Embed Size (px)
Citation preview
scimaps.org/atlas2 13 x 11, 250 pp. | 580 illus. 978-0-262-02881-3The MIT Press Cambridge, Massachusetts mitpress.mit.edu
In an age of information overload, the ability to make sense of vast amounts of data and to render insightful visual-izations is as important as the ability to read and write. The Atlas of Knowledge explains and exemplifies the power
of visualizations not only to help locate us in physical space but also to help us understand the extent and structure of our collective knowledge, to identify bursts of activity, pathways of ideas, and borders that beg to be crossed.
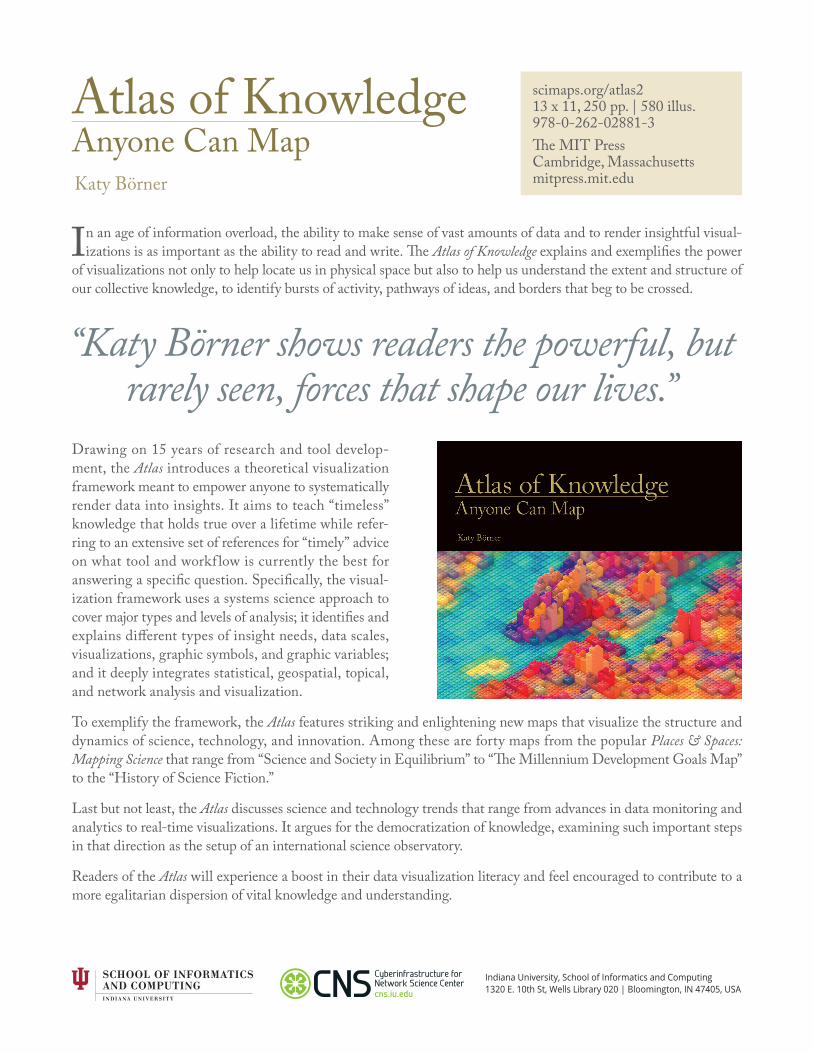
Drawing on 15 years of research and tool develop-ment, the Atlas introduces a theoretical visualization framework meant to empower anyone to systematically render data into insights. It aims to teach “timeless” knowledge that holds true over a lifetime while refer-ring to an extensive set of references for “timely” advice on what tool and workf low is currently the best for answering a specific question. Specifically, the visual-ization framework uses a systems science approach to cover major types and levels of analysis; it identifies and explains different types of insight needs, data scales, visualizations, graphic symbols, and graphic variables; and it deeply integrates statistical, geospatial, topical, and network analysis and visualization.
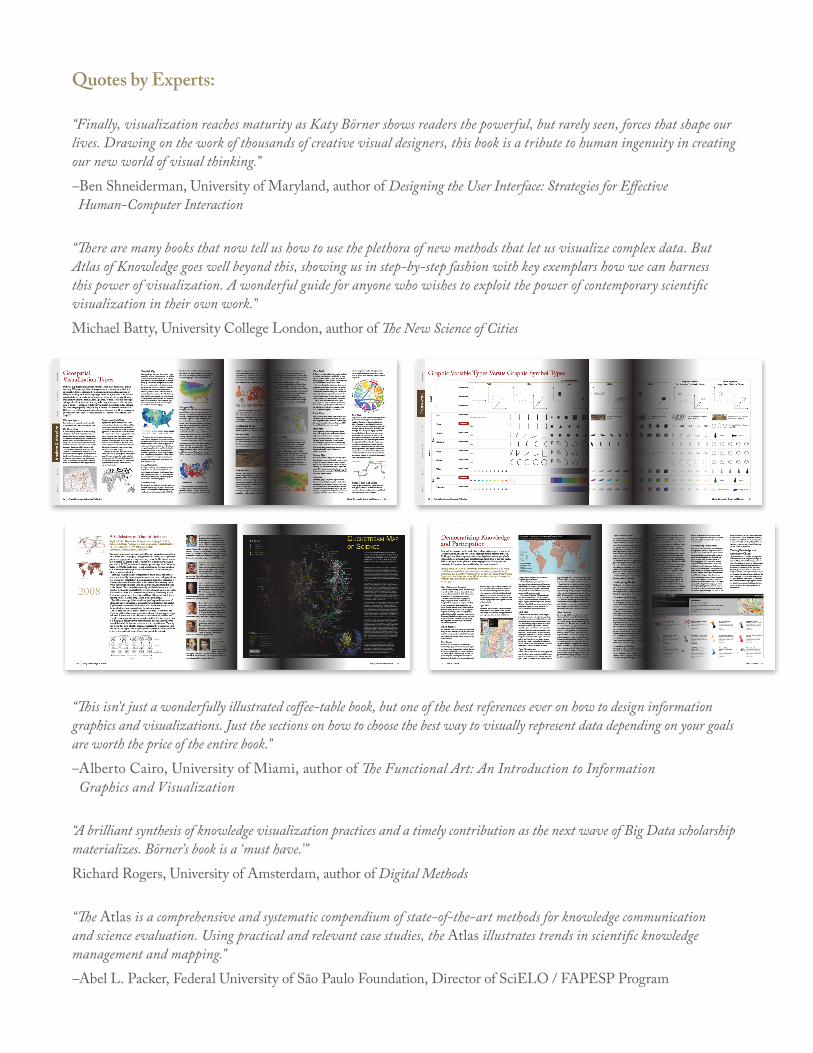
To exemplify the framework, the Atlas features striking and enlightening new maps that visualize the structure and dynamics of science, technology, and innovation. Among these are forty maps from the popular Places & Spaces: Mapping Science that range from “Science and Society in Equilibrium” to “The Millennium Development Goals Map” to the “History of Science Fiction.”
Last but not least, the Atlas discusses science and technology trends that range from advances in data monitoring and analytics to real-time visualizations. It argues for the democratization of knowledge, examining such important steps in that direction as the setup of an international science observatory.
Readers of the Atlas will experience a boost in their data visualization literacy and feel encouraged to contribute to a more egalitarian dispersion of vital knowledge and understanding.
Indiana University, School of Informatics and Computing1320 E. 10th St, Wells Library 020 | Bloomington, IN 47405, USA
SCHOOL OF INFORMATICSAND COMPUTINGI N D I A NA UN I V E R S I T Y
Department of Information and Library ScienceBloomington
Atlas of Knowledge Anyone Can Map
“Katy Börner shows readers the powerful, but rarely seen, forces that shape our lives.”
Katy Börner
Quotes by Experts:
“Finally, visualization reaches maturity as Katy Börner shows readers the powerful, but rarely seen, forces that shape our lives. Drawing on the work of thousands of creative visual designers, this book is a tribute to human ingenuity in creating our new world of visual thinking.”–Ben Shneiderman, University of Maryland, author of Designing the User Interface: Strategies for Effective Human-Computer Interaction “There are many books that now tell us how to use the plethora of new methods that let us visualize complex data. But Atlas of Knowledge goes well beyond this, showing us in step-by-step fashion with key exemplars how we can harness this power of visualization. A wonderful guide for anyone who wishes to exploit the power of contemporary scientific visualization in their own work.”Michael Batty, University College London, author of The New Science of Cities
“This isn’t just a wonderfully illustrated coffee-table book, but one of the best references ever on how to design information graphics and visualizations. Just the sections on how to choose the best way to visually represent data depending on your goals are worth the price of the entire book.”–Alberto Cairo, University of Miami, author of The Functional Art: An Introduction to Information Graphics and Visualization
“A brilliant synthesis of knowledge visualization practices and a timely contribution as the next wave of Big Data scholarship materializes. Börner’s book is a ‘must have.’”Richard Rogers, University of Amsterdam, author of Digital Methods “The Atlas is a comprehensive and systematic compendium of state-of-the-art methods for knowledge communication and science evaluation. Using practical and relevant case studies, the Atlas illustrates trends in scientific knowledge management and mapping.”–Abel L. Packer, Federal University of São Paulo Foundation, Director of SciELO / FAPESP Program