Embed Size (px)
Citation preview
FEDERAL DEMOCRATIC REPUBLIC OF
Ethiopia
COMPLEMENTARY ACTIVITIES
4 Handwashing with soap Hearing testing/treatment Height measurement Dental cleaning/testing Weight measurement Menstrual hygiene
4 Deworming treatment 4 Drinking water Eye testing/eyeglasses Waterpurification
COMPLEMENTARY EDUCATION PROGRAMS
EDUCATION OTHER4 Nutrition School gardens4 Health 4 Physical education4 Food and agriculture4 Reproductive health4 Hygiene4 HIV prevention
4 = mandatory
SCHOOL MEAL PROGRAMS
SCHOOL MEAL/FEEDING PROGRAM(S)
Most recently completed school year: September 2017 - June 2018 (202 school days)
• Home Grown School Feeding • Emergency School Feeding• Traditional School Feeding
Lead Agency: Ministry of Education
NATIONAL LAWS, POLICIES, AND STANDARDS
4 National school feeding policy4 Nutrition
Food safety4 Agriculture
Private sector involvement
Line item in the national budget… Yes 4 No NR
INFRASTRUCTURE
Most schools have latrines and dedicated eating spaces/cafeterias. Some schools have piped water and clean water. Very few schools have electricity and kitchens and no school hasflushtoilets.
MEALS/SNACKS/MODALITY
Breakfast 4 Snacks4 Lunch 4 Take-home rations
Dinner Conditional cash transfer
4 Grains/cereals Fish Roots, tubers Green, leafy vegetables
4 Legumes and nuts Other vegetables Dairy products Fruits Eggs 4 Oil Meat 4 Salt Poultry Sugar
Prohibited food items: None
FOOD SOURCES
4 Purchased (domestic) In-kind (domestic)4 Purchased (foreign) 4 In-kind (foreign)
The checked and highlighted items are reported as required, though they may not be uniformly implemented.
NR = No Response
The Global Survey of School Meal Programs is the property of GCNF and is protected by copyright. It may not be reproduced or distributed without prior written consent. Contact: [email protected]
©2019. The Global Child Nutrition Foundation. All rights reserved.
GCNFisanon-political,non-profitentity.Fundingforthissurveyandafollow-upsurvey in 2021 is provided, in part, by the United States Department of Agriculture;
agreement number FX18TA-10960G002.
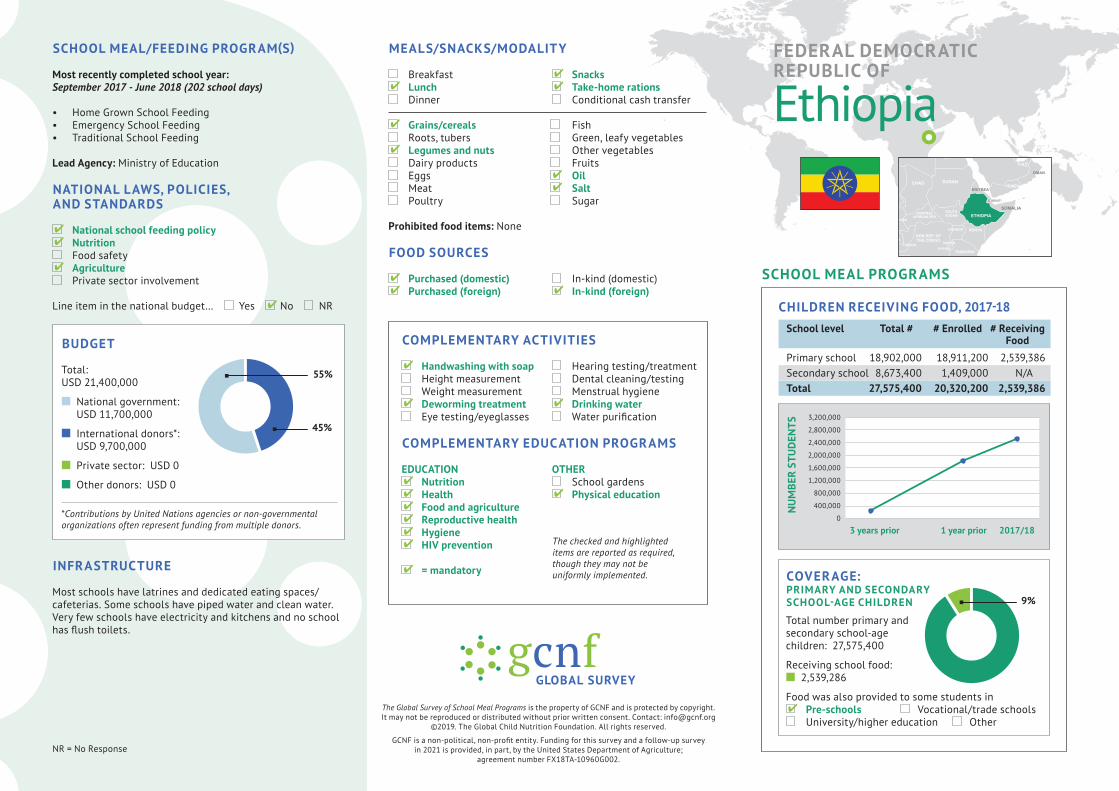
BUDGET
Total: USD 21,400,000
n National government: USD 11,700,000
n International donors*: USD 9,700,000
n Private sector: USD 0
n Other donors: USD 0
*Contributions by United Nations agencies or non-governmental organizations often represent funding from multiple donors.
45%
55%
COVERAGE:PRIMARY AND SECONDARY SCHOOL-AGE CHILDREN
Total number primary and secondary school-age children: 27,575,400
Receiving school food: n 2,539,286
Food was also provided to some students in 4 Pre-schools Vocational/trade schools University/higher education Other
9%
CHILDREN RECEIVING FOOD, 2017-18School level Total # # Enrolled # Receiving FoodPrimary school 18,902,000 18,911,200 2,539,386 Secondary school 8,673,400 1,409,000 N/ATotal 27,575,400 20,320,200 2,539,386
3 years prior 1 year prior 2017/18
3,200,000
2,800,000
2,400,000
2,000,000
1,600,000
1,200,000
800,000
400,000
0
NU
MBE
R ST
UD
ENTS
NUTRITION
School feeding program(s) include/involve the following:
4 Fortified foods Bio-fortifiedfoods Micronutrient supplements Nutritionists involved Special training for cooks/caterers in nutrition
4 Objective to meet nutritional goals Objective to reduce obesity
Food items fortified:Corn soy blend
Micronutrients added to fortified foods:Iron, Vitamin A, Iodine, Zinc, Folate, Vitamin B12, Thiamine, Riboflavin,Niacin,VitaminB6,VitaminC,Calcium,Magnesium
ADDITIONAL INFORMATION
Corn Soy Blend Plus (CSB+), a complete protein and source of energy, carbohydrates, protein, fat and micronutrients, is used in the Traditional School Feeding Program in Ethiopia. Cooks are trained in food safety and hygiene. Obesity is not seen to be a problem in Ethiopia.
SUCCESSES AND CHALLENGES
Ethiopia reported the following positive recent developments: A national school feeding strategy has been drafted; school feeding has gained leadership’s attention; and central and regional governments have allocated funding for both Emergency and Home Grown School Feeding Programs. Three particular strengths cited are: Community engagement; local governments’ allocation and management of budget for the program; and local procurement from smallholder farmers.
The major setbacks reported for school feeding in the country were the absence of an endorsed policy document for school feeding; the fact that there is not a dedicated national budget line; a budget shortfall in the face of high level of need; and the lack of infrastructure and facilities at the school level. In addition, there is no national and regional level coordination mechanism and the government has not taken full ownership of the program. Fortunately, there have been no serious cases of corruption or mismanagement reported in the country.
STUDIES CONDUCTED
The WFP collaborated with Mastercard to conduct a cost benefitanalysisinthecountryin2017.Thestudyhasdrawnthe economic return of the program which is 1:6.7 for the Home Grown School Feeding Program. School feeding reduces the cost of family food expenditure and helps children improve their performance at school. Children also transfer knowledge in hygiene, sanitation and diet diversity.
CBA of school feeding (2017); Impact of school feeding on primary school education in Ethiopia, Ramin Gallenbacher, 2018
RESEARCH NEEDED
The impact of school feeding on nutrition and agriculture
AGRICULTURE, EMPLOYMENT, AND COMMUNITY PARTICIPATION
Jobs created by school feeding programs
15,380 Cooks and food preparers
122 Transporters
16,620 Off-site processors
15,140 Food packagers and handlers
NR Monitoring
NR Food service management
NR Safety and quality inspectors
NR Other
Farmers were involved with the school feeding program(s)...
4 Yes No NR
Other private sector (for profit) actors were involved...
4 Yes No NR
There was a focus on creating jobs or leadership or income-generating opportunities for...
4 Women 4 Youth 4 Other groups
There was community engagement (by parents or others) in the school feeding program(s)
4 Yes No NR
ADDITIONAL INFORMATION
All cooks are paid in cash by the national or local governments, implementing partners, or by local communities. Most (75–100%) are women.
CONTACTS: ETHIOPIA
Agency: Ministry of EducationWebsite: http://www.moe.gov.etEmail: [email protected]
Prog
ram
repo
rt: E
thio
pia
All d
ata
from
the
2017
-18
scho
ol y
ear
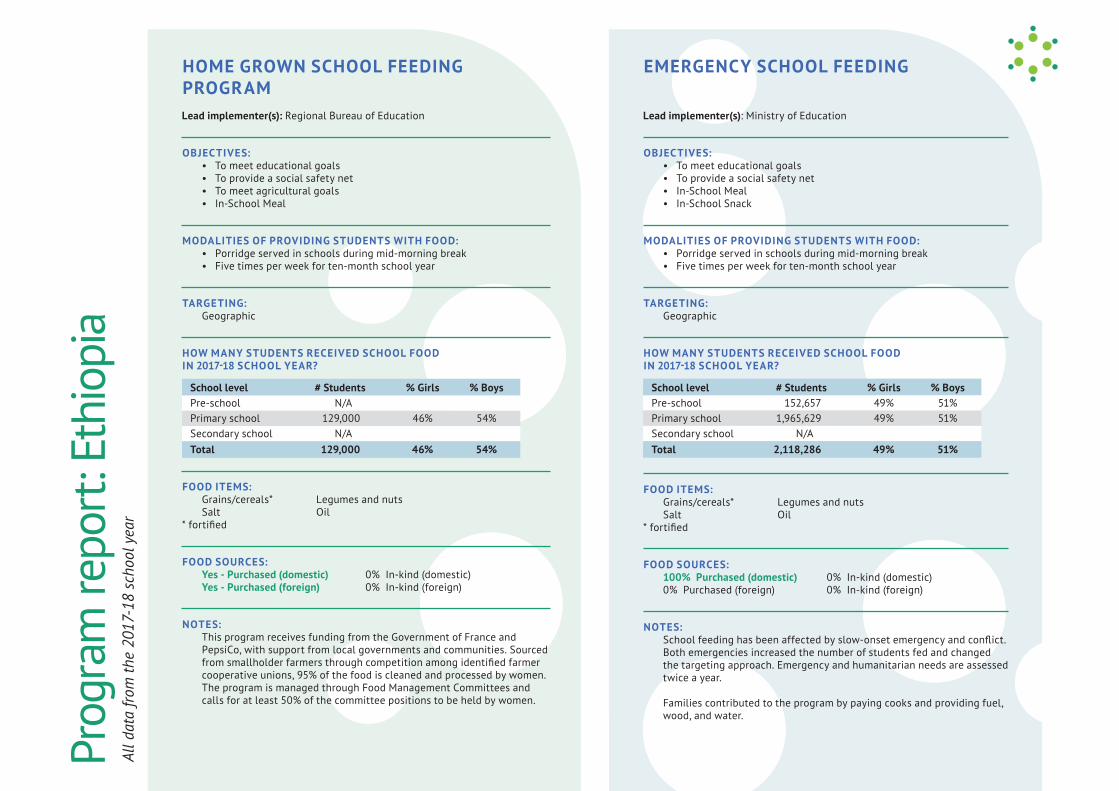
HOME GROWN SCHOOL FEEDING PROGRAMLead implementer(s): Regional Bureau of Education
OBJECTIVES: • To meet educational goals • To provide a social safety net • To meet agricultural goals • In-School Meal
MODALITIES OF PROVIDING STUDENTS WITH FOOD: • Porridge served in schools during mid-morning break • Five times per week for ten-month school year
TARGETING: Geographic
HOW MANY STUDENTS RECEIVED SCHOOL FOOD IN 2017-18 SCHOOL YEAR?
School level # Students % Girls % BoysPre-school N/A Primary school 129,000 46% 54%Secondary school N/A Total 129,000 46% 54%
FOOD ITEMS: Grains/cereals* Legumes and nuts Salt Oil*fortified
FOOD SOURCES: Yes - Purchased (domestic) 0% In-kind (domestic) Yes - Purchased (foreign) 0% In-kind (foreign)
NOTES: This program receives funding from the Government of France and
PepsiCo, with support from local governments and communities. Sourced fromsmallholderfarmersthroughcompetitionamongidentifiedfarmercooperative unions, 95% of the food is cleaned and processed by women. The program is managed through Food Management Committees and calls for at least 50% of the committee positions to be held by women.
EMERGENCY SCHOOL FEEDING
Lead implementer(s): Ministry of Education
OBJECTIVES: • To meet educational goals • To provide a social safety net • In-School Meal • In-School Snack
MODALITIES OF PROVIDING STUDENTS WITH FOOD: • Porridge served in schools during mid-morning break • Five times per week for ten-month school year
TARGETING: Geographic
HOW MANY STUDENTS RECEIVED SCHOOL FOOD IN 2017-18 SCHOOL YEAR?
School level # Students % Girls % BoysPre-school 152,657 49% 51%Primary school 1,965,629 49% 51%Secondary school N/A Total 2,118,286 49% 51%
FOOD ITEMS: Grains/cereals* Legumes and nuts Salt Oil*fortified
FOOD SOURCES: 100% Purchased (domestic) 0% In-kind (domestic) 0% Purchased (foreign) 0% In-kind (foreign)
NOTES: Schoolfeedinghasbeenaffectedbyslow-onsetemergencyandconflict.
Both emergencies increased the number of students fed and changed the targeting approach. Emergency and humanitarian needs are assessed twice a year.
Families contributed to the program by paying cooks and providing fuel, wood, and water.
Prog
ram
repo
rt: E
thio
pia
(cont
inue
d)Al
l dat
a fro
m th
e 20
17-1
8 sc
hool
yea
r
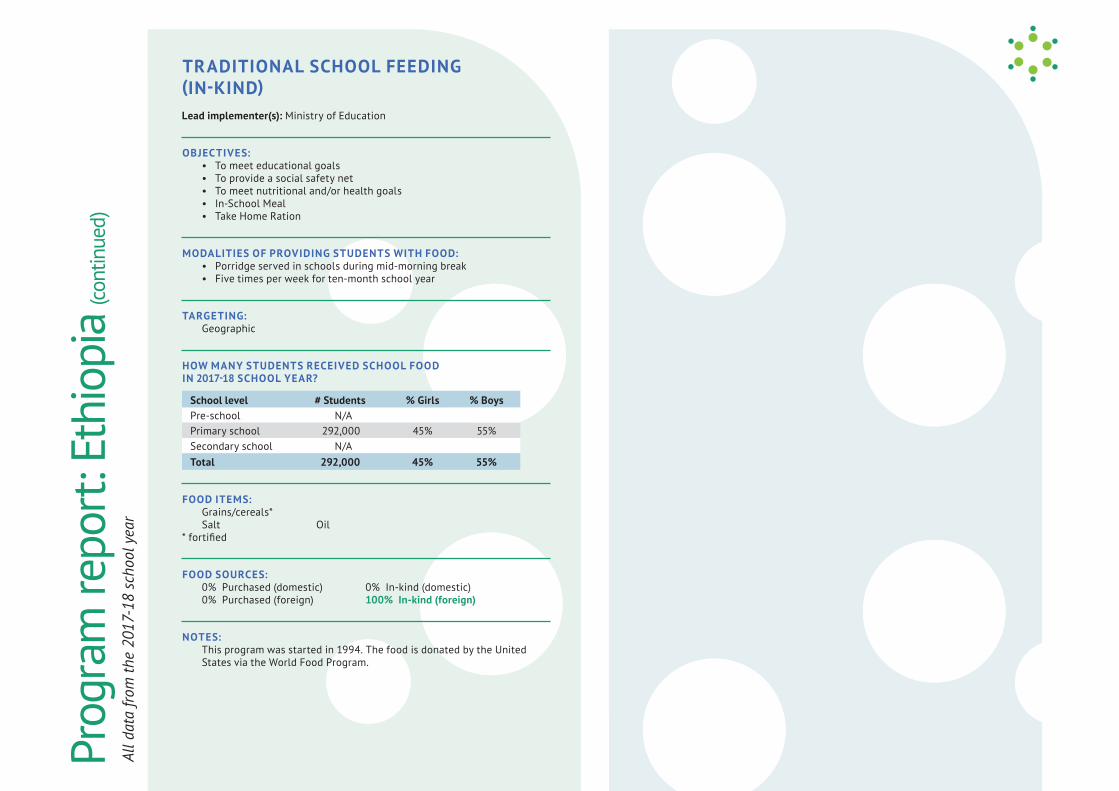
TRADITIONAL SCHOOL FEEDING (IN-KIND)Lead implementer(s): Ministry of Education
OBJECTIVES: • To meet educational goals • To provide a social safety net • To meet nutritional and/or health goals • In-School Meal • Take Home Ration
MODALITIES OF PROVIDING STUDENTS WITH FOOD: • Porridge served in schools during mid-morning break • Five times per week for ten-month school year
TARGETING: Geographic
HOW MANY STUDENTS RECEIVED SCHOOL FOOD IN 2017-18 SCHOOL YEAR?
School level # Students % Girls % BoysPre-school N/A Primary school 292,000 45% 55%Secondary school N/A Total 292,000 45% 55%
FOOD ITEMS: Grains/cereals* Salt Oil*fortified
FOOD SOURCES: 0% Purchased (domestic) 0% In-kind (domestic) 0% Purchased (foreign) 100% In-kind (foreign)
NOTES: This program was started in 1994. The food is donated by the United
States via the World Food Program.