Embed Size (px)
Citation preview

What Is The Feeding Value Of Carinata Meal
To Cattle?
Derek Brake
Importance Of Discovering Value For Non-Fuel
Products From B. Carinata
0
20
40
60
80
100
Solvent Extracted Mechanically Extracted
Meal
Oil
Meal
Oil
How To Make Meal From A Non-Food Oilseed Into
A Food?
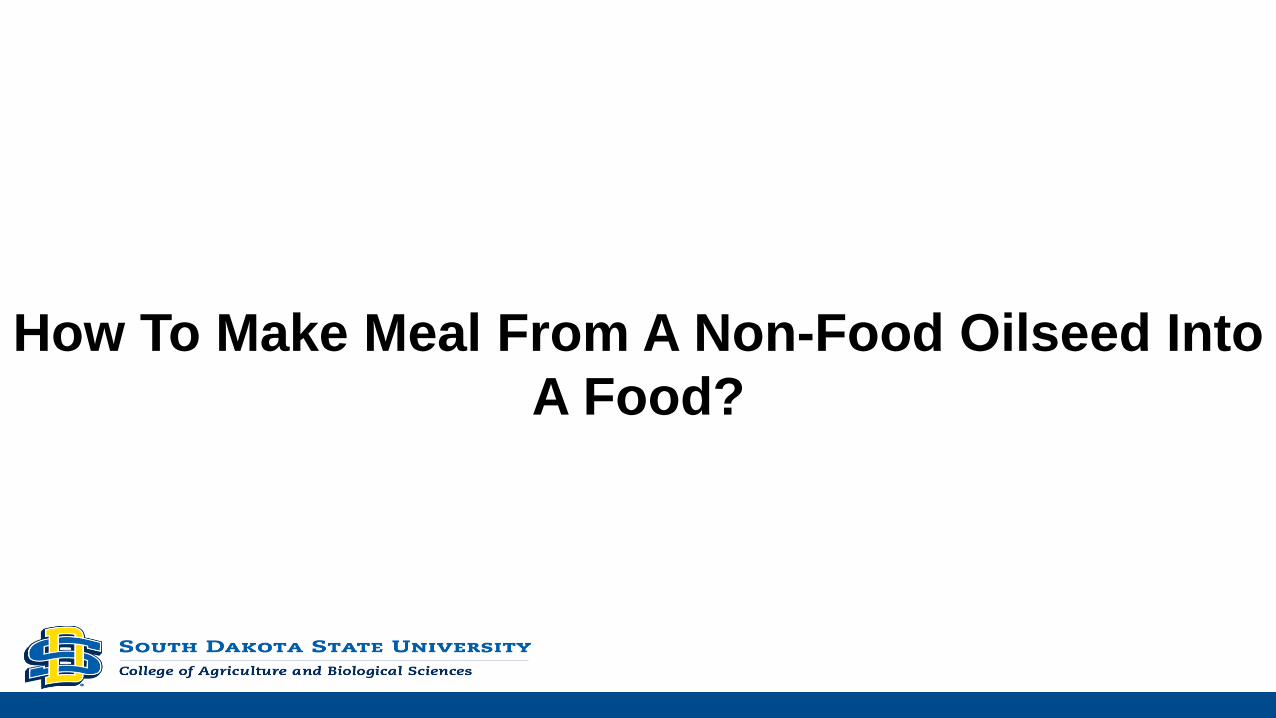
A Few Challenges To Feeding Carinata Meal
Glucosinolates Are Goitrogenic
• Depressed thyroid function
– T3
– T4
• Erucic acid
– myocardial lipidosis
– fatty heart
Intake Of Brassica-based Meals Are Regulated
• AAFCO & FDA limits intake of brassica meals to ruminants
– Previously marketed in US as ‘Mustard Meal’ (IFN 5-12-149)
• 10% DM in diets of nonlactating ruminants
• 0% DM in nonruminant and lactating cattle diets
– Brassica carinata meal has been recommended by FDA for definition in
2017 AAFCO by IDC
• T71.35
Intake Of Brassica-based Meals Are Regulated
• Proposed definition of Brassica carinata meal.• T71.35 Brassica carinata meal, solvent extracted is the meal obtained after the
removal of most of the oil by solvent extraction of Brassica carinata seeds. The
meal shall contain less than 2% erucic acid and less than 30 micromoles of total
glucosinolates per gram. It is a source of protein for beef cattle in an amount not
to exceed 10% of the total diet. The maximum sulfur content must be
guaranteed.
• Predominate concern related to erucic acid intake in humans
– Myocardial lipidosis
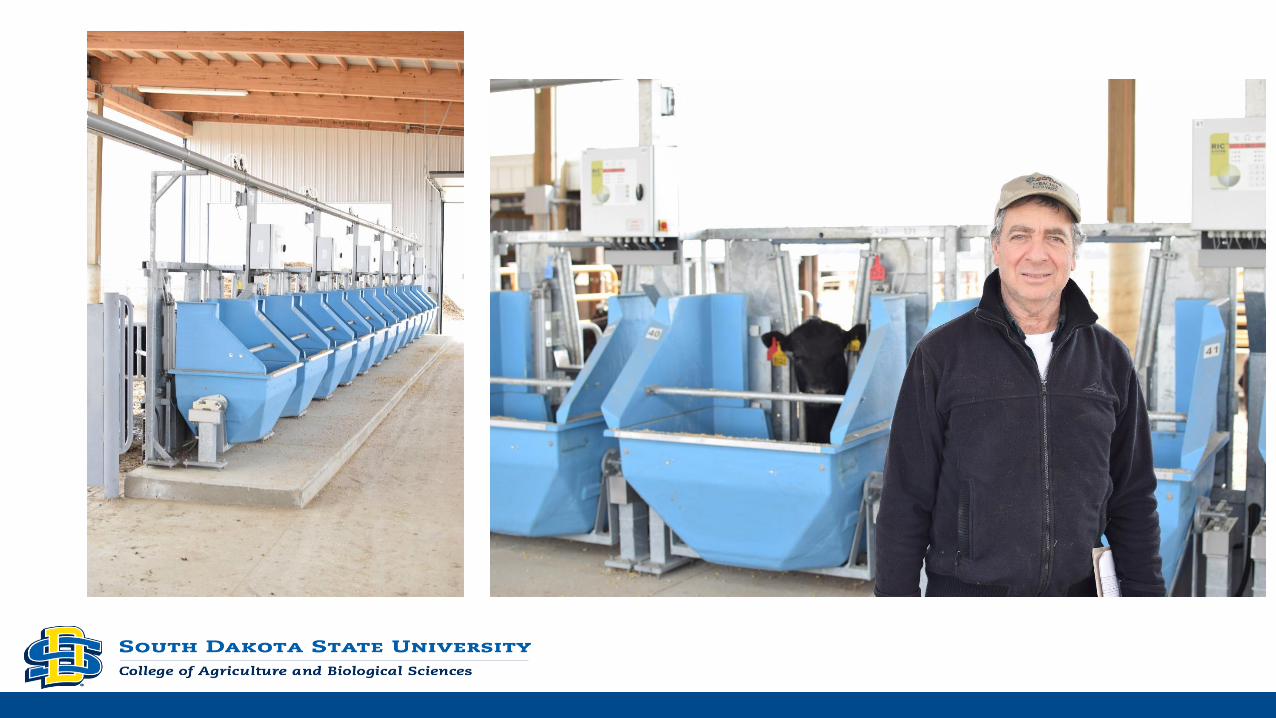
Beef Feeding Trials At SDSU
• Why are cattle fed protein meals?
– After puberty performance in cattle is limited by energy
– Ruminal fermentation can be limited by N to support optimal microbial
growth
• Protein meals are often fed to optimize ruminal fermentation
– to yield more energy from fermentation
Beef Feeding Trials At SDSU
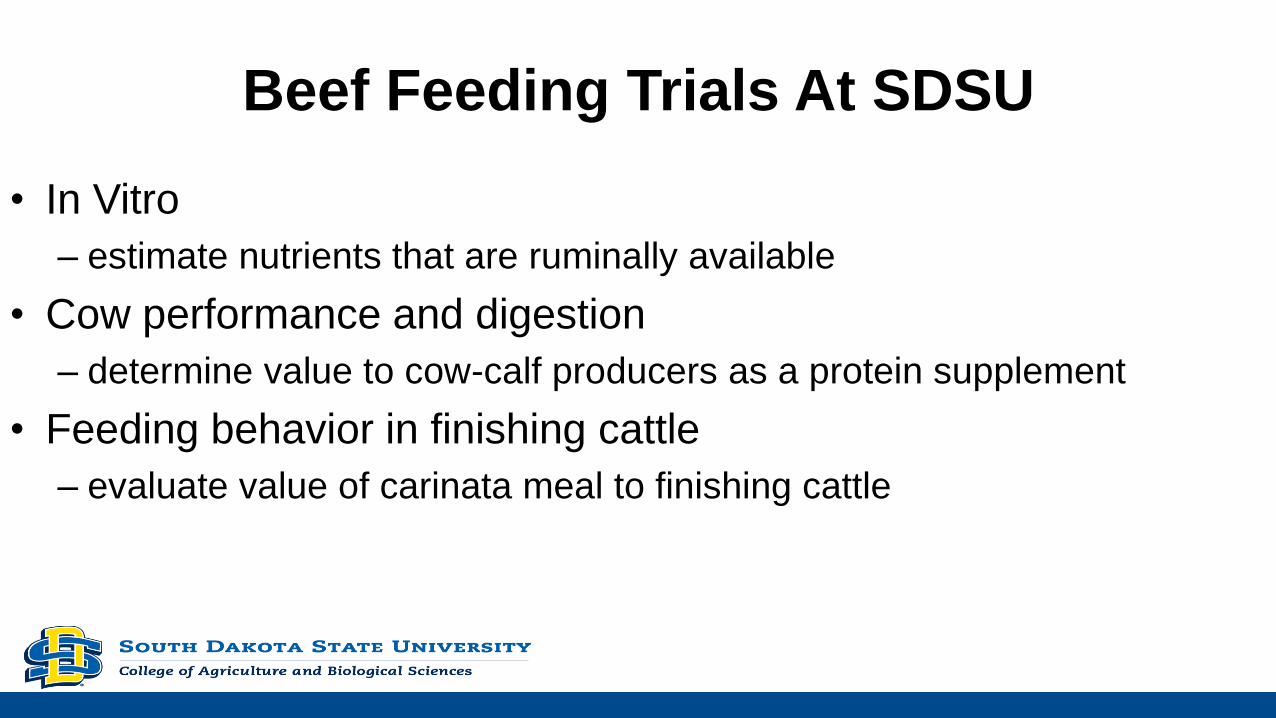
• In Vitro
– estimate nutrients that are ruminally available
• Cow performance and digestion
– determine value to cow-calf producers as a protein supplement
• Feeding behavior in finishing cattle
– evaluate value of carinata meal to finishing cattle
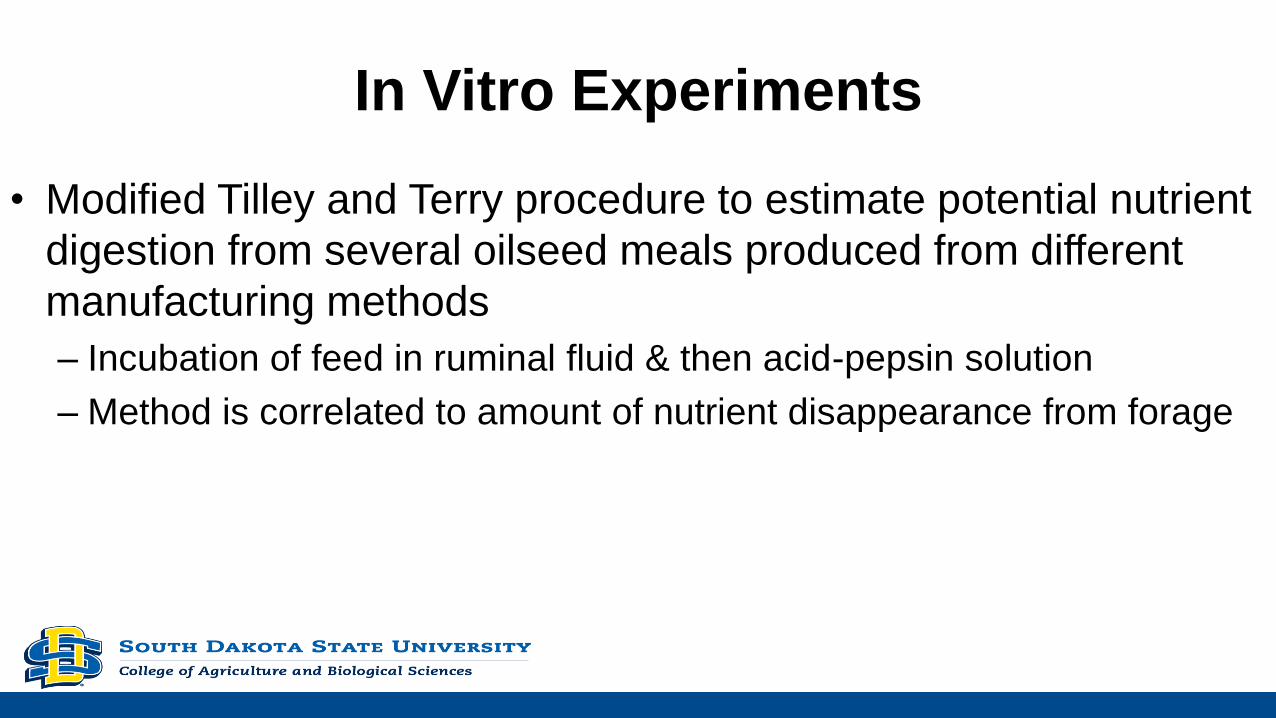
In Vitro Experiments
• Modified Tilley and Terry procedure to estimate potential nutrient
digestion from several oilseed meals produced from different
manufacturing methods
– Incubation of feed in ruminal fluid & then acid-pepsin solution
– Method is correlated to amount of nutrient disappearance from forage
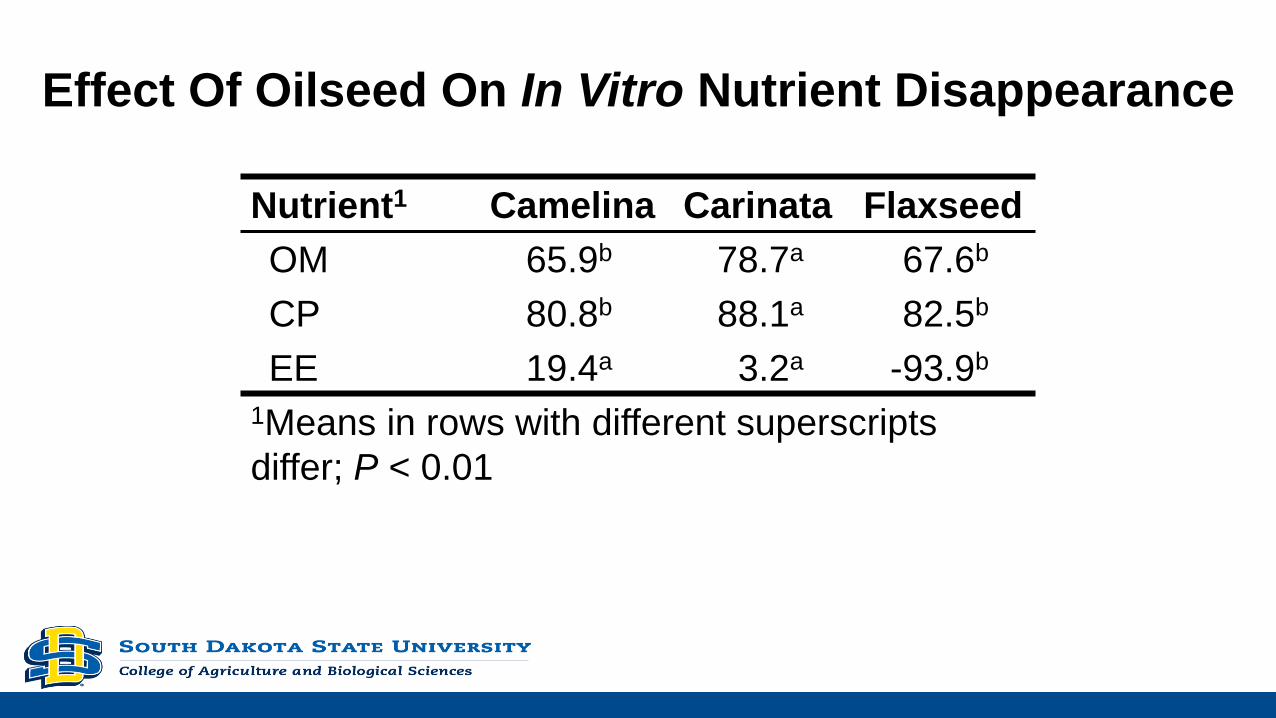
Effect Of Oilseed On In Vitro Nutrient Disappearance
Nutrient1 Camelina Carinata Flaxseed
OM 65.9b 78.7a 67.6b
CP 80.8b 88.1a 82.5b
EE 19.4a 3.2a -93.9b
1Means in rows with different superscripts
differ; P < 0.01
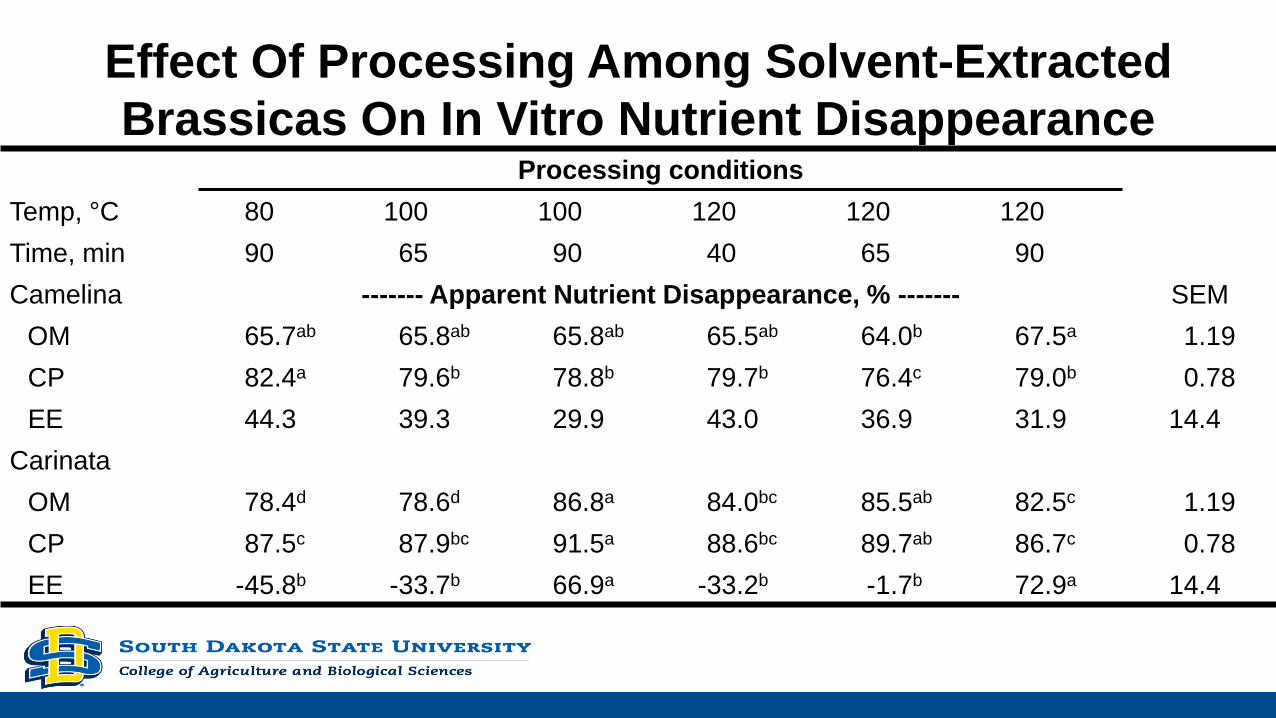
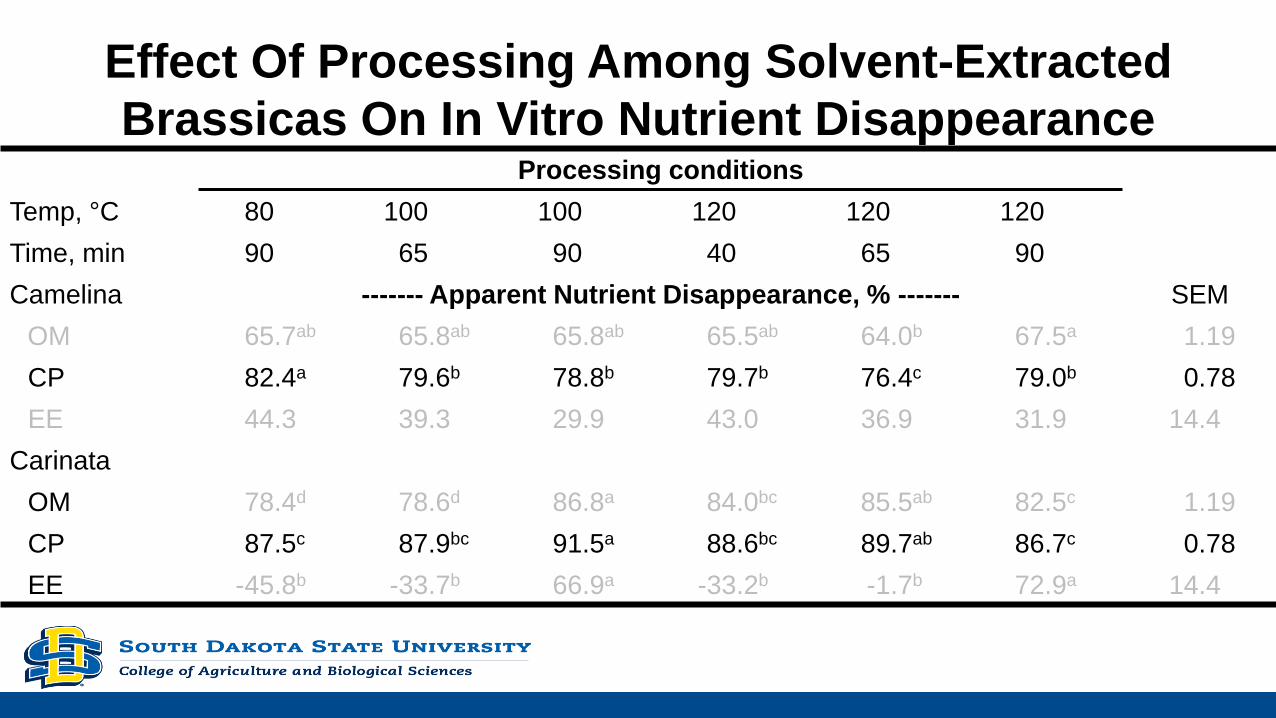
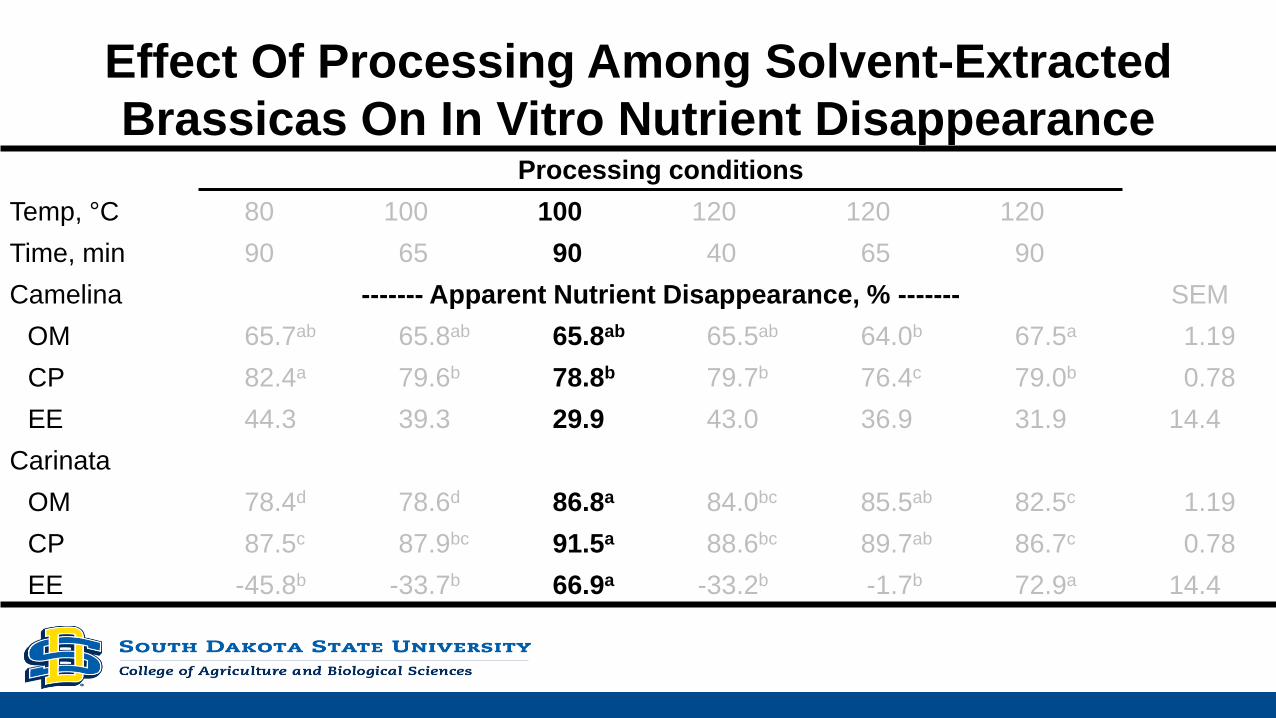
Effect Of Processing Among Solvent-Extracted
Brassicas On In Vitro Nutrient Disappearance Processing conditions
Temp, °C 80 100 100 120 120 120
Time, min 90 65 90 40 65 90
Camelina ------- Apparent Nutrient Disappearance, % ------- SEM
OM 65.7ab 65.8ab 65.8ab 65.5ab 64.0b 67.5a 1.19
CP 82.4a 79.6b 78.8b 79.7b 76.4c 79.0b 0.78
EE 44.3 39.3 29.9 43.0 36.9 31.9 14.4
Carinata
OM 78.4d 78.6d 86.8a 84.0bc 85.5ab 82.5c 1.19
CP 87.5c 87.9bc 91.5a 88.6bc 89.7ab 86.7c 0.78
EE -45.8b -33.7b 66.9a -33.2b -1.7b 72.9a 14.4
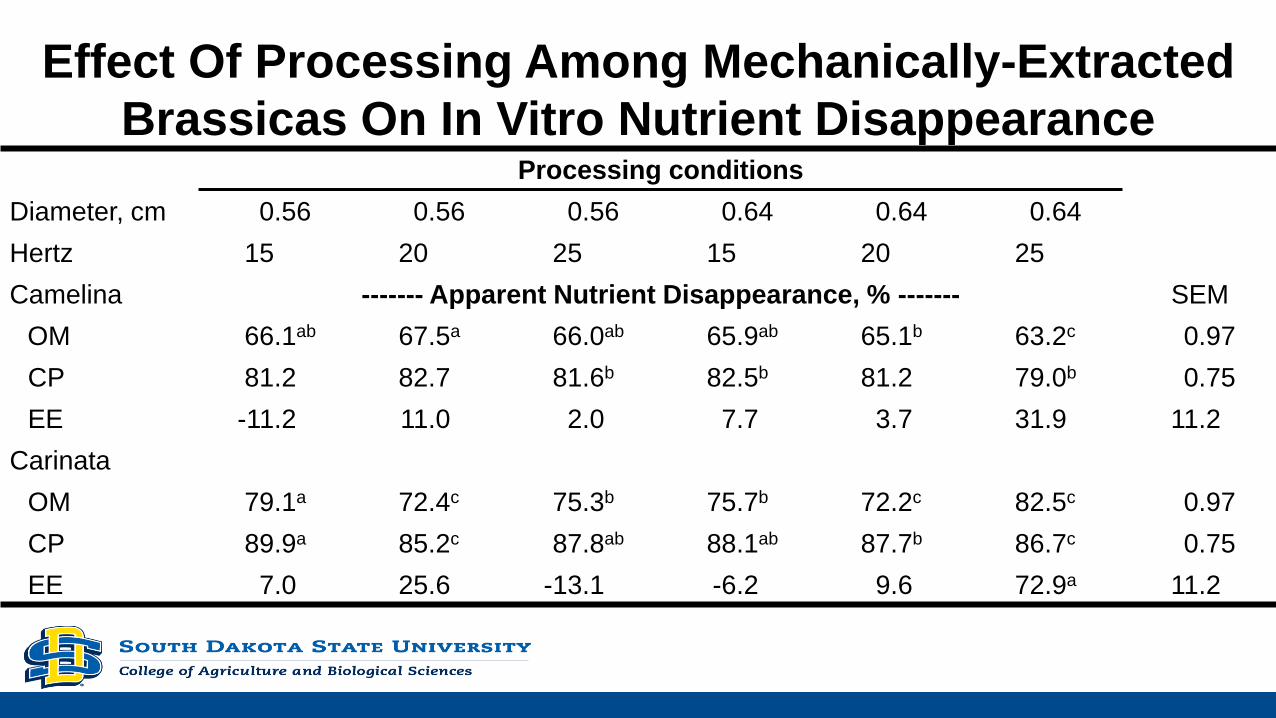
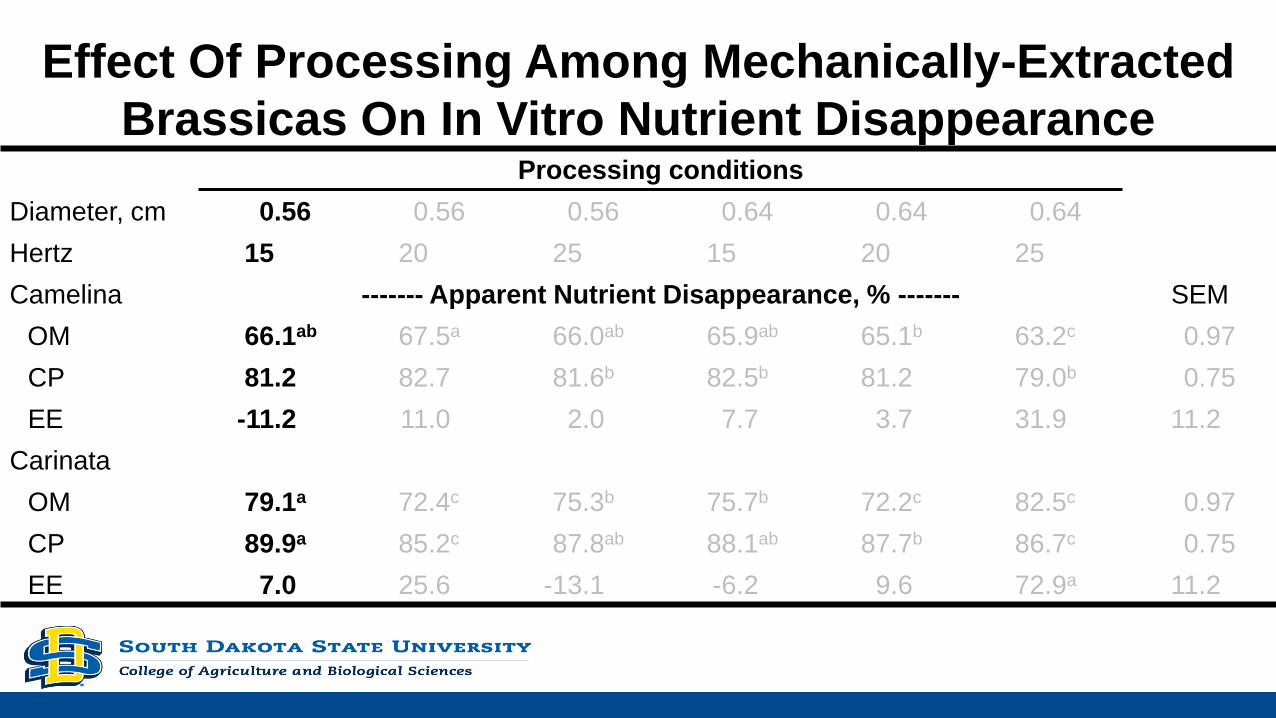
Effect Of Processing Among Mechanically-Extracted
Brassicas On In Vitro Nutrient Disappearance Processing conditions
Diameter, cm 0.56 0.56 0.56 0.64 0.64 0.64
Hertz 15 20 25 15 20 25
Camelina ------- Apparent Nutrient Disappearance, % ------- SEM
OM 66.1ab 67.5a 66.0ab 65.9ab 65.1b 63.2c 0.97
CP 81.2 82.7 81.6b 82.5b 81.2 79.0b 0.75
EE -11.2 11.0 2.0 7.7 3.7 31.9 11.2
Carinata
OM 79.1a 72.4c 75.3b 75.7b 72.2c 82.5c 0.97
CP 89.9a 85.2c 87.8ab 88.1ab 87.7b 86.7c 0.75
EE 7.0 25.6 -13.1 -6.2 9.6 72.9a 11.2
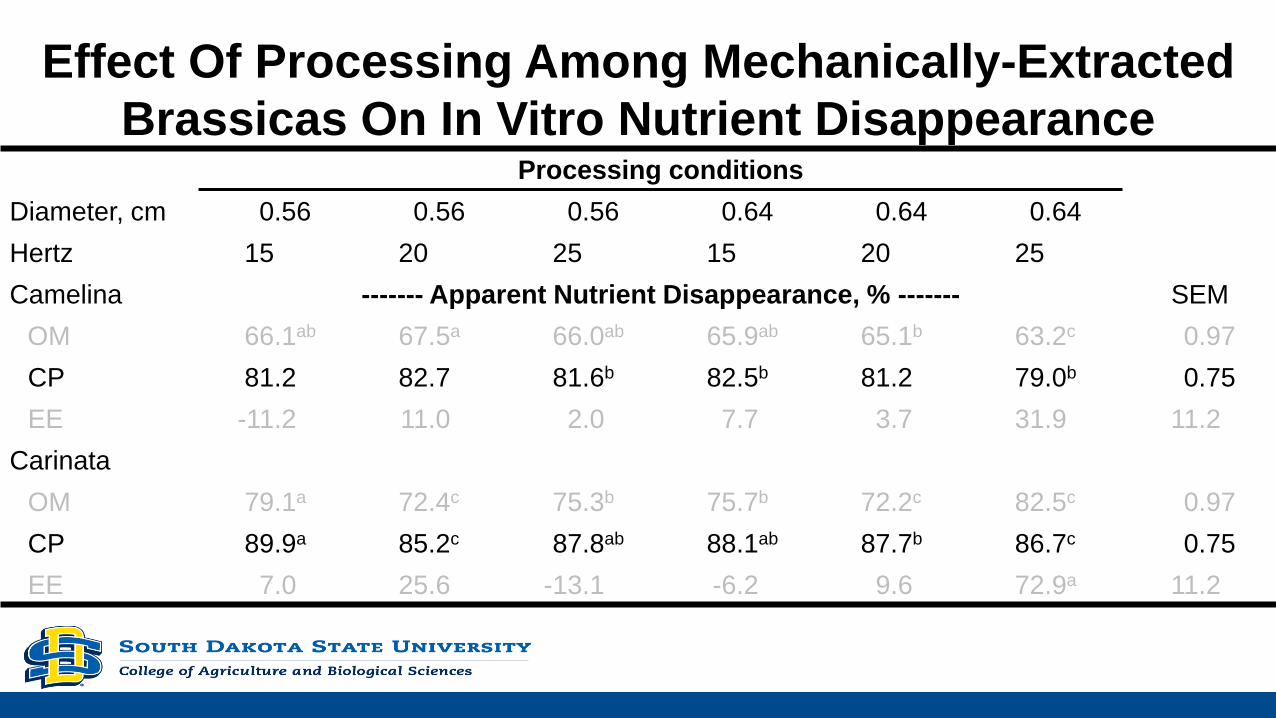
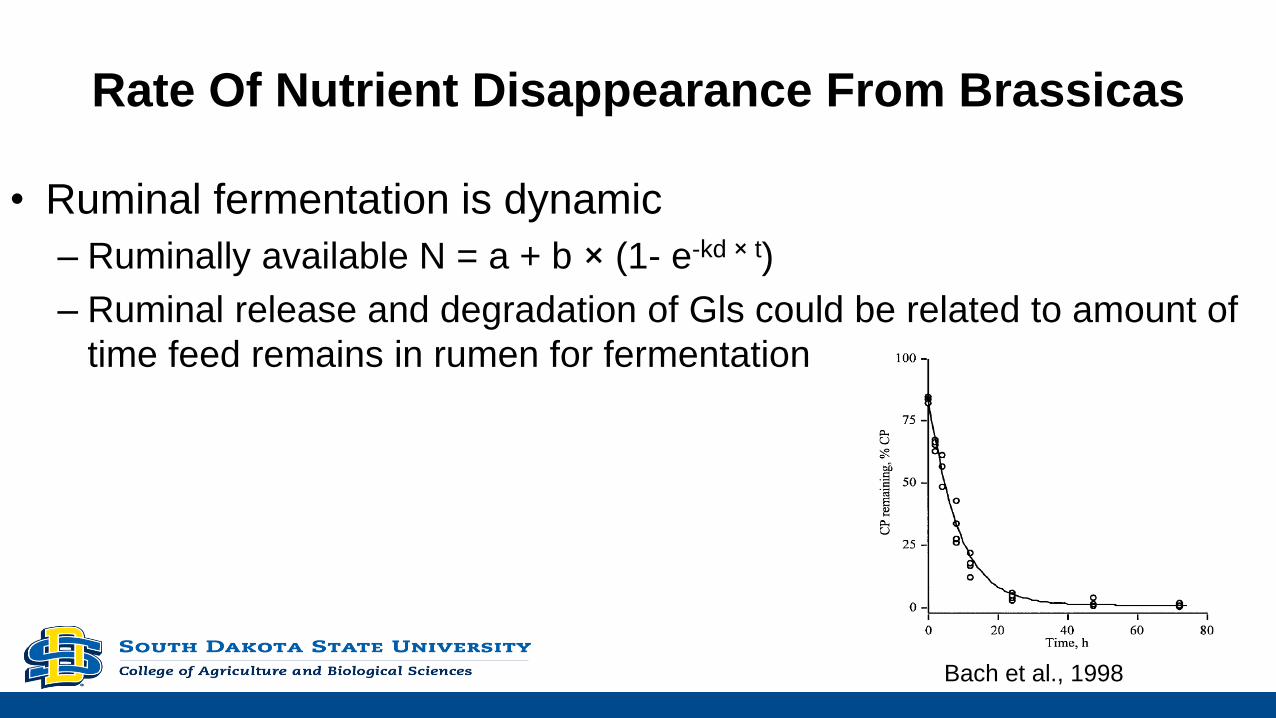
Rate Of Nutrient Disappearance From Brassicas
• Ruminal fermentation is dynamic
– Ruminally available N = a + b × (1- e-kd × t)
– Ruminal release and degradation of Gls could be related to amount of
time feed remains in rumen for fermentation
Bach et al., 1998
Effect Of Processing Among Solvent-Extracted
Brassicas On In Vitro Nutrient Disappearance Processing conditions
Temp, °C 80 100 100 120 120 120
Time, min 90 65 90 40 65 90
Camelina ------- Apparent Nutrient Disappearance, % ------- SEM
OM 65.7ab 65.8ab 65.8ab 65.5ab 64.0b 67.5a 1.19
CP 82.4a 79.6b 78.8b 79.7b 76.4c 79.0b 0.78
EE 44.3 39.3 29.9 43.0 36.9 31.9 14.4
Carinata
OM 78.4d 78.6d 86.8a 84.0bc 85.5ab 82.5c 1.19
CP 87.5c 87.9bc 91.5a 88.6bc 89.7ab 86.7c 0.78
EE -45.8b -33.7b 66.9a -33.2b -1.7b 72.9a 14.4
Effect Of Processing Among Mechanically-Extracted
Brassicas On In Vitro Nutrient Disappearance Processing conditions
Diameter, cm 0.56 0.56 0.56 0.64 0.64 0.64
Hertz 15 20 25 15 20 25
Camelina ------- Apparent Nutrient Disappearance, % ------- SEM
OM 66.1ab 67.5a 66.0ab 65.9ab 65.1b 63.2c 0.97
CP 81.2 82.7 81.6b 82.5b 81.2 79.0b 0.75
EE -11.2 11.0 2.0 7.7 3.7 31.9 11.2
Carinata
OM 79.1a 72.4c 75.3b 75.7b 72.2c 82.5c 0.97
CP 89.9a 85.2c 87.8ab 88.1ab 87.7b 86.7c 0.75
EE 7.0 25.6 -13.1 -6.2 9.6 72.9a 11.2
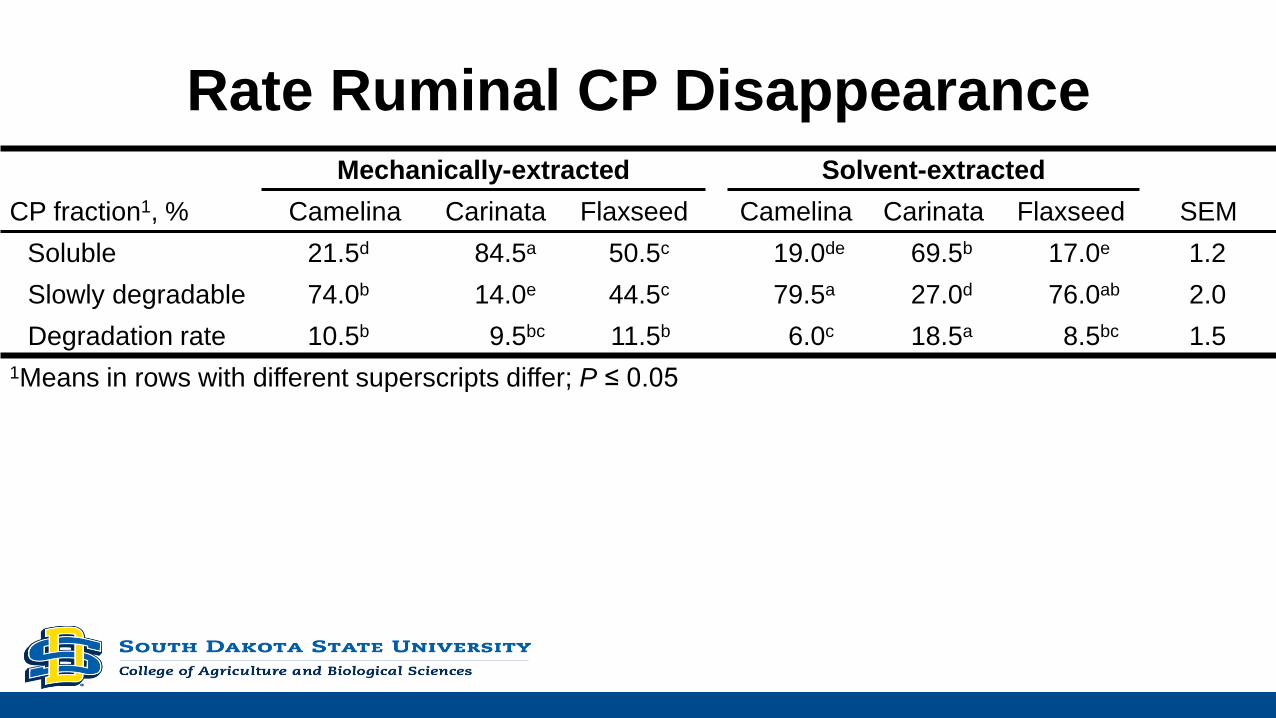
Rate Ruminal CP DisappearanceMechanically-extracted Solvent-extracted
CP fraction1, % Camelina Carinata Flaxseed Camelina Carinata Flaxseed SEM
Soluble 21.5d 84.5a 50.5c 19.0de 69.5b 17.0e 1.2
Slowly degradable 74.0b 14.0e 44.5c 79.5a 27.0d 76.0ab 2.0
Degradation rate 10.5b 9.5bc 11.5b 6.0c 18.5a 8.5bc 1.5
1Means in rows with different superscripts differ; P ≤ 0.05
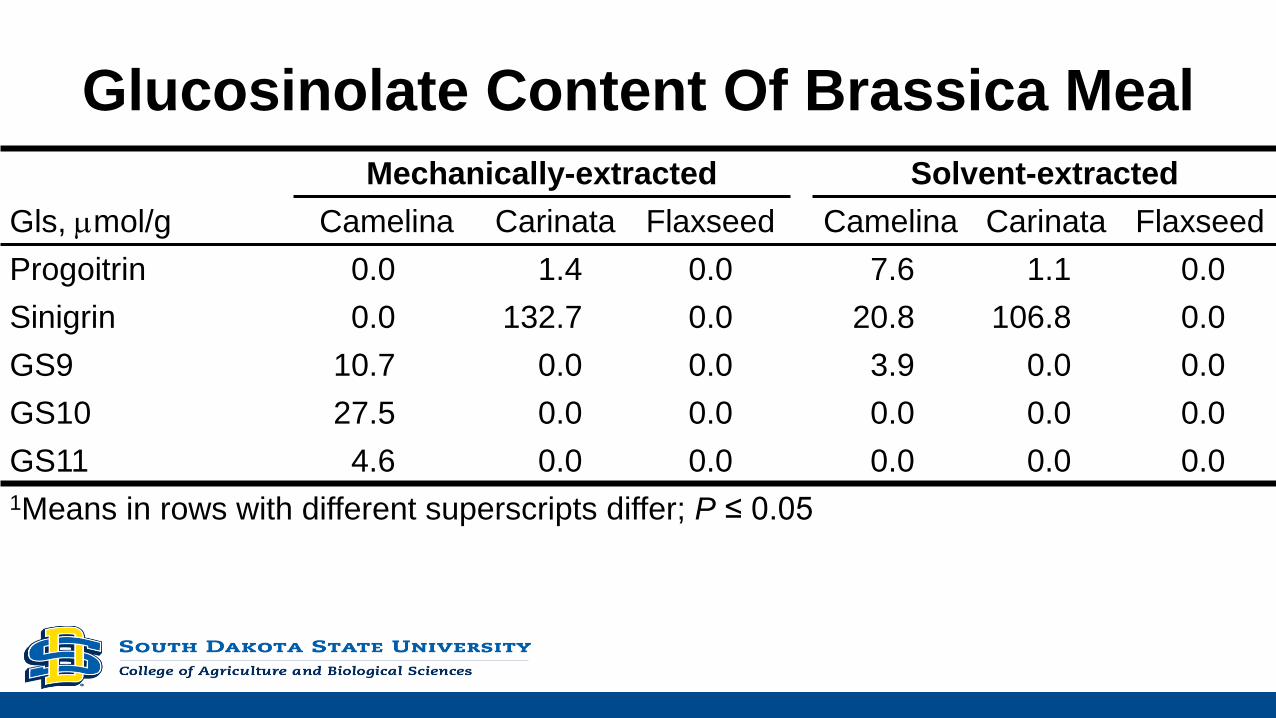
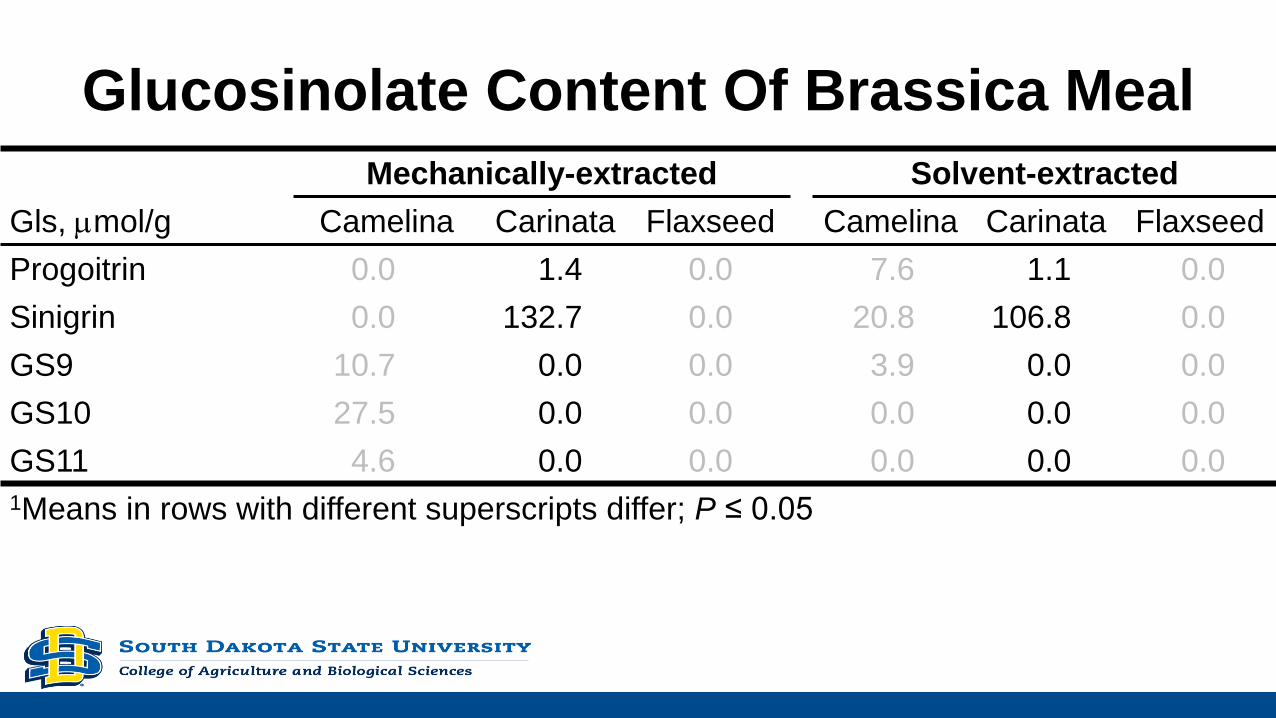
Glucosinolate Content Of Brassica Meal
Mechanically-extracted Solvent-extracted
Gls, mmol/g Camelina Carinata Flaxseed Camelina Carinata Flaxseed
Progoitrin 0.0 1.4 0.0 7.6 1.1 0.0
Sinigrin 0.0 132.7 0.0 20.8 106.8 0.0
GS9 10.7 0.0 0.0 3.9 0.0 0.0
GS10 27.5 0.0 0.0 0.0 0.0 0.0
GS11 4.6 0.0 0.0 0.0 0.0 0.0
1Means in rows with different superscripts differ; P ≤ 0.05
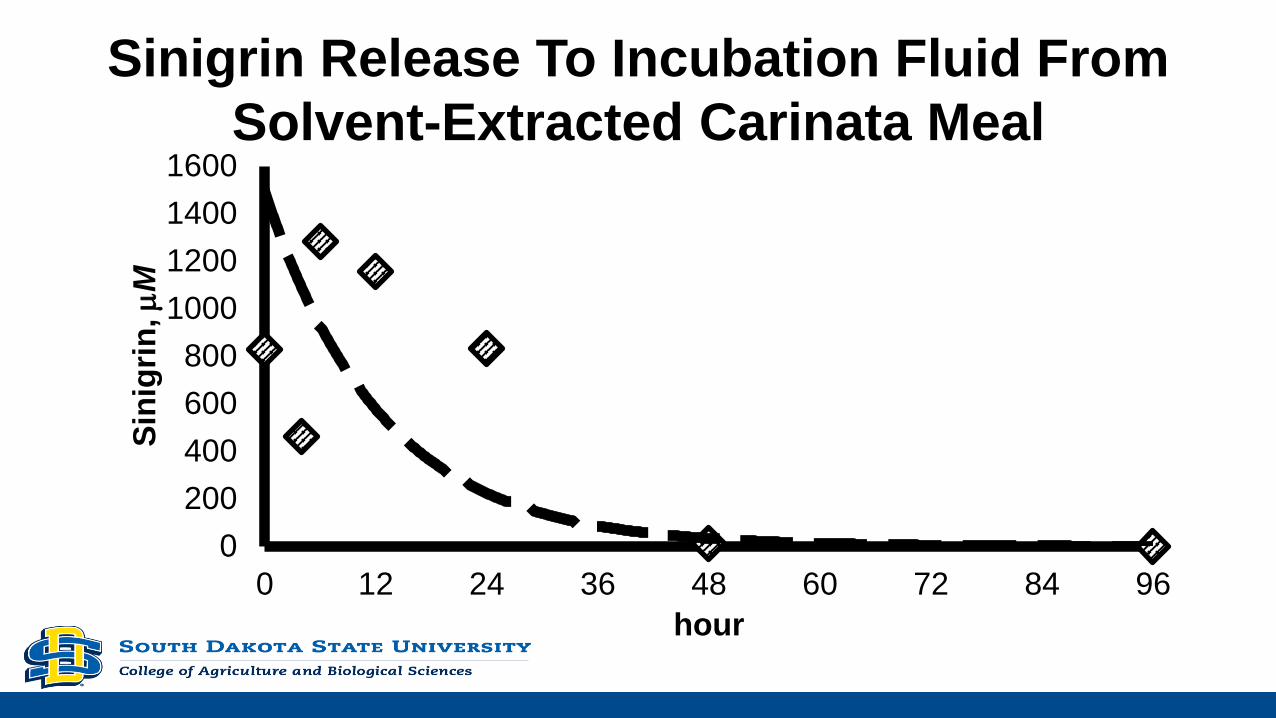
Sinigrin Release To Incubation Fluid From
Solvent-Extracted Carinata Meal
0
200
400
600
800
1000
1200
1400
1600
0 12 24 36 48 60 72 84 96
Sin
igri
n, m
M
hour
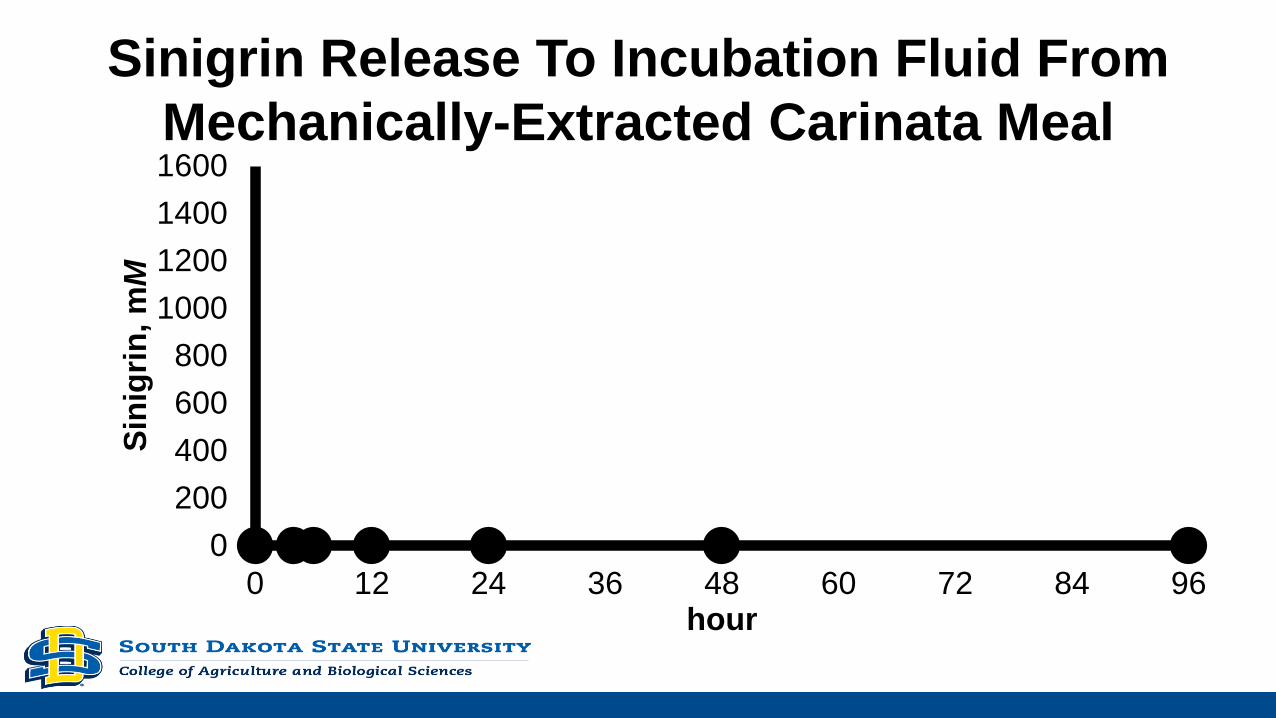
Sinigrin Release To Incubation Fluid From
Mechanically-Extracted Carinata Meal
0
200
400
600
800
1000
1200
1400
1600
0 12 24 36 48 60 72 84 96
Sin
igri
n,
mM
hour
What Did We Learn?
• Estimates of total-tract digestion indicate that Carinata meal may
be extensively digested
• Carinata meal appears to be a good source of ruminally
available nitrogen
• Carinata meal in our study contained detectable amounts of
goitrogenic glucosinolates but amounts decreased with
increased amounts of time
Effect Of Solvent- Or Mechanically-extracted Brassica
Carinata Meal On Performance Of Cows
• What are effects of extraction method on value of carinata meal
to cows?
• Does value of carinata meal differ when cattle are fed forage-
based diets with different particle size?
Methods
• 56 non-pregnant cows were blocked by BW
• Fed either long-stem or chopped corn-stalk residues
• 2 cows within each pen randomly assigned to receive:
– Cold-pressed carinata meal
– Solvent-extracted carinata meal
– Canola meal (positive control)
• 1 cow within each pen was randomly assigned to receive no supplemental protein (negative control)
Observations
• Differences in response to supplemental protein and particle size
• No protein source × particle size of corn stalk residues
– Apparently, greater forage length does not provide added benefit to
supplementing cattle with carinata meal
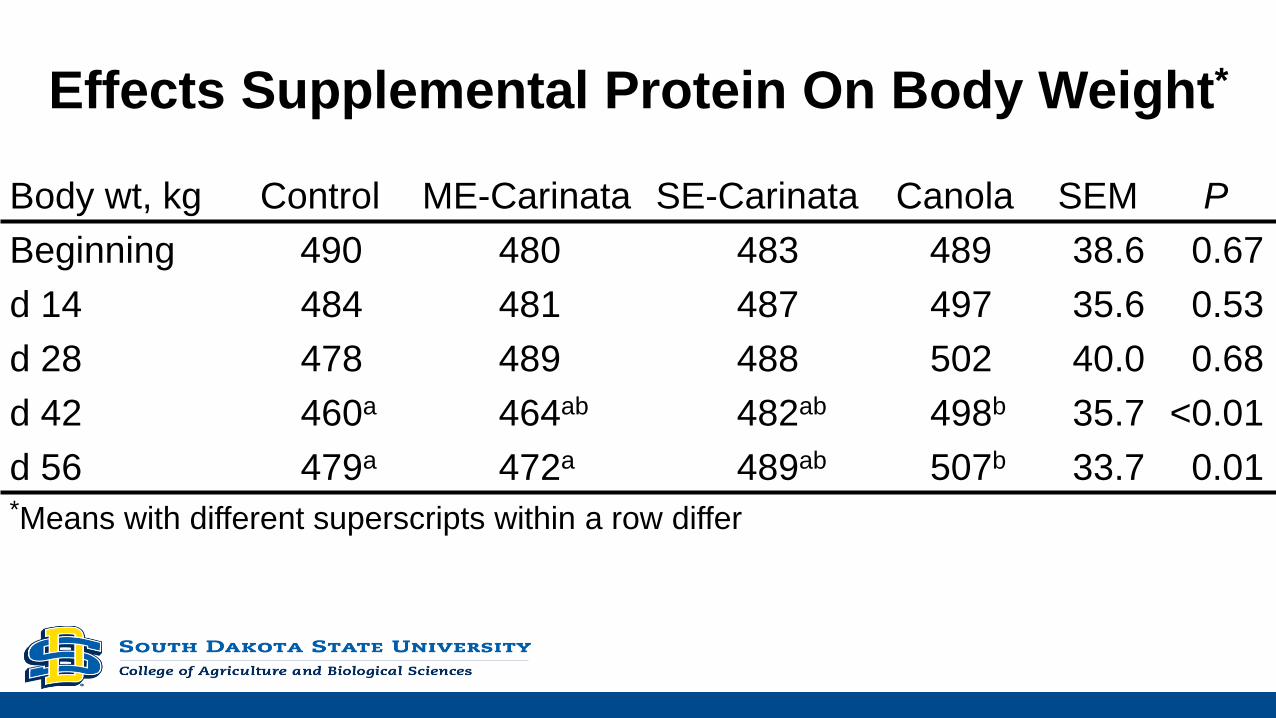
Effects Supplemental Protein On Body Weight*
Body wt, kg Control ME-Carinata SE-Carinata Canola SEM P
Beginning 490 480 483 489 38.6 0.67
d 14 484 481 487 497 35.6 0.53
d 28 478 489 488 502 40.0 0.68
d 42 460a 464ab 482ab 498b 35.7 <0.01
d 56 479a 472a 489ab 507b 33.7 0.01*Means with different superscripts within a row differ
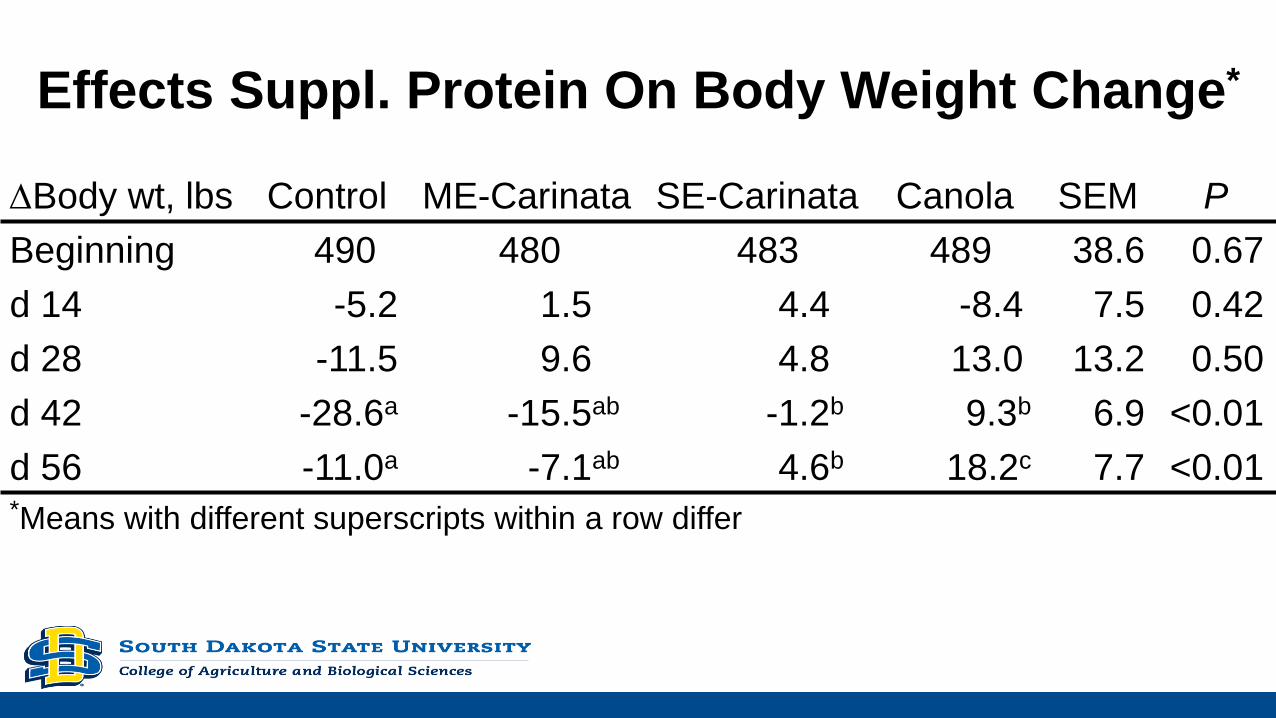
Effects Suppl. Protein On Body Weight Change*
DBody wt, lbs Control ME-Carinata SE-Carinata Canola SEM P
Beginning 490 480 483 489 38.6 0.67
d 14 -5.2 1.5 4.4 -8.4 7.5 0.42
d 28 -11.5 9.6 4.8 13.0 13.2 0.50
d 42 -28.6a -15.5ab -1.2b 9.3b 6.9 <0.01
d 56 -11.0a -7.1ab 4.6b 18.2c 7.7 <0.01*Means with different superscripts within a row differ
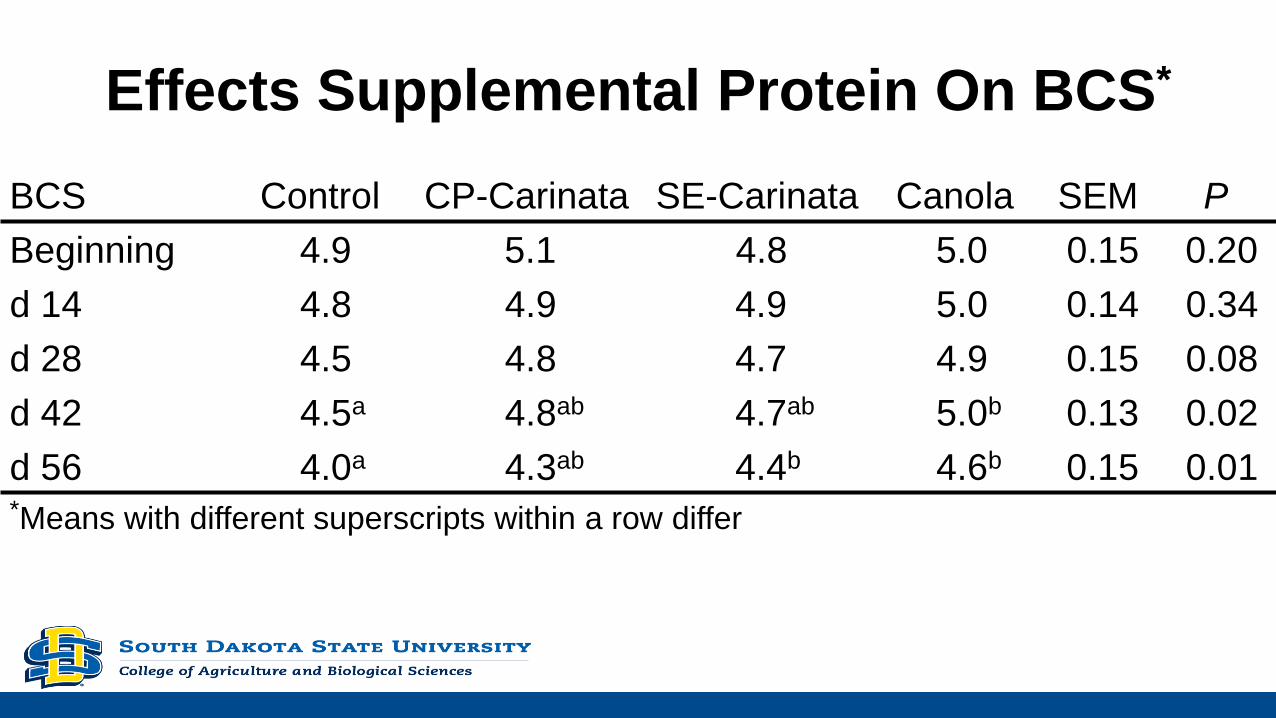
Effects Supplemental Protein On BCS*
BCS Control CP-Carinata SE-Carinata Canola SEM P
Beginning 4.9 5.1 4.8 5.0 0.15 0.20
d 14 4.8 4.9 4.9 5.0 0.14 0.34
d 28 4.5 4.8 4.7 4.9 0.15 0.08
d 42 4.5a 4.8ab 4.7ab 5.0b 0.13 0.02
d 56 4.0a 4.3ab 4.4b 4.6b 0.15 0.01*Means with different superscripts within a row differ
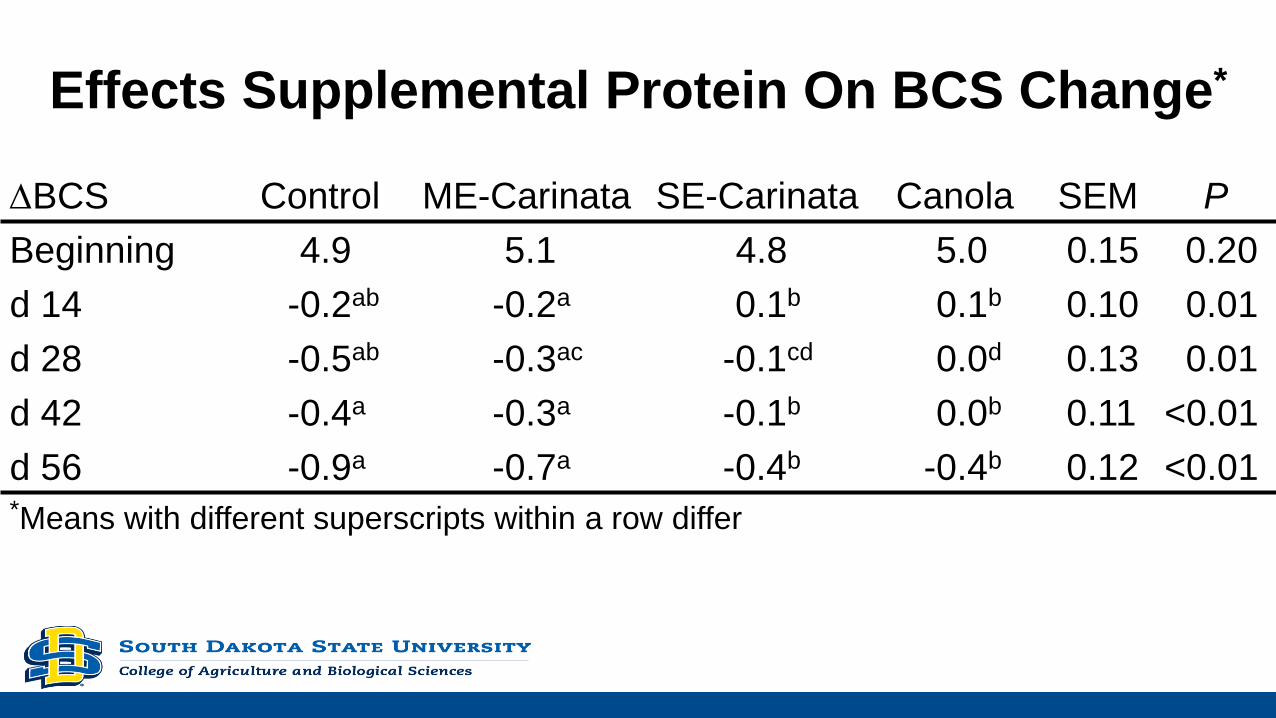
Effects Supplemental Protein On BCS Change*
DBCS Control ME-Carinata SE-Carinata Canola SEM P
Beginning 4.9 5.1 4.8 5.0 0.15 0.20
d 14 -0.2ab -0.2a 0.1b 0.1b 0.10 0.01
d 28 -0.5ab -0.3ac -0.1cd 0.0d 0.13 0.01
d 42 -0.4a -0.3a -0.1b 0.0b 0.11 <0.01
d 56 -0.9a -0.7a -0.4b -0.4b 0.12 <0.01*Means with different superscripts within a row differ
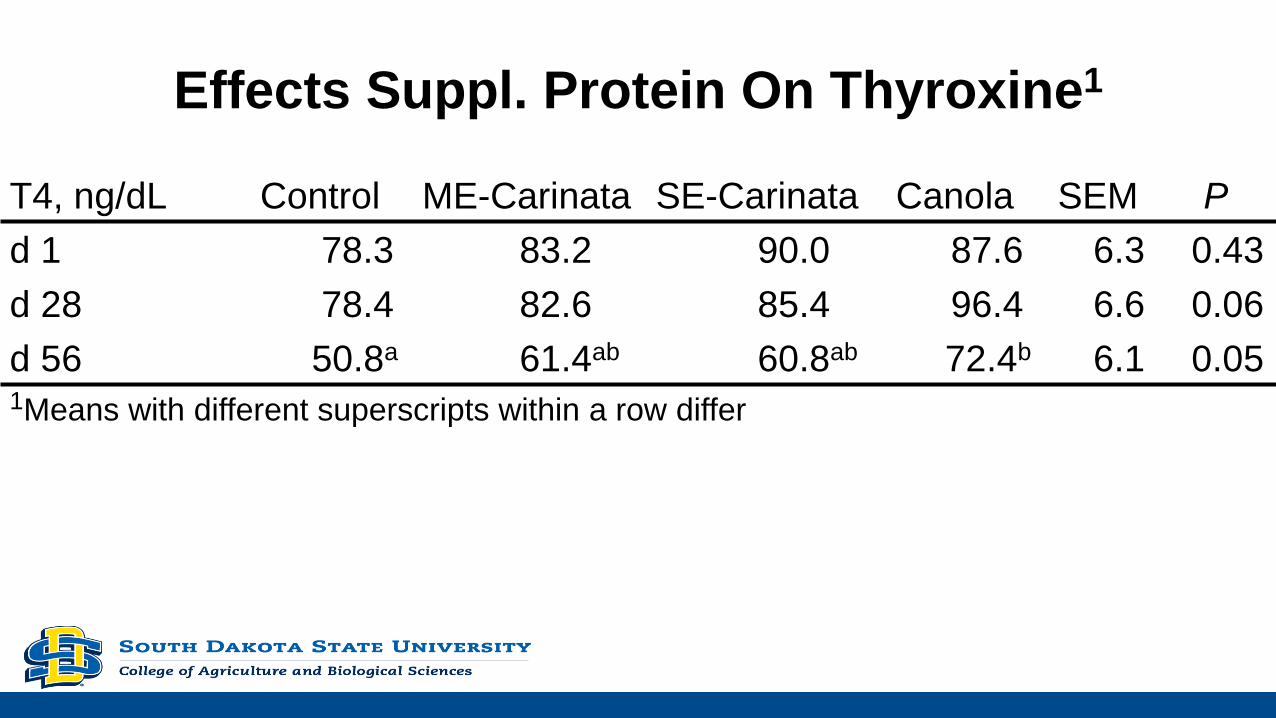
Effects Suppl. Protein On Thyroxine1
T4, ng/dL Control ME-Carinata SE-Carinata Canola SEM P
d 1 78.3 83.2 90.0 87.6 6.3 0.43
d 28 78.4 82.6 85.4 96.4 6.6 0.06
d 56 50.8a 61.4ab 60.8ab 72.4b 6.1 0.051Means with different superscripts within a row differ

Effects Suppl. Protein On Triiodothyronine1
T3, ng/dL Control ME-Carinata SE-Carinata Canola SEM P
d 1 4.2 4.4 4.7 4.4 0.35 0.52
d 28 4.4 5.0 5.4 5.1 0.45 0.29
d 56 3.3 3.4 3.5 3.9 0.36 0.411Means with different superscripts within a row differ

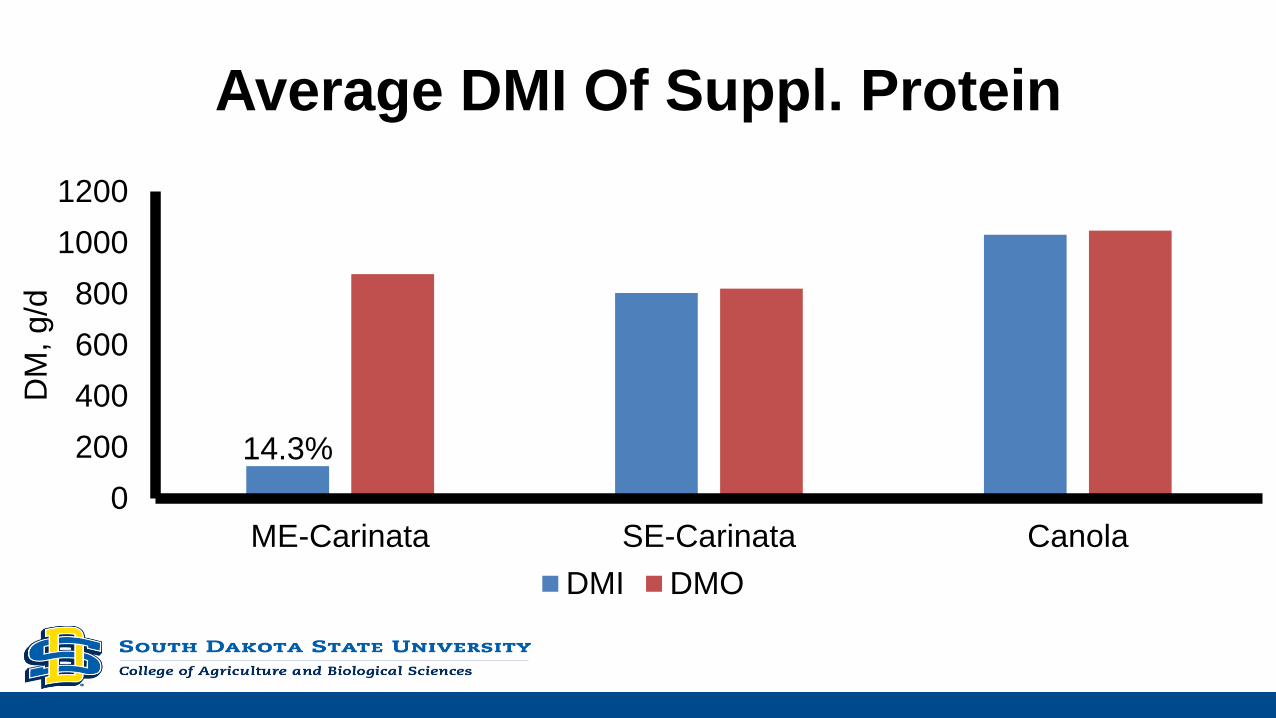
Average DMI Of Suppl. Protein
0
200
400
600
800
1000
1200
ME-Carinata SE-Carinata Canola
DM
, g/d
DMI DMO
Average DMI Of Suppl. Protein
0
200
400
600
800
1000
1200
ME-Carinata SE-Carinata Canola
DM
, g/d
DMI DMO
14.3%
What Did We Learn?
• As expected corn stalk residues did not supply adequate protein
to optimize cow performance
• The positive control ameliorated limits in protein
• Solvent extracted carinata meal enhanced cow performance
similar to the positive control
• Apparently cattle will voluntarily consume only modest amounts
of ME-carinata when fed as the entire meal
Does Inclusion Of Solvent Extracted
Carinata Meal Impact Feeding Behavior In
Finishing Cattle & Carcass Lipid Profiles?
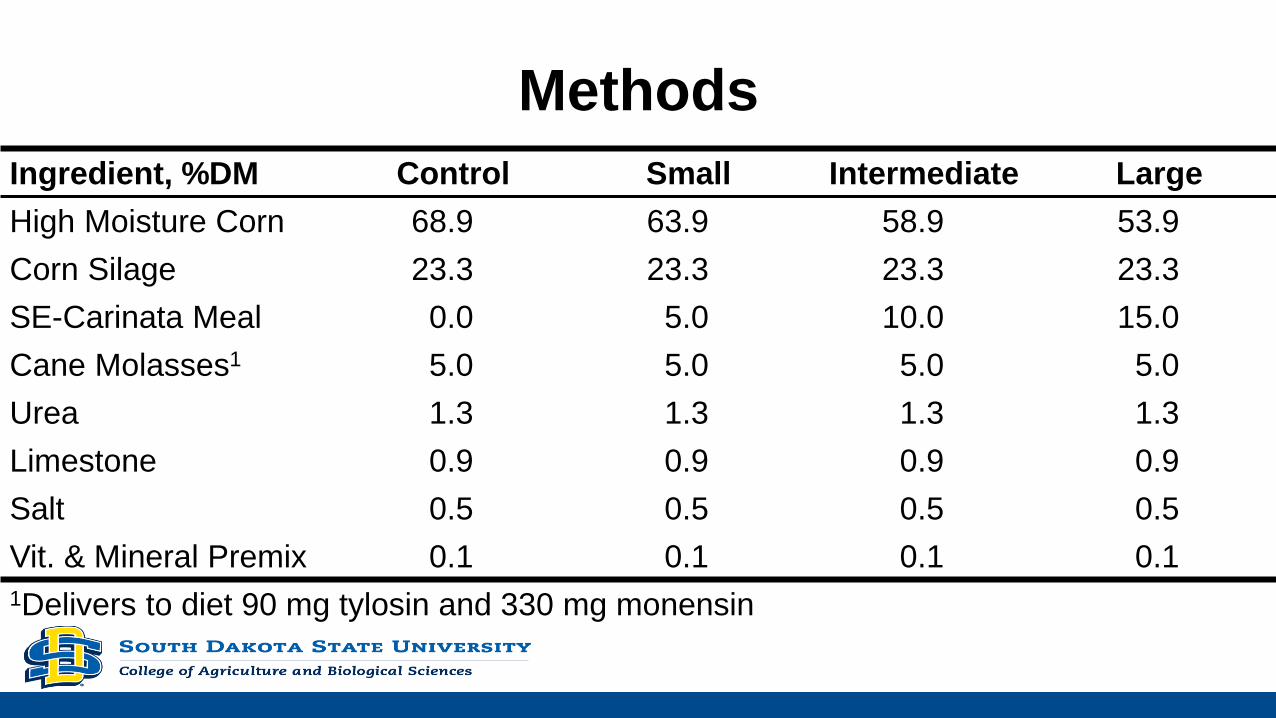
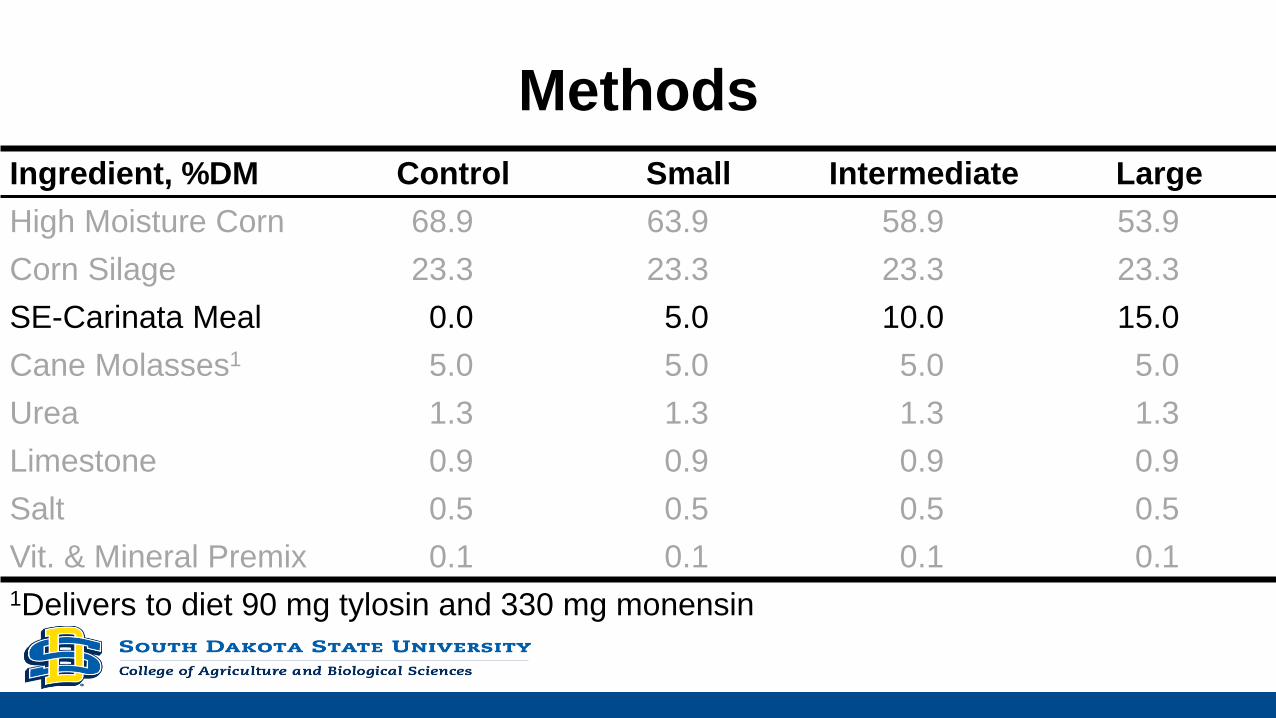
Methods
Ingredient, %DM Control Small Intermediate Large
High Moisture Corn 68.9 63.9 58.9 53.9
Corn Silage 23.3 23.3 23.3 23.3
SE-Carinata Meal 0.0 5.0 10.0 15.0
Cane Molasses1 5.0 5.0 5.0 5.0
Urea 1.3 1.3 1.3 1.3
Limestone 0.9 0.9 0.9 0.9
Salt 0.5 0.5 0.5 0.5
Vit. & Mineral Premix 0.1 0.1 0.1 0.1
1Delivers to diet 90 mg tylosin and 330 mg monensin
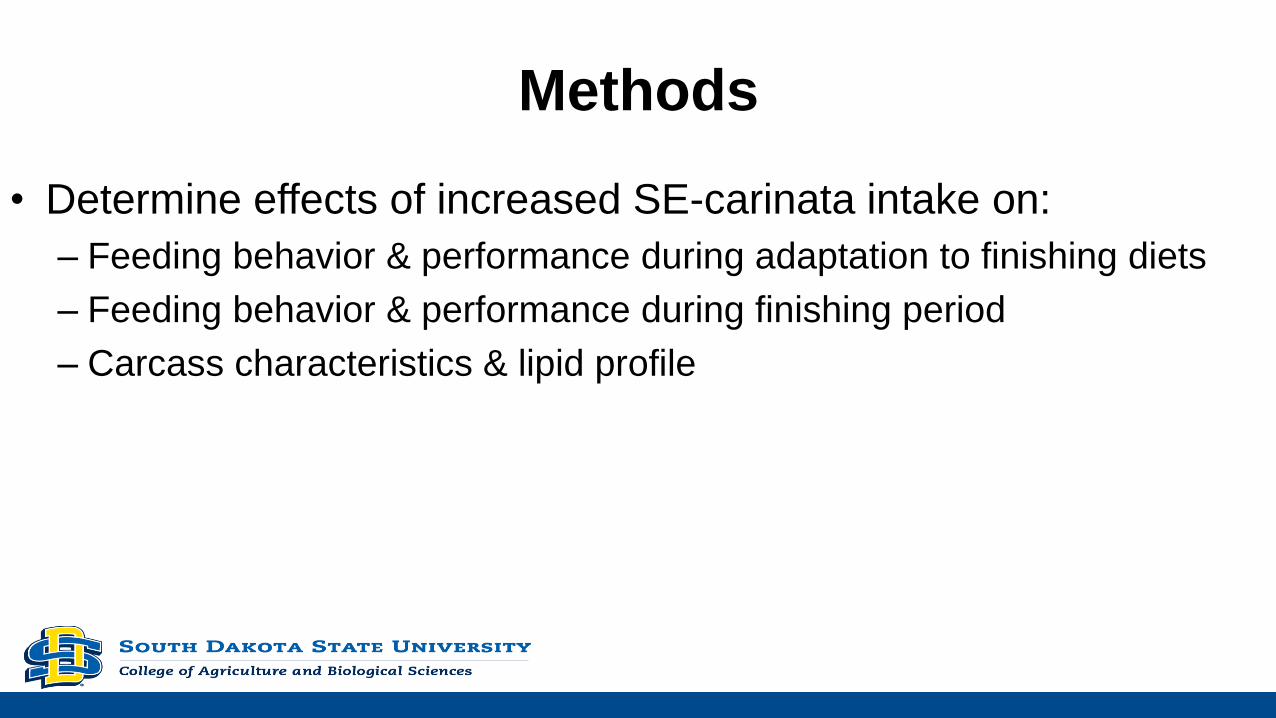
Methods
• Determine effects of increased SE-carinata intake on:
– Feeding behavior & performance during adaptation to finishing diets
– Feeding behavior & performance during finishing period
– Carcass characteristics & lipid profile
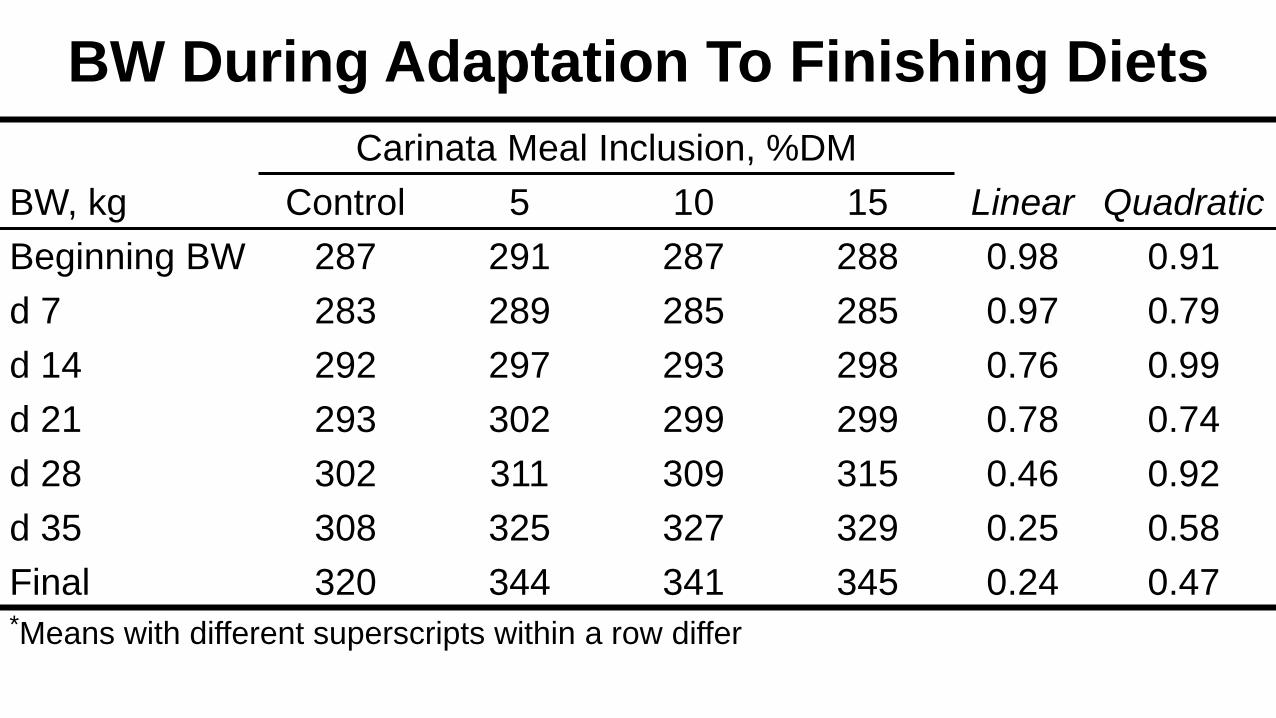
BW During Adaptation To Finishing Diets
Carinata Meal Inclusion, %DM
BW, kg Control 5 10 15 Linear Quadratic
Beginning BW 287 291 287 288 0.98 0.91
d 7 283 289 285 285 0.97 0.79
d 14 292 297 293 298 0.76 0.99
d 21 293 302 299 299 0.78 0.74
d 28 302 311 309 315 0.46 0.92
d 35 308 325 327 329 0.25 0.58
Final 320 344 341 345 0.24 0.47*Means with different superscripts within a row differ
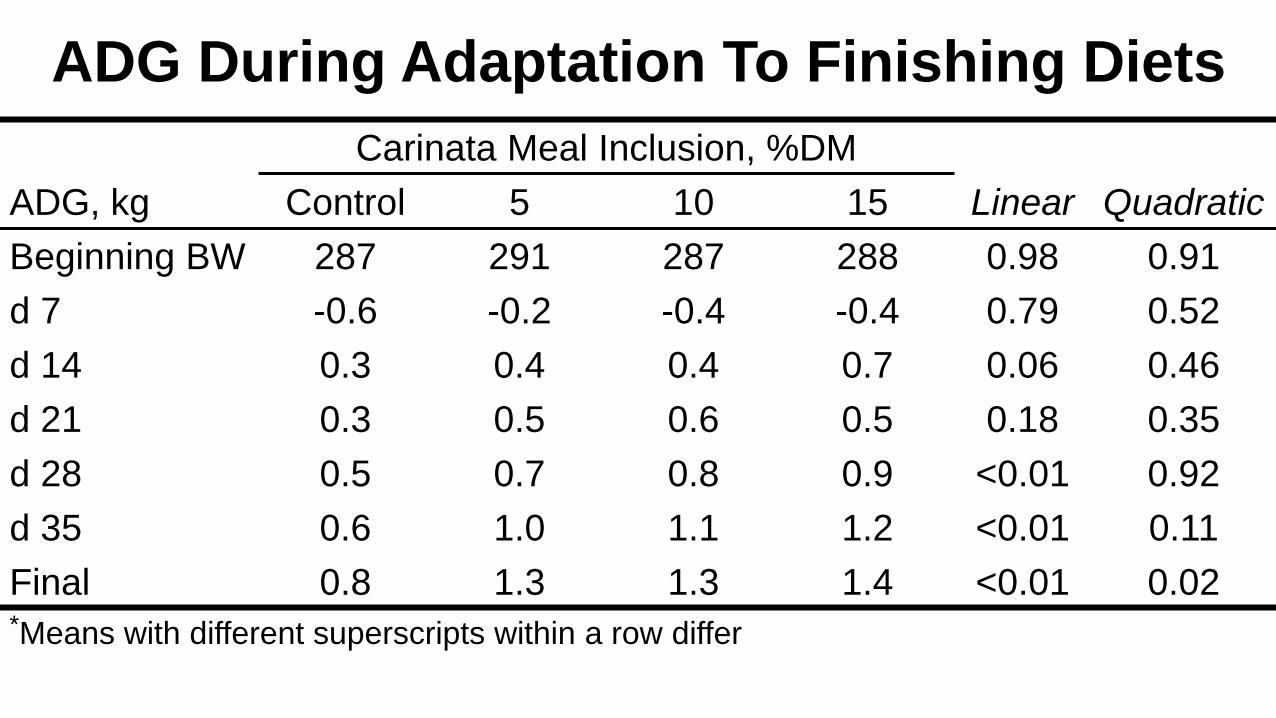
ADG During Adaptation To Finishing Diets
Carinata Meal Inclusion, %DM
ADG, kg Control 5 10 15 Linear Quadratic
Beginning BW 287 291 287 288 0.98 0.91
d 7 -0.6 -0.2 -0.4 -0.4 0.79 0.52
d 14 0.3 0.4 0.4 0.7 0.06 0.46
d 21 0.3 0.5 0.6 0.5 0.18 0.35
d 28 0.5 0.7 0.8 0.9 <0.01 0.92
d 35 0.6 1.0 1.1 1.2 <0.01 0.11
Final 0.8 1.3 1.3 1.4 <0.01 0.02*Means with different superscripts within a row differ