Embed Size (px)
Citation preview

Buncombe County Schools
School Improvement Plan
2014 – 2016
A.C. Reynolds High School
Buncombe County Schools 2014 – 2016 School Improvement Plan
Table of Contents
1. Cover 2. Table of Contents 3. Statement of Assurance 4. Vision, Mission, Belief Statements 5. School Profile
Demographics/School Characteristics Climate/Culture Academics
6. School Improvement Plan—Objectives & Strategies 7. Year-long Professional Development Plan 8. Attendance 9. Federal and State AMO Targets and Performance Standards –
Percent Proficient: Academic Performance 10. Annual Measurable Objectives (AMO) Report – Reading 11. Annual Measurable Objectives (AMO) Report – Science 12. Annual Measurable Objectives (AMO) Report - Math 13. CTE Post-Assessment Data 14. EVAAS Academic Growth 15. Students Passing Courses Required for Graduation 16. Parent/Community Involvement 17. Safe School Data 18. Dropout Data 19. Plan for Duty-Free Lunch and Duty-Free Planning 20. SAT Test Data 21. Advanced Placement Data 22. Building Level Waiver – Blank Form 23. Building Level Waiver – Transfer of Funds 24. Building Level Waiver – Exceed Class Size 25. Mid–Year Reflection 26. Progress Report

Buncombe County Schools 2014 – 2016 School Improvement Plan
Statement of Assurance
The School Improvement Team, with input from faculty, staff, and community members, has developed the following plan. This plan is based on an analysis of the data collected in the areas of academics, climate/culture, and demographics/school characteristics in conjunction with both the No Child Left Behind and N.C. Accountability Guidelines. The following AdvancED Accreditation Standards for Quality Schools are addressed in this plan: NCSBE Goals AdvancED Standards
- Globally Competitive Students - Purpose and Direction - 21st Century Professionals - Governance & Leadership - Healthy & Responsible Students - Teaching & Assessing for Learning - Twenty-First Century Systems - Resources and Support Systems - Strong Family, Community, and Business Support - Using Results for Continuous Improvement
Principal SIT Co-Chair Charles Furlow ______________________________ SIT Co-Chair Martha Cowan Signature: Signature: Assistant Principal: Kevin Yontz Assistant Principal: Kasey King Signature: Signature: Assistant Principal: Jeffrey Burleson Assistant Principal: Steven McCurry Signature: Signature: Teacher: Canda Molinari Instructional Support: Stephanie Brigman______ Signature: Signature: _______ Teacher: Ethan Burns Teacher: Steven Payne _____________ Signature: Signature: Teacher: James Wilson Parent: _ Jerri Wommack ______ Signature: Signature: Teacher: Joseph Keever _______ Teacher: Shane Laws ______ Signature: Signature: Teacher: Kelli Self ______ Teacher: Marcia Hudzik _______ Signature: Signature: _______ Parent: Melody Harris ______ Parent: Judith Fender_______________

Signature: Signature: _______ Student: Terrell Mwetta Parent: Gabe Daughtery____________
Approved by secret ballot vote of the staff on _____9/26/14_______________ Date
_____ Principal SIT Co-Chair Charles Furlow _____ SIT Co-Chair Martha Cowan Please duplicate this page if needed to accommodate signatures of all School Improvement Team members.

Buncombe County Schools 2014 – 2016 School Improvement Plan
BCS Mission Statement
To collaborate with stakeholders to provide a safe, caring, rigorous and engaging learning environment that prepares all students to be Career
and College Ready.
BCS Vision Statement
Buncombe County Schools’ students will reach their full potential and become successful, responsible citizens in a diverse, global society.
ACRHS Mission Statement
AC Reynolds High School is committed to Success for ALL Students Our Purpose: From the classroom, to the athletic field, to the stage, and in all activities, we provide an education for ALL students that empowers them to become well rounded, productive adults, prepared to positively contribute and thrive within their local and global communities.

ACRHS Belief Statements
Student Learning and Graduation Rate
In order to ensure success for ALL students, ACRHS is committed to the advancement of learning through our Professional Learning Community (PLC). In our PLC, collaborative teams build and sustain a comprehensive, rigorous, and clearly articulated curriculum comprised of: (1) student learning goals, (2) continuous assessment of progress toward learning goals, (3) evidence-based instructional strategies for the achievement of learning goals, and (4) a systematic response to students who struggle to learn or who require enrichment. Through collaborative teaming, teachers commit to, collective inquiry, shared practice, self-reflection, and evidence-based decision making. With teacher guidance, students accept increasing responsibility for their learning by knowing their learning goals, assessing their progress, and committing to the achievement of their goals.
Diversity, Equity, and Access
In order to ensure success for ALL students, ACRHS holds high expectations for every student and provides the support required to help them meet those expectations. We appreciate and value the differences among students and recognize the need to consider individual needs. We provide access and encouragement to ALL students to participate in a wide variety of school activities and academic programs.
Student Climate and Campus Safety In order to ensure success for ALL students, ACRHS provides a safe, caring, supportive, and positive climate for students. We have developed a Student Climate Team and a Campus Safety Team comprised of a wide representation of stakeholders who assess the areas of need by analyzing student surveys and recommending strategies for continuous improvement of both climate and safety.
Professional Climate ACRHS provides a safe, caring, supportive, positive, and professional school climate for ALL faculty and staff. We have developed a Professional Climate Team comprised of a wide representation of stakeholders who assess the areas of need by analyzing faculty and staff satisfaction surveys. This team recommends strategies for continuous improvement of the professional climate

Buncombe County Schools
2014 – 2016 School Improvement Plan
School Profile Narrative
School: A. C. Reynolds High School
Describe your current reality in each of the three profile areas: Demographics/School Characteristics, Climate/Culture, and Academics. Demographics/School Characteristics
At the beginning of the 2014-2015 school year, A.C. Reynolds High School (ACR) had a total enrollment of 1,359 students (50% of the population being male and 50% female). The ethnic make-up of the school was predominantly Caucasian at 75% of the student population, followed by 9.5% African American, 8% Hispanic, 6% Multiracial, 2% Asian, and less than 1% Native American. Our African-American population decreased slightly and our Hispanic and Multiracial populations increased slightly since our last analysis in 2012. Our total enrollment decreased by 50 students (two charter high schools and a STEM high school opened in 2014). Students who attend ACR live in the suburban area around the city of Asheville including Fairview, Arden, Fletcher, and Haw Creek. The housing situation ranges from wealthy neighborhoods to impoverished areas. Approximately one-third of the students ride the bus; 45% of the students receive free or reduced lunch. About half of the students who attend ACR have their family origins in the area. Over the last 15 years the student population has changed. Many families from other countries have moved to the Reynolds school district. During the 2013-2014 school year, 2% of the ACR student population spoke English as a Second Language (ESL). Our ESL population is composed of families from the Ukraine, Russia, Moldova, Jamaica, and various Latin American and Asian countries. For the 2013-2014 school year, A.C. Reynolds High School had a graduation rate of 89.1%, up 4.4% from our last report and the highest rate in our school’s history. Students with special needs comprise around 15% of our population, a 5% increase since our last analysis. The average attendance for 2013-2014 was 96% (up .5% from the last analysis). The dropout rate data is not available at this time, but will be analyzed once all the figures are released. The 90 members of the A.C. Reynolds High School faculty are predominantly Caucasian. One teacher is of African-American ethnicity and one is a visiting faculty member from China through the Confucius Classroom Grant. 47% of our faculty is male and 53% is female. Nationally Board Certified teachers comprise 16% of the faculty and 21% are Initially Licensed teachers. The ACR School Improvement Team (SIT) is composed of one representative from each department including counseling, the administrative team, two parents, and two student representatives. All of the SIT faculty and parent participants are Caucasian and the two student representatives are African-American.

Climate/School Culture A.C. Reynolds High School is a community that affirms the importance of learning and growing. We are a comprehensive high school facility of approximately 256,000 square feet. We are committed to upgrading existing facilities with an emphasis on safety. Programs in place that promote safety include comprehensive coverage and monitoring of our surveillance cameras, a full time School Resource Officer, improvements in our alarm system, more widespread teacher coverage of the building when students are present, new electromagnetic door holders/releases, and a trained security officer with consistent presence. We have a written crisis management plan that provides training for staff and students with regular drills to ensure fluency in practice and procedures. The surrounding community has a long-standing sense of pride in the school due to continued excellence in academic achievement, sports and the performing arts. One third of the student population participates in an athletic activity; one third participates in our art and/or our performing arts program. Overall, according to student surveys, approximately 63% of our students agree or strongly agree that they feel respected and cared about within ACR and feel safe and free to report crimes and other incidents (25% neutral). 61% agree or strongly agree that their teachers provide them with clearly defined expectations, that they are recognized for good work, and feel that they are successful (28% neutral). Of the students surveyed, 67% agreed or strongly agreed that they feel supported by their families and believe the school has strong parent involvement (27% neutral). 39% of seniors reported seeing the possession and/or use of illegal substances in school or on the bus (23% neutral). 79% of seniors surveyed agreed or strongly agreed that they feel safe at school (15% neutral). Several programs at ACR emphasize physical fitness and the knowledge to live a healthy lifestyle. In addition, the campus features a fitness trail in order to combat the rising numbers of students, faculty, and community members struggling with obesity. The cafeteria meets all of the requirements of the National School Lunch and School Breakfast Program and the Hunger-Free Kids Act, programs enacted to raise a healthier generation of kids. In order to develop and maintain meaningful relationships with our students, we have continued our Rocket Power mentoring program. Rocket Power is designed so that every member of the faculty and staff will continuously meet with the same mentor group (formerly “homerooms”) over a four year period. To ensure frequent, meaningful contact, Rocket Power groups meet once a week to discuss strategies for school success such as time management and organization as well as to discuss school policies and expectations. In addition, our Honors Journalism class produces a school news program which is shown in Rocket Power on a bi-monthly basis. Our school counselors coordinate a program called “Rocket Launch” that makes individual connections between teachers and students considered “at-risk” for struggling in high school. Those students are identified at the beginning of the school year and our “At Risk” team of administrators, counselors, and case workers discuss their progress at weekly meetings in order to make sure the students receive consistent support and do not fall through the cracks. A.C. Reynolds High School has a highly qualified faculty and staff, committed to continuous professional development and growth. We employ a variety of high-level instructional strategies including: district, school wide and subject area PLC teams; differentiated instruction for diverse learning styles; digital learning strategies; monthly literacy strategies for all subject areas; an emphasis on common instructional framework; and Positive Behavior Interventions and Supports. These strategies are utilized in connection with the North Carolina Common Core & Essential Standards and are implemented under a Professional Learning Communities model. Relevant field trips and interscholastic contests that support the curriculum are also encouraged.

Evidence gathered from the 2014 Teacher Working Conditions Survey (72% of faculty responded) indicates that A. C. Reynolds High School is making strides to maintain excellence. For instance, in the last analysis, only 39% of teachers at the school felt that they had adequate time for collaboration with colleagues, but in 2014, that figure rose significantly to 73%, an improvement likely attributed to common planning time scheduled during the school day. The survey also indicates that a majority of teachers are satisfied with the facilities (clean and well maintained-95%; adequate work space-86%) and that the facilities support teaching and learning (87%). In addition, teachers surveyed responded positively when asked about communication with parents and other community stakeholders (overall response 82% agreeing). There are areas in which we need to improve in the future. In 2014, only 51% of teachers felt that they were able to teach with minimal interruptions and that they are allocated adequate non-instructional time for preparation, down from 67% in the previous analysis. Of those surveyed, only 45% of teachers felt they had an appropriate level of influence on decision making at A. C. Reynolds High School and 48% felt comfortable raising issues and concerns that are important to them. Another area of improvement was indicated by 37% of the respondents who thought class sizes were reasonable. Access to appropriate instructional materials (52%) and adequate access to computers, internet, printers, and software (58%), factors that are primarily budget-driven, indicate a need for improvement. Academic Achievement A. C. Reynolds High School is a silver medalist in the US News and World Report rankings (placing 12th in North Carolina overall). We consistently establish high academic expectations for all students by instilling a sense of responsibility, self-discipline, and a desire for life-long learning. ACRHS did not meet expected growth for the 2013-2014 school year despite the fact that we met 69 of 71 targets (97.7%), far exceeding the county average of 76.2% and the state average of 55.2%. Reynolds High School performed well on the end-of-course assessments. 76.1% of English II students scored a Level III or higher (state ave=61.2%). 64.2% of Biology students scored Level III or higher (state ave=53.9%). 58.3% of Math I students scored a Level III or higher (state ave=60%). Since the tests were renormed and the achievement levels redistributed, there is not a year for comparison at this point. ACR consistently scores higher than state and national averages on the ACT. During the 2013-2014 school year, 67.4% of students scored a 17 or higher (county=60.6%, state=59.3%). ACR students have a history of success on Advanced Placement Exams. 68.1% of students who took an AP exam in spring 2014 scored 3 or higher, with 240 students taking a total of 379 tests. The last analysis showed the percentage at 87% of students making a 3 or better.


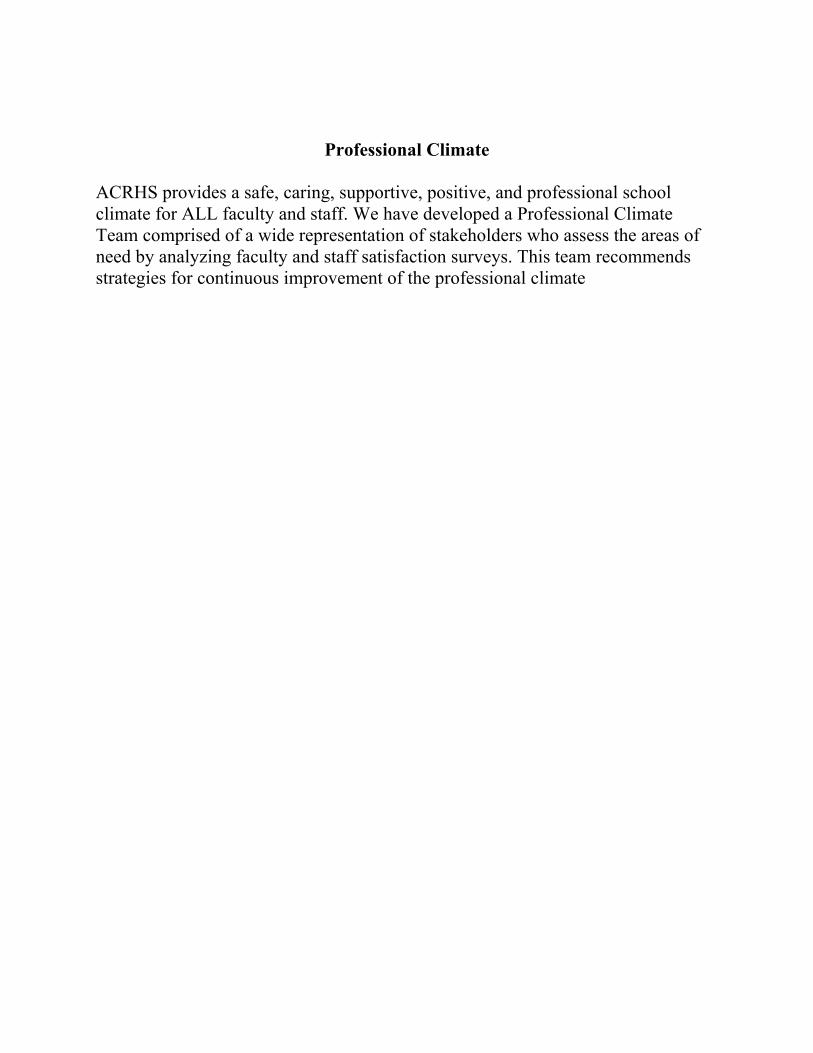
Buncombe County Schools 2014 – 2016 School Improvement Plan
School: A.C. Reynolds High School
Attendance*
School Year Attendance Rate
2011 - 2012 95.5%
2012 - 2013 96%
2013 - 2014 95.4%
2014 - 2015
2015 - 2016
*Source: Report: 10th month Year to Date Attendance Percentages for the School Year (this will be sent to you in June from the CO)

Buncombe County Schools 2014 – 2016 School Improvement Plan
School: A.C. Reynolds High School
Federal and State AMO Targets and Performance Standards – Percent Proficient
AMO Targets 2011 - 12 2012-13 2013-14 2014-15 2015-16
Total Number of Federal AMOs 19 23 ------------
Number of Federal AMOs Met 19 25 ------------
Percentage of Federal AMOs Met 100 92 -------------
Total Number of State AMOs ------------ 75 71
Number of State AMOs Met ------------ 69 69
Percentage of State AMOs Met ------------ 92 97.2
Performance Standards 2011 - 12 2012 - 13 2013 - 14 2014 - 15 2015 - 16
Math I 51.5 51.1
Algebra I/Integrated II 80.7
Biology 86.5 60.9 58.1
English I 86.1 n/a
English II 65 68
Performance Composite 83.7 53.9 64.5
Math Course Rigor 95 95
The ACT 69.2 67.4
ACT WorkKeys 79.3 71.4
4-Year Cohort Graduation Rate 83.3 89.1
5-Year Cohort Graduation Rate 86.5 85.7
Graduation Project yes yes
Information for this chart is found on the Ready Accountability Model (State Targets Met) website at www.ncaccountabilitymodel.org.

Buncombe County Schools 2014 – 16 School Improvement Plan
School Year: 2013-2014
School: A C Reynolds High School
Annual Measurable Objectives (AMO) Report* READING Grade 10
All
Stu
dent
s
Am
eric
an In
dian
Asi
an
Bla
ck
His
pani
c
Tw
o or
Mor
e R
aces
Whi
te
Eco
nom
ical
ly
Dis
adva
ntag
ed
Lim
ited
Eng
lish
Pro
ficie
ncy
Stu
dent
s w
ith
Dis
abili
ties
Aca
dem
ical
ly/
Inte
llect
ually
Gift
ed
Eligible Students 334 <5 10 29 23 18 254 138 11 49
94
Met 95% Participation Yes NA NA Yes NA NA Yes Yes NA Yes
yes
Tested Students (FAY) 322 <5 10 29 21 17 245 129 * 47
94
Target Goals 57.1 * * 39.9 46.8 59.5 67.4 42.4 * 22.7
93.5
Percent Proficient 68 * 68.1 * * * 75.5 44.1 14.5 25.5
>95
Met Proficiency Target yes * * No Subgroup * * yes yes * yes
yes
*Data not measured or not applicable for ACRHS

Buncombe County Schools 2014 – 16 School Improvement Plan
School Year: 2013-2014
School: A C Reynolds High School
Annual Measurable Objectives (AMO) Report* SCIENCE, Grade 10
All
Stu
dent
s
Am
eric
an In
dian
Asi
an
Bla
ck
His
pani
c
Tw
o or
Mor
e R
aces
Whi
te
Eco
nom
ical
ly
Dis
adva
ntag
ed
Lim
ited
Eng
lish
Pro
ficie
ncy
Stu
dent
s w
ith
Dis
abili
ties
Aca
dem
ical
ly/
Inte
llect
ually
Gift
ed
Eligible Students 342 <5 8 37 24 20 253 126 5 41
102
Met 95% Participation Yes * * Yes * * Yes Yes * Yes
yes
Tested Students (FAY) 320 <5 6 36 21 17 240 114 <5 39
101
Target Goals 55.9 41.5 73.0 37.7 46.1 57.2 65.5 41.7 15.4 27.9
89.8
Percent Proficient 58.1 * * 33.3 * * 63.8 43 * 15.4
95
Met Proficiency Target yes * * yes * * yes yes * no
yes
* Data not measured or not applicable for ACRHS

Buncombe County Schools 2014 – 16 School Improvement Plan
School Year: 2013-2014
School: A C Reynolds High School
Annual Measurable Objectives (AMO) Report* MATH, Grade 10
All
Stu
dent
s
Am
eric
an In
dian
Asi
an
Bla
ck
His
pani
c
Tw
o or
Mor
e R
aces
Whi
te
Eco
nom
ical
ly
Dis
adva
ntag
ed
Lim
ited
Eng
lish
Pro
ficie
ncy
Stu
dent
s w
ith
Dis
abili
ties
Aca
dem
ical
ly/
Inte
llect
ually
Gift
ed
Eligible Students 334 <5 10 29 23 18 254 138 11 49 94
Met 95% Participation Yes * * * * * Yes Yes * No
yes
Tested Students (FAY) 309 <5 9 27 21 17 235 124 9 45
94
Target Goals 44.6 36.2 66.7 28.5 36.6 44.3 53.6 32.0 14.8 18.7
84
Percent Proficient 51.1 * * * * * 60 30.6 * 13.3
90.4
Met Proficiency Target yes * * * * * yes yes * yes
yes
*Data not measured or not applicable for ACRHS

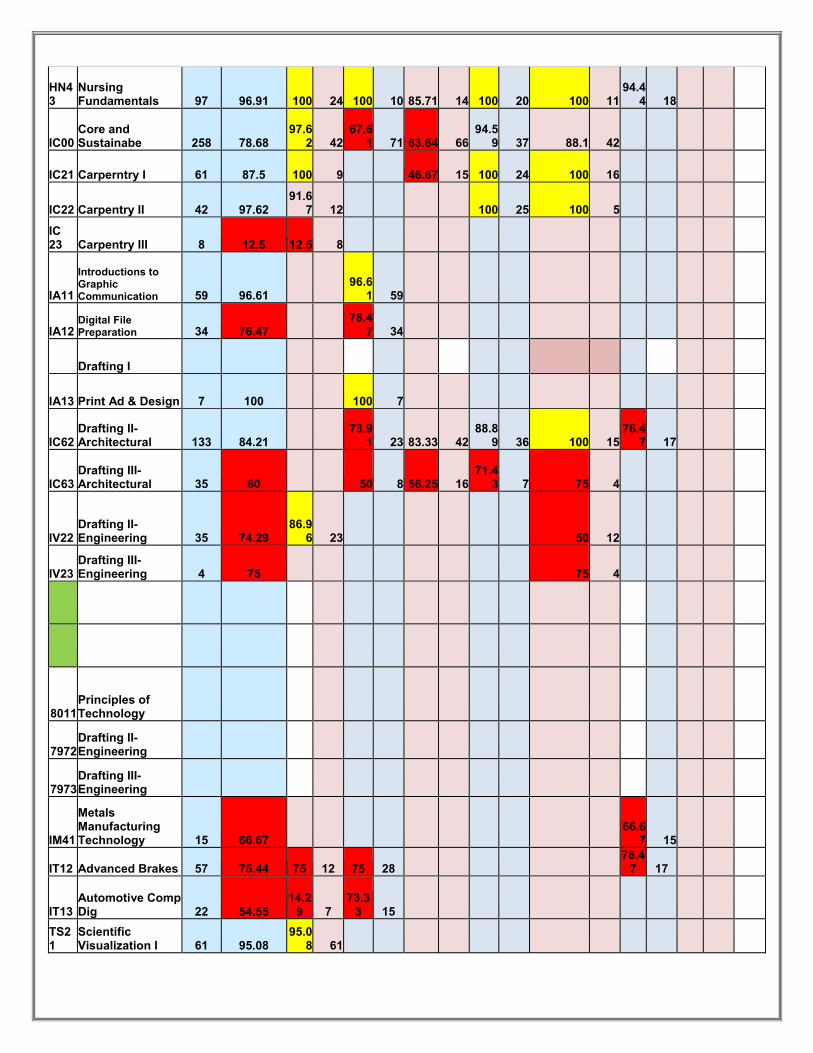
CTE Post-Assessment Results 2013 – 2014
It is the goal of the Career and Technical Education Department at ACRHS to provide students with
instruction that will ensure their success in post-secondary education and/or the workplace of 21st century. The 2013-2014 school year saw nearly half of the CTE Department teachers leave as a result of turnover and many of the new teachers in their first year of teaching. The 2013-2014 CTE Post-Assessment data showed the best test scores in the county in fifteen courses, but as a entire department there were seven areas that were below proficiency. The net result of the lack of proficiency saw our school drop from the best test scores in the county to fourth best in the county. The CTE Department is committed to the growth of our students and will utilize the goals and strategies from this School Improvement Plan to increase student learning and achievement in all areas.
Course #
Course Name # of Studen
ts Tested
in County
District Average
ACR
# teste
d ACR
ENKA
# teste
d Enka
ERWIN
# teste
d Erwi
n
NBHS
# tested NB
OWEN # teste
d Owe
n
TCR # teste
d TCR
CHS
# teste
d CHS
Below the 77% Profiency RateHighest
in county
CC45
Career Management 286 81.47 91.3 69 80 55 68.75 64
80.49 41
85.96 57
6411Computer Applications 1
BF05 Personal Finance 418 87.56
95.51 89 78.79 99 87.8 41 84.21 76
91.15 113
BA10 Accounting I 44 72.73
72.73 44
BD10
Multimedia and Webpage Design 349 83.67
73.91 46
70.97 62 86.36 44
96.36 55 86.49 74
86.76 68
BD12 e-Commerce I 40 90
83.33 12
93.75 16 91.67 12
6416e-Commerce II
6415
Digital Communications Systems (NCVPS)
BM10
MSITA- Powerpoint,Publisher and Word
BM20
MSITA- Excel & Access
BP10
Computer Programming I (NCVPS)
6* BCEC Teste
d 1 66.67 66.6
7 3 50 2
6615
Small Business Entrepreneurship (NCVPS)
MA52 Marketing Mgt 14 78.57 78.57 14

MM51 Marketing I 267 77.9
93.48 46
78.43 51 57.89 76
94.44 18 100 27
75.51 49
6622Marketing Management
6631Fashion Merchandising
MH31
Sports & Ent. Marketing I 191 84.82
95.24 63
95.65 23 65.08 63 94.44 18
91.67 24
MI21 Fashion Merchandising 75 70.67
94.12 17
63.79 58
MH32 Sports Mrkt II
BF10
Principles of Business 209 91.87
95.52 67
97.56 41 83.33 78 100 23
AU10 Agriscience App. 114 81.58
85.71 21
77.36 53 85 40
AU11
Agricultural Production I 98 93.88
82.86 35 100 21 100 42
AU12
Agricultural Production II 33 90.91
88.24 17 93.75 16
AA21 Animal Science I 160 68.13
76.19 21
52.94 17 51.06 47
80.00 45 80 30
AA22 Animal Science II 34 47.06 37.5 16
55.56 18
6823Animal Science II Small Animal
AA23
Animal Science II Small Animal
AA31 Equine Science I
6826Equine Science II
6826Equine Science II
AA32 Equine Science II
AA23
Animal Science II - Small Animal 16 81.25 81.25 16
AA31 Equine Science 20 75 75 20
AA32 Equine Science II 24 87.5
93.75 16 75 8
AS31
Agricultural Mechanics I 114 87.83
96.23 52 78.79 33 82.76 29
6833
Agricultural Mechanics II Small Eng.

AS32
Agricultural Mechanics II 53 90.57
94.74 19 86.67 15 89.47 19
AS33
Agricultural Mechanics II
AS33
Agricultural Mechanics II- Sm Eng 23 95.65
95.65 23
AP41 Horticulture I 144 69.44 75 16
62.16 37 65 20 69.23 26
72.41 29
81.25 16
AP42 Horticulture II 39 69.23 75 4 50 18 90 10
85.71 7
AN51
Environmental and Natural Resources I 34 82.35
82.35 34
AP44
Horticulture II Landscape 25 84 100 5 80 20
FC10 Teen Living 390 79.74
81.67 60
77.78 144 78.43 102
83.33 84
FA31
Apparel Development I 161 81.48
77.42 31 87.5 32 85.71 13
92.31 26 77.78 27
71.88 32
FA32
Apparel II- Enterprise 39 97.44 100 19 100 10 80 5 100 5
FN41 Foods I 587 92.5
93.75 80
89.36 94 95.54 112
90.83 109 91.3 69
96.12 103 80 20
FN42
Foods II Enterprise 226 83.63
86.84 38 90 20 79.52 83 90.91 33
85.29 34
72.22 18
FN43
Foods II Food Technology 32 71.88 60 15
82.35 17
FI51 Interior Design I 136 84.56 68.4
2 19 50 1295.6
5 46 83.87 3192.8
6 28
FI52 Interior Design II- Enterprise 20 85
71.43 7 92.31 13
FE60
Parenting and Child Development 188 93.62 100 65
86.67 30 89.36 47
93.48 46
FE11
Early Childhood Education I 58 89.66 95 20 82.61 23
93.33 15
FE12
Early Childhood Education II 35 100 100 16 100 11 100 8
HB10
Biomedical Technology 450 82.89
87.95 83
72.82 103 84.81 79
90.74 54 75.76 66
90.77 65
HU40 Health Sciences I 344 79.65
91.03 78
58.82 51 73.21 56
88.89 72 75.76 33
79.63 54
HU42 Health Sciences II 211 92.89
97.37 38
94.12 34 84.62 26
89.09 55 94.12 17
97.56 41
7622Furniture and Cabinet Making II
HN43 Nursing
HN43
Nursing Fundamentals 97 96.91 100 24 100 10 85.71 14 100 20 100 11
94.44 18
IC00 Core and Sustainabe 258 78.68
97.62 42
67.61 71 63.64 66
94.59 37 88.1 42
IC21 Carperntry I 61 87.5 100 9 46.67 15 100 24 100 16
IC22 Carpentry II 42 97.62 91.6
7 12 100 25 100 5
IC 23 Carpentry III 8 12.5 12.5 8
IA11
Introductions to Graphic Communication 59 96.61
96.61 59
IA12 Digital File Preparation 34 76.47
76.47 34
Drafting I
IA13 Print Ad & Design 7 100 100 7
IC62 Drafting II-Architectural 133 84.21
73.91 23 83.33 42
88.89 36 100 15
76.47 17
IC63 Drafting III-Architectural 35 60 50 8 56.25 16
71.43 7 75 4
IV22 Drafting II-Engineering 35 74.29
86.96 23 50 12
IV23 Drafting III-Engineering 4 75 75 4
8011Principles of Technology
7972Drafting II- Engineering
7973Drafting III- Engineering
IM41
Metals Manufacturing Technology 15 66.67
66.67 15
IT12 Advanced Brakes 57 75.44 75 12 75 28 76.4
7 17
IT13 Automotive Comp Dig 22 54.55
14.29 7
73.33 15
TS21
Scientific Visualization I 61 95.08
95.08 61

TS22
Scientific Visualization II 20 90 90 20
8007Scientific Visualization II
TE21
Principles of Technology 64 70.31
66.07 56 100 8
II21
Computer Engineering I - 3rd party 69 100 100 69
II22
Computer Engineering II - 3rd party 28 100 100 28
8115Manufacturing
8221Game Art Design
ME11
Entrepreneurship I 140 82.14
90.91 44 87.5 24 68.75 48
85.71 14 90 10
Total Students Tested in CTE Field Tests 6950 81.63
84.37 1297
79.43 1434 75.77 1411
86.97 958 85.92 781
87.15 1016
79.80 61
BM10
MISTA - Powerpoint,Publisher and word 557 26.7
37.29 118 5.45 110 34.09 44
34.91 106 23.3 103
29.87 76
BM20
MISTA - Excel and Access 215 27.91
19.57 46
14.29 42 33.33 18
38.64 44 14.29 35
56.67 30
7046Foods II- Enterprise
7240Health Science I XE
HB10
Biomedical Technology
IC61 Drafting I 402 22.14 14.5
2 6218.7
5 80 3.64 5532.3
1 65 22.58 6235.0
9 78
IM61 Welding Technology I 50 14 14 50
IM62 Welding Technology II 22 13.64
13.64 22
MH32 Sports & Ent II 60 11.67
23.53 17 6.25 16 7.14 14 0 5 12.5 8
ME12
Entrepreneurship II 13 30.77
30.77 13
Total Students Tested 1319
20.97571429
23.79 226
12.83 232 23.69 117
26.70 287
20.05666667 200
40.54 184
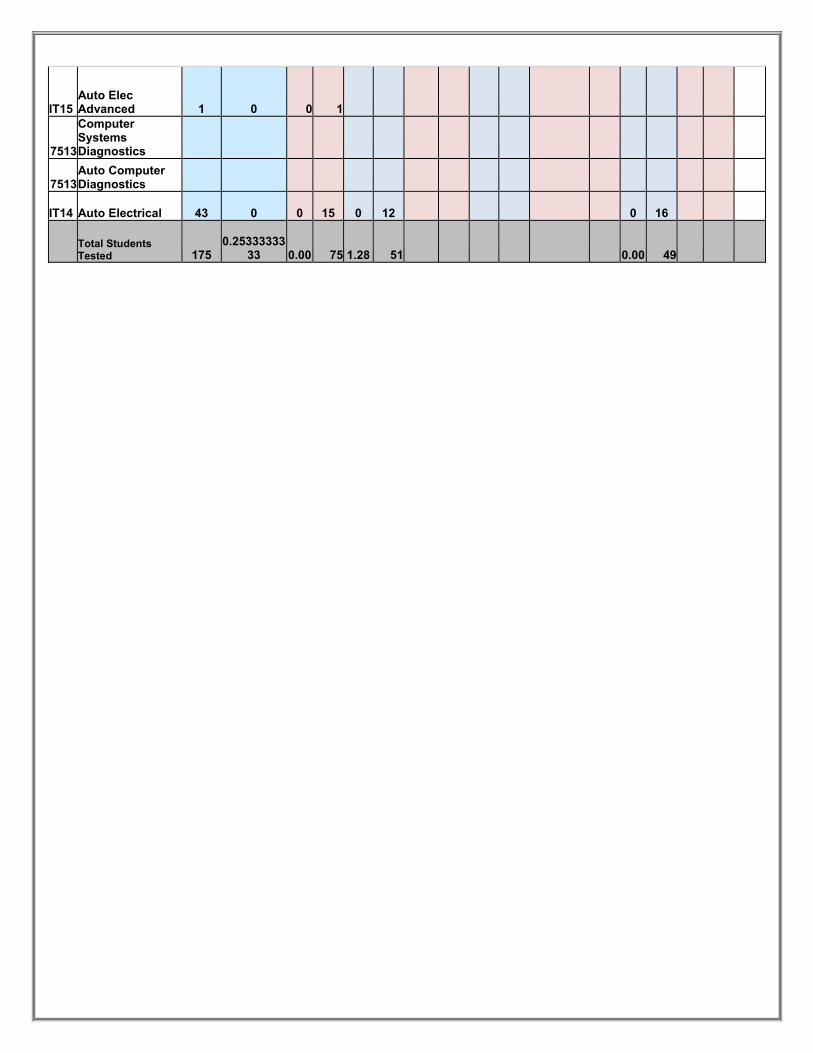
Automotive Courses- Today's Class- Non Scaled Scores
IT11 Automotive Service 131 0.76 0 59 2.56 39 0 33
IT15 Auto Elec Advanced 1 0 0 1
7513
Computer Systems Diagnostics
7513Auto Computer Diagnostics
IT14 Auto Electrical 43 0 0 15 0 12 0 16
Total Students Tested 175
0.2533333333 0.00 75 1.28 51 0.00 49
Buncombe County Schools 2014 – 2016 School Improvement Plan
School: A.C. Reynolds High School
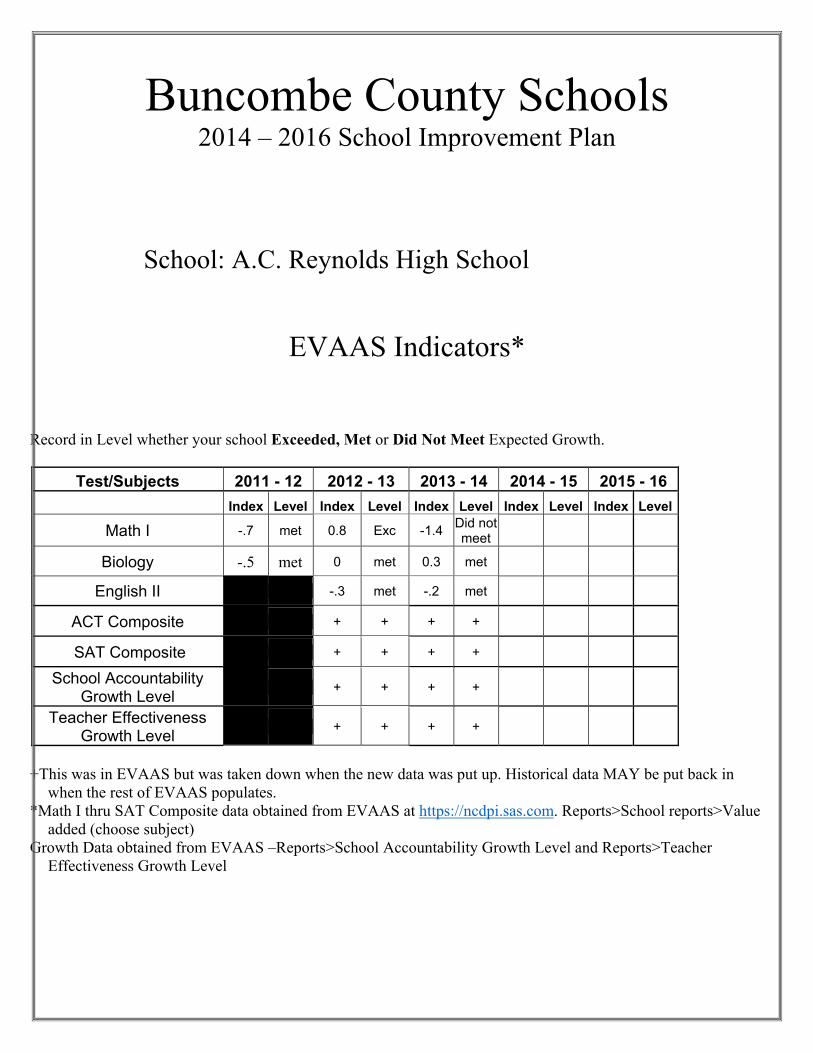
EVAAS Indicators*
Record in Level whether your school Exceeded, Met or Did Not Meet Expected Growth.
Test/Subjects 2011 - 12 2012 - 13 2013 - 14 2014 - 15 2015 - 16
Index Level Index Level Index Level Index Level Index Level
Math I -.7 met 0.8 Exc -1.4 Did not meet
Biology -.5 met 0 met 0.3 met
English II -.3 met -.2 met
ACT Composite + + + +
SAT Composite + + + +
School Accountability Growth Level
+ + + +
Teacher Effectiveness Growth Level
+ + + +
+This was in EVAAS but was taken down when the new data was put up. Historical data MAY be put back in
when the rest of EVAAS populates. *Math I thru SAT Composite data obtained from EVAAS at https://ncdpi.sas.com. Reports>School reports>Value
added (choose subject) Growth Data obtained from EVAAS –Reports>School Accountability Growth Level and Reports>Teacher
Effectiveness Growth Level

Buncombe County Schools 2014 – 2016 School Improvement Plan
This will be submitted when data is available.
School: A.C. Reynolds High School
Summary of Students Passing Courses Required for Graduation
Membership
Number Passed
Percent Passed
English I English II English III English IV Math I Math II Math III Earth and Environmental Biology Physical Science Chemistry World History American History I American History II Civics and Economics Health/PE (required)

Buncombe County Schools 2014 – 2016 School Improvement Plan
School: AC Reynolds High School
Parent/Community Involvement Number of Volunteer Hours / Number of Students Mentored Volunteers
Year Total Volunteer Hours
2011 - 2012 2400 hours
2012 - 2013 2502 hours
2013 - 2014 3703 hours
2014 - 2015
2015 - 2016
Mentors
Year Total # of
Staff Staff as Mentors
Students Served Year
Volunteer Mentors
Students Served
2011 – 2012 110 86 1313 2011 – 2012 25 250
2012 – 2013 137 92 1325 2012 – 2013 258 258
2013 – 2014 136 92 1340 2013 - 2014 308 308
2014 - 2015 136 1417 2014 – 2015
2015 - 2016 2015 - 2016

Buncombe County Schools 2012 – 2014 School Improvement Plan
School: A.C. Reynolds High School
Safe School Data
End of Year Total Number of Legally Reportable Acts
2011 - 2012 2012 - 2013 2013 - 2014 2014 - 2015 2015 - 2016 37 23 35
End of Year Total Number Days of BCATS (HS Only)
2013 - 2014 2014 – 2015 2015 – 2016
308
End of Year Total Number Days of Suspension
2013 - 2014 2014 - 2015 2015 - 2016
Short Term 680
Long Term (>10) 0
Source: Data Manager can access reports in PowerSchool

Buncombe County Schools 2014 – 2016 School Improvement Plan
School: A.C. Reynolds High School
Dropout Data
School Year # of Students % Based on ADM
2011 - 2012 33 2.5%
2012 - 2013 31 2.3%
2013 – 2014 28 2.1%
2014 – 2015
2015 - 2016

Buncombe County Schools A.C. Reynolds High School
2014 – 2016 School Improvement Plan
Plan for Duty-Free Lunch (to the extent possible) All teachers have a duty free lunch. Plan for Daily Duty-Free Planning (to the extent possible) All teachers have a duty free planning period.

Buncombe County Schools 2014 – 2016 School Improvement Plan
School: A.C. Reynolds High School
SAT Test Data Analysis: ACR consistently scores higher than the county, state, and national averages on the SAT. The 2013‐2014 critical reading, math, sub‐total, and total scores were higher than the county, state, and national averages. The writing mean was three points lower than Buncombe County but exceeded the state and national averages. The average 2014 score was lower than the school's average for the past five years, but surpassed the average scores of other schools in the county except TC Roberson HS and the much smaller Buncombe County Early College. During the year, 60 percent of graduates took the SAT, a participation rate higher than the previous year but still a four percent decline from 2012. This participation rate exceeded the county and national averages by five and eight percent respectively, but four percent lower than the state average. Implications ACR should work to maintain the consistency and success it has demonstrated in the past decade, however, keeping in mind the ever changing demands of the community. In the past six years, there has been a significant change in the economy and as a result, an increase amount of students have sought out and secured free and reduced lunch. Such a finding would imply that students who might have taken the SAT/ACT multiple times might be re-thinking this decision. In addition, previous access to test preparation courses might also have ceased. Encouraging the online SAT course available to student here during the day could be one way to address the small decrease in mean scores we have experienced. In response to the participation rate, making students more aware of the fee waivers available to students accessing free and reduced lunch could provide students with financial need a more feasible way to take the national test and improve scores.


Buncombe County Schools 2014 – 2016 School Improvement Plan
School: A. C. Reynolds High School
AP Enrollment Data Analysis ACR students are generally successful on Advanced Placement Exams. In the 2013-2014 school year, sixty-eight percent of students who took an AP exam scored 3 or higher, which was the highest in Buncombe County for the year and above the county (58.4), state (57.7), and national (59.1) percentage levels. The number of students who have taken AP classes has increased by seventy-three percent (73%) since the 2012 school year. While A.C. Reynolds has the second highest student enrollments in the county, participation rates in AP courses comprise a smaller percentile of the overall student body than at comparable high schools in the system. Implications A.C. Reynolds has worked consistently to foster an environment that will allow and encourage the faculty and students to continue the tradition of Advanced Placement success. Additionally, the school has worked to increase the number of AP offerings available. One goal might be to continue to increase the number of students who complete an Advanced Placement course. The school has fostered an increase of seventy-three percent in the number of students who complete an AP course over the past two years. According to statistical trends, it may be expected to experience a drop in the number of students who score a 3 or higher on the exams overall. To counter this trend, the school might work to support instruction for AP teachers to continue student success in making a 3 or higher. Another goal might be to increase the ethnic diversity of AP enrollment, which depends on shifting prevalent attitudes and working on a district-wide level to make AP enrollment more feasible and appealing to a broader range of students. Furthermore, increasing the number of students in AP classes generally results in larger enrollments, which might lower overall performance and morale for the students and faculty. This morale decline was evidenced in the N.C. Teacher Working Conditions Survey where 37% of teachers indicated that class sizes are already too large. Collaborating with Honors and Middle-school teachers to increase the number of students who transition to AP courses would support this goal and work to shift attitudes.


Buncombe County Schools 2014 – 2016 School Improvement Plan
Building Level Waiver Request
School: A.C. Reynolds High School
1. Please insert the waiver you are requesting.
2. Please identify the law, regulation, or policy from which you are seeking an exemption.
3. Please state how the waiver will be used.
4. Please state how the waiver will promote achievement of performance goals.

Buncombe County Schools 2014 – 2016 School Improvement Plan
Building Level Waiver Request
School: A.C. Reynolds High School
1. Please insert the waiver you are requesting.
Request the flexibility to move funding between state categories to the maximum extent allowed by the General Assembly and the Department of Public Instruction.
2. Please identify the law, regulation, or policy from which you are seeking an exemption. The principal, in consultation with the School Improvement Team reserves the right to request ABC transfers of funds between categories in any manner that furthers the accomplishment of the school’s mission.
3. Please state how the waiver will be used.
The transfers of funds between categories will assist in accomplishing the school’s mission to better meet the educational objectives for students.
4. Please state how the waiver will promote achievement of performance goals.
Flexibility of funding will help provide resources for quality instruction as determined by the local school administration and the School Improvement Team.

Buncombe County Schools 2014 – 2016 School Improvement Plan
Building Level Waiver Request
School: A.C. Reynolds High School
1. Please insert the waiver you are requesting. Request a class size waiver for individual academic classes.
2. Please identify the law, regulation, or policy from which you are seeking an exemption. Public School Law: 115C-301 - Allocation of teachers, class size.
3. Please state how the waiver will be used. Within the school, administrators need the flexibility of assigning smaller numbers of students to one class which may result in larger classes scheduled during the same time period.
4. Please state how the waiver will promote achievement of performance goals.
To accommodate student needs, staffing and specialized courses schools need flexible scheduling. This waiver will give us the flexibility to assist low achieving students through smaller classes, therefore providing the individualized instruction and support necessary for them to achieve success.

Buncombe County Schools 2014 – 2016 School Improvement Plan
Mid-Year Reflection for School Year: 2014 -2015
School Name: A.C. Reynolds High School Date: 1/10/15 The goals for the 2014 – 2016 School Improvement Plan were approved by the faculty when the plan was voted on and discussed in detail at the October 2014 faculty meeting. Since the meeting all internal stakeholders have been working diligently to ensure adequate progress is being made through the implementation of the strategies that were designed to support achieving our goals. SIP Goal/Objective #1: Using the school-wide emphasis on the Common Instructional Framework of student learning, we will increase the number of subgroups that meet or exceed the Annual Measurable Objectives (AMO) state target levels in the three EOC targeted areas as compared to 2015 and 2016 target levels. Progress to Date:
The Common Instructional Framework was a focus of our staff development this year and to support educating the staff properly to implement the framework Eric Grant and Laura Meyer presented strategies to achieve all components outlined in the instructional framework. The Buncombe County Instructional Framework will allow A.C. Reynolds to strengthen the Professional Learning Community process through added focus and new strategies. We have been utilizing the Professional Learning Community model for several years but introducing the engagement strategies outlined in the framework and making them part of every class will help us reach the goal of meeting or exceeding the Annual Measurable Objectives outlined by the State.
The Professional Leadership Community Committee has been asked by the School Improvement Team to create a targeted intervention plan that will help us support the Professional Learning Communities by reaching those struggling learner who have a very difficult time reaching the expected level of proficiency. The creation of this targeted period of the day will allow more help for struggling learners and support for students who are unable to seek assistance before or after school hours. By adding this intervention to the day we feel that this will be a helpful addition to the multiple strategies that are currently used to increase student academic performance and meet our goal.

SIP Goal/Objective #2: Using the “Rocket Launch, PBIS (Positive Behavior Intervention Support), and Common Instructional Framework, we will increase the number of students graduating within their cohorts to 89.5% by 2015 and 90% by 2016 as measured by state graduation rates. Progress to Date:
The Rocket Launch program was introduced at the start of the school year and a significant number of the faculty are involved in the program that helps to ease the transition to high school and make a positive contact at A.C. Reynolds High School. The Parent Teacher Support Organization has been supporting the program by providing resources to the program through coordination with external stakeholders who want to help the Reynolds community. The introduction of Positive Behavior Intervention Support has been well received by faculty and students and the incentives that have been introduced by the Positive Behavior Intervention Support Committee are now part of our culture. Changing the culture of our student body and expecting students to behave in a positive manner will increase our graduation rate by increasing student involvement in the education process. The Buncombe County Schools Instructional Framework was involved heavily in goal number one and is equally involved in increasing the graduation cohort rate as it addresses proper instructional strategies that produce results. Developing faculty knowledge of the framework and how to properly implement it will be an ongoing focus of staff and individual Professional Learning Communities development activities. The focus on the three strategies outlined here and the existing strategies that are in place should work well together to increase student performance and increase the academic culture on our campus. SIP Goal/Objective #3: Provide a safe, healthy, civil school environment that reduces ‘Tier 3’ referrals from 8.4% in 2013-2014 (192 tier 3 referrals out of 1,618 total) to 8.2% of total referrals in 2014-2015 and 8% of total referrals in 2015-2016. Progress to Date: Introduction of the Positive Behavior Intervention Support will be a critical component of achieving this goal. Changing the culture of A.C. Reynolds High School through successful creation and implementation of Positive Behavior Intervention Support incentives and policies will provide our student body with positive strategies that should result in improved behavior and a safer school environment. We also believe that successful implementation of the Buncombe County Instructional Framework will make classes more meaningful for students and that engagement will result is a student body that wants to be successful and will abide by student behavior policies, thus reducing referrals. Signatures below indicate the School Improvement Team has participated in the development of the School Improvement Plan Mid-Year Reflection as submitted. ____ ______ _ _______ Principal SIT Chairperson
Signature: Signature: Assistant Principal Instructional Support

Signature: Signature: Teacher Teacher Assistant
Signature: Signature: Teacher Parent
Signature: Signature: Teacher Parent
Signature: Signature: Teacher Position: