Embed Size (px)
Citation preview

1
School Education in IndiaHigh Demand - Poor Outcomes
Reforms based on Critical Levers of Change
Redefining Success
Consolidation of Schools
Funds should follow students
Adjustment to demographic dividends
Community Ownership, Participation and Accountability
2019

A First Principles Approach Towards Change
2

3
Two Central Elements in Indian School Education
Therefore, the need to focus on Critical Levers of Change

Despite Enormous Expenditure by the Government…
Rs.2,08,777 crore has been spent on Sarva Shiksha Abhiyan (SSA) since 2010
4
Source: Budget Briefs Vol 10 Issue 1 - Accountability Initiative, Centre for Policy Research, 2018
Damning Evidence
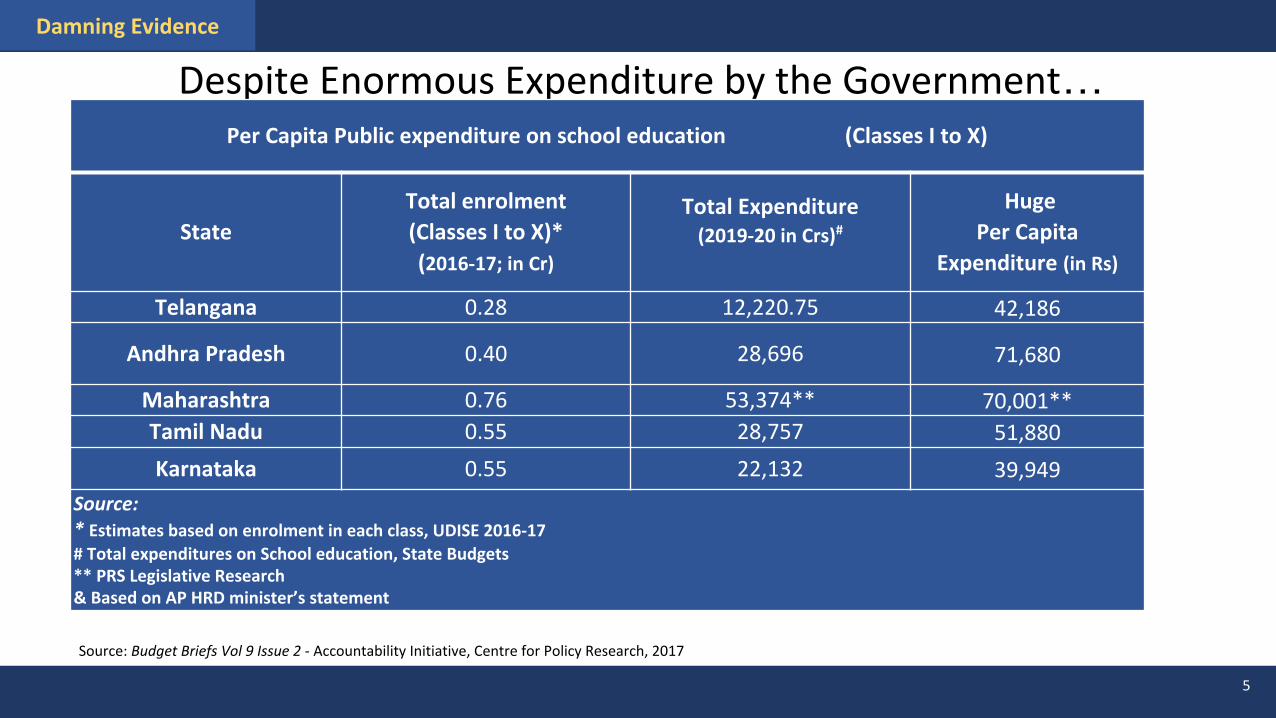
Despite Enormous Expenditure by the Government…Per Capita Public expenditure on school education (Classes I to X)
StateTotal enrolment (Classes I to X)*(2016-17; in Cr)
Total Expenditure(2019-20 in Crs)#
Huge Per Capita
Expenditure (in Rs)
Telangana 0.28 12,220.75 42,186
Andhra Pradesh 0.40 28,696 71,680
Maharashtra 0.76 53,374** 70,001**Tamil Nadu 0.55 28,757 51,880
Karnataka 0.55 22,132 39,949
Source:* Estimates based on enrolment in each class, UDISE 2016-17# Total expenditures on School education, State Budgets ** PRS Legislative Research& Based on AP HRD minister’s statement
5
Source: Budget Briefs Vol 9 Issue 2 - Accountability Initiative, Centre for Policy Research, 2017
Damning Evidence

6
…steep Decline in Govt. School Enrolment (Elementary Education)
Source: Flash Statistics 2016-17, UDISE
Damning Evidence

7
A Pronounced Shift towards Private Schools
Source: Analytical Tables – 2016-17,UDISE
• In elementary education (Classes I to VIII), there is a clear decrease in govt. school enrolment and increase in pvt. school enrolment.
• Enrolment in govt. schools which stood at 133.64 million in 2007-08 decreased to 111.31 million by 2016-17, a decline of 16.7%.
• During the same period, pvt. school enrolment increased from 51.09 million to 73 million a rise of 42%.
• The share of govt. schools in enrolment fell from 72% to 58%, whereas the share in pvt. sector rose from 28% to 38%.
Damning Evidence

8
Enrolment Trends across States (Elementary Education)
* 2015-16 data includes Andhra Pradesh + Telangana
Damning Evidence

9
Enrolment Trends across States (Elementary Education)
* 2015-16 data includes Andhra Pradesh + Telangana
Damning Evidence

10
ASER-2018 - Arithmetic
% of students who can
Subtract Divide
Std. III 28.2 8.5
Std. V 52.3 27.8
Std. VIII 66 43.9
ASER-2018 - Reading
% of students who can
Read
Std. III 27.2
Std. V 50.3
Std. VIII 72.8
Miserable Learning Outcomes
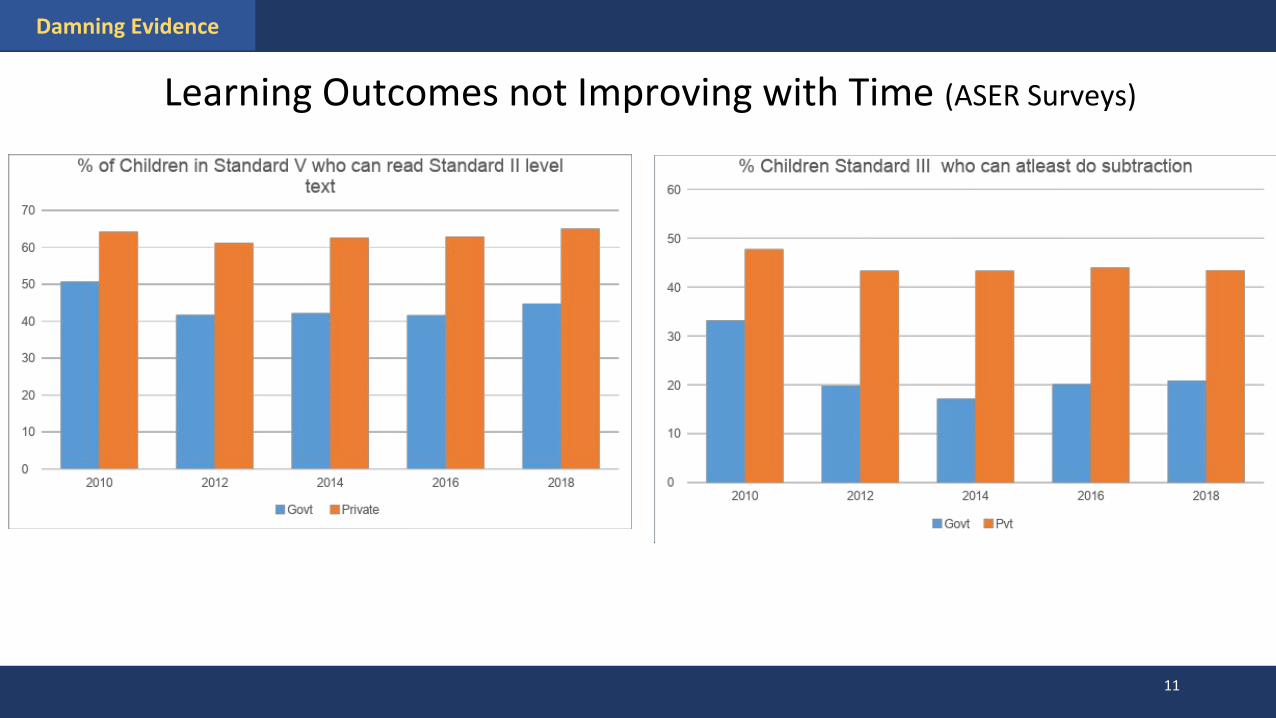
While learning levels in government schools plummeted, they are barely better in private schools
Half of all children in Std. V cannot perform simple
two-by-two digit subtraction.
More than half in Class VIII cannot perform three-by-one
digit division.
More than half of class V students cannot read Std. II text.
Close to 27% Std. VIII students cannot read the
same text.
Damning Evidence
11
Learning Outcomes not Improving with Time (ASER Surveys)
Damning Evidence

12
Learning Outcomes not Improving with Time (ASER Surveys)
Damning Evidence

13
Miserable Learning Outcomes
While learning levels in government schools plummeted, they are barely better in private schools Source : ASER 2018
Damning Evidence

14
Miserable Learning Outcomes
While learning levels in government schools plummeted, they are barely better in private schools Source : ASER 2018
Damning Evidence

• In the PISA (Programme for International Student Assessment) survey in 2009, at the age of 15 when children are tested for language, math, science and logic,
• India stood 73rd out of 74 nations Shanghai- China, Singapore and Hongkong- China stood first, second and third in that order.
• Only Kyrgyzstan was ranked lower than India!
15
Languishing at the Bottom!
Mean performance on the overall reading scale
Damning Evidence

16
Demographic Transition
• According to the MHRD research report, ‘Equity in Access and Learning’ points out that the number of 6-year olds in India is expected to decline from 25 million in 2011 to 17 million in 2025, a decline of 30%.
• The population of children aged 14 and 15, which stands at 50 million currently, is expected to decline to under 39 million by 2025. • The population growth rate which stood at 1.5% in the decade ending in 2011 is going to progressively decline and reach 0.2% in the decade
of 2041-51. • The population of children in 0-14 yrs age group, which stood at 364 million in 2001 will decline to 327 million by 2026, and will decline much
more rapidly after 2026.
Source: (Department of Atomic energy, Government of India)- http://dae.nic.in/?q=node/125
Source: as cited by M R Narayana in paper ' DEMOGRAPHIC TRANSITION, PUBLIC EXPENDITURE ON EDUCATION AND ECONOMIC GROWTH: NEW MACROECONOMIC
EVIDENCE FROM INDIA' by using the population projections in United Nations (2013b).
Damning Evidence
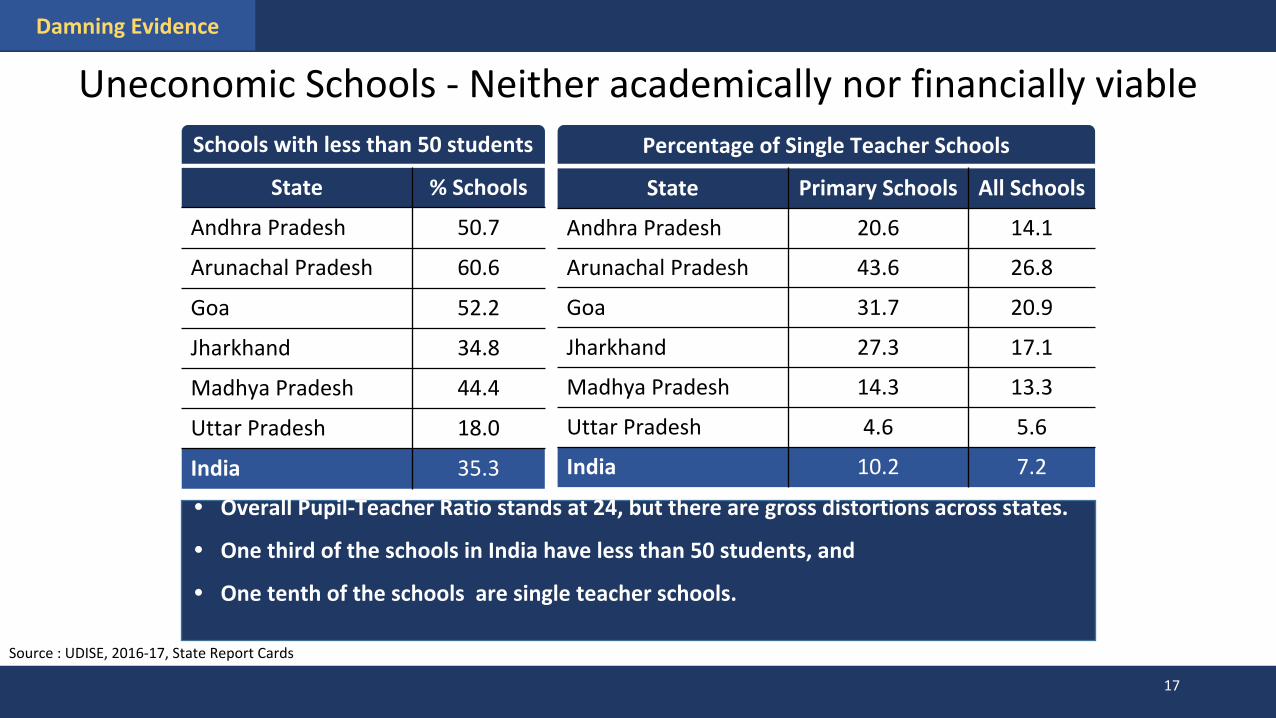
Percentage of Single Teacher SchoolsSchools with less than 50 students
• Overall Pupil-Teacher Ratio stands at 24, but there are gross distortions across states.
• One third of the schools in India have less than 50 students, and
• One tenth of the schools are single teacher schools.
17
Uneconomic Schools - Neither academically nor financially viable
State Primary Schools All Schools
Andhra Pradesh 20.6 14.1
Arunachal Pradesh 43.6 26.8
Goa 31.7 20.9
Jharkhand 27.3 17.1
Madhya Pradesh 14.3 13.3
Uttar Pradesh 4.6 5.6
India 10.2 7.2
State % Schools
Andhra Pradesh 50.7
Arunachal Pradesh 60.6
Goa 52.2
Jharkhand 34.8
Madhya Pradesh 44.4
Uttar Pradesh 18.0
India 35.3
Damning Evidence
Source : UDISE, 2016-17, State Report Cards

18
Skyrocketing Out-of-Pocket Expenses not a Demand Dampener for Private Schools
• An average Indian household spent around Rs 6,400 annually on education, which is almost double the amount spent a decade ago.
• One of the major contributing factors of the increasing expenditure on education seems to be the growing preference for private educational institutions over government, at least at the school level.
• Even in rural areas many families choose to send their children to pricey private schools, in spite of the presence of adequate number of government schools.
http://www.financialexpress.com/opinion/growth-in-household-spending-fuels-education-market/183735/
Damning Evidence

19
Enormous expenditure spent by the government
Budget Private Schools Unaffordable Private Schools
Features :
•Norm-based rather than result-oriented
•Students have little or no choice in terms of the school they wish to attend
•Schools don't have much incentive to improve.
Government Schools
OR
FLAWED MODEL
Norm-based system has led to the shutting down of budget private schools

20
Interventions at Multiple levels
Solutions

21
The Way Out: Matching Supply with Huge Demand
Need for a clearheaded, evidence-based approach focusing on:
Solutions

Redefining Success :
Redefining Success and Real Learning Outcomes
22
STAKEHOLDERS
Altering Incentives for the Stakeholders
Solutions

23
1. Measures to Improve Learning Outcomes
23
Solutions
Redefining Success and Real Learning Outcomes

24
National and Global Testing & Accreditation
24
Solutions
2. Measures to Improve Learning Outcomes
Redefining Success and Real Learning Outcomes

Consolidation of Schools
• U-DISE reports that 1/3rd of the schools in India have less than 50 students and 1/10th of the schools are single teacher schools where there is neither monitoring nor attention and are deemed to be uneconomic
• Schools with over 150-200 students, at least 5 Class rooms and teachers and an institutional environment and minimum infrastructure tend to perform better because of economies of scale, institutional environment and better attention and monitoring
• Teachers and facilities can be rationalized to meet requirements of the consolidated schools. It is preferable that a primary school should have at least 100 students, and high school should have at least 300 students
• However, while implementing this policy, it is desirable to give a transport subsidy of, say Rs. 150 per month, if the school is, say more than 3 Kms from home
25
Solutions
Source : National Sample Survey Organisation (as cited by Indiaspend)

26
Funds should follow students
1. Independent Accreditation and Testing Boards proposed at all levels.
2. Funds will follow the students; parental choice of schools & reimbursement of fees for the poor.
3. No additional burden on the state: govt. school enrolment is falling & retiring teachers vacancies can be left unfilled.
Funding should gradually shift from teacher salaries to tuition fees of students
States
Total teachers in Government Schools
(2016-17; Classes I to VIII)
Student- Teacher
Ratio
Retiring Teachers per
annum*
Assuming Average teacher salary per
annum(in Lakhs of Rs.)
Savings, by not filling vacancies(in Crores of Rs.)
Private Expenditure per
student (In Rs. )
No. of students who could be funded
additionally, each year
(a) (b, =3% of a) (c) (d, =b*c) (e) (f, =d/e)
Andhra Pradesh 1,90,065 19 5701.95 7.50 410 15,000 2,85,098
Telangana 1,29,156 21 3874.68 7.50 287 15,000 1,93,734
Karnataka 1,75,219 27 5256.57 7.50 395 15,000 2,62,829
Tamil Nadu 2,71,455 16 8143.65 7.50 608 15,000 4,07,183 Gujarat 2,05,843 27 6175.29 7.50 467 15,000 3,08,765
*Assuming the retirement percentage per annum at a reasonable 3% Source: UDISE Flash Statistics 2016-17 This table does not include teachers of Secondary & Hr. Secondary classes in Composite schools
Solutions

Funds should follow the student
• Government should identify moderate and low-cost private schools of reasonable quality based on advice of Accreditation and Testing Board. Schools which charge tuition fees below a certain prescribed ceiling should be brought under public education programme.
• Funding for education should shift gradually from teachers’ salaries to students fees. Funds will follow the students. If children go to accredited private schools under public education programme, the fee will be paid by the government.
• As only children from poor and lower income families are likely to be admitted in low-cost private schools, government funds will go only to the deserving children from indigent families.
27
Solutions

Adjustment to demographic needs
• As the number of children to be enrolled begins to decline as shown in the slide on Demographic Transition, it will be prudent if government focuses on outcomes and encourages service delivery by private sector at an affordable cost. Culturally and managerially, private sector will show greater innovation and flexibility in dealing with changing personnel requirements.
• There is need to amend RTE Act and design public policy incorporating private schools as key education providers along with government schools
28
Solutions

Community Ownership, Participation and Accountability
School Management Committees : Reputed retired teachers who earned the trust of the community and reputed local NGOs in the field of education will add value to the management of the schools. Therefore a provision should be made to co-opt these groups in the School Management Committees
Autonomous Education Boards at Block, District and City level : The Boards will have State and local officials, accreditation, testing, monitoring and inspection authorities, representatives of SMCs and local governments, experts in the field of school education, reputed non-profit organizations and representatives of private schools.
A state level autonomous Board : with State government officials, representatives NCERT, SCERT and District Boards, reputed NGOs, eminent educationists, state level testing board and representatives of higher education. The State Board should have full autonomy, authority and resources to address all challenges of school education including syllabus, text books, examinations, teacher training, accreditation and other relevant matters.
29

30
Real Choice & Competition Model

31
Suggested Amendments to RTEAmendments Proposed Section Amendments Proposed Section
Inclusion of “unrecognized schools” in the definition of school
Section 2Focusing on learning outcomes instead of input-centric norms and capital requirement standards.
Section 19,20
Removal of the concept of neighbourhood. Funding of child instead of school.
Section 3, 10Formation of independent assessment bodies to conduct regular assessment in a stress free manner.
Section 21
Allowing children of any age to start school or resume school.
Section 4Integration of School Development Plans (SDPs) with State’s planning and budgeting process.
Section 22
Allowing children to transfer to private schools of their choice.
Section 5Teachers salary to be free from overregulation.
Section 23
Allowing non-profit organizations schools and facilitating privately funded non-profit schools.
Section 6Teachers learning outcomes to focus on a class appropriate curriculum.
Section 24
Measuring and improving the learning outcomes instead of treating “compulsory education” as an obligation.
Section 8, 9No need for unscientifically imposed teacher-student ratio.
Section 25
Making a standardized assessment institutional, by an Independent Authority.
Section 18

32
Foundation for Democratic Reforms# 6-3-1187, Flat No. 801 & 806,8th Floor, Srinivasa Towers,Beside ITC Kakatiya Hotel,Begumpet, Hyderabad – 500016, TelanganaPhone: 91-40-2341 9949;Fax: 91-40-2341 9948Emails: [email protected]@fdrindia.org ; [email protected]@fdrindia.org ; [email protected];www.fdrindia.org