Embed Size (px)
Citation preview

This dissertation has been
microfilmed exactly as received68-16,959
• _ •• _. , •• - .0. _
I'
RAO, K. Krislma, 1928-ISOLATION AND CHARACTERIZATION OF TAROFERREDOXIN.
University of Hawaii, Ph.D., 1968Biochemistry
Please Note: School lists author's name asKrishna K. Rao.
-- .University Microfilms, Inc., Ann Arbor, Michigan
ISOLATION AND CHARACTERIZATION OF
TARO FERREDOXIN
A DISSERTATION SUBMITTED TO THE GRADUATE DIVISION OF THE
UNIVERSITY OF HAWAII IN PARTIAL FULFILLMENT
OF THE REQUIREMENTS FOR THE DEGREE OF
DOCTOR OF PHILOSOPHY
IN BIOCHEMISTRY
JUNE 1968
By
K. Krishna Rao
Dissertation Committee:
Dr. Howard F. Mower, ChairmanDr. Theodore WinnickDr. John A. HuntDr. John B. HallDr. Robert H. McKay

DEDICATION
To Retnam and Ranji

ACKNOWLEDGMENTS
To the East-West Center, University of Hawaii, for
a,generous, grant.
To Mr. E. H. Higa for assistance in the preparation
of ferredoxin.
To Dr. J. Tsunoda for many valuable s~ggestions and
helpful discussion.
To my colleagues, W. W. Philleo, R. N. Asato, A. D.
Kidman, L. S. R. K. Rao, and A. M. Benson for
their help in many phases Of this work.
v
TABLE OF .CONTENTS
LIST. OF..T.ABLES ' . . . . . . . . . . . . . . . . . . . . . . . . . . . . .. viii
LIST OF FIGURES ·.............................. ix
ABBREVIATIONS. . . . . . . . . . . . . . . . . . . . . . . . . . . . . . . . . . . . . . . . . xi
ABSTRACT. . . . . . . . . . . . . . . . . . . . . . . . . . . . . . . . . . . . . . . . . . . . .. xii
INTRODUCTION ' . . . . . . . . . . . . . . . . . . . . . . . . . . . . . . . . . 1
MATERIALS AND METHODS
Mat eri·als . . . . . . . . . . . . . . . . . . . . . . . . . . . . . . . . . . . . . . . . 8
Methods
Preparation of adsorbent columns for
chromat~graphy• • • • • . . . • . • . • . • . . . • . . • • . • . . • • 11
Extraction of ferredoxin.................. ....111
Determination of electron transfer activity
of ferredoxin.............................. 15
Absorption spectra............................ 17
Determination of dry we~ght................... 18
Determination of totalnitr~gen............... 19
Determination of ino~ganic sulfide............ 20
Determination of iron content ·. 21
Disc electrophoresis on acrylamide. gels....... 23
Moving boundary electrophoresis....... 23
Starch. gel electrophoresis.................... 24
.Gel filtration................................ 25.
Sucrose gradient .centrif~gation............... 26
Phosphoroclastic assay........................ 27

vi
Titration wi.th eMB............................. 28
Titration with mer~alyl.· ··.· ......•..... 29
Titrat.ion with DTNB.. . . . . . . . . . . . . . . . . . . . . . . . . . . 29
Determination ,of mercury bound to
ap,oferredoxin. . . . . . . . . . . . . . . . . . . . . . . . . . . . . .. 30
Oxidized iron and sulfur, free,ferredoxin. . . . . .. 32
S-carboxymethy~ ferredoxin 32
Determination ,of amino acidcomposition. . . . . . .. 33
Determination of the aminoterminal amino acid:
By usi~g FDNB... . . . . . . . . . . . . . . . . . . . . . . . . . . . . 34
By usi~g dansylchloride 36
Determination of carboxyterminal amino acid:
Hydrazinolysis. . . . . . . . . . . . . . . . . . . . . . . . . . . . .. 37
D~gestion with carboxypeptidases 37
Determination of tryptophan content:
By action of alkali 39
By action of N-bromosuccinimide in urea 40
By action ,of 6 M. guanidine hydrochloride.... 40
Basic hydrolysis 40
Fi~ger print analysis of taro and
spinac~ ~erredoxins 41
H~gh volt?-ge paper electrophoresis 42
Two dimensional paper, chromat~graphy.. . . . . . . . .. }.j.2
·EPR studies.................................... 43

vii
RESULTS
Pur.ification of. ferredoxin.. . . . . . . . . . . . . . . . . . . . . . . 45
Electron transfer' activity. of. ferredoxin • . . . . . . . .. 45
AlJsorytion spectra 47
Ele.ctrophoresis. . . . . . . . . . . . . . . . . . . . . . . . . . . . . . . . . . . 48
Chemical composition .of.ferredoxin.... . . . . . . . . . . . . 51
Molecular we?-ght determination 55
Action of sodium dithionite on absorption spectra. 56
Action of urea on absorption spectra 58
Phosphoroclastic assay .........•.................. 59
Titration with mercurials 60
Estimation of bound mercury 62
Titration with DTNB 63
Tryptophan determination 65
Amino acid composition 67
Aminoterminal amino acid determinatioL 68
Carboxyterminal amino acid determination 70
Fi~gerprints of taro and spinachferredoxins 72
·EPR studies....................................... 73
DISCUSSION AND CONCLUSION 76
APPENDIX • • • • • • • • • • • • • • • • • • • • • • • • • • • • • • • • • • • • • • • • • • • • • • • 99
TABLES. • • • • • • • • • • • • • • • • • • • • • • • • • • • • . • • • • • • • • • • • • • • • • • •• 100
F·IGURES. • • • • • • • • • • • • • • • • • • • • • • • • • • • • • • • • • • • • • • • • • • • • • •• 114
BI·BLIOGRAPHY • • • • • • . • • • • • • • • • • • • • • • . • • • • • • • • • • . • • • • • • • •• 1.47

viii
LIST OFTABI,ES
Table
I.
II.
III.
IV.
V.
VI.
VII.
VIII.
IX.
X.
Purification of ferredoxin .
Ratio of absorbancies of plant, ferredoxins .
Molar extinction coefficients 9f plant
ferredoxins .
Absorbancies of ferredoxin in 8 M urea .
Titration of ferredoxins with mercurials ....•....
Bound mercury in apoferredoxin .
Reaction of DTNB with taro ferredoxin .
Tryptophan content of ferredoxin .
Amino acid composition of taro ferredoxin .
Amino acid composition of taro, spinach and
Page
100
101
102
103
104
105
106
107
108
alfalfa ferredoxin 110
XI. Differences in the amino acid composition
of plant ferredoxins 112
XII. Amino acids released by hydrazinolysis of
ferredoxins ...... a •••••••••••••••••••••••• '. • • 113
XIII. Amino acids liberated by carboxypeptidase A
d~gestion of ferredoxin... . . . . . . . . . . . . . . . . . . 114
ix
LIST OF FIGURES
Figure
1. Taro, ferredoxin-mediated ,photore,duction
of NA,DP ••••• 0 ••••••••••••••• oil •• II • • • • • • • • 116
2. Absorption spectra ,of pure, ferredoxins . 118
3. Absorption sp,ectra of 'cuts' obtained
duri!1g thepurificatin of, ferredoxin. . . . 118
4. Starch, gel electrophoresls ,of taroI
ferredoxin.............................. 120
5. Disc electrophoresis ,of. f3rredoxins in
polyacrylamide. gels. . . . . . . . . . . . . . . . . . . . . 122
6. Gel filtration of proteins in Sephadex
G-IOO, ••••••••••••••••••••••••••••••• &.' • • • 124
7 . Sedimentation analysis ,of proteins in
sucrose, gradient........................ 124
8. Absorption spectra of dithionite~ferredoxin
ml. xture s . . . . . . . . . . . . . . . . . . . . . . . . . . . . . . . . 126
9. Absorption spectra of dithionite-treated
ferredoxin.............................. 126
10. Absorption spectra of urea-ferredoxin
mixtures. . . . . . . . . . . . . . . . . . . . . . . . . . . . . . . . 128
11. Comparison of phosphoroclastic activity ,of
taro and Q. pasteurianum ferredoxins.... 130
12., Titration.of ferredoxin with CMB . 132
Figure
13.'
14.,
x
Page
Titration ,of,ferredoxin ?-gainst mersaly'l 132
Effect of CMB on the :absorbancy of
taro, .ferredoxin '.. 134
15. Titration of taro ferredoxin ?-gainst DTNB 134
16. Absorption spectra of ferredoxin in alkali 136
17. Thin layer. chromat~graphyofDNP-amino
acids '. . . . . . . . . . . . . . . . . . . . . . . . .. 138
18. Thin layer chromat~gram of dansyl amino
acids on silica. gel G 138
19. Paper chromat~graphy of carboxypeptidase A
d?-ges t of taro ferredoxin ..... L-••0. • • • • • • •• 140
20. Separation of peptides, formed by the action
of chymotrypsin on ferredoxins 142
21. Fi~ger prints of ferredoxin after d?-gestion
with chymotrypsin 144
22. EPR spectra Of taro ferredoxin '. . . .. 146
A
ADP
ATP
CJ.V'3
DEAE
DFP
DTNB
Dansyl
EDTA
EPR
Fd
FDNB
M
mu
Mersalyl
NAD
NADP
Pi
PPNR
- SH
Tris
xi
ABBREVIATIONS
Absorbancy
Adenosine 5'~ diphosphate
adenosine 5'- triphosphate
p- chloromercuribenzoic acid
0- (diethyl aminoethyl)
Di-isopropyl phosphofluoridate
5,5'- dithiobis(2~ nitrobenzoic acid)
1- Dimethylaminonaphthalene·-5-sulfonyl
Ethylenediaminetetraacetate
Electron param~gnetic resonance
Ferredoxin
I-fluoro-2,4-. dini tobenzene
Molar concentration
Milli micron
0- .( 3"':Hydroxymercuri-2-me.thoxypropyl) carbamyl
phenoxyacet~c acid
Nicotinamide- adenine dinucleotide
Nicotinamide- adenine dinucleotide phosphate
Ino:rganic orthophosphate
Photos~nthetic pyridine nucleotide reductase
Sulfhydryl. group
Tris (hydroxymethyl) aminomethane
ABSTRACT
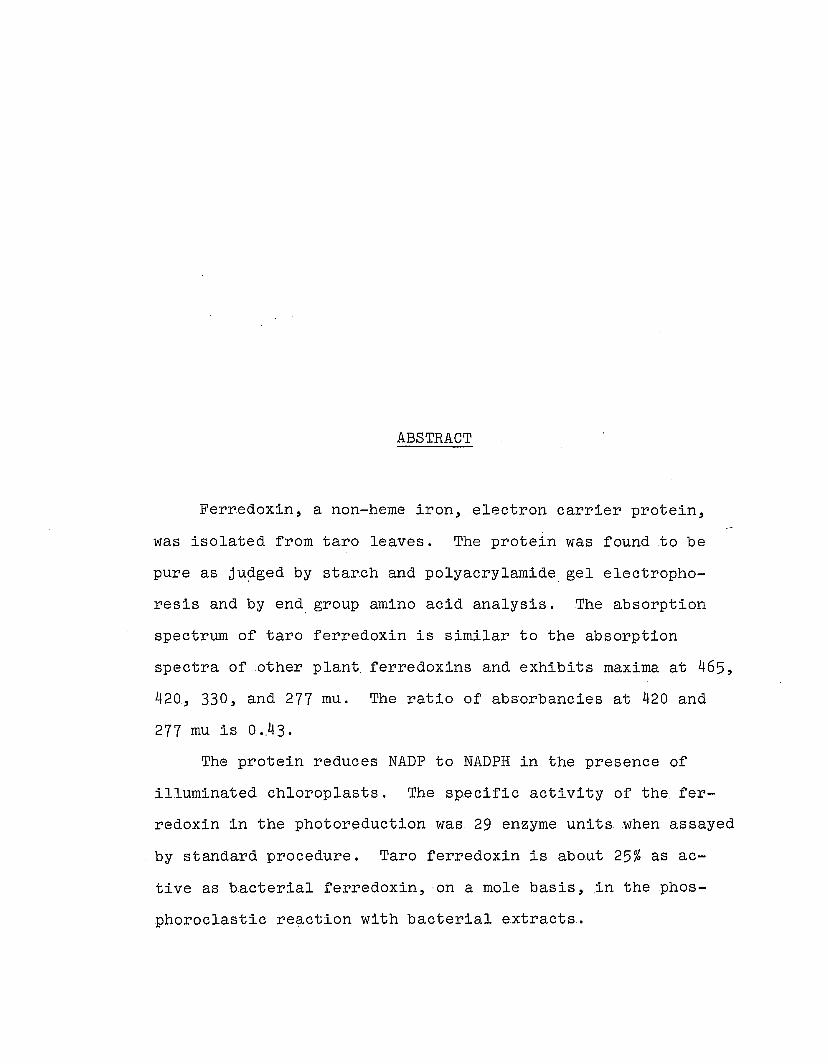
Ferredoxin, a non-heme iron, electron carrier protein,
was isolated from taro leaves. The protein was found to be
pure as ju~ged by starch and polyacrylamide. gel electropho
resis and by end. group amino acid analysis. The absorption
spectrum of taro ferredoxin is similar to the absorption
spectra of other plant ferredoxins and exhibits maxima at 465,
420, 330, and 277 mu. The ratio of absorbancies at 420 and
277 mu is 0 ..43.
The protein reduces NADP to NADPH in the presence of
illuminated chloroplasts. The specific activity of the fer
redoxin in the photoreduction was 29 enzyme units when assayed
by standard procedure. Taro ferredoxin is about 25% as ac
tive as bacterial ferredoxin,·on a mole basis, in the phos
phoroclastic re~ction with bacterial extracts.
xiii
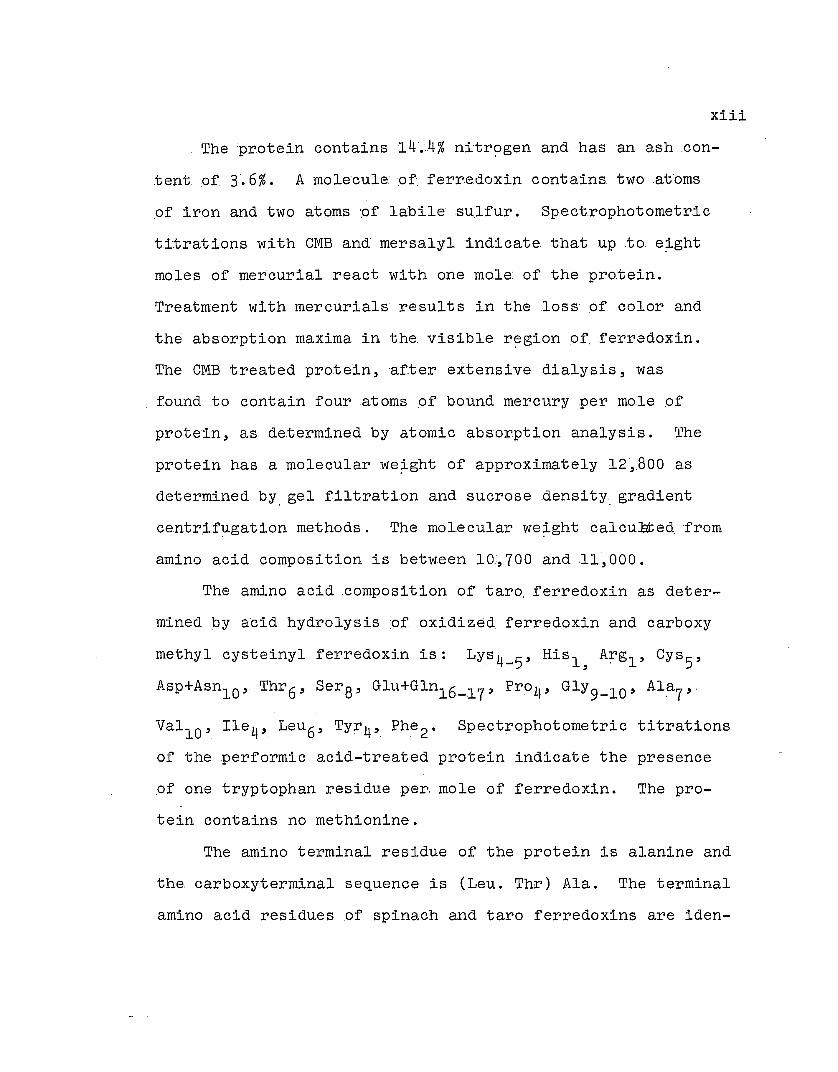
The protein contains 14·.~4% nitr~gen and has an ash .con
.tentof. 3.6%. A mole:cule. ·.of ferredoxin contains two .atoms
.of 'iron and two atoms.of labilesu,lfur. Spe.ct.rophotometric
titrations with CMB and mersalyl indicate that up to. e~ght
moles of mercurial react with one mole of the pro.tein.
Treatment with mercurials' results in the loss of color and
the absorption maxima in the visible r~gion offerradoxin.
The CMB treated protein, ·af.ter extensive dialysis, was
found to contain four atoms of bound mercury per mole .of
protein, as determined by atomic abs'orption analysis. rrhe
protein has a molecular we~ghtof approximately 12,.800 as
determined by. gel filtration and sucrose densit~gradient
centrif~gation methods. The molecular we~ght calcu:ated. 'from
amino acid composition is between 10,,700 and .11,000.
The amino acid .composition .of taro. ferredoxin as deter-
mined by acid hydrolysis.of oxidized ferredoxin and carboxy
methyl cysteinyl ferredoxin is: Lys4_5' RiS l , A~gl' CYS5'
Asp+AsnlO ' Thr6' Ser8 , Glu+Gln16_17" Pro4' G1Y9_10' Al.a7 ,
VallO' Ile4' Leu6' Tyr4' Phe 2 . Spectrophotometric titrations
of the performic acid-treated protein indicate the presence
.of one tryptophan residue per'. mole of. ferredoxin. The pro-
tein contains no methionine.
The amino terminal residue of the protein is alanine and
the carboxyterminal sequence is (Leu. Thr) Ala. The terminal
amino acid residues of spinach and taro ferredoxinsare iden-
xiv
tical. Fi~ger prints. '.of.chymotry.pt.i.c. d~ge.st·s. ·.of spinach and
taro, ferr.edoxins·also show many similarities.
Tr.e.atment with .sodium dithionite results. in the .loss .of
ab.out. 50 %..of theabsor.pt.ion ,0f.ferr.edoxinat.420. .rou. The EPR
sp.ectrum .of. dithionite-tr.eated; ferr.edoxin ,at liqu,id nit.rpgen
temperature, is simiJ..ar.tothe ·EPR spe.ctra of..other r.educ.ed
non-heme iron prote.ins.
INTRODUCTION
The first successful demonstration of a pho.tosynthet.ic
reaction in a cell-freesys.tem was made in 1939 by. Hill .(1)
whosho.wed that illuminated chloroplasts. evolv.ed oxygen in the
presence of a non physiol~gical electronaccep.tor. like .ferric
oxalate. The conversion of carbon dioxide to phosph~glyceric
acid was achieved in 1952 (2). Within a few years, Calvin and
associates (.3) werE' able to isolate a number of intermediates
formed duri!1-g the conversion of car.bon dioxide.to. carbohydrate
-in photosynthetic a~gae and .to propose that a "reductive pent
ose phosphate pathway" is operative in photosynthesis.
Arnon and coworkers have established (4) that photosyn
thesis consists of two phases: (a) a photochemical phase in
which radiant ene~gy is trapped and converted into chemical
ene~gy and (b) a chemical phase in which the .chemical ene~gy
(stored as ATP and NADPH) released by phase .§:. is utilized to
convert carbon dioxide intoo~ganic compounds by a series of
reactions that are independent of l~ght. For each molecule
of carbon dioxide that is assimilated to the level of car.bo
hydrate in plants, ehe~gy released from three molecules of ATP
and two molecules of NADPH is required (.5). These two ene~gy
donors are formed durip.g the photosynthetic phosphorylat.ion
accordi!1-g to the reactions:
n. ADP + n Pi . light------------~chloroplasts. n. ATP, and
2
2 H 0 + 2 NADP + 2 ADP + 2 P' _...,;_~!~b~ ~ 2 NADPH+ +2H+. 2 ... . . . .. ). chloroplasts -, .
+ 2ATP + 02
It has been known since 1951 that illuminated chloroplasts
can reduce pyridine nucleotides (6,. 7, 8). The actual accu-
mulation of reduced pyridine nucleotides in an- illuminated·
grana suspension was first reported by San Pietro and La~g
(9). These auttDrs measured the reduce~ pyridine nucleotides
by spectroscopic methods and indicated the presence pf a
soluble factor in chloroplasts which stimulated the pyridine
nucleotide reduction. SUbsequently, Arnon et al. (10) reported
that NADP and a NADP-reduci~g factor with some properties of
a protein, present in aqueous extracts .ofchloroplasts ,acted
as catalysts pf photosynthetic phosphorylation. In 1958, San
Pietro and La~g (11) isolated and purified a soluble protein
from spinach chloroplasts which catalyzed the reduction of
pyridine nucleotides by illuminated chloroplasts and names it
photosynthetic pyridine nucleotide reductase (PPNR).
As early as 1952, Davenport et al. (12) had reported the
presence of a water soluble pro.tein factor in chloroplasts
which acted as a catalyst for the reduction of methem~globin
by illuminated chloroplasts. Further studies (13) showed that
3
this methem~globin reducip.g fact'or (MRF). cataly.zed .the reduc
tion.of a number of heme 'proteins and NADP by ·illuminated
chloroplasts. Comparison.of the spectral and catalytic pro
perties..ofpurified preparations ofPPNR andMRF r.evealed
that the two proteins 'are .identical. The two proteins were
shown .to. contain non-heme .ironand labilesu.lfur.
In 1962, Mortenson etal. (14) reported the isolation of
anon-heme, non-flavin, proteinfromClo·str.idium past.eurianum
which functioned as an electron carrier in the .phosphoroclas
tic reaction of the bacterium. These authors named the pro
teinUferredoxin".At the same time, T~gawaandArnon (1-5)
isolated. from spinach leaves, a non-heme iron protein with
electron carrier properties similar to that of hacterial
ferredoxin. Bot.h proteins. had a very low oxidation reduction
potential (E~ -0·.43 'V at .pH. 7 ..-5-5 ) and both were reversibly
oxidized and reduced with characteristic chap.ges in absorption
spectra. Bacterial ferredoxin was found to becapahle .of
mediatip.g in the dark reduction.-Of pyridine nucleotides in the
presence of hydr~gen and hacterial hydr~genase. Due to the
similarity in properties. between clostridial ferredoxin and
the pyridine nucleotide reducip.g factor of spinach, the name
chloroplast. ferredoxin was s~ggested. for the latter by Arnon
and associates. These authors also pointed out the identity
.ofPPNRand MRF to chloroplast ferredoxin . The name ferre
doxin was s~ggestedfor iron proteins whichfuncti.on as. elec
tron carriers on .the"hydr~gen side" .of pyridine nucleo-

4
tides .(16) .
.The .chloroplast..enzy.me responsible. for the reduct.ion of
.NADP ,..ferredoxin-NADP reductase, .was prepared in a crystal-
line,form by Shin et.al.(l:7}..This enzyme was a.flavopro-
tein, spec.ific for NADP with transhydr~genaseproperties. A
similar pr.otein had been isolct:ed.earlier byKeister.etal.
(18 ) and by. .Avron and J?-gendorf (19). .The mechanism .of. fer-
redoxin mediated NADP reduction as envis?-ged by Shin and
Arnon (20) is
l?-ghtdriven electron Fd red) (fPOXid)(NADPH
donor system ----7 Fdoxid fp d NADPre
where f stands for Fd-NADP reductase.p
(NADH)
(NAD)
In addition toacti~g as an electron carrier in the re-
duction of NADP, chloroplast. ferredoxin can mediate in .the
reduction .of nitrate to nitrite, and nitrite and hydroxy-
lamine to ammonia (23). Recently, Arnon et- ale (4). have shown
clearly that ferredoxin participates in both <yelic and noncy--
clic photophosphorylation, the two photochemical reactions
that jointly account. for the evolution of oxygen and for the
assimilatory power made up of NADPH and ATP. Also, reduced
chloroplast ~erredoxin was shown to act~vate a· spec~fic fruc
tose 1, 6-diphosphatase indicatipgthe role of. ferredoxin in
the r~gulation .of carbohydrate metabolism in plants .( 2.1+,) .
5
Thusitisevident. that,ferr.edoxinplays an important role in
the photosynthetic ene~gy, .conversion process in plants .
In the few years) since .the dis covery ,of,ferredoxins
and establishment of. their role in the electron tran,sfer
mechanism ,of .plants and b.acteria (14,. 15) ,there has been a
tremendous interest in various laborat'ories in the .study of
these proteins. The relatively low molecular we~ghtof fer
redoxinshas prompted pro.tein chemists to study the amino
acid .sequence of.ferredoxins from various b.acteria and plants
,( 26, 97,' 75) . It is the bi.ochemist' s e~gernessto trace the
evolution of life and desire to look for diversity in unity
that resulted in the isolation of prote~ns like cytochrome c
and hems>globin from numerous spec.ies and in the. determination
of the amino acid sequence of. these proteins (98). The enun-
ciation .of. the. genet.ic code has enab.led biochemists to under
stand some of the amino acid substitutions that are found in
a part.icular protein. from di,fferentorthe same spec.ies.
The development ofco~puter technols>gy has been helpful .to
predict within reasonab.le limits the time lapse that would
have occurred betw.een the evolution of eachspec.ies based on
-the amino acid sequence determinations of certain proteins
from the respective species (99). Comparat.ive biochemistry
,of proteins is still an open and promisip,g field capable of
makip,g many. futurecontribut.ions.
Fer.r.edoxinsfromplant sand bacteria contain iron and aIt,
form ,of acid-labile sulfide which can be estimated as hydro-
6
. gen .su,l·f.ide.. Simultaneous with .the discovery pf,ferre.doxins,
the presence .ofelectron tran,s.fer. proteins with iron and labile
sulf.ide was. observed in mammalian mitochondria (100). Unlike
the cyt.o.chromes and hem~globin,. ;theiron in the: .ferr.edoxins
is extremely labile and the determination of the mode ,of bind
i~g .of iron in these prote~ns has become a challe~gi~g problem
for biochemists and biophysicists. Due to the presence ,of
param~gnetic chromophore in the molecule ,te,chniques like
lYIossbauer Spectroscopy (101, 102), optical rotatory disper
sion(76),circular dichroism (103.), proton relaxation (104),
near infrar.ed dpectroscopy (IDS) and electron param~gnetic
resonance spectroscopy (92-96.) are applied alo~g with chemical
invest~gations to. elucidate the structure .offerredoxins.
Tho~g~the molecule.of ferredoxin is smaller than molecules of
ribonuclease and my~globin, the presence of labile iron and
sulfur makes the determination ,of, ferredoxin structure by X
ray crystall~graphy, ,after isomorphic replacement. of he.avy
metals, d.i,fficult( 22). The importance .of ,and interest in,
the s.tudy ,of these non-heme' iron proteins is illustrated by
the special Symposia on these pro.teins held in Hawaii (Hono
lulu, 19,63) and in Ye,llow Spri~gs (Ohio, 1965). The applica
tions .of m?-gnetic resonance techniques in the elucidation of
non-heme iron protein structure was discussed by scientists
from laboratories in an International Symposium held ,at
Stockholm, Sweden, in 1966.
7
Tho~gh many bacterial ferredoxins were isolated between
1962 .and 1965, (106,25) ,the only plant.ferredoxins adequate
ly characterized by 1965 were those of spinach and parsley
.(27, 107). Bacterial ferredoxin is available .commercially
but the commercial production of plant ferredoxins has never
been accomplished and samples are difficult to obtainirom
other laboratories for detailed studies.
The proposed objects of the present research were:
1) To devise a convenient method for the isolation of ferre
doxin in a pure state from a plant readily available on the
Islands of Hawaii. 2) To study the chemical composition and
properties of the protein and compare them with those of
other plant and bacterial ferredoxins. 3) To determine the
moleculr we~ght and optical and electron param~gnetic reso
nance spectra of the protein. 4) To determine the amino
acid composition and terminal amino acid residues of the pro
tein and compare these wi.th those of other plant fe.rrl8doxins.
With these objects in view, preliminary invest~gations
were started with leaves of Amaranthus. gangeticus andcondi
tions necessary to. get the best yield of ferredoxin were
worked out. The plant finally chosen was taro (Colocasia es
cUlenta) which belo~ged to a different class from spinach ..
In the later stages. ferredoxin was prepared from spinach (Si;ii
nacia oleraces), flown in from California, and from taro
leaves, under identical conditions, and their phys.ical and
chemical properties were compared.
MATERIALS AND METHODS
MATERIALS
Guanidine hydrochloride, crystalline iodoacetic acid,
mersalyl acid (sodium salt), N-bromosuccinimide, pyridine-2
azo-p-dimethyl aniline, and cytochrome c were purchased from
Sigma Chemical Company, St. Louis, Missouri.
G. Frederick Smith Chemical Company, Columbus, Ohio, sup
plied standard iron solution and all the re~gents used in
iron analysis. Acrylamide, N,N'-methylene bisacrylamide and
N,N',N'-tetramethyl ethylene diamine, re~gents used in acryl
amide. gel electrophoresis, were obtained from Eastman Organic
Chemicals, Rochester, New York. The same source supplied
mercaptoethanol, hydrazine, and p-dimethyl aminobenzaldehyde.
Coenzyme A, crystalline bovine serum albumin, NADP and
p-chloromercuribenzoic acid (sodium salt) were obtained from
Nutritional Biochemi.cal Corporation, Cleveland, Ohio.
Cal Biochem, Los A~geles, California, was the source for
Cellex D (DEAE-cellulose), Bi~gel P, dansyl chloride and
standard dansyl amino acids.
Amberlite MB-I and MB-3 were purchased from Mallinkrodt
Chemicals, St. Louis, Missouri.
Matheson Coleman and Bell, East Rutherford, New Jerse~
supPied N,N-dimethyl-p-phenylenediamine sulfate and ammonium
persulfate.
9
FDNB waspurchased,from Pierce Chemical Company , ,Rock
,ford, ,Illinois.
Silica. gel was ,pur,chas,ed,f,rom Warner-Chi:lc'ott Lahorato
ries, ,Richmond, Cal:ifornia
DFPcarboxypeptidases, A and B, and lyophilized trypsin
were ,supplied by Worthington Biochemical ,Corporation, 'Free
hold, ~ew Jersey.
Sephadex was supplied byPharmacia Fine ,Chemicals Inc.,
Piscataway, New Jersey,.
DTNB was purchased from Aldri,ch Chemical Co. Inc., Mil
waukee, Wisconsin.
Standard DNP amino acids and TLCK-Chymotrypsin were the
gift of Dr. Joyce Tsunoda ,of, this department ,University, 'of
Hawaii.
,Compressed hydr~gen and nitr~gen were obtained. from
Gaspro Ltd., Honolulu, Hawaii
All other, chemicals used were standard lahoratory rea
gents.
Distilled water or deionized water was used, for maki~g
aqueous solutions.
Urea was always pur,ified as des cr.ibed by, Benschetal.
,(3:4 ),.
The leaves of taro plant werepurchas,ed,from a,farm near
the University of Hawaii Campus. Chinese spinach was pur
chased,fl'om a local. grocer., Spinach (Spinacia ,oleraces) was
purchased, from the Blue and Go:ldGrocery" Berke,ley" Cal,ifor-
10
nia, .and was flown imrnediateT.y .to.Honolulu in r.efr?-gerated
containers.
- Swis s:~hard was grown .outs.ide .the laboratory from .seeds
packed oy .the Ferry-Mor.se· .Se.ed Co. ,Mountain View, .Cal.ifor
nia..
METHODS
Prepar:ation of adsorbent: .columns, forchr'omatography.
Diethylaminoethyl :cellulos e .(corrunerciaICellex-D) was
pr.oces.sed and packed into. columns by .the pr.ocedure described
byPe.terson and Sober (35 ) .Sephadex, gels a.nd Bi~.gel· P-IO
werepro.cessed .for columnchromat~graphyas recommend.ed by
the man:ufacturer .
Extra,ction offerre.doxin.
Fresh taro leaves , harves.ted. in the morni~g, were. freed
.of .their mid-ribs, we?-ghed, packed in plastic b~gs, and
stored. for. fiveto, fif.teen days in the. free.ze.r.The, frozen
le.aves were thawed .at a convenient time in the cold room at
4°, h,eforehom~genization. .At timesthele,aves were .cooled
to 4°. immediately after. harvest and hom~genize.d without
freezi~g and thawi!-'1g. The pro.cedure of T~gawa and Arnon (36)
was used for isolation ,of. fe.rr,e.doxin, with some modifications.
The entire operation was carried out at 4°.
Preparat.ion of aqueous. ·extract.
About I ~g of leaves was hom~genized with 3 liters .of
0.05 M Tris-HCI b:uffer,pH; 7.5,containi!-'1g 0.05 M NaCI, .for
two minutes, in a Wari~gBlendor .(one. gallon capacity) at low
speed. The hom~genate was,filt'ered thro~gh a double layer
.ofcheesecloth and a si!-'1glelayer of. glass wool. The last
.port.ions were removed by mechanical .compression,ofthe filter
cake.
12
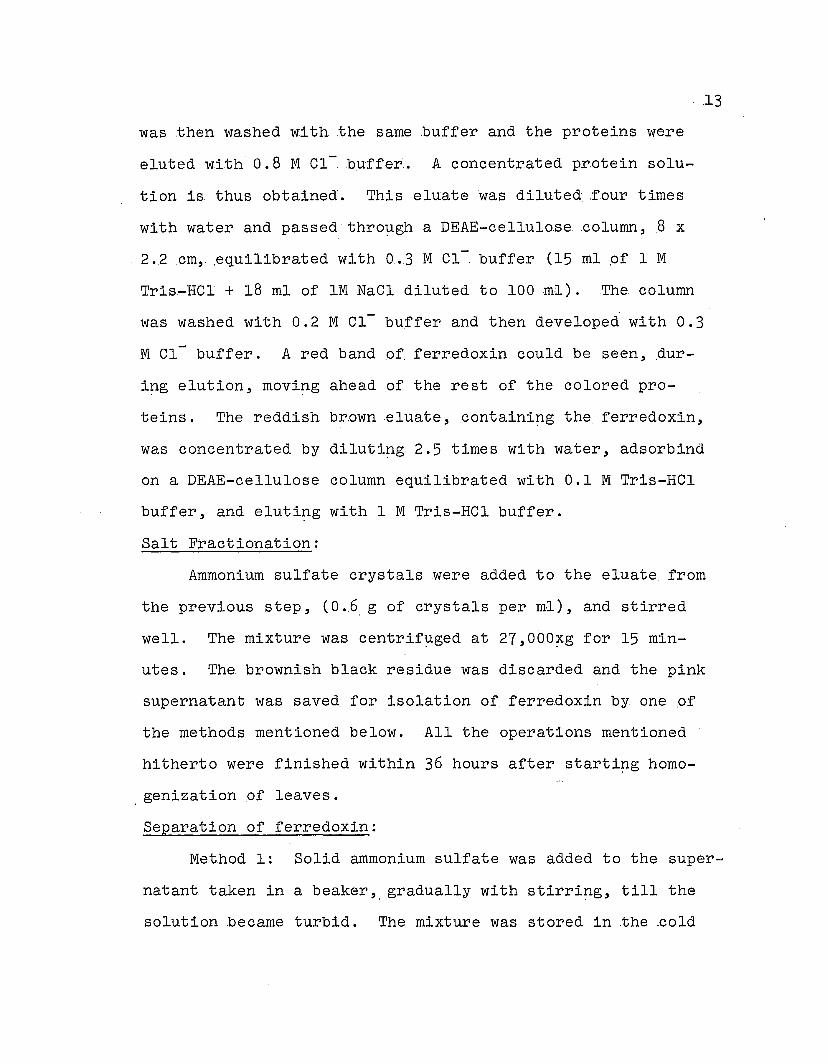
.13
was then washed wi ththesame .buffer and the proteins were
eluted with 0.8 M Cl- b:uffer.. Aconcentratedpr.otein solu
tion is thus obtained. This eluate was dilute~ rour times
with water and passed thro~gh a DEAE-cellulose -column, 8 x
2.2cm, .equilibrated with 0.3 MCI- buffer (15 ml pf I M
Tris-HCl + 18 ml of 1M NaCl diluted to 100 ml). The. column
was washed with 0.2 M CI- buffer and then developed with 0.3
M Cl- buffer. A red band pf. ferredoxin could be seen, dur
i~g elution, movi~g ahead of the rest of the colored pro
teins. The reddish. br.own eluate ,containi~g the. ferredoxin,
was concentrated by diluti~g 2.5 times with water, adsorbind
on a DEAE-cellulose column equilibrated with 0.1 M Tris-HCI
buffer, and eluti~g with 1 M Tris-HCl buffer.
Salt Fractionation:
Ammonium sulfate crystals were added to the eluate from
the previous step, (0.6, g of crystals per ml), and stirred
well. The mixture was centrif~ged at 27,000~g for 15 min
utes. The brownish black residue was discarded and the pink
supernatant was saved for isolation of ferredoxin by one of
the methods mentioned below. All the operations mentioned
hitherto were finished within 36 hours after starti~g homo
genization of leaves.
Separation of ferredoxin:
Method 1: Solid ammonium sulfate was added to the super
natant taken in a beaker" gradually with stirri~g, till the
solution became turbid. The mixture was stored in the cold
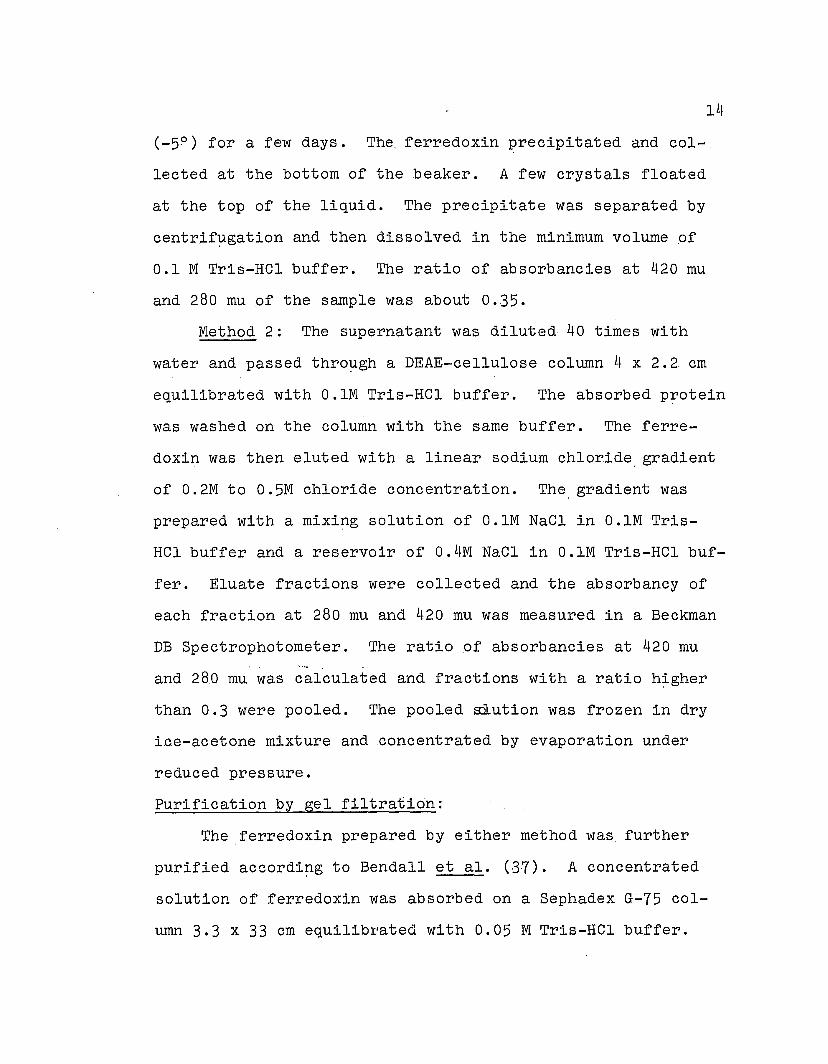
14
(-59) for a few days. The ferredoxin precipitated and col-
lected at the bottom of the beaker. A few crystals floated
at the top of the liquid. The precipitate was separated by
centrif~gation and then dissolved in the minimum volume .of
0.1 M Tris-HCl buffer. The ratio of absorbancies at 420 mu
and 280 muof the sample was about 0.35.
Method 2: The supernatant was diluted 40 times with
water and passed thro~gh a DEAE-cellulose column 4 x 2.2 em
equilibrated with O.lM Tris-HCl buffer. The absorbed protein
was washed on the column with the same buffer. The ferre-
doxin was then eluted with a linear sodium chloride. gradient
of 0.2M to 0.5M chloride concentration. The. gradient was
prepared with a mixi~g solution of O.lM NaCl in O.lM Tris
HCl buffer and a reservoir of 0.4M NaCl in O.lM Tris-HCl buf-
fer. Eluate fractions were collected and the absorbancy of
each fraction at 280 mu and 420 mu was measured in a Beckman
DB Spectrophotometer. The ratio of absorbancies at 420 mu.... .
and 280 mu was calculated and fractions with a ratio h~gher
than 0.3 were pooled. The pooled ~ution was frozen in dry
iC.e-acetone mixture and concentrated by evaporation under
reduced pressure.
Purification by gel filtration:
The ferredoxin prepared by either method was further
purified accordi~g to Bendall et ale (37). A concentrated
solution of ferredoxin was absorbed on a Sephadex G~75 col-
umn 3.3 x 33 em equilibr'ated with 0.05 M Tris-HCl buffer.
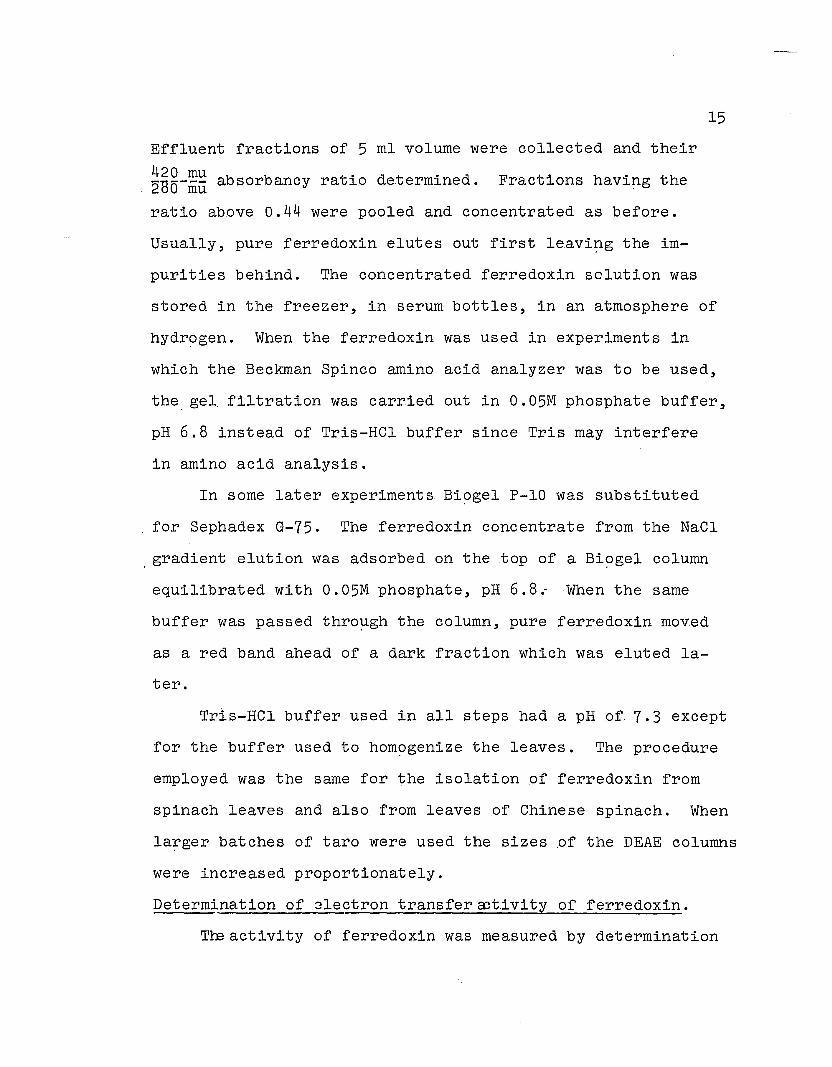
15
Effluent fractions of 5 ml volume were collected and their
420 mu b b t· d t . d F ti h· th2'85-mu a sor ancy ra lO e ermlne. rac ons aVl~g e
ratio above 0.44 were pooled and concentrated as before.
Usually, pure ferredoxin elutes out firstleavi~g the im
purities behind. The concentrated ferredoxin sclution was
stored in the freezer, in serum bottles, in an atmosphere of
hydr~gen. When the ferredoxin was used in experiments in
which the Beckman Spinco amino acid analyzer was to be used,
the. gel, filtration was carried out in O. 05M phosphate buffer,
pH 6.8 instead of Tris-HCl buffer since Tris may interfere
in amino acid analysis.
In some later experiments Bi~gel P-10 was substituted
for Sepnadex G~75. The ferredoxin concentrate from the NaCl
gradient elution was adsorbed on the top of a Bi~gel column
equilibrated with 0.05M phosphate, pH 6.8.-When the same
buffer was passed thro~gh the column, pure ferredoxin moved
as a red band ahead of a dark fraction which was eluted la-
ter.
Tris-HCl buffer used in all steps had a pH o~ 7.3 except
for the buffer used to hom~genize the leaves. The procedure
employed was the same for the isolation .of ferredoxin from
spinach leaves and also from leaves of Chinese spinach. When
la~ger batches of taro were used the sizes ,of the DEAEcolumns
were increased proportionately.
Determination of 8lectron transferoot~vity of ferredoxin.
Treactivity of ferredoxin was measured by determination
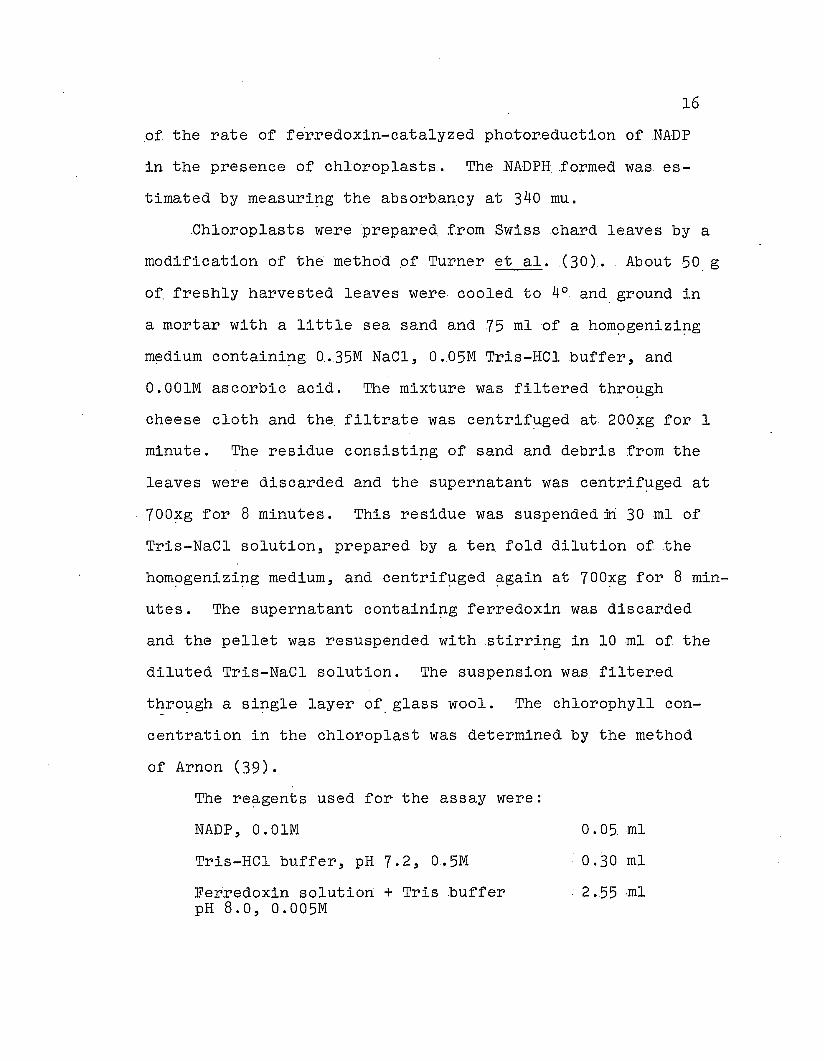
16
.of the rate of fe'rredoxin-catalyzed photoreduction of NADP
in the presence of chloroplasts. The NADPH.formed was. es
timated by measuri~g the absorb.ancy at 340 fiU.
Chloroplasts were prepared; from Swiss chard le.aves by a
modification of the method .of Turner et ale .(30). About 50. g
of. freshly harvested leaves were. cooled to 4° and ground in
a mortar with a little sea sand and 75 mlof a hom~genizi~g
medium containi~g a.35M NaCl, 0.05M Tris-HCl buffer, and
O.OOlM ascorbic acid. The mixture was filtered thro~gh
cheese cloth and the. filtrate was centrif~ged at 2aO~g for 1
minute. The residue consisti~g of sand and debris from the
leaves were discarded and the supernatant was centrif~gedat
700~g for 8 minutes. This residue was suspendedfu 30 ml of
Tris-NaCl solution, prepared by a ten fold dilution of the
hom~genizi~g medium, and centrif~ged ~gain at 700~g for 8 min
utes. The supernatant containi~g ferredoxin was discarded
and the pellet was resuspended withstirri~g in 10 ml of the
diluted Tris-NaCl solution. The suspension was filtered
t~ro~gh a si~gle layer of, glass wool. The chlorophyll con
centration in the chloroplast was determined by the method
of Arnon (39).
The re~gents used for the assay were:
NADP, O.OlM
Tris-HCl bUffer, pH 7.2,0.5M
Ferredoxin solution + Tris bufferpH 8.0, 0.005M
0.05 ml
. 0.30 ml
2.55ml

- '
17
Chloroplast suspension . 0.10 ml
The .chloroplast was added just b.efore illumination. The as
say was pe.rformed in a dark room at ambient temperature by
the procedure of San Pietro (40).
Reaction mixtures..containipg,. 0.5 micromole of NADP,
0.15 millimole of Tris b~ffer,.chloroplast suspension equi
valent to about 50 micr~gram of chlorophyll, and varyipg
quantities of ferredoxin, were taken in 13 x 100 mID test
tubes and mixed well. The tubes were placed around a 1,000
, ml beaker containipg water. L~ght. from a 100 watttupgsten
lamp, immersed in the water, was passed thro~gh the tubes for
5 minutes. The absorbancy of the supernatant was measured
at 340 mu in a Beckman DB spectrophotometer ?-gainst a blank
which contained all the re?-gents except ferredoxin. The ab
sorbancy of the ferredoxin at 340 mu was subtracted from the
observed values to, get .the absorbancy due to NADPH. Protein
concentration of the ferredoxinsolttion was determined usipg
Folin-Ciocalteu re?-gent accordipg to Sutherland etal. (41).
The standard used was a freshly prepared solution of bovine
serum albumin. Thewe~ght .of, ferredoxin obtained by this
method was h~gher than the actual dry we;Lghtof the protein
and a correction factor was determined, after the purifica
tion of the protein, for calculatipg the we;Lght of protein
from the value obtained by the Folin-Ciocalteu assay.
Absorption Spectra:
Pure ferredoxin has characteristic absorption peaks in
18
the. visible r~gion of the spectrum . So, the purity..of the
effluents duri~gchromat~graphicpurific.ationofferredoxin
was checked by recordi~gthe absorption spectra 'of the sam
ples in a Cary model 14 spectrophotometer.
Thee.ff~ctof re~gents like. sodium dithionite, urea,
mersalyl, and CMB on ferredoxin was also studied by record
i~g the .absorption spe.ctraof the protein after incubation
with the respective re~gents. Some of these reactions were
carried out in the absence of air. The reactants were main
tained .1n anaerobic condition in a special type of absorption
cell supplied by Quaracell Products, New York. This cell
had a lo~g. glass stem, 9 1/2 cm l0!1g, fused over the conven
tional 3 ml absorption cell. The mouth of the cell was
closed with a serum stopper thro~gh which a syri!1ge needle
was inserted. The needle was connected to a specially con
structed vacuum manifold and the contents of the cell de
gassed. The cell was then alternately flushed with hydr~gen
and evacuated, several times, to insure the complete remova.l
of air. Finally the space above the reaction mixture was
filled with hydr~gen. Re~gents were added into the vessel,
thro~gh the serum stopper, by means of a syri!1ge.
Determination of dry weight:
The protein concentration of a sample of freshly preparea.
ferredoxin solution was determined accordi!1g to Sutherland
et al.(41). The absorbancy of the solution at. 277 and,420
mu was also measured. Two ml of the same solution was dialyzed
19
in 8 rom dyalysistubi~g ~gainst .severalcha~ges, of deionized
water ,for 24. hours" the water,bei~g cha~gedevery 8 hr. The
dialysis tube was cut and the Dontentstransferred to a pre
viously we~ghedplatinum crucible. Thetub~ was washed with
a,few drops of water and the washi~gs were added to the. main
dialyzate. The crucible was partially covered with a platinum
lid and heated in an evacuated oven at 60° for 12 hours. The
crucible was then ,cooled in a desiccator over phosphorus
pentoxide and we~ghed. The residue was heated to 60°"cooled,
and we~ghed, repeatedly, till there was no further cha~ge in
we~ght. The crucible was then heated to 600 0 for 24 hours in
a muffle furnace, cooled and we~ghed. The ash obtained was
saved for determination of iron content.
Determination of total nitrogen:
The total nitr~gen in the protein was determined by
conversion of the protein nitr~gento ammonium sulfate by
the K1eldahl method, and estimatipg the ammonium content
with Nessler's re~gent. The, ferredoxin sample used was the
same as that which was used for the dry we~ght determination.
Two-tenths milli liter of the protein solution was heated
with 0.2 ml of concentrated sulfuric acid for 30 minutes in
a 25 ml Kjeldahl flask. The flask was cooled, 'two drops of
30%hydr~gen peroxide was added to it, and the flask heated
~gain for 5 hours. The d~gested protein was cooled in ice,
neutralized with 0.4 N sodium hydroxide, and diluted to 25
ml with water. Nessler's re~gent, prepared accordipg to

20
Seely and Vandemark (.42.) was added to various' fractions of
the. diluted d?-ge st and the absorbancy..of the resulti~g
colored solution was measured, after 10 minutes ,at: .420 mu,
in a Bausch and Lomb Spec.tronic 20 spectrophotomet.er. The
we?-ght. of the nitr~gen in the sample was calculated by. com
pari~g the absorbancy. values wi.ththatof a standard curve
obtained from ammonium chloride and Nessler's re~gent.
Determination of inorganic sulfide:
Ino~ganic or labile .sulfide in a non-heme iron pro.tein
is sulfide .that is liberated from the protein by .the action
of dilute acids. The ino~ganicsulfide content of taro
ferredoxin was determined by conversion to methylene blue
accordi~g to F~go and Popowski (43) as modified by Lovenbe~g
etal. (44). One~half milli liter of a mixture o~ ferredoxin
solution and water was taken in tUbes, 10 x· 75 mm, and 1.3 ml
of 1% zinc acetate and 0.05mlof 12% sodium hydrOXide were
added. .Thetubes were stoppered and 0.25 ml of 0.5 % N, N-dime
thylphenylenediamine hydrochloride (prepared by. dissolvi~g
N,N-dimethyl-p-phenylenediamine sulfate in 5.5NHC1), and
0.D5 ml of 0.23M ferric chloride were added to each tUbe,
the stopper bei!1g replaced after each addition. After 20
minutes, 0.85ml of water was added to each tube and the
absorbancy .of the methylene blue formed was measured at .670
mu ~gainst a blank which contained all re~gents except fer
redoxin. A solution of sodium sulfide which had been
standardized iodimetrically accordi~g to V~gel (45) was used
21
as standard for a calibration curve.
S0dium sulfide was .standardized by the', .followi~g proce
dure. A standard solution ,of sodium arsenite was prepared by
dissolvi!1g 1.25. g of pure arsenious oxide in 2.5 N sodium
hydroxide, neutralizi!1g the solution with 1 N hydrochloric
acid, and diluti!1g the mixture t~ 250 mI. The no~mality of
the solution was calculated. An approximately decinormalso
lution of iodine was prepared by dissolvi~g about 12.7. g of
iodine crystals in potassium iodine solution and diluti~g to
one liter with water. The iodine solution was standardized
by titration ~gainst the sodium arsenite, in the presence of
sodium bicarbonate, usi!1g starch as an indicator. The sodium
sulfide solution was treated with excess of sodium arsenite
and dilute hydrochloric acid when the sulfide was precipi
tated as arsenious sulfide. The precipitate was filtered off
quantitatively and the unused arsenite in the filtrate was
estimated by titration ~gainst the iodine solution. The nor
mality of the sodium sulfide solution was calculated. from the
amount of sodium arsenite consumed by the sulfide.
Determination of iron content.
The iron content Of the pr.otein was determined usi!1g
4,7-diphenyl-l-IO-phenanthroline (bathophenanthroline) accord
i~g to. the method of Diehl and Smith (46). In this method,
an acidic solution of the protein is treated with hydroxyla
mine to reduce any ferric iron to the. ferrous state and the
ferrous iron is complexed with hathophenanthrolineto form a

·22
colored..compound which is estimated spectrophotometrical1y.
About o. 3 ~g 'of. ferredoxin was heated with3 ml of 1%
HCl,in a 15 ml centrif~ge .tube ,at 80 0 for 10 minutes. The
mixture was centrif~ged and the supernatant was transferred
to a 10 ml volumetric flask. The sediment was washed with
deionized water, centrif~ged, and this supernatant was also
poured into the flask. The process was repe.ated twice. The
solution in the flask was diluted to 10 mI. Various frac
tions of this solution were used f or iron estimation. The
iron content of the dry ash, obtained from ferredoxin, was
also estimated after dissolvi~g the ash in warm. dilute hy
drochloric acid. The reaction mixture consisted of:
Ferredoxin solution + water 1.1 ml
Hydroxylamine hydrochloride, 10% 0.2 ml
Sodium acetate, 10% 0.8 ml
Bathophenanthroline, 0.00100 0.4 ·ml
Isoamyl alcohol 1.5 ml
The mixture, taken in a 13 x 100 mmtube, was shaken well and
allowed to settle. About 1 ml of. the colored complex was re
moved from the isoamyl alcohol layer and its absorbancy was
measured at 533 mu in a 1 ml absorption cell. The concentra
tion pf. the iron in the solution was calculated by r~ference
to a calibration curve prepared with standard iron solution.
:23
Disc electrophoresis onacrylamide gels.
Polyacrylamide. gels .0 f.' 7.5% and 30% concentration were
prepar.ed and run in O•.038~~ Tris:--glycine .buffer., pH 8.3,
accordi~g to Ornstein and Davis (.47). About 100 to. 200
micr~gram of: ferredoxin (prepared from taro or spinach) was
SUbjected to elec.trophoresisin a standard, 7.5%. gel, in
6 x60 mm columns, .at a currentstre~gthof 2.5 ma per. col
umn. Bromophenol blue was used as the marker dye. Elec
trophoresis was over in two hours. After observi~g the
colored bands and their positions with respect to the marker
dye, the. gels were removed from the, glass tubes. They were
then cut at the position of the marker dye and stained with
l%soluti:)n .of amidoblack in 7.5% acetic aCid, to detect
colorless proteins. The stained, gels were washed with 7.5%
acetic acid (sometimes destaini~g was done by electrophoresis
in acetic acid). 'rhe relat.ive intensities of the stained
bands were traced in a Phot.ovoltCorporation Densicord.
Electrophoresis was carried out in small pore .(30%), gels
also, in, glass tubes. These,gels are very difficult to re
move.from the tubes intact, and so the. gels were not stained
after. electrophoresis.
Moving boundary electrophoresis:
Free boundary electrophoresis of ferredoxin was carried
out in a Perkin-Elmer Model 38 Electrophoresis apparatus pro
vided with Schlieren optical assembly. A freshly prepared
solution of ferredoxin (4 ~g perml) was dialyzed ~gainst pH
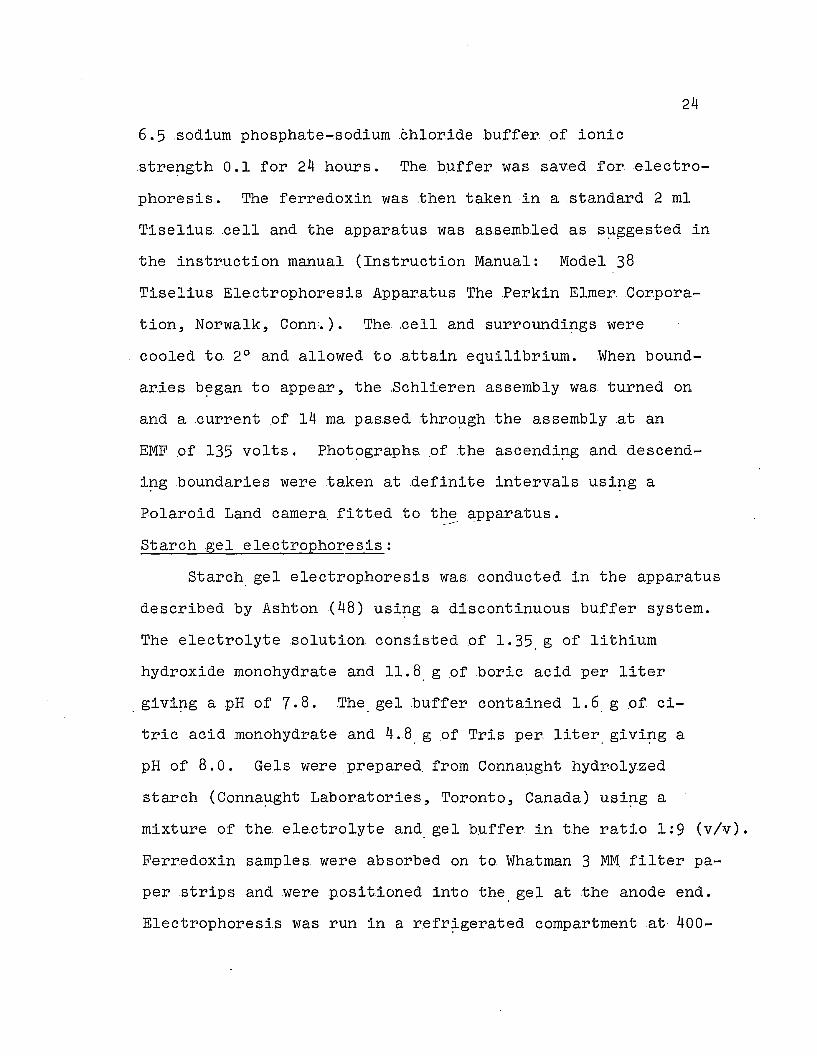
24
6.5 .sodium phosphate-sodium .chloride buffer .ofionic
stre!1gth 0.1 for 24 hours. The buffer was saved for electro
phoresis. The. ferredoxin was then taken in a standard 2 ml
Tiseliuscell and the apparatus was assembled ass~ggested in
the instruction manual (Instruction Manual: Model 38
TiseliusElectrophoresis. Apparatus The Perkin ElmerCor.pora
tion, Norwalk, Conn:.). The ,cell andsurroundi!1gs were
cooled to 2° and allowed to attain equilibrium. When bound-
ar.iesb~ganto appear ,the .Schlieren assembly was turned on
and a current .of 14 rna passed thro~gh the assembly at an
EMF of 135 volts. Phot~graphsof the ascendi!1g and de.scend
i!1g boundaries were taken at ,definite intervals usi!1g a
Polaroid Land camera fitted to the apparatus .. ---
Starch gel electrophoresis:
Starch, gel electrophoresis was conducted in the apparatus
described by Ashton (48) usi!1g a discontinuous buffer system.
The electrolyte solution consisted .of 1.35, g of lithium
hydroxide monohydrate and 11.8. g .of .boric acid per liter
givi!1g a pH of 7.8. The. gel b~ffer contained 1.6, g of ci
tr~c acid monohydrate and 4.8, g of Tris per liter. givi!1g a
pH of 8.0. Gels were prepared. from Conna~ght hydrolyzed
starch (Conna~ght Laboratories, Toronto, Canada) usi!1g a
mixture of the ele.ctrolyte and, gel buffer in the ratio 1:9 (v/v).
Ferredoxin samples were absorbed on to Whatman 3 MOO filter pa-
per strips and were positioned into the. gel at the anode end.
Electrophoresi.s was run in a r.efr~gerated compartment .at 400-

25
500 with an initial current ;of 4 rna per cm width .of the gel
and was complet.ed in about: 3hr. The. gel was removed and
stained with 0.05% solution of n~grosine black in methanol
acet.icacid-water ·(5: 1.: 5 by. volume).
Molecular weight determination.
The molecular we?-ght of. ferredoxin was determined by. gel
filtration and density. gradient centrif~gation methods.
Gel filtration.
Gel filtration was performed in Sephadex G-IOO ,columns,
prepared and run accordi~g to the procedure of Andrews (49)
and of Whitaker (50). About 5 ~gof ferredoxin, dissolved
in 1 ml of Tris-HCl bUffer, was layer.ed on top of a column
of Sephadex G-IOO,. 1.6 x 113 cm, kept at 4° and equilibrated
with 0.22M Tris-HCl buffer, pH, 7.5. The protein was eluted
with the same buffer, stored in a reservoir, at ahe?-ght of
15cm. from the bottom of the .column. Effluent fractions of
approximately 3 ml volume were. collected. every. 20 minutes in
tubes .loaded on a G. M. fraction collector. The concentration
of the ferredoxin in the. fractions was determined by measur
i~g the absorbancy at 280 mu !3-gainst a blank, which was a
fraction eluted just before the ferredoxin. The column was
standardized by runni~gthro~gh it, pure specimens of beef
heart cytochrome c, trypsin, beef heart lactic dehydr~genase
and bovine serum albu.min.The void volume of the column was
determined usi~g Blue Dextran 2000.
26
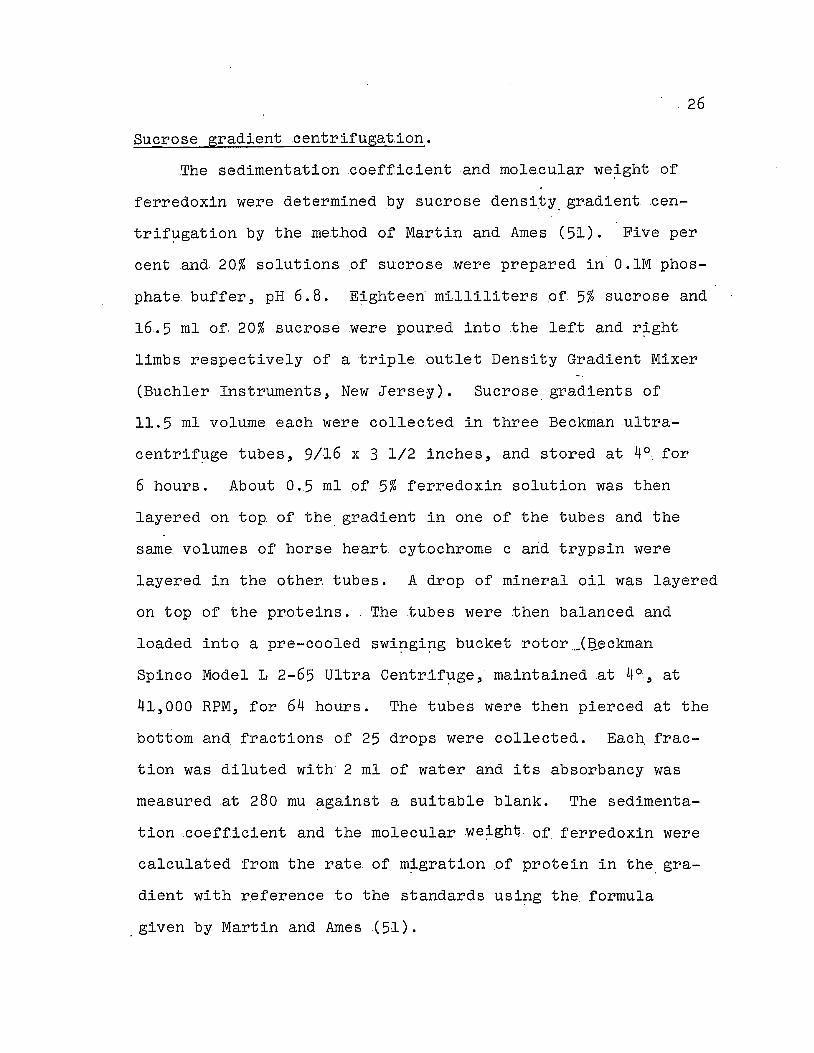
Sucrose gradient .centrifugat.ion.
The sedimentation coefficient and molecular we?-ghtof
ferredoxin were determined by sucrose density. gradientcen
trif~gation by the method of Martin and Ames (51). Five per
cent and 20% solutions Of sucrose were prepared in O.lM phos
phate buffer, pH 6.8. E?-ghteen milliliters of 5% sucrose and
16.5 ml of 20% sucrose were poured into the left and r?-ght
limbs respectively ,of a triple .outlet Density Gradient Mixer
(Buchler Instruments, New Jersey). Sucrose.gradientsof
11.5 ml volume each were collected in three Beckman ultra
centr1f~ge tUbes, 9/16 x 3 1/2 inches, and stored at 4° for
6 hours. About 0.5 ml of 5% ferredoxin solution was then
layered on top of the. gradient in one of the tubes and the
same volumes of horse heart cytochrome c arid trypsin were
layered in the other. tubes. A drop of mineral oil was layered
on top of the proteins. The tubes were then balanced and
loaded into a pre-cooled swi~gi~g bucket rotor ,Jaeckman
Spinco Model L 2-65 Ultra Centrif~ge, maintained at 4°., at
41, 000 RPM, for 64 ,hours. The tubes were then pierced at the
bottom and. fractions of 25 drops were collected. Each. frac
tion was diluted with 2 ml of water and its absorbancy was
measured at 280 mu ~gainst a suitable blank. The sedimenta
tioncoefficient and the molecular we?-gh~. of ferredoxin were
calculated from the rate of m?-gratlon of protein in the. gra
dient with reference to the standards usi!1g the formula
given by Martin and Ames ,( 51) .

27
Phosphoroclastic ·assay.
The 'capacityof taro, ferredoxin to substitute, for bac-
terialferredoxin in the. ,formation :of acetyl phos.phate" from
pyruvate and ino:rganic phosphate was meaclured by the method
of Lovenbe:rg et ale (44).. Bacterial. ferredoxin and. ferre
doxin-free bacterial extract (clastic system) were prepared
from dry cells of Clostridium pasteurianum accordip.gto
Mortenson (52). The protein concentration of the clastic
system was determined by. the biuret method and that of bac
terial ferredoxin from its absorbancy at 390 mu El % = 33.2,lcm
(53). The protein concentration of taro ferredoxin was
determined usip.g Folin-Ciocalteu re~gent. A reaction mixture,
consistip.g of:
Sodium pyruvate 1M 0.1 ml
Coenzyme A OwOOlM 0.1 ml
Clastic system (40 ~g per ml) 0.2 ml
P6t~ssium phosphate 0:.25M, pH 6.8 0.1 ml and
Ferredoxin + O.lM acetate, pH 5.8 0.5 ml
was incubated at 30° for 15 minutea. The acetyl phosphate
formed was estimated by the method of Lipmann and Tuttle
(5~). The reaction mixture containip.g acetyl phosphate was
incubated for 10 minutes with 28% hydroxylamine hydrochloride.
Three milliliters of ferric chloride were then added and the
mixture was centrif'!lged. The ab sorbancy ,of the red super-
natant containi~g acidic ferric hydroxamate was measured in
a Klett-Summerson photoelectric, colorimeter, with a. green
28
filter., ~gainst a blank which contained all re~gents. except
ferredoxin.
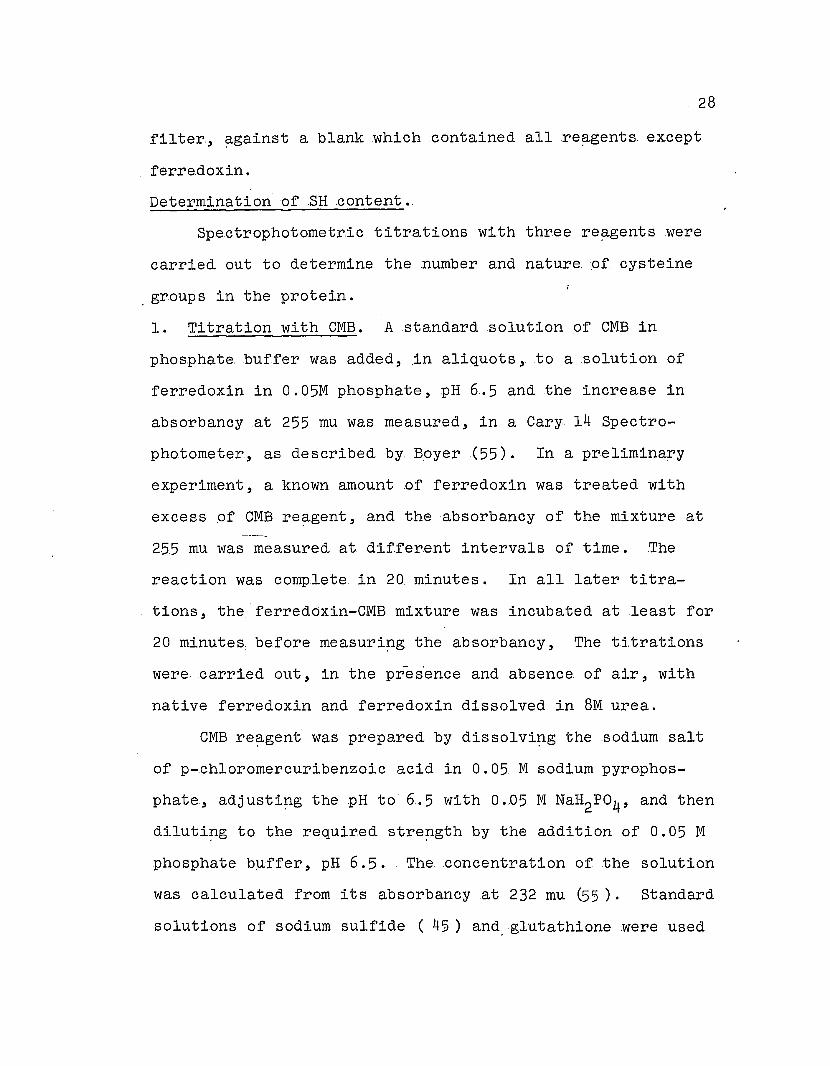
Determination of EH .content.
Spectrophotometric titrations with threere~gents were
carried out to determine the number and nature. of cy.steine
groups in the protein.
1. Titration with CMB. A standard solution 9f CMB in
phosphate. buffer was added, in aliquots, to a solution of
ferredoxin in 0.05M phosphate, pH 6.5 and the increase in
absorbancy .at 255 mu was measured, in a Cary 14 Spectro
photometer, as described by. Boyer (55). In a preliminary
experiment, a known amount of ferredoxin was treated with
excess .of CMB re~gent, and the absorbancy of the mixture at
255 mu was measured at dif.ferent intervals of time. The
reaction was complete in 20 minutes. In all later. titra
tions, the·ferredoxin-CMB mixture was incubated at least for
20 minutes, before measuri!1g the absorbancy, The ti.trations
were carried out, in the pres'ence and absence of air, with
nat.ive ferredoxin and ferredoxin dissolved in 8M urea.
CMB re?-gent was prepared by dis solvi!1g the .sodium salt
of p-chloromercuribenzoic acid in 0.05 M sodium pyrophos
phate,adjusti!1g the pH to 6.5 with 0.05 M NaH2P04, and then
dj.luti!1g to the required stre!1gth by the addition of 0.05 M
phosphate bUffer, pH 6.5. The concentration of the solution
was calculated from its absorbancyat 232 mu (55). Standard
solutions of sodium sulfide ( 45) and. glutathione were used

29
as references.
To study the effect .of CMB titration on the absorption
maxima Of ferredoXin, the .absorbancychapgesat 277, 330,
420 and 465 mu were also rec.orded duri!1g the titration.
2. Titr.ation with mer.s·alyl. Mersalyl titration was carried
out by the methoddescr~bed by Klotz and Carver (56). A
millimolar solution of the re?-gent was prepared by dissolvi!1g
25.. 3 ~g of the sodium salt of mersalyl acid and 15 ~g of
sodium chloride in 50 ml of 0.1 M sodiumacet.ate. huffer, pH
8 -45. . A 2 xlO M solution of the dye, pyridine2~azo-p-
dimethylaniline in acetate buffer was used as an internal
indicator. When the re.action withthe protein is complete,
the next drop of mersalyl added will react with the dye. givipg
a pink color with a h~gh absor.ption at 550 mu. This is the
end point of the titration.
Aliquots of standard mersalyl re~gent were added to
reaction mixturescontaini!1g 0.8 ml of the dye and about 0.1
micromole of ferredoxin in a total volume of 2.5mlacetate
bUffer, pH 5.8. After 20 minutes incubation the absorbancy
of the mixture at 550 mu was measured ~gainst a blank con
taini!1g the acetate buffer. A .standard solution of reduced
glutathione was used as r.eference.
3. Titration with DTNB.To .study the effect of, guanidine
hydrochloride on the SH, groups, ferredoxin was titrated
~gainst a solution of DTNB by the procedure described by
Ellman (57). A millimolar solution of DTNB re~gent was pre-
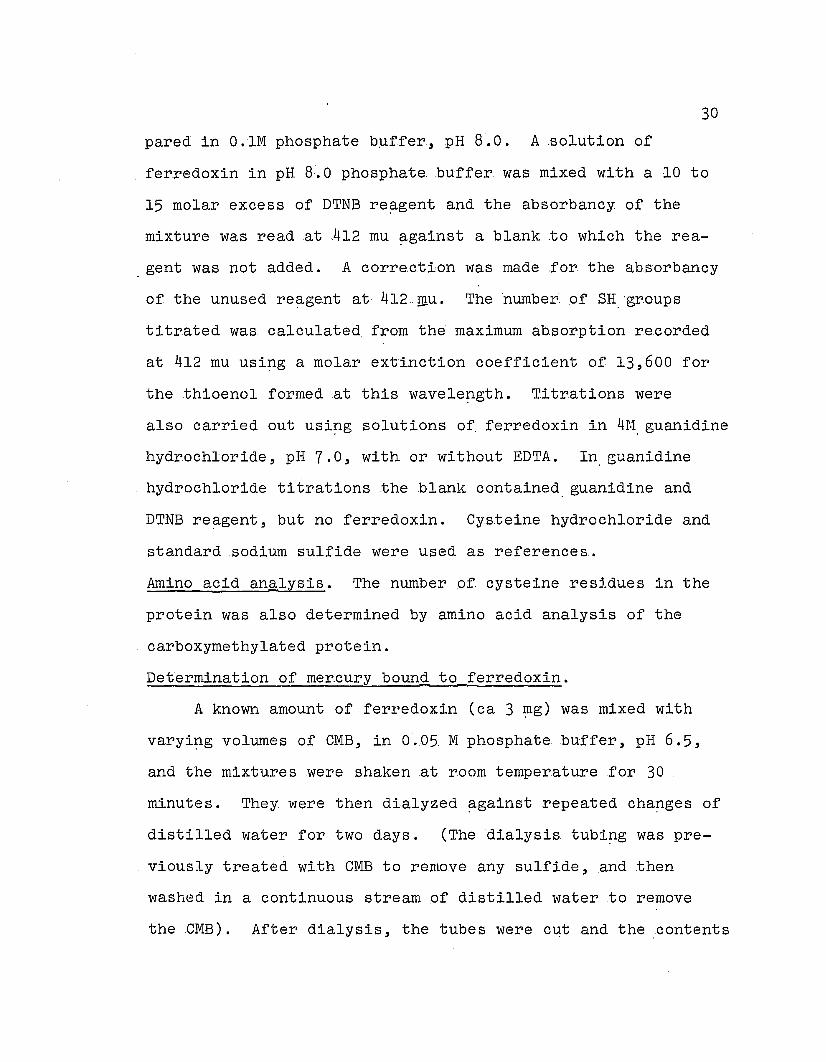
30
pared in O.lM phosphate b:uffer, pH 8.0. A solution of
ferredoxin in pH 8.0 phosphate. buffer was mixed with a 10 to
15 molar excess of DTNB re~gent and the absorbancy of the
mixture was read at 412 mu ~gainst a blank .to which the rea
gent was not added. Acorre.ction was made .for the absorbancy
of the unused re~gentat·412-mu. The number. of SH, 'groups
titrated was calculated. from the maximum absorption re.corded
at 412 mu usi~g a molar extinction coefficient of 13,600 for
the thioenol formed at this wavele~gth. Titrations were
also carried out usi~g solutions of. ferredoxin in 4r.l. guanidine
hydrochloride, pH 7.0, with or without EDTA. In, guanidine
hydrochloride titrationsthe blank contained guanidine and
DTNB re~ge.nt, but no ferre.doxin. Cysteine hydrochloride and
standard sodium sulfide were used as references.
Amino acid analysis. The number :of cysteine resj.dues in the
protein was also determined by amino acid analysis of the
carboxymethylated protein.
Determination of mercury bound to ferredoxin.
A known amount of ferredoxin (ca 3 ~g) was mixed with
varyi~g volumes of CMB, in 0.05 M phosphate buffer, pH 6.5,
and the mixtures were shaken at room temperature for 30
minutes. They were then dialyzed ~gainst repeated cha~ges of
distilled water for two days. (The dialysis tUbi~g was pre
viously treated with CMB to remove any sulfide, and then
washed in a continuous stream of distilled water to remove
theCMB). After dialysis, the tubes were c~t and the contents
31
were· quantitatively transferred to. graduated cylinders. The
mercury present in the dialyzates was estimated by atomic
absorption spe.ctrophotometry.
Measurements pf atomic absorption were carried out
es.sentially by the procedure .of Fuwaet ale (58), usi~g the
apparatus assembled by Dr. R. H. McKay of this department.
AWesti~ghouse WL 22847 hollow cathode discha~ge tUbe,
oper.atedat a current of 10 ma, was the emission source, and
a Beckman atomizer burner was used to spray the sample into
the 1. 3 x25 cm alumina absorption cell. The. fuel used con
sisted of a mixture of hydr~gen, at a pressure of 2.5 pounds
per. square inch, and oxygen, at a pressure of 14 pounds per
square inch. The flow rate of liquid thro~gh the burner was
approximately 2 ml per minute. The absorption was measured
at 2537 A in a Carl Zeiss PMQ II Spectrophotometer, operated
at maximum sensitivity and a slit width of less than 0.1 mm.
From the absorbancy values, the concentrat.ion of mercury in
the samples was calculated by reference to curves constructed
with standard mercuric chloride or CMB solution. The water,
that was present, outside the dialysis tUbi~g, in the final
dialysis, .served as a blank.
Preparation of der.ivatives of ferredoxin.
For amino acid analysis and determination of terminal
amino acid residues, two derivatives of ferredoxin were pre
pared.
32
1. Oxidized, iron and sulfur_free ferredoxin.
Iron and ino~ganicsulfidewere removed from the protein
by the method of Tanaka etal. (59). To a solution .of 100
~g of ferredoxin (in 6 ml of water), cooled in ice, was
added,in drops, 2 ml of. 20.% tr.i.chloroacetic acid. The fer
redoxin was immediately decolorizedand a white precipitate
appeared. The mixture was let stand for one hour in the
cold and then centrif~ged.Thesedimentwas washed three
times with 5 ml .volumes.of a mixture of ether and 95%
ethanol, and finally dried in vacuo.
The cysteine residues in the iron and sulfur. free. fer
re.doxin were oxidized to cys.te.icacid with performic acid
as described by Moore (60). Nine milliliters of 88%. formic
acid was added to 1 ml .of 30%hydr~gen peroxide, the mixture
let stand for one hour at room temperature and then cooled to
0°. Four milliliters of the resulti~g performic acid was
added to 40 !fig .of trichloroacet.i.c acid treated ferredoxin.
A precipitate was formed. The reaction mixture was left in
the cold room overn~ght. Then i~ was diluted fivefold with
water and lyophilized.
2.. S-Carboxymethyl ferredoxin:
Carboxymethylated ferredoxin was prepared as described
by Cres.tfield et ale (61). The reaction was carried out in
25. ml plastic bottles pr.ovided with screw caps. Two pieces
of na;Lgene tubes were inserted thro~gh the cap to serve as
inlet and outlet for nitr~gen. gas which was passedthro~gh

.33
the bottle thro~ghout'the reaction. Two milliliters of
ferredoxin (1.0 ~g) solution were taken in thebott.le and to
it was added 3.6 g .of recry.stallized urea, 0.3 ml of. 5% EDTAI •
solution, 3 ml of Tris-HClbuffer, pH 8.6, and 0.1 ml of
mer.captoethanol. The mixture was covered with 10 ml of 8 M
urea solution . Nitr~gen was. passed thro~gh the reaction
mixture, at room temperature, for 4 hours. The reaction
mixture which was reddish brown in the .b~ginni!1g hecame
colorless by this time. The contenta of the bottle were then
transferred, in the dark,. to a .beaker, and a solution of
0.27.gm of recrystallized iodoacetic acid in 1 ml of IN
NaOH was added. Nitr~gen was passed thro~gh the mixture
for 10 minutes. Then it was poured on top of a 4 x· 40 em
column of Sephadex G':-75 equilibrated with 0.02M ammonium
acetate and wrapped in aluminum. foil. The protein was eluted
from the column with 0.02M ammonium acetate solution as
s~sgested by Kresztes-N~gy and Ma~goliash (£2). Since the
column had a. good ·flow rate (40 ml per. hour), no air pressure
was used in elution. Fractions of 10 ml were collected and
the carboxymethylated protein was located in the eluate
fractions by measuri!1g the absorbancy at 280 mu. Fractions
containi!1g the protein were pooled and evaporated in a flash
evaporator. The residue was dissolved in 5 ml of watar and
evaporated to dryness under nitr~gen.
Determination of amino acid .composition:
The amino acid composition of the performic acid-oxidized
34
ferredoxin was determined .quant.itatively usi~g a Beckman
SpincoModel 120 .amino acid analyzer according to the instruc
tions. given by the manufacturer (Spinco Model 120-Instruc
tion Manual and Hand Books). A solutioncontainip.g about
0.05 micromole of ferredoxin was taken in a 16 x 150 mm
pyrex tube and evaporated in nitr~gen. A smallcry.stal of
phenol and 1 ml .of 6N HClwereadded to the tube .which was
then evacuated and sealed. The tube was heated at 110°. for
24 hours. The tube was then cooled, cut open and the HCl was
removed by evaporation under a stream of nitr~gen. The
dried hydrolyzate was then dissolved in pH 2.2 sodium citrate
buffer and aliquots of the solution were run in the lo~g
and short columns of the amino acid analyzer. From the
chr'omat~grams obtained, the .concentration of. each amino acid
was calculated by reference to standard chromat~grams from
runs· with standard amino acid mixtures.
The amino acid composition .of the S-Carboxyme.thylated
ferredoxin was also determined by the same procedure, after
24 hour hydrolysis.
Determination of the amino terminal amino acid.
The amino terminal amino acid of the proteil1 was iden
tified by two methods.
1. By using FDNB. The dinitrophenyl (DNP) derivative of
the protein was prepared accordip.g to Fraenkel-Conratet :al.
(63), the DNP protein was hydrolyzed, and the amino terminal
amino acid was separated as the DNP derivative.
35
Two. drops of FDNB re~gent and 0.1 ml of 95% ethanol
were added to a solution containi~g 0.2 micromoleof ferre
doxin in 1 ml of 1% aqueous sodium bicarbonate. The mixture
was shaken for· 4 hours .to .comple.te..the reaction and then
the excess of FDNB was removed by extraction with ether.
The residue was treated with 1 ml of 6N HCl and let stand
overn~ghtat 4° . The mixture was then centr.if:uged and the
supernatant was discarded. .The sediment was mixed with 1 ml
of 6N HCl in a pyrex tube. The tube was sealed under. vacuum
and then heated for 16 hours at 110°. After hydrolysis, the
reaction mixture was diluted with water and the .aqueous so
lution was shaken with ether to separate the ether-soluble
DNP amino acids. The yellow ethereal extract was dried,
dissolved in acetone and then chromat~graphed on a thin layer
of silica gel-G usi~g a mixture of chloroform,. benzy.l al
cohol and acetic acid (7: 3: 3 by. volume) as the solvent.
Standard DNP amino acids were used as reference. To detect
the presence of any water-soluble DNP amino acid in the hy
drolyzate, the aqueous phase of the hydrolyzate was separated
by thin layer chromat~graphy usi~g n-propanol-34% aqueous
ammonia (7:3 by volume) as the solvent system.
A dinitrophenyl derivative was also -prepared from ox·i-
dized ferredoxin. After hydrolysis of the DNP protein and
ether extraction of the hydrolyzate, theether~soluble DNP
amino acids were chromat~graphed on a Whatman No. 1 paper
usi~g 3% aqueous ammonia-tertiary amyl alcohol (1:1 by
36
volume) in one direction and 1.5 Mphosphate..buffer, pH 6,
in the second direction. Standard DNP amino acids were also
spotted on the paper, for chromat~graphy in the second direc
tion. The aqueous phase was separated by thin layer. chroma
t~graphy as before.
2. By using dansylchloride. The protein was treated with
dansyl chloride by the procedure .of Gray and Hartley (64),
the dansylated protein was hydolyzed and the dansyl amino
acid at the amino terminal was identified.
About 0.2 micromole of ,Oxidized ferredoxin, ·in 1 ml of
0.01 M.sodium bicarbonate solution, was taken in a 18 x 150
mm pyrex tube wrapped in aluminum foil. One .tenth of a
milliliter .of dansyl chloride (3 ~g in 1 mlacetone) was
added to. the protein and the nixture was shaken for 3 hours
at room temperature. It was then dried under a stream of
nitr~gen, mixed with 1 ml of 6N HCl and sealed under. vacuum.
Hydrolysis was effected by heati~gat 110 0 for 12 .hours.
The hydrolyzate was dried in a stream of nitr~gen, dissolved
in 2 .drops of acetone-acet.ic acid mixture and the solution
was spotted on a. glass plate .coated with a thin layer .of
silica. gel-G. Standard dansyl amino acids were also spotted
on the plate which was then heated. for 20 minutes at 110 0•
Thechromat~gram was developed usi~g the solvent system of
Nedkov and Genov (6·5), viz, chlor.oformethylacetate-methano:'
acetic acid (90:150:45:2 by volume). The dansyl amino acids
were detected on the plate by their fluorescence under a
37
u.v. lamp.
Determination of carboxy.terminal amino acid .
The carboxyterminal amino acid was identified by
hydrazinolysis, and by the action of carboxypeptidase enzymes
on the protein.
1 .. Hydrazinolysis. Hydrazinolysis of the protein was per
formed by the procedure of Bradbury (66) with sl~ght modi
fications. About 0.1 micromole of dry , native ,.ferredoxin
was mixed with 25 ~g of hydrazinesulfate and 0.2 ml hydrazine
(95%+), in a pyrex tube. The tube was sealed under reduced
pressure and then heated at 60° for 16 hours. After cooli~g,
the tube was cut and the contents were dried in a jet. of
nitr~gen. The residue was treated with 1 ml of 1 M acetic
acid and evaporated under nitr~gen. The resultant mass was
treated with 1 ml of acetone" and dried under nitr~gen. The
dry residue was dissolved in 1 ml of 0.2N sodium citrate
b:uffer, pH 2.2, and the pH of the solution was adjusted to
2 ..2 by addipg 1% HCl. Aliquots of the solution were analyzed
in the lopg and short columns of the Beckman Spinco amino
acid analyzer.
2 .. Digestion with carboxypeptidases. Carboxypeptidase di
gestion was carried out by a modification of the procedure
of Fraenkel-Conratet al. (63). DFP carboxypeptidase, pur
chased commercially, was suspended in water and centrif~ged.
The .sediment was suspended in 1% aqueous sodium bicarbonate,
and O.lN NaOH was added to the suspension till the enzyme was
38
comple.telysolubilized. The pH of the enzyme solution was
immediately reduced to 8.0 with 0.3 M acetic acid. The con-
centration of the enzyme in the solution was determined by
measuri~g the absorbancy at 278 mu (El % mu = 19.6).278
A solution of native ferredoxin, containi~g about 0.1
micromole of protein, was evaporated to dryness in a current
Of nitr~gen. The dry protein was dissolved in 2 ml of 0.1%
sodium bicarbonate solution. Solubilized DFP carboxypepti-
dase A was added to the protein solution taken in a tUbe, to
give a ferredoxin to enzyme ratio of 20:1. The reaction mix
ture was incubated, with shaki~g, at 40°,. for 24 hours.
Enzymic d~gestion was then stopped by addi~g 0.3 M acetic
acid to pH 3.0 and the contents of the tube were evaporated
under nitr~gen. Samples .of ferredoxin solution and enzyme
solution were also evaporated to be used as controls. The
dried carboxypeptidase d?-gest was dissolved in water and
the solution was divided into two parts, one part of the solu-
tion was dried ~gain,the dried mass was dissolved in acetone
and chromat~graphed on a Whatman No. 1 paper, in the descend
i!lg direction, usi~g the upper phase Of a butanol-acetic acid
water mixture (4:1:5 by volume) as the solvent. Standard
amino acids were also spotted on the paper as references.
The second part was evaporated under nitr~gen, the residue
was dissolved in pH 2.2 sodium citrate buffer and the solution
was used. for the quantitative analysis of amino acids in the
Beckman-Spinco analyzer. The control samples of oxidized

39
ferredoxin and carboxypeptidase A were also run in the amino
acid analyzer.
Oxidized ferredoxin, and carboxymethyl cysteinyl fer
redoxin .were also d~gested with carboxypeptidase. A, for
various intervals of time, and the amino acids liberated, in
each case, were determined quantitatively usi~g the amino
acid analyzer.
Enzymic d~gestion of the protein was repeated usi~g car
boxypept.idase B,instead ,of car.boxypeptidase A, to. detect
the presence of basic amino acids at the carboxyterminal.
Determination of Tryptophan content.
Tryptophan was estimated spectrophotomeiIically. Due to
the p:>esence of iron and sulfide in the molecule .of ferredoxin,
the ultraviolet absorbance of the native ferredoxin in the
280. to. 300 mu r~gion is much h~gherthan the combined ab
sorbance of the aromatic amino acids in the molecule. There
fore, tryptophan estimations .were carried out .with the native
protein,acid precipitat.ed protein, and with oxidized pro
tein. Three methods .were emplo.y.ed.
1. By action of alkali. Ferredoxin was dissoLved in O.lN
NaOH and the absorbancy .of. the solution at 280 and 294.4 mu
was measured. From the .absorbancy. values, the molar ratio of
tyrosine to tryptophan was calculated usi~g the Goodwin and
Morto~formula (67).
40
2. By. the action of N...;bromosuc cinimide in urea. In this
method due .to Funatsuetal. (68), a solution of. ferredoxin
in pH 4.6, acetatebuffer.,O. 2M, was treated with a milli
molar solution of N-bromosuccinimidein 8M urea . The .de
crease in absorbancy of the protein at 280 mu, due to. the
oxidation of tryptophyl residues, was measured and the extinc
tion due to tryptophan was calculated usi~g the empirical
factor. given by Patchornik et al. (69).
3. By the action of 6 Mguanidine hydrochloride. The protein
was dissolved in a 6 M solution of. guanidine hydrochloride
in 0.2 'M phosphate buffer, pH 6.5. The absorbancy of the
protein .solution at 280 and, 288 mu was measured and from the
absorbancy values, the tyrosine and tryptophan content were
calculated accordi~gto Edelhoch' s formula (70).
Basic hydrolysis. An attempt was made to estimate the trypto
phancontent of native ferredoxin, chemically, accordi~g to
the procedure of Noltmanetal. ·(71). About 6 ~g.of native
ferredoxin, in a 18 x 15·0 mm Vycor tube (No. 19800, Corni~g
GlassWorks, Cornip.g, New. YorkL was mixed with 0·.75. g of
Ba (OH) 2.8 H20 and 0.6 ml of water. The tube was cooled to
0°, evacuated, and sealed. Hydrolysis was carried out by
heatip.g the tube at 110° for 72 .hours. After cooli~g, the
tube was cut and the contents were transferred,byshaki~g
with hot water, into a 50 mlplastic. centrif~ge tube. The
barium ion in the mixture was precipitated by bUbbli~g carbon
dioxide,. generated from dry ice and water, thro~gh it. The
41
precipitate was removed by. centrifugation and the supernatant
was evaporated under reduced pressure .to 1 ml volume. This
liquid was filtered thr.o~gh a millipore filter and the. fil
trate was lyophilized. The residue was dissolved in pH 2.2
sodium citrate. buffer and aliquots of the ,solution were used
in the .short and lo~g .columns ,of the amino acid analyzer.
The try.ptophan content ;ofthe protein was calculated. from
the leucine recoveries and from the known leucine .content of
ferredoxin assumi~g equal destruction of these two amino acids
duri~g alkaline hydrolysis.
Finger print analysis .of taro and spinach ferredoxins.
For a general comparison of the amino acid residues in
taro and spinachferredoxins, the two proteins were hydrolyzed
with .chymotrypsin and the peptides liberated were .separated
either. by, electrophoresis followed by chromat~graphy, or by
two dimensional paper chromat~graphy. The number and Rf
values of the peptides were then determined by staini~g with
ninhydrin. The chymotrypsin was freed of any, trypsin actiVity
by II"'ior. treatment with tosyl lysyl chloromethyl ketone (TLCK
chymotrypsin) ass~ggested by Mares-Guia and Shaw ,(72).
About· 0.01 micromoleof TLCK chymotrypsin was added to
a solution of 0.5 micromole ,of a carboxymethyl cysteinyl
ferredoxin in 3 ml of phosphate. bUffer, pH 6.8. The mixture
was .continuouslystirred at 35° and the pH was adjusted and
then maintained at 8.0by the addition of O.IN NaOH. About
0.005 micromole more ,of the enzyme was added after, 2 hours.
,42
After 8 hours of d?-gestion, the reaction was terminated by
addi~g 1M acetic acid till the pH dropped to. 5. a. .The .solu
tion was evaporated ,to dryness and the dry residue was used
fore.lectrophoresis and chromat~graphy.
High voltage paper ele.c.trophoresis was conducted in the ap
paratus supplied by Enso, Salt Lake City. A portion of the
chymotryptic d?-gest was disso.lvedin pyridine-.ac.etic acid
water (100: 4: 900) buffer, pH 6.4, and the .solution was applied
to a Whatman 3MM paper as, de.scribed by. Bailey. (73). Elec
trophoresis was run in the same .buffer., for 2 hours, at 500
volts. The paper was then dried, and submitted .to chromato
graphy in thedescendi~g direction in butanol-pyridine-acetic
acid-water (30 :20:6: 2 VIV) • After, dryi~g the paper, in a
current of air, it was sprayed with 0.02% ninhydrin in ace
tone. The peptide spots appeared on warmi~g for a few minutes
at 60°.
':['wo dimensional paper. chromatography of thechymotryptic di-
. gest was carried out accordi~g to Tsuru et ale (74). The
sample spotted on a WhatmanNo., 3 paper was sUbje,c.ted to de
scendi~gchromat~graphyin n-hutanol-acetic acid-water
(4:1:2 V/V) in the first direction and in n-butanol-pyridine
water (1:1:1 by volume) in the second direction. The paper
was then dried and sprayed with 0.2% solution on ninhydrin
in butanol, saturated with water., Purple sp.ots appeared on
heati~g .the paper, at 100°, for a few minutes. After marki~g
the ninhydrin positive spots, Ehrlich re~gent was sprayed
.43
over the spots to detect peptides containip.g tryptophan.I
EPRstudies.
The electron param?-gnetic resonance spectra .of native and
reduced taroferredoxins were observed and recorded in a
Varian V-.4500-10 A EPR spectrometer with 100kcs. field modula
tions. Measurements were made at ambientC 25.0 ) and liquid
nitr~gen (-195.0 ) temperatures. .The instrument was .tuned. for
operation by followip.g the directions. given in 'Operatip.g
Instructions' (PUblication No. 87-114-200,. Varian Associates,
Palo Alto, California). The Klystron oscillator was operated
ata. frequency of 9.5 kMc and the attenuator dial of the x-
Band Micro Wave Bri~ge was set at 10 db thro~ghout the experi
ment. Ferredoxin solution (0.2 ml containip.g 3 ~g of protein)
in pH 7. o phosphate. buffer was taken in a quartz EPR sample
holder and placed in the samp.le caVity.
After adjustip.g the s~gnal thro~gh the oscilloscope, the
instrument was scanned for the detection of EP~ s~gnals in
the; field rap.geof1250 to 3750. gauss and the spectra of the
s~gnal was recorded. The sample was then mixed with 0.2 ml
of 0.1 Msodium dithionite(prepared in pH 7.0 phosphate and
stored in a helium atmosphere) and the spectra Of the mixture
was recorded in the same m~gnetic field rap.ge.
EPR measurements .were repeated at liquid nitr~gen tem
perature. The ferredoxin solution was taken in a cylindrical
quartz tube (3 x 250mm). The tube was closed with a serum
stopper and the air above the sample was replaced with hydro-
44
. gen. gas. After; freezi!1g ,the sample in liquid nitr~gen, the
tube was inserted in a specially construct.ed Nit.r~gen Dewar
placed in the EPR cavity. Gaseous nitr~gen was pas.sed
thr0'!lgh the cavity. to. insure that no water. vapour condensed
inthe..cavity. duri!1g the low .temperature operation.
The signals from the sample .were recorded in .the range. . .
.of m~gnetic. field from 1250 .to, 3750. gauss . The tube was then
removed from the Dewar and immediately dipped in cold water
to thaw the sample. Sodium dithionite solution was added
anerobically into the..tube, the mixture was: frozen and the
EPR spectra of thefrozeri mixture was recorded in the usual
m~gnet.ic. field ra!1ge.
The EPR spectra.of spinach. ferredoxin was also recorded
in the oxidized and reduced states at ambient and liqUid ni
trpgen temperatures. A separate measurement of the s~gnal
generated from sodium dithionite was also made.
RESULTS·
Purification of ferredoxin.
A summary of the yields and purifications obtained in
each step. of isolation,startip.g with 1.1 ~gof le.aves .is
given in Table I. The .aver~geyield was about 25 ~gof pure
protein from 1 ~g of le.aves. This yield compares. favorably
with the yield of ferredoxin from alfalfa (£2) ·and spinach
(75) . The yield was the same whether the .leaves were used
fresh or after a week's stor~ge in the freezer. However, a
decrease in ferredoxin content was noticed when the leaves were
harvested in theevenip.g rather than in the mornip.g. Tris-HCl
buffer, pH 7.5, was used in the hom~genization of the leaves,
since low yields were nbtained in some of the earlier studies·
where distilled water was used for hom~genization. Dialysis
was .avoided to reduce the time required for purification.
The purified protein was stored under hydr~gen to prevent
oxidation and consequent deactivation, by air. For most of
the work, it was convenient to store the protein as a con
centrated solution in the buffer, instead of as a lyophilized
solid. The protein samples were usually used within a month
after their preparation.
Electron transfer activity Of. ferredoxin.
F?-g. 1. gives the relation between the amount of NADPH
formed and the concentration of protein added, with different
preparations of taro ferredoxin,usip.g the photoreduction
46
assay of San Pietro (4.0). In .this assay,. one unit .of. fer
redoxin activity is defined as "the amount which produces a
cha~gein optical density of 1. Oin 10 minutes at. 340 mu
when the reaction mixture contains' 0.1 !fig of. chlorophyll per
3 ml". When absorbancy measurements were made without .cen
trif~gi~g the reaction mixture,. tiny chloroplast particles
floated in the solution and inter.fered with the .measurements .
.Therefore,. the reaction mixture wascentrif~gedto .sediment
the particles and the supernatant was used. The maximum
activity. observed was 29, units per. ~g (F~g. 1,. curve A) with
a sample. of taro ferredoxin which had a 420 ,to. 27.7 muab
sorbancy ratio of 0 ..43. This corresponds to..the reduction
of 139 micromoles of NADP per ~g of ferredoxin, per ~g of
chlorophyll in 10 minutes. The specific activity of spinach
ferredoxin de.termined with Swiss chard chloroplasts was com
parable .to that of .the taro protein.
The activity of. ferredoxin decreases with ~gi~g. Curve
B' repre.s·ent s the NADP photoreduction by an ~ged preparation
of ferredoxin with a, 420, muto 277 mu ratio of 0.38. The
activity of the sample was 15,.3 units per '~g. The specific
act.ivity of a sample with a 420 mu to 277 mu abso,rbancy of
0.40 .was 22.5. CurveC represents. the photoreduction act,ivity
of the .supernatantobtained,after ammonium sulfate frac
tionation, in the course of pur,if.icat.ion of ferredoxin.
Curve D was obtained with one ,of the earlier, fractions eluted
outduri~g the DEAE-cellulose column chromat~graphic purifi-
cation.of.ferredoxin . The low .activ.ity with .these. fractions
is due.to..the pre.sence .of other proteins as contaminants.
Absor.ption spectra. Pure .ferr.edoxin is red in color and the
spe.ctrum of the prote.inshowsabsorption maxima .at 465,420,
330, and 277 mu. Durip,gtheisolation of. ferredoxin, the
purific.ation ache.ived in each step can be followed by record
ip,g the .absorption spe.ctra of therespe.ctive preparations.
The .spectra of crude .ferredoxin preparations show an absorp
tion maximum near 260 mu,. but no absorption peaks in the
visible .spectral r~gion. As the protein preparation. gets
more .and more purified, absorption maxima appear in the. vi
sible r~gion and the 260 muabsorption peak in the ultra
violet r~gion is shifted .toward 27.7 mu. F?-g. 2. gives the
absorption spectrum of .pure taro: ferredoxin and .of a sample
of spinach ferredoxin prepar.ed in our laboratory and F?-g. 3,
the absorption spectra of three; ferredoxin fractions in dif
ferent st~ges pf purification.
Table II. gives the ratios of absorbancy of taro.fer
redoxin in the visible and near ultraviolet r~gion to. the
absorbancy in theultravioletr~gion. For comparison, the
correspondip,g ratios of some other plant ferredoxins are
also included in the table. It has been s~ggested .that the
h?-gher ratio of absorbance in the visible r~gionto that in
the ultrav.iolet r~gion pf parsley and brassica.ferredoxins
is due .to the absence .of try.ptophan residues in these fer
redoxins .(27).

48
Electrophoresis.
Starch. gel e.le.ctrophoresis was run to det.e.ct the pre
senceof ~ggr~gated molecules of ferredoxin, and other im
purities in the preparation. The presence .of polymers has been
reported in the spinach protein at pH 2.2 by. Appella and San
Pietro (29), and in ·alfalfa ferredoxin .( free from labile
sulfide). by Keresztes-N~gy and Ma~goliash (6.2). Electro
.phoresis on starch. gel with a fresh preparation of taro, fer
redoxin (.420 :277 mu absorbancy = .0 .43) revealed only a si~gle
pr.otein band (F;i.g. 4a). The band appeared dark on a blue
bac~ground onstaini~g and had m;i.grated about 5 cm in the 7
cm. gel strip in three. hours of. electrolysis . This indicates
the protein is free from polymers. (The protein was shown to
be the monomer by molecular we;i.ght determination of the sam
pIe) . However, .when theele.ctrophoresis was repeated usi~g
an ~ged preparation (stored aerobically) with a 42.0.: 277 mu
absorbancy ratio .of 0.38, a very l;i.ght, slow movi!1g band was
seenal0!1g with the main band (F;i.g. 4b). .Whe·n the band had
moved 68 mrn from the or?-gin,the minor .component had moved
65 mm. .This slow movi~g band may be due .tosome ~ggr~gated
molecules of ferredoxin formedduri~g·stor~ge.
Free. boundary ele.ctrophoresis was performed mainly during
the. earlier st~ges of the work to .test thehom~genity. .of the
ferredoxin preparations isolated from t'aro leaves. Whenever
more than one peak appeared in the electrophoretic runs, such
samples were eitherrej.ec.tedor rechromat~graphed. The chief

49
contaminants in these samples were proteins .of h~gh ,mobility
than ferredoxin. The ferredoxin peaks were not well defined
due to the h~ghcolor of the preparations used. Si!1g1e peaks
movi!1g with a fairly h~gh velocity were obtained with samples
purified, by Sephadex G;.,75 chromat~graphy. The mobility of
the pure protein at' 0°, .at pH 7.0 in phosphate.. buf.fer. of ionic
5 2 -1-1stre!1gth 0.1, was 10 .Ox 10'- cinsec volt . The mobility
of native alfalfa ferredoxin in phosphate buffer of ionic
stre!1gth 0.1 at pli 7.2, is 15.6 x 10⁻⁵ cm2 sec- l volt-l (Ref
erence £2), and that of spinach ferredoxin is: 7.57 x 10~5 cm2
-1 -1sec . .volt , in phosphate buffer o.f ionic stre!1gth 0.1 and
pH 7.0 ,at 4° (Reference 29).
Polyacrylamide gel electrophoresis.
Electrophoresis on polyacrylamide gels was very conve-
nient for a rapid analysis of the protein fractions eluted
duri!1g the chromat~graphic purification of ferredoxin. The
fractions were first run thro~gh the standard. 7.5%. gel which
separated proteins in the molecular we~ght ra!1ge 400,000
10,000. The colored bands formed on electrophoresis were ob-
served directly and the colorless proteins were detected
afterstaini!1g the. gel. Preparations which were found homo
geneous in the standard. gel were further examined by electro
phoresis in the small pore 30%, gel which resolved compounds
in the molecular we~ght ra!1ge of 10,000 - 3,000.
F~g., 5 shows the bands o.btained on electrophoresis of
taro and spinach ferredoxin samples purified by Sephadex G;.,75
50
chromat~graphy.Electrophoresis in the standard, gelre
vealed only a sip.gle red band movip.g'alop.g with the 'marker
dye. But, when the, gels were stained with amidoblack, three
faint bands lyip.g close t~gether were seen midway between
the or~gin and the position ,of the major. band (F~g .. 5a).
When traced in a densitometer, the total absorbance due to
these three bands was less than 1% of the absorbance of the
major band. The interestip.g observation was that the band
patterns were identical in spinach and taro, ferredoxins.
Thecalorless components responsible for the minor bands may
be due to. decomposition products ,of. ferr.edoxin or artifacts
,of isolation procedure. Garbett.et ale (76) have reported
the pre,sence of traces ,of impurities, probably poly-phenolic,
in spinach and parsley: ferredoxins.
Electro.phoresis in 30% acrylamide gel(F~g.. 5b)showed
only a sip.gle red band with an Rf. value (ratio .of distance
moved in the, gel by the protein to the distance moved by the
marker dye) of 0,.75. Ma?=,goliash has observed (personal com
munication to Dr. H. F. Mower) different,g;enetic variants of
ferredoxin in the protein isolated from alfalfa. If the
taro preparation contained such variant forms of, ferredoxin,
they would have shown up' as separate bands durip.g electro
phoresis in 30%.geJ. provided they possessed different mole
cular we~ghts or net cha?=,ge. However, the absence .of mUltiple
bands .does not prove that the, ferredoxin consists of hom~geneous
molecules with identical amino acid sequences.
·51
Chemical composition of. ferr.edoxin.
A freshly prepared solution of ferredoxin,. found homo
. gene.ous by electrophoresis ,and with a 420 to. 27.7mu ab
sorbance ratio of 0 ..43 was used for the followi!1g determina
tions as described under methods.
1. Determination of dry we~ght and ash content.
2 .. Determination of nitr~gencontent.
3. Estimation of iron and sulfide.
4. Determination of extinction coefficients at wave-
le!1gths of maximum absorption.
5. Determination of protein usi!1g Folin-Ciocalteu
re~gent.
The we~ghtofdry protein obtained from 2 ml of ferre
doxin solution after. extensive dialysis ~gainst distilled
water, .evaporation, and dryi!1g at 60°, was 15.6 + 0.3 ~g.
The ash content of the dry res~due after ~gnition to con
stant .we~ght at 600°, was 3.6%. The ash contained 2·6% iron
which corresponds to 37% Fe203·. The amount of ash in the
protein, not accountable as Fe 203
is, therefore ,.2.3%.
The nitr~gen content, from duplicate Kjeldabl determin
ation, was 14.4%.
Iron analysis was performed, on the dry ash after di-
gestion with acid and on the native prote~n after treatment
with dilute acid. The amount of iron in ferr.edoxin, estima-
ted; from analysis of the aSh, was 0.90 :!: 0 ..03%. Direct analy-
sis of nat~ve. ferredoxin. gave a value for the iron content of
52
o..93± 0 ..03%. In the assay system used, .the .absorbancy .of·
the.ferrous-bathophenanthroline. complex at 533 mu, ,whenche
reaction mixture .contained one micromole of iron, was 0:..275.
Thisc'orresponds to a molar. extinction coefficient of 23,000
at. 533 mufor the iron-dye complex in isoamyl alcohol. With
the standard iron solution, results of duplicate. de.termina
tions !lgreed within + 1%. The ferredoxin solution used, for
iron analysis contained 3 to 5 micr~gramof iron per milli
liter.
The inorganic sulfide content of the ferredoxin prepa
ration was 0.53% or 2 atoms .ofsulf.ur per 12,OOO.g of pro
tein. In this assay system, the methylene blue: formed from
one micromole of sodium sulf.ide. gave an absorbancy of 8.0 at
670 mu. This extinction' value is 15% lower than that re
ported by Lovenbe~getal. (44). This may be due to. sl;i.ght
differences in the temperature at which the reaction was
carried out and in the pH .of. the re~gents used, as mentioned
by F~go and Popowski (43). H;i.gh concentrations of sulfide
inhibit the formation .of methylene blue color and, there
fore, sulfide determinations were carried out usi~g, ferredoxin
solutions which. gave a linear relationship between the ab
sorbancy..of the methy.lene blue formed and the concentration
of protein added .
. . Protein concentration .of,ferredoxin preparations was
determined in many. cases, ,usi!1g the Folin-Giocalteu re~gent
with .bovine serum albumin as reference standard. It was
· 53
found that the dry we;ightof the protein was; 74 ± 3% of that
de.termined by. colorimetr.ic method. This conversion fac.tor
(0. 74.g per, g) was .ther,efore used for calculatipg the true
we;ight ot ferredoxin from the value obtained wi.th the Folin
Ciocalteure~gent. Our spinach ferredoxin 'preparation also
gave a h;ighercolor yield in the assay ,comparable. to .that
pf the taro protein.
Chou and Goldstein .( 77) have attributed the la~gecolor
increments. given by some pro.teins in .the alkaline ~opper re
action to the presence of sequence of amino acids .containipg
functional 'chains, and to a~ginine, histidine and glutamic
acid residues which are h;ighlychrom~genic in peptide link
~ges. One mole of ferredoxin (call,ObO,g) contains one
histidine, one a~ginine and 16-17. glutamic acid (or, glutamine)
residues. The same we;ight of bovine serum albumin contains
approximately .three histidine, four a~ginine and 13. glutamic
acid (or. glutamine) residues accordipg to the data, given by
Putnam (78). These amino acids by themselves are not, there
fore, responsible for the enhanced color yield with ~erre
doxin with respect to bovine serum albumin as standard. The
enhanced yield may therefore be due to certain peptidese
quences, a relatively h;igher serine,tryptophan and valine
content, and the presence of iron and ino~ganic sulfide in
ferredoxin. It may be mentioned in this context .that the
amino acid sequence of spinach ferredoxin worked out by
Matsubara et al.(75) shows two tripeptides with .the Glu-Glu-

54
Glu .sequence.
Lovenbe~g .et ale (44.). have reported that the dry we~ght
of salt-free Q. pasteurlanum. ferredoxin was 70% of that de
termined by the colorimetric protein method. The bacterial
and plantferredoxins ther.eforeseem to have some common pep
tide sequences which are responsible for the enhanced color
y.ield.
The ratio of absorbancy of ferredoxin at wavele!1gths of
maximum absorption is. given in Table II. The molar extinc
tion coefficients of ferredoxin at difference wavele!1gths
calculated. from the absorbancy value and .the iron content ,
assumi!1g that a molecule Of. ferredoxin contains two atoms
of iron, is given in Table III.
The absorbancy of the protein solution was measured
also at 280 and 260 mu . The ratio .of absorbancy at 280 to
260 mu was 1.12. The protein concentration of the solution
was calculated from this data usi!1g the formula of Warbu~g and
Christian quoted by Layne .( 79) • The dry we~ght .of the pro
tein was 65 :!:4% of that determined by the spectrophotometric
method. The result was the same with spinach ferredoxinal
so. The s:r:>ectrophotometric method is based on the assumption
that .the ·ultraviolet absorption of a protein at 280 mu is
mainly due to the tyrosine and tryptophan residues, bqt a
la~ge. fraction of the 280 mu absorption of ferredoxins is not
accounted by the constituent aromatic amino acids. There
fore, we can expect a disc.repancy between the true we~ght of
-55
ferredoxin and ,the we?-ght calculated, from the ultr,aviolet
absorption by the method of Warbu~g and Christian.
Mole'cularWeight Determinatio'n.
Gel £iltration. The relation between thel~g of mole
cular we?-ghts of proteins and the ratio of their elution
volume to void volume (V/Y ) during gel filtration is illus-o ..
trated in F?-g. 6. 'Taro ferredoxin was eluted from the gel
column just b,efore cytochrome c. The molecular we?-ghtof
ferredoxin with r,eferenceto the standard curve is approxim
ately 13,000. Duplicate runs were made with thestandar~s
and ferredoxin and no difference in elution volumes were ob-
served.
Sedimentation Analysis. The absorbancyat 280 'mu of the
protein, fractions sedimented in ,the sucrose, gradient is. given
in F?-g.; 7. Measurement of the 420 to 277 'fiU absorbancy ratio
.of the ferredoxin in the. gradient showed that ,the protein
did notunde~go any deterioration duripg the centrif~gal
run. Ferredoxin and cytochrome c sedimentedto the same ex-
tent. The ratio of the distances traveled from the meniscus,
R, ,(51) by ferredoxin and cy,tochrome c, was 1.0., The R
value .o~ ferredoxin with respect to trypsin was 0.60. The
sedimentation constant.of ferredoxin', calculated on the basis
of an s20,w =1.838 for cy,tochrome c (80), is 1.8S and with
reference to an s20,w = ,2.,48S, ,for trypsin (.81) ,is 1. 5S.
The sedimentation constant determined by directultracentri-
f~gal analysis was 1.36S ,for spinach PPNR (29), 1.65S, for
On this basis, ferre-
56
alfalfa. ferredoxin (.62) and 1.55S for Euglena. gracilis ·PPNR
(82) . It is seen that .the S value of taro. ferredoxin is close
to that of otlrer plant ferredoxins.
Martin and Ames (Sl) have calculated approximate mole-
cular weights of prote~ns.from their sedimentation ratios. .sl ( MWl)2/3
usipg the relatlon - = MW ..s2 '. 2 .
.doxin has a molecular we~ght of approximately 12', boo .± 1, 000
with reference to a molecular we:~ght value of 12,300...for the
cy.to.chrome c (S~gma Chemicals) and 24, 000 for the trypsin
used in the exp~riment.
The molecular we~ght of. ferredoxin calculated from its
amino acid composition and iron and sulfide content is be-
t.w.een 10.,.700 and 11, 000.
Action of sodium dithionite on the absoJ;J?tion spectra.
Sodium dithionite solution (5 ~g per ml of Tris bUf.fer,
pK 7.8) was added in small aliquotsto a solution of £erre
doxin( ca 1. 5 ~g) in a 3 'ml apsorption cell. The .contents
of .thecell were mixed immediately and the absorption measured
at .420. mu. The maximum loss in absorbancy at.42o. mu, after
correcti~g for dilution, was. 51%. When the experiment was
repeated under anaerobic conditions, the absorbancy decrease
was 49%. In both cases, the~final mixture .contained more than
hundred.-fold molar excess of. dithionite. These results are
in ~gree~ent with those of Whatley et al. (B3) and Fry et al.
(84). where a 50% loss.of·420 mu absorption was observed with
spinach ferredoxin reduced with dithionite. Sobel and Loven-
· 57
be~g (.85) have observed a 5·4% loss or absor.ptionat415 mu with
dithionite-treated 2... pas.teu·rianuIl1;ferredoxin and Malkin and
Rabinowitz .(22) have reported. a 51% decrease in absorption
with 2... acidi-urici ferredoxin when treated with dithionite.
Tho~gh .the. chemical chap.ges accompanyip.g thedithionite' re
duction were not invest~gated in detail, it .isinterestip.g
to note..that .the .behaviour :of bacterial and plant ferredoxin
toward the re~gent was similar.
The ferredoxin samples. treated with sodium dithionite were
examinedafterstor~ge.at 4° ,overn~ght. Theaer.obically
maintained mixture lost ,83% of its absorption (prior to
stor~ge). at .420 mu while the anaerobic sample lost· only 33%
of its prestor~ge absorption. The absorption spectra .of
dithionite-treatedferredoxin,before and after incubation at
4°, are shown in F~g. 8. When a la~ge excess of dithionite
(ca 500 molar) was added to..fer·redoxin, in air ,at room
temperature, the p:'otein was irr.eversibly bleached within an
hour. The splectrum of the protein after removal of the di
thionite. by dialysis ~gainst water showed no visible absorp
tion,. but the 277 mu peak in the ultraviolet was shifted to
267 mU(F~g. 9). A s~mil~r shift in the U.V. peak was ob
served by T~gawa and Arnon (15) with spinach ferredoxin after
reduction with hydr~gen and C. pasteurianum hydr~genase.
This shift cannot .be due to pH reductionoccurrip.g in the
mixture since even trichloroacet.ic acid-treated: ferredoxin
retained the peak near 277 mu.It is possible .that treatment
58
with excess .of sodium dithionite resulted in the .loss .of
iron and labile sulfide,fr'om the protein.
Action .of 8 M urea on the .absor.pt.ion spectra..
The absorption spectra .of taro.ferredoxin(ca 1.4 ~g
in 3ml) in 8 M urea (pH > 6) was recor.dedfollowi~g f.ive
minutes of aerobic and anaerobic incubation at room tempera
ture . The spectra in both cases showed a peak 'around .455 mu
in place ,of the usual 465 mu peak observed in native .ferre
doxin. Since there was no pr.evious mention of this type of
ahsorbancy shift in the literature, the experiment was re
peated with spinach, ferredoxin. The spectralsh.ift in the
visihle r~gion was observed with spinach ferredoxin also.
This. clearly s~ggests that some .conformationalcha!lgeo.ccurs
in the plant ferredoxin molecule on treatment with 8 M urea.
Garbett.et al.( 76) have reported a cha!1ge in the circular di
chroism of spinach ferredoxin on treatment' with 8 M urea.
These authors s~ggest that "the effect of urea is pre:sumably
to alter the helical nature of the protein around the non-heme
iron chromophore".
The urea-Fd mixtures were examined ~gain after incuba
tion at 40 for 40 hours. The spectra of the samples are
given in F~g. 10.. The. ferredoxin kept exposed to air lost
most of its, visihle absorption, while the anaerobically kept
sp.ecimen lost about half of. the. visihle ahsorption. A solu
tion of. ferredoxin in phosphate .bu.ffer, ke.pt as a .control, re
tained most of ita visible absorption underidenticalcondi-

59
tions (F:ig. 10·). The .absorbancyat 277 mu was not altered.
in all 'cases as is illustrated in Table IV.
Malkin and Rabinowitz (86) have repor.t.ed recently that
a de~rease in' 415 mu absorption occurs in C. acidi-urici
ferredoxin when it is incubated for· 60 minutes. with 4 .M..guani
dine hydrochloride or 6.4 M urea, .the decrease .heipg. greater
under aerobic than anaerobic conditions . The iron.of .this
ferredoxin was more readily .available for chelatipg ~gents
in the presence of denaturipg ~gents than it was with the
native protein. Brumby.et ale (.87) haveohserved the pro
gressiveloss of iron and visible absorption wi.th xanthine
ox~dase when the protein was incubated with urea. A similar
loss of iron from .the molecule of tar~ ferredoxin could have
occurred on prolopgedincubation of the prote~n in 8 M urea.
Phosphoroclastic assay.
F:ig. 11 shows the relation between the amount of acetyl
hydroxamate formed and the concentration of. ferredoxin used
in .the phosphoroclastic assay. The. 390 to. 280 mu absorbance
ratio of the bacterial protein used was 0· ..73 ,and the .420 to
277 mu absorbance ratio of the taro protein, was 0.38.
Lovenbe~g et ale have defined a unitof. ferredoxinactivity
in this assay as "the amount needed to. effect achapge of
1.0 .in the absorbance of 540 mu" and is equivalent .tothe
amount of. ferredoxin which produces 6 micromoles .of acid
hydroxamate per 10 minutes. The activity. of our bacterial
ferredoxin was 11 units per ~g. If we assume the molecular

60
we~ght .of .the plant pr.otein .to..be .double .that ;Of .the hacterial
p:rotein,..then bacterial. ferredoxin is four times as active
. as plant ferredoxin on a .molar basis. Valentineetal. (88)
... have .observed that Q. pasteurianumferredoxin is'..four times
as active as spinach ·PPNR is theclev!3-ge of pyruvate by
clastic. extracts on a we~ght basis. It should .be. emphasized
here that the bacterial and plant. ferredoxins used were de
ter.i'or.ated samples and the. values obtained by :the assay have
onlyqualitat.ive s;Lgnificancein provip.gthat t'aro ferredoxin
can substitute in the electron transfer reaction of bacterial
extracts.
Titration with mercurials.
It is difficult .to det.erminethe exact number. of sulfide
and sulfhydryl. groups in ferredoxin by spectrophotometric
titration. This is in part :due .to the sensitivity of ferre
doxinto. exposure to air .We have. found a decrease in sul
fide content with taro. ferredoxin samples..of low 420, to. 277
mu absorbancy ratio « 0 ..43) .To minimize..the. oxidation .of
thepr.otein, the titrations were carried out in a hydr~gen
atmosphere, as described under methods.
The .standards used, reduced. glutathione and .sodium sul
fide,. combined with stoichiometric amounts .of CMB and mersalyl.
The molar extinction co.e.fficient ;Of the CMB-SHcomp.lex in
phosphate b:uffer, pH 6.5, was approximately. 7 x 10³ with re
duced. glut.athione. The results ;Of CMB and mersalyl titra
tions with different ~erredoxin preparations ·are.given in
61
Table V. The su,lfide content,. de.termined. by. the F~go and
.Popowski method (43), .and the .420. ,to. 277 muabsorbancy ratio
.ofsome ;of the preparations are also IDcluded in .the table.
F;i.gs .12 .and 13 show the relation between theabsorbancy ;Of
the mer.cury-SR comp.lex and the..concentration ;Of mercurials
added.
It is evident from the results that: (1) both CMB and
mer.salyl react to the same extent with. ferredoxin; (2) urea
does not expose any. buried SR, groups since .there was no ap
preciable.cha~ge in the titre in the presence of 8 M urea,
and .(3) the number ;Of moles of mercurial reacti~g with a mole
.of. ferredoxin decreases with decrease in relat.ive visible
absorpt.ion of the protein. The maximum number ;Of moles. of
mer.curials reacti~g with a mole .offerredoxin .is e;i.ght with
taro, and nine with spinach.
Thecorrelationbet.ween the loss in visible and near
U.V. absorbancy of taro; ferredoxin and the amount of mercurial
reacted with the protein i.sillustr:ated in F;i.g. 14 . The de
crease in visible .absorbancy paralleled the increase· in ah
sorbancyof. the protein-mercurial complex at 255mu. The
visibleabsorbancyof.-the protein was not comple.tely lost
when the sulfide and sUlfhydryl. groups were .completely ti
tr.ated. However, the spectrum .ofthe protein .after dialysis
of the reaction mixture ~gainst distilled waters.howed no
absorbancy in the. visible r~gion. Analysis .of this protein
solution showed the absence of both iron and labile..sulfide
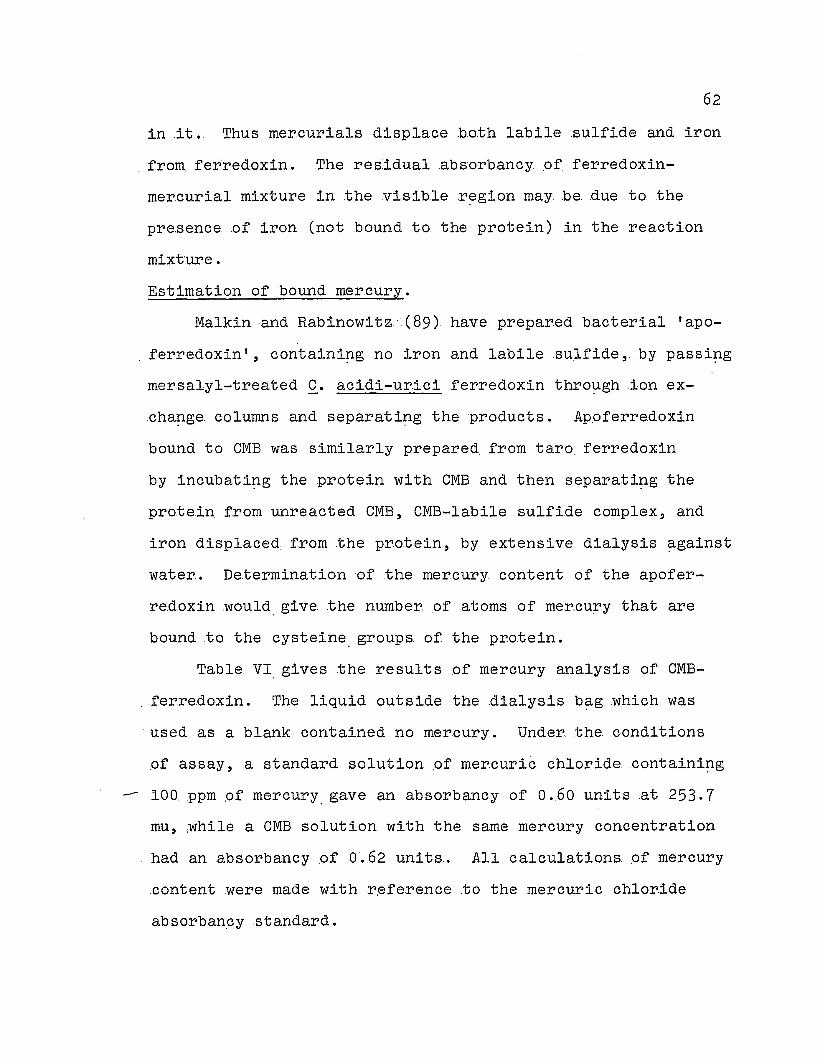
62
in .it • Thus mercurials displace .both labile .sulfide and iron
from. ferredoxin . The res.idualabsorbancy. .of. ferredoxin
mer.curial mixture in the visibler~gionmay. be. due to the
presence of iron (not bound to the protein) in the reaction
mixt·ure.
Estimation of bound mercury.
Malkin and Rabinowitz.(8g) have prepared bacterial 'apo
ferredoxin', containi~g no iron and labile sulfide,. by passi~g
mersalyl-treated Q. acidi-urici ferredoxin thro~gh .ion ex
cha~ge.columns andseparati~g the products . Ap.oferredoxin
bound to CMB was similarly prepared. from taro. ferredoxin
by incubati~g the protein with CMB and then separati~g the
protein from unreacted CMB, CMB-Iabile sulfide complex, and
iron displaced from .the protein, by extensive dialysis ?-gainst
water. Determination of the mercury content of the apofer
redoxin WOUld, give the number .ofatoms of mer.cury that are
bound to. the cysteine, groups of the pr.otein.
Table VI, gives the results .of mercury analysis .of CMB
ferredoxin. The liquid outside the dialysis b?-g which was
. used as a blank contained no mer.cury. Under. the. conditions
.of assay, a standard solution .of mercuric chloridecontaini~g
100. ppm .of mercury, gave an absorbancy of 0.60 units at 253 . 7
mu, while a CMB solution with the same mercury. concentration
had an .absorbancy .of 0.62 units. All calculations .of mer.cury
content were made with r,eference .to the mercuric chloride
absorbancystandard.

.63
From the table ,.itisc.1earthat .the maximum number .of
mer.cury .atoms bound to. theap.oferre.doxin is. four. The, fact
that the apoferredoxin contained hound mer.cury..even when
the native protein was incubated at a CMB: Fd ratio .of· 4 :1,
shows that both the .su1fideandsu.1fhydry1, groups react si
mUltaneously with the mer.curia1.
The CMB-ferredoxin .reaction was allowed to proceed only
for. 30 minutes. If the protein is incubated. for a lop,g pe
riod,there is a possibility .of amino acids other than cys
teine.combinip,g slowly with the mercurial, especially when
there is excess of re~gent present ·(55).
Titration with DTNB.
The..eff.ect of 4 M guanidine hydroch1or.ide on the pr.otein
was studied by titration ,of the' .protein ~gainst DTNB in the
presence Of the denaturi~g ~gent. The reSUlts, shown in
Table VII are only ,of .qua1itat.ive s?-gnificance. Both
standards used, cysteine and .sodium SUlfide, reduced the
re~gent rapidly andsto.ichiometrica11y under all conditions
.of titration. But, the color .of the r.educed re~gent .b~gan
to fade. gradually after about. 30 minutes, as ju~ged by. the
loss ~ofinabsorbancyat412mu. .The reaction between. fer
re.doxin and DTNB in the presence of 4 M. guanidine hydrochlo
ride was also ver.y, fast, .tho~gh all cysteines 'and ino~ganic
sulfides were not t.itrated. The. color .ofthe DTNB-Fd mixture
also, faded ~after. 30 minutes ,as illustrated, .in F?-g. 15.
The reaction between the native protein and DTNB was. very
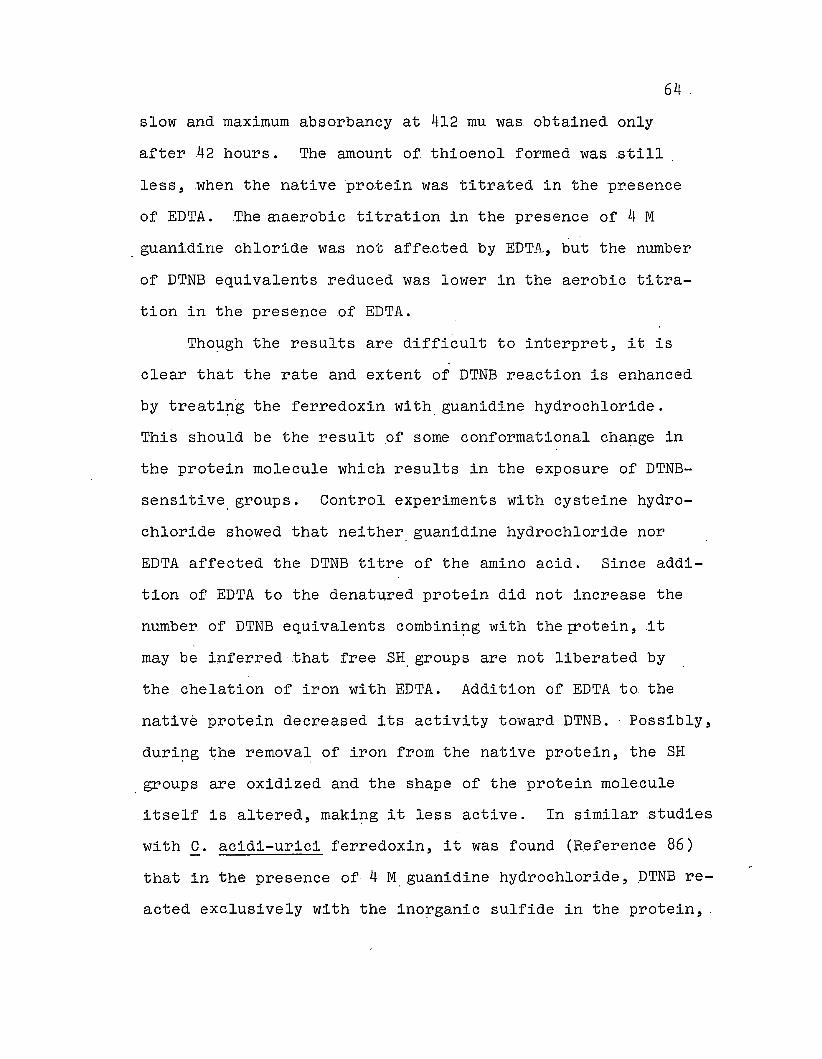
64
slow and maximum absorbancy at 412 mu was obtained only
after 42 hours. The amount of thioenol formed was still
less, when the native pro.tein was titrated in the presence
of EDTA. The maerobic titration in the presence of 4 M
guanidine chloride was not affe,cted by EDTA, but the number
of DTNB equivalents reduced was lower in the aerobic titra
tion in the presence of EDTA.
Tho~gh the results are d~fficult to interpret, it is
clear that the rate and extent of DTNB reaction is enhanced
by treati~g the ferredoxin with, guanidine hydrochloride.
This should be the result of some conformational cha~ge in
the protein molecule which results in the exposure of DTNB
sensitive, groups. Control experiments with cysteine hydro
chloride showed that neither. guanidine hydrochloride nor
EDTA affected the DTNB titre of the amino acid. Since addi
tion of EDTA to the denat~red protein did not increase the
number of DTNB equivalentscombini~gwith the p:'otein,it
may be i:nferredthat free SR. groups are not liberated by
the chelation of iron with EDTA. Addition of EDTA to the
native protein decreased its activity toward DTNB. Possibly,
duri~g the removal of iron from the native protein, the SR
groups are oxidized and the shape of the protein molecule
itself is altered, maki~g it less active. In similar studies
with C. acidi-urici ferredoxin, it was found (R~ference 86)
that in the presence of 4 M guanidine hydrochloride, DTNB re
acted exclusively with the ino~ganic sulfide in the protein, .
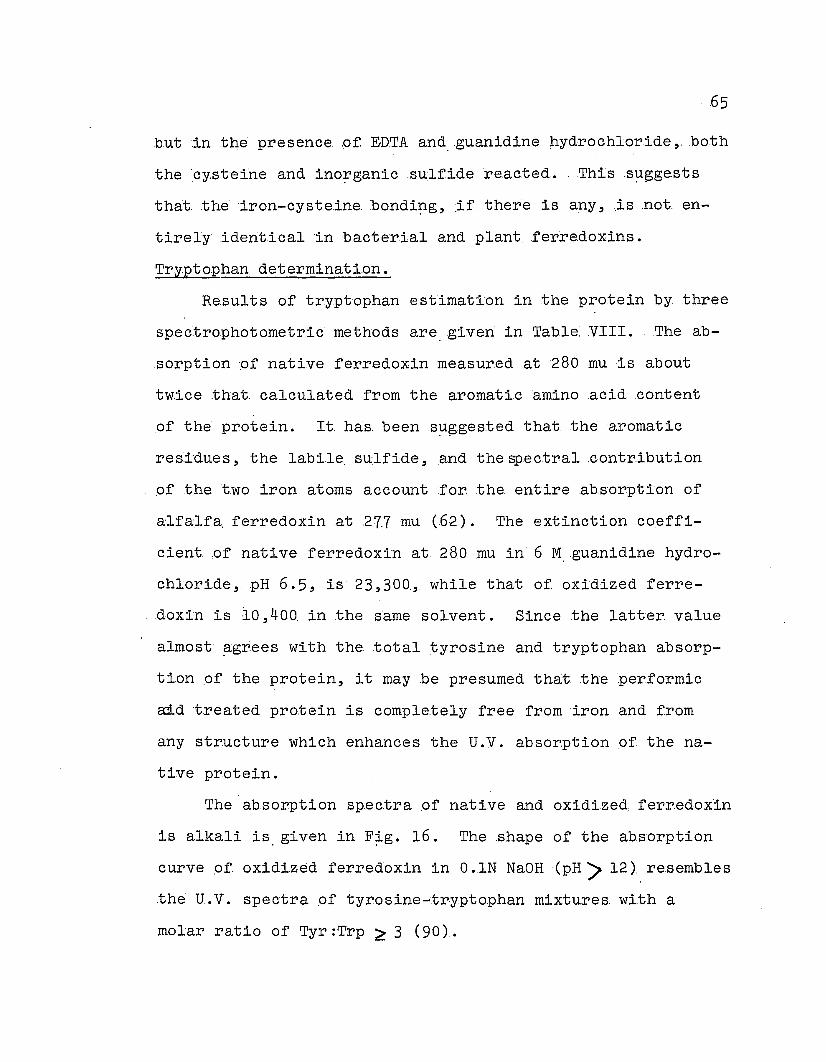
65
but.in the presence ..of EDTA and .guanidine. hydrochlor.ide,..both
the :cy.s.teine and inorganic .sulfide re.acted.Thissuggests, ' .
that .the ·iron-cysteine. :bondi~g, :if there is any ,.is .not. en-
tirely identical in bacterial andplantferre.doxins.
Tryptophan determination.
Results of tryptophan estimation in the protein by. three
spectrophotometric methods are, given in Table: VIII. .The ab
sorption of native ferredoxin measured at 280 muis about
tw.ice that calculated from the aromatic amino acid .content
of the protein. It has been s~ggested that .thearomatic
residues, the labile sulfide ,and the spectral .contribution
.of. the two iron atoms account for the entire absorption of
alfalfa. ferredoxin at 27,7mu (62).. The extinctioncoeffi
cient.of native ferredoxin at 280 rou in 6 M,guanidine hydro
chloride, pH 6.5, is 23,300, while that of. oxidized ferre
.doxin is 10,400 in the same solvent. Since .thelatter. value
almostagr.ees with the total t;yrosine and tryptophan absorp-, .
tion pf the protein, it may be presumed that the performic
.ECi..dtreated pro.tein is comple.telyfreefromiron and from
any structure which enhances the U.V. absorption.of the na
tive protein.
The absorption spec.traof native and oxidized ferr.edoxln
is alkali is, given in F?-.g. 16. The .shape of the absorption
curve pf oxidized ferredoxin in O..lN NaOH (pH> 12). resembles
the U.V. spectra of tyrosine-tryptophan mixtures. with a
molar ratio of Tyr :Trp ~ 3 (9D).
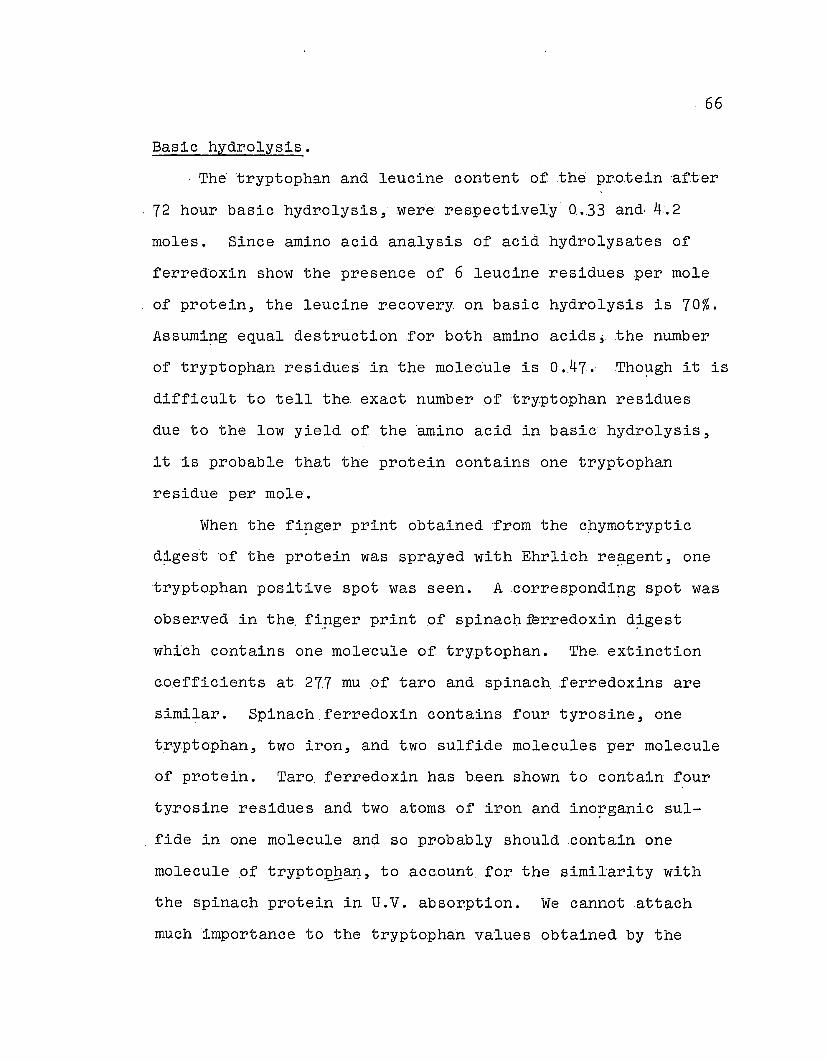
66
Basic hydrolysis.
The tryptophan and leucine content of. the·pro.tein after
72 hour basic hydrolysis, .were respectively 0. •.33 and, 4.2
moles. Since amino acid analysis of acid hydrolysates of
ferredoxin show the presence of 6 leucine residues per mole
of protein, the leucine recovery on basic hydrolysis is 70%.
Assumipg equal destruction for both amino acids.; the number
of tryptophan residues in the molecule is' 0. •.47.' .Tho~gh it is
difficult to tell the exact number of tryptophan residues
due to the low yield of the amino acid in basic hydrolysis,
i tis probable that the pro.tein contains one tryptophan
residue per mole.
When the fipger print obtained rrom thechymotryptic
d?-gestof the pro.tein was sprayed with Ehrlichre!3-gent, one
tryptophan positive spot was seen. Acorrespondi~g spot was
observed in the. fipger print of spinach ferredoxin d?-gest
which contains one molecule .of tryptophan. The extinction
coefficients at 277mu .of taro and spinach ferredoxins are
similar. Spinach.ferredoxin contains four tyrosine, one
tryptophan, b'fo iron, and two sulfide mole:cules per molecule
of protein. Taro. ferredoxin has been shown to contain four
tyrosine residues and two atoms of iron and ino~ganicsul
fide in one molecule and so probably should contain one
molecule ,of trypto,@aJ1, to account for the simil'arity with
the spinach protein in U. V. absorption .We cannot .attach
much 'importance to the tryptophan values obtained by the
.67
spe.ctr.ophotometric titration, since..the. U.V .. extinct.ion .of
the native protein is raied by. the presence .,of iron,.and
that ,of. ,the oxidized pro,te.in may. be lowered due, .to the loss
of some tryptophan.
Amino ,acidcompos.it.ion.
,The amino acid compos.ition .of taro, ferredoxin, calculated
from the direct analysis ,of acid hydrolysatesof.the carboxy
methylated and oxidized proteins is. given in Table IX. Table
X. gives a comparison .of the amino acid composition of the
taro protein with those of spinach and alfalfa, the only
o.therplant, ferredoxins whose .compositions are known. Spi
nach, ferredoxin was s.hown to. contain 97 amino acid residues
only' after the determination ,of the complete amino acid se·
quence ;(75). Direct analysis indicated the presence ,of 99
100...(75) ,and 97-101 ,( 27) amino acids in the protein. It
is ther,eforepossible that when the complete ,sequence of taro
ferredoxin is .worked out " the .total number.ofamino acid
res,idues. in the molecule may. turn out to be the same as that
.of spinac4 ferredoxin.
All' the three:, ferredoxinscontain the same number ,of
a~ginine" tryptophan, isoleucine , tyrosince ,and phenylala
nine residues. Methionine is absent in the ferredoxin com
positions. given in Table X. However, Fry and San Pietro (27)
have reported the presence of a methionine res,idue in their
spinach ferredoxin preparation, .and Matsubara .etal. ;(75) have
indicated the possible presence of a methioninecontaini~g
68
variant ,of, ferredoxin in the spinachpro.tein used .forse
.quen.ce. de.termination. The' major di.fferences in .the amino
acid .composition are 1) a h~gher. glycine and a lower alanine
content in taro ferredoxin; 2 ), a h~gh proportion ,of aspartic
acid+aspar~gine and a lower. proportion .of, glutamic acid!glu
taminein spinach ferredoxin; and -3) the presence .of an
additional residue of histidine and cysteine and one residue
less of proline in alfalfa ferredoxin. The d~gree .of these
differences incomposit.ion is minimized if we, group t~.ge.ther,
as in Table XII, those amino acids which are ,chemically. very
close and whose. codons differ only ~y a si~gle base. It is
interesti~gto no.te .that .the content of .total basic, neutral,
and acidic amino acids is almost identical in taro and spi-
nach ferredoxins.
NH2 terminal amino acid determination.
F~g. 17, gives a trace .of the thin layer chromat~gram
obtained. from the ethereal extract .of DNP-ferredoxin hydroly
sate. .There was only a si~gle ,yellow spot in .thechromato-
, gram which 'or~ginated from the sample. The Rf .ofthis spot
.corresponded with that of DNPalanine which was one .of .the
standard DNP amino acids spot.ted on the thin layer. The
aqueous layer of the DNP hydrolysate was chromat~graphed on
silica, gel alo~g with standard DNP cysteine, DNP a~ginine E
DNP lysine, O-DNP tyrosine, and Im-DNP histidine. The chro
mat~gram,of the sample. contained a faint yellow spot with an
;Rf. value. equal to that ,of Im-DNP histidine. .Whenthin layer
69
.chromat~·graphy was rep.eat.ed with .the aqueous extracts..ob
tainedfrom the .acid hydrolysates. :of FDNBtreat.ed oxidized
.ferredoxin, two yellow spot s..were..obtained. .The· ;Rf. values
.of.the.se :were .the same as O-DNE .ty.rosineand Tm-DNE histi
dine respectively . These derivat.ives.are.formed by..conden
sation ,of FDNB with the-OR. gr.oup .of tyrosine and imidazole
group .of histidine and not necessarily from .the NH2 :terminal
amino acid.
Two. dimensional paper.chromat~graphy.ofthe .ether. ex
tract. :from oxidize.d.ferredoxinr.evealed two; yellow spots with
.Rf. values. equal to. those ,af DNPalanine and DNP.glycine
(.lower. Rf) resp.e.ct.ively. These spots. were eluted with 4%
aqueous sodium bicarbonate. and the ratios of absorbancy at
390 ,to. 360 mu of the eluates were determined. .The ratio was
O.59,fortheeluate.correspondi!lg with DNPalanine and 0·.79
for. the other . The. 390. ,to. 360 fiU ratio. for .solution of
standard DNP alanine ,.DNP .glycine, .and dinit.rophenol were
respectively 0.60,.0.62,. and 0.81. So ,the .yellow spot with
an ;Rf. value similar .to DNP.glycineshould be..dueto. dinitroph
enol. Thus the only aminoterminal amino acid .of. ferredoxin
de.t.e.ct.able by the FDNB method is alanine.
The .result .ofthin layer..chromat~graphy usi!lg acid
hydrolysatesof the dansyl .derivativeof ferredoxin is illus
trat.ed in F~g. 18. The ::pots marked on the .chromat~gramwere
de.t.e.c:t.ed. by their, ·fluores.cence under aU. V. lamp. There were
.three·: ·fluorescent spotsor~ginati~g from the sample. The Rf
, 70
,of the ,central spot was the 'same as .thatofdansy1 ,alanine.
The compound ,movipg ahead ,of the. ,central spot was'. found to
be,dansy1 amine and the. ,third spot was, found to, be dansy1
hydroxide, by comparison with standards run under identical
conditions (65). Alanine is, ther,efore, the only aminotermina1
amino acid in the pro.tein.
Carboxy tel"'mina1 amino :acid.
The 'amino acids released, from. ferredoxin as a result of
hydrazinolysis are, given in Table XII. The results indicate
alanine .to be the C-termina1 amino acid . Low yields ,of C
terminal amino acids have been reported with many proteins.
Bradbury (66) has observed that hydrazino1ysis ,of insulin
liberated 37% of C-termina1a1anine and about 10% each 'of
non-C-termina1,gl.ycine, serine and,glutamic acid. Recently,
Shore and Shore (91) obtained 30%. ,of C-terminal threonine
and 1-5% each of non-C-termina1.g1ycine and serine after
hydrazino1ysis of a protein moeity.from human serum. Only
56% ,of, free alanine added to insulin was rec.over.ed .after
hydrazino1ysis (66).showi~gthatthisamino acid was decom
posed to a la~ge extent rluripg the reaction. The non-C
terminal amino acids are produced probably as a result. ;of
hydrolysis of their hydrazides duripg or.after hydrazino1ysis
(6,6) . The h?-gh, glycine content in the hydrazino1ysis product
fro:m ferredoxin may be due to. the presence of a h?-gh propor
tion of glycine in the native prote~n and the ease of hydroly
sis ,of the. glycine hydrazide.

, ·71
Carboxy peptidase d~gestion .of taro ferredoxin in the
nat.iveand carboxymethylatedstate' released mainly alanine ,
thr.eonine, leucine, and serine. The amounts ofthe.se amino
acids liberated under. various.exper·imentalconditions is
given in Table XIII. In addition .to the amino acids men
tioned in the table, approx'imately 0.5 mole per' mole of pro
te:Ln, of. glutamic acid, aspartic acid and. gl.ycine were also
liberated from the oxidizedferr.edoxin preparation. It is
possible that duri~g the preparation of this sample .of fer
redoxin, the molecule was cleaved either by trichloroacetic
acid or by performic acid. Serine may be an artifact, or
the four.th amino acid from the C-terminal. It is evident
from the results that alanine is the C-terminalamino acid
of the proteil. The penultimate amino acid may either be
threonine or leucine. Spinach ferredoxin has the C-terminal
se.quence Leu-Thr-Ala (75) and.it is quite possible that this
sequence is identical for taro and spinach ferredoxins. Pa
per.ch~omat~graphyof the 24 hr. carboxypept~dase A d~gest
(F~g. 19) ·.of native protein did not reveal any spots corres
pondi~g to aspar~gine or, glutamine. Therefore, the threonine
and serine peaks obtained duri~g amino acid analysis of the
enzyme d~gest are not contaminated wit? aspar~gine or.gluta
mine, two amino acids which are eluted alo~g with threonine
and serine in the analyzSr.
Paper. chromat~graphy and amino acid analysis of the 24
hr. d~ge::t of. ferredoxin with carboxypeptidase B, did not show
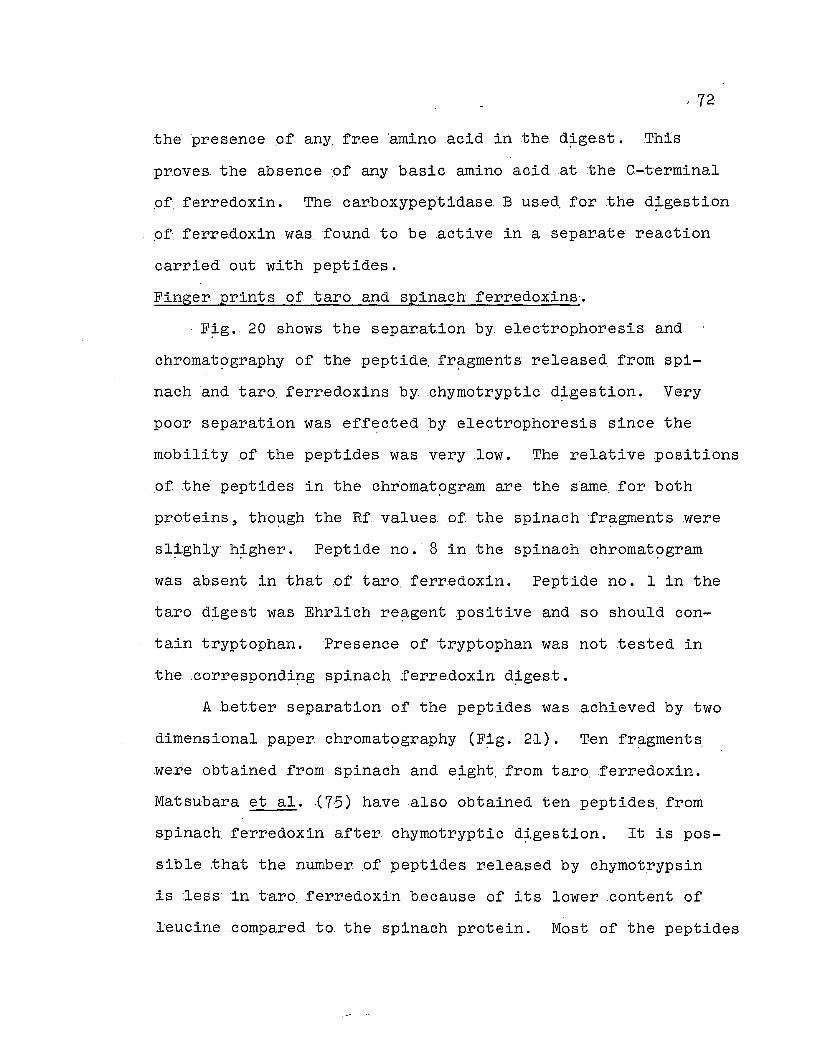
,72
the presence .of any, 'free 'amino acid in the d~gest . This
proves. the absence ',of any basic amino acid at :the G-.t'erminal
,of. ferredoxin. The', carboxypeptidase, B used. for ,the d~gestion
,of, ferredoxin was found to be ,active in a separate reaction
carried out with peptides.
Finger prints of taro and spinach ferredoXins.
F~g. 20, shows the separat,ion by, electrophoresis and
chromat~)'graphy of the peptide,fr~gments released, from spi
nach and taro, ferredoxins by, ,chymotryptic d~gestion. Very
poor separation was effec.ted by, electrophoresis since the
mobility, of the peptides was very low . The relative .positions
of the peptides in thechr'omat~gram are the same, for both
proteins, tho~gh the Hf, values. of the spinach fr~gments were
sl~ghly h~gher. Peptide no.' 8 in the spinach chromat~gram
was absent in that of taro ferredoxin. Peptide no. 1 in the
taro d~gest was Ehrlich re~gentpositive and so should con
tain try,ptophan. Presence of tryptophan was not tested in
the ,correspondi!1g spinach, ferredoxin d~gest.
A bet,ter separation of the peptides was achieved by two
dimensional paper chromat~graphy (F~g. 21). Tenfr~gments
were obtained from spinach and e~ght,from taro, ferredoxin.
Matsubara et ala .( 75) have also obtained ten peptides, from
spinach ferredoxin after, chymotryptic d~.gestion. It is pos
sible ,that the number :of peptides released by chymotrypsin
is less' in t'aroferredoxin because of its lower ,content .of
leucine compared to the spinach protein. Most of the peptides
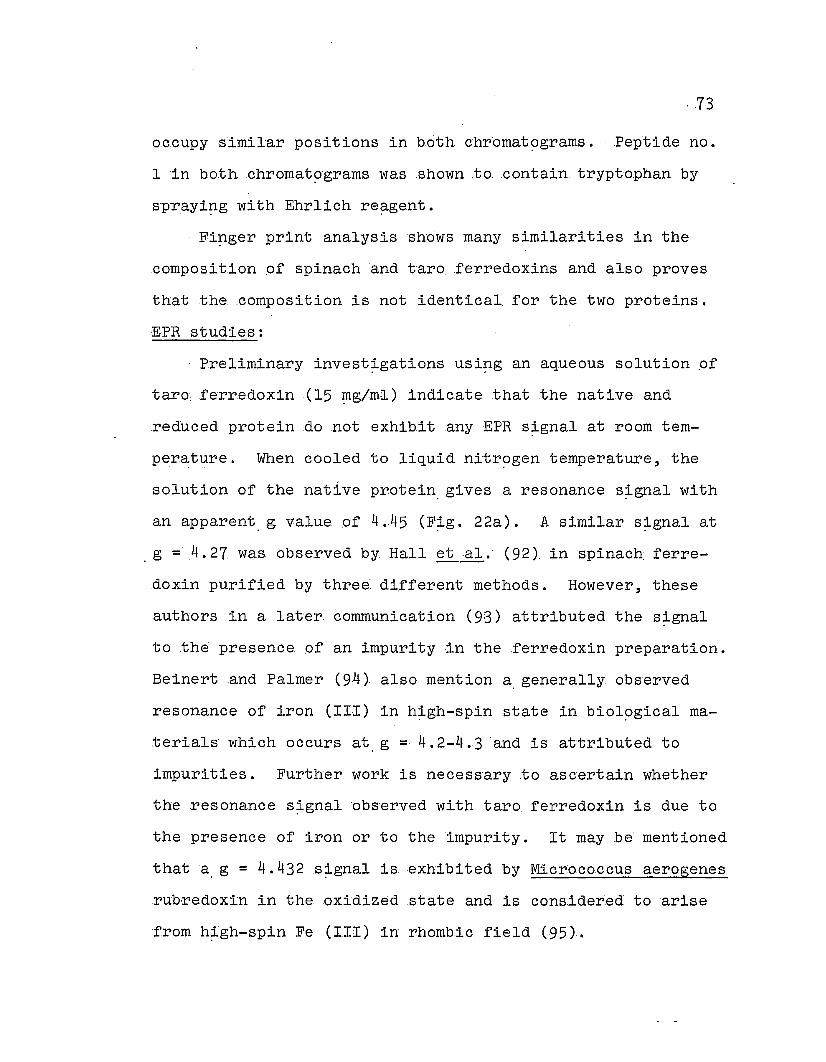
, .73
o.ccupy ·similar positions in .both chr·omat~grams. .Peptide no.
linbothchromat~gramswas shown .tocontain tryptophan by
sprayi~g with Ehrli·chre~gent.
Fipger print analysis shows many similarities in the
composition ,of spinach and taroferredoxins and also proves
that the composition is not identical for the two proteins.
EPR studies:
Preliminary invest?-gations usipg an aqueous solution .of
taro, ferredoxin· (15 ~g/ml) indicate that the native and
reduced protein .donot exhibit any EPR s?-gnal at room tem
perature. When cooled to liquid nitr~gen temperature, the
solution of the native protein. gives a resonance s?-gnal with
an apparent,g. value of 4.45 (F?-g. 22a). A simil'ar s?-gnal at
. g =4.27 was observed by. Hall et ·al.· (92). in spinach. ferre
doxin purified by three: different methods. However, these
authors in a later. communication (93) attributed the s?-gnal
to .the presence Of an impurity in the .fe·rredoxin preparation.
Beinertand Palmer (94) also mention a. generally observed
resonance of iron (III) in h?-gh-spin state in biol~gical ma
terials which occurs at g =4.2-4.-3 and is attributed to
impurities. Further work is necessary .to ascertain whether
the resonance s?-gnal observed with taro ferredoxin is due to
the pre.sence Of iron or to the impurity . It may be mentioned
thata. g = 4.432s?-gnal is exhibited by Micrococcus aerogenes
rub-redoxin in the oxidized state and is cons.ider.ed to arise
from h?-gh-spin Fe (ITI) in rhombic field (95)..
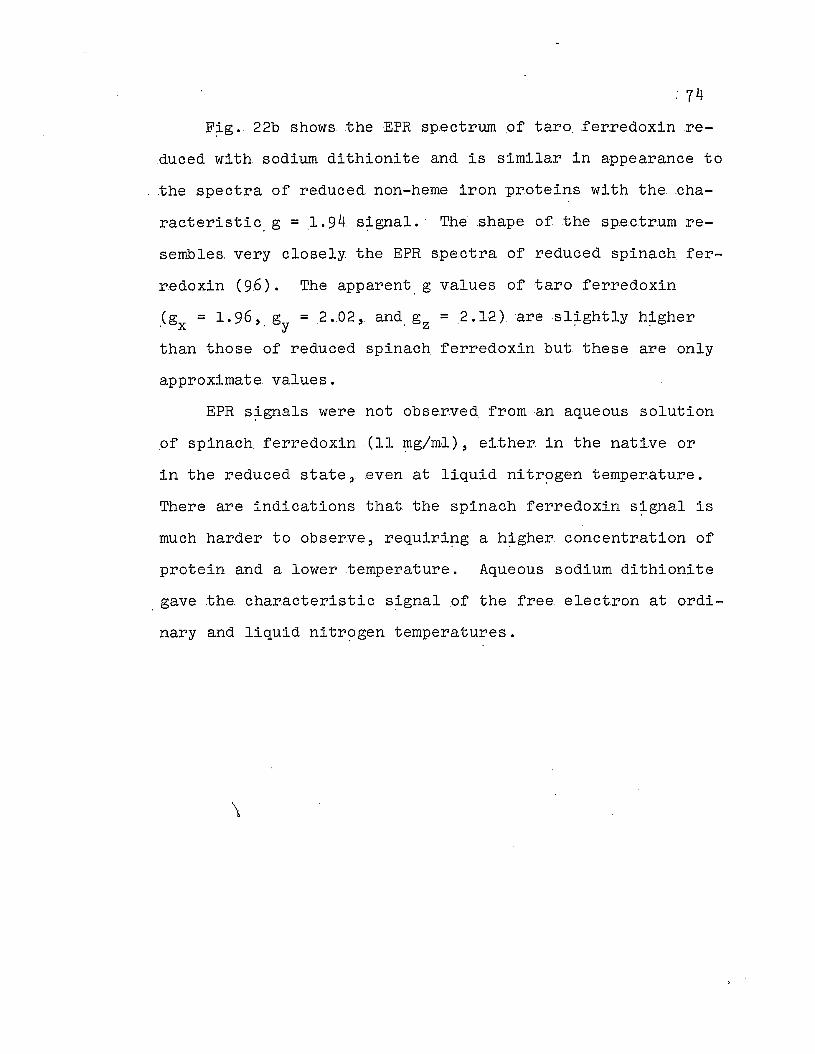
, 74
F~g. 22bshows .theEPR spectrum .of taro..ferredoxin re
duced with sodium dithionite.and is similar in appearance to
the spectra of reduced non-heme iron proteins with the .cha
racteristic. g = 1.94s~gnal.The .shape .of. the spe.ctrum re
sembles. very closely the EPR spectra of reduced spinach fer
redoxin (96). The apparent. g values of taro ferredoxin
(g = 1.96, g =2.02, and. gz =2.12) aresl~ghtly hJ.."gher, x . y
than those of reduced spinach, ferredoxin but these are only
approximate. values.
EPR s~gnals were not observed. from an aqueous solution
of spinach ferredoxin (11 ~g/ml), either in the nat.ive or
in the reduced state, even at liquid nitr~gen temperature.
There are indications that the spinach ferredoxin s~gnal is
much harder to observe, requiri~g a h~gher, concentration of
protein and a lower .temperature. Aqueous sodium dithionite
gave the characteristic s~gnal pf the free electron at ordi
nary and liquid nitr~gen temperatures.
\
DISCUSSION AND .CONCLUSION
The primary. obj.ect 'of .the present research was .to isolate
pure,ferredoxin from a plant .available at all seasons in Ha
waii and to establish its identity. as a, ferredoxin by s.tudy-
i!1g its. various physical parame.ters and chemical properties,
and anino acid composition. This would. guarant.eea ready sup
ply .of plant ferredoxin. for, future work in this laboratory.
It was felt that it would beadvant?-geous for a .comparative
study to select a different class of plant from spinach and
parsley for the extraction of the protein . The, final choice
was taro (Colocasia esculanta), a t.ropical monocoty.ledonous
plant. Taro. ferredoxin is the first example ,of a, ferredoxin
isolated from a monocotyledon. It was our aim to look for
structural variations, if any, in the taro protein to es
tablish in terms of measurable cha!1ges the differences between
taro. ferredoxin and the .other. two plant :ferredoxins isolated
from dicotyledonous plants. Some observations have. been made
duri~g these invest~gations of the properties pf tar~ ferre
doxin which may lead .to the under.standi!1g of the structure
function relationship of the protein. The determination of
the amino acid sequence of taro ferredoxin, and the structure
function relationship are planned as part of the. future research
on this protein.
The modified isolation procedure devised for taro ferre
doxin is superior to prepare pure ferredoxins in. good yield
76
from plant s. compared to -:-the methods of San Pietro ( 40) and
T~gawa and Arnon ("36). The method devised does not involve
the use of la?=,ge excess of'acetone or extensive dialysis re
quired in theor~ginal method~ The use of pH. 7.5 Trisbuf
fer,for hom~genization 'ofthe .leaves prevents. the decomposi-'
tion of the proteingue..toloweri~gof the pH, which would
occur if water is used in hom~genization.
One molecule of taro ferredoxin contains two atoms of
iron and two atoms of 'ino?=,ganic' sulfide. The smell Of
hydr~gen sulfide is noti.ceable when the protein is treated
with dilute hydrochloric acid or trichloroacet.icacid. All
plant:ferredoxins ,so far isolated, contain two atoms of iron
and labile sulfur per mole.
In alfalfa (personal communication to Dr. Mower, from
Dr , Ma?=,goliash) and spinach ferredoxins (75), presence ,of
more than one type of ferredoxin has been observed in the
course .of amino acid sequence determination. There is a
stro~g possibility for the presen~e of protein variants in
the Koa. ferredoxin, the .sequence of which is now worked out
at the University of Hawaii (Miss A. Benson, personal commu
nication) . These plants, therefore, may. contain more .than
one type of gene directi~g the synthesis of thei~ ferredoxins.
Electrophoreses did not indicate..the presence of variants in
taro, ferredoxin. ,Electrophoretic studies alone are not suf
ficient to detect protein variants unless amino acidsubsti
tutions produce appreciable .cha~ges in the net cha?=,ge or
,77
molecular we~ghts of these pro,tein variants. Our .source .of
taro,ferredoxin was plants grown in the same area..for, genera
tions. Taro plants are prop~gated. by. v~getat.ive repr.oduction,
whilea.lfa.lfa and spinach are prop~gated by sexual reproduc
tion . Hence, the probability..of hybridizati.onis less in
taro than in the other two plants . Determination of. the amino
acid .sequence of taro. ferredoxin will help .to establish the
genet.ic.hom~genity of .the protein.
The molecular we?-ght values of taro ferredoxin are
12,000..:t 600 from iron analysis, 12,500.+ 120.0 .from, gel, fil
tration and sedimentation analysis, and 11',000 :to 300. from
amino acid composition. These. values ~greeclosely with the
molecular we?-ghts de.terminedfor spinach (75) and alfalfa
(62} ferredoxins.
The absorption spect.rum of taro. ferredoxin is similar
to . those .of other plant· .ferredoxins , with characteristic
.peaks in the 'vistie and. ultraviolet r~gions . The. values of
the extinction co.e.fficientsof taro and spinach ferredoxins
at 277 mu and 420 mu ~gree. closely.
The color and visible absorption .of taro ferredoxin de
creaseonstor~ge of the protein in air. The decrease in
the. visible absorption of taro. ferredoxin on exposure to air
is .accompanied by a .decrease in the labilesulf.ide .content of
the protein (Table V). Tho~gh no correlation studies were
made betw.een the loss in visible .absorption and the iron con
tent .of taro. ferredoxin,. the amount of iron present in two
, 78
samples.of.ferredoxin with A420 mu to: A277mu ratios. of' 0,.,43
and 0..38 .wereidentical.Thus .the presence, ,of. two moles of
ino~ganicsulfide is. essential to maintain 'maximum visible
absorpti:onin taro. ferredoxin.
The. visible absorption .of the protein is partially. 'or
comple,telylost by treatment ,of ferredoxin with re~gents
like. sodium dithionite., ·8M urea, ando~ganic mercurials. It
has been observed with spinach.ferr.edoxin, .that ,sodium di
thionite reduces one.of the two, ferric ions in the protein
to the..ferrousstate (108). The complete bleachi~g of. taro
ferredoxin .col·or on addition of excess of .sodium dithionite,
in air, may, be .due to the displacement ,of ironbound to the
protein. The reactivity,.of iron' chelati~g 9-gent s,toward spi
nach.ferredoxin is enhanced very much on incubation .of. the
protein wi.th sodium dithionite as observed by Bayer ,,(109).
The spectral shifts. observed on treatment of taro; ferredoxin
wi,th 8 M 'urea, soon after the addition of urea may be due to
conformational cha~ges occurrip.g around the iron-sulfur chro
mophoric.group. It is possible that on prolo~ged incubation
in urea, ,both the iron and ino~ganic sulfide are displaced
f.rom ,the protein. Loss of iron on urea-treatment has been
observed with xanthine oxidase (.87), another non-heme 'iron
protein.of the ferredoxin type. The loss in visible absorp-
tionoccurri!lg on mercurial treatment of. the protein is due to
the removal of labile su.lfide and, iron from it since analysis
of the mercurial-bound. ferredoxin showed the absence of. these
, 79
eTenientsinthe apoprotein. .Thusthe, visible .absorbancy .of
taro; .ferredoxin is dep.endent on .thepresence ;Of 'iron and in
o?=,ganic su.lfide in a part.i:cular. :typeof .conf~guration. The
absorbancy, in the ultr.av.io.let r~gion (277 mu) .is.dueto.the
aromati.c amino acids and 'ironatoms in the protein.
The. group of .non-hemeiron ·el.ectron tran.sferprote,ins
includes the bacterial and chloroplast,ferredoxins, mammalian
mito.chondrial pro.te,ins like .succinic dehydr~genase, xanthine
oxidase , adrenodoxin, etc. All these non-heme iron pro,teins
contain iron and labi.le .su.lfide in a 1:1 ratio. One.of the
chi.ef, .physical propert.ies, which distip.guish the.se non-heme
iron prote,ins. from heme proteins like c,yto.chromes, catalase
etc.. is their characteristic absorption spectra. Thes.p.ectra
.of non-heme iron proteins ,in the. visible r~gion, ;show broad
absorption peaks hetw.een 380 ,and ,470 mu. The intensities .of
the.se .ahsorptions decrease, on reduct.ion of the protein chem
ically 'or enzymatically.
The .shape of the visible .abs·orpt,ion spectra .of hemoproteins
is .qui:te. di-,fferent and is made up .of the absorption due to .the
porphyrin and the .absorpti,on arisip.g out of the iron-l~gand
inter.action in the heme moiet,y.. Low spin ferrouscomple,xes
show a three-banded spectrum with a sharp Soret .peak .at·400
to· .420 muand two other peaks with less intensities in .the
r~gions 520 to 535 and 555 ,to. 565 mu. H~gh-spin.ferrous ,com
plexes. have spectra, with the Soret peak and another band
around. 550 mu. The .soret peak ,of the hemoproteinsiscon-

. 80. .;" ~
tr.ibu.t;ed. by..theporphyrins. .Ther.eis no decrease in the in-
.tensities.,of the absorpt.ion peaks when the heme proteins are
reduced. by sodium dithionite: .. (.110)..
.Thespectra of taro and other. chloroplast'.ferredoxins
show absorption maxima .at, ~42.0. .and 465mu . The. vis.ible .ab-
sorption' spectra ofadrenodoxin and flavin-free'. mito.chondrial
non-hemeironprote.ins, 'are similar to those ;of. chloroplast
ferredoxins (11-5). The. ·extinction .coefficients. .of..chloro-
plast..ferredoxins and the mit.o:chondrialenzymes .(freed.from
·flavin nucleotides where present) are between 4000..-500.0. .cm2
-1 6mole's per atom .of iron .( 7 ) . TheEPR s?-,gnals ,of~ferredoxins
·and the mitochondrial non-heme iron proteins, .in the reduced
.state,.are similar. There is thus· a .body..of..evidenceto
s~g-ge.st .that .the .chromophoric.group in chloroplast: .ferre
.doxinsis related to that ;Of a wide. variety. ,of very.impor-
tant..enzymes in many diver.se.f'orms of l·ife .
.The..capac.i ty of taro. ferredoxin to photo reduce .NADP
decreases with decrease in the relative visib.le .absorbancy
,of .the pro.tein (F~g. :l). The protein obtained. byaddipg
excess ,of CMB to taro. ferredoxin and dialyzi!1g Of'f..the iron
and GMB-labilesulfide complex was, found to be .comple.te.ly in
active. in the photo-reduction of NADP. Thus the iron and
sUlfi.de. groups which are essential to. give .themaximum visible
absorpti.on .to taro; ferredoxin is essential also. for .the
ele.ctron transferact.ivity...of the pro.tein . This has .been
substantiated by. other workers usipg spinach .( 27) and alfa.lfa
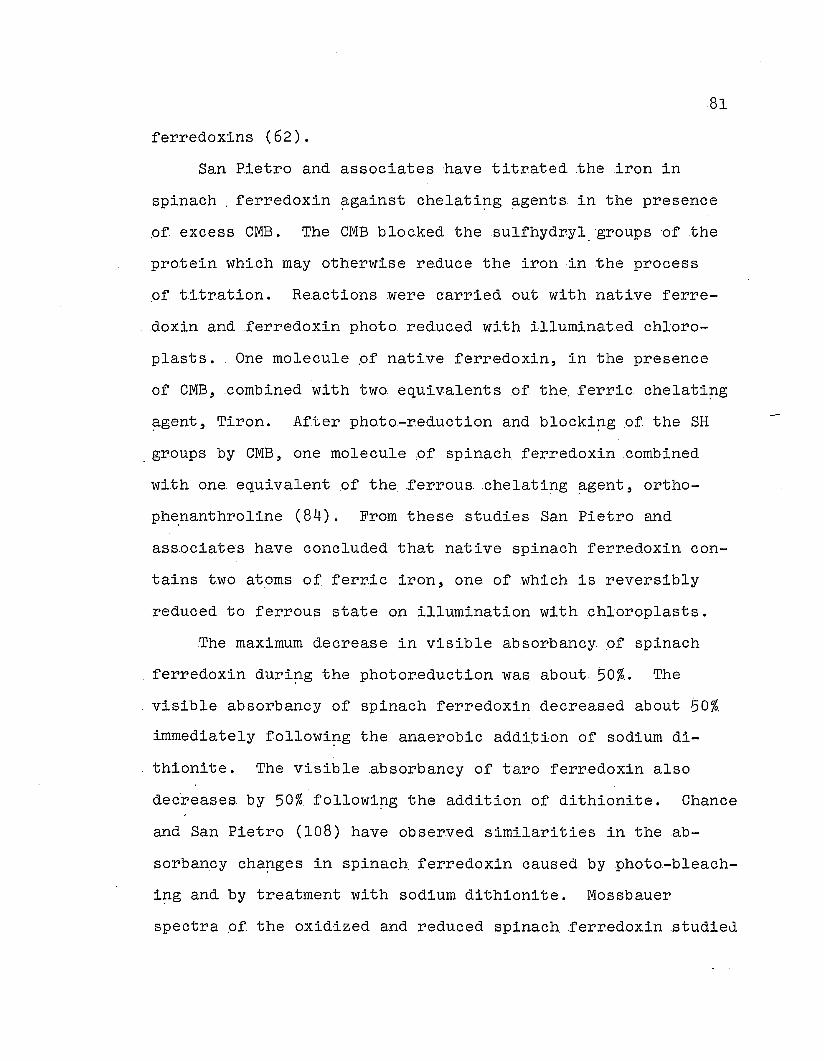
81
ferredoxins (62).
San Pietro and associates have. titrated the iron in
spinach. ferredoxin ~gainstchelati!1g ~gents in the presence
.of excess CMB. The CMB blocked the sUlfhydryl. groups of the
protein which may otherwise re.duce the iron in the process
.of titration. Reactions were carried out with nat.iveferre
doxin and ferredoxin photo. reduced withilluminatedchloro
plasts. One molecule of nat~ve ferredoxin, in the presence
of CMB, .combined with two equivalents of the. ferric chelati!1g
~gent, Tiron. After photo-reduction and blocki!1g of the SH
. groups by CMB, one molecule of spinach ferre.doxin .combined
with one equivalent of the .ferrouschelati!1g ~gent, ortho
phe.nanthroline (84). From these studies San Pietro and
associates have concluded that native spinach ferredoxin con
tains two atoms of. ferric iron, one of which is reversibly
reduced to ferrous state on illumination with chloroplasts.
The maximum decrease in visible absorbancyof spinach
ferredoxin duri!1g the photoreduction was about. 50%.. The
visible absorbancy of spinach ferredoxin decreased about 50%,
immediately, followi!1g the anaerobic addition of sodium di
thionite. The visible ,absorbancy of taro ferredoxin also
dec'reases by 50% followi!1g the addition of dithionite. Chance
and San Pietro (108) have observed similarities in the ab
sorbancy cha!1ges in spinach,ferre.doxin caused by photo.-bleach
i!1g and by treatment with sodium dithionite. Mossbauer
spectra of the oxidized and reduced spinach ~erredoxin studied
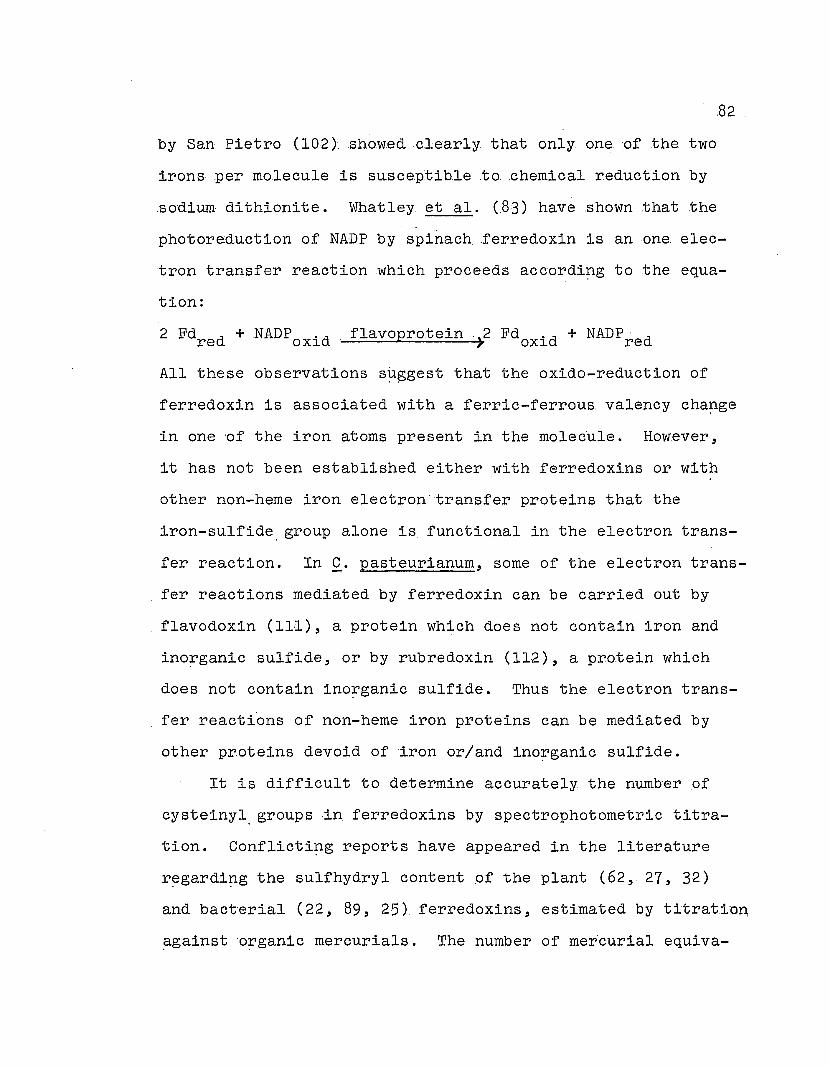
,82
by San Pietro (l02) ,showed ,cle'arly, that only one of the two
irons per molecule is susce,p,tible .to.chemical reduction by
sodium dithionite. Whatley,etal. (83) have shown .that the
photoreduction of NADP by spinach ferredoxin is an one elec
trontransfer reaction which proceeds accordi!1g to the equa
tion:
2 Fdred + NADPoxid flavoprotein. }2 Fdoxid + NADPred
All these observations s~ggest that the oxido-reduction of
ferredoxin is associated with a ferric-ferrous valency cha!1ge
in one nf the iron atoms present in the molecule. However,
it has not been established either with ferredoxi.ns or with
other non-heme iron electron transfer proteins that the
iron-sulfide. group alone is functional in the electrontrans
fer reaction. In C. pasteurianum, some of the electron trans
fer reactions mediated by ferredoxin can be carried out by
flavodoxin (111), a protein which does not contain iron and
ino?=,ganic sulfide, or by rubredoxin (112), a pro.tein which
does not contain ino?=,ganic sulfide. Thus the electron trans
fer reacti6ns of non-heme iron proteins can be mediated by
other proteins devoid of iron or/and ino?=,ganic sUlfide.
It is difficult to determine accurately, the number of
cysteinyl. groups in ferredoxins by spectrophotometric titra
tion. Conflicti!1g reports have appeared in the literature
r~gardi!1g the sulfhydryl content pf the plant (62, 27, 32)
and bacterial .( 22, 89, 25). ferredoxins, estimated by titration,
~gainst 'o?=,ganic mercurials. The number of mercurial equiva-
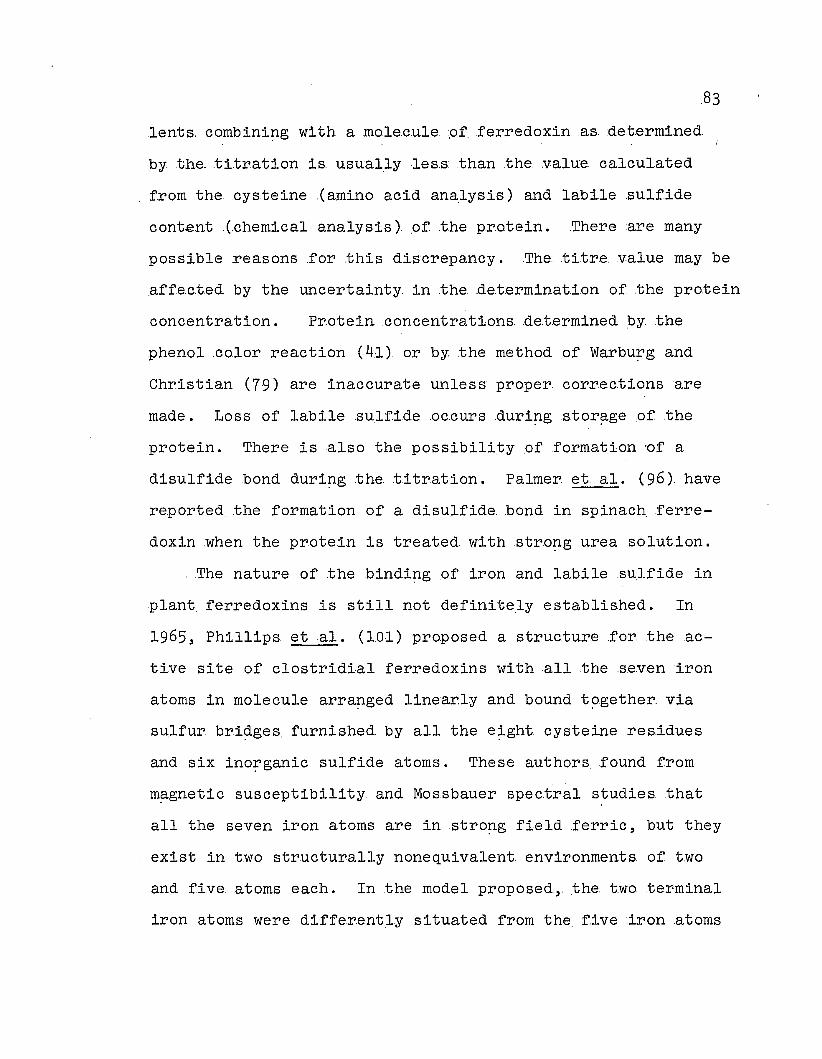
.83
lents..combinip.g with a mole.cule ,of. ferredoxin as. det.ermined
by. the. titration is. usuallyles.sthan .the. value. calculated
from the. :cysteine(amino .acidanalysis) and labile .sulf.ide
cont€nt .(.chemical analysis) .of .the pr.otein ...There 'are many
possible reasons for this discrepancy. .The .titre. value may be
.affec.ted. by the uncertainty in .the det.ermination of .the protein
concentration. Protein .concentrations det.ermined. by. the
phenol color reaction (.41) or by the method of Warbu~g and
Christian (79) are inaccurate. unless proper. corrections are
made. Loss of labile .sulfide .occursdurip.g .stor~geof.the
protein. There is also the possibility of formation 'of a
disulfide bond durip.g thetitration. Palmer. etal. (96) have
reported the formation of a disulfide bond in spinach ferre
doxin when the pr.ote.in is treated with strop.g urea solution.
The nature of the bindip.g of iron and labile .su,J.fide in
plant ferredoxins is still not definitely established. In
1965, Phillips etal. (1.01) proposed a structure .for theac
tivesiteof clostridial ferredoxins with all the .seveniron
atoms in molecule arrap.ged linear.ly and bound t~gether. via
sulfur bri~ges furnished by all the e~ght cysteine res.idues
and six ino~ganic sulfide atoms. These authors found from
m~gnetic .susceptibility and Mossbauer spectral s~udiesthat
all the seven iron atoms are instrop.g field ferric, but they
exist in two structurally none qUivalent. environments. of two
and five. atoms each. In the model proposed,. thetwoter-minal
iron atoms were differentl.y situated from the. f.iveironatoms
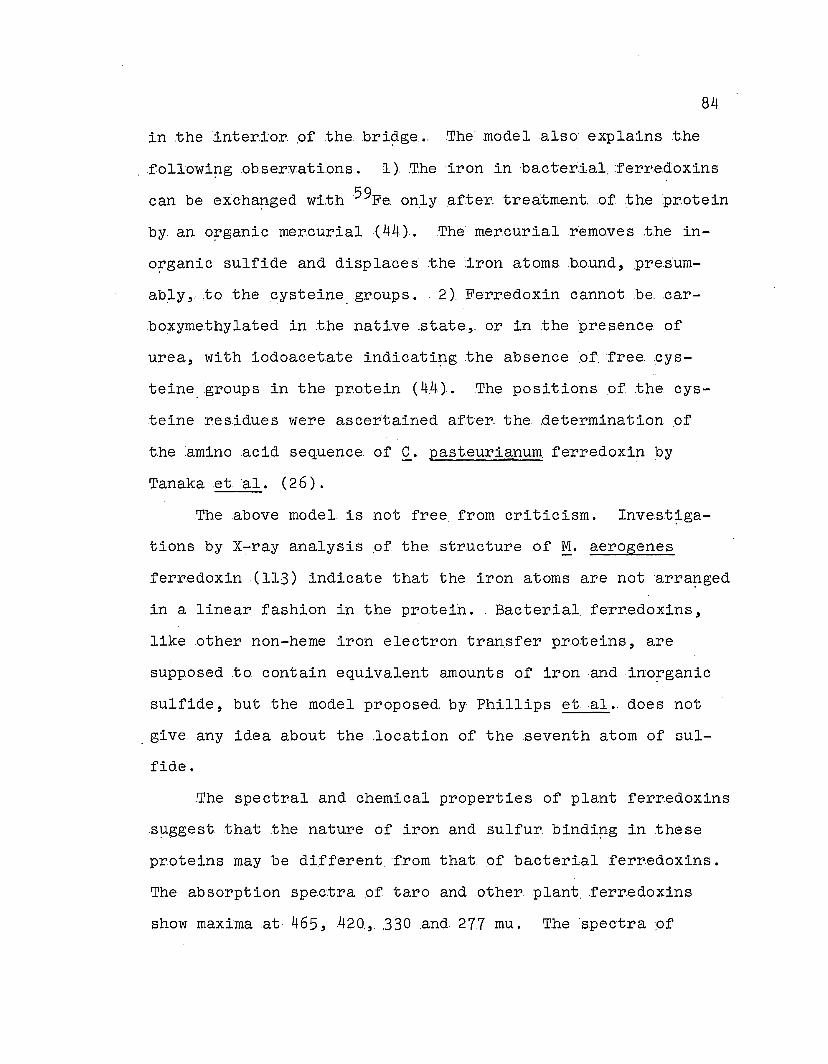
84
in the interior..of .the briSlge ....The· model also explains the
followi~g .observ.ations. ].) .T.he 'iron in bacterial..ferr.edoxins
canbeex.cha~gedwith 59Fe.onlyaftertreatment. of .the protein
by. an o~ganic mercurial (41+.). • The' mer.curialremoves the in
o~ganic sulfide and displaces. the :iron atoms bound, presum
ably, .to the cysteine. groups. 2). Ferredoxin cannot be..car
boxyme.thylated in .the native .state, or in the pre.s.ence. of
urea, with iodoacetateindicati~gtheabsence .of.free.cys
teine. groups in the protein (4.4.).. The positions .of .the cys-
.teine residues were ascertained after the .determination .of
the 'aminoacid sequence. of C. pasteurianum ferredoxin by
Tanakaetal. (26).
The above model is not fre~ from criticism. InveBt~ga
tions by X-ray analysis :of the .structure of !'i.aerogenes
ferredoxin (113) indicate that .theiron atoms are not 'arra~ged
in a linear fashion in the protein. Bacterial ferredoxins,
like other non-heme iron electron transfer proteins, are
supposed to contain equivalent amounts of iron and ino~ganic
sulfide, but the model proposed. by Phillipsetal. does not
. give any idea about the .location of the seventh atom of sul
fide.
The spectral and chemical properties of plant ferredoxins
s~ggest that the nature of iron and sulfur bindi~g in these
proteins may be different from that of bacterial ~erredoxins.
The .absorption spec.tra .of taro and other plant.ferredoxins
show maxima at 465,420.,. 330 .and 277 mu. The. spectra ·.of
85
bacterial.ferredoxinsshow maxima at 390,. 300.and 280 ,mu.
It is not .y.et .definiteT.yknown .whe.ther.the. 0390 ,mu ab-S'orp
t.ion peak:of bacterial. ferr.edoxins is due .to an increase
in the :iron content 'or due ~tothe presence of a d.iffer.ent
chr'omophoric ,group in thes'eproteihs . The' EPR spectra .of
taro and .otherplant :ferredoxinsin the reduced state are
sl~ghtly different ·fromthe..correspondi~g s.pectra .of bac
terialfenredoxins (96). The circular dichroism and opt.ical
rotatory dispersion sp.e.ctra.ofspinach ferr.edoxin was. found
to. be ~qualitatively andquant.itat.ively different, 'from those
.of bacterial ferredoxins(103). Taro ferredoxin .contains two
atoms .of iron and five cy.s.teine groups (from amino acid
analysis ) compared to seven .atoms ,of iron and e~ghtcysteine
groups per. mole of bacterial, :ferredoxins. 'DTNB titrations
show that a molecule of taro ferredoxin combines with about
six equivalents of the re~gent in the presence of. guanidine
hydrochloride (Table VII). The DTNB titre was notalter.ed
.when EDTA was added to. the .reaction mixture .. How.ever , with
Q.acidi-urici ferredoxin, it wa~ .found that DTNB reacts
with all the labile sulfide pf the protein in the presence of
. guanidine hydrochloride, and w.ith the labile sulfide and the
cysteinyl,groups in the presence of EDTA and,guanidine hydro
chloride (86). There ~s thus a difference in the reactivity
of DTNBtoward the two types of. ferredoxinl:3.
Any structure proposed: for the iron and sulfur bindi~g
in plant.ferredoxinsshould explain the followi!lg observations.
86
-1 ) The production of .temperature-.sensitiveEPR s~gnals by
the r.educed protein with a. g value around 1.94. Theparti
cipation ·of iron and sulfur in the. generation of the s~gnal
has been shown by isotopic substitution exper·iments (114)..
2). The presence of two atoms of sulfide per mole of ferredoxin
which can be. liberated by acidification of the protein and
which can be estimated as H2S by F~go and Popowski method.
3) The inaccessibility of the cysteinyl.groupsof native
ferredoxin for reaction withiodoacetate, observed withal
falfa ferredoxin (62), .which s~ggests that the cysteinyl
groups are blocked in the nativepro.tein. 4).The results of
mercurial titrations with taro ferredoxin which does not s~g
gest the presence of disulfide. groups in the protein. 5) The
ease with which iron and sulfide are displaced from taro, fer
redoxin by mercurials. 6) Native spinach ferredoxin in neu
tralsolution does not react easily with ferrous or ferric
iron chelati~g ~gents.
Two structures have been proposed for spinach ferredoxin
to explain the electron param~gnetic resonance s~gnal. gener
ated by the reduced protein. Gibson et al. (93) consider the
resonance s~gnal to arise from h~gh spin ferric ions in an
octahedral of tetrahedral field. These authors s~ggest
that the two iron atoms in ferredoxin stro~glyinteract
with one another thro~gh one or more sulfur l~gands. .The
reduced complex may. be of the type,

87
Fe 3+(d5 ,S, = 5/2)-sulfur l?-gand (s)-Fe 2+ (d6 ,8 =2). This
structure can explain the .' g' values and the temperature de
pendence of the EPR s?-gnal and also the one electron trans
fer mechanism of ferredoxin.
Palmer and associates (.116) have found, from quantita
t.ive measurements of the EPR s?-gnal of spinach,ferredoxin
that there is only one unpaired electron associated with the
iron atom. givi~g the EPR s?-gnal. These authors assume that
the s?-gnal is produced by low spin ferric ion in a tetrahe
dral l?-gand field and propose the followi~g structure for
the active site of ferredoxin (96).
m
( )

~
88
Accordi~g to Palmer.etal. (96) mercurials can trap the
mercaptide ion and hence pr.oduceFe(III) as in .structure I.
The iron thus released reacts' rapidly and quanti.tati.vely with
Tiron, a ferric specific chelator. Instro~g urea solution
the iron is accessible .to bathopherianthroline sUlfonate, a
ferrous specific chelator but not to Tiron. Instro~g urea
the Fe (III) of native,ferredoxin is converted to Fe (II) as
in structure II which reacts .quantitatively with the. ferrous
chelator. Duri~g this process, a disulfide bond is formed
from two cysteine sU:lf.hyd..ryl. groups. The authors .detected the
presence of a disulfide bond in the product by amperometric
analysis. Iodoacetate cannot react with the cysteinyl. groups of
the native protein since they are in combination with the iron
atoms. Carboxymethylation of ferredoxin does not take place
even in the presence of urea, since the two cysteinyl groups
liberated are immediately oxidized to a disulfide bond. How
ever., when the ferredoxin is incubated for a lopg time with
urea, mercaptoethanol, and EDTA, ·allthe iron atoms are released
from the protein, and the free cysteinyl. groups are maintained
in the reduced state by the mercaptoethanol. Iodoacetate now
reacts readily and quantitatively with the cysteinyl. groups of
the denatured ferredoxin.
Accordi~g to Palmer and associates, Fe (III) in an en
vironment. of four sUlfidel~gands (structure III) and Fe (I)
with one disulfide and two sulfide l~gands (structure .IV)
are. formally indisti~guishable and both structures are capable
of. generatip.g the EPR s?-gnalsobserved with reduc.edplant
ferredoxins. Palmer's. group have observed that bis-hexamethyl
benzene-Fe (I) exhibits an EPR spectrum similar to the spin
ach. ferredoxin.
The structure proposed by Palmer et al .. fails to show
specif.ically the nature and location of the labile sulfide
in.ferredoxins. A molecule .of spinach. ferredoxin contains
f.ive cysteine residues and two moles of ino~ganic sulf.ide .
.It appears from the model that all the six sulfur atoms shown
belop.g to cysteine residues. The spectra of plant..ferredox
ins show an absorption maximum at 330 mu. Villarejo and West
ley (117) have noticed such an absorpt.ion around 330 mu in a
mixture of cysteine and sodium sulfide which produces an
o?=,ganic persulfide of the type RSSH. Neither cy.steine nor
S was. found to absorb at wavelep.gths greater than 300 mu.
Persulfides react with dilute acids liberatip.g hydr~gensul
fide. Thus there is a possibility for the pre.sence of a
CyS-S-H. group in the structure .offerredoxins!
Blumbe?=,g andPeisach (118) have pointed out that quantum
mechanics does not permit theEPR s~gnals that have been ob
served in the r~gion g = 1.9-2.0 to be ascribed to iron alone
in any. conf~guration whatsoever. These authors, however,
s~ggest that the. g value of a free radical uan depart s?-gnifi
cantly.from 2.0023 , the. g value of the free..electron, when
.the. fr.ee radical species. has:che'latedto it anion with an
even number of d electrons in the low spin state. The s?-gnal
90
observed with reduced t'aroferredoxin, therefore; may arise
by. the .bondi!1g betw.eenF·e·2+(with 6 d electrons in .thelow
spin state) and sulfur .atoms. It :should be' meriti::ned. here
thattho~gh·the s;ignal with. g =' :4'.45 observed with native
taro. ferredoxin may be due to the presence .of an impurity,
the s;ignal .of the reduced pro.tein is definite.ly.from the iron
sulfide .chromophore as .seen by. comparison with the s?-gnals
obtained from reduced spinac~ ~erredoxin (96). Proteins which
give the s;ignalat. g = .~.. 3 do not. generate the g =1. 94s;ig
nalon reduction. The apparent. di'fference in the s?-gnals
observed with spinach ferredoxin in our work may. be due to
the temperature dependence .of the s;ignals.
Bayer and associates (109) in Germany were able to pre
pare spinach apoferredoxin by incubati!1g native. ferredoxin
solution at pH 5.4 with ce:. - oC - bipyridyl andseparati!1g the
products by. columnchromat~graphy. The apoferredoxin was
catalyt.ically inact.ive and did not possess iron, labile sul
fide, or absorbancy in the. visible r~gion of the spectrum.
Ferredoxin was reconstituted from the apopro.tein by treati!1g
the apoprotein with mercaptoethanol followed by sodium sul
fide and Mohr's salt. The. chemical composition ,electron
transfer activity, and opt~cal and EPR spectra .of the recon
stituted ferredoxin were the same as those of native. ferre-
doxin. Based on these findi!1gs, Bayer. et al .. (109) have
s~gge:stedstructure I for native ferredoxin and structures II
to IV for the reduced protein.
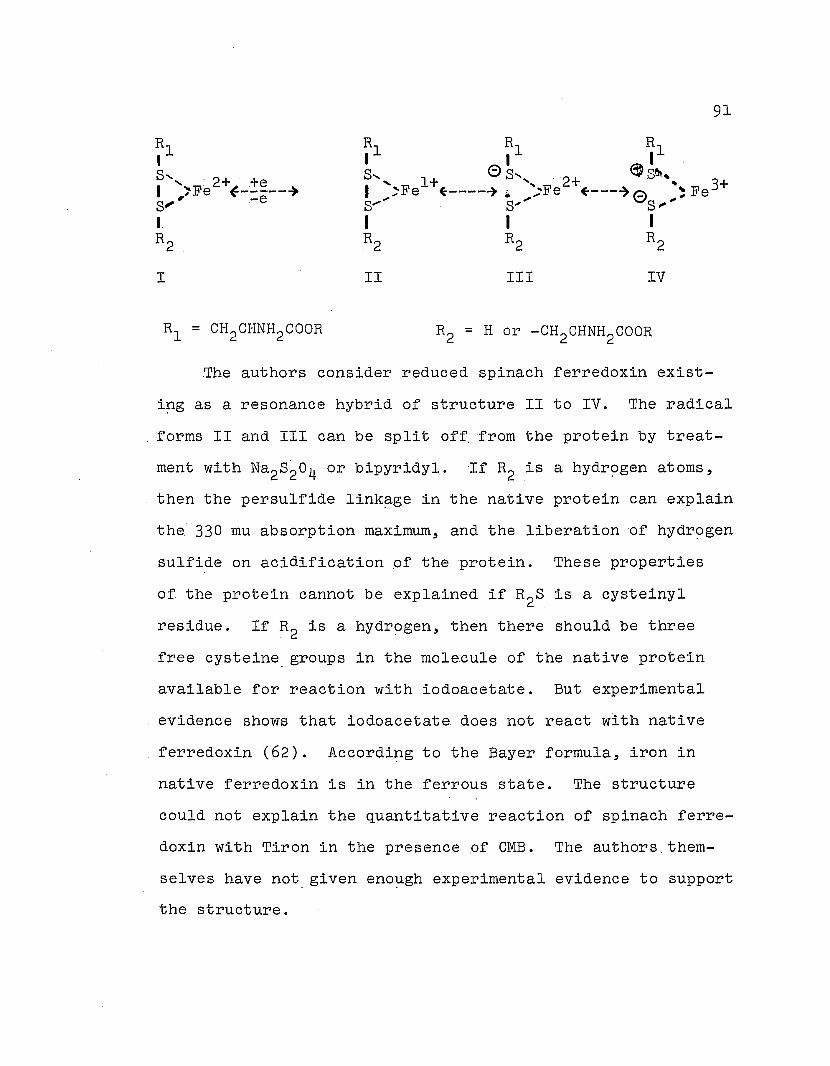
91
RlIS"'2+ +eI ~Fe ~-----+S,' -eI.R2
I II III IV
The authors consider reduced spinach ferredoxin exist-
ipg as a resonance hybrid of structure II to IV. The radical
forms II and III can be split off. from the protein by treat-
ment with Na2S204 or bipyridyl. If R2 is a hydr~gen atoms,
then the persulfide link~ge in the native protein can explain
the. 330 mu absorption maximum, and the liberation of hydr~gen
sulfide on acidification of the protein. These properties
of the protein cannot be explained if R2S is a cysteinyl
residue. If R2 is a hydr~gen, then there should be three
free cysteine, groups in the molecule of the native protein
available for reaction with iodoacetate. But experimental
evidence shows that iodoacetate does not react with native
ferredoxin (62). Accordi~g to the Bayer formula, iron in
native. ferredoxin is in the ferrous state. The structure
could not explain the quantitat.ive reaction of spinach ferre-
doxin with Tiron in the presence of CMB. The authors. them-
selves have not, given eno~gh experimental evidence to support
the structure.
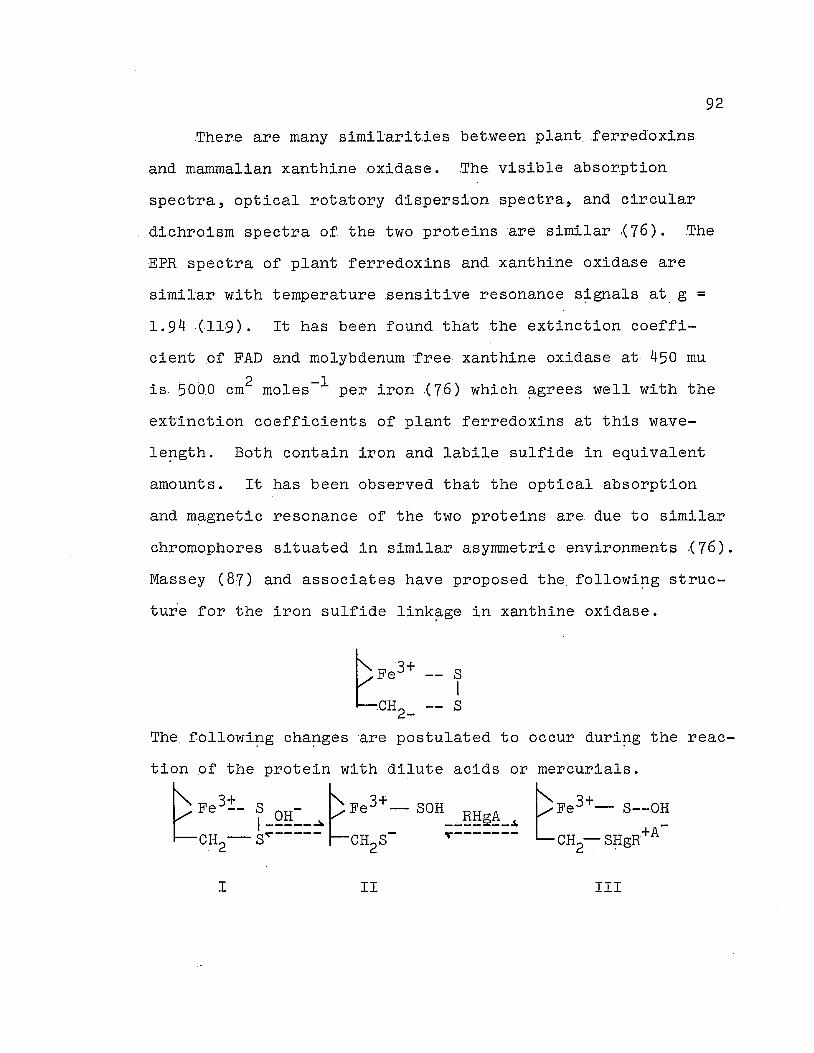
92
.There are many similarities bet.weenplant.ferredoxins
and mammalian xanthine oxidase. .The visible absorption
spectra, optical rotatory dispersion spectra, and circular
dichroism spectra of the two proteins are similar ,( 76) . The
EPR spectra of plant ferredoxins and xanthine oxidase are
similar with temperature sensitive resonance s~gnalsat. g =1.94 .(119). It has been found that the extinction coeffi
cient of FAD and molybdenum free xanthine oxidase at 450 mu
is. 5000 cm2 moles -1 per iron ,( 76) which ~grees well with the
extinction coefficients of plant ferredoxins at this wave-
le!1gth. Both contain iron and labile sulfide in equivalent
amounts. It has been observed that the optical absorption
and m~gnet~c resonance pf the two proteins are due to similar
chromophores situated in similar asymmetric environments ,( 76).
Massey (87) and associates have proposed the followi!1g struc
ture for the iron sulfide link~ge in xanthine oxidase.
~Fe3+ -- 1LCH
2_ -- S
The. £ollowi!1g cha!1gesare postulated to occur duri!1g the reac
tion of the protein with dilute acids or mercurials.
~ Fe3:!:_ f_2!!=_...~ Fe
3+- SOH__~!!i!i~_... ~ Fe
3+- S-.-O~
[CH2
- S~----- ~CH2S- ..------- lCH2-S~gR+A
I II III

93
This structure can explain :the absorption maxima at 330 mu
of taro. ferredoxin sp.e.ctrum, :the' .absorbancy .losses..occurri!1g
on treatment of ferredoxin withurea and also the, displace-
ment of iron atoms from the protein byo~ganic mer.curials.
The structure proposed .does not. give any idea r~gardi~g the
l~gands of iron other than the .sulfide.
It is evident from the above discussion that .tho~gh all
the proposed structures. can explain many of the properties
of plantferredoxins, none of them satisfactorily accounts
for all the reactions observed with the proteins. More
research and development ,of techniques are ne,cessasry. for the
enunciation of an unamb~guousstructureforthis class .of
non-heme iron proteins. One possible structure which would
explain some of the reactions of the taro protein is:
.......
,s
"oI
PROTEIN- - r -...."
CH2ISI
I \
)- I 3+ I 3+ \rCH2S-Fe - Fe -SH2C~
I I I \'SS \I \
I \I \
t•I
94
In this model all the.cy.s.teine residues .of native, .ferre-
doxinare..bound either .to.ironor labile su.lfideand hence are
not ,available, for reaction withiodoacetate .. Both iron atoms
in the native protein are in .the ferric valence state. One
of the two iron atoms is linked to two cysteinyl,groups. The
second iron atom is linked to a cysteinyl,group and possibly
to another amino acid in the pro.tein chain. It is di-,fficult
to predict which one of these iron atoms unde~go r.educt.ion
duri!1gillumination with chloroplasts. There are two per
sulfidelink!iges in the model which could account for the ab-,
sorption .of the protein at. 330 .mu and the liberat.ion of hy-
dr~gen sulfide on acidification . .The primary structure .of
spinach. ferredoxin ,(75) shows the cysteinyl residues located
. at .posit.ions 18, 39,. 44,.. ,41. and: 76 in the .sequence. It is
theor.et.ically possible to, fold the spinach protein molecule
and bri!1gt~,gether the cy.steinyl residues as shown in the
above model.
Determination .of amino acid sequence and X-ray structure
will show whether the ferredoxin molecule can physically
exist jon this structure. Also ,it is not known whether two
iron atoms directly linked can. give rise to the EPR s~gnals
observed with ferredoxins.
The complete amino acid se.quence .of Q.. pas.teurianum and
c. butyr.icum ferredoxins( 26, 97 ) and the partial sequence of
·~ •. aerogenes ferredoxin (Dr . J. Tsunoda, personal communica-
tion) are known. The molecule of the two clostridial ferre-
95
doxins .studiedcontain 55 amino acid residues. each. Both of
them have .the same amino and carboxyterminal amino acids .
Both have e?-ght cyteinyl residues .(to which the iron atoms are
believed to be linked) in identical positions. of the molecule.
Methionine, a~ginine, histidine and tryptophan are absent in
both ferredoxins. Thus, ferred<Qxins isolated from the same
genus have closely relateq structures. Preliminary invest~ga
tions by Dr. J. Tsunoda of the amino acid composition of fer
redoXin. from Peptostreptococcuselsdenii, an o~ganism of a
different order, have shown methionine as one of the component
amino acids, provi~g that structural differences can be found
in ferredoxins from different orders ofo~ganisms.
The amino acid composition of taro, spinach .( 75) andal
falfa (62) ferredoxins are similar. If we assume that taro
ferredoxin molecule contains only 98 amino acids (lower. value
in Table X), then the number of basic, aromatic and sulfur
containi~g amino acids are identical in spinach and taro fer
redoxins except for the amides. The electrophoretic mobilities
of the two ferredoxins in acrylamide gel electrophoresis were
the same indicati~g the identity in the net cha~ge of the
two proteins. It is likely, therefore, the total number of
amides are also the same in taro and spinach ferredoxins.
Both contain the same number of proline residues (helix-break
i~g residues) and almost .the same number of cl. -helixformi~g
amino acids (120); 62 in spinach and 61 in taro. ferredoxin.
The aminoterminal amino acid of taro ferredoxin, like all
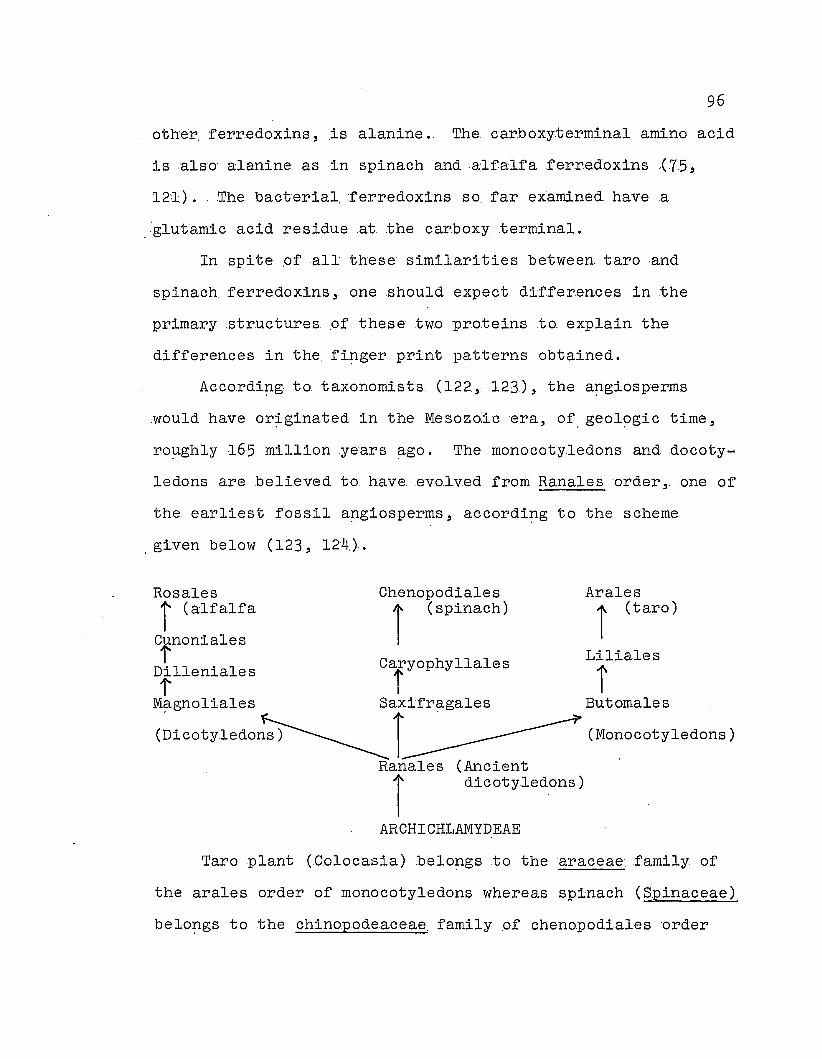
96
other, ferr,edoxins, ,is alanine. The.carboxy.te.rminal amino acid
is also alanine as in spinach and ·alfalfaferredoxins ;(75,
121) . The bacterial, 'ferredoxins so. far examined have a
,'glutamicacid residue at .the carboxy .terminal.
In spi.te .ofall these' similarities betw.een taro and
spinach ferredoxins, one should expect differen.ces in the
primary structures ,of these twopro.teins to. explain the
differen~es in the fi~ger print patterns obtained.
Accordi~g. to taxonomists (122., 123), the a~giosperms
.would have or?-.ginated in the MesozO:ic era, of. geol~gic time,
ro~ghly 165 million years ~go. The monocoty.ledons and .docoty-
ledonsare believed to. have. evolved from Ranalesorder,. one of
the earliest fossil a!1giosperms, accordi~g to the scheme
. given below (123, 124)..
Caryophyllales
i
ChenopodialesT (spinach)Rosalesr (alfalfa
Cfnoniales
Dillenialest
Magnoliales Saxifragales
(~1cotYledO~r .Ranales (Ancient1 dicotyledons)
ARCHICHLAMYDEAE
Aralesi (taro)
Liliales
iButomales
(Monocotyledons)
Taro plant (.Colocasia) bel0!1gsto the araceae.family of
the arales order of monocoty.ledons whereas spinach (Spinaceae)
belo~gs to the chinopode.aceae. family ,of chenopodiales 'order

97
Of dicotyledons. The morphol~gical differences between mono
cotyl.edons and dicoty.ledonsare .wellknown. From acompara
t.ivestudy of ferredoxins. from various monocotyledons and
dicotyledons, it could be possihleto estimate. the time lapse
that had occurred betw.een the .evolution of each sp.ec.ies in
these two classes Of plants.
The primary sequence of cytochrome c Of at least ~wenty
animal species is known. Ma~goliash and Sch~gter have dis
cussed in detail (28) the similarities and di·fferences of
thesecy.tochromes and their usefulness in the understandi~g
.ofthe .evolution of animal spec.ies. No such study has been
made with plant proteins. Ferredoxins are present in all
plants, includi~g a~gae, examined and seems to be .the ideal
choice. for comparative s.tudy Of primary structures in order
to. explore the phyl~genetic relationship in plants . We have
made a start toward this, goal bystudyi~g the characteristics
.of.ferredoxin from a monocotyledon. It is our aim to advance
toward this, goal by studyi~g the characteristics of. ferre
doxins from plants of lower order like a~gae and tropical
ferns. One of the recent instances of the use of protein se
quence data in solvi~gproblems of taxonomy is illustrated
in the report of the work Of Dr. Charles Sibley of Yale Uni
versity in the classification of birds from the structures
of their blood and ~ggwhite proteins [Chemical and E~gineeri!1g
News, 48, 108 (1968)J.
98
Thr.ee types of:ferredoxins have .b.een isolated so far
from plant s and bacteria. Ferre.doxins. 'from clostr.idiaand
other non-photosynthet.ic bacteria contain about 55 amino acid
residues per molecule, the plant anda~gal ferredoxins con
tain about 100 amino acid res.idues per molecule, while the
ferr.edoxin. from photo.synthetic bacteria, chromatium,contains
84 amino acid residues per. molecule (125). The primary struc
ture Of spinach ferredoxin shows many similarities with that
Q. butyricum ferredoxin and it has been s~ggested that both
types of. ferredoxins would have been evolved from a common
arche type ,(75). The primary structure .of. chromatium ferre
doxin is e!3-gerly awaited, as this would indicate whether the
photosynthet.ic bacteria forms a bri~ge betw.een the non-photo
synthetic anerobes and .plants. De.termination .of the amino
acid sequence of low molecular we?-ght mammalian proteins like
adrenodoxin and testodoxin (126) and h?-gh molecular we?-ght
mammalian proteins like succinic dehydr~genase and xanthinE!
oxidase would establish the str.uctural relationship betw.een
the non-heme iron electron transfer proteins .of. various spe
cies.
APPENDIX
A. Tables. P~gea iaa to 114.
B. F~gures. P~ges 116 to 146.
99
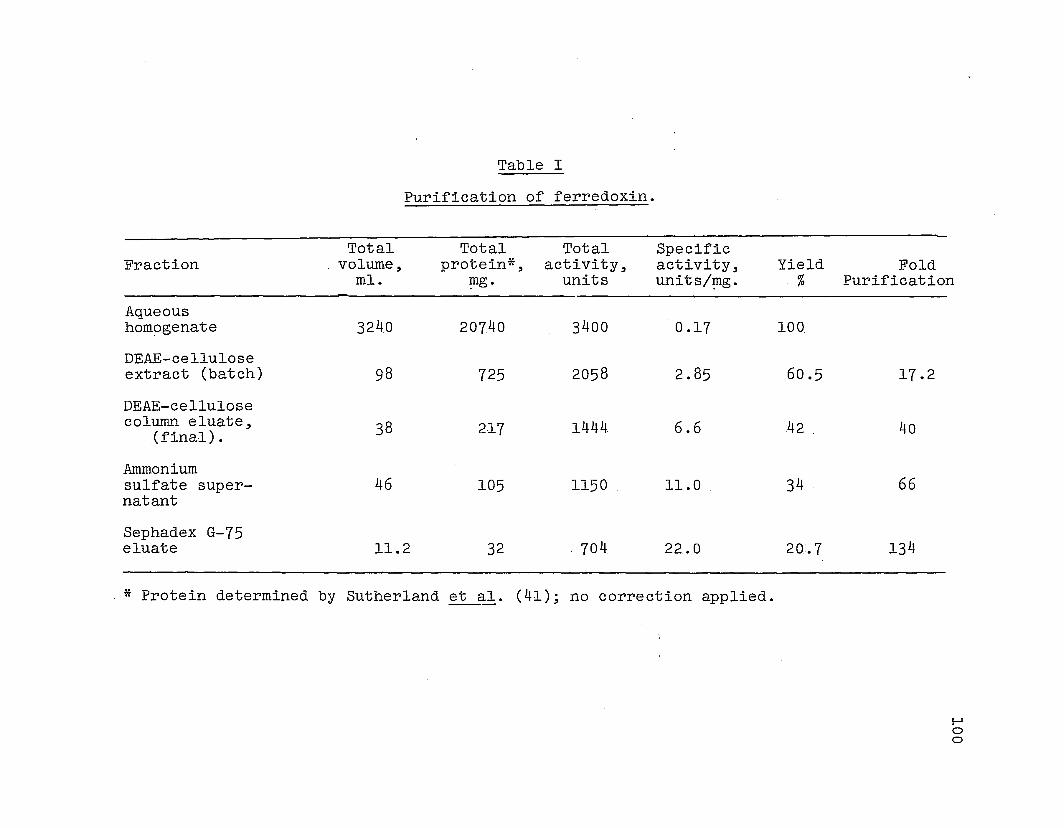
Table I
Purification of ferredoxin.
Total Total Total SpecificFraction volume~ protein*~ activity~ activity~ Yield Fold
mI. ~g. units units/~g. % Purification
Aqueoushom~genate 3240 20740 3400 0.17 100
DEAE-celluloseextract (batch) 98 725 2058 2.85 60.5 17.2
DEAE-cellulosecolumn eluate~ 38 217 1444 6.6 42 40(final) .
Ammoniumsulfate super- 46 105 1150 11.0 34 66natant
Sephadex G-75eluate 11.2 32 704 22.0 20.7 134
* Protein determined by Sutherland et ale (41); no correction applied.
f-Joo
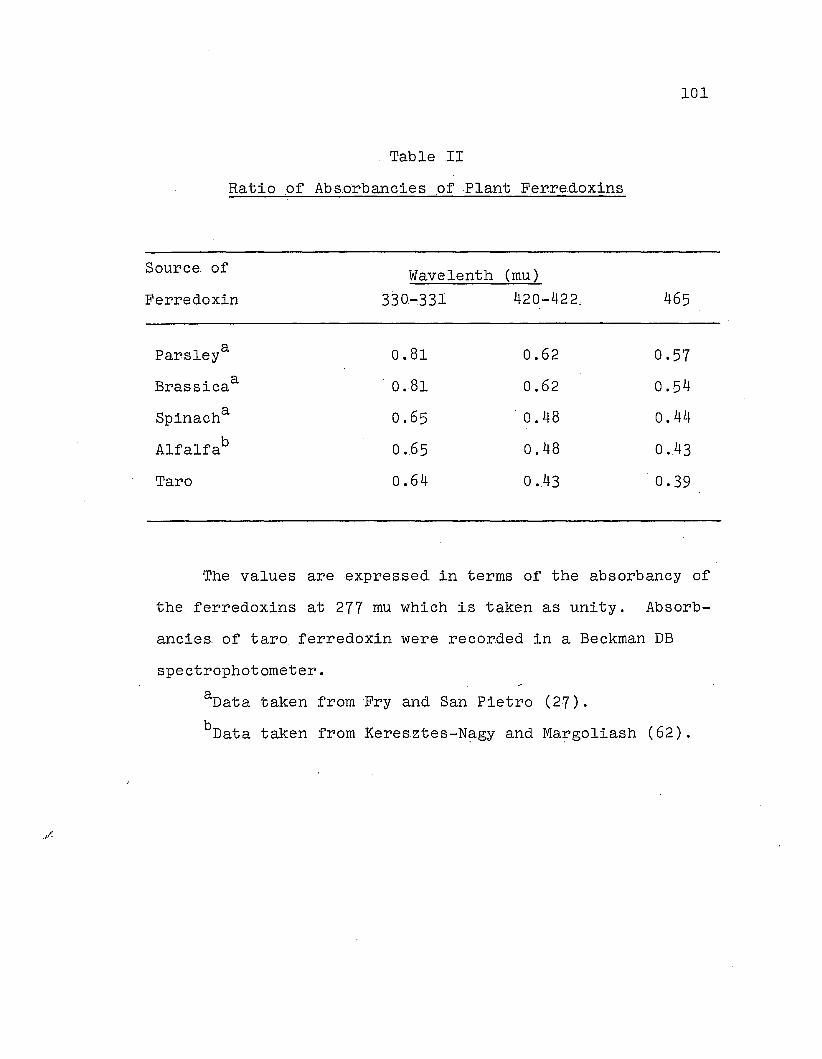
101
Table II
Ratio of Absorbancies of Plant Ferre.doxins
Source of Wavelenth (mu)
Ferredoxin 330-331 420-422, 465
Parsleya 0.81 0.62 0.57
Brassicaa 0.81 0.62 0.54
Spinacha 0.65 0.48 0.44
Alfalfab 0.65 0.48 0 ..43
Taro 0.64 0 ..43 0.39
The values are expressed in terms of the absorbancy of
the ferredoxins at 277 mu which is taken as unity. Absorb-
anciea of taro ferredoxin were recorded in a Beckman DB
spectrophotometer.
aData taken from Fry and San Pietro (27).
bData taken from Keresztes-N~gy and Ma~goliash (62).
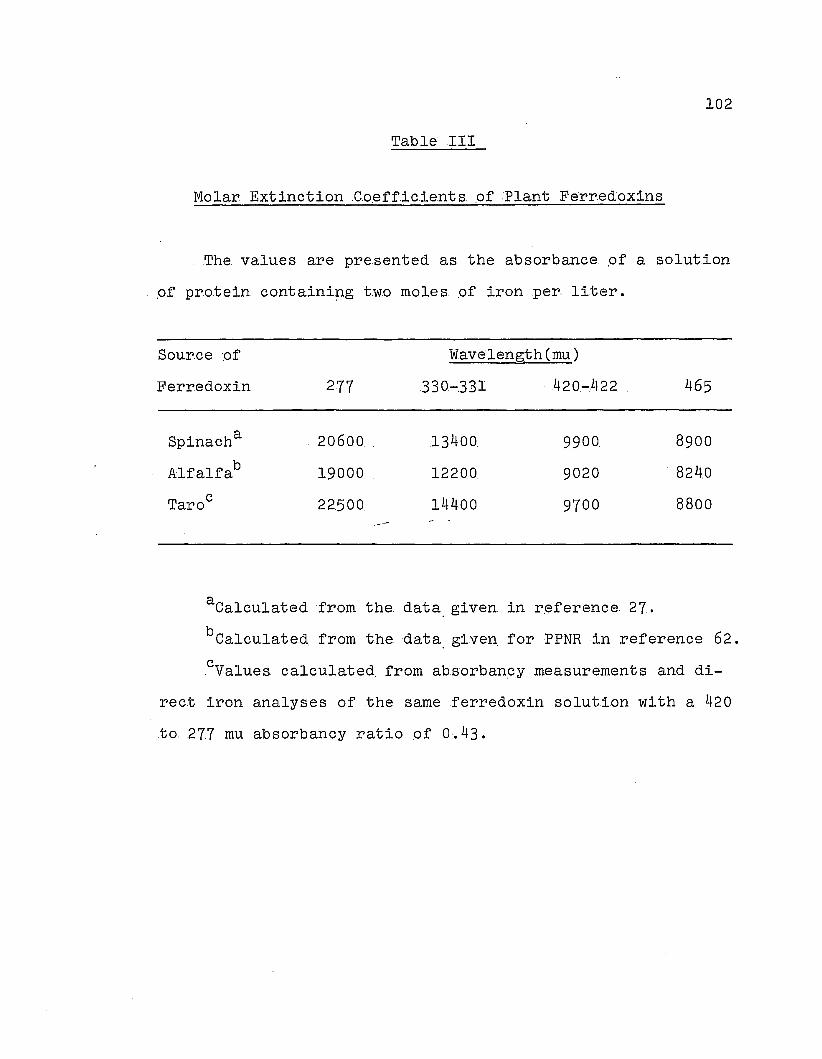
102
Table III
Molar Extinction .Co.eff.icients .ofPlant Ferredoxins
The values are presented as the absorbance .of a solution
,of pr.otein containip.g two moles of iron per liter.
Sour.ce ',of Wavelength(mu)
Ferredoxin 277 330,-331 ' .420,-422 4.65
Spinacha 20600 13400 9900 8900
Alfalfab 19000 12200 9020. 8240
Taroc 22500 14400 9700 8800
aCalculated from the data given in r~ference 27.
bCalculated from the data. given, forPPNR in r.eference 62 .
.cValues calculated, from absorbancy measurements and di-
rect iron analyses of the same ferredoxin solution with a 420
to 277 fiU absorbanoy ratio .of 0.43.
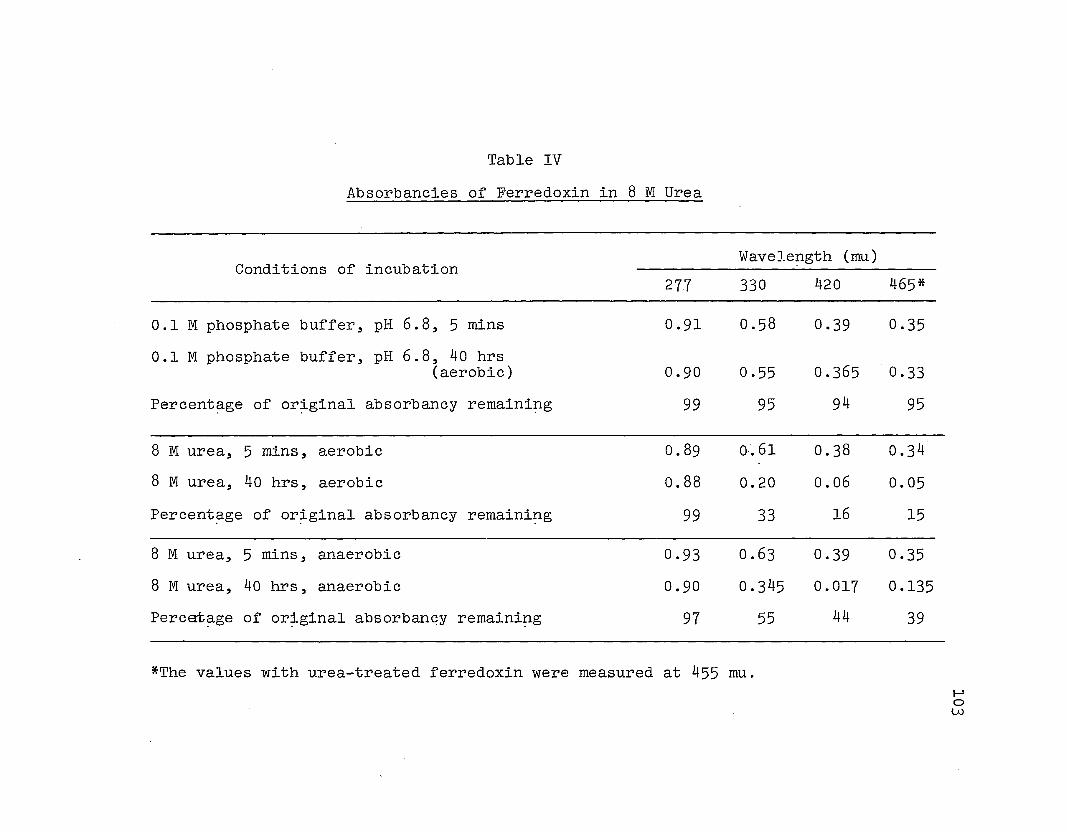
Table IV
Absorbancies of Ferredoxin in 8 M Urea
Conditions of incubation
0.1 M phosphate buffer, pH 6.8, 5 mins
0.1 M phosphate buffer, pH 6.8, 40 hrs(aerobic)
Percent~ge of or~ginal absorbancy remaini~g
8 M urea, 5 mins, aerobic
8 M urea, 40 hrs, aerobic
Percent~ge of or~ginal absorbancy remaini!lg
8 M urea, 5 mins, anaerobic
8 M urea, 40 hrs, anaerobic
Percet~ge of or~ginal absorbancy remaini!lg
WaveJ.e!lgth (mu)
277 330 420 . 465*
0.91 0.58 0.39 0.35
0.90 0.55 0.365 0.33
99 95 94 95
0.89 0:.61 0.38 0.34
0.88 0.20 0.06 0.05
99 33 16 15
0.93 0.63 0.39 0.35
0.90 0.345 0.017 0.135
97 55 44 39
*The values with urea-treated ferredoxin were measured at 455 mu.I-'ow
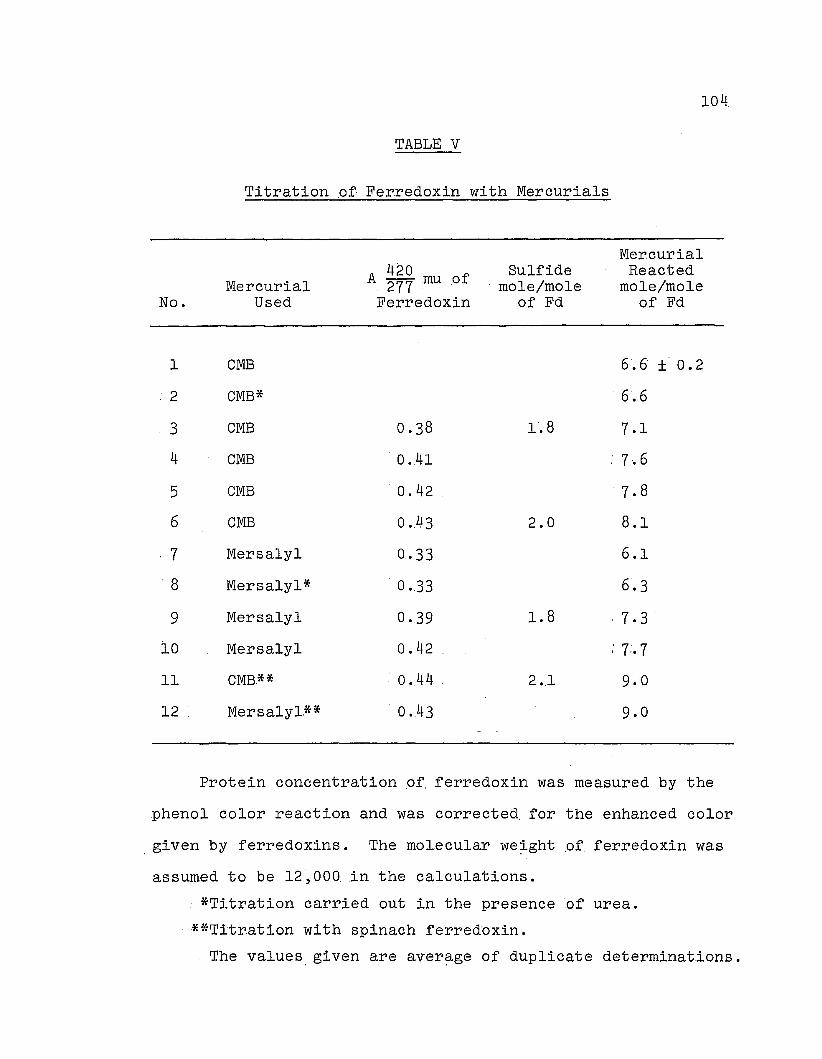
104
TABLE V
Titration .of Ferredoxin with Mercurials
No.Mercurial
Used
420A 277 mu .ofFerredoxin
Sulfidemole/mole
of Fd
Mer.curialReacted
mole/moleof Fd
1 CMB 6.6 ± 0.2
'2 CMB* 6.6
3 CMB 0.38 1.8 7.1
4 CMB 0.41 ; 7·.6
5 CMB 0.42 7.8
6 CMB 0.43 2.0 8.1
7 Mersalyl 0.33 6.1
'8 Mersalyl* 0.33 6.3
9 Mersalyl 0.39 1.8 7.3
10 Mersalyl 0.42 ; 7·.7
11 CMB.** 0.44 2..1 9.0
12 . Mersalyl.** 0..43 9.0
Protein concentration o~ ferredoxin was measured by the
phenol color reaction and was corrected for the enhanced color
given by ferredoxins. The molecular we?-ght .of ferredoxin was
assumed to be 12,000 in the calculations.
*Titration carried out in the presence of urea.
**Titr.ation with spinach ferredoxin.
The values. given are aver~ge of duplicate determinations.
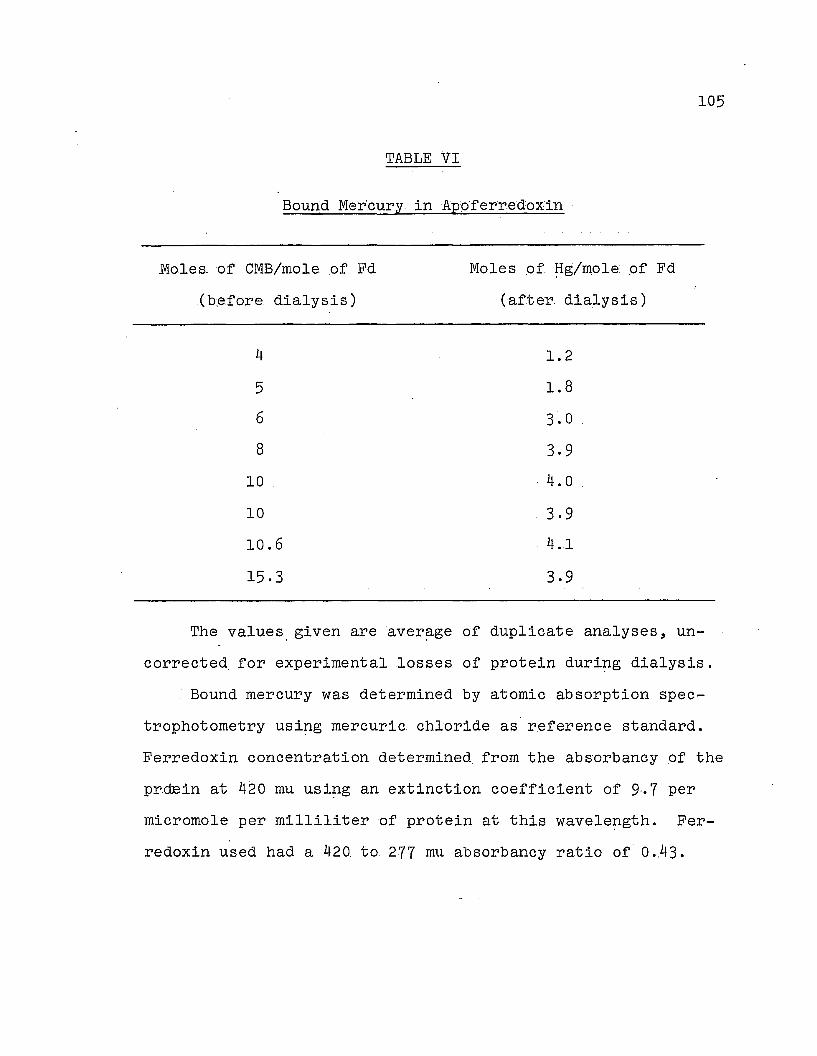
105
TABLE VI
Bound Mer'.cury, in Ap.oferredox·in
.Mole s. afeMB/mole .of Fd
(b~fore dialysis)
4
5
6
8
10
10
10.6
15.3
Moles .of. ~g/IJlole ,of Fd
Carter dialysis)
1.2
1.8
3.0
3.9
4.0
3.9
4.1
3.9
The values gi.ven are aver~ge of duplicate analyses, un
corrected for experimental losses of protein duripg dialysis.
Bound mercury was determined by atomic absorption spec
trophotometry usipg mercuric chloride as reference standard.
Ferredoxin concentration determined from the absorbancy .of the
prdEin at 420 mu usipg an extinction coefficient of 9,.7 per
micromole per milliliter of protein at this wavelepgth. Fer
redoxin used had a 420 to 277 ~1 absorbancy ratio of 0.43.

Table VII
Reaction of DTNB with Taro Ferredoxin.
+
Reaction Conditions. 4 M guanidinehydrochloride EDTA Air
+
Time for maximum Maximum moles Moles of DTNBcolor formation of DTNB reduced reduced per mole
at 412 mu per mole of Fd of Fd in 15 mins
42 hrs 8.5 0.9
7hrs 5.5 0.6
10 mins 5.6 \ 5.6
5 mins 5.6 5.6
4 mins 5.2 5.2
1 min 3.5 3.5
4 hrs 2.0 0.8
4 hrs 2.0 . 0 •.4
+
+
+
+
+ +
+
+
+
+
Reaction mixtures contained 0·.05-0.07 micromole of ferredoxin in 0.05 M Tris-RCl., pH 7.2.,
1 micromole of DTNB., and 0.1 mmole of EDTA and 10 m mole of. guanidine-RCI where present.,
in a final volume of 3 mI. Anerobic titrations were carried out as described under
methods. In reactions involvipg EDTA., this re~gentwas added last. A4l2 mu was measured
in a Beckman DB· Spectrophotometer.I-'o.0"\
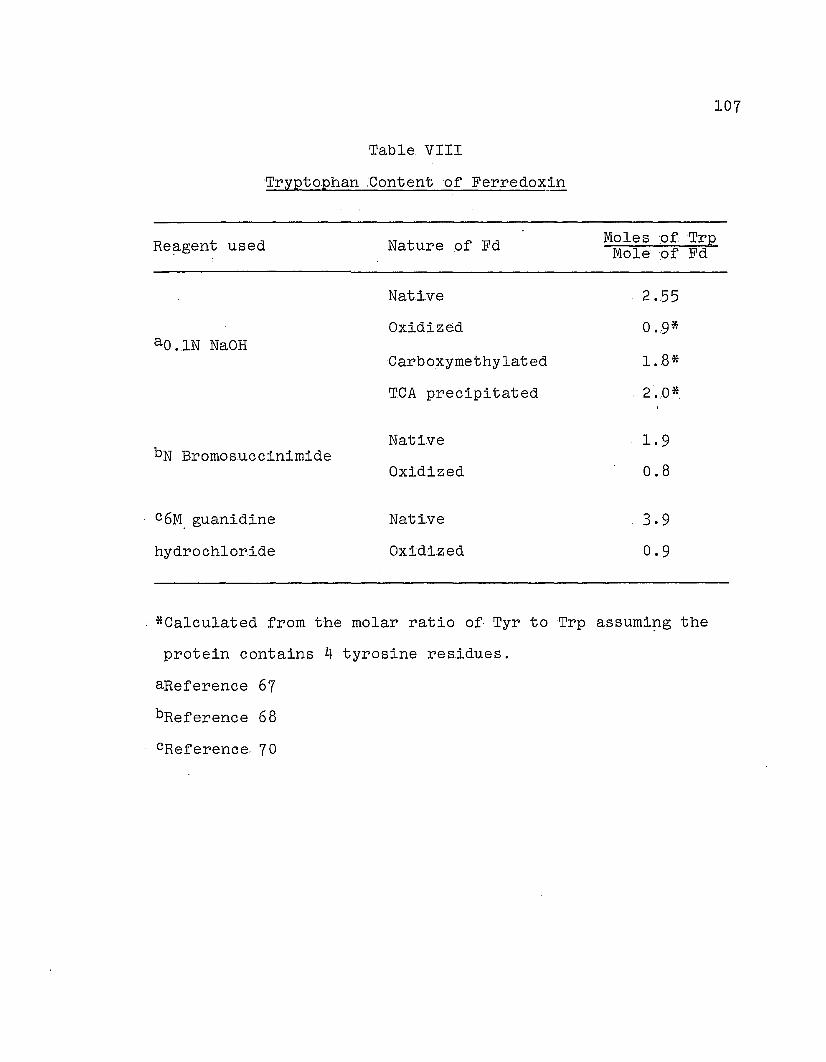
107
Table VIII
Trypto.phan :Contentqf Ferredoxin
Re!igent used
ao ..1N NaOH
bN Bromosuccinimide
c6M. guanidine
hydrochlor.ide
Nature of Fd
Native
Oxidized
Carboxymethylated
TCA precipitated
Native
Oxidized
Nat.ive
Oxidized
Mo.les .of: TrplVlole :of Fd
2.55
0.9*
1.8*
2.0*.
1.9
0.8
3.9
0.9
*Calculated from the molar ratio of Tyr toTrp assumi!1g the
protein contains 4 tyrosine residues.
aReference 67
bR.eference 68
cReference, 70
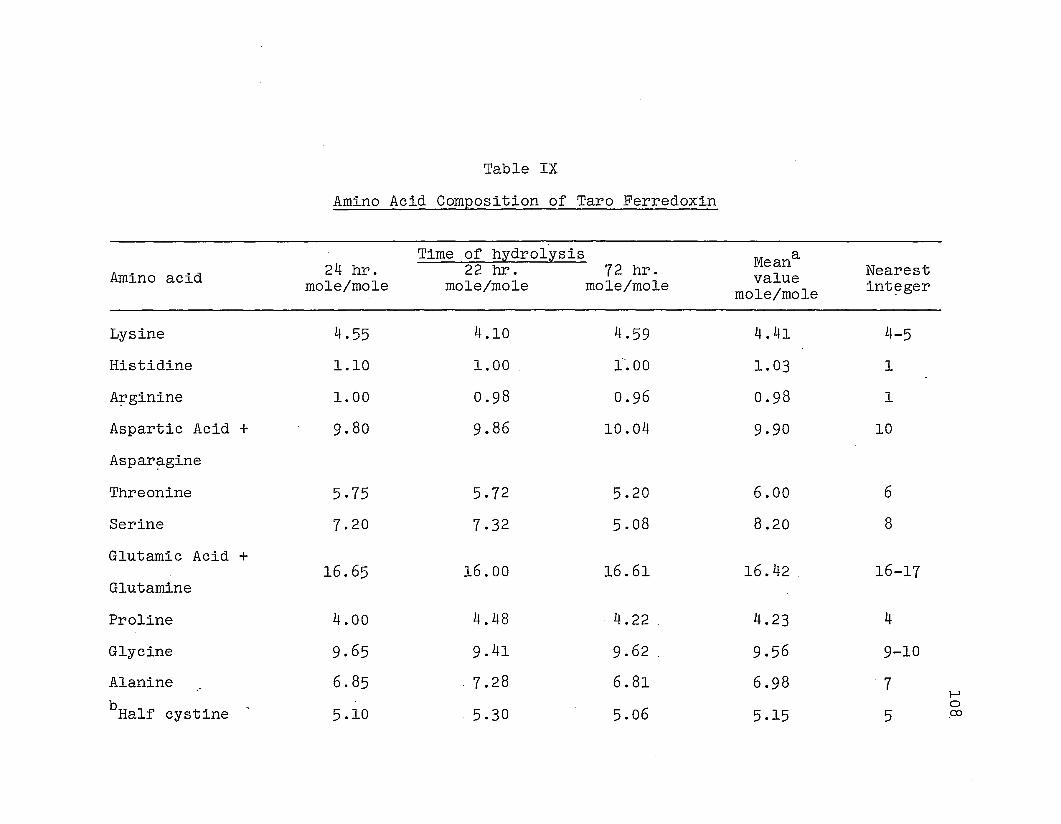
Table IX
Amino Acid Composition of Taro Ferredoxin
Time of hydrolysis Me anaAmino acid 24 hr. 22 hr. 72 hr. value Nearest
mole/mole mole/mole mole/mole mole/mole int~ger
Lysine 4.55 4.10 4.59 4.41 4-5
Histidine 1.10 1.00 1'.00 1.03 1
A~ginine 1.00 0.98 0.96 0.98 1
Aspartic Acid + 9.80 9.86 10.04 9.90 10
Aspar~gine
Threonine 5.75 5.72 5.20 6.00 6
Serine 7.20 7.32 5.08 8.20 8
Glutamic Acid +16.65 16.00 16.61 16.42 16-17
Glutamine
Proline 4.00 4.48 4.22 4.23 4
Glycine 9.65 9.41 9.62 9.56 9-10
Alanine 6.85 . 7.28 6.81 6.98 7I-'
bHalf cystine, 0
5.10 5.30 5.06 5.15 5 co
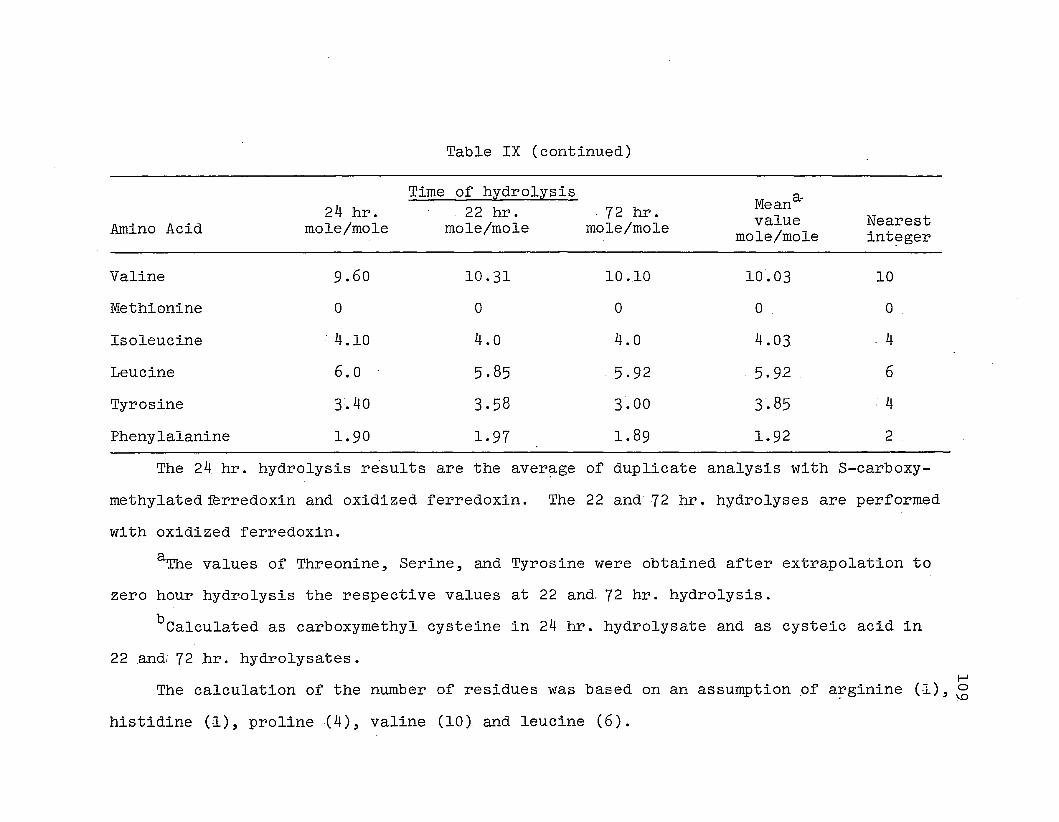
Table IX (continued)
Time of hydrolysisMe ana-24 hr. 22 hr. . 72 hr.
Amino Acid mole/mole mole/mole mole/mole value Nearestmole/mole int~ger
Valine 9.60 10.31 10.10 10.03 10
Methionine 0 0 0 0 0
Isoleucine . 4.10 4.0 4.0 4.03 4
Leucine 6.0 5.85 5.92 5.92 6
Tyrosine 3.40 3.58 3.00 3.85 ·4
Phenylalanine 1.90 1.97 1.89 1.92 2
The 24 hr. hydrolysis results are the aver~ge of duplicate analysis with S-carboxy
methylated~rredoxinand oxidized ferredoxin. The. 22 and 72 hr. hydrolyses are performed
with oxidized ferredoxin.
aThe values of Threonine, Serine, and Tyrosine were obtained after extrapolation to
zero hour hydrolysis the respective values at 22 and 72 hr. hydrolysis.
bCalculated as carboxymethyl cysteine in 24 hr. hydrolysate and as cysteic acid in
22 .and; 72 hr. hydrolysates.I-'
The calculation of the number of residues was based on an assumption Of a~ginine (1), ~
histidine (1), proline .( 4), valine (10) and leucine (6).

Table X
Amino Acid Composition of Taro? Spinach and
Alfalfa ~erredoxin.
110
Amino Acid Taro Spinacha Alfalfab
Lysine 4--5 4 5
Histidine 1 1 2
A!'ginine 1 1 1
Tryptophan 1 1 1
Aspartic acid +10 13 10
Aspar!3-gine
Threonine 6 8 6
Serine 8 7 8
Glutamic acid +16-17 13 17 .
Glutamine
Proline -4 4 3
Glycine 9-10 6 7-8
Alanine 7 9 10
Half cystine 5 5 6
. Valine 10 7 9
Methionine 0 0 0

III
Table X (continued)
Amino Acid
Isoleucine
Leucine
Tyrosine
Phenylalanine
Taro
4
6
4
2
98-101
Spinacha
4
8
4
2
97
Alfalfab
4
6
4
2
101-102
aValues .of spinach ferredoxin were taken from Matsubara et ale
.( 75) .
bValues of alfalfa ferredoxin were taken from Kerestzes-N~gy
and Ma~goliash (62).

Table XI
Differences in the Amino Acid Composition of Plant Ferredoxins.
Source of Ferredoxin
Amino Acid Taro Spinach Alfalfa
Lysine 4-5 4 5
Histidine 1 1 2
Proline 4 4 3
Half cystine 5 5 6
*Aspartic acid+Glutamic acid 26-27 26 27
Glycine+Alanine 16-17 15 17-18
Valine+Leucine 16 15 15
Threonine+Serine 14 15 14
*Aspar~gine and glutamine values were included in aspartic acid and glutamic acid
respectively.
I--'I--'l\.)

113
Table XII
Amino Acids Released by Hydrazinolysis of Ferredoxin.
Amino Acid
Alanine
Glycine
Leucine
Serine
Valine
Aspartic Acid
Threonine
moles/mole of protein
Hydrazinolysis was carried out by heati~g the protein with
95% hydrazine and hydrazine sulfate for 16 hours at 60 0 • The
values are the aver~ge of duplicate determinations
(uncorrected for experimental losses).
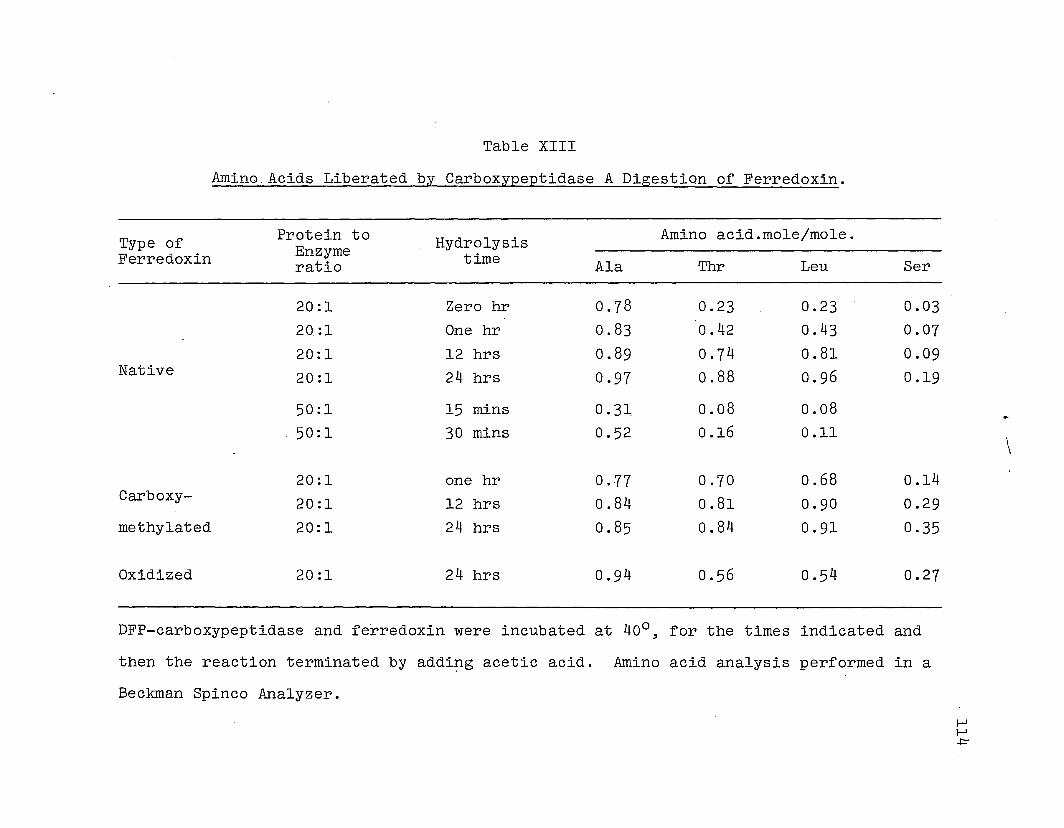
Table XIII
Amino. Acids Liberated by Carboxypeptidase A Digestion of Ferredoxin.
Type of Protein to Hydrolysis Amino acid.mole/mole.EnzymeFerredoxin ratio time Ala Thr Leu Ser
20:1 Zero hr 0.78 0.23 0.23 0.03
20:1 One hr 0.83 0.42 0.43 0.07
20:1 12 hrs 0.89 0.74 0.81 0.09Native 20:1 24 hrs 0.97 0.88 0.96 0.19
50:1 15 mins 0.31 0.08 0.08
50:1 30 mins 0.52 0.16 0.11\\
20:1 one hr 0.77 0.70 0.68 0.14Carboxy- 20:1 12 hrs 0.84 0.81 0.90 0.29methylated 20:1 24 hrs 0.85 0.84 0.91 0.35
Oxidized 20:1 24 hrs 0.94 0.56 0.54 0.27
DFP-carboxypeptidase and ferredoxin were incubated at 40 0 , for the times indicated and
then the reaction terminated by addi~g acetic acid. Amino acid analysis performed in a
Beckman Spinco Analyzer.
(--J
i:...J~
115
F~g. 1. Taroferredoxin-.mediated photoreduction
of NADP.
The reaction mixture contained, in a final volume
of 3.0 ml,O.50 micromole .of NADP, 0.15 millimole of Tris
HCl bUffer,. chloroplast suspension containi~g 60 micro
gram of chlorophyll, and amounts of ferredoxins as indi
cated. The blank cuvettes contained the same components
except ferredoxin. Illumination time was 5 mins.
(-.-.-e;..) Pure ferredoxin, A420 = 0.43.to 277 mu(-0-0-0-) Aged ferredoxin, A420 = 0.38.to 277 mu(-Q-C-Q;..) Ammonium sulfate supernatant obtained duri~g
the isolation of ferredoxin.
(-~-A-A-) DEAE-cellulose column eluate, with 0.3 M Cl
bUffer, duri~g the isolation of ferredoxin.
The protein concentration was determined by the method of
Sutherland etal. (41) and corrected for excess of color
as described under "Results".
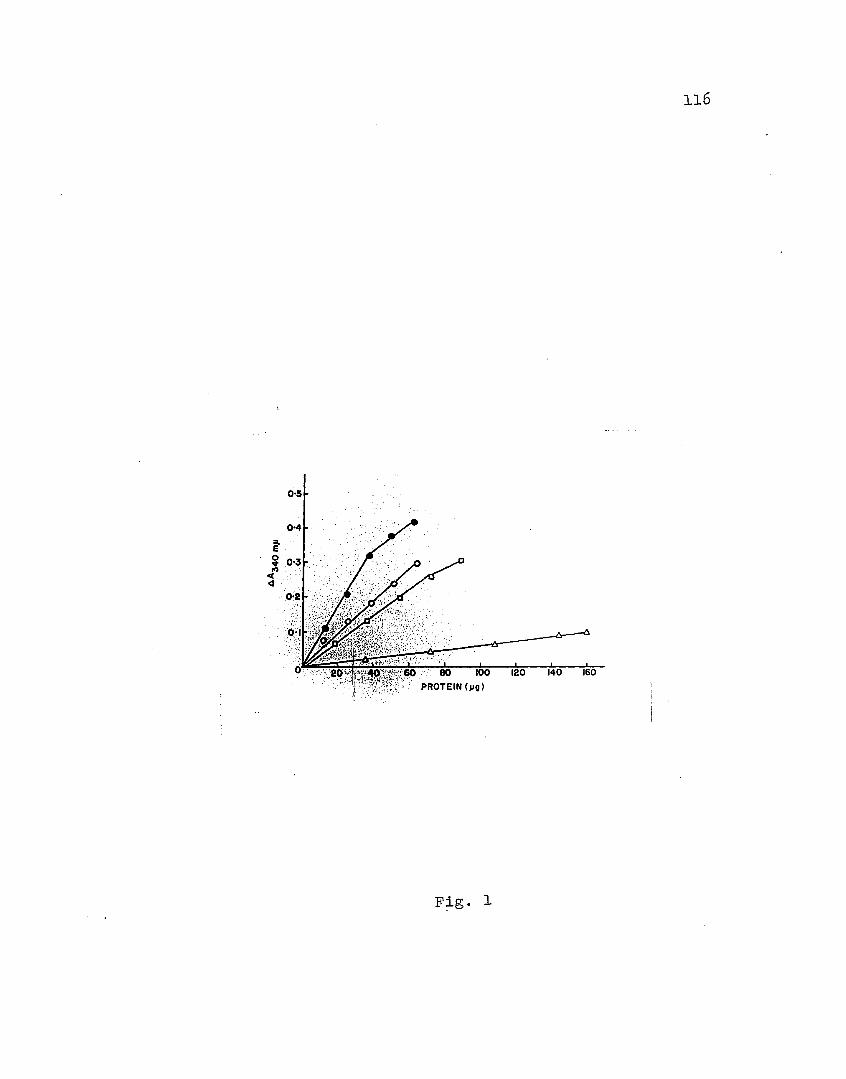
120 140 160
116
F~g. 2. Absorption spectra of pure ferredoxin.
Spectrum of a solution of ferredoxin (ca 0.1 micromole) in 3ml of Tris-
HCl bUffer, pH 7.3, was recorded ~gainst a blank containi~g the same buffer in
a Cary 14 Spectrophotometer.
I-'F-'-..;:j
Broken line ---- Spinach ferredoxin; Solid line taro ferredoxin.---
F~g. 3. Absorption spectra of 'cuts' obtained duri~g the
purification of ferredoxin.
The spectra of the protein solutions in Tris-HCl buffer were recorded
~gainst a blank containi~g the same buffer in a Cary 14 Spectrophotometer.
Curve A
Curve. B
Curve C
Spectrum of 0.3 M Cl- eluate from DEAE-cellulose column.
Spectrum of 0.1 M Tris-HCleluate before ammonium sulfate precipitation.
Spectrum of supernatant after ammonium sulfae precipitation.
For details about the 'cuts', see "Methods".

118
.bO·ri.P:!
C\J
.bO·ri.P:!
F~g. 4. Starch. gel electrophoresis of taro ferredoxin.
Electrophoresis was carried out in pH 8.0 buffer, for 3 hrs. at 0° and
400-500 volts. Protein bands were detected by staini~g with n~grosine
black. The anodic end of the. gel is at the top of the phot~graph.
a. Protein band obtained with freshly prepared ferredoxin
(A420 to 27.7 mu = o. 43 ) .
b. Protein bands obtained with an ~ged preparation of ferredoxin
(A420 to 277 mu = 0.38).
~
~\0

on·ri.P:!
120.
F~g. 5. Disc electrophoresis of ferredoxins
in polyacrylamide gels.
a. Protein bands obtained by electrophoresis of taro (T) and spinach
(8) ferredoxins in 7.5% acrylamide. gel at room temperature. Gels
were stained with amido black.
b. Protein bands obtained by electrophoresis of spinach (8) and taro
(T) ferredoxins in 30% acrylamide. gel at room temperature.
For details of electrophoresis, see "Methods".
I-'I\)
I-'
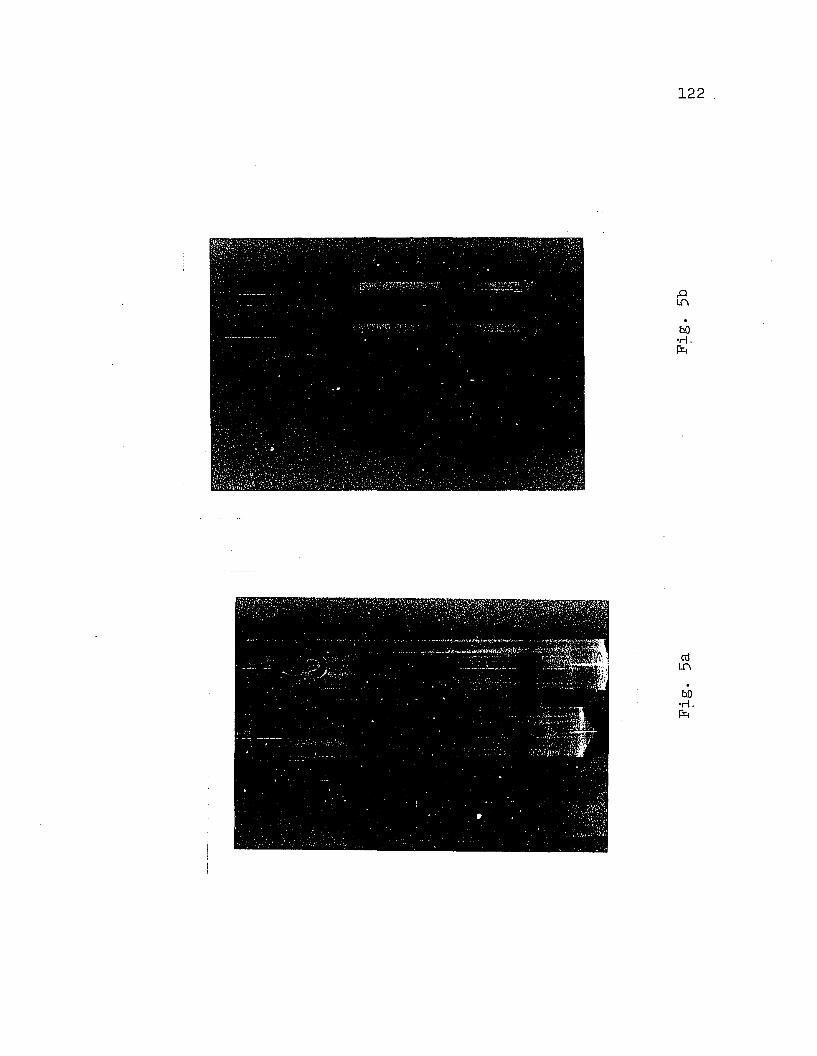
122
,.QLr\
b.O'r!'p:.
cOLr\
.b.O·rI.p:.
123
F;ig. 6. Gel filtration .of pro.teins in Sephadex 'G-100
Proteins (ca 5 ~g each) dissolved in 1 ml of 0 ..2M
Tris HCl bUffer, pH 7.5, were layered on top of a sepha
dex G-100 column, at 4°, and were eluted with the same
Tris buffer. The elution volume .(V) of each protein was
determined by measuri~g the absorbancy .of the effluent
fractions at 280 mu. The void volume (Va) was determined
by usi~g Blue Dextran 2000. Molecular we;ight values are
plotted on a l~garithmic scale.
F;ig .. 7. Sedimentation analysis of proteins
in sucrose, gradient.
Proteins (ca 2.5 !llg each) were dissolved in 0.5 ml
of 0.1 M phosphate buffer, pH 6.8, and layered on top of
5-20% sucroBe, gradients. After 64 hr. centrif~gationat
41,000 r.p.m. 4°, the, gradients were. fractionated and
protein concentration determined. The proteins used were:
Ferredoxin (-e-.-_-), Cytochrome c (-)(-X-x-) and Tryp
sin (-.-A-j-).·
124 .
125
F~g. 8. Absorption spectra..of dithionite.-.ferre.
doxin mixtures.
Sodium dithionite.in 100M excess was added to asolu
tion of ferredoxin(ca 1.5 ~g)in Tris-HCl buffer main
tained artobically and anaernbically. The spectra were
recorded immediately after mixi~g the solution, and after
24. hr. stor~ge at 4° ,~gainst a Tris buffer. blank.
Curve A --- Spectrum of Fd-dithionite immediately after
mixi~g in air.
Curve B --- Spectrum of Fd-dithionite immediately after
mixi~g anaerobically.
Cur.ve C --- Spectrum of aerobically maintained mixture
after 24 hr.
Curve D --- Spectrum of anaerobically maintained mixture
after 24 hr.
F~g. 9. Absorption spectra of dithionite-treated
ferredoxin.
Sodium dithionite in 500 M excess was added to a
solution of taro ferredoxin (0.. 5 ~g per ml of Tris-HCl
bUffer, pH. 7. -3) and the mixture kept at room temperature
for one hr. Excess of dithionite was then removed by
extensive dialysis ~gainst water.
Curve A Spe ctrum .of pure. ferredoxin .
Curve. B Spectrum of dithionitetreated ferredoxin.
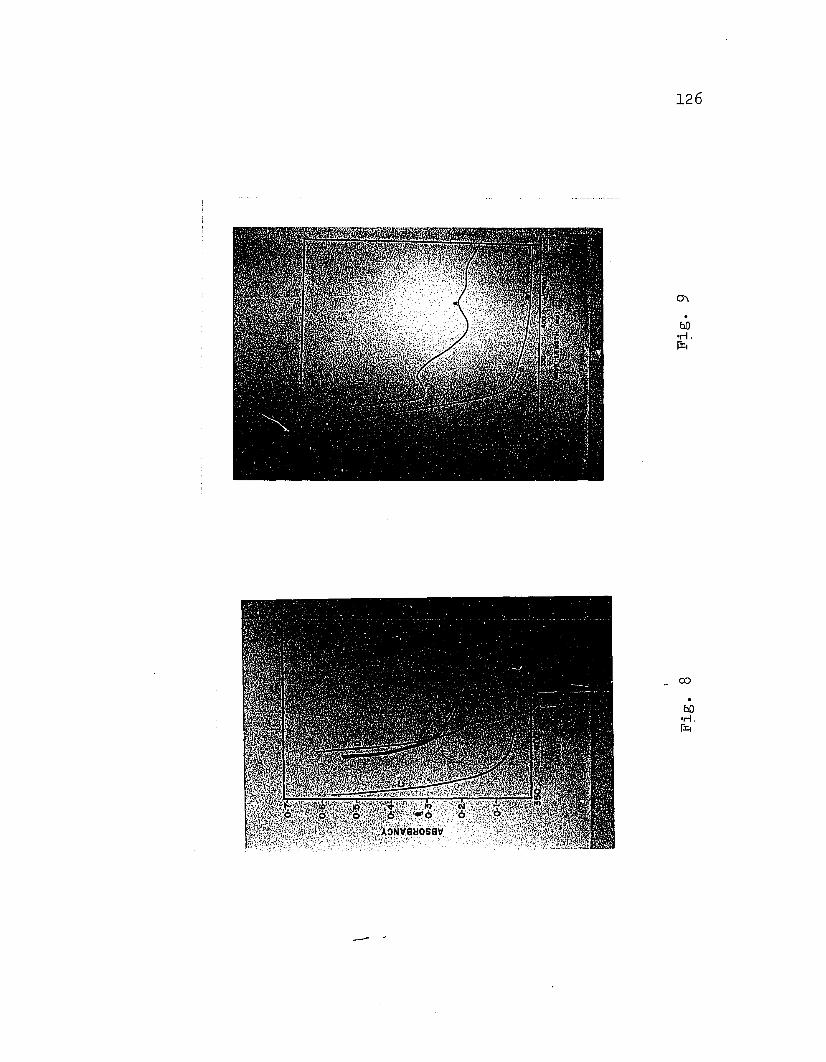
- .
126
co
.b.O·rI.ILl
F~g. 10. Absorption spectra of Urea-Fd mixtures.
Taro ferredoxin (ca 1.5 ~g) was dissolved in 3 ml of 8 M urea. The
spectrum of the solution was recorded 5 mins. after mixi~g, and after 40
hr. incubation at 4° ~gainst an 8 M urea blank.
a. Curve A -- Spectrum of ferredoxin in 8M urea, 5 mins. after
mixi~g in air.
Curve B -- Spectrum of the above solution after 40 hr. aerobic
incubation.
b. Curve A -- Spectrum of ferredoxin ~n 8 M urea (anaerobic) 5 mins.
after mixi~g.
Curve B -- Spectrum of the above solution after 40 hr. anaerobic
incubation.
~f\)
~
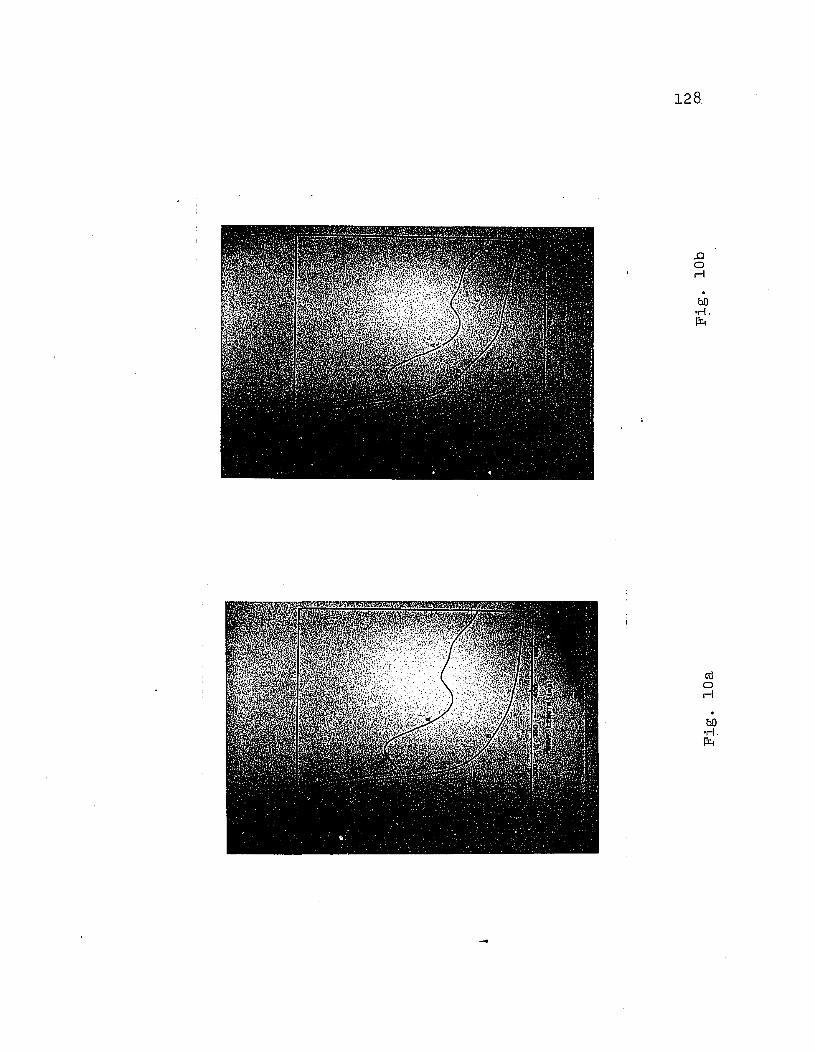
128
..aorl
.bO·rI.IXt
cdorl
.bO·rI.IXt
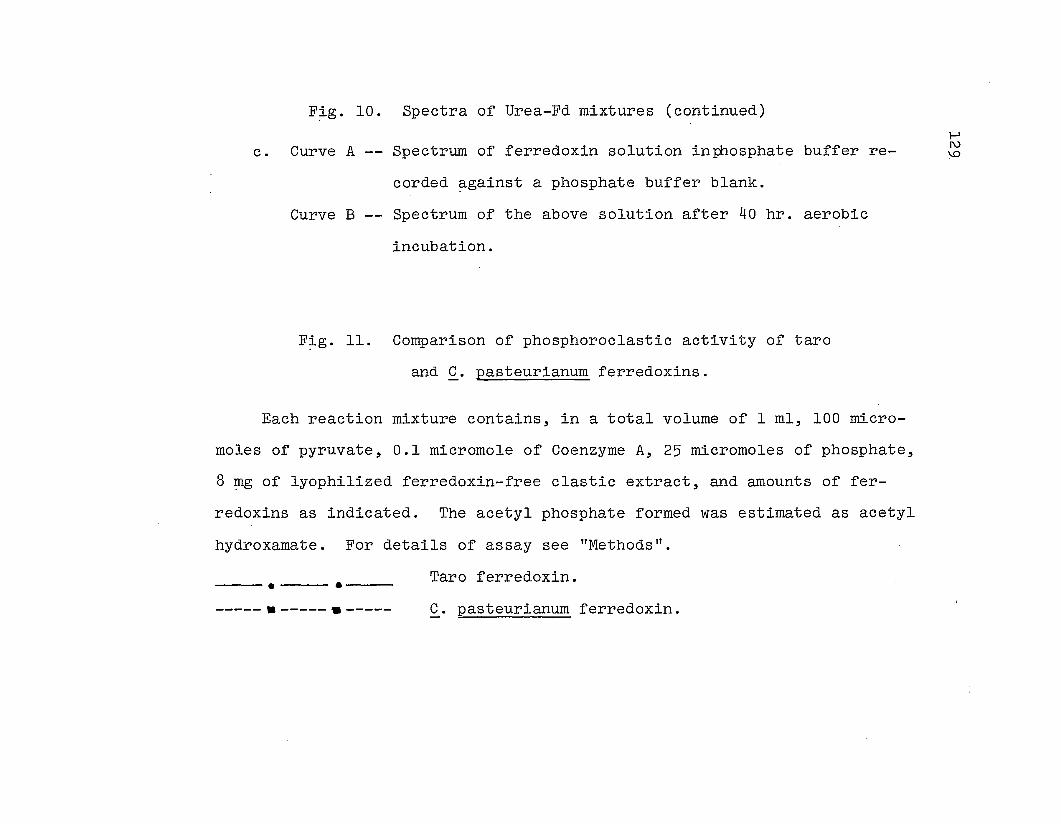
F~g. 10. Spectra of Urea-Fd mixtures (continued)
c. Curve A -- Spectrum of ferredoxin solution inPhosphate buffer re-
corded ~gainst a phosphate buffer blank.
Curve B -- Spectrum of the above solution after 40 hr. aerobic
incubation.
F~g. 11. Comparison of phosphoroclastic activity of taro
and C. pasteurianum ferredoxins.
Each reaction mixture contains, in a total volume of 1 ml, 100 micro-
moles of pyruvate, 0.1 micromole of Coenzyme A, 25 micromoles of phosphate,
8 ~g of lyophilized ferredoxin-free clastic extract, and amounts of fer
redoxins as indicated. The acetyl phosphate formed was estimated as acetyl
hydroxamate. For details of assay see "Methods ll•
~('\)
\.D
----. .--------- .----- .-----
Taro ferredoxin.
C. pasteurianum ferredoxin.

130
rIrI
oorI
Q()·n.JX.l

131
F?-g. 12. Titration of. ferredoxin withCMB.
CMB .solution wasaddedina1iquots to a soluti~on.of
ferredoxin ·in 0.05 M phosphate. b.u.ffer, pH 6.5 ,and .after
20 min. incubation at..25.0. the :absorbancy. .of the reaction
mixture was measured ~gainst a .b:ufferb1ank. Absorbancy
values have been correc.ted;for the absorption due to; fer-
redoxin and CMB and also. for dilution effects . Prctein
concentration were determiried by the phenol color reaction.
-1-1-1-, Titration ~gainstsodium sulfide, 0.16 micromo1e.
-x-x-x-, Titration ~gD.nst spinach ferredoxin, 0.064
micromo1e, A420 to 277 mu =0.44.
-.-.-e-, Titration ~gainst taro ferredoxin, 0 ..039 micro-
mole,. A420 to 277 mu = 0.43.
F?-g. 13. Titration of ferredoxin ~gainst mersalyl.
Mersalyl solution was added ina1iquots to anaero-
bica11y maintained ferredoxin and dye mixture and the ab
sorbancy was measured after. 20. min. incubation at 25°. Ab-
sorbancy values have heencorrected for dilution e.ffects.
Protein concentrations were determined by the phenol color
reaction.
-x-x-x-, Titration ~gainst reduced glutathione , 0 ..1 micro
mole.
-e-e-e-, Titration ~gainst spinach ferredoxin (A420 to 277
mu =' 0 •.43},0 '.069 micromo1e.
-a-'I-I-, Titration ~gainst taro. ferredoxin (A420 .to. 277 mu
= 0.42), 0.039 micromo1e.
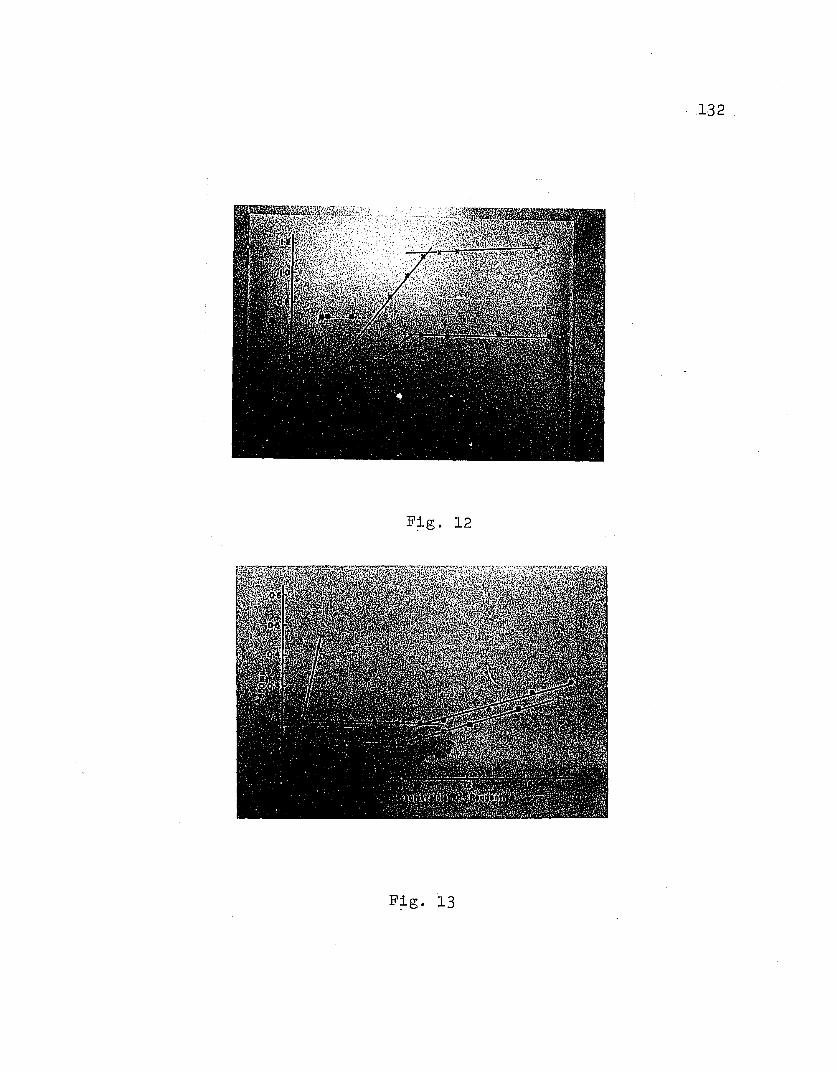
132

133
F~g. 14 ..Effect .of CMB on the .ahsorbancy of taro..ferredoxin.
Aliquots.ofstandardCMBsolution were added to. a .solu
tion of ferredoxin (1. 2~g) in phosphate. buffer., pH 6.5.
After 20. min. incubation at 25° the.absorbancy of the reac-·
tion mixture was recorded at 255, 280,. 330, 420 and 465 mu,
9-gainst a phosphate b:uffer. blank, in a Cary 14 Spectrophoto
meter. The values. given have .been .corrected for dilution
effect and for the absorbancy. of CMB at the respective wave
le~gths.Calculations from the absorbancy increase at 255 mu
(not shown in the. graph) showed that, 7.1 moles of CMB reacted
with a mole of ferredoxin. The ferredoxin used had a 420 to
277 mu absorbancy ratio of 0.38.
F~g. 15. Titration of taro ferredoxin 9-gainst DTNB.
Ferredoxin solution was ~ncubated with excess of DTNB
and other re~gents, when present, and the absorbancy. of the
reaction mixture vas measured at 412 mu at various time inter
vals. Appropriate corrections were made. for the absorbancy
due to ferredoxin and the re~gents wherever necessary. The
ferredoxin used had a 420 .to 277 mu absorbancy ratio of 0.40.
For details of titration see "Methods".
-0-0-0-, Titration with native ferredoxin.
-.-.-0-, Titration with reduced,glutathione.
-.-.-.- , Titration with sodium sulfide.
-x-x-x-, Titration with ferredoxin in 4 M,guanidine hydro-
chloride.

134

135
F?-g. 16. Absorption spe.ctra of· ferredoxin
in alkali.
Native and oxidized taro ferredoxins were disso.lved
in 0.1 N NaOH and the spectra of the solutions were re~
corded in the U. V. and near U. V. r~gions.
Curve A -- Spectrum of native ferredoxin in phosphate
bUffer, pH 6.8, recorded ~gainst a phosphate
buffer blank.
Curve B -- Spectrum of oxidized ferredoxin in phosphate
buffer recorded ~gainst the phosphate buffer
blank.
Curve C -- Spectrum of native. ferredoxin in alkali re
corded ~gainst the alkali blank.
Curve D -- Spectrum of oxidized ferredoxin in alkali re
corded ~gainst an alkali blank.
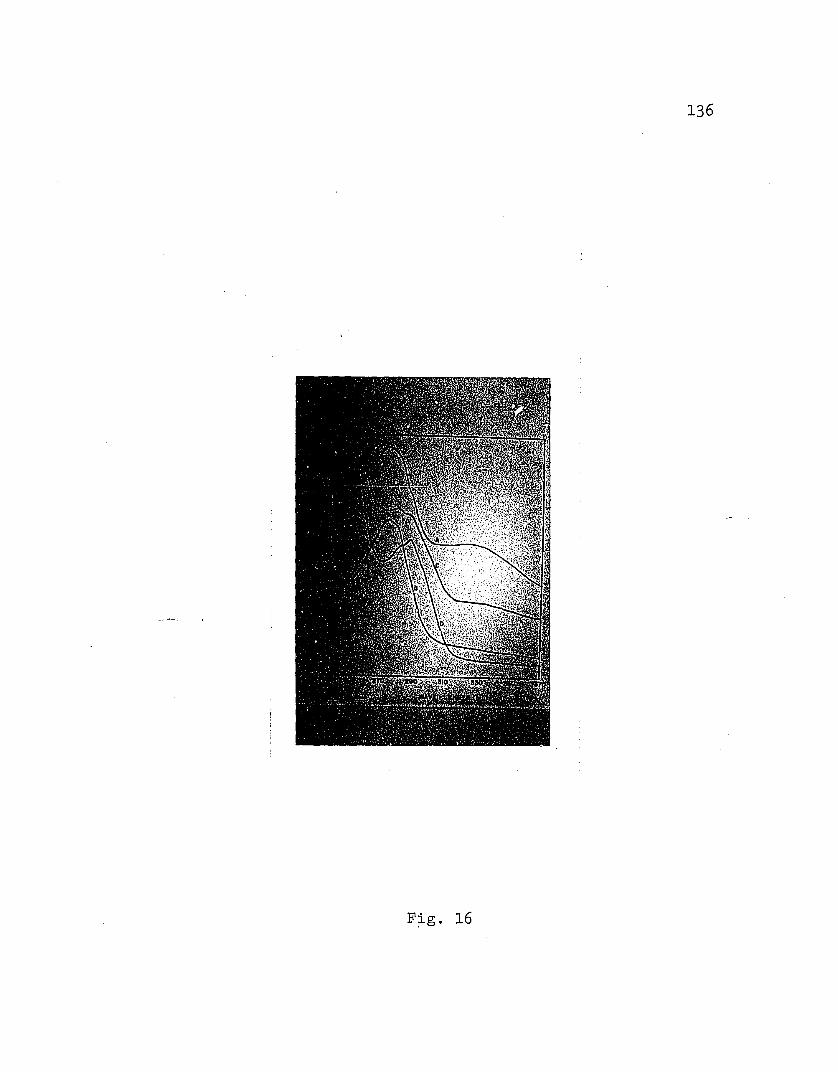
136

137
F~g. 17. Thin layer. chromat~graphyofDNP-aminoacids.
The .ethersoluble DNP;-.ferr.edoxin p-ydrolysate. was spot-.
ted on a thin layer. of sili·ca. gel and developed in a .chloro
form-benzy'lalcohol-acet:ic acid solvent :system. The standard
DNP amino acids used were, aspartic acid (1), serine .(2),
. glutamic acid .(3)" glycine (4) , alanine (.5), lysine (6), ty
rosine (7), tryptophan (8), valine (9), leucine (10), iso
leucine (11), and phenylalanine (12). The dashed spot with
a h~gh Rf value or~ginati~g from the sample is due to dini
troalanine.
F~g. 18. Thin layer chromat~gram of dansyl amino
acids on silica. gel G.
The dansyl der.ivative taro, ferredoxin wc;ts hydrolysed
with 6 N Hel. The hydrolysate was spotted on a thin layer
of silica,gel alo~g with the dansyl der~vat~ves of aspartic
acid (2), ,glycine (3), alanine (4), tyrosine (5), and ly
sine (6). Spot no. 1 is due to dansyl hydroxide and no.' 7
due .to dansyl amine. The solvent system used was chloroform
E:;thyl acetate-methanol-acetic acid. The spot without a num
ber in the chromat~gram is due to dansyl alanine or~ginati~g
from the sample. The chromat~gram was sprayed with Pauli
re?-gent. Spot no. 5 alone cha~ged to ora~ge in color.
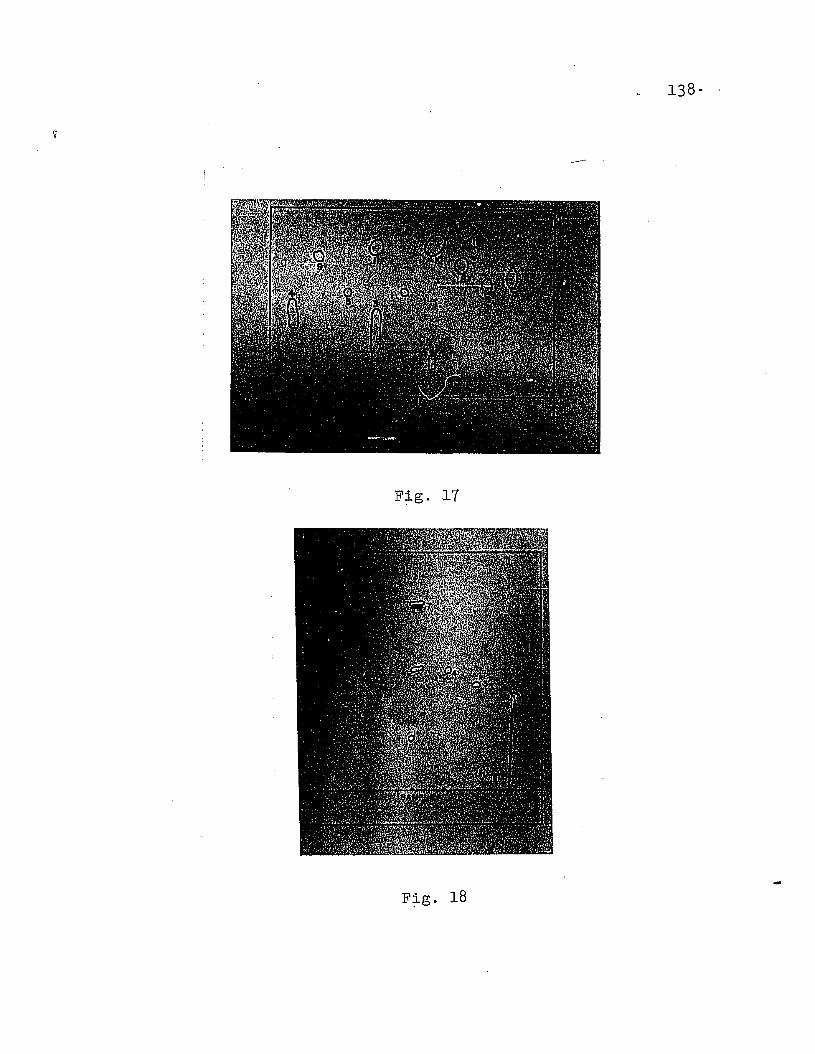
138- ,
...

139
F~g. 19. Paperchr'omat~graphY:;ofcarboxypeptidase
A d~gest ,of. taro ferredoxin .
Native ferredoxin after 24 hr. d~gestion with car
boxypeptidase A was spotted on a Whatman no. 1 paper to
gether with standard arninoacids. Descendi~g chromato
graphy carried out 12 hrs. usi~g the upper pha~e of a
butanol-acetic-acid-water (li:l:5 V/V) solvent system.
The amino acids were detected by sprayi~g the paper with
a solution of ninhydrin in acetone.
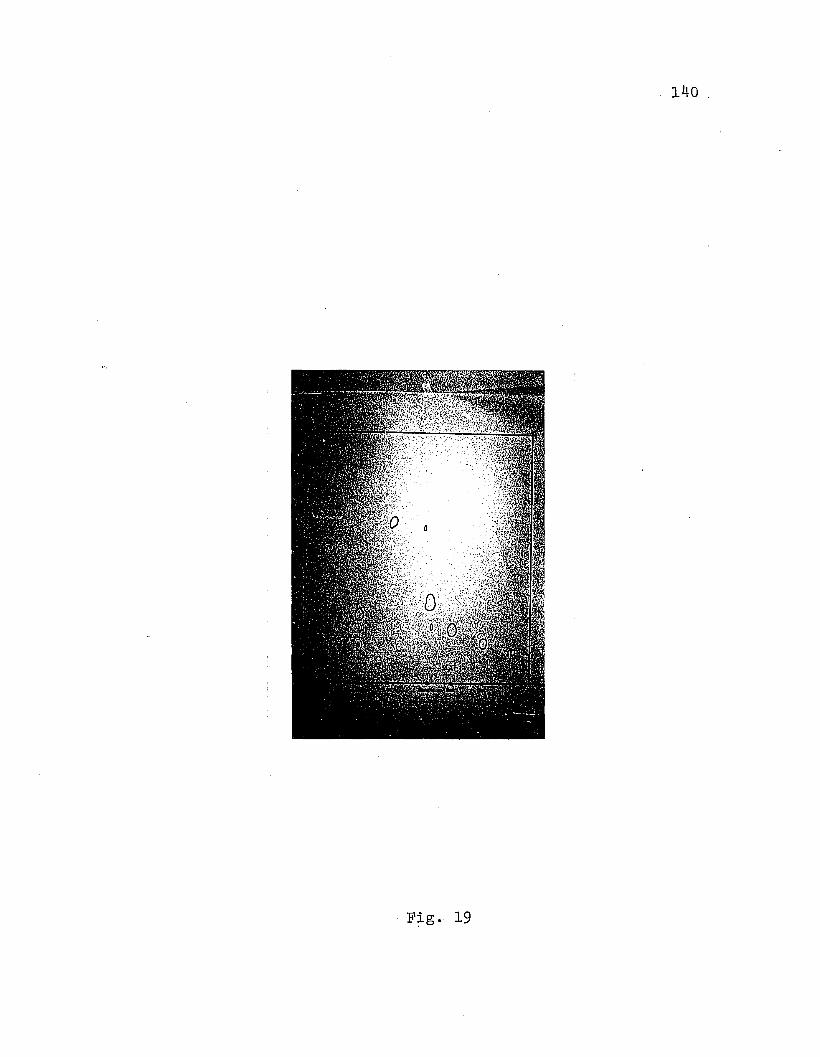
140

F~g. 20. Separation of peptides formed by the
action of chymotrypsin on ferredoxins.
S-carboxymethyl derivatives of spinach and taro ferredoxins were
hydrolyzed with TLCK chymotrypsin for 8 hrs. H~gh volt~ge paper elec
trophoresis of the d~gests· in pyridine-acetic acid-water buffer, pH 6.4,
was carried out in the first direction for 2 hrs. and descendi~g chroma
t~graphy in butanol-pyridine-acetic acid-water in the second direction for
12 hrs. The peptide spots were detected by sprayi~g the paper with nin-
hydr:in solution.
a. Chromat~gram ottained from taro ferredoxin d~gest. The shaded
area represents tryptophan containi~g peptide.
b. Chromat~gram from spinach ferredoxin d~gest. For details see
lIMethodsll.
~..j::"
f--l

142
..aoC\I
ctloC\I
.bO·rI.P=i
F~g. 21. Fi~ger prints of ferredoxin after
d~gest~on with chymotrypsin.
S-carboxymethyl derivatives of spinach and taro ferredoxins were hydrolyzed
with TLCK chymotrypsin. The peptides were separated by chromat~graphy, on a What-
man no. 3 paper, in a butanol-acetic acid-water for 12 hrs. in the first direction
and in butanol-pyridine-water for 14 hrs. in the second direction. Dashed boundaries
represent faint ninhydrin positive spots. Shaded area represents tryptophan contain-
i~g peptide detected by Ehrlich re~gent.
a. Peptide map of taro ferredoxin hydrolysate.
b. Peptide map of spinach ferredoxin hydrolysate.
I-'-l=W
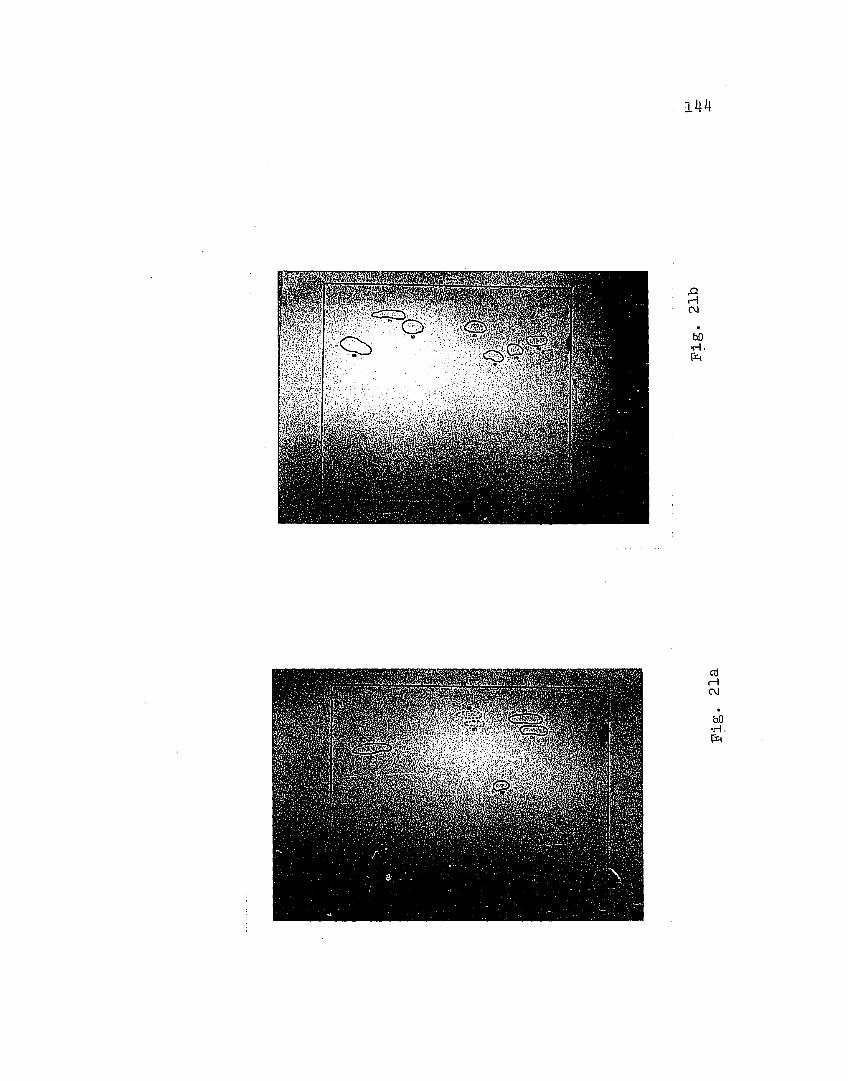
144
ro.-lN
.aD·rI.IZI

145
F?-g. 22. EPR sp:e.ctra .of. taro ferredoxin .
The spectrum was recorded in a Varian. V 4500-10A
EPR spectrometer with 100 kc per sec. field modulation.
Microwave frequency, .9.5 k Mc; microwave power, 10 db;
response, 0.3 sec; sweep rate, 1 min; sweep rap,ge, 1 ~g;
~emperature, - 195°. Protein concentration was 15 ~g/m1.
a. Spectrum of native ferredoxin (A420 to 27'1 mu ='0.42).
b. Spectrum .of ferredoxin after reduction with
dithionite.
.--- -
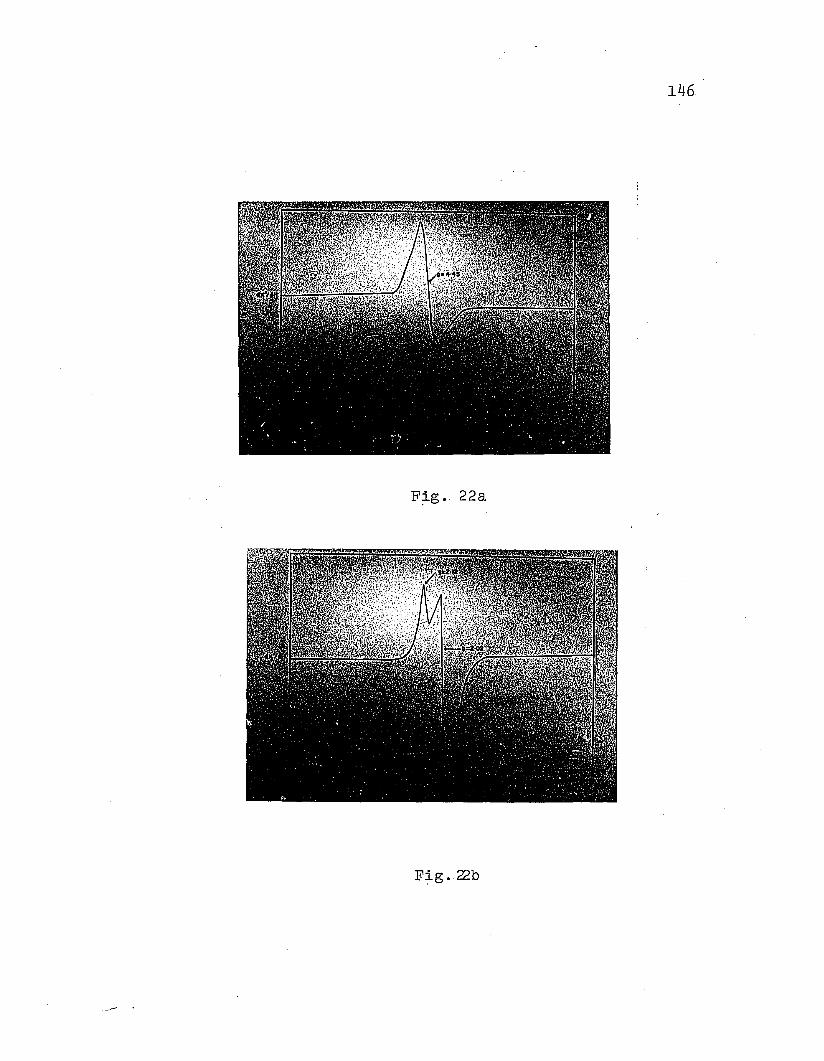
.-- -
F~g. 22a
146
1.
2 •.
3.
4.
5.
6.
7 .
8.
9.
10.
BIBLIOGRAPHY
Hill, R., Proc.' .Roy. Soc.,~., 127,192(1939).
F~ger, E. W., Arch.: Biochem.Biophys., 41, 383·(1952).
CalvinM.', and J. A. Bassham, The Photosynthesis of Car.bonCompounds. W. A. Benj amin, Inc., New. Yo.rk (1962 ).
Arnon, D. I., H. Y. Tsujimoto, and B. D. Mcswain, Nature~
214, 562 (1967).
Calvin, M., and J. A. Bassham, The Pa·th .of Carbon inPhotosynthesis, Prentice-Hall, New~ork .(1957).
Arnon, D. I., Nature, 167, ~oo,8. (1951).
Tolm~ch, L. J., Nature 3 167, 946 (1951).
Vishniac, W., and S. Ochoa, Nature, 167,. 768 (195J..).
San Pietro, A., and H. M. La~g, Science, 124.,.118 (1956).
Arnon, D. I., F ..R. Whatley, and M. B. Allen, Nature,180, 182 (1957).
11. San Pietro, A., and H. M. La~g, ~. Biol. Chern. 231, 211(1958).
12. Davenport, H. E., R. Hill, and F. R. Whatley, Proc. Roy.Soc., ~., 139, 346 (1952) . --
13. Davenport, H. E., and R. Hill, Biochern. ~., 74, 493(1960).
14. Mortenson, L. E., R. C. Valentine, and J. E. Carnahan;Biochem. Biophys. Res. Column. I, 448 (1962).
15. T~gawa, K., and D. I. Arnon., Nature, 195, 538 (1962).
16. Arnon, D. I., Science, 149, 1466 (1965) ..-
17. Shin, M., K. Tagawa, and D. I. Arnon, Biochem. ~.; 338,84 (1963).
18. Keister, D. L., A. San Pietro, and F. E.Stolzenbach, ~.
Biol. Chern., 235,2989 (1960).
19. Avron, M., and A. T. Jagendorf, Arch. Biochem. Biophys.,65,475 (1956) ..
148
20. Shin, M., and D. I. Arnon,~., BioI. Chem., 24,0,14,05(196,5) .
21. San Pietro,siol. ,
A. ,16-'
and C. C•. Black, Ann. Rev. Plant Phy155 (1965).
22. Malkin, R., and J. C. Rabinowitz, Ann. Rev .. Biochem.,36, 113, ,(1967).
23. Losada, M., and A. Paneque" Biochem. Biophys. Acta.,126, 587 (1966).
24. Buchanan, B. B.,. P.' P . Kalberer, and D. I. Arnon, Biochem. Biophys.' Res.. ·Commun. 29, 74(1967).
25. Buchanan, B. B., W. Lovenberg, and J. C. Rabinowitz,Proc. Natl. Acad. Sci.', u. S., 49, 345 (1963).
26. Tana~a, M., T. Nakashima, A. Benson, H. F. Mower, andK. T. Yasunobu, Biochem. Biophys. Res. Commun., 16,422 (1964).
Katoh, S., and A. Takamiya, Arch. Biochem. Biophys. 102,189 (1963).
Horio, T., and T., Yamashita, Biochem. Biophys. Res.Commun. 2., 142 (1962) .
Appella, E., and A. San Pietro, Biochem. Biophys. Res.Commun. ~, 349 (1961).
Horio, T., and T.Yamashita, Biochem.~. 338, 526 (1963).
Beinert, H., In San Pietro, A. [Editor], Non Heme IronProteins: Role in Energt Conversion~ntioch Press,Yellow Spri!lgs, Ohio (19 5), p.23.
34. Benes,ch, R~ E., H. A. Lardy, and R. Benes.ch,~. BioI.Chern., 216, 663 (1955).
27. Fry, K. T., and A. San Pietro, In Photosynthetic Mechanismsof Green Plants. Natl. Acad. Sci.-Natl. Res.Council-,Publ. 1145, Washi!lgton D. C. (1963), p. 252.
Margoliash, E., and A. Schegter, Advan. Protein Chern., 21, 113 (1966).' --
28.
29.
30.
31.
32.
-- 33.
149
35.' Peterson, E. A., and H. A.Sober, In .Colowick,S. P.and N. o. Kaplan (Editors), .Methods in EnZ~mOlOgy,
Vol. V, Academic Press, Inc., New. Yo.rk .(192) ,p. 3.
36. T~gawa, K., and D. I. Arnon, In Linskens, H. F., B. D.Sanwal,and M.. V.. Tracey (Editors), Modern Methodsof Plant Analysis~. Vol. VII. ,Sprip.ger-Verl~g,Berlin (1964), p .. 595.
37. Bendall, D. S., R. P. F. Gregory, and R. Hill, Biochem.~., 88, ·29 P (1963). .
38. Turner, J. F., C. C. Black, and M. Gibbs, ~. BioI. Chem.,237, 577 (1962).
39. Arnon, D. I.,PlantPhyaiol., 24, 1 (1949).
40. San Pietro, A., InColowick, S. P., and N. O. Kaplan(Editors), Methods in EnZ~mOlOgy, Vol. VI, AcademicPress, Inc., New York (19 3), P. ·439.
41. Sutherland, E. W., C. F. Cori, R. Haynes, and N. W. Olsen,J. BioI. Chern., 180, 825 (1949).
42. Seeley, H. W., Jr., and P. J. Vandemark, In Microbes inAction. W. H. Freeman and Company, San Francisco(1962), P. 185.
43. Fogo, J. K., and M. Popowsky, Anal. Chem., 21, 732. (1949).
44. Lovenberg, W., B. B. Buchanan, and J. C. RAbinowitz, J.BioI. Chem., 238, 3899 (1963).
45.
46.
. .47.
Vogel, A. I., In Quantitative Inorganic Analysis. 2nd. ed., Lop.gmans,Green and Co., London (1951), P. 355.
Diehl, H., and G. F. Smith, In The Iron Reagents:Bathophenanthroline, Bathophenanthroline, disulfanicacid, 2, 4, 6-Tripryidyl-S-triazine phenyl-2-pyridylketoxime. G. Frederick Smith Chemical Company,Columbus (1965), P. 13 .
Ornstein, L., and B. J. Davis, Disc Electro~horesis.
Canalco Industrial Corp., Bethesda (19 1).
150
48. Ashton, G. C., Aust.· Q:..: BioI. Sci., 18,.665 (1965) .
. 49 . Andrews, P., Biochem. Q:.. ,91, .222 (1964)..
50. Whitaker, J. R. Anal. Chern.,. 35, 1950 (1963).
51. Martin, R. G., and B. N. Ames, ~. BioI. Chern., 236,1372 (196:1).
52.
53.
Mortenson, L. E. Biochem. Biophys. Acta. , 81, .4.73(1964)..
Mortenson, L. E. Biochem .. Biophys. Acta. ,~,. 71(1964).
54. Lipmann, F., and L. C. Tuttle, ~. BioI. Chern., 159,21 (1945).
55. Boyer, P. D., ~. Am. Chern. Soc., ~ 4331 (1954)..
56. Klotz, I. M., and B. R. Carver, ~rch. Biochem. Biophys.95,540 (1961).
57. Ellman, G. I., Arch Biochem. Biophys., 82,·70 (1959).
58. Fuwa, K., P. Pulido, R. H. McKay, and B. L. Vallee,Anal. Chern., 36, 2407 (1964)..
59. Tanaka, M., T. Nakashima, H. F. Mower, and K. T. Yasunobu, Arch. Biochem. Biophys., 105, 570 (1964).
60. Moore; S., ~. BioI. Chern., 238, 235 (1963).
61. Crestfield, A. M., S. Moore, and W. H. Stein, ~. BioI.Chern., 238, 622 (1963).
- 62. Keresztes-Nagy, S., and E. Ma~goliash, J. BioI. Chern.,241, 5955 (1966).
63. Fraenkel-Conrat,. H., J.I. Harris, and A. L. Levy, In D.Glick (Editor), MeitDds .of Biochemical Analysis,Vol. 2, Academic Press, New York (1955), p. 359.
64. Gray, W. R., and B. S. Hartley,. Biochem. J., 89, 59 p(1963) . -
..65.· Nedkov, P., and N. Genov,. Biochem. Biophys. Acta., 127541 (1966).
151
66 . Bradbury, J. H. Biochem.~., .68, 482(1958).
67. Goodwin, T. W. ,and R. A..Morton, Biochem. ~ .. 40>. 628.(1946) .
68. Funatsu, M., N. M.Green, and B. Witkop,-i!:.. Am. Chem.Soc., ~, .1846 (1964).
69. Patchornik, A.,W. B. Lawson, and B. Witkop, J. Am. Chem.Soc., 80, .4747 (1958).
70. Edelhoch, H., Biochemistry" 'I, 1948 (1967).
71. Noltman, E. A., T. A. Mohowald, and S. A. Kuby, ~. Biol.Chern., 237, 1146 (1962).
72. Mares-Guia, and E. Shaw, Fed. Proc., 22,. 528 (1963).
73. Bailey, J. L., In Techniques in Protein Chemistry, Elsevier PUblishi~g Company, Amsterdam (1962), p. 50.
74. Tsuru, D., H. Kira, T. Yamamoto, and J. FUkumoto, Agr.Biol. Chem.,. 31,1718 (1967).
75. Matsubara, H., R. M. Sasaki, and R. K. Chain, Proc. Natl.Acad. Sci. u. S. ,. 57, 439 (1967).
76. Garbett, K., R. D. Gillard, P. F. Knowles and J. E.Sta~groom, Nature, 215, 824. (1967) .
.. 77. Chou, S., and A.Goldstein, Biochem. ~., 75, 109 .(1960).
78. Putnam, F. W., In Neurath, H. (Editor), The Prote~ns,
Vol. III, Academic Press, Inc., New York (1965)p. 189. .
79. Layne, E., In Colowick, S. P., and N. O. Kaplan (Editors)Methods in Enzymology, Vol. III, Academic Press,Inc., New. York (1957) p. 453.
80. Margoliash, E., and J. Lustgarten, J. BioI. Chern., .237,.. 3397 (1962). . -
81. Tietzel, F., ~. Biol. Chem. ,204, 1 (1953).

82.
84.
85..
86.
87.
88.
90.
91.
92.
93.
94.
95.
Shapiro, D. M.. The purif.i·cat:bn and propert.ies.of photosynthetic pyridine nucleotide reductase from EU&ena
. gracilis. . Hoctoral dissertation, .John Hopkins University, Baltimore, Md .. (1961).
Whatley, F. R.,K. Tagawa, and D. I. Arnon, Proc. Natl.Acad. Sci., .U. S'., 49·, 266 (1963). ----
Fry, K. T., R. A. Lazzarini, and A. San Pietro,Proc.Natl. Acad. Sci. U.S., 50, 652 (1963). --
Sobel, B. E., and W. Lovenbe~g, Biochemistry, 2., 6(1966).
Malkin, R., and J. C. Rabinowitz, Biochemistry, §., 3880(1967) .
Brumby, P. E., R. W. Miller, and V. Massey, J. BioI.Chern., 240, 2222 .( 1965) . -
Valentine, R. C., W. J. Brill, and R. S. Wolfe, Biochem.Biophys. Res. Commun., 10, 73 (1963).
Malkin, R., and J. C. Rabinowitz, Biochemistry, ~, 1262(1966) .
Beaven, G. H., and E. R. Holiday, Advances in ProteinChemistry, 1, Academic Press, Inc., NewYork (1952)p. 379.
Shore, V., and B. Shore, Biochemistry, -§., 1962(1967).
Hall, D.O., J. F. Gibson, and F. R. Whatley, Biochem.Biophys. Res. Commun., £1, 81 (1966).
Gibson, J. F., D. O. Hall, J. H. M. Thornley, and F. R.Whatley, Proc. Natl. Acad. Sci. U. S.,-.2.§., 987(1966).
Beinert, H., and G. Palmer, Advances in Enzymology, 27,105 (1965).
Bachmayer, H., L. H. Piette, K. T. Yasunobu, and H. R.Whiteley, Proc. Natl. Acad. Sci.,· 57, 122 (1967).

153
96. Palmer, G., H.: Brintz,inger, R. W. Estab.r.ook, ,and R. H.Sands, In Ehrenberg" ,A. " B. G. MaImstron, and T.Van~gard', ,CEditors.) , Magnet,ic Resonance in Biological-Systems.,Wenner-GrenCenter International Cym,posium Ser.ies, Vol. IX, Pe~gamon Press, London, 1967),p. 155.
97. Benson, A. M., H. F. Mower, and K. T. Yasunobu, Proc.Natl. Acad . Sci., U.S., 55, 1532 (19'66) .
98. Eck, V. R., and M. o. Dayhoff, Atlas of Protein Se~ence and Structure, National Biomedical ResearchFoundation, Silver Spr~Q9, Md. (1966).
99. Fitch, M. W., and E. Margoliash, Science" 155,279(1967).' ---
100. Soluble and Respiratory Chain Linked Dehydrogenases,In San Pietro A., (Editor) Non Heme Iron Proteins,Role in Energy Conversion, Antioch Press" YellowSpri~gs, Ohio (1965) p. 325-369.
101. Phillips, W. D., E. Knight, Jr., and D. C. Blomstron,In San Pietro, A.,' (Editor), Non Heme Iron Proteins:Role in Energy Conversion., Antioch PreSS;-YellowSpri~gs, Ohio (1965), p. 23.
102. San Pietro, A., Col. XIII-3, Seventh International Congress of Biochemistry, Tokyo (1967).
103. Palmer, G., H. Br.itntzinger, and R. W. Estabrook, Biochemistry, 6, 1658 ~1967).
104. Mildvan, A. S., R. W. Estabrook, and G. Palmer in Ehrenberg, A., B. G. Malmstron, and T. Vanngard (Editors)Magnetic Resonance in Biological Systems., WennerGren Center International Symposium Series, Vol. IX,Pe~gamonPress, London (1967), p. 155.
105. Wilson, F. D., Arch. Biochem. Biophys., 122,254, (1967).
106. Valentine, R. C., Bacteriol. Rev., 28, 497 (1964).
107. Hill, R., and A. San Pietro" Z. Naturforsch., 18, 677
108. Chance, B., and A. San Pietro, Proc. Natl.Ac'ad . Sci.,U.S., 49, .633 (1963).
109..
110.
Ill.
112.
113.
114.
115.
116.
117.
118.
119.
120.
121.
122.
15~
Bayer, E., D.Joseph, F. Krauss, H. Hagenmaier,. A.Roeder,A.Trehst,. Biochem. BiophYs.. Acta~ .143,
..435 (1967).
Mahler, H. R., .and E.. H. Cordes , Biological Chemistry ,Harper and Row, New York (1966) p. 586-588.
Kn?-ght, E. Jr., and R. W. F . Hardy, ~. BioI. Chem.,.241, 2752 (1966).
Lovenberg, W., and B. E.Sobel, Proc. Natl. Acad. Sci.U.S~, 54, 193, (1965).
Sieker, L. C. and L. H. Jensen, Biochem. Biophys. Res.Commun., 20, 33, (1965).
Der Vartanian; D. V., W. H. Orne-Johnson, R. E. Hansen,H. Beinert, R. L. Tsai, J. C. M. Tsibris, R. C.Bartholomans, and I. C. Gunsalus, Biochem. Biophys.Res. Commun., 26, 569 (1967).
Rajagopalan, K. V., and P. Handler, J. BioI. Chern., 239. 1509 (1964). -
Palmer, G., and R. H. Sands, ~. BioI. Chem., 241, 253(1966).
Villarejo, M., and Westley, J., J. BioI. Chern., 238,4016 (1963).
Blumberg, W. E.,and J. Peisach, In San Pietro, A.,(Editor), None Heme Iron Proteins: Role in EnergyConversion, Antioch Press,. Yellow Springs, Ohio(1965), p. 101 ..
Roeder, A., and E. Bayer, Hoppe-Seryler's Z. Physiol.Chem., 348 (10), 1335 (1967). -
Schellman, J. A., and C. Schellman, In Neurath, H.(Editor), The Proteins, Vol. II, Academic Press,Inc., New. York (1964) p. 1.
Margoliash, E., F.Perini, and S. Keresztes-Nagy, Ab. stracts of the Seventh International Congress of
Biochemistry, Tokyo (1961) A-68.
Haupt, W. A., Plant MorphoTogy, McGraw-Hill Book .Company,Inc., New York (1953), p .. 401.

155
123." Porter, C. L. Taxonomy~.of .F.lowering Plants, .W. H..Freeman and .Company, .San Francisco .(1959) p. 125.
124.. Hutchinson,.J .The~Families~ofFlowering Plants.Vols. I and II, Macmillan and Co., London (1926),Vol. I, p. 8 and. Vol. II, p., 7.
125. Sasaki, R. M., .and H. Matsubara, Biochem. Biophys. Res.Commun., 28 , . 46 7 (1967).
126. Ohno, H., K. Suzuki, and.T. Kimura, Biochem. Biophys.Res. Commun., 26, 651 (1967).

![if - ScholarSpace at University of Hawaii at Manoa: Home · PDF filereferential, conative, emotive, poetic, ... [1]. I arbitrarily chose 21 ... [2]. 13. Phatic Communion in Women's](https://img.pdfslide.us/doc/110x75/5ab767e07f8b9ac10d8bb505/if-scholarspace-at-university-of-hawaii-at-manoa-home-conative-emotive-poetic.jpg)