Embed Size (px)
Citation preview
Schlumberger Limited
42 rue Saint-Dominique75007 Paris
5599 San Felipe, 17th Floor,Houston, Texas 77056
Parkstraat 83 2514 JG The Hague
www.slb.com
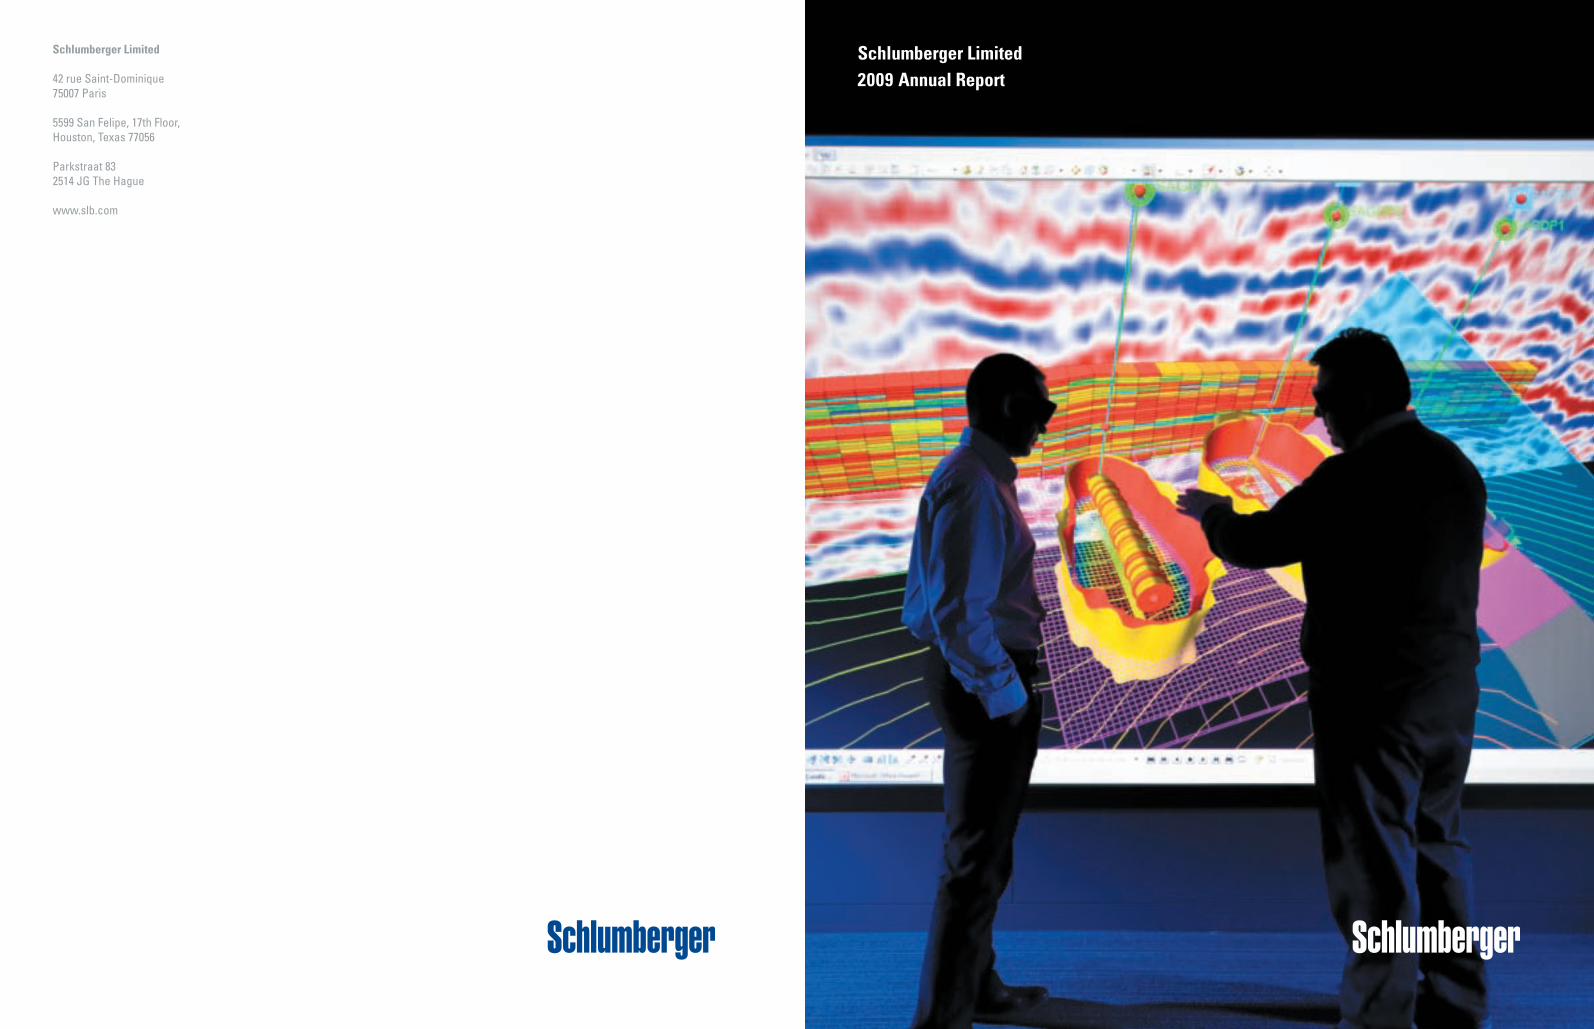
Schlumberger Limited2009 Annual Report
28488schD1R3.qxp:28488schD1R3 - Cover 2/11/10 9:38 PM Page 1
Board of Directors
Philippe Camus 1,3
Co-Managing PartnerSociété LagardèreSenior Managing DirectorEvercore Partners Inc.New York, New York
Jamie S. Gorelick 2,3
PartnerWilmer Cutler Pickering Haleand Dorr LLPWashington, D.C.
Andrew GouldChairman & Chief Executive OfficerSchlumberger
Tony Isaac 1,3,4
RetiredFormer Chief ExecutiveBOC GroupSurrey, United Kingdom
Nikolay Kudryavtsev 1,5
RectorMoscow Institute ofPhysics and TechnologyMoscow, Russia
Adrian Lajous 1,2,4
Senior Energy AdvisorMcKinsey & CompanyHouston, TexasPresident PetrometricaMexico City, Mexico
Michael E. Marks 2,4
Managing PartnerRiverwood Capital LLCPalo Alto, California
Leo Rafael Reif 3,5
Provost, Chief Academic Officer &Chief Budget OfficerMassachusetts Institute ofTechnologyCambridge, Massachusetts
Tore I. Sandvold 3,4
ChairmanSandvold Energy ASOslo, Norway
1 Member, Audit Committee2 Member, Compensation Committee3 Member, Finance Committee4 Member, Nominating and Governance
Committee5 Member, Technology Committee
Henri Seydoux 3,5
Chairman & Chief Executive OfficerParrot S.A.Paris, France
Linda Gillespie Stuntz 2,4
PartnerStuntz, Davis & Staffier, P.C.Washington, D.C.
Corporate Officers
Andrew GouldChairman & Chief Executive Officer
Simon AyatExecutive Vice President & Chief Financial Officer
Paal KibsgaardChief Operating Officer
Alexander C. JudenSecretary & General Counsel
H. Sola OyinlolaVice President & Treasurer
Ashok BelaniVice President
Stephanie CoxVice President
Mark DantonVice President
David FarmerVice President
Rodney NelsonVice President
Satish PaiVice President
Malcolm TheobaldVice President
Charles WoodburnVice President
Howard GuildChief Accounting Officer
Eileen HardellAssistant Secretary
Saul LaurelesAssistant Secretary
Corporate Information
Stockholder InformationSchlumberger common stock islisted on the New York StockExchange, trading symbol SLB, andon the Euronext Paris, London andSIX Swiss Stock Exchanges.
For quarterly earnings, dividendannouncements and other infor-mation, call 1-800-99-SLB-99 from the US and Canada and 1-813-774-5043 for callers outside North America, or visitwww.slb.com/ir and sign up to receive email alerts.
Stock Transfer Agent and RegistrarComputershare Trust Company, N.A.P.O. Box 43078Providence, Rhode Island02940-30781-877-785-9341 or 1-781-575-2707
General stockholder information isavailable on the ComputershareWeb site atwww.computershare.com
Form 10-KThe Schlumberger 2009 annualreport on Form 10-K filed with the Securities and ExchangeCommission is available withoutcharge. To obtain a copy, call 1-800-997-5299 from NorthAmerica and 1-813-774-5043 out-side North America. Alternatively,you can view all of our SEC filingsonline at www.slb.com/ir or writeto the Secretary, SchlumbergerLimited, 5599 San Felipe, 17thFloor, Houston, Texas 77056.
Email AlertsTo receive Schlumberger pressreleases, headlines, and dailyindustry news headlines, registerat www.slb.com/ir.
Duplicate MailingsWhen a stockholder owns sharesin more than one account, orwhen stockholders live at thesame address, duplicate mailingsmay result. If you receive duplicate reports, you can helpeliminate the added expense byrequesting that only one copy besent. To eliminate duplicate mailings, contact ComputershareTrust Company, N.A., StockTransfer Agent and Registrar.
World Wide WebFor information on Schlumbergertechnology, services and solutionsand the latest industry news, visitwww.slb.com.
RecruitmentFor more information on careersand job opportunities atSchlumberger, visitwww.careers.slb.com.
Non-Profit CommunityDevelopment ProgramsSchlumberger supports andencourages a range of communitydevelopment programs—bothglobal and local—which are often initiated and implementedby employees. We have chosen to focus on education and socialdevelopment. To learn more about these programs, please visit www.seed.slb.com and www.foundation.slb.com.
* Mark of Schlumberger
Photography by Abdullah Al-Huthail (page 5),Agence WO (page 4), John Borowski (page 16),Joyice Baby Cherian (page 11), Ken Childress(cover, pages 8, 9, 10 and 15), Ricardo Merendoni(page 12), Jennifer Purviance (page 14), GerardoSerrano (page 1), and John Smallwood (page 6).
Image on page 13 courtesy of Brazilian architect Zanetti.
Schlumberger is the world’s leading oilfield services company supplying technology, information solutions, and integrated project management that optimize reservoir performance for customers working in the oil and gas industry. The companyemploys approximately 77,000 people of over 140 nationalities working in approximately 80 countries. Schlumberger supplies a wide range of products and services from seismic acquisition and processing; formation evaluation; well testing and directional drilling to well cementing and stimulation; artificial lift and well completions; and consulting, software, and information management.
In This Report
Inside Front Cover Financial, Safety, and Environmental Performance
Page 2 Letter from the Chairman
Page 4 Integrating Technology for Success in Complex Project ManagementA Review of the 2009 Performed by Schlumberger Winners
Page 7 Delivering New Technology FasterThe Schlumberger Advantage
Page 14 Technology and the EnvironmentMeasurement and Impact
Page 17 Annual Report on Form 10-K
Inside Back Cover Directors and Officers
Inside Back Cover Corporate Information
Front CoverIn the Schlumberger Heavy OilRegional Technology Center inCalgary, Reservoir Engineers CarlosDamas and Jose Rivero discusssteam-assisted gravity drainage simulation results from a heavy oilreservoir in Alberta.
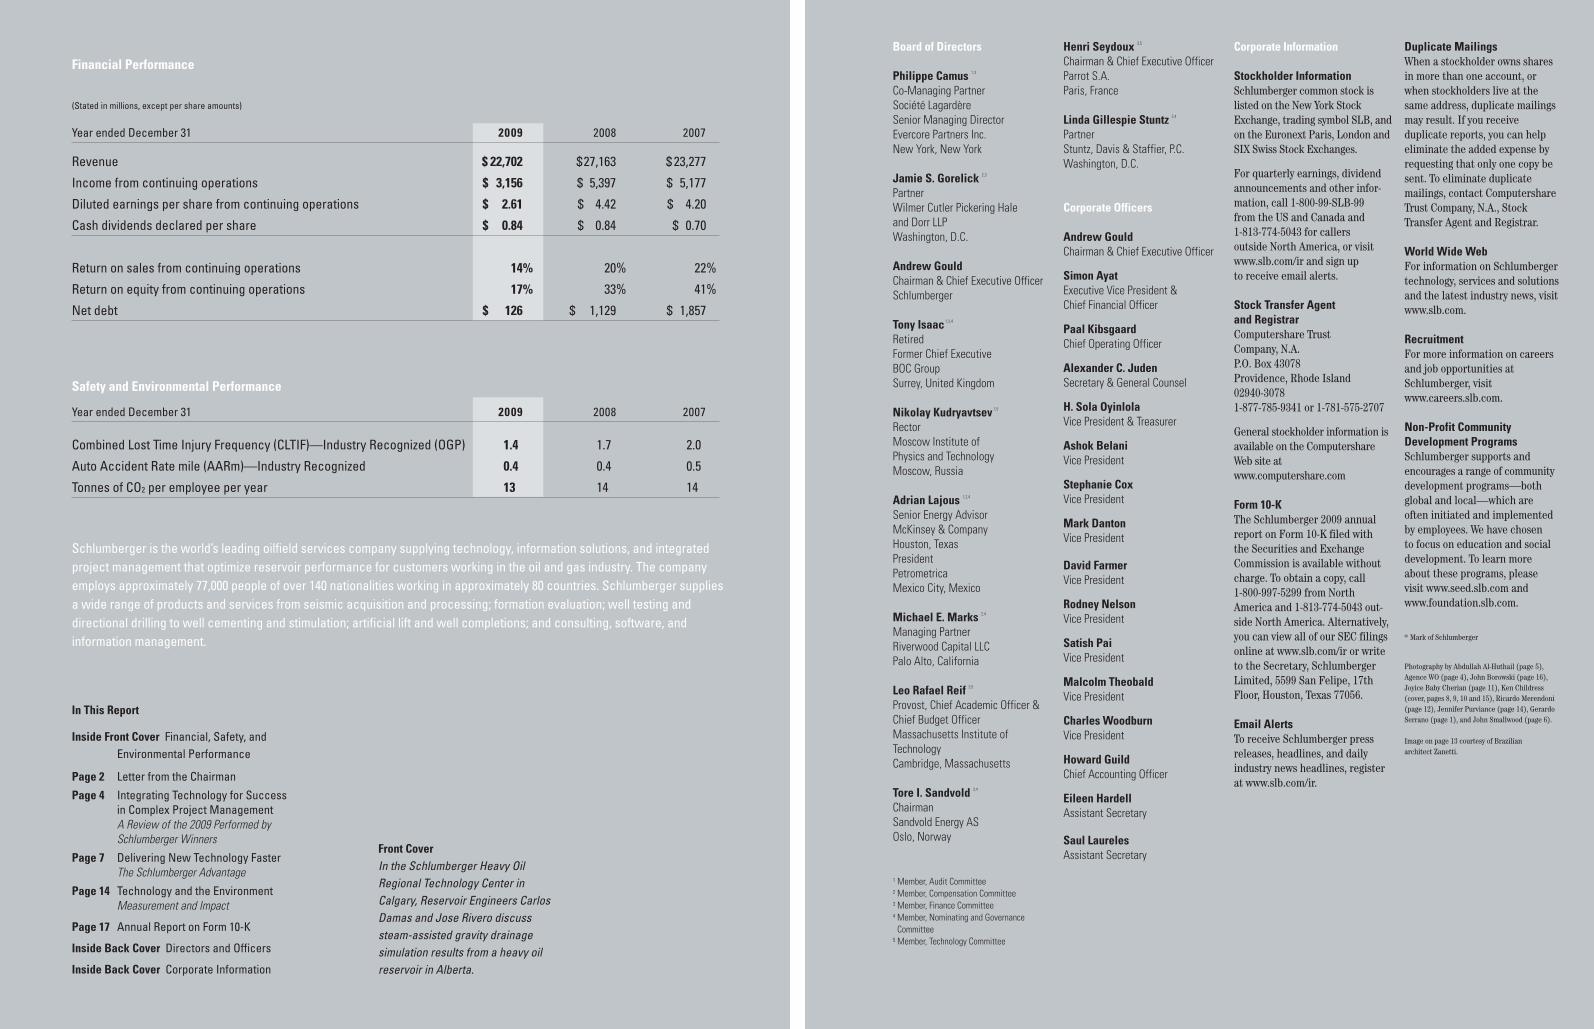
Year ended December 31 2009 2008 2007
Revenue $ 22,702 $27,163 $ 23,277
Income from continuing operations $ 3,156 $ 5,397 $ 5,177
Diluted earnings per share from continuing operations $ 2.61 $ 4.42 $ 4.20
Cash dividends declared per share $ 0.84 $ 0.84 $ 0.70
Return on sales from continuing operations 14% 20% 22%
Return on equity from continuing operations 17% 33% 41%
Net debt $ 126 $ 1,129 $ 1,857
Safety and Environmental Performance
Year ended December 31 2009 2008 2007
Combined Lost Time Injury Frequency (CLTIF)—Industry Recognized (OGP) 1.4 1.7 2.0
Auto Accident Rate mile (AARm)—Industry Recognized 0.4 0.4 0.5
Tonnes of CO2 per employee per year 13 14 14
(Stated in millions, except per share amounts)
Financial Performance
28488schD1R3.qxp:28488schD1R3 - Cover 2/11/10 9:43 PM Page 2
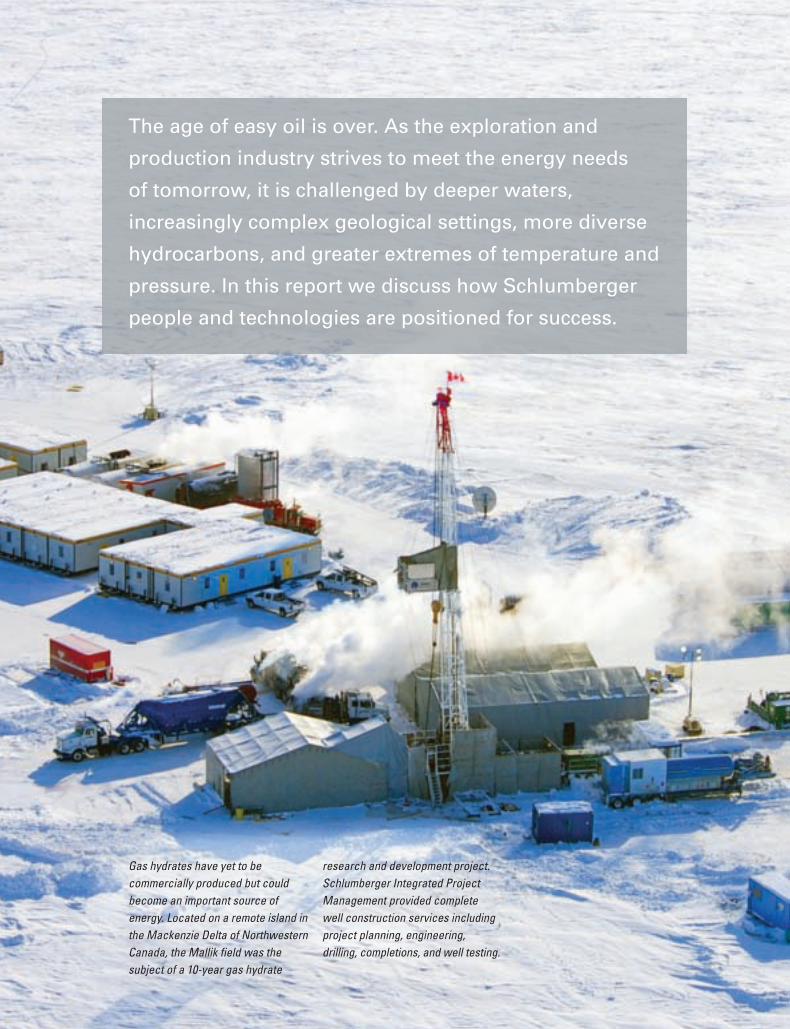
The age of easy oil is over. As the exploration and
production industry strives to meet the energy needs
of tomorrow, it is challenged by deeper waters,
increasingly complex geological settings, more diverse
hydrocarbons, and greater extremes of temperature and
pressure. In this report we discuss how Schlumberger
people and technologies are positioned for success.
Gas hydrates have yet to be commercially produced but couldbecome an important source ofenergy. Located on a remote island inthe Mackenzie Delta of NorthwesternCanada, the Mallik field was the subject of a 10-year gas hydrate
research and development project.Schlumberger Integrated ProjectManagement provided complete well construction services includingproject planning, engineering,drilling, completions, and well testing.
28488schD1R3.qxp:28488schD1R3 - Text 2/15/10 11:33 AM Page 1
2
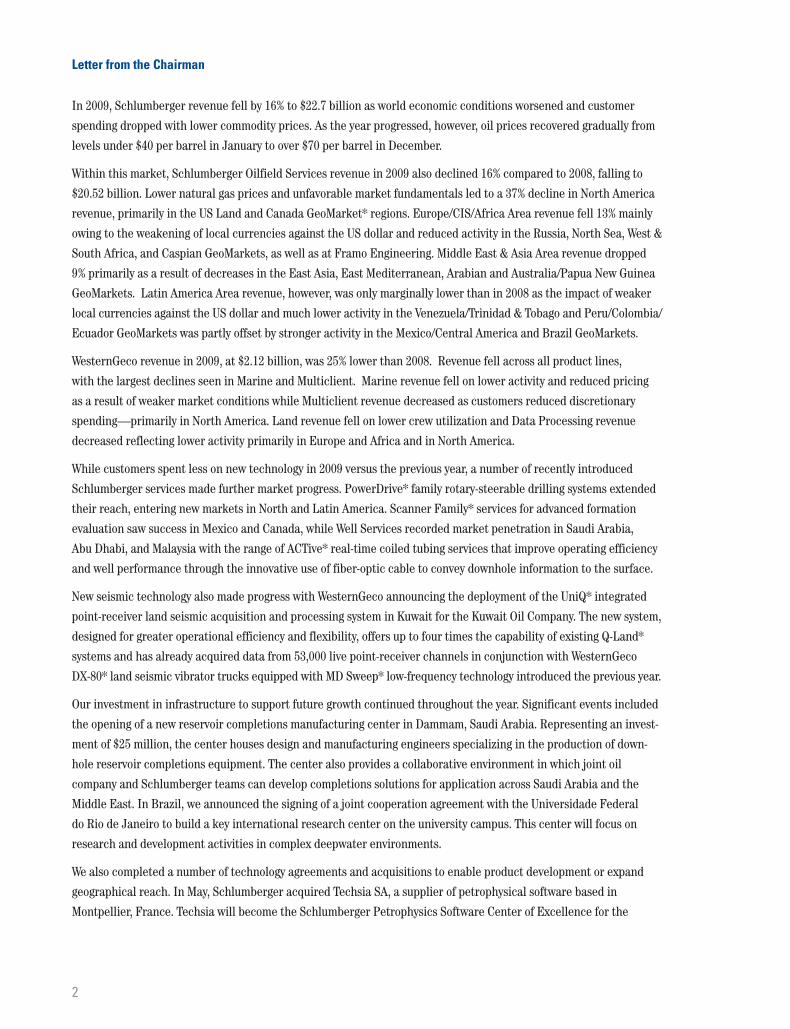
In 2009, Schlumberger revenue fell by 16% to $22.7 billion as world economic conditions worsened and customer
spending dropped with lower commodity prices. As the year progressed, however, oil prices recovered gradually from
levels under $40 per barrel in January to over $70 per barrel in December.
Within this market, Schlumberger Oilfield Services revenue in 2009 also declined 16% compared to 2008, falling to
$20.52 billion. Lower natural gas prices and unfavorable market fundamentals led to a 37% decline in North America
revenue, primarily in the US Land and Canada GeoMarket* regions. Europe/CIS/Africa Area revenue fell 13% mainly
owing to the weakening of local currencies against the US dollar and reduced activity in the Russia, North Sea, West &
South Africa, and Caspian GeoMarkets, as well as at Framo Engineering. Middle East & Asia Area revenue dropped
9% primarily as a result of decreases in the East Asia, East Mediterranean, Arabian and Australia/Papua New Guinea
GeoMarkets. Latin America Area revenue, however, was only marginally lower than in 2008 as the impact of weaker
local currencies against the US dollar and much lower activity in the Venezuela/Trinidad & Tobago and Peru/Colombia/
Ecuador GeoMarkets was partly offset by stronger activity in the Mexico/Central America and Brazil GeoMarkets.
WesternGeco revenue in 2009, at $2.12 billion, was 25% lower than 2008. Revenue fell across all product lines,
with the largest declines seen in Marine and Multiclient. Marine revenue fell on lower activity and reduced pricing
as a result of weaker market conditions while Multiclient revenue decreased as customers reduced discretionary
spending—primarily in North America. Land revenue fell on lower crew utilization and Data Processing revenue
decreased reflecting lower activity primarily in Europe and Africa and in North America.
While customers spent less on new technology in 2009 versus the previous year, a number of recently introduced
Schlumberger services made further market progress. PowerDrive* family rotary-steerable drilling systems extended
their reach, entering new markets in North and Latin America. Scanner Family* services for advanced formation
evaluation saw success in Mexico and Canada, while Well Services recorded market penetration in Saudi Arabia,
Abu Dhabi, and Malaysia with the range of ACTive* real-time coiled tubing services that improve operating efficiency
and well performance through the innovative use of fiber-optic cable to convey downhole information to the surface.
New seismic technology also made progress with WesternGeco announcing the deployment of the UniQ* integrated
point-receiver land seismic acquisition and processing system in Kuwait for the Kuwait Oil Company. The new system,
designed for greater operational efficiency and flexibility, offers up to four times the capability of existing Q-Land*
systems and has already acquired data from 53,000 live point-receiver channels in conjunction with WesternGeco
DX-80* land seismic vibrator trucks equipped with MD Sweep* low-frequency technology introduced the previous year.
Our investment in infrastructure to support future growth continued throughout the year. Significant events included
the opening of a new reservoir completions manufacturing center in Dammam, Saudi Arabia. Representing an invest-
ment of $25 million, the center houses design and manufacturing engineers specializing in the production of down-
hole reservoir completions equipment. The center also provides a collaborative environment in which joint oil
company and Schlumberger teams can develop completions solutions for application across Saudi Arabia and the
Middle East. In Brazil, we announced the signing of a joint cooperation agreement with the Universidade Federal
do Rio de Janeiro to build a key international research center on the university campus. This center will focus on
research and development activities in complex deepwater environments.
We also completed a number of technology agreements and acquisitions to enable product development or expand
geographical reach. In May, Schlumberger acquired Techsia SA, a supplier of petrophysical software based in
Montpellier, France. Techsia will become the Schlumberger Petrophysics Software Center of Excellence for the
Letter from the Chairman
28488schD1R3.qxp:28488schD1R3 2/11/10 8:34 PM Page 2
development of state-of-the-art solutions for the oil and gas exploration and production industry. In September, we
announced the creation of a joint venture with National Oilwell Varco to provide high-speed drillstring telemetry
systems to improve the efficiency and safety of oil and gas operations, and in November, we acquired Lonkar
Services—a company providing slickline, cased-hole wireline and surface well testing services in Western Canada
and Northern USA. In November we also signed a joint cooperation agreement with Technip to develop subsea
integrity and surveillance solutions for the flexible pipe used in deep offshore oil and gas production. This agreement
will initially focus on surveillance systems activities for new and challenging flexible pipe applications such as those
required in deepwater operations.
Last year I commented with disappointment on the poor safety results of 2008. This year, I am pleased to note some
improvement, particularly in our own driving performance that resulted in no fatalities among our employees for the
first time since 2005. We regretfully still recorded fatalities in accidents suffered by our contractors, and here we
must further strengthen our efforts to raise awareness and enforce the procedures that will ultimately save lives.
Our improved driving safety performance was not, however, mirrored in our operations, and 2009 saw the worst
year for work process fatalities since 2000. We must not relax our efforts in any area of safety and I expect all of the
management team to make safety their highest priority in the coming year.
The outlook for 2010 remains largely dependent on the prospects for the general economy. At the end of the third
quarter of 2009, we indicated that we were encouraged that signs were emerging that demand for oil and gas would
begin to increase. Consensus forecasts now predict that oil demand in 2010 will increase, particularly in the develop-
ing world, for the first time since 2007.
As a result, we feel that oil prices are likely to be sustained at current levels and that as our customers’ confidence
grows, their exploration and production budgets will increase. We believe that considerable leverage exists to
increase investment in offshore markets, in Russia, as well as in certain emerging investment opportunities such
as Iraq but that this will be dependent on continued economic growth in the second half of the year beyond current
government stimulus packages.
For natural gas activity we remain a great deal more cautious. Despite signs of some recovery in industrial demand as
well as colder winter weather, we consider that markets remain generally oversupplied. Increased LNG flows together
with further capacity being added in 2010, as well as the general uncertainty over the decline rates of unconventional
gas production, have the potential to limit the current increase in the North American gas drilling rig count.
In conclusion, I would like to thank our customers for their confidence and support as well as our employees for the
dedication and commitment that they have shown in a difficult year. Longer term, we remain confident that consider-
ably increased spending will be necessary to maintain sufficient reserves and production of hydrocarbons to meet the
world’s needs. Our technology portfolio and worldwide infrastructure mean we are strongly positioned to capture
growth opportunities as our customers begin to increase their investment.
Andrew Gould
Chairman and Chief Executive Officer
3
28488schD1R3.qxp:28488schD1R3 2/11/10 8:34 PM Page 3
Integrating Technology forSuccess in Complex ProjectManagement
Performed by Schlumberger The Performed by Schlumberger program is founded
on corporate values of people, technology, and profit. Itwas launched in 1999 and every year, entries from teams of employees across the company are judged through anawards process that recognizes teamwork, innovation, and business impact.
Award-winning projects are recognized at three levels—gold, silver and bronze—and from these projects theultimate winner is selected to receive the SchlumbergerChairman’s Award. In 2009, for the first time in the history of the Performed by Schlumberger program, theChairman’s Award went to two projects: Rejuvenating
Casabe and Developing the North Kuwait
Jurassic Gas Field. Both are excellent examples ofthe Schlumberger integrated approach to managing com-plex projects in either well construction or production thatdemand rapid solutions and long-term commitment.
Rejuvenating Casabe The Casabe Field in Colombia was first discovered in
1941 and achieved peak production of 45,000 barrels of oil per day in 1954. Secondary recovery began in the mid-1980s when waterflooding was introduced to boost declining production. In 2004, Ecopetrol, the national oil company of Colombia, offered Schlumberger the opportunity to form an alliance to revive production.
The Alliance began as a 10-year field management project to reverse production decline and extend field life.Four key factors were identified for the success of theAlliance—teamwork, integrated reservoir management,fit-for-purpose technology, and excellence in operationalexecution. The team members were drawn from bothEcopetrol and Schlumberger with expertise that covered a range of technical skills in the field.
Despite Casabe being a mature field, the need for accu-rate seismic data was identified as the first step to betterreservoir understanding, so an extensive 3D seismic surveywas designed and acquired. This led to adjustment of thestructural and static reservoir models, definition of newdrilling targets toward the edges of the field, reduced geological uncertainties, and identification of a number of new and significant oil reserves.
In 2007 the Alliance introduced a selective injectioncompletion system, which enabled more accurate controlof pressure and water injection rates for the various layers of reservoir rock within each producing pattern. The technology helped raise water injection rates andimprove vertical sweep efficiencies to improve production
4
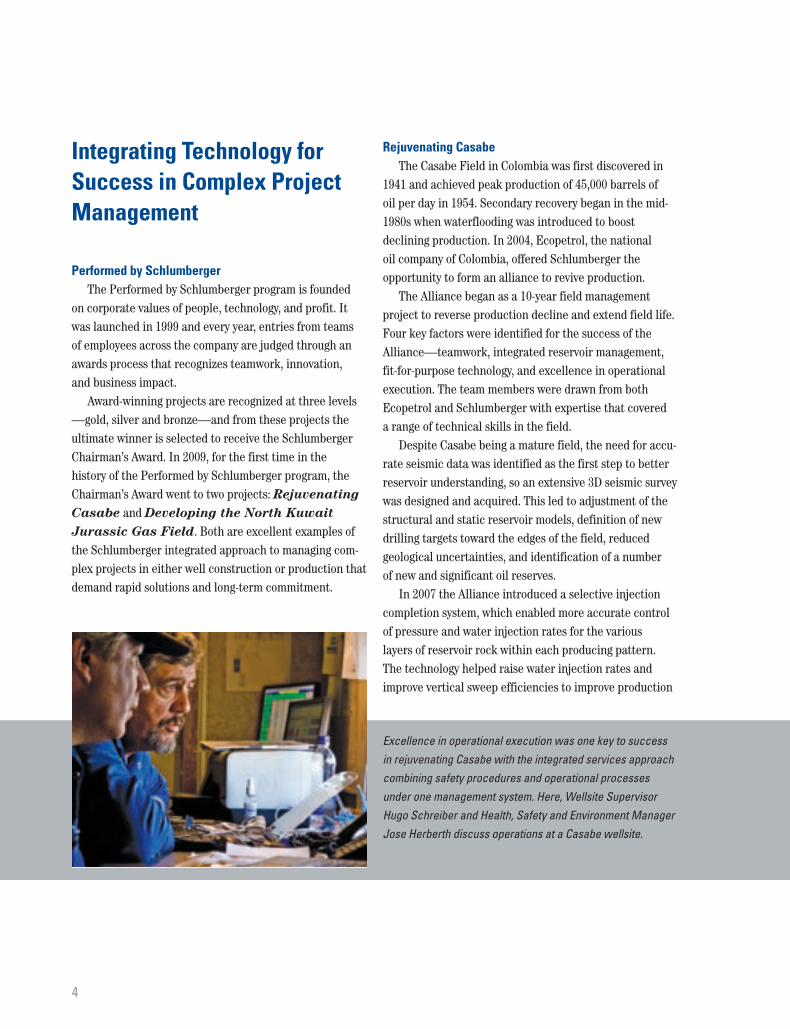
Excellence in operational execution was one key to successin rejuvenating Casabe with the integrated services approachcombining safety procedures and operational processesunder one management system. Here, Wellsite SupervisorHugo Schreiber and Health, Safety and Environment ManagerJose Herberth discuss operations at a Casabe wellsite.
28488schD1R3.qxp:28488schD1R3 2/11/10 8:34 PM Page 4
55
performance. Artificial lift technology was also introducedto increase sand handling and oil production. This furtherimproved performance, and today more than 70% of thefield production is pumped with progressive cavity artifi-cial lift pumps.
The efficiency of the drilling and completions programwas a determining factor in achieving the targeted produc-tion increases within approved budgets. The integratedservices approach provided close coordination and effective processes for continuous improvement acrossoperational phases. As a result, the Alliance reduced operating times by more than 60% per well from beginningto end, providing major savings for Ecopetrol.
After five years’ work, the Alliance has more thantripled production to over 16,000 barrels per day and isnow on target to reach more than 23,000 barrels per dayby 2014. The Casabe project has demonstrated the valueof an integrated approach to project management inreversing production decline and extending the life of the field. With its value clear, the Alliance has beenextended for a further ten years even before the end of the initial ten-year period.
Developing the North Kuwait Jurassic Gas Field In 2005, in recognizing a need for increasing domestic
supply of natural gas, the Kuwait Oil Company (KOC) gave Schlumberger the chance to help it develop the firstnonassociated gas field in Kuwait.
The challenges of this project were apparent from thebeginning. The carbonate reservoir is heterogeneous,
fractured, and highly complex—covering a wide geograph-ical area of more than 1,700 square kilometers. In addition,the anticipated drilling environment posed a variety of difficulties, while the need to accelerate production only added to the pressure. With all of this in mind, theproject team was formed from a diverse group of morethan 50 multidisciplinary experts from both KOC andSchlumberger; who worked together at KOC facilities for the duration of the project.
The field development plan relied on the integration oftechnologies across the spectrum from seismic to stimula-tion, using one of the most innovative and complex reser-voir models developed to date. A 35-million-cell, fine-scalematrix and fracture model with 371 layers at 4- to 6-feetvertical resolution was built using Petrel* workflowprocess software, incorporating all available data. Thereservoir was divided into 48 separate models based on thecurrent understanding of the complex reservoir compart-mentalization. These models were coupled through anadvanced simulation system to ensure optimal selection of future well locations from across six main fields.
The innovative work done by the team enabled comple-tion of the first phase of the field development plan onschedule and with excellent results. This was enough tojustify the investment in the next phase of development,which will ultimately replace the use of liquid hydrocar-bons for electricity generation in Kuwait. By 2015, theNorth Kuwait Jurassic Project is forecast to deliver morethan 1 billion cubic feet of gas per day.
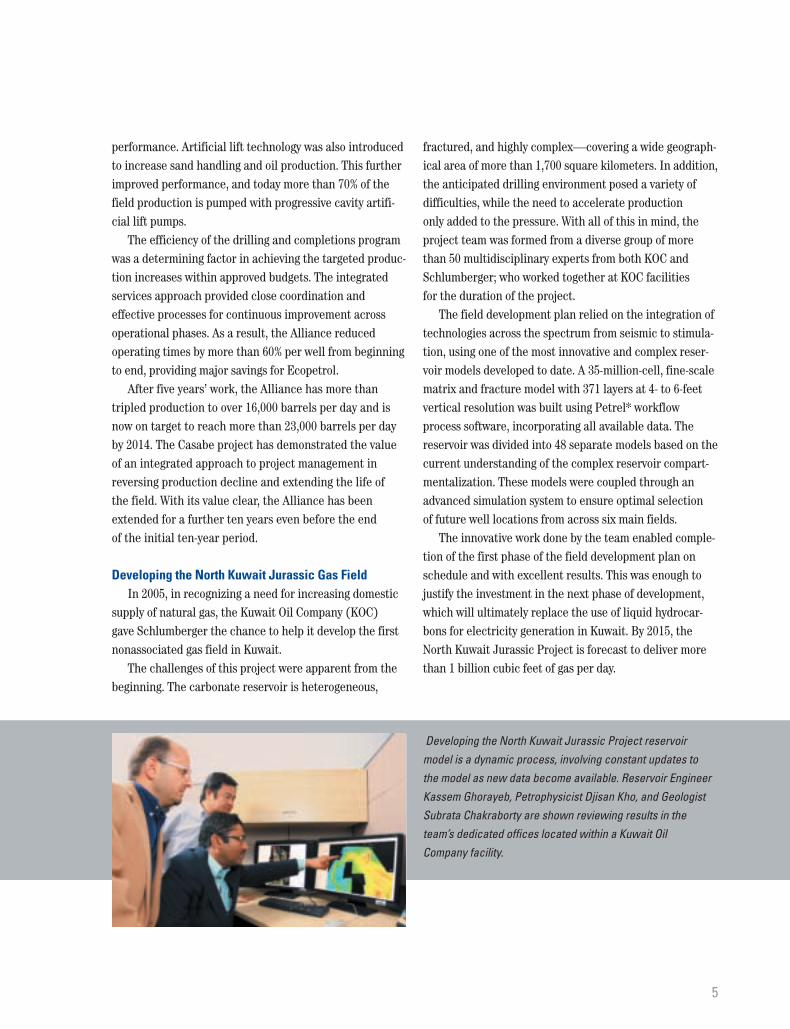
Developing the North Kuwait Jurassic Project reservoirmodel is a dynamic process, involving constant updates to the model as new data become available. Reservoir EngineerKassem Ghorayeb, Petrophysicist Djisan Kho, and GeologistSubrata Chakraborty are shown reviewing results in theteam’s dedicated offices located within a Kuwait Oil Company facility.
28488schD1R3.qxp:28488schD1R3 2/11/10 8:34 PM Page 5

6
Schlumberger-Doll Research, which relocated to Cambridge, Massachusetts, USA, in2006, has been a center of excellence for oilfield research since the 1940s. The centerhouses approximately 150 scientists and engineers representing 31 nationalities focusedon new technologies that will help customers improve recovery and sustain performance.Ronald van Hal, program manager—new spectroscopies, is shown here working on pH measurement technology.
28488schD1R3.qxp:28488schD1R3 2/11/10 8:35 PM Page 6
77
Delivering New TechnologyFaster—The SchlumbergerAdvantage
IntroductionThe age of easy oil is over. As the exploration and pro-
duction (E&P) industry strives to meet the energy needsof tomorrow, it is challenged by frontier locations such asdeeper waters, increasingly complex geological settings,more diverse hydrocarbons, and greater extremes of tem-perature and pressure—all areas where Schlumbergerexcels. These environments require significant new tech-nologies to find and develop the resources that will makeup future production.
In deeper waters, for example, technology challengesare twofold. First, operating costs are high, given the diffi-culty of operating in more than two kilometers of water todevelop reserves trapped below several kilometers of rock.Technology to mitigate risk in such environments is essen-tial. Second, the complexities of these potential reservoirsrequire sophisticated measurement and modeling toensure that the right well is drilled. More often than not,success depends on technology integration.
Natural gas production presents other challenges. Themajority of the world’s gas resources are considered to beunconventional—trapped in low-permeability reservoirs,shales, and coalbed methane formations. Although uncon-ventional gas represents only 10% of today’s total world production, this will increase in the future as world gas consumption accelerates and conventional gas reservoirsdeplete. Natural gas production will also include more com-plex components. Not only will we be producing from uncon-ventional reservoirs, but we will be adding more diversetypes of gas including wet gas, sour gas, and carbon dioxide—all of which further compel the use of new technology.
At the same time, today’s aging global production baserequires greater support. Many of the giant fields that supply current needs were developed using technologiesconceived 50 years ago or more. Production of theirremaining reserves increasingly depends on implementingnew technologies such as multilateral wells and advancedcompletion systems.
A Commitment to Research Schlumberger—the world’s leading supplier of
technology to the E&P industry—has long recognized thattechnology development demands long-term commitment.Many steps are required to bring new technology to mar-ket, including fundamental research, intrinsic develop-ment, and adaptation of solutions from other industries.These factors can lengthen the technology developmentcycle, delaying potential benefits. Consequently, invest-ment and effort must be maintained even in times of slowdown—an objective to which Schlumberger maintainsan unwavering commitment.
As oil and gas production expands geographically, tech-nology development efforts must similarly expand. Forexample, our Research Centers have moved from centralestablishments, far from areas of operations, to networkedfacilities closer to customers and the field. Harnessingregional input while remaining connected to worldwideexpertise is one of the reasons why we inauguratedResearch Centers in Saudi Arabia, Norway, and Russia that complement existing major centers in Cambridge,Massachusetts, USA, and Cambridge, UK. The three new centers are close to oil company operations and toconcentrations of academic expertise.
Each Research Center maintains a specific focus. InRussia, for example, Schlumberger pursues many collabo-rative projects with academic institutions covering seismicand acoustic methods, reservoir physics, and reservoir testing. In Saudi Arabia we are looking in depth at carbonates, and in Brazil a new center will open to focus on research and development for complex deepwater presalt and subsalt environments.
From Research to the FieldTechnology development is not just about research and
engineering. We work in an industry where commercialuptake is often slow due to the sheer size of the invest-ments required. New techniques take time to attain fulldeployment, even more so given the variation in the newhydrocarbon resources to be developed. Consequently, wemust learn to move faster, efficiently selecting the righttechnology and then ensuring its correct application in a timely manner. To this end, Schlumberger has opened a series of Regional Technology Centers with the objective
28488schD1R3.qxp:28488schD1R3 2/11/10 8:35 PM Page 7

8
The Schlumberger DBR Technology Center is located in the Edmonton Research Parkin Alberta—a campus that houses companies engaged in advanced research. FluidAnalysis Specialist Mila Goretic and Project Engineer Fenglou Zhou prepare the 2D gaschromatograph to analyze the chemical signature of a heavy oil sample. Such signaturesdefine variability across the reservoir and help reservoir engineers optimize stimulationand production programs.
28488schD1R3.qxp:28488schD1R3 2/11/10 8:35 PM Page 8
99
of answering customer needs by combining multidomainpetrotechnical expertise with Schlumberger technology in a collaborative environment.
The Regional Technology Centers bridge the gapbetween field operations and research and engineering.While responding to global industry challenges, they alsomeet regional needs by creating a collaborative environ-ment in which customer and Schlumberger experts canwork to solve specific questions. In Dallas, Texas, USA, the focus falls on unconventional gas resources; in Calgary,Alberta, Canada, it’s on heavy oil reservoirs; and the cen-ter in Mexico City, Mexico, targets advanced recovery techniques. In the Eastern Hemisphere, Abu Dhabi, UAE,directs its efforts at carbonates; Moscow, Russia, targetsthe difficulties that surround gas condensate production;and Kuala Lumpur, Malaysia, works on deepwater technol-ogy applications.
Where the Regional Technology Centers are close tosatellite Research Centers such as those in Russia or inSaudi Arabia, their value is increased by an expanded network of available specialists. The work performed cantherefore include more fundamental aspects. However, the overall goal remains to bring new technologies on linefaster through their introduction on specific projects inthe same geographical area rather than through more general approaches.
Answers for More Diverse CrudesHeavy oil, extra-heavy oil, and bitumen are estimated to
make up 70% of the world’s total oil reserves. Other liquid
resources include oil shales that require major technologi-cal breakthroughs to become commercial. Geographically,
today’s centers of heavy, or viscous, oil reserves lie inCanada and Venezuela. In both countries, Schlumbergerhas located specific expertise directed at providing the scientific and technical leadership to stimulate relevanttechnology development.
The Calgary Heavy Oil Regional Technology Centeropened its doors in August 2007. Located close to majoroperators, the center is designed for client interaction,providing open collaboration spaces, formal meeting rooms,workshops, and a dedicated data visualization center.Experts in geology, geophysics, physics, geochemistry, production, and reservoir engineering work alongsideoperational personnel. Leveraging contacts with acade-mia, relationships have already been forged with theAlberta Research Council and universities, including thefunding of several PhD candidates.
This team supports the development of modeling andsimulation technologies for thermal recovery, cold heavyoil production with sand (CHOPS), cold production in horizontal wells, solvent recovery processes, air injection,and fully coupled geomechanical and reservoir modeling.Focus is also on the understanding of fluid behavior andpressure-volume-temperature (PVT) properties. Thisincludes high-temperature PVT analysis, miscible injectionstudies, viscosity measurement, flow assurance, and specificstudies in geochemistry. Much of this work is conducted inconjunction with the Schlumberger DBR TechnologyCenter, located nearby in Edmonton, Alberta, Canada.
A number of customer programs involve both thermaland cold production projects with the objective of improv-
ing reservoir recovery. New applications of Vx* advancedmultiphase flowmeter technology are being developed foruse in steam-assisted gravity drainage (SAGD) systems aspart of a wider approach of enhancing high-temperature
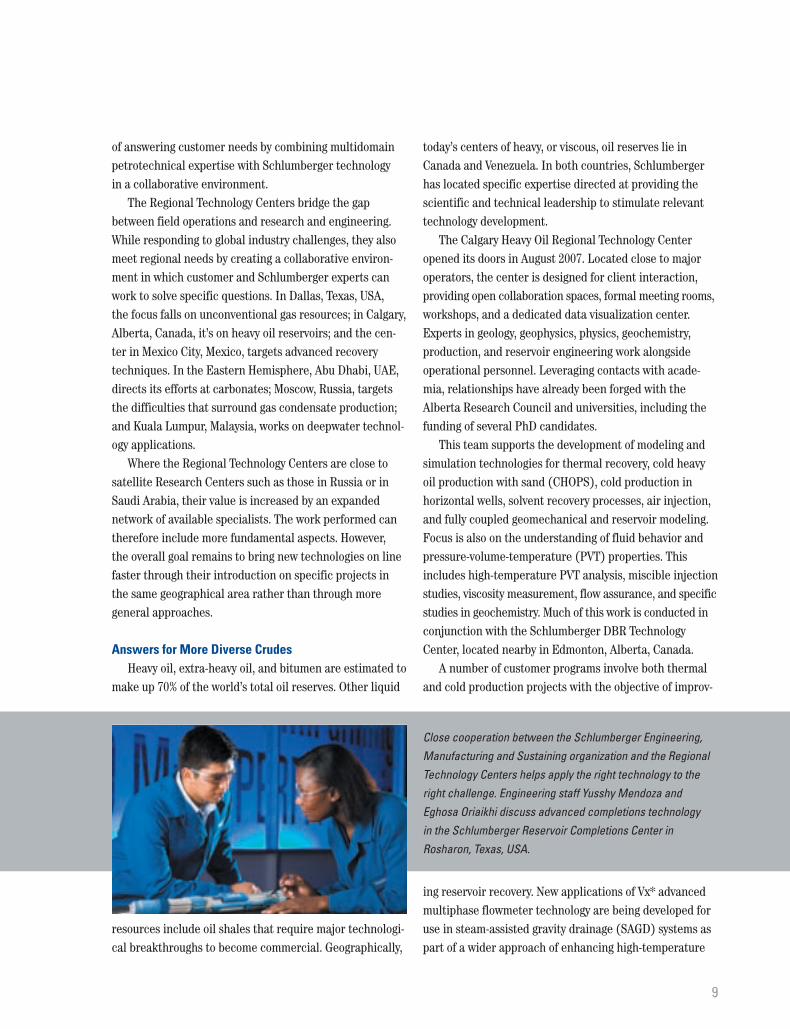
Close cooperation between the Schlumberger Engineering,Manufacturing and Sustaining organization and the RegionalTechnology Centers helps apply the right technology to theright challenge. Engineering staff Yusshy Mendoza andEghosa Oriaikhi discuss advanced completions technology in the Schlumberger Reservoir Completions Center inRosharon, Texas, USA.
28488schD1R3.qxp:28488schD1R3 2/11/10 8:35 PM Page 9

10
Regional Technology Centers foster multidisciplinary cooperation between geoscientistsand engineers. Visualization of the potential results of proposed technical solutions is key to clear communication and rapid understanding. In Calgary, Fereidoon Farahani,Amin Saeedfar, Jose Rivero, Robert Godfrey, Kevin McCarthy, and John Zhao discussmodeling and simulation results from a heavy oil project in Canada.
28488schD1R3.qxp:28488schD1R3 2/11/10 8:35 PM Page 10
11111111
electric submersible pump performance. Smart comple-tions as well as crosswell electromagnetic and seismic sur-veys are being studied for their potential toward improvingSAGD recovery. A total of seven Schlumberger technologyorganizations are contributing to work at the center, making it a truly multidisciplinary effort.
The Faja Heavy Oil Center of Excellence in Venezuelaalso contributes to Schlumberger customer understandingof heavy oil challenges, specifically in Latin America. The higher ambient temperatures have allowed cold production based on multilateral well technologies to beused in the area, but even in the Orinoco belt, thermalrecovery techniques are necessary to improve recovery.Consequently, the Faja center draws on expertise fromCalgary while developing its own approach to meetingmore specific local needs.
And More Complex Natural Gas ResourcesToday’s unconventional natural gas development is
mainly in North America, and particularly in the UnitedStates where it represents more than 40% of domestic production—a figure that has been made possible byexciting new technologies that maximize the contactbetween the producing shale formation and the wellbore.
One of the biggest challenges in developing unconven-tional gas fields is understanding the complex reservoircharacteristics and fluid flow processes for optimizing production design and improving recovery factor. TheRegional Technology Center in Dallas, which opened in
early 2007, applies rigorous scientific analysis of data andinformation to address the myriad knowledge and technol-ogy gaps in unconventional gas development. Three maintechnical domains are involved. The first, productivityoptimization, is focused on the hydraulic and geomechani-
cal mechanisms that influence natural gas flow. The second, completions and production, develops advancedmodeling capabilities for predicting production potentialthroughout the life of an unconventional gas well. Thethird, geosciences, completes the production designprocess by building an in-depth understanding of thepetrophysical properties of unconventional reservoirs to optimize the design of well placement, completion, andstimulation programs.
But North America is not alone in the development ofunconventional gas resources. The trend toward uncon-ventional gas production is spreading to other parts of theworld as demand increases are driven by industrial expan-sion, petrochemical needs, and residential growth. By2030, the Middle East and Asia will account for 30% ofglobal natural gas demand—up from 19% today. To meetthis demand tomorrow, operators must focus on new solu-tions today. That is why Schlumberger opened the TightGas Center of Excellence in Al-Khobar, Saudi Arabia, inJuly 2008. Much of the technical approach comes fromapplying and adapting the techniques that have proved sosuccessful in North America. But the center also providesan environment in which engineers new to unconventionalgas production can absorb the knowledge necessary todevelop such resources successfully.
Russia holds the largest natural gas reserves in theworld, and Moscow has been home to a RegionalTechnology Center since January 2007. The center’s origi-nal charter, the study of gas condensates, is significant
because as the supply of dry gas from conventional largegas fields declines, future production will increasinglycome from wet gas or gas condensate fields. In such fields,gas can liquefy as the pressure drops with production,reducing recoverable volumes and reservoir deliverability.
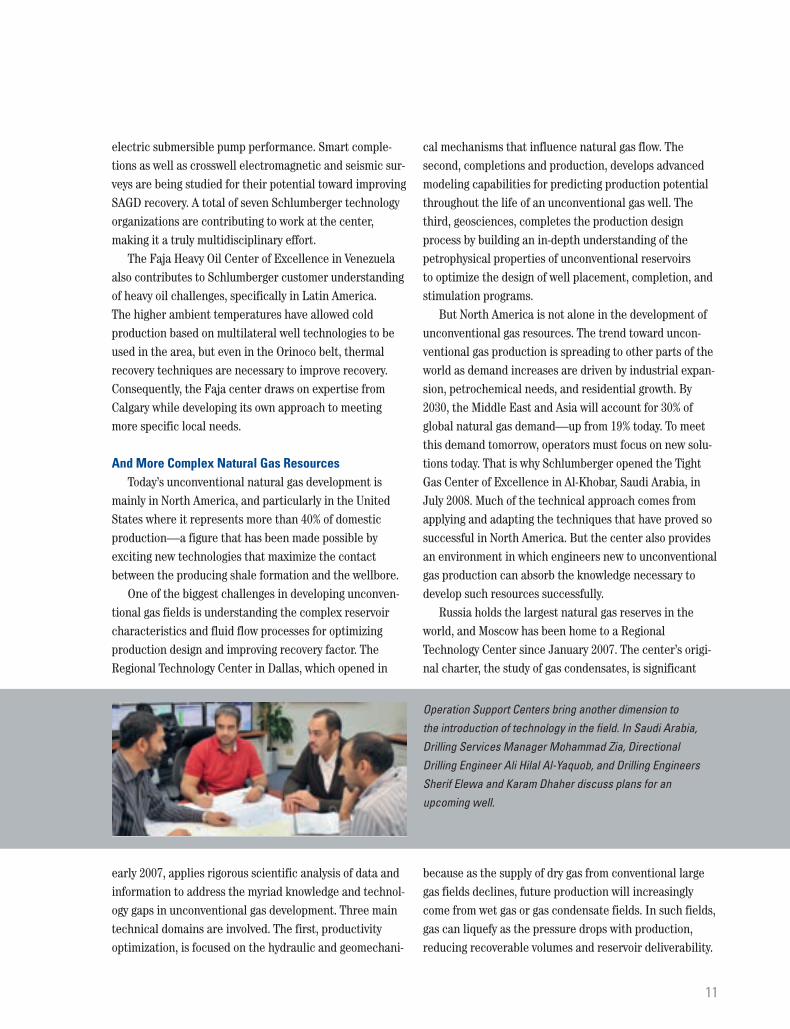
Operation Support Centers bring another dimension to the introduction of technology in the field. In Saudi Arabia,Drilling Services Manager Mohammad Zia, Directional Drilling Engineer Ali Hilal Al-Yaquob, and Drilling EngineersSherif Elewa and Karam Dhaher discuss plans for an upcoming well.
28488schD1R3.qxp:28488schD1R3 2/11/10 8:35 PM Page 11

12
Wireline logging tool measurements help deliver accurate fluid analysis for heavy oil fields, where viscosity can vary significantly across a single reservoir and affect production rates. Fluid viscosity variations can be incorporated into models to improve theaccuracy of simulation predictions. In Venezuela, Electronics Engineer Victor Rodriguezprepares an MDT* modular dynamics tester tool before a fluid sampling job.
28488schD1R3.qxp:28488schD1R3 2/11/10 8:36 PM Page 12
Russia is home to a substantial Schlumberger technicalpresence including research, engineering, manufacturing,and sustaining facilities. The Regional Technology Centercan therefore draw on a wealth of expertise to support its work.
The Technology Collaboration Framework Agreementsigned between Gazprom and Schlumberger in November2008 extended the center’s mandate beyond the technicalchallenges of gas condensates. In 2009, review began of more than 80 possible technologies that had been identified for fracturing, coiled tubing and sidetrackingoperations as well as for artificial lift systems. Candidatewells were subsequently selected, and pilot jobs havealready led to significant increases in gas production.
Reservoir Rock Is Complex TooAnalyses by the International Energy Agency, BP, and
Schlumberger indicate that approximately 60% of theworld’s conventional oil reserves and 40% of the world’sconventional natural gas reserves are trapped in carbon-ate rocks. The Middle East holds 62% of the world’s provedconventional oil reserves; approximately 70% of these arein carbonate reservoirs. The Middle East also holds 40% ofthe world’s gas reserves, of which 90% are in carbonates.The Schlumberger Abu Dhabi Regional Technology Centeris therefore well situated to focus on technologies forimproving carbonate reservoir performance. Reflectingthe importance of carbonate reservoirs to world oil andgas production, the Abu Dhabi center is part of a world-wide Schlumberger technology effort that harnesses
Saudi Arabia; Stavanger, Norway; Clamart, France;Rosharon and Sugar Land, Texas, USA; and Beijing, China.
Carbonate reservoirs are highly heterogeneous andexhibit varying degrees of diagenesis. Their porosity sys-tems are complex, their description challenging, and theirrecovery factors can be significantly lower than average.Techniques that improve formation evaluation, reservoircharacterization, sweep efficiency, and oil recovery in carbonate reservoirs are therefore clear opportunities forthe application of Schlumberger technologies.
The experts who staff the Abu Dhabi center are wellengaged in a number of collaborative projects that addresscustomer needs in developing carbonate reservoirs. Thesemultidisciplinary solutions include deep-reading crosswellseismic and electromagnetic surveys for visualizing sweeppatterns and fracture characterization using the latestUniQ point-receiver land acquisition system. They alsoinclude enhanced oil recovery techniques which are beingassessed using MDT technology from depth to depth in thesame well, and from well to well in the same field.
Depth and Breadth, Across the WorldIn September 2009, Schlumberger announced the sign-
ing of a joint cooperation agreement with the UniversidadeFederal do Rio de Janeiro to build a key Research Centeron the university’s campus. The agreement marks the firstinternational research and geosciences center to belocated at the university’s technology park. The new cen-ter will focus on many of the research and developmentprojects that form the basis of a Technology CooperationAgreement recently signed between Petrobras andSchlumberger. As the network of Schlumberger RegionalTechnology Centers develops, so does the unique technol-ogy advantage that Schlumberger brings to present andfuture E&P industry challenges.
1313
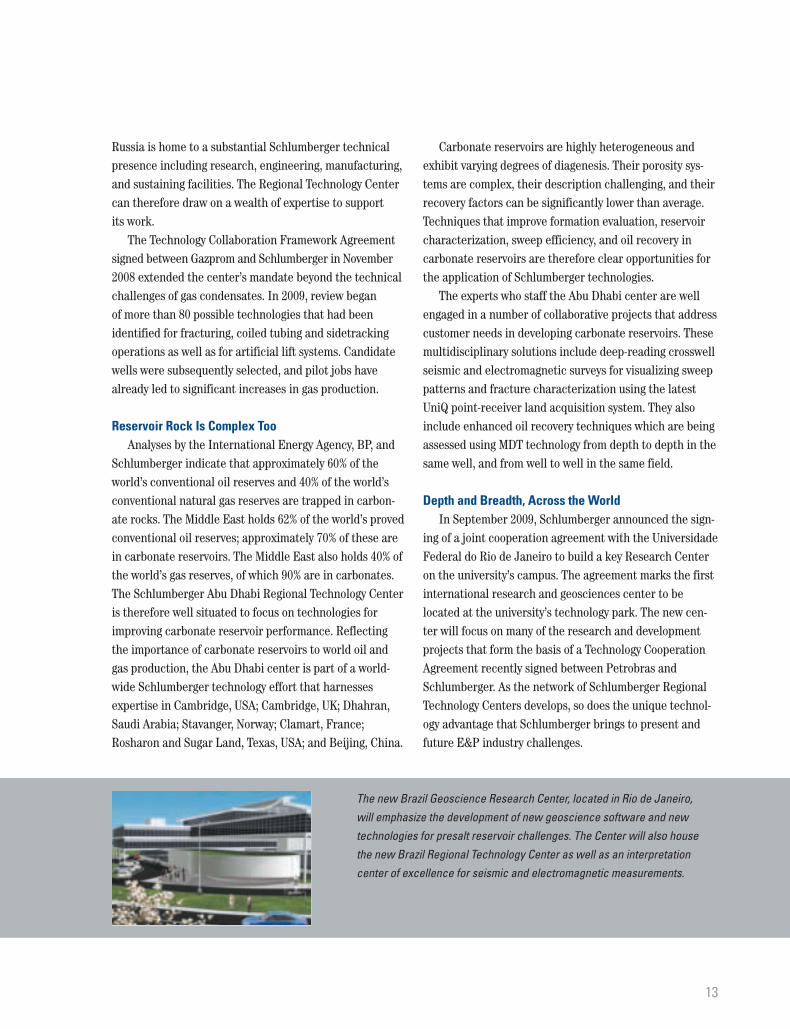
The new Brazil Geoscience Research Center, located in Rio de Janeiro, will emphasize the development of new geoscience software and new technologies for presalt reservoir challenges. The Center will also housethe new Brazil Regional Technology Center as well as an interpretation center of excellence for seismic and electromagnetic measurements.
28488schD1R3.qxp:28488schD1R3 - Text 2/12/10 10:44 AM Page 13
expertise in Cambridge, USA; Cambridge, UK; Dhahran,
Technology and the Environment—Measurement and Impact
Schlumberger technology, innovation, and knowledgeare not only directed at improving reservoir performance.They are also of value in how we contribute to addressingclimate change: both as a provider of solutions and in howwe manage our own greenhouse gas (GHG) footprint. Inparticular, we directed significant effort at measuring ourGHG emissions in 2009, with an additional focus on widerenvironmental issues including groundwater protection.
As a technology leader in oil and gas exploration andproduction, Schlumberger believes that growing concernsover levels of anthropogenic carbon dioxide emissionsrequire complementary mechanisms to reduce GHG con-centrations. This view is linked to the certainty that fossilfuels will continue to fulfill the overwhelming majority ofthe world’s energy needs for decades to come. Expert bodies such as the International Energy Agency havealready identified means for emissions reduction—including energy efficiency, greater use of renewable energies and nuclear power, and geological carbon captureand storage (CCS). Implementation of the latter dependson accurate characterization of subsurface storage forma-tions—a discipline to which Schlumberger naturally
contributes substantially through its measurement tech-nologies and geoscience expertise. Indeed, SchlumbergerCarbon Services, formed in 2005, is already a leadingplayer in this field, with experience in the more than 30 pilot projects active worldwide.
While technologies such as CCS can deliver significantcontributions in the future, energy efficiency and carbondioxide emission reduction programs represent moreimmediate solutions for today. Schlumberger is focused on measuring and reporting GHG emissions each year with greater clarity as more measurement data of morereliable quality become available. Since 2005 we have submitted figures and narrative to the Carbon DisclosureProject, and in 2008 we adopted the GHG Protocol toguide us in setting the boundaries of our reporting.
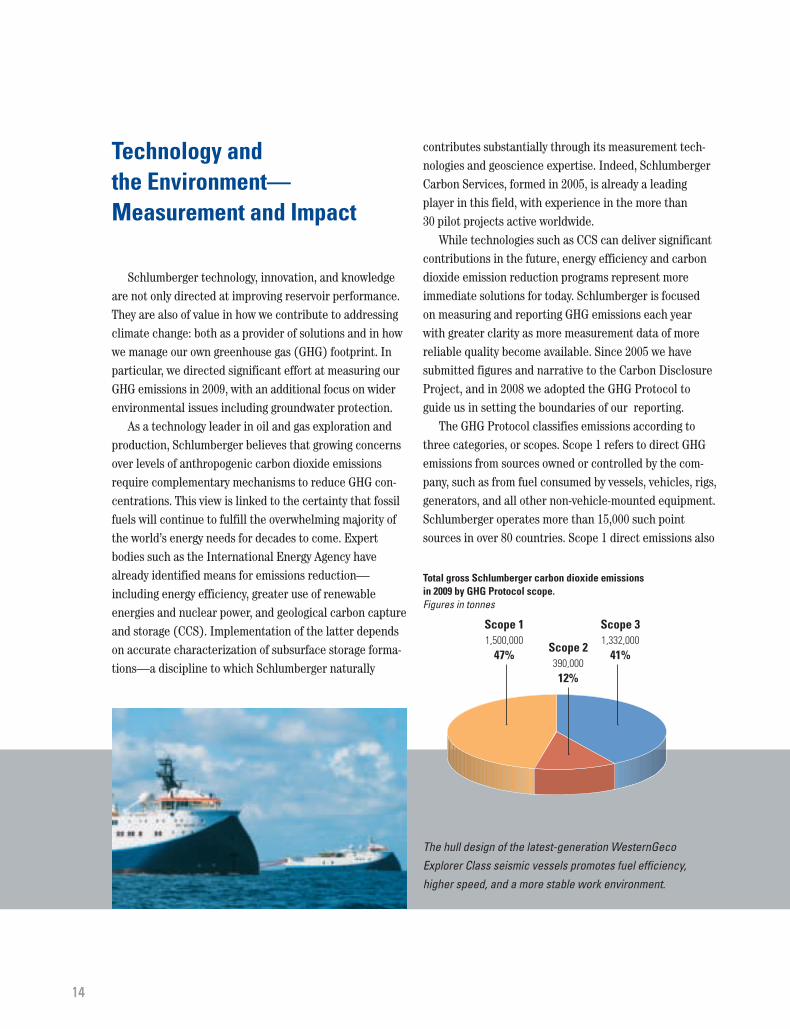
The GHG Protocol classifies emissions according tothree categories, or scopes. Scope 1 refers to direct GHGemissions from sources owned or controlled by the com-pany, such as from fuel consumed by vessels, vehicles, rigs,generators, and all other non-vehicle-mounted equipment.Schlumberger operates more than 15,000 such pointsources in over 80 countries. Scope 1 direct emissions also
1414
The hull design of the latest-generation WesternGecoExplorer Class seismic vessels promotes fuel efficiency,higher speed, and a more stable work environment.
Scope 31,332,000
41%
Scope 11,500,000
47%Scope 2390,000
12%
Total gross Schlumberger carbon dioxide emissions in 2009 by GHG Protocol scope. Figures in tonnes
28488schD1R3.qxp:28488schD1R3 2/11/10 8:36 PM Page 14
15
include those from offices and other facilities, wellsiteoperations, and natural gas consumption for power or heatgeneration. Scope 2 indirect GHG emissions are from elec-tricity generation at power stations for consumption bySchlumberger-controlled activities. Other indirect GHGemissions from associated activities not directly controlledby Schlumberger are reported as Scope 3. These includesubcontracted haulage and employee business travel, butthe majority comes from the production of cement used inwell cementing operations and of ceramic proppants usedin well stimulation.
The decrease in Schlumberger GHG emissions intensityfrom 2008 to 2009, although principally activity related,has indicated the potential for reduction strategies. Insome cases, these strategies await the development of newtechnologies in power generation and automotive engi-neering. In the meantime, we have identified a number of ways that our emissions might be reduced. In landtransportation—our most significant source of emis-sions—avoiding excess weight, heavy acceleration, unnecessary idling, and inadequate gear selection couldreduce related emissions by up to 10%. Other opportuni-ties are afforded by engine downsizing during fleetrenewal, hybrid and electric vehicles where operationallyappropriate, and new-generation fuels. To monitorprogress, our comprehensive e-Journey* computer-basedjourney management system for driving safety can beextended to track improvements brought by environmen-tally friendly driving.
Reductions in emissions from fuel consumed in non-land-transportation activities are also targeted.
New-generation marine seismic survey vessels towinghydrodynamically efficient streamer arrays offer one solution; additional options are improved maintenanceand generator efficiency and alternative energy sourcesfor field power generation. Within the supply chain,Schlumberger will be working with cement and ceramicproppant suppliers to identify achievable savings.
While carbon emissions are generally associated withclimate change, they form only part of the Schlumbergerapproach to the environment. Other operational concernsinclude the chemicals used in well stimulation, for whichthe company has pledged significant efforts aimed at deliv-ering best-in-class technology with greater transparency.We continue to address our overall environmental foot-print, with a 65-strong team of auditors assessing our 550-plus locations around the world. The environmentalassessment process is rigorous and compliance must be demonstrated to 85 requirements. In 2008 more than 96% of Schlumberger sites achieved compliance with the requirements of the company’s EnvironmentalManagement Standard. Wherever it works, Schlumbergeradheres strictly to local environmental laws, but in thosecases where differences exist between local laws andSchlumberger standards, compliance is based on the morestringent of the two—which is often the Schlumbergerstandard.
Technology is key to Schlumberger—forming a signifi-cant differentiator—from the company’s unique range ofservices and products, through its management systemsand processes, to the manner in which it can help addressenvironmental concerns with concrete actions.
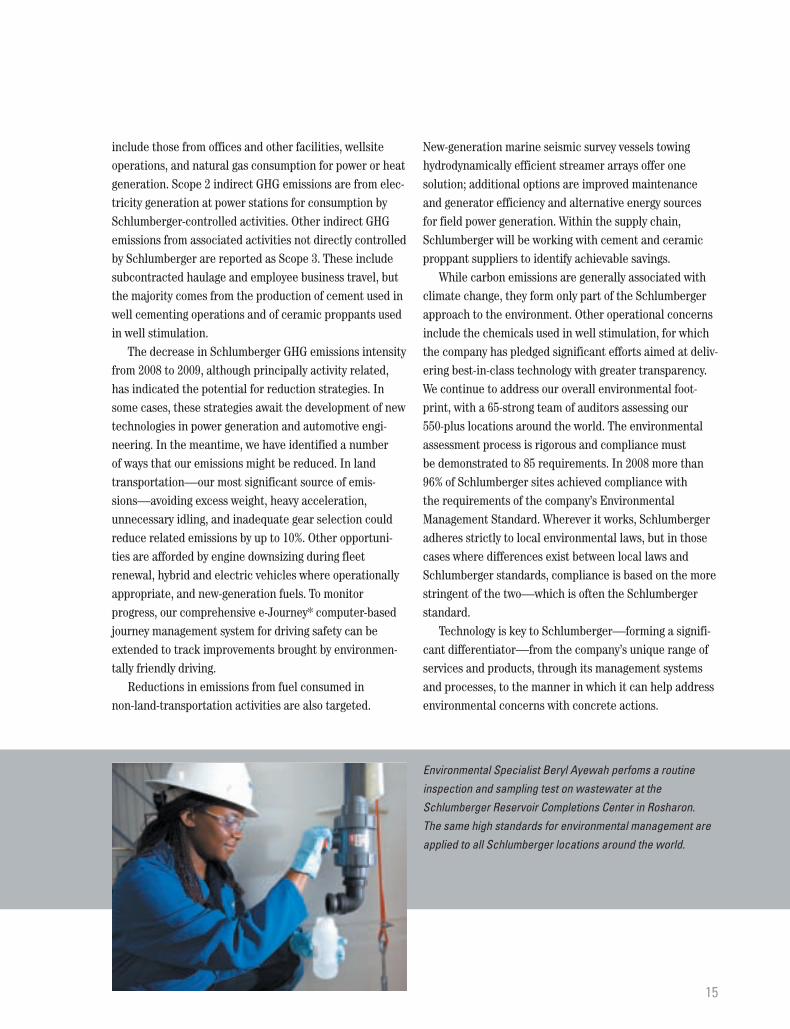
Environmental Specialist Beryl Ayewah perfoms a routineinspection and sampling test on wastewater at theSchlumberger Reservoir Completions Center in Rosharon.The same high standards for environmental management areapplied to all Schlumberger locations around the world.
28488schD1R3.qxp:28488schD1R3 2/11/10 8:36 PM Page 15

Technology is key to Schlumberger—forming a signifi-
cant differentiator—from the company’s unique range of
services and products, through its management systems
and processes, to the manner in which it can help
address environmental concerns with concrete actions.
16
Land seismic technology is undergoing significant evolutionarychange with the introduction ofWesternGeco UniQ integrated point-receiver systems. In Kuwait,this crew is acquiring data for use in new studies of reservoir fracture conductivity.
28488schD1R3.qxp:28488schD1R3 2/11/10 8:36 PM Page 16
UNITED STATES SECURITIES AND EXCHANGE COMMISSIONWashington, D.C. 20549
Form 10-K(Mark One)È ANNUAL REPORT PURSUANT TO SECTION 13 OR 15(d) OF THE SECURITIES EXCHANGE ACT OF 1934
For the fiscal year ended December 31, 2009OR
‘ TRANSITION REPORT PURSUANT TO SECTION 13 OR 15(d) OF THE SECURITIES EXCHANGE ACT OF 1934For the transition period from to
Commission File Number 1-4601
Schlumberger N.V. (Schlumberger Limited)(Exact name of registrant as specified in its charter)
Netherlands Antilles 52-0684746(State or other jurisdiction ofincorporation or organization)
(IRS Employer Identification No.)
42, rue Saint-DominiqueParis, France
75007
5599 San Felipe, 17th FloorHouston, Texas, United States of America
77056
Parkstraat 83, The Hague,The Netherlands 2514 JG
(Addresses of principal executive offices) (Zip Codes)Registrant’s telephone number in the United States, including area code, is:
(713) 513-2000Securities registered pursuant to Section 12(b) of the Act:
Title of each class Name of each exchange on which registered
Common Stock, par value $0.01 per share New York Stock ExchangeEuronext ParisThe London Stock ExchangeSIX Swiss Exchange Ltd.
Securities registered pursuant to Section 12(g) of the Act:None
Indicate by check mark if the registrant is a well-known seasoned issuer, as defined in Rule 405 of the Securities Act.YES È NO ‘
Indicate by check mark if the registrant is not required to file reports pursuant to Section 13 or Section 15(d) of the Act.YES ‘ NO È
Indicate by check mark whether the registrant (1) has filed all reports required to be filed by Section 13 or 15(d) of theSecurities Exchange Act of 1934 during the preceding 12 months (or for such shorter period that the registrant wasrequired to file such reports), and (2) has been subject to such filing requirements for the past 90 days. YES È NO ‘
Indicate by check mark whether the registrant has submitted electronically and posted on its corporate Web site, if any,every Interactive Data File required to be submitted and posted pursuant to Rule 405 of Regulation S-T during the preceding12 months (or for such shorter period that the registrant was required to submit and post such files. YES È NO ‘
Indicate by check mark if disclosure of delinquent filers pursuant to Item 405 of Regulation S-K is not contained herein,and will not be contained, to the best of the registrant’s knowledge, in definitive proxy or information statementsincorporated by reference in Part III of this Form 10-K or any amendment to this Form 10-K. ‘
Indicate by check mark whether the registrant is a large accelerated filer, an accelerated filer, a non-accelerated filer, ora smaller reporting company. See the definitions of “large accelerated filer”, “accelerated filer” and “smaller reportingcompany” in Rule 12b-2 of the Exchange Act.Large accelerated filer È Accelerated filer ‘ Non-accelerated filer ‘ Smaller reporting company ‘
Indicate by check mark whether the registrant is a shell company (as defined in Rule 12b-2 of the Act). YES ‘ NO È
As of June 30, 2009, the aggregate market value of the common stock of the registrant held by non-affiliates of theregistrant was approximately $64.7 billion.As of January 31, 2010, the number of shares of common stock outstanding was 1,196,589,089.
DOCUMENTS INCORPORATED BY REFERENCEPortions of the following document have been incorporated herein by reference into Part III of this Form 10-K to theextent described therein: the definitive proxy statement relating to Schlumberger’s 2010 Annual General Meeting ofStockholders (“2010 Proxy Statement”).
SCHLUMBERGER LIMITED
Table of Contents
Form 10-KPage
PART IItem 1. Business 3Item 1A. Risk Factors 6Item 1B. Unresolved Staff Comments 10Item 2. Properties 10Item 3. Legal Proceedings 10Item 4. Submission of Matters to a Vote of Security Holders 10
PART IIItem 5. Market for Schlumberger’s Common Stock, Related Stockholder Matters and Issuer
Purchases of Equity Securities 12Item 6. Selected Financial Data 15Item 7. Management’s Discussion and Analysis of Financial Condition and Results of
Operations 17Item 7A. Quantitative and Qualitative Disclosures About Market Risk 33Item 8. Financial Statements and Supplementary Data 35Item 9. Changes in and Disagreements with Accountants on Accounting and Financial
Disclosure 71Item 9A. Controls and Procedures 71Item 9B. Other Information 71
PART IIIItem 10. Directors, Executive Officers and Corporate Governance of Schlumberger 72Item 11. Executive Compensation 72Item 12. Security Ownership of Certain Beneficial Owners and Management and Related
Stockholder Matters 72Item 13. Certain Relationships and Related Transactions, and Director Independence 73Item 14. Principal Accounting Fees and Services 73
PART IVItem 15. Exhibits and Financial Statement Schedules 74
Signatures 75Certifications
Part 1, Item 1
PART I
Item 1. Business.
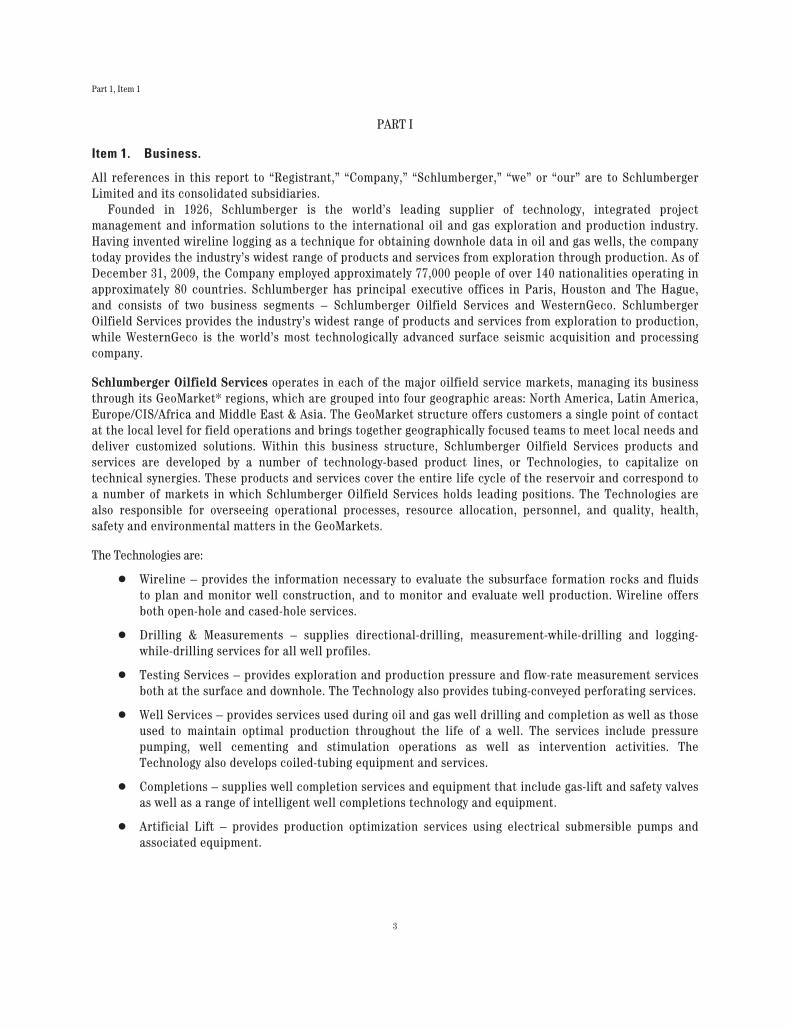
All references in this report to “Registrant,” “Company,” “Schlumberger,” “we” or “our” are to SchlumbergerLimited and its consolidated subsidiaries.
Founded in 1926, Schlumberger is the world’s leading supplier of technology, integrated projectmanagement and information solutions to the international oil and gas exploration and production industry.Having invented wireline logging as a technique for obtaining downhole data in oil and gas wells, the companytoday provides the industry’s widest range of products and services from exploration through production. As ofDecember 31, 2009, the Company employed approximately 77,000 people of over 140 nationalities operating inapproximately 80 countries. Schlumberger has principal executive offices in Paris, Houston and The Hague,and consists of two business segments – Schlumberger Oilfield Services and WesternGeco. SchlumbergerOilfield Services provides the industry’s widest range of products and services from exploration to production,while WesternGeco is the world’s most technologically advanced surface seismic acquisition and processingcompany.
Schlumberger Oilfield Services operates in each of the major oilfield service markets, managing its businessthrough its GeoMarket* regions, which are grouped into four geographic areas: North America, Latin America,Europe/CIS/Africa and Middle East & Asia. The GeoMarket structure offers customers a single point of contactat the local level for field operations and brings together geographically focused teams to meet local needs anddeliver customized solutions. Within this business structure, Schlumberger Oilfield Services products andservices are developed by a number of technology-based product lines, or Technologies, to capitalize ontechnical synergies. These products and services cover the entire life cycle of the reservoir and correspond toa number of markets in which Schlumberger Oilfield Services holds leading positions. The Technologies arealso responsible for overseeing operational processes, resource allocation, personnel, and quality, health,safety and environmental matters in the GeoMarkets.
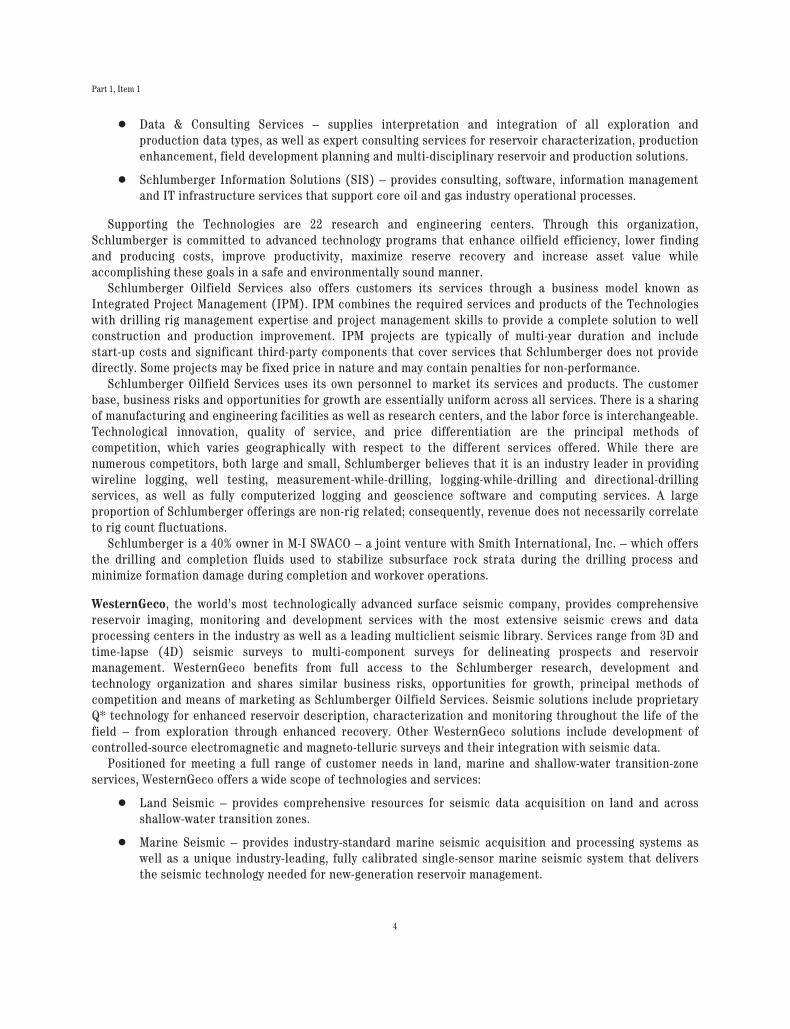
The Technologies are:
Š Wireline – provides the information necessary to evaluate the subsurface formation rocks and fluidsto plan and monitor well construction, and to monitor and evaluate well production. Wireline offersboth open-hole and cased-hole services.
Š Drilling & Measurements – supplies directional-drilling, measurement-while-drilling and logging-while-drilling services for all well profiles.
Š Testing Services – provides exploration and production pressure and flow-rate measurement servicesboth at the surface and downhole. The Technology also provides tubing-conveyed perforating services.
Š Well Services – provides services used during oil and gas well drilling and completion as well as thoseused to maintain optimal production throughout the life of a well. The services include pressurepumping, well cementing and stimulation operations as well as intervention activities. TheTechnology also develops coiled-tubing equipment and services.
Š Completions – supplies well completion services and equipment that include gas-lift and safety valvesas well as a range of intelligent well completions technology and equipment.
Š Artificial Lift – provides production optimization services using electrical submersible pumps andassociated equipment.
3
Part 1, Item 1
Š Data & Consulting Services – supplies interpretation and integration of all exploration andproduction data types, as well as expert consulting services for reservoir characterization, productionenhancement, field development planning and multi-disciplinary reservoir and production solutions.
Š Schlumberger Information Solutions (SIS) – provides consulting, software, information managementand IT infrastructure services that support core oil and gas industry operational processes.
Supporting the Technologies are 22 research and engineering centers. Through this organization,Schlumberger is committed to advanced technology programs that enhance oilfield efficiency, lower findingand producing costs, improve productivity, maximize reserve recovery and increase asset value whileaccomplishing these goals in a safe and environmentally sound manner.
Schlumberger Oilfield Services also offers customers its services through a business model known asIntegrated Project Management (IPM). IPM combines the required services and products of the Technologieswith drilling rig management expertise and project management skills to provide a complete solution to wellconstruction and production improvement. IPM projects are typically of multi-year duration and includestart-up costs and significant third-party components that cover services that Schlumberger does not providedirectly. Some projects may be fixed price in nature and may contain penalties for non-performance.
Schlumberger Oilfield Services uses its own personnel to market its services and products. The customerbase, business risks and opportunities for growth are essentially uniform across all services. There is a sharingof manufacturing and engineering facilities as well as research centers, and the labor force is interchangeable.Technological innovation, quality of service, and price differentiation are the principal methods ofcompetition, which varies geographically with respect to the different services offered. While there arenumerous competitors, both large and small, Schlumberger believes that it is an industry leader in providingwireline logging, well testing, measurement-while-drilling, logging-while-drilling and directional-drillingservices, as well as fully computerized logging and geoscience software and computing services. A largeproportion of Schlumberger offerings are non-rig related; consequently, revenue does not necessarily correlateto rig count fluctuations.
Schlumberger is a 40% owner in M-I SWACO – a joint venture with Smith International, Inc. – which offersthe drilling and completion fluids used to stabilize subsurface rock strata during the drilling process andminimize formation damage during completion and workover operations.
WesternGeco, the world’s most technologically advanced surface seismic company, provides comprehensivereservoir imaging, monitoring and development services with the most extensive seismic crews and dataprocessing centers in the industry as well as a leading multiclient seismic library. Services range from 3D andtime-lapse (4D) seismic surveys to multi-component surveys for delineating prospects and reservoirmanagement. WesternGeco benefits from full access to the Schlumberger research, development andtechnology organization and shares similar business risks, opportunities for growth, principal methods ofcompetition and means of marketing as Schlumberger Oilfield Services. Seismic solutions include proprietaryQ* technology for enhanced reservoir description, characterization and monitoring throughout the life of thefield – from exploration through enhanced recovery. Other WesternGeco solutions include development ofcontrolled-source electromagnetic and magneto-telluric surveys and their integration with seismic data.
Positioned for meeting a full range of customer needs in land, marine and shallow-water transition-zoneservices, WesternGeco offers a wide scope of technologies and services:
Š Land Seismic – provides comprehensive resources for seismic data acquisition on land and acrossshallow-water transition zones.
Š Marine Seismic – provides industry-standard marine seismic acquisition and processing systems aswell as a unique industry-leading, fully calibrated single-sensor marine seismic system that deliversthe seismic technology needed for new-generation reservoir management.
4
Part 1, Item 1
Š Multiclient Services – supplies high-quality seismic data from the multiclient library, includingindustry-leading Q technology data.
Š Reservoir Services – provides people, tools and technology to help customers capture the benefits of acompletely integrated approach to locating, defining and monitoring the reservoir.
Š Data Processing – offers extensive seismic data processing centers for complex data processingprojects.
Š Electromagnetics – provides controlled-source electromagnetic and magneto-telluric data acquisitionand processing.
Acquisitions
Information about acquisitions made by Schlumberger appears in Note 4 of the Consolidated Financial Statements.
GENERAL
Research Centers
Research to support the engineering and development efforts of Schlumberger activities is principallyconducted at Cambridge, Massachusetts, United States; Cambridge, England; Stavanger, Norway; Moscow,Russia; and Dhahran, Saudi Arabia.
Patents
While Schlumberger seeks and holds numerous patents covering various products and processes, no particularpatent or group of patents is considered material to Schlumberger’s business.
Seasonality
Although weather and natural phenomena can temporarily affect delivery of oilfield services, the widespreadgeographic location of such services precludes the overall business from being characterized as seasonal.
Customers and Backlog of Orders
No single customer exceeded 10% of consolidated revenue. Oilfield Services has no significant backlog due tothe nature of its business. The WesternGeco backlog, which is based on signed contracts with customers, was$1.0 billion at December 31, 2009 ($1.8 billion at December 31, 2008).
Employees
As of December 31, 2009, Schlumberger had approximately 77,000 employees.
Financial Information
Financial information by business segment for the years ended December 31, 2009, 2008 and 2007 is providedin Note 18 of the Consolidated Financial Statements.
Available Information
The Schlumberger Internet website is www.slb.com. Schlumberger uses its Investor Relations website,www.slb.com/ir, as a channel for routine distribution of important information, including news releases,analyst presentations, and financial information. Schlumberger makes available free of charge on or throughits Investor Relations website at www.slb.com/ir access to its Annual Reports on Form 10-K, Quarterly Reports
5
Part 1, Item 1, 1A
on Form 10-Q, Current Reports on Form 8-K, its proxy statements and Forms 3, 4 and 5 filed on behalf ofdirectors and executive officers, and amendments to each of those reports, as soon as reasonably practicableafter such material is filed with or furnished to the Securities and Exchange Commission (“SEC”).Alternatively, you may access these reports at the SEC’s Internet website at www.sec.gov.
Schlumberger’s corporate governance materials, including Board Committee Charters, CorporateGovernance Guidelines and Code of Ethics, may also be found at www.slb.com/ir. From time to time, corporategovernance materials on our website may be updated to comply with rules issued by the SEC and the New YorkStock Exchange (“NYSE”) or as desirable to promote the effective governance of Schlumberger.
Any stockholder wishing to receive, without charge, a copy of any of Schlumberger’s SEC filings shouldwrite to the Secretary, Schlumberger Limited, 5599 San Felipe, 17th Floor, Houston, Texas 77056, USA.
Schlumberger has filed the required certifications under Section 302 of the Sarbanes-Oxley Act of 2002 asExhibits 31.1 and 31.2 to this Form 10-K.
The information on our website or any other website is not incorporated by reference in this Report andshould not be considered part of this Report or any other filing Schlumberger makes with the SEC.
Item 1A. Risk Factors.
The following discussion of risk factors contains “forward-looking statements” which are discussedimmediately following Item 7A of this Form 10-K. These risk factors may be important to understanding anystatement in this Form 10-K or elsewhere. The following information should be read in conjunction withItem 7. Management’s Discussion and Analysis of Financial Condition and Results of Operations, and theconsolidated financial statements and related notes included in this Form 10-K.
We urge you to carefully consider the risks described below, as well as in other reports and materials that we filewith the SEC and the other information included or incorporated by reference in Form 10-K. If any of the risksdescribed below or elsewhere in this Form 10-K were to materialize, our business, financial condition, results ofoperations, cash flows or prospects could be materially adversely affected. In such case, the trading price of ourcommon stock could decline and you could lose part or all of your investment. Additional risks and uncertaintiesnot currently known to us or that we currently deem immaterial may also materially adversely affect our financialcondition, results of operations and cash flows.
Demand for the majority of our services is substantially dependent on the levels of expenditures by the oil andgas industry. Our customers’ capital expenditures may decline in 2010 and beyond if current global economicconditions continue or worsen. This could have a material adverse effect on our financial condition, results ofoperations and cash flows.
The current global economic downturn has reduced worldwide demand for oil and natural gas and resulted insignificantly lower crude oil and natural gas prices compared to their record highs in July 2008. It is difficultto predict how long the global economic downturn will continue, or to what extent this will continue to affectus. The significant decline in oil and natural gas prices reduced many of our customers’ activities andspending on our services and products in 2009; this reduction in our customers’ activities and spending couldcontinue through 2010 and beyond. Demand for the majority of our services depends substantially on the levelof expenditures by the oil and gas industry for the exploration, development and production of oil and naturalgas reserves. These expenditures are sensitive to the industry’s view of future economic growth and theresulting impact on demand for oil and natural gas. The worldwide deterioration in the financial and creditmarkets, which began in the second half of 2008, resulted in diminished demand for oil and gas andsignificantly lower oil and natural gas prices. This caused many of our customers to reduce or delay their oiland gas exploration and production spending in 2009, which consequently reduced the demand for ourservices, and exerted downward pressure on the prices of our services and products. If the economic downturn
6
Part 1, Item 1A
continues for a prolonged period or if there is little or no economic growth, it will likely result in furtherreductions of exploration and production expenditures by our customers, causing further declines in thedemand for, and prices of, our services and products. This could result in a material adverse effect on ourfinancial condition, results of operations and cash flows.
The reduction in cash flows being experienced by our customers resulting from declines in commodityprices, together with the reduced availability of credit and increased costs of borrowing, could have significantadverse effects on the financial condition of some of our customers. This could result in project modifications,delays or cancellations, general business disruptions, and delay in, or nonpayment of, amounts that are owedto us, which could have a material adverse effect on our results of operations and cash flows.
The prices for oil and natural gas are subject to a variety of factors, including:
Š demand for hydrocarbons, which is affected by worldwide population growth, economic growth ratesand general economic and business conditions;
Š the ability of the Organization of Petroleum Exporting Countries (“OPEC”) to set and maintainproduction levels for oil;
Š oil and gas production by non-OPEC countries;
Š the level of excess production capacity;
Š political and economic uncertainty and sociopolitical unrest;
Š the level of worldwide oil and gas exploration and production activity;
Š the cost of exploring for, producing and delivering oil and gas;
Š technological advances affecting energy consumption; and
Š weather conditions.
A significant portion of our revenue is derived from our non-United States operations, which exposes us to risksinherent in doing business in each of the approximately 80 countries in which we operate.
Our non-United States operations accounted for approximately 84% of our consolidated revenue in 2009, 78% in2008 and 76% in 2007. Operations in countries other than the United States are subject to various risks,including:
Š unsettled political and economic conditions in certain areas;
Š exposure to possible expropriation of our assets or other governmental actions;
Š social unrest, acts of terrorism, war or other armed conflict;
Š confiscatory taxation or other adverse tax policies;
Š deprivation of contract rights;
Š trade restrictions or embargoes imposed by the United States or other countries;
Š restrictions under the United States Foreign Corrupt Practices Act or similar legislation in othercountries;
Š restrictions on the repatriation of income or capital;
Š currency exchange controls;
Š inflation; and
Š currency exchange rate fluctuations and devaluations.
7
Part 1, Item 1A
In addition, we are subject to risks associated with our operations in countries, including Iran, Syria, Sudanand Cuba, which are subject to trade and economic sanctions or other restrictions imposed by the UnitedStates or other governments or organizations. United States law enforcement authorities are currentlyconducting a grand jury investigation and an associated regulatory inquiry related to our operations in certainof these countries.
If any of the risks described above materialize, or if any governmental investigation results in criminal orcivil penalties or other remedial measures, it could reduce our earnings and our cash available for operations.
We are also subject to risks related to investment in our common stock in connection with certain US statedivestment or investment limitation legislation applicable to companies with operations in these countries,and similar actions by some private investors, which could adversely affect the market price of our commonstock.
Environmental compliance costs and liabilities could reduce our earnings and cash available for operations.
We are subject to increasingly stringent laws and regulations relating to importation and use of hazardousmaterials, radioactive materials and explosives, environmental protection, including laws and regulationsgoverning air emissions, water discharges and waste management. We incur, and expect to continue to incur,capital and operating costs to comply with environmental laws and regulations. The technical requirements ofthese laws and regulations are becoming increasingly complex, stringent and expensive to implement. Theselaws may provide for “strict liability” for damages to natural resources or threats to public health and safety.Strict liability can render a party liable for damages without regard to negligence or fault on the part of theparty. Some environmental laws provide for joint and several strict liability for remediation of spills andreleases of hazardous substances.
We use and generate hazardous substances and wastes in our operations. In addition, many of our currentand former properties are, or have been, used for industrial purposes. Accordingly, we could become subject topotentially material liabilities relating to the investigation and cleanup of contaminated properties, and toclaims alleging personal injury or property damage as the result of exposures to, or releases of, hazardoussubstances. In addition, stricter enforcement of existing laws and regulations, new laws and regulations, thediscovery of previously unknown contamination or the imposition of new or increased requirements couldrequire us to incur costs or become the basis of new or increased liabilities that could reduce our earnings andour cash available for operations. We believe we are currently in substantial compliance with environmentallaws and regulations.
We could be subject to substantial liability claims, which would adversely affect our financial condition, resultsof operations and cash flows.
Certain equipment used in the delivery of oilfield services, such as directional drilling equipment, perforatingsystems, subsea completion equipment, radioactive materials and explosives and well completion systems, areused in hostile environments, such as exploration, development and production applications. An accident or afailure of a product could cause personal injury, loss of life, damage to property, equipment or theenvironment, and suspension of operations. Our insurance may not adequately protect us against liability forsome kinds of events, including events involving pollution, or against losses resulting from businessinterruption. Moreover, in the future we may not be able to maintain insurance at levels of risk coverage orpolicy limits that we deem adequate. Substantial claims made under our policies could cause our premiums toincrease. Any future damages caused by our products that are not covered by insurance, or are in excess ofpolicy limits or are subject to substantial deductibles, could adversely affect our financial condition, results ofoperations and cash flows.
8
Part 1, Item 1A
If we are unable to maintain technology leadership in the form of services and products, this could adverselyaffect any competitive advantage we hold.
If we are unable to develop and produce competitive technology or deliver it to our clients in the form ofservices and products in a timely and cost-competitive manner in the various markets we serve, it couldadversely affect our financial condition, results of operations and cash flows.
Limitations on our ability to protect our intellectual property rights, including our trade secrets, could cause aloss in revenue and any competitive advantage we hold.
Some of our products or services, and the processes we use to produce or provide them, have been grantedpatent protection, have patent applications pending or are trade secrets. Our business may be adverselyaffected if our patents are unenforceable, the claims allowed under our patents are not sufficient to protectour technology, our patent applications are denied, or our trade secrets are not adequately protected. Ourcompetitors may be able to develop technology independently that is similar to ours without infringing on ourpatents or gaining access to our trade secrets.
We may be subject to litigation if another party claims that we have infringed upon its intellectual propertyrights.
The tools, techniques, methodologies, programs and components we use to provide our services may infringeupon the intellectual property rights of others. Infringement claims generally result in significant legal andother costs and may distract management from running our core business. Royalty payments under licensesfrom third parties, if available, would increase our costs. If a license were not available we might not be ableto continue providing a particular service or product, which could adversely affect our financial condition,results of operations and cash flows. Additionally, developing non-infringing technologies would increase ourcosts.
Failure to obtain and retain skilled technical personnel could impede our operations.
We require highly skilled personnel to operate and provide technical services and support for ourbusiness. Competition for the personnel required for our businesses intensifies as activity increases. Inperiods of high utilization it may become more difficult to find and retain qualified individuals. This couldincrease our costs or have other adverse effects on our operations.
Severe weather conditions may affect our operations.
Our business may be materially affected by severe weather conditions in areas where we operate. This mayentail the evacuation of personnel and stoppage of services. In addition, if particularly severe weather affectsplatforms or structures, this may result in a suspension of activities until the platforms or structures havebeen repaired. Any of these events could adversely affect our financial condition, results of operations andcash flows.
9

Part 1, Item 1B, 2, 3, 4
Item 1B. Unresolved Staff Comments.
None.
Item 2. Properties.
Schlumberger owns or leases manufacturing facilities, administrative offices, service centers, researchcenters, data processing centers, sales offices and warehouses throughout the world. No significant lease isscheduled to terminate in the near future, and we believe comparable space is readily obtainable should anylease expire without renewal. We believe our properties are generally well maintained and adequate for theirintended use.
Outside the United States the principal owned or leased facilities of Oilfield Services are located in Beijing,China; Clamart and Abbeville, France; Fuchinobe, Japan; Oslo, Norway; Singapore; Abingdon, Cambridge andStonehouse, United Kingdom; and Novosibirsk, Russia.
Within the United States, the principal owned or leased facilities of Oilfield Services are located in Boston,Massachusetts; Houston, Rosharon, and Sugar Land, Texas; and Lawrence, Kansas.
The principal owned or leased facilities of WesternGeco are located in Bergen and Oslo, Norway; Gatwick,United Kingdom; Houston, Texas, United States; and Mumbai, India.
Item 3. Legal Proceedings.
The information with respect to this Item 3 is set forth in Note 17 of the Consolidated Financial Statements.
Item 4. Submission of Matters to a Vote of Security Holders.
No matters were submitted to a vote of Schlumberger’s security holders during the fourth quarter of the fiscalyear covered by this Form 10-K.
10
Part 1, Item 4
Executive Officers of Schlumberger
The following table sets forth, as of January 31, 2010, the names and ages of the executive officers ofSchlumberger, including all offices and positions held by each for at least the past five years.
Name Age Present Position and Five-Year Business Experience
Andrew Gould 63 Chairman and Chief Executive Officer, since February 2003.
Simon Ayat 55 Executive Vice President and Chief Financial Officer, since March 2007; Vice PresidentTreasurer, February 2005 to March 2007; and Vice President, Controller and BusinessProcesses, December 2002 to February 2005.
Chakib Sbiti 55 Executive Vice President, since February 2003.
Alexander Juden 49 Secretary and General Counsel, since April 2009; Director of Compliance SchlumbergerLimited, February 2005 to April 2009; and WesternGeco General Counsel, May 2004 toFebruary 2005.
Ashok Belani 51 Vice President and Chief Technology Officer, since April 2006; Senior Advisor,Technology, January 2006 to April 2006; Director, President and Chief Executive OfficerNPTest, May 2002 to December 2005.
Stephanie Cox 41 Vice President Personnel, since May 2009; North Gulf Coast GeoMarket Manager, April2006 to May 2009; and North & South America Personnel Manager, May 2004 to April2006.
Mark Danton 53 Vice President - Director of Taxes, since January 1999.
Howard Guild 38 Chief Accounting Officer, since July 2005; and Director of Financial Reporting, October2004 to July 2005.
Paal Kibsgaard 42 President Reservoir Characterization Group since May 2009; Vice President Engineering,Manufacturing and Sustaining, November 2007 to May 2009; Vice President Personnel,April 2006 to November 2007; and President, Drilling and Measurements, January 2003 toApril 2006.
Rodney Nelson 51 Vice President Communications, since October 2007; Vice President Innovation andCollaboration, July 2006 to October 2007; Vice President Strategic Marketing, July 2004 toJuly 2006; and Vice President Marketing Oilfield Services, February 2003 to July 2004.
H. Sola Oyinlola 54 Vice President Treasurer, since March 2007; Deputy Treasurer, July 2006 to March 2007;and Oilfield Services GeoMarket General Manager, Nigeria, April 2001 to July 2006.
Satish Pai 48 Vice President, Operations, Oilfield Services, since May 2008, President Europe Africa &Caspian, March 2006 to May 2008; and Vice President Oilfield Technologies, March 2002to March 2006.
Malcolm Theobald 48 Vice President Investor Relations, since June 2007; and Global Account Director,September 2001 to June 2007.
Charles Woodburn 38 Vice President Engineering Manufacturing and Sustaining since May 2009; WirelinePresident, April 2006 to May 2009; and Product Development Manager, June 2004 to April2006.
11
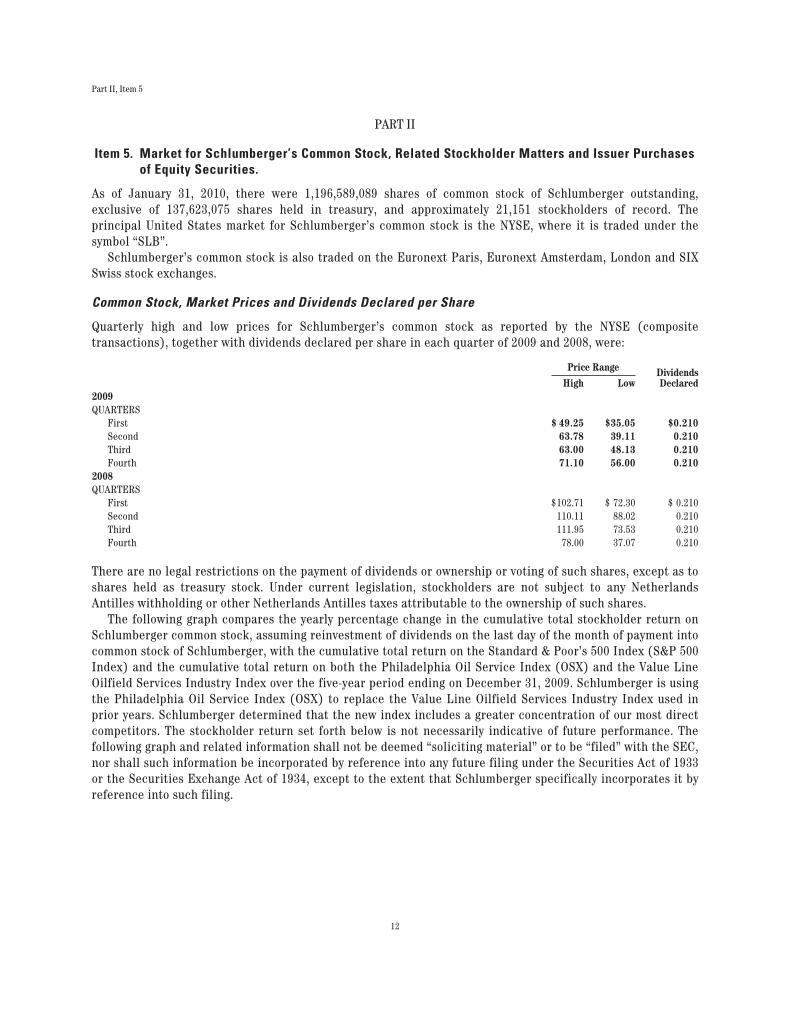
Part II, Item 5
PART II
Item 5. Market for Schlumberger’s Common Stock, Related Stockholder Matters and Issuer Purchasesof Equity Securities.
As of January 31, 2010, there were 1,196,589,089 shares of common stock of Schlumberger outstanding,exclusive of 137,623,075 shares held in treasury, and approximately 21,151 stockholders of record. Theprincipal United States market for Schlumberger’s common stock is the NYSE, where it is traded under thesymbol “SLB”.
Schlumberger’s common stock is also traded on the Euronext Paris, Euronext Amsterdam, London and SIXSwiss stock exchanges.
Common Stock, Market Prices and Dividends Declared per Share
Quarterly high and low prices for Schlumberger’s common stock as reported by the NYSE (compositetransactions), together with dividends declared per share in each quarter of 2009 and 2008, were:
Price Range DividendsDeclaredHigh Low
2009QUARTERS
First $ 49.25 $35.05 $0.210Second 63.78 39.11 0.210Third 63.00 48.13 0.210Fourth 71.10 56.00 0.210
2008QUARTERS
First $102.71 $ 72.30 $ 0.210Second 110.11 88.02 0.210Third 111.95 73.53 0.210Fourth 78.00 37.07 0.210
There are no legal restrictions on the payment of dividends or ownership or voting of such shares, except as toshares held as treasury stock. Under current legislation, stockholders are not subject to any NetherlandsAntilles withholding or other Netherlands Antilles taxes attributable to the ownership of such shares.
The following graph compares the yearly percentage change in the cumulative total stockholder return onSchlumberger common stock, assuming reinvestment of dividends on the last day of the month of payment intocommon stock of Schlumberger, with the cumulative total return on the Standard & Poor’s 500 Index (S&P 500Index) and the cumulative total return on both the Philadelphia Oil Service Index (OSX) and the Value LineOilfield Services Industry Index over the five-year period ending on December 31, 2009. Schlumberger is usingthe Philadelphia Oil Service Index (OSX) to replace the Value Line Oilfield Services Industry Index used inprior years. Schlumberger determined that the new index includes a greater concentration of our most directcompetitors. The stockholder return set forth below is not necessarily indicative of future performance. Thefollowing graph and related information shall not be deemed “soliciting material” or to be “filed” with the SEC,nor shall such information be incorporated by reference into any future filing under the Securities Act of 1933or the Securities Exchange Act of 1934, except to the extent that Schlumberger specifically incorporates it byreference into such filing.
12
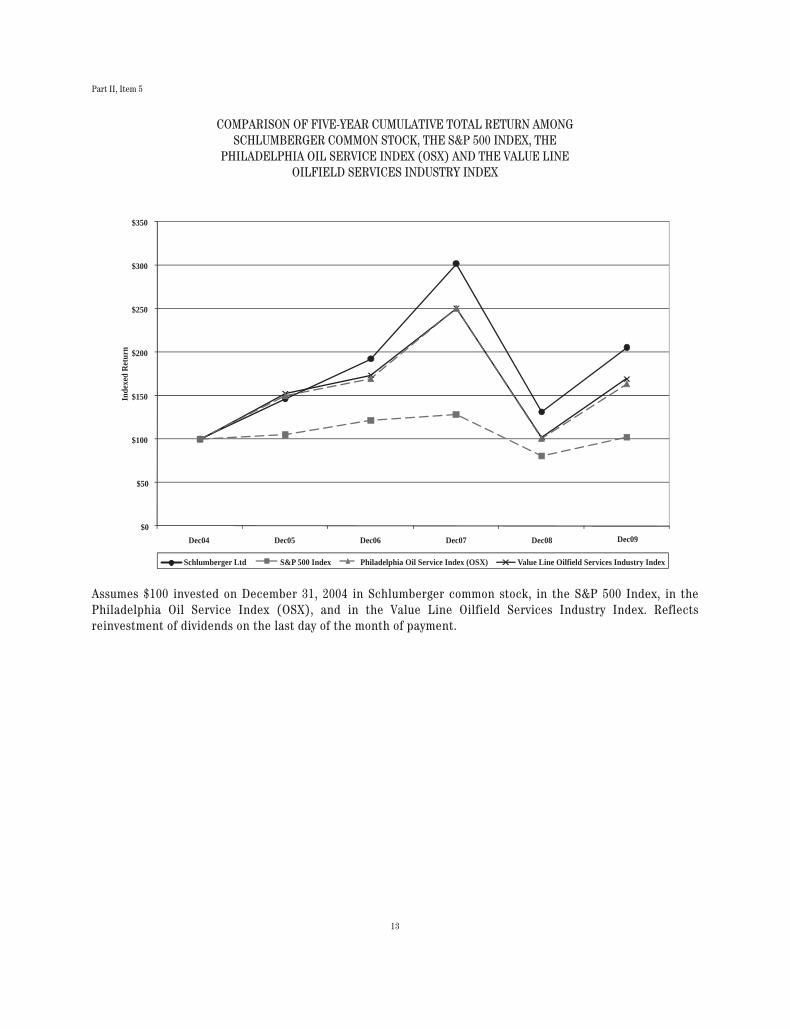
Part II, Item 5
COMPARISON OF FIVE-YEAR CUMULATIVE TOTAL RETURN AMONGSCHLUMBERGER COMMON STOCK, THE S&P 500 INDEX, THE
PHILADELPHIA OIL SERVICE INDEX (OSX) AND THE VALUE LINEOILFIELD SERVICES INDUSTRY INDEX
x
x
x
x
x
x
$0
$50
$100
$150
$200
$250
$300
$350
Inde
xed
Ret
urn
Dec04 Dec05 Dec06 Dec07 Dec09Dec08
Schlumberger Ltd Value Line Oilfield Services Industry IndexS&P 500 Index Philadelphia Oil Service Index (OSX) x
Assumes $100 invested on December 31, 2004 in Schlumberger common stock, in the S&P 500 Index, in thePhiladelphia Oil Service Index (OSX), and in the Value Line Oilfield Services Industry Index. Reflectsreinvestment of dividends on the last day of the month of payment.
13
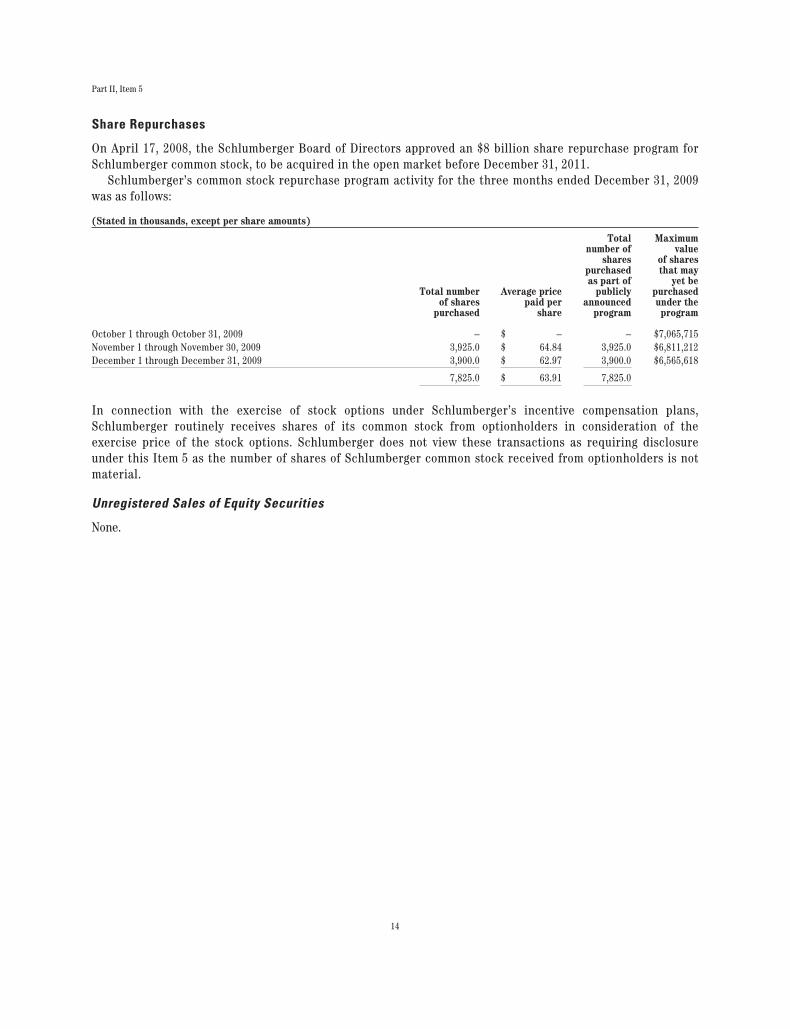
Part II, Item 5
Share Repurchases
On April 17, 2008, the Schlumberger Board of Directors approved an $8 billion share repurchase program forSchlumberger common stock, to be acquired in the open market before December 31, 2011.
Schlumberger’s common stock repurchase program activity for the three months ended December 31, 2009was as follows:
(Stated in thousands, except per share amounts)
Total numberof shares
purchased
Average pricepaid per
share
Totalnumber of
sharespurchasedas part of
publiclyannounced
program
Maximumvalue
of sharesthat may
yet bepurchasedunder theprogram
October 1 through October 31, 2009 – $ – – $7,065,715November 1 through November 30, 2009 3,925.0 $ 64.84 3,925.0 $6,811,212December 1 through December 31, 2009 3,900.0 $ 62.97 3,900.0 $6,565,618
7,825.0 $ 63.91 7,825.0
In connection with the exercise of stock options under Schlumberger’s incentive compensation plans,Schlumberger routinely receives shares of its common stock from optionholders in consideration of theexercise price of the stock options. Schlumberger does not view these transactions as requiring disclosureunder this Item 5 as the number of shares of Schlumberger common stock received from optionholders is notmaterial.
Unregistered Sales of Equity Securities
None.
14
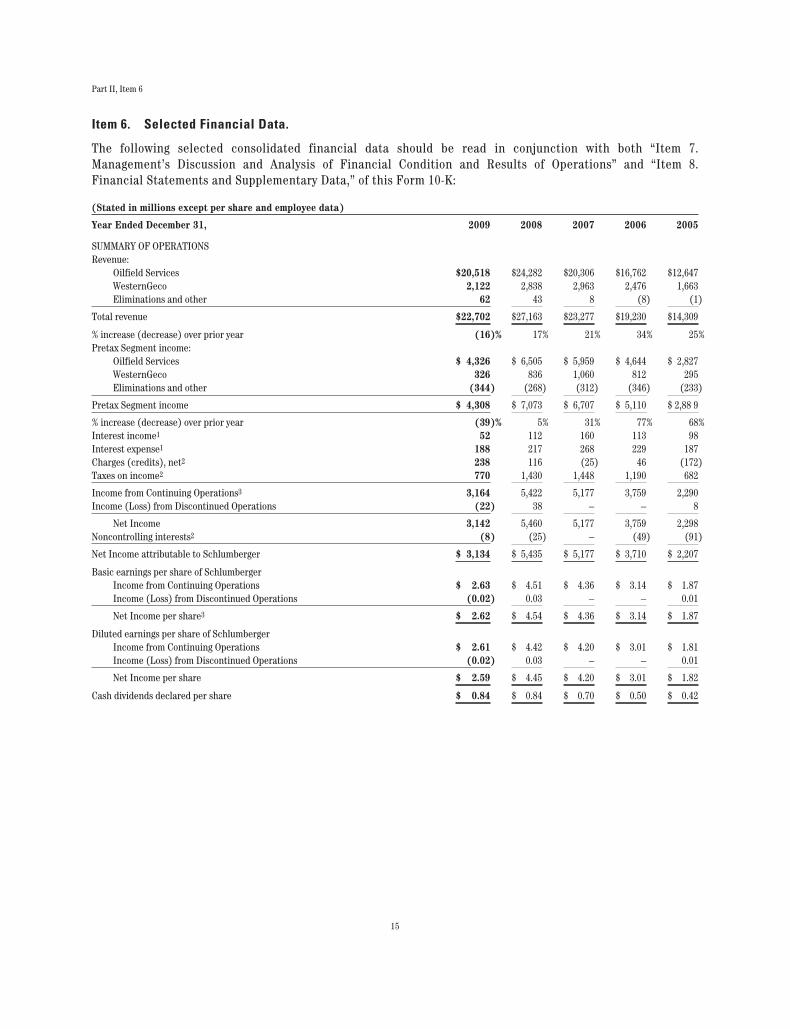
Part II, Item 6
Item 6. Selected Financial Data.
The following selected consolidated financial data should be read in conjunction with both “Item 7.Management’s Discussion and Analysis of Financial Condition and Results of Operations” and “Item 8.Financial Statements and Supplementary Data,” of this Form 10-K:
(Stated in millions except per share and employee data)
Year Ended December 31, 2009 2008 2007 2006 2005
SUMMARY OF OPERATIONSRevenue:
Oilfield Services $20,518 $24,282 $20,306 $16,762 $12,647WesternGeco 2,122 2,838 2,963 2,476 1,663Eliminations and other 62 43 8 (8) (1)
Total revenue $22,702 $27,163 $23,277 $19,230 $14,309
% increase (decrease) over prior year (16)% 17% 21% 34% 25%Pretax Segment income:
Oilfield Services $ 4,326 $ 6,505 $ 5,959 $ 4,644 $ 2,827WesternGeco 326 836 1,060 812 295Eliminations and other (344) (268) (312) (346) (233)
Pretax Segment income $ 4,308 $ 7,073 $ 6,707 $ 5,110 $ 2,88 9
% increase (decrease) over prior year (39)% 5% 31% 77% 68%Interest income1 52 112 160 113 98Interest expense1 188 217 268 229 187Charges (credits), net2 238 116 (25) 46 (172)Taxes on income2 770 1,430 1,448 1,190 682
Income from Continuing Operations3 3,164 5,422 5,177 3,759 2,290Income (Loss) from Discontinued Operations (22) 38 – – 8
Net Income 3,142 5,460 5,177 3,759 2,298Noncontrolling interests2 (8) (25) – (49) (91)
Net Income attributable to Schlumberger $ 3,134 $ 5,435 $ 5,177 $ 3,710 $ 2,207
Basic earnings per share of SchlumbergerIncome from Continuing Operations $ 2.63 $ 4.51 $ 4.36 $ 3.14 $ 1.87Income (Loss) from Discontinued Operations (0.02) 0.03 – – 0.01
Net Income per share3 $ 2.62 $ 4.54 $ 4.36 $ 3.14 $ 1.87
Diluted earnings per share of SchlumbergerIncome from Continuing Operations $ 2.61 $ 4.42 $ 4.20 $ 3.01 $ 1.81Income (Loss) from Discontinued Operations (0.02) 0.03 – – 0.01
Net Income per share $ 2.59 $ 4.45 $ 4.20 $ 3.01 $ 1.82
Cash dividends declared per share $ 0.84 $ 0.84 $ 0.70 $ 0.50 $ 0.42
15
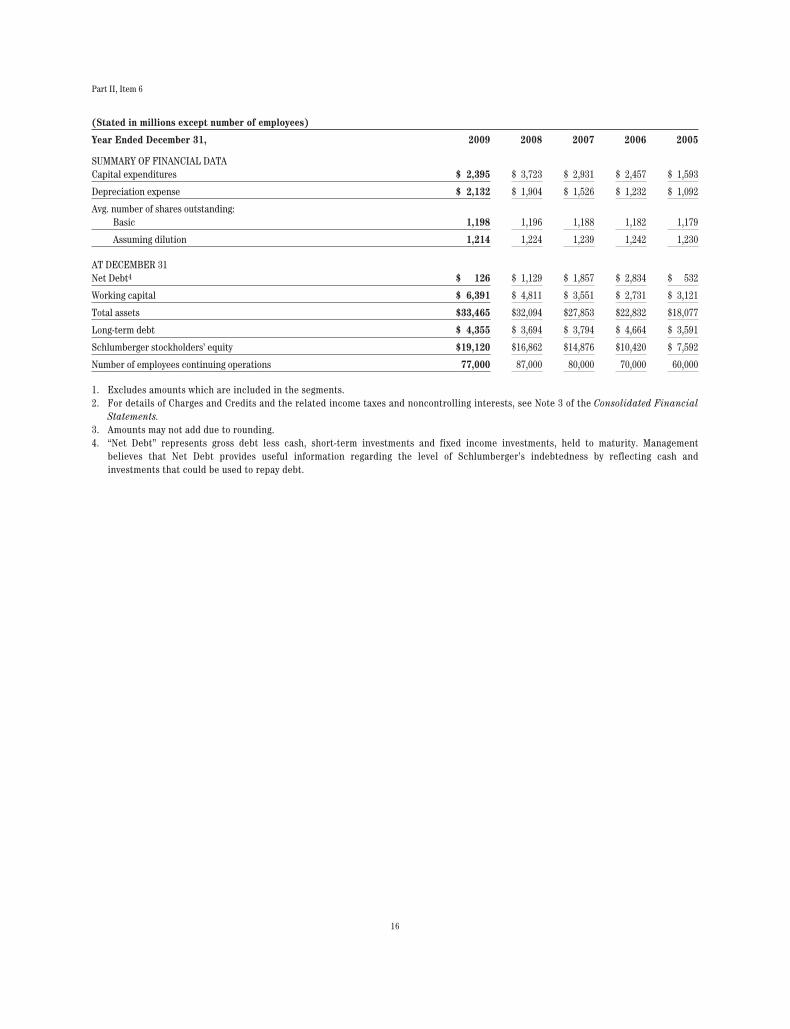
Part II, Item 6
(Stated in millions except number of employees)
Year Ended December 31, 2009 2008 2007 2006 2005
SUMMARY OF FINANCIAL DATACapital expenditures $ 2,395 $ 3,723 $ 2,931 $ 2,457 $ 1,593
Depreciation expense $ 2,132 $ 1,904 $ 1,526 $ 1,232 $ 1,092
Avg. number of shares outstanding:Basic 1,198 1,196 1,188 1,182 1,179
Assuming dilution 1,214 1,224 1,239 1,242 1,230
AT DECEMBER 31Net Debt4 $ 126 $ 1,129 $ 1,857 $ 2,834 $ 532
Working capital $ 6,391 $ 4,811 $ 3,551 $ 2,731 $ 3,121
Total assets $33,465 $32,094 $27,853 $22,832 $18,077
Long-term debt $ 4,355 $ 3,694 $ 3,794 $ 4,664 $ 3,591
Schlumberger stockholders’ equity $19,120 $16,862 $14,876 $10,420 $ 7,592
Number of employees continuing operations 77,000 87,000 80,000 70,000 60,000
1. Excludes amounts which are included in the segments.2. For details of Charges and Credits and the related income taxes and noncontrolling interests, see Note 3 of the Consolidated Financial
Statements.3. Amounts may not add due to rounding.4. “Net Debt” represents gross debt less cash, short-term investments and fixed income investments, held to maturity. Management
believes that Net Debt provides useful information regarding the level of Schlumberger’s indebtedness by reflecting cash andinvestments that could be used to repay debt.
16
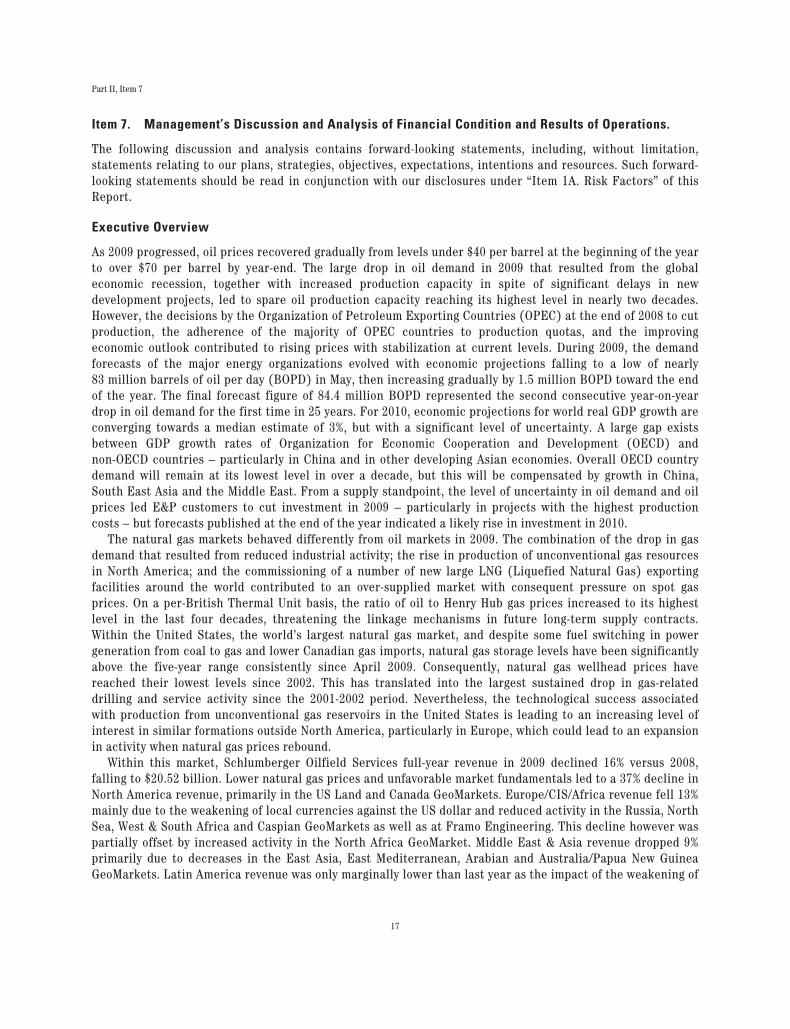
Part II, Item 7
Item 7. Management’s Discussion and Analysis of Financial Condition and Results of Operations.
The following discussion and analysis contains forward-looking statements, including, without limitation,statements relating to our plans, strategies, objectives, expectations, intentions and resources. Such forward-looking statements should be read in conjunction with our disclosures under “Item 1A. Risk Factors” of thisReport.
Executive Overview
As 2009 progressed, oil prices recovered gradually from levels under $40 per barrel at the beginning of the yearto over $70 per barrel by year-end. The large drop in oil demand in 2009 that resulted from the globaleconomic recession, together with increased production capacity in spite of significant delays in newdevelopment projects, led to spare oil production capacity reaching its highest level in nearly two decades.However, the decisions by the Organization of Petroleum Exporting Countries (OPEC) at the end of 2008 to cutproduction, the adherence of the majority of OPEC countries to production quotas, and the improvingeconomic outlook contributed to rising prices with stabilization at current levels. During 2009, the demandforecasts of the major energy organizations evolved with economic projections falling to a low of nearly83 million barrels of oil per day (BOPD) in May, then increasing gradually by 1.5 million BOPD toward the endof the year. The final forecast figure of 84.4 million BOPD represented the second consecutive year-on-yeardrop in oil demand for the first time in 25 years. For 2010, economic projections for world real GDP growth areconverging towards a median estimate of 3%, but with a significant level of uncertainty. A large gap existsbetween GDP growth rates of Organization for Economic Cooperation and Development (OECD) andnon-OECD countries – particularly in China and in other developing Asian economies. Overall OECD countrydemand will remain at its lowest level in over a decade, but this will be compensated by growth in China,South East Asia and the Middle East. From a supply standpoint, the level of uncertainty in oil demand and oilprices led E&P customers to cut investment in 2009 – particularly in projects with the highest productioncosts – but forecasts published at the end of the year indicated a likely rise in investment in 2010.
The natural gas markets behaved differently from oil markets in 2009. The combination of the drop in gasdemand that resulted from reduced industrial activity; the rise in production of unconventional gas resourcesin North America; and the commissioning of a number of new large LNG (Liquefied Natural Gas) exportingfacilities around the world contributed to an over-supplied market with consequent pressure on spot gasprices. On a per-British Thermal Unit basis, the ratio of oil to Henry Hub gas prices increased to its highestlevel in the last four decades, threatening the linkage mechanisms in future long-term supply contracts.Within the United States, the world’s largest natural gas market, and despite some fuel switching in powergeneration from coal to gas and lower Canadian gas imports, natural gas storage levels have been significantlyabove the five-year range consistently since April 2009. Consequently, natural gas wellhead prices havereached their lowest levels since 2002. This has translated into the largest sustained drop in gas-relateddrilling and service activity since the 2001-2002 period. Nevertheless, the technological success associatedwith production from unconventional gas reservoirs in the United States is leading to an increasing level ofinterest in similar formations outside North America, particularly in Europe, which could lead to an expansionin activity when natural gas prices rebound.
Within this market, Schlumberger Oilfield Services full-year revenue in 2009 declined 16% versus 2008,falling to $20.52 billion. Lower natural gas prices and unfavorable market fundamentals led to a 37% decline inNorth America revenue, primarily in the US Land and Canada GeoMarkets. Europe/CIS/Africa revenue fell 13%mainly due to the weakening of local currencies against the US dollar and reduced activity in the Russia, NorthSea, West & South Africa and Caspian GeoMarkets as well as at Framo Engineering. This decline however waspartially offset by increased activity in the North Africa GeoMarket. Middle East & Asia revenue dropped 9%primarily due to decreases in the East Asia, East Mediterranean, Arabian and Australia/Papua New GuineaGeoMarkets. Latin America revenue was only marginally lower than last year as the impact of the weakening of
17
Part II, Item 7
local currencies against the US dollar and much lower activity in Venezuela/Trinidad & Tobago and Peru/Colombia/Ecuador was nearly offset by stronger activity in Mexico/Central America and Brazil. Weakening oflocal currencies against the US dollar reduced 2009 revenue by approximately 4%. Across the Areas, all of theTechnologies recorded revenue declines except Testing Services. IPM recorded revenue growth compared to2008.
While customers spent less on new technology in 2009 versus the previous year, a number of recentlyintroduced Schlumberger services made further market progress. PowerDrive* family rotary-steerable drillingsystems extended their market reach, entering new markets in the North and Latin America. Scanner Family*services for advanced formation evaluation saw success in Mexico and Canada, and Well Services recordedmarket penetration in Saudi Arabia, Abu Dhabi and Malaysia with the range of ACTive* real-time coiled-tubingservices that improve operating efficiency and well performance through the innovative use of fiber-opticcable to convey downhole information to the surface.
Investment in Oilfield Services infrastructure continued throughout the year. Significant events includedthe opening of a new reservoir completions manufacturing center in Damman, Saudi Arabia. Representing aninvestment of $25 million, the center houses a team of design and manufacturing engineers specialized in theproduction of downhole reservoir completions equipment. The center also provides a collaborativeenvironment in which joint oil company and Schlumberger teams can develop and manufacture completionssolutions for application across Saudi Arabia and the Middle East. In Brazil, we announced the signing of ajoint cooperation agreement with the Universidade Federal do Rio de Janeiro to build a key internationalresearch center on the university’s campus. This new center will focus on research and development activitiesin the deepwater subsalt environment, with emphasis on the development of geosciences software for theexploration and production sector; new technologies to meet reservoir challenges in subsalt environments; andthe creation of a geophysical processing and interpretation Center of Excellence covering time-lapse seismicand combined electromagnetic and seismic measurements.
A number of technology agreements and acquisitions were completed during the year to enable futureproduct development or improve geographical reach. In May, Schlumberger acquired Techsia SA, a supplier ofpetrophysical software based in Montpellier, France. Techsia will become the Schlumberger PetrophysicsSoftware Center of Excellence for the development of state-of-the-art solutions for the oil and gas explorationand production industry. In September, Schlumberger and National Oilwell Varco announced the creation of ajoint venture to provide high-speed drill string telemetry systems to improve the efficiency and safety of oiland gas operations. The venture is expected to accelerate development and delivery of intelligent drillingsolutions through the expanded use of the IntelliServ® Broadband Network, a patented technology thatprovides high resolution data in real time to and from the bottom of oil and gas wells as they are being drilled.In November, Schlumberger acquired Lonkar Services – a company providing slickline, cased-hole wirelineand surface well testing services in Western Canada and Northern USA. Also in November Schlumberger signeda global cooperation agreement with Technip to jointly develop subsea integrity and surveillance solutions forthe flexible pipes used in deep offshore oil and gas production. This agreement will initially focus onsurveillance systems activities for new and challenging flexible pipe applications such as those required in thedeepwater subsalt environment in Brazil.
Full-year 2009 revenue of WesternGeco was, at $2.12 billion, 25% lower than 2008. Revenue decreasedacross all product lines, with the largest declines seen in Marine and Multiclient activity. Marine revenue fellon lower activity combined with reduced pricing as a result of weak market conditions. Multiclient revenuedecreased primarily in North America, as customers continued to reduce discretionary spending. Land revenuefell on lower crew utilization, while Data Processing revenue decreased reflecting lower activity primarily inEurope/Africa and in North America.
Towards the end of the year, WesternGeco announced the deployment of the next-generation UniQ*integrated point-receiver land seismic acquisition and processing system in Kuwait for the Kuwait OilCompany. The new system, designed for greater operational efficiency and flexibility, offers up to four times
18
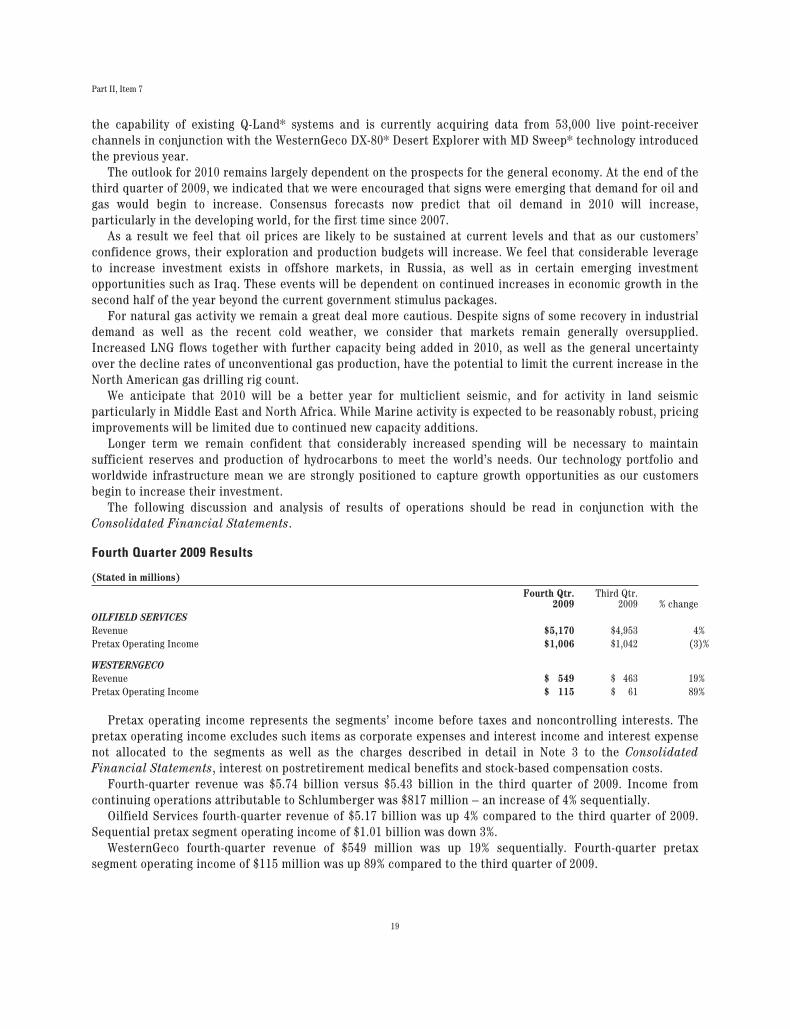
Part II, Item 7
the capability of existing Q-Land* systems and is currently acquiring data from 53,000 live point-receiverchannels in conjunction with the WesternGeco DX-80* Desert Explorer with MD Sweep* technology introducedthe previous year.
The outlook for 2010 remains largely dependent on the prospects for the general economy. At the end of thethird quarter of 2009, we indicated that we were encouraged that signs were emerging that demand for oil andgas would begin to increase. Consensus forecasts now predict that oil demand in 2010 will increase,particularly in the developing world, for the first time since 2007.
As a result we feel that oil prices are likely to be sustained at current levels and that as our customers’confidence grows, their exploration and production budgets will increase. We feel that considerable leverageto increase investment exists in offshore markets, in Russia, as well as in certain emerging investmentopportunities such as Iraq. These events will be dependent on continued increases in economic growth in thesecond half of the year beyond the current government stimulus packages.
For natural gas activity we remain a great deal more cautious. Despite signs of some recovery in industrialdemand as well as the recent cold weather, we consider that markets remain generally oversupplied.Increased LNG flows together with further capacity being added in 2010, as well as the general uncertaintyover the decline rates of unconventional gas production, have the potential to limit the current increase in theNorth American gas drilling rig count.
We anticipate that 2010 will be a better year for multiclient seismic, and for activity in land seismicparticularly in Middle East and North Africa. While Marine activity is expected to be reasonably robust, pricingimprovements will be limited due to continued new capacity additions.
Longer term we remain confident that considerably increased spending will be necessary to maintainsufficient reserves and production of hydrocarbons to meet the world’s needs. Our technology portfolio andworldwide infrastructure mean we are strongly positioned to capture growth opportunities as our customersbegin to increase their investment.
The following discussion and analysis of results of operations should be read in conjunction with theConsolidated Financial Statements.
Fourth Quarter 2009 Results
(Stated in millions)
Fourth Qtr.2009
Third Qtr.2009 % change
OILFIELD SERVICESRevenue $5,170 $4,953 4%Pretax Operating Income $1,006 $1,042 (3)%
WESTERNGECORevenue $ 549 $ 463 19%Pretax Operating Income $ 115 $ 61 89%
Pretax operating income represents the segments’ income before taxes and noncontrolling interests. Thepretax operating income excludes such items as corporate expenses and interest income and interest expensenot allocated to the segments as well as the charges described in detail in Note 3 to the ConsolidatedFinancial Statements, interest on postretirement medical benefits and stock-based compensation costs.
Fourth-quarter revenue was $5.74 billion versus $5.43 billion in the third quarter of 2009. Income fromcontinuing operations attributable to Schlumberger was $817 million – an increase of 4% sequentially.
Oilfield Services fourth-quarter revenue of $5.17 billion was up 4% compared to the third quarter of 2009.Sequential pretax segment operating income of $1.01 billion was down 3%.
WesternGeco fourth-quarter revenue of $549 million was up 19% sequentially. Fourth-quarter pretaxsegment operating income of $115 million was up 89% compared to the third quarter of 2009.
19
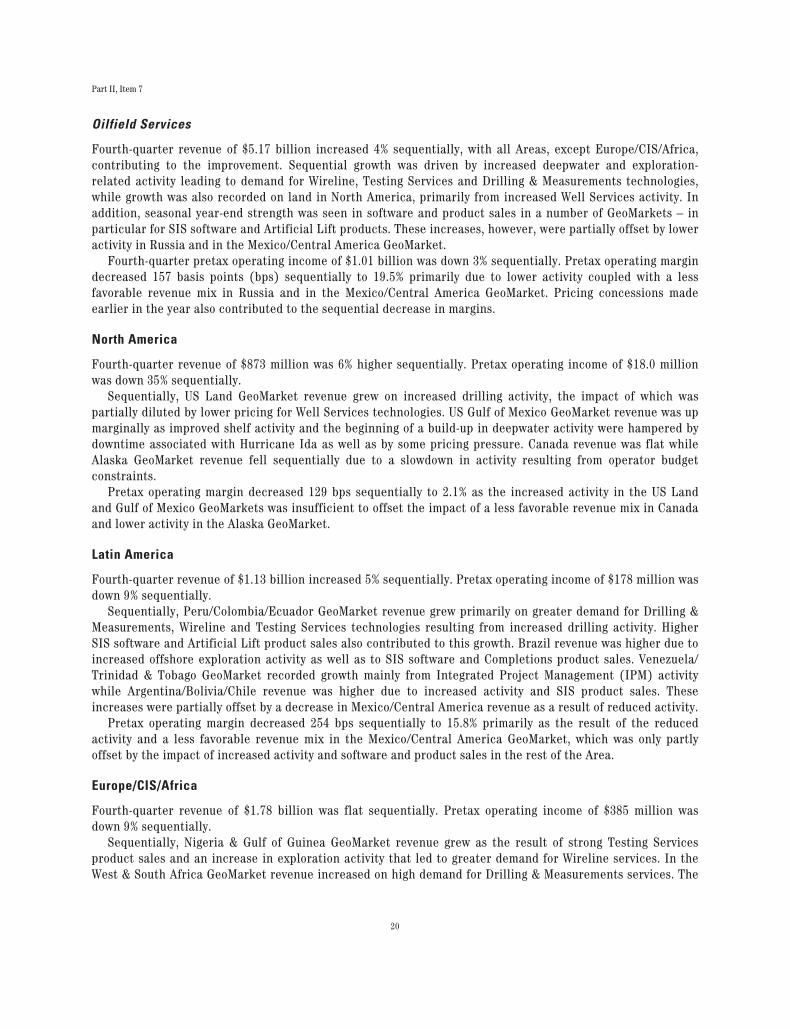
Part II, Item 7
Oilfield Services
Fourth-quarter revenue of $5.17 billion increased 4% sequentially, with all Areas, except Europe/CIS/Africa,contributing to the improvement. Sequential growth was driven by increased deepwater and exploration-related activity leading to demand for Wireline, Testing Services and Drilling & Measurements technologies,while growth was also recorded on land in North America, primarily from increased Well Services activity. Inaddition, seasonal year-end strength was seen in software and product sales in a number of GeoMarkets – inparticular for SIS software and Artificial Lift products. These increases, however, were partially offset by loweractivity in Russia and in the Mexico/Central America GeoMarket.
Fourth-quarter pretax operating income of $1.01 billion was down 3% sequentially. Pretax operating margindecreased 157 basis points (bps) sequentially to 19.5% primarily due to lower activity coupled with a lessfavorable revenue mix in Russia and in the Mexico/Central America GeoMarket. Pricing concessions madeearlier in the year also contributed to the sequential decrease in margins.
North America
Fourth-quarter revenue of $873 million was 6% higher sequentially. Pretax operating income of $18.0 millionwas down 35% sequentially.
Sequentially, US Land GeoMarket revenue grew on increased drilling activity, the impact of which waspartially diluted by lower pricing for Well Services technologies. US Gulf of Mexico GeoMarket revenue was upmarginally as improved shelf activity and the beginning of a build-up in deepwater activity were hampered bydowntime associated with Hurricane Ida as well as by some pricing pressure. Canada revenue was flat whileAlaska GeoMarket revenue fell sequentially due to a slowdown in activity resulting from operator budgetconstraints.
Pretax operating margin decreased 129 bps sequentially to 2.1% as the increased activity in the US Landand Gulf of Mexico GeoMarkets was insufficient to offset the impact of a less favorable revenue mix in Canadaand lower activity in the Alaska GeoMarket.
Latin America
Fourth-quarter revenue of $1.13 billion increased 5% sequentially. Pretax operating income of $178 million wasdown 9% sequentially.
Sequentially, Peru/Colombia/Ecuador GeoMarket revenue grew primarily on greater demand for Drilling &Measurements, Wireline and Testing Services technologies resulting from increased drilling activity. HigherSIS software and Artificial Lift product sales also contributed to this growth. Brazil revenue was higher due toincreased offshore exploration activity as well as to SIS software and Completions product sales. Venezuela/Trinidad & Tobago GeoMarket recorded growth mainly from Integrated Project Management (IPM) activitywhile Argentina/Bolivia/Chile revenue was higher due to increased activity and SIS product sales. Theseincreases were partially offset by a decrease in Mexico/Central America revenue as a result of reduced activity.
Pretax operating margin decreased 254 bps sequentially to 15.8% primarily as the result of the reducedactivity and a less favorable revenue mix in the Mexico/Central America GeoMarket, which was only partlyoffset by the impact of increased activity and software and product sales in the rest of the Area.
Europe/CIS/Africa
Fourth-quarter revenue of $1.78 billion was flat sequentially. Pretax operating income of $385 million wasdown 9% sequentially.
Sequentially, Nigeria & Gulf of Guinea GeoMarket revenue grew as the result of strong Testing Servicesproduct sales and an increase in exploration activity that led to greater demand for Wireline services. In theWest & South Africa GeoMarket revenue increased on high demand for Drilling & Measurements services. The
20
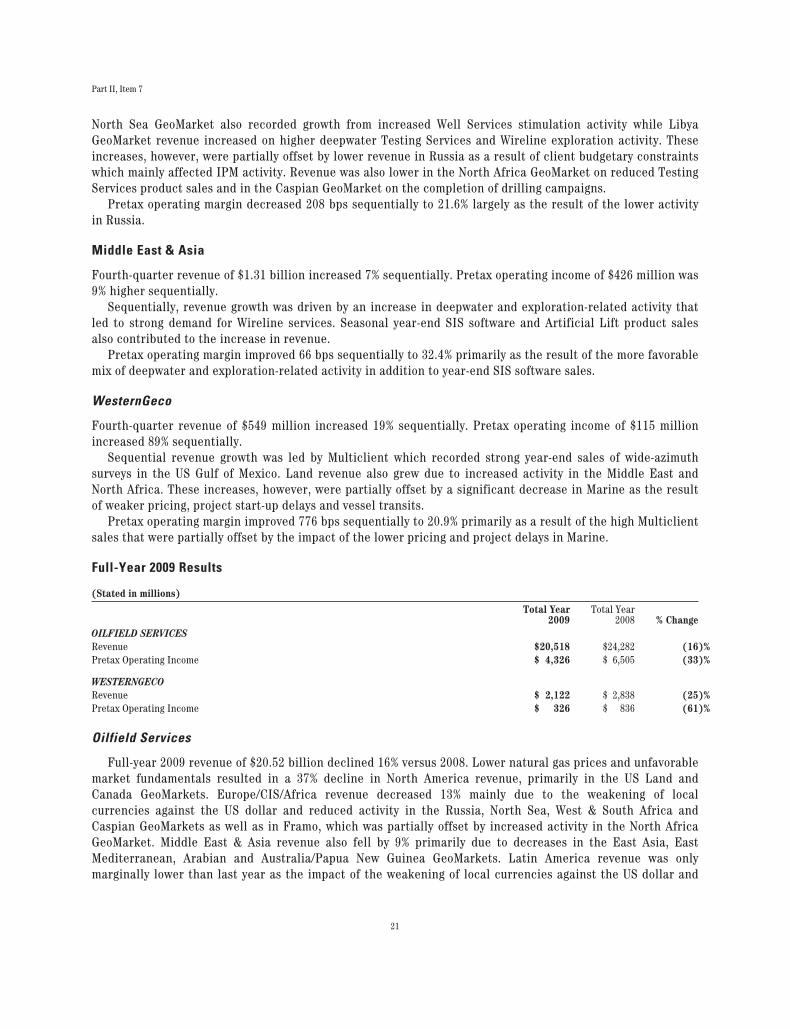
Part II, Item 7
North Sea GeoMarket also recorded growth from increased Well Services stimulation activity while LibyaGeoMarket revenue increased on higher deepwater Testing Services and Wireline exploration activity. Theseincreases, however, were partially offset by lower revenue in Russia as a result of client budgetary constraintswhich mainly affected IPM activity. Revenue was also lower in the North Africa GeoMarket on reduced TestingServices product sales and in the Caspian GeoMarket on the completion of drilling campaigns.
Pretax operating margin decreased 208 bps sequentially to 21.6% largely as the result of the lower activityin Russia.
Middle East & Asia
Fourth-quarter revenue of $1.31 billion increased 7% sequentially. Pretax operating income of $426 million was9% higher sequentially.
Sequentially, revenue growth was driven by an increase in deepwater and exploration-related activity thatled to strong demand for Wireline services. Seasonal year-end SIS software and Artificial Lift product salesalso contributed to the increase in revenue.
Pretax operating margin improved 66 bps sequentially to 32.4% primarily as the result of the more favorablemix of deepwater and exploration-related activity in addition to year-end SIS software sales.
WesternGeco
Fourth-quarter revenue of $549 million increased 19% sequentially. Pretax operating income of $115 millionincreased 89% sequentially.
Sequential revenue growth was led by Multiclient which recorded strong year-end sales of wide-azimuthsurveys in the US Gulf of Mexico. Land revenue also grew due to increased activity in the Middle East andNorth Africa. These increases, however, were partially offset by a significant decrease in Marine as the resultof weaker pricing, project start-up delays and vessel transits.
Pretax operating margin improved 776 bps sequentially to 20.9% primarily as a result of the high Multiclientsales that were partially offset by the impact of the lower pricing and project delays in Marine.
Full-Year 2009 Results
(Stated in millions)
Total Year2009
Total Year2008 % Change
OILFIELD SERVICESRevenue $20,518 $24,282 (16)%Pretax Operating Income $ 4,326 $ 6,505 (33)%
WESTERNGECORevenue $ 2,122 $ 2,838 (25)%Pretax Operating Income $ 326 $ 836 (61)%
Oilfield Services
Full-year 2009 revenue of $20.52 billion declined 16% versus 2008. Lower natural gas prices and unfavorablemarket fundamentals resulted in a 37% decline in North America revenue, primarily in the US Land andCanada GeoMarkets. Europe/CIS/Africa revenue decreased 13% mainly due to the weakening of localcurrencies against the US dollar and reduced activity in the Russia, North Sea, West & South Africa andCaspian GeoMarkets as well as in Framo, which was partially offset by increased activity in the North AfricaGeoMarket. Middle East & Asia revenue also fell by 9% primarily due to decreases in the East Asia, EastMediterranean, Arabian and Australia/Papua New Guinea GeoMarkets. Latin America revenue was onlymarginally lower than last year as the impact of the weakening of local currencies against the US dollar and
21
Part II, Item 7
much lower activity in Venezuela/Trinidad & Tobago and Peru/Colombia/Ecuador were nearly offset bystronger activity in Mexico/Central America and Brazil. Weakening of local currencies against the US dollarreduced 2009 revenue by approximately 4%. Across the Areas, all of the Technologies recorded revenuedeclines except Testing Services. IPM recorded revenue growth compared to the same period last year.
Full-year 2009 pretax operating margin decreased 5.7 percentage points to 21.1%, on the significant drop inactivity and pricing pressure experienced across all the Areas, but most notably in North America.
North America
Revenue of $3.71 billion was 37% lower than last year with reductions across the entire Area. The decreaseswere highest in US Land and Canada, where lower natural gas prices resulted in a steep drop in activity andconsequent pressure on pricing. Canada revenue was also lower as the result of the weakening of the Canadiandollar against the US dollar. Revenue in the US Gulf of Mexico GeoMarket was severely impacted by weakershelf drilling activity and strong pricing pressure.
Pretax operating margin fell 17.3 percentage points to 5.8% due to the significant decline in activity levelsacross the Area, combined with the severe pricing erosion.
Latin America
Revenue of $4.22 billion was marginally lower compared to 2008. The weakening of local currencies against theUS dollar reduced 2009 revenue by approximately 3%. In addition, Venezuela/Trinidad & Tobago revenue felldue to significantly reduced customer spending while Peru/Colombia/Ecuador revenue was lower due toreduced gain share in IPM projects. These decreases were mostly offset by higher IPM activity in Mexico/Central America and increased offshore activity in Brazil.
Pretax operating margin decreased 245 bps to 17.8% primarily as the result of the sharp activity decline inVenezuela/Trinidad & Tobago and the lower gain share in Peru/Colombia/Ecuador.
Europe/CIS/Africa
Revenue of $7.15 billion was 13% lower than last year largely due to the weakening of local currencies againstthe US dollar, which reduced revenue by approximately 7%. In addition, revenue was negatively impacted byreduced customer spending that resulted in significantly lower activity and pricing erosion in Russia and theNorth Sea. Revenue in the West & South Africa and Caspian GeoMarkets and in Framo was also negativelyimpacted by lower activity levels. These decreases were partially offset by a revenue increase in the NorthAfrica GeoMarket due to strong Testing Services product sales.
Pretax operating margins declined 357 bps to 23.9% on a combination of the overall lower activity and heavypricing pressure across the Area.
Middle East & Asia
Revenue of $5.23 billion was 9% below 2008. Revenue was down across much of the Middle East, especially inthe East Mediterranean and Arabian GeoMarkets, due to reduced demand for Drilling & Measurements,Wireline and Testing Services technologies. Revenue in Asia also fell, primarily due to a decrease in offshoreexploration activity, which was most significant in the East Asia and Australia/Papua New Guinea GeoMarkets,resulting in lower demand for Testing Services and Wireline technologies as well as Completion Systemsproducts.
Pretax operating margin decreased 268 bps to 32.4% primarily as a result of the lower overall activity and aless favorable revenue mix across the Area.
22
Part II, Item 7
WesternGeco
Full-year revenue of $2.12 billion was 25% lower than 2008. Revenue decreased across all product lines, withthe largest declines experienced in Marine and Multiclient. Marine revenue declined due to lower activitycombined with reduced pricing as the result of weak market conditions. Multiclient revenue decreasedprimarily in North America, as customers continued to reduce discretionary spending. Land revenue fell onlower crew utilization, while Data Processing revenue was down reflecting lower activity primarily in Europe/Africa and in North America.
Pretax margin decreased 14.1 percentage points to 15.4% primarily due to the weaker Marine activity andpricing as well as lower Multiclient sales.
Revenue backlog was $1.0 billion at December 31, 2009, compared to $1.8 billion at December 31, 2008.
Full-Year 2008 Results
(Stated in millions)
Total Year2008
Total Year2007 % Change
OILFIELD SERVICESRevenue $24,282 $20,306 20%Pretax Operating Income $ 6,505 $ 5,959 9%
WESTERNGECORevenue $ 2,838 $ 2,963 (4)%Pretax Operating Income $ 836 $ 1,060 (21)%
Oilfield Services
Full-year 2008 revenue of $24.28 billion increased 20% versus 2007 driven by Area growth of 28% in LatinAmerica, 24% in Europe/CIS/Africa, 18% in Middle East & Asia and 11% in North America. All Technologiesexperienced double-digit growth, most notably in Well Services, Drilling & Measurements and Wireline.
Pretax operating income of $6.50 billion in 2008 was 9% higher than 2007. However, pretax operatingmargin declined 256 bps to 26.8% primarily due to reduced pricing for well stimulation services in the US landGeoMarkets, a higher mix of low-margin third-party managed services in the Mexico/Central AmericaGeoMarket and cost inflation across all Areas.
North America
Revenue of $5.91 billion grew 11% versus 2007. Growth was led by the US land West GeoMarket mostly due toincreased gas shale activity that resulted in robust demand for Well Services and Drilling & Measurementstechnologies and by the US land Central GeoMarket on higher rig activity and strong Artificial Lift productsales. The Canada GeoMarket revenue was higher from demand for Well Services and Drilling & Measurementstechnologies while the US Gulf of Mexico GeoMarket grew on increased deepwater activity the resulted instrong demand for Drilling & Measurements and Wireline services in addition to Completion Systems products.
Pretax operating margin decreased 557 bps to 23.2% primarily as the result of lower pricing for wellstimulation services in the US land GeoMarkets and cost inflation across the Area.
Latin America
Revenue of $4.23 billion was 28% higher than 2007 on double-digit growth across all GeoMarkets. The Mexico/Central America GeoMarket increased on significantly higher IPM activity while the Peru/Colombia/EcuadorGeoMarket also experienced increased IPM activity in addition to robust demand for Wireline services and forArtificial Lift products and SIS software. The Brazil GeoMarket grew on higher offshore activity that resulted instronger demand for Well Testing, Wireline and Well Services technologies. The Venezuela/Trinidad and TobagoGeoMarket experienced increased demand for Wireline, Drilling & Measurements and Well Services activities.
23
Part II, Item 7
Pretax operating margin of 20.3% declined 262 bps versus 2007 as a result of an increased mix of low-marginthird-party managed services in the Mexico/Central America GeoMarket and cost inflation across the Area.
Europe/CIS/Africa
Revenue of $8.18 billion increased 24% versus the same period last year. Growth was led by Russia whichexperienced strong demand for Wireline, Well Services and Drilling & Measurements technologies. The West &South Africa, North Sea and Caspian GeoMarkets grew on increased exploration-related services as well asstrong demand for Well Services technologies. The Continental Europe GeoMarket was higher due to strongdrilling-related activities and demand for SIS offerings. The consolidation of Framo also contributed to theincrease.
Pretax operating margin decreased 112 bps to 27.4% primarily as a result of reduced pricing in the LibyaGeoMarket and a less favorable revenue mix in the Nigeria & Gulf of Guinea GeoMarket and Russia. Theconsolidation of Framo also reduced total Area margin.
Middle East & Asia
Revenue of $5.72 billion was 18% higher than the prior year. All GeoMarkets experienced growth, most notablyin the Arabian, Australia/Papua New Guinea/New Zealand, Gulf, and East Mediterranean GeoMarkets. Amongthe Technologies, growth was strongest in Wireline, Drilling & Measurements, Well Services and Well Testing.
Pretax operating margin was nearly flat at 35.0% as the positive impact of the higher overall activity levelwas offset by cost inflation.
WesternGeco
Full-year 2008 revenue of $2.84 billion was 4% lower than 2007. Multiclient revenue was down primarily as theresult of significantly lower client discretionary spending in the fourth quarter of 2008, while Land decreasedon lower crew utilization. These decreases were partially offset by increases in Marine, as a result ofadditional vessel capacity and higher pricing, and in Data Processing, which experienced a growth in activityin all geographic areas.
Pretax operating margin of 29.5% decreased 634 bps due to significantly lower Multiclient sales, reducedLand activity and cost inflation that affected Marine operations.
Revenue backlog was $1.8 billion at December 31, 2008, compared to $1.2 billion at December 31, 2007.
Interest and Other Income
Interest and other income consisted of the following:
(Stated in millions)2009 2008 2007
Interest income $ 61 $119 $162Equity in net earnings of affiliated companies 209 293 244Other1 3 (10) 25
$273 $402 $431
1. Refer to Note 3 to the Consolidated Financial Statements for details.
Interest Income
The average return on investments decreased to 1.4% in 2009 from 3.5% in 2008 and the weighted averageinvestment balance of $4.5 billion in 2009 increased $1.1 billion compared to 2008.
The average return on investments decreased to 3.5% in 2008 from 5.2% in 2007 and the weighted averageinvestment balance of $3.4 billion in 2008 increased $286 million compared to 2007.
24
Part II, Item 7
Equity in Net Earnings of Affiliated Companies
The equity in net earnings of affiliated companies primarily represents Schlumberger’s share of the results ofits 40% interest in the M-I SWACO drilling fluids joint venture with Smith International, Inc. Schlumberger’sequity income from this joint venture was $131 million in 2009, $210 million in 2008 and $178 million in 2007.The decrease in equity income relating to this joint venture from 2008 to 2009 was attributable to a significantdecline in M-I SWACO activity levels, primarily in its United States and Europe/Africa regions, as well asincreased pricing pressures.
Interest Expense
Interest expense of $221 million in 2009 decreased by $26 million compared to 2008 due to a decline in theweighted average borrowing rates, from 4.5% to 3.9%. The weighted average debt balance of $5.6 billion in 2009increased $148 million compared to 2008.
Interest expense of $247 million in 2008 decreased by $28 million compared to 2007 due to a decline in theweighted average borrowing rates, from 5.0% to 4.5%. The weighted average debt balance of $5.5 billion in 2008was essentially flat compared to 2007.
Other
Gross margin was 23.4%, 30.2% and 33.5% in 2009, 2008 and 2007, respectively.The decline in gross margin in 2009 compared to 2008 was primarily attributable to lower activity coupled
with the impact of a significant reduction in pricing across all of Oilfield Services, most notably in NorthAmerica and Europe/CIS/Africa. Weaker Marine activity and pricing and reduced Multiclient sales inWesternGeco also contributed to the margin decline.
The decline in gross margin percentage in 2008, compared to 2007, was primarily attributable to thefollowing factors: reduced pricing for well stimulation services in the US Land GeoMarkets, a higher mix oflow-margin third-party managed services in the Mexico/Central America GeoMarket, significantly lowerMulticlient sales in WesternGeco and the impact of cost inflation across all Areas within Oilfield Services aswell as the Marine operations of WesternGeco.
Research & engineering, Marketing and General & administrative expenses, as a percentage of Revenue,were as follows:
2009 2008 2007Research & engineering 3.5% 3.0% 3.1%Marketing 0.4% 0.4% 0.4%General & administrative 2.4% 2.2% 2.2%
Research & engineering expenditures, by segment, were as follows:
(Stated in millions)2009 2008 2007
Oilfield Services $679 $686 $595WesternGeco 108 118 120Other 15 15 13
$802 $819 $728
Income Taxes
The Schlumberger effective tax rate was 19.6% in 2009, 20.9% in 2008, and 21.9% in 2007.The Schlumberger effective tax rate is sensitive to the geographic mix of earnings. When the percentage of
pretax earnings generated outside of North America increases, the Schlumberger effective tax rate willgenerally decrease. Conversely, when the percentage of pretax earnings generated outside of North Americadecreases, the Schlumberger effective tax rate will generally increase.
25
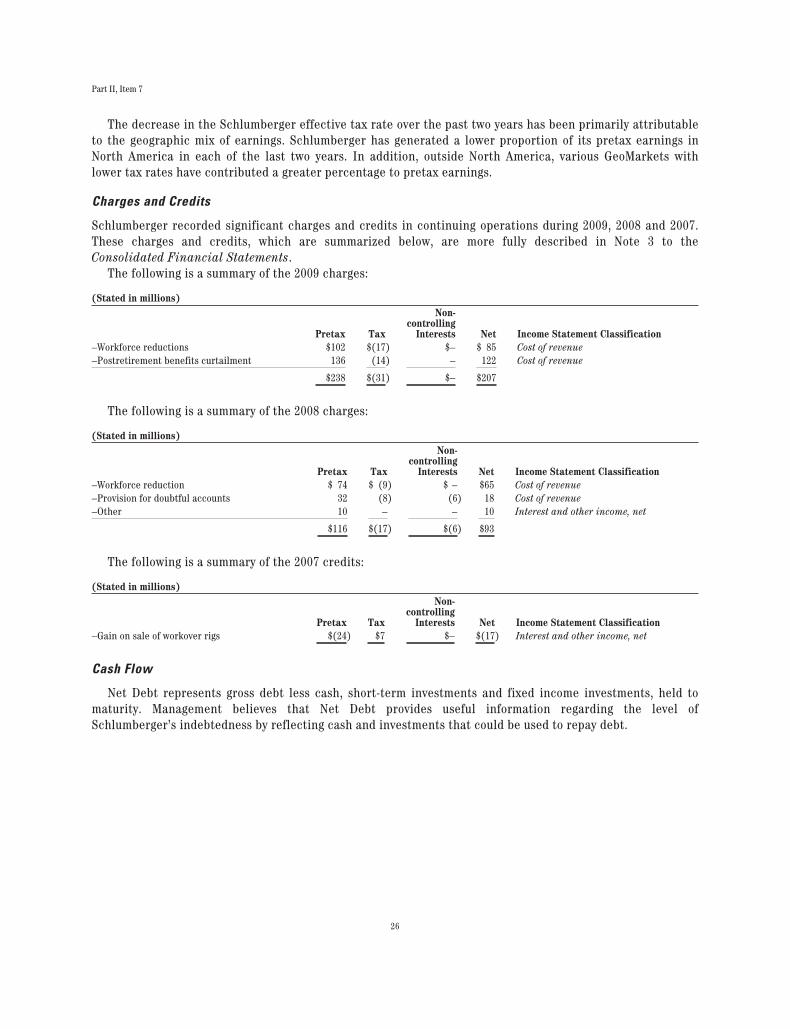
Part II, Item 7
The decrease in the Schlumberger effective tax rate over the past two years has been primarily attributableto the geographic mix of earnings. Schlumberger has generated a lower proportion of its pretax earnings inNorth America in each of the last two years. In addition, outside North America, various GeoMarkets withlower tax rates have contributed a greater percentage to pretax earnings.
Charges and Credits
Schlumberger recorded significant charges and credits in continuing operations during 2009, 2008 and 2007.These charges and credits, which are summarized below, are more fully described in Note 3 to theConsolidated Financial Statements.
The following is a summary of the 2009 charges:
(Stated in millions)
Pretax Tax
Non-controlling
Interests Net Income Statement Classification–Workforce reductions $102 $(17) $– $ 85 Cost of revenue–Postretirement benefits curtailment 136 (14) – 122 Cost of revenue
$238 $(31) $– $207
The following is a summary of the 2008 charges:
(Stated in millions)
Pretax Tax
Non-controlling
Interests Net Income Statement Classification–Workforce reduction $ 74 $ (9) $ – $65 Cost of revenue–Provision for doubtful accounts 32 (8) (6) 18 Cost of revenue–Other 10 – – 10 Interest and other income, net
$116 $(17) $(6) $93
The following is a summary of the 2007 credits:
(Stated in millions)
Pretax Tax
Non-controlling
Interests Net Income Statement Classification–Gain on sale of workover rigs $(24) $7 $– $(17) Interest and other income, net
Cash Flow
Net Debt represents gross debt less cash, short-term investments and fixed income investments, held tomaturity. Management believes that Net Debt provides useful information regarding the level ofSchlumberger’s indebtedness by reflecting cash and investments that could be used to repay debt.
26
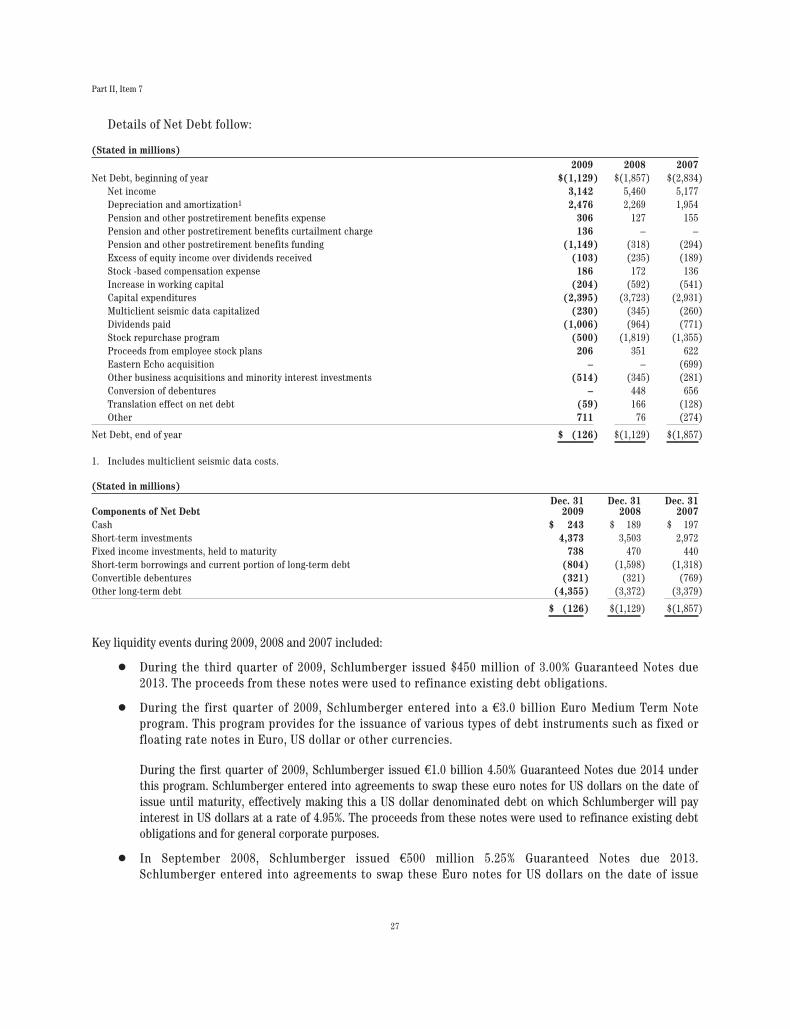
Part II, Item 7
Details of Net Debt follow:
(Stated in millions)2009 2008 2007
Net Debt, beginning of year $(1,129) $(1,857) $(2,834)Net income 3,142 5,460 5,177Depreciation and amortization1 2,476 2,269 1,954Pension and other postretirement benefits expense 306 127 155Pension and other postretirement benefits curtailment charge 136 – –Pension and other postretirement benefits funding (1,149) (318) (294)Excess of equity income over dividends received (103) (235) (189)Stock -based compensation expense 186 172 136Increase in working capital (204) (592) (541)Capital expenditures (2,395) (3,723) (2,931)Multiclient seismic data capitalized (230) (345) (260)Dividends paid (1,006) (964) (771)Stock repurchase program (500) (1,819) (1,355)Proceeds from employee stock plans 206 351 622Eastern Echo acquisition – – (699)Other business acquisitions and minority interest investments (514) (345) (281)Conversion of debentures – 448 656Translation effect on net debt (59) 166 (128)Other 711 76 (274)
Net Debt, end of year $ (126) $(1,129) $(1,857)
1. Includes multiclient seismic data costs.
(Stated in millions)Dec. 31 Dec. 31 Dec. 31
Components of Net Debt 2009 2008 2007Cash $ 243 $ 189 $ 197Short-term investments 4,373 3,503 2,972Fixed income investments, held to maturity 738 470 440Short-term borrowings and current portion of long-term debt (804) (1,598) (1,318)Convertible debentures (321) (321) (769)Other long-term debt (4,355) (3,372) (3,379)
$ (126) $(1,129) $(1,857)
Key liquidity events during 2009, 2008 and 2007 included:
Š During the third quarter of 2009, Schlumberger issued $450 million of 3.00% Guaranteed Notes due2013. The proceeds from these notes were used to refinance existing debt obligations.
Š During the first quarter of 2009, Schlumberger entered into a €3.0 billion Euro Medium Term Noteprogram. This program provides for the issuance of various types of debt instruments such as fixed orfloating rate notes in Euro, US dollar or other currencies.
During the first quarter of 2009, Schlumberger issued €1.0 billion 4.50% Guaranteed Notes due 2014 underthis program. Schlumberger entered into agreements to swap these euro notes for US dollars on the date ofissue until maturity, effectively making this a US dollar denominated debt on which Schlumberger will payinterest in US dollars at a rate of 4.95%. The proceeds from these notes were used to refinance existing debtobligations and for general corporate purposes.
Š In September 2008, Schlumberger issued €500 million 5.25% Guaranteed Notes due 2013.Schlumberger entered into agreements to swap these Euro notes for US dollars on the date of issue
27
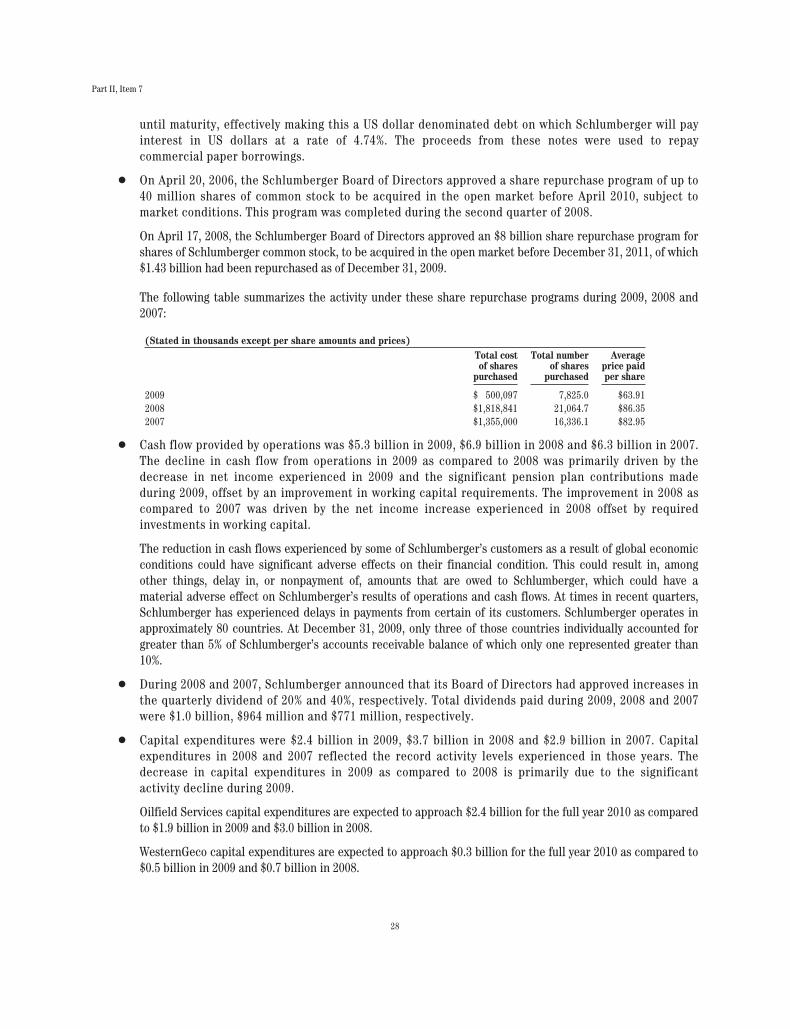
Part II, Item 7
until maturity, effectively making this a US dollar denominated debt on which Schlumberger will payinterest in US dollars at a rate of 4.74%. The proceeds from these notes were used to repaycommercial paper borrowings.
Š On April 20, 2006, the Schlumberger Board of Directors approved a share repurchase program of up to40 million shares of common stock to be acquired in the open market before April 2010, subject tomarket conditions. This program was completed during the second quarter of 2008.
On April 17, 2008, the Schlumberger Board of Directors approved an $8 billion share repurchase program forshares of Schlumberger common stock, to be acquired in the open market before December 31, 2011, of which$1.43 billion had been repurchased as of December 31, 2009.
The following table summarizes the activity under these share repurchase programs during 2009, 2008 and2007:
(Stated in thousands except per share amounts and prices)Total costof shares
purchased
Total numberof shares
purchased
Averageprice paidper share
2009 $ 500,097 7,825.0 $63.912008 $1,818,841 21,064.7 $86.352007 $1,355,000 16,336.1 $82.95
Š Cash flow provided by operations was $5.3 billion in 2009, $6.9 billion in 2008 and $6.3 billion in 2007.The decline in cash flow from operations in 2009 as compared to 2008 was primarily driven by thedecrease in net income experienced in 2009 and the significant pension plan contributions madeduring 2009, offset by an improvement in working capital requirements. The improvement in 2008 ascompared to 2007 was driven by the net income increase experienced in 2008 offset by requiredinvestments in working capital.
The reduction in cash flows experienced by some of Schlumberger’s customers as a result of global economicconditions could have significant adverse effects on their financial condition. This could result in, amongother things, delay in, or nonpayment of, amounts that are owed to Schlumberger, which could have amaterial adverse effect on Schlumberger’s results of operations and cash flows. At times in recent quarters,Schlumberger has experienced delays in payments from certain of its customers. Schlumberger operates inapproximately 80 countries. At December 31, 2009, only three of those countries individually accounted forgreater than 5% of Schlumberger’s accounts receivable balance of which only one represented greater than10%.
Š During 2008 and 2007, Schlumberger announced that its Board of Directors had approved increases inthe quarterly dividend of 20% and 40%, respectively. Total dividends paid during 2009, 2008 and 2007were $1.0 billion, $964 million and $771 million, respectively.
Š Capital expenditures were $2.4 billion in 2009, $3.7 billion in 2008 and $2.9 billion in 2007. Capitalexpenditures in 2008 and 2007 reflected the record activity levels experienced in those years. Thedecrease in capital expenditures in 2009 as compared to 2008 is primarily due to the significantactivity decline during 2009.
Oilfield Services capital expenditures are expected to approach $2.4 billion for the full year 2010 as comparedto $1.9 billion in 2009 and $3.0 billion in 2008.
WesternGeco capital expenditures are expected to approach $0.3 billion for the full year 2010 as compared to$0.5 billion in 2009 and $0.7 billion in 2008.
28
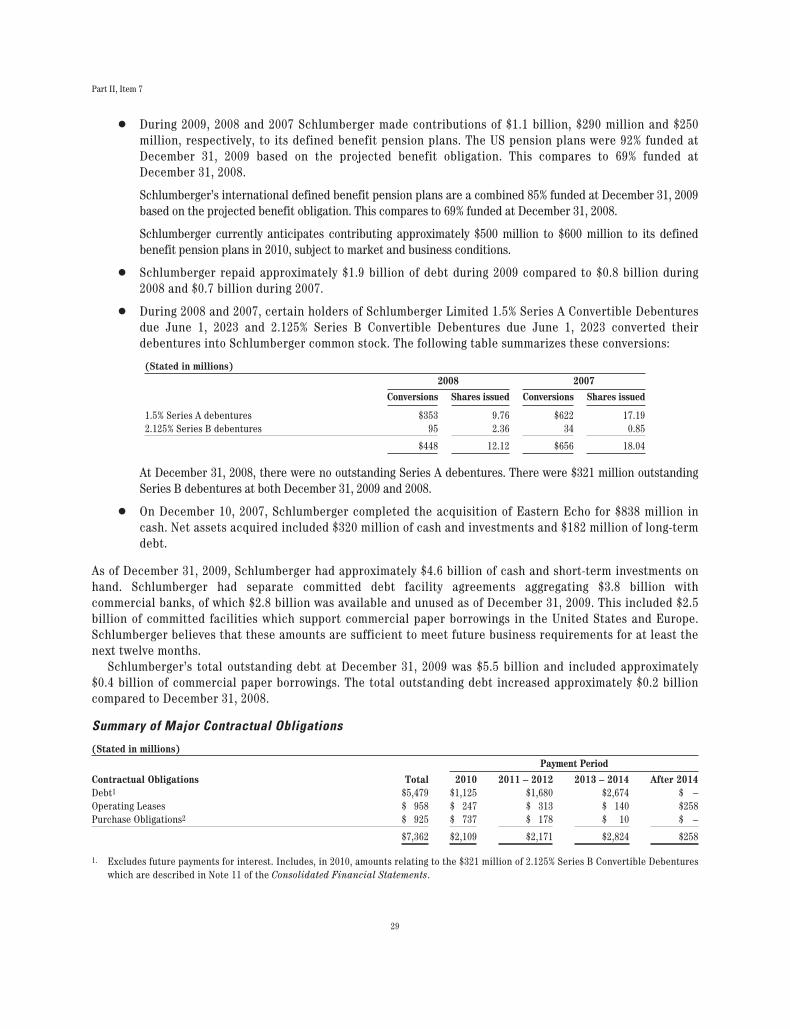
Part II, Item 7
Š During 2009, 2008 and 2007 Schlumberger made contributions of $1.1 billion, $290 million and $250million, respectively, to its defined benefit pension plans. The US pension plans were 92% funded atDecember 31, 2009 based on the projected benefit obligation. This compares to 69% funded atDecember 31, 2008.
Schlumberger’s international defined benefit pension plans are a combined 85% funded at December 31, 2009based on the projected benefit obligation. This compares to 69% funded at December 31, 2008.
Schlumberger currently anticipates contributing approximately $500 million to $600 million to its definedbenefit pension plans in 2010, subject to market and business conditions.
Š Schlumberger repaid approximately $1.9 billion of debt during 2009 compared to $0.8 billion during2008 and $0.7 billion during 2007.
Š During 2008 and 2007, certain holders of Schlumberger Limited 1.5% Series A Convertible Debenturesdue June 1, 2023 and 2.125% Series B Convertible Debentures due June 1, 2023 converted theirdebentures into Schlumberger common stock. The following table summarizes these conversions:
(Stated in millions)2008 2007
Conversions Shares issued Conversions Shares issued
1.5% Series A debentures $353 9.76 $622 17.192.125% Series B debentures 95 2.36 34 0.85
$448 12.12 $656 18.04
At December 31, 2008, there were no outstanding Series A debentures. There were $321 million outstandingSeries B debentures at both December 31, 2009 and 2008.
Š On December 10, 2007, Schlumberger completed the acquisition of Eastern Echo for $838 million incash. Net assets acquired included $320 million of cash and investments and $182 million of long-termdebt.
As of December 31, 2009, Schlumberger had approximately $4.6 billion of cash and short-term investments onhand. Schlumberger had separate committed debt facility agreements aggregating $3.8 billion withcommercial banks, of which $2.8 billion was available and unused as of December 31, 2009. This included $2.5billion of committed facilities which support commercial paper borrowings in the United States and Europe.Schlumberger believes that these amounts are sufficient to meet future business requirements for at least thenext twelve months.
Schlumberger’s total outstanding debt at December 31, 2009 was $5.5 billion and included approximately$0.4 billion of commercial paper borrowings. The total outstanding debt increased approximately $0.2 billioncompared to December 31, 2008.
Summary of Major Contractual Obligations
(Stated in millions)Payment Period
Contractual Obligations Total 2010 2011 – 2012 2013 – 2014 After 2014Debt1 $5,479 $1,125 $1,680 $2,674 $ –Operating Leases $ 958 $ 247 $ 313 $ 140 $258Purchase Obligations2 $ 925 $ 737 $ 178 $ 10 $ –
$7,362 $2,109 $2,171 $2,824 $258
1. Excludes future payments for interest. Includes, in 2010, amounts relating to the $321 million of 2.125% Series B Convertible Debentureswhich are described in Note 11 of the Consolidated Financial Statements.
29
Part II, Item 7
2. Represents an estimate of contractual obligations in the ordinary course of business. Although these contractual obligations areconsidered enforceable and legally binding, the terms generally allow Schlumberger the option to reschedule and adjust theirrequirements based on business needs prior to the delivery of goods.
Refer to Note 19 of the Consolidated Financial Statements for details regarding Schlumberger’s pension andother postretirement benefit obligations.
As discussed in Note 15 of the Consolidated Financial Statements, included in the SchlumbergerConsolidated Balance Sheet at December 31, 2009 is approximately $1.03 billion of liabilities associated withuncertain tax positions in the over 100 jurisdictions in which Schlumberger conducts business. Due to theuncertain and complex application of tax regulations, combined with the difficulty in predicting when taxaudits throughout the world may be concluded, Schlumberger cannot make reliable estimates of the timing ofcash outflows relating to these liabilities.
Schlumberger has outstanding letters of credit/guarantees which relate to business performance bonds,custom/excise tax commitments, facility lease/rental obligations, etc. These were entered into in the ordinarycourse of business and are customary practices in the various countries where Schlumberger operates.
Critical Accounting Policies and Estimates
The preparation of financial statements and related disclosures in conformity with accounting principlesgenerally accepted in the United States requires Schlumberger to make estimates and assumptions that affectthe reported amounts of assets and liabilities, the disclosure of contingent assets and liabilities and thereported amounts of revenue and expenses. The following accounting policies involve “critical accountingestimates” because they are particularly dependent on estimates and assumptions made by Schlumbergerabout matters that are inherently uncertain. A summary of all of Schlumberger’s significant accountingpolicies is included in Note 2 to the Consolidated Financial Statements.
Schlumberger bases its estimates on historical experience and on various assumptions that are believed tobe reasonable under the circumstances, the results of which form the basis for making judgments about thecarrying values of assets and liabilities that are not readily apparent from other sources. Actual results maydiffer from these estimates under different assumptions or conditions.
Multiclient Seismic Data
The WesternGeco segment capitalizes the costs associated with obtaining multiclient seismic data. Thecarrying value of the multiclient seismic data library at December 31, 2009 and 2008 was $288 million and $287million, respectively. Such costs are charged to Cost of revenue based on the percentage of the total costs tothe estimated total revenue that Schlumberger expects to receive from the sales of such data. However, underno circumstances will an individual survey carry a net book value greater than a 4-year straight-line amortizedvalue.
The carrying value of surveys is reviewed for impairment annually as well as when an event or change incircumstance indicates an impairment may have occurred. Adjustments to the carrying value are recordedwhen it is determined that estimated future revenues, which involve significant judgment on the part ofSchlumberger, would not be sufficient to recover the carrying value of the surveys. Significant adverse changesin Schlumberger’s estimated future cash flows could result in impairment charges in a future period. Forpurposes of performing the annual impairment test of the multiclient library, future cash flows are analyzedprimarily based on two pools of surveys: United States and non-United States. The United States andnon-United States pools were determined to be the most appropriate level at which to perform the impairmentreview based upon a number of factors including (i) various macroeconomic factors that influence the abilityto successfully market surveys and (ii) the focus of the sales force and related costs. Certain larger surveys,which are typically prefunded by customers, are analyzed for impairment on a survey by survey basis.
30
Part II, Item 7
Allowance for Doubtful Accounts
Schlumberger maintains an allowance for doubtful accounts in order to record accounts receivable at their netrealizable value. A significant amount of judgment is involved in recording and making adjustments to thisreserve. Allowances have been recorded for receivables believed to be uncollectible, including amounts for theresolution of potential credit and other collection issues such as disputed invoices. Depending on how suchpotential issues are resolved, or if the financial condition of Schlumberger customers were to deteriorateresulting in an impairment of their ability to make payments, adjustments to the allowance may be required.
Goodwill, Intangible Assets and Long-Lived Assets
Schlumberger records the excess of purchase price over the fair value of the tangible and identifiableintangible assets acquired as goodwill. Goodwill is tested for impairment annually as well as when an event orchange in circumstance indicates an impairment may have occurred. Goodwill is tested for impairment bycomparing the fair value of Schlumberger’s individual reporting units to their carrying amount to determine ifthere is a potential goodwill impairment. If the fair value of the reporting unit is less than its carrying value,an impairment loss is recorded to the extent that the implied fair value of the goodwill of the reporting unit isless than its carrying value.
For purposes of performing the impairment test for goodwill, Schlumberger’s reporting units are primarilythe geographic areas comprising the Oilfield Services segment in addition to the WesternGeco segment.Schlumberger estimates the fair value of these reporting units using a discounted cash flow analysis and/orapplying various market multiples. Determining the fair value of a reporting unit is a matter of judgment andoften involves the use of significant estimates and assumptions. Schlumberger’s estimates of the fair value ofeach of its reporting units were significantly in excess of their respective carrying values at the time of theannual goodwill impairment tests for 2009, 2008 and 2007.
Long-lived assets, including fixed assets and intangible assets, are reviewed for impairment wheneverevents or changes in circumstances indicate that the carrying value may not be recoverable. In reviewing forimpairment, the carrying value of such assets is compared to the estimated undiscounted future cash flowsexpected from the use of the assets and their eventual disposition. If such cash flows are not sufficient tosupport the asset’s recorded value, an impairment charge is recognized to reduce the carrying value of thelong-lived asset to its estimated fair value. The determination of future cash flows as well as the estimated fairvalue of long-lived assets involves significant estimates on the part of management. If there is a materialchange in economic conditions or other circumstances influencing the estimate of future cash flows or fairvalue, Schlumberger could be required to recognize impairment charges in the future. Schlumberger evaluatesthe remaining useful life of its intangible assets on a periodic basis to determine whether events andcircumstances warrant a revision to the remaining estimated amortization period.
Income Taxes
Schlumberger’s tax filings are subject to regular audit by the tax authorities in most of the over 100jurisdictions in which it conducts business. These audits may result in assessments for additional taxes whichare resolved with the authorities or, potentially, through the courts. Tax liabilities are recorded based onestimates of additional taxes which will be due upon the conclusion of these audits. Estimates of these taxliabilities are made based upon prior experience and are updated in light of changes in facts andcircumstances. However, due to the uncertain and complex application of tax regulations, it is possible thatthe ultimate resolution of audits may result in liabilities which could be materially different from theseestimates. In such an event, Schlumberger will record additional tax expense or tax benefit in the period inwhich such resolution occurs.
31
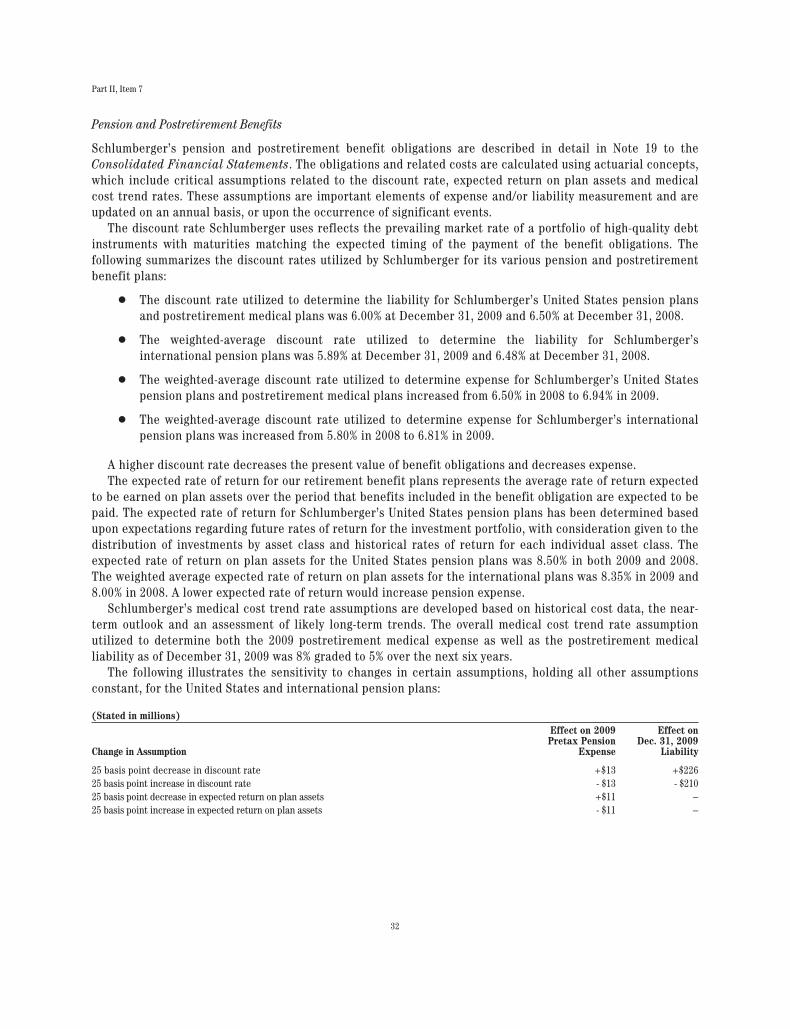
Part II, Item 7
Pension and Postretirement Benefits
Schlumberger’s pension and postretirement benefit obligations are described in detail in Note 19 to theConsolidated Financial Statements. The obligations and related costs are calculated using actuarial concepts,which include critical assumptions related to the discount rate, expected return on plan assets and medicalcost trend rates. These assumptions are important elements of expense and/or liability measurement and areupdated on an annual basis, or upon the occurrence of significant events.
The discount rate Schlumberger uses reflects the prevailing market rate of a portfolio of high-quality debtinstruments with maturities matching the expected timing of the payment of the benefit obligations. Thefollowing summarizes the discount rates utilized by Schlumberger for its various pension and postretirementbenefit plans:
Š The discount rate utilized to determine the liability for Schlumberger’s United States pension plansand postretirement medical plans was 6.00% at December 31, 2009 and 6.50% at December 31, 2008.
Š The weighted-average discount rate utilized to determine the liability for Schlumberger’sinternational pension plans was 5.89% at December 31, 2009 and 6.48% at December 31, 2008.
Š The weighted-average discount rate utilized to determine expense for Schlumberger’s United Statespension plans and postretirement medical plans increased from 6.50% in 2008 to 6.94% in 2009.
Š The weighted-average discount rate utilized to determine expense for Schlumberger’s internationalpension plans was increased from 5.80% in 2008 to 6.81% in 2009.
A higher discount rate decreases the present value of benefit obligations and decreases expense.The expected rate of return for our retirement benefit plans represents the average rate of return expected
to be earned on plan assets over the period that benefits included in the benefit obligation are expected to bepaid. The expected rate of return for Schlumberger’s United States pension plans has been determined basedupon expectations regarding future rates of return for the investment portfolio, with consideration given to thedistribution of investments by asset class and historical rates of return for each individual asset class. Theexpected rate of return on plan assets for the United States pension plans was 8.50% in both 2009 and 2008.The weighted average expected rate of return on plan assets for the international plans was 8.35% in 2009 and8.00% in 2008. A lower expected rate of return would increase pension expense.
Schlumberger’s medical cost trend rate assumptions are developed based on historical cost data, the near-term outlook and an assessment of likely long-term trends. The overall medical cost trend rate assumptionutilized to determine both the 2009 postretirement medical expense as well as the postretirement medicalliability as of December 31, 2009 was 8% graded to 5% over the next six years.
The following illustrates the sensitivity to changes in certain assumptions, holding all other assumptionsconstant, for the United States and international pension plans:
(Stated in millions)
Change in Assumption
Effect on 2009Pretax Pension
Expense
Effect onDec. 31, 2009
Liability
25 basis point decrease in discount rate +$13 +$22625 basis point increase in discount rate - $13 - $21025 basis point decrease in expected return on plan assets +$11 –25 basis point increase in expected return on plan assets - $11 –
32
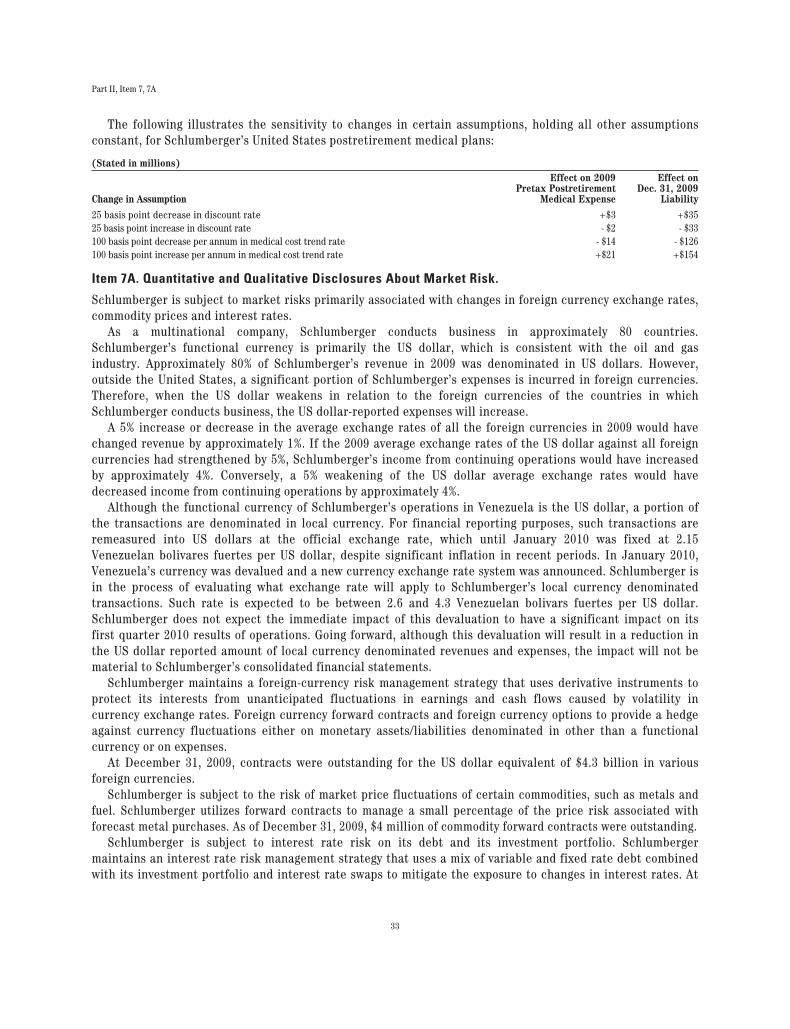
Part II, Item 7, 7A
The following illustrates the sensitivity to changes in certain assumptions, holding all other assumptionsconstant, for Schlumberger’s United States postretirement medical plans:
(Stated in millions)
Change in Assumption
Effect on 2009Pretax Postretirement
Medical Expense
Effect onDec. 31, 2009
Liability
25 basis point decrease in discount rate +$3 +$3525 basis point increase in discount rate - $2 - $33100 basis point decrease per annum in medical cost trend rate - $14 - $126100 basis point increase per annum in medical cost trend rate +$21 +$154
Item 7A. Quantitative and Qualitative Disclosures About Market Risk.
Schlumberger is subject to market risks primarily associated with changes in foreign currency exchange rates,commodity prices and interest rates.
As a multinational company, Schlumberger conducts business in approximately 80 countries.Schlumberger’s functional currency is primarily the US dollar, which is consistent with the oil and gasindustry. Approximately 80% of Schlumberger’s revenue in 2009 was denominated in US dollars. However,outside the United States, a significant portion of Schlumberger’s expenses is incurred in foreign currencies.Therefore, when the US dollar weakens in relation to the foreign currencies of the countries in whichSchlumberger conducts business, the US dollar-reported expenses will increase.
A 5% increase or decrease in the average exchange rates of all the foreign currencies in 2009 would havechanged revenue by approximately 1%. If the 2009 average exchange rates of the US dollar against all foreigncurrencies had strengthened by 5%, Schlumberger’s income from continuing operations would have increasedby approximately 4%. Conversely, a 5% weakening of the US dollar average exchange rates would havedecreased income from continuing operations by approximately 4%.
Although the functional currency of Schlumberger’s operations in Venezuela is the US dollar, a portion ofthe transactions are denominated in local currency. For financial reporting purposes, such transactions areremeasured into US dollars at the official exchange rate, which until January 2010 was fixed at 2.15Venezuelan bolivares fuertes per US dollar, despite significant inflation in recent periods. In January 2010,Venezuela’s currency was devalued and a new currency exchange rate system was announced. Schlumberger isin the process of evaluating what exchange rate will apply to Schlumberger’s local currency denominatedtransactions. Such rate is expected to be between 2.6 and 4.3 Venezuelan bolivars fuertes per US dollar.Schlumberger does not expect the immediate impact of this devaluation to have a significant impact on itsfirst quarter 2010 results of operations. Going forward, although this devaluation will result in a reduction inthe US dollar reported amount of local currency denominated revenues and expenses, the impact will not bematerial to Schlumberger’s consolidated financial statements.
Schlumberger maintains a foreign-currency risk management strategy that uses derivative instruments toprotect its interests from unanticipated fluctuations in earnings and cash flows caused by volatility incurrency exchange rates. Foreign currency forward contracts and foreign currency options to provide a hedgeagainst currency fluctuations either on monetary assets/liabilities denominated in other than a functionalcurrency or on expenses.
At December 31, 2009, contracts were outstanding for the US dollar equivalent of $4.3 billion in variousforeign currencies.
Schlumberger is subject to the risk of market price fluctuations of certain commodities, such as metals andfuel. Schlumberger utilizes forward contracts to manage a small percentage of the price risk associated withforecast metal purchases. As of December 31, 2009, $4 million of commodity forward contracts were outstanding.
Schlumberger is subject to interest rate risk on its debt and its investment portfolio. Schlumbergermaintains an interest rate risk management strategy that uses a mix of variable and fixed rate debt combinedwith its investment portfolio and interest rate swaps to mitigate the exposure to changes in interest rates. At
33
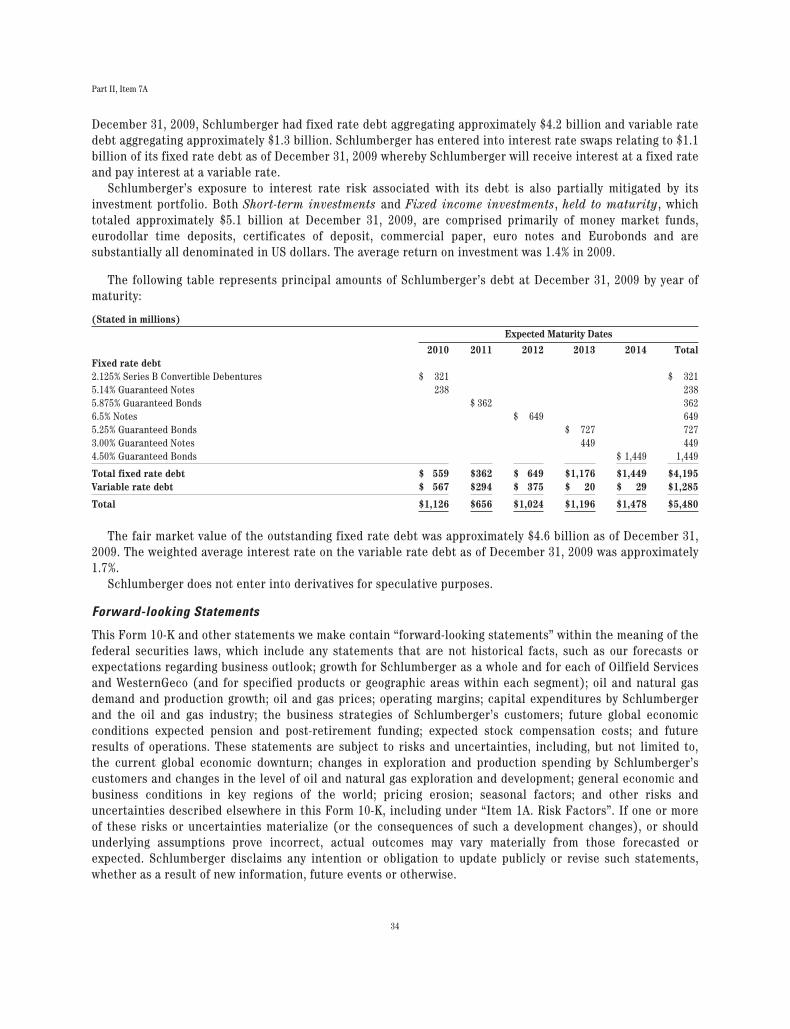
Part II, Item 7A
December 31, 2009, Schlumberger had fixed rate debt aggregating approximately $4.2 billion and variable ratedebt aggregating approximately $1.3 billion. Schlumberger has entered into interest rate swaps relating to $1.1billion of its fixed rate debt as of December 31, 2009 whereby Schlumberger will receive interest at a fixed rateand pay interest at a variable rate.
Schlumberger’s exposure to interest rate risk associated with its debt is also partially mitigated by itsinvestment portfolio. Both Short-term investments and Fixed income investments, held to maturity, whichtotaled approximately $5.1 billion at December 31, 2009, are comprised primarily of money market funds,eurodollar time deposits, certificates of deposit, commercial paper, euro notes and Eurobonds and aresubstantially all denominated in US dollars. The average return on investment was 1.4% in 2009.
The following table represents principal amounts of Schlumberger’s debt at December 31, 2009 by year ofmaturity:
(Stated in millions)Expected Maturity Dates
2010 2011 2012 2013 2014 TotalFixed rate debt2.125% Series B Convertible Debentures $ 321 $ 3215.14% Guaranteed Notes 238 2385.875% Guaranteed Bonds $ 362 3626.5% Notes $ 649 6495.25% Guaranteed Bonds $ 727 7273.00% Guaranteed Notes 449 4494.50% Guaranteed Bonds $ 1,449 1,449
Total fixed rate debt $ 559 $362 $ 649 $1,176 $1,449 $4,195Variable rate debt $ 567 $294 $ 375 $ 20 $ 29 $1,285
Total $1,126 $656 $1,024 $1,196 $1,478 $5,480
The fair market value of the outstanding fixed rate debt was approximately $4.6 billion as of December 31,2009. The weighted average interest rate on the variable rate debt as of December 31, 2009 was approximately1.7%.
Schlumberger does not enter into derivatives for speculative purposes.
Forward-looking Statements
This Form 10-K and other statements we make contain “forward-looking statements” within the meaning of thefederal securities laws, which include any statements that are not historical facts, such as our forecasts orexpectations regarding business outlook; growth for Schlumberger as a whole and for each of Oilfield Servicesand WesternGeco (and for specified products or geographic areas within each segment); oil and natural gasdemand and production growth; oil and gas prices; operating margins; capital expenditures by Schlumbergerand the oil and gas industry; the business strategies of Schlumberger’s customers; future global economicconditions expected pension and post-retirement funding; expected stock compensation costs; and futureresults of operations. These statements are subject to risks and uncertainties, including, but not limited to,the current global economic downturn; changes in exploration and production spending by Schlumberger’scustomers and changes in the level of oil and natural gas exploration and development; general economic andbusiness conditions in key regions of the world; pricing erosion; seasonal factors; and other risks anduncertainties described elsewhere in this Form 10-K, including under “Item 1A. Risk Factors”. If one or moreof these risks or uncertainties materialize (or the consequences of such a development changes), or shouldunderlying assumptions prove incorrect, actual outcomes may vary materially from those forecasted orexpected. Schlumberger disclaims any intention or obligation to update publicly or revise such statements,whether as a result of new information, future events or otherwise.
34
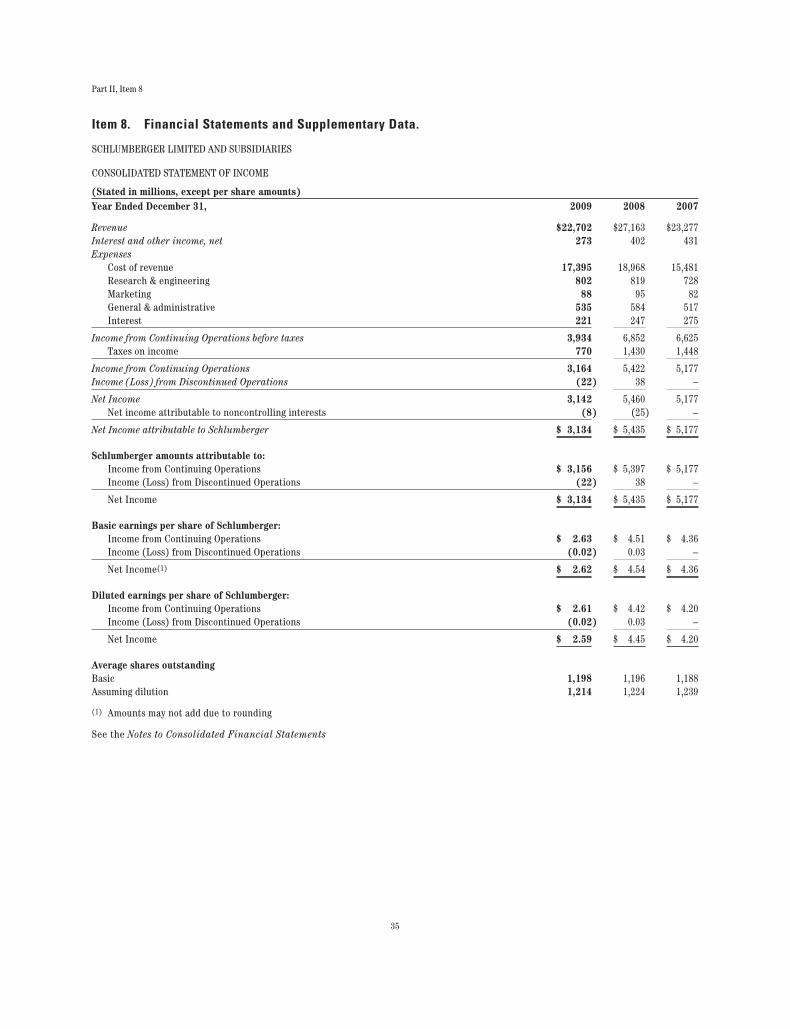
Part II, Item 8
Item 8. Financial Statements and Supplementary Data.
SCHLUMBERGER LIMITED AND SUBSIDIARIES
CONSOLIDATED STATEMENT OF INCOME
(Stated in millions, except per share amounts)Year Ended December 31, 2009 2008 2007
Revenue $22,702 $27,163 $23,277Interest and other income, net 273 402 431Expenses
Cost of revenue 17,395 18,968 15,481Research & engineering 802 819 728Marketing 88 95 82General & administrative 535 584 517Interest 221 247 275
Income from Continuing Operations before taxes 3,934 6,852 6,625Taxes on income 770 1,430 1,448
Income from Continuing Operations 3,164 5,422 5,177Income (Loss) from Discontinued Operations (22) 38 –
Net Income 3,142 5,460 5,177Net income attributable to noncontrolling interests (8) (25) –
Net Income attributable to Schlumberger $ 3,134 $ 5,435 $ 5,177
Schlumberger amounts attributable to:Income from Continuing Operations $ 3,156 $ 5,397 $ 5,177Income (Loss) from Discontinued Operations (22) 38 –
Net Income $ 3,134 $ 5,435 $ 5,177
Basic earnings per share of Schlumberger:Income from Continuing Operations $ 2.63 $ 4.51 $ 4.36Income (Loss) from Discontinued Operations (0.02) 0.03 –
Net Income(1) $ 2.62 $ 4.54 $ 4.36
Diluted earnings per share of Schlumberger:Income from Continuing Operations $ 2.61 $ 4.42 $ 4.20Income (Loss) from Discontinued Operations (0.02) 0.03 –
Net Income $ 2.59 $ 4.45 $ 4.20
Average shares outstandingBasic 1,198 1,196 1,188Assuming dilution 1,214 1,224 1,239
(1) Amounts may not add due to rounding
See the Notes to Consolidated Financial Statements
35
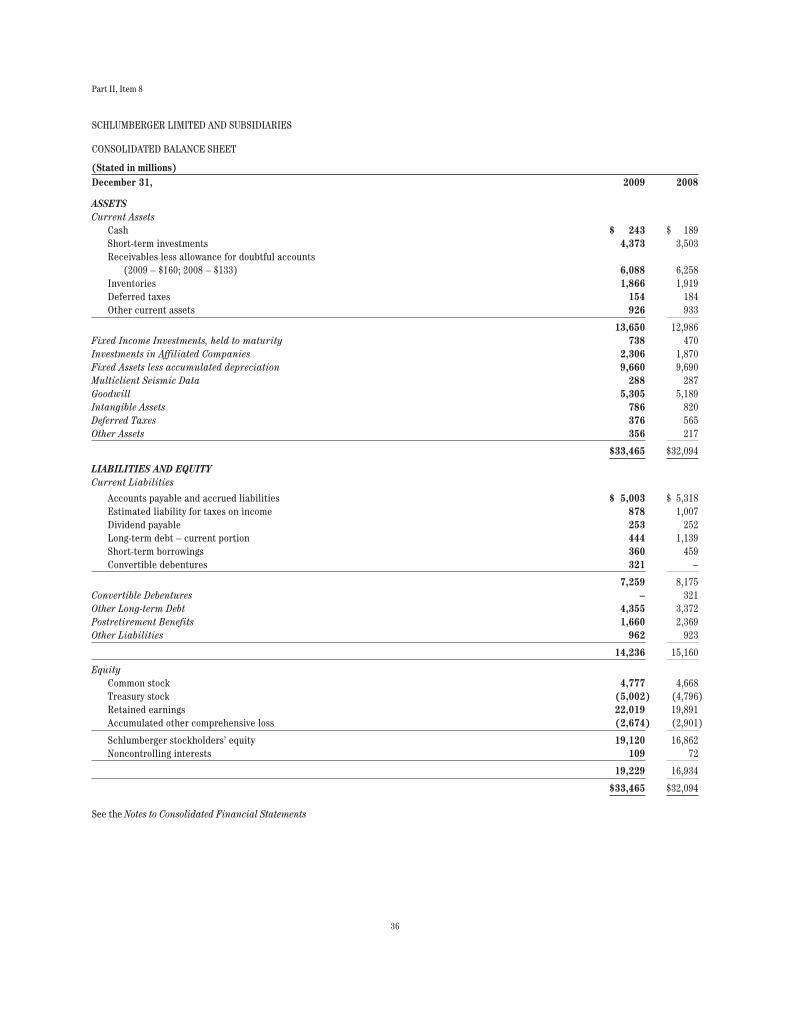
Part II, Item 8
SCHLUMBERGER LIMITED AND SUBSIDIARIES
CONSOLIDATED BALANCE SHEET
(Stated in millions)December 31, 2009 2008
ASSETSCurrent Assets
Cash $ 243 $ 189Short-term investments 4,373 3,503Receivables less allowance for doubtful accounts
(2009 – $160; 2008 – $133) 6,088 6,258Inventories 1,866 1,919Deferred taxes 154 184Other current assets 926 933
13,650 12,986Fixed Income Investments, held to maturity 738 470Investments in Affiliated Companies 2,306 1,870Fixed Assets less accumulated depreciation 9,660 9,690Multiclient Seismic Data 288 287Goodwill 5,305 5,189Intangible Assets 786 820Deferred Taxes 376 565Other Assets 356 217
$33,465 $32,094
LIABILITIES AND EQUITYCurrent Liabilities
Accounts payable and accrued liabilities $ 5,003 $ 5,318Estimated liability for taxes on income 878 1,007Dividend payable 253 252Long-term debt – current portion 444 1,139Short-term borrowings 360 459Convertible debentures 321 –
7,259 8,175Convertible Debentures – 321Other Long-term Debt 4,355 3,372Postretirement Benefits 1,660 2,369Other Liabilities 962 923
14,236 15,160
EquityCommon stock 4,777 4,668Treasury stock (5,002) (4,796)Retained earnings 22,019 19,891Accumulated other comprehensive loss (2,674) (2,901)
Schlumberger stockholders’ equity 19,120 16,862Noncontrolling interests 109 72
19,229 16,934
$33,465 $32,094
See the Notes to Consolidated Financial Statements
36
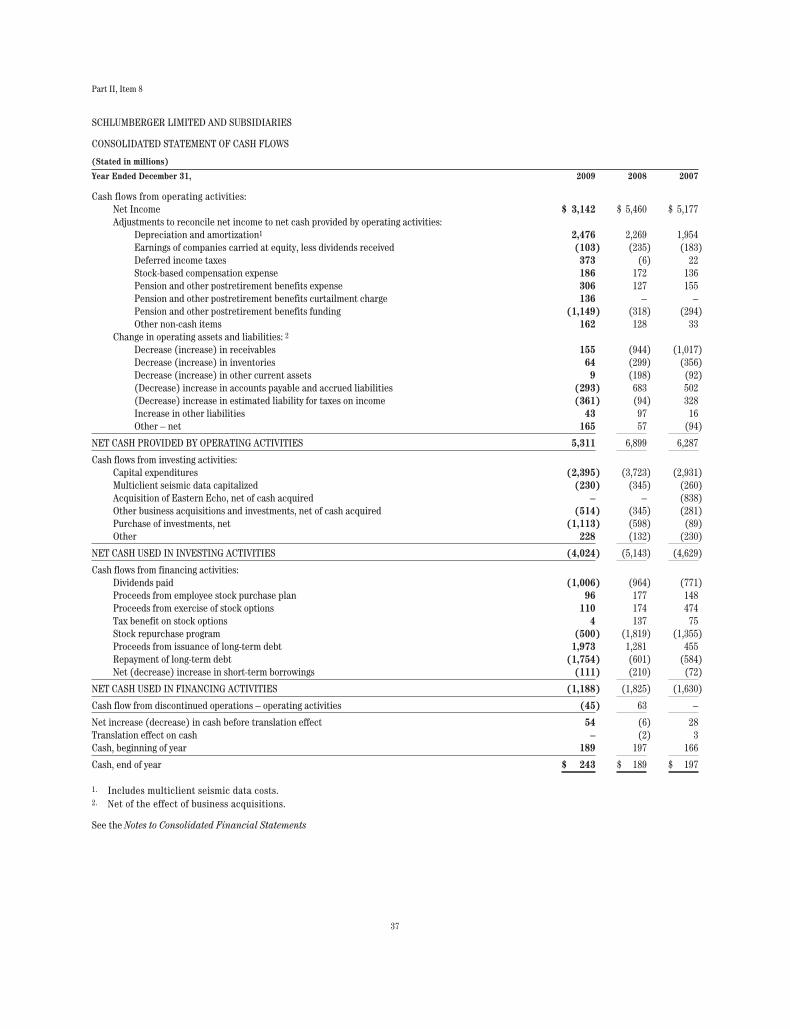
Part II, Item 8
SCHLUMBERGER LIMITED AND SUBSIDIARIES
CONSOLIDATED STATEMENT OF CASH FLOWS
(Stated in millions)
Year Ended December 31, 2009 2008 2007
Cash flows from operating activities:Net Income $ 3,142 $ 5,460 $ 5,177Adjustments to reconcile net income to net cash provided by operating activities:
Depreciation and amortization1 2,476 2,269 1,954Earnings of companies carried at equity, less dividends received (103) (235) (183)Deferred income taxes 373 (6) 22Stock-based compensation expense 186 172 136Pension and other postretirement benefits expense 306 127 155Pension and other postretirement benefits curtailment charge 136 – –Pension and other postretirement benefits funding (1,149) (318) (294)Other non-cash items 162 128 33
Change in operating assets and liabilities: 2
Decrease (increase) in receivables 155 (944) (1,017)Decrease (increase) in inventories 64 (299) (356)Decrease (increase) in other current assets 9 (198) (92)(Decrease) increase in accounts payable and accrued liabilities (293) 683 502(Decrease) increase in estimated liability for taxes on income (361) (94) 328Increase in other liabilities 43 97 16Other – net 165 57 (94)
NET CASH PROVIDED BY OPERATING ACTIVITIES 5,311 6,899 6,287
Cash flows from investing activities:Capital expenditures (2,395) (3,723) (2,931)Multiclient seismic data capitalized (230) (345) (260)Acquisition of Eastern Echo, net of cash acquired – – (838)Other business acquisitions and investments, net of cash acquired (514) (345) (281)Purchase of investments, net (1,113) (598) (89)Other 228 (132) (230)
NET CASH USED IN INVESTING ACTIVITIES (4,024) (5,143) (4,629)
Cash flows from financing activities:Dividends paid (1,006) (964) (771)Proceeds from employee stock purchase plan 96 177 148Proceeds from exercise of stock options 110 174 474Tax benefit on stock options 4 137 75Stock repurchase program (500) (1,819) (1,355)Proceeds from issuance of long-term debt 1,973 1,281 455Repayment of long-term debt (1,754) (601) (584)Net (decrease) increase in short-term borrowings (111) (210) (72)
NET CASH USED IN FINANCING ACTIVITIES (1,188) (1,825) (1,630)
Cash flow from discontinued operations – operating activities (45) 63 –
Net increase (decrease) in cash before translation effect 54 (6) 28Translation effect on cash – (2) 3Cash, beginning of year 189 197 166
Cash, end of year $ 243 $ 189 $ 197
1. Includes multiclient seismic data costs.2. Net of the effect of business acquisitions.
See the Notes to Consolidated Financial Statements
37
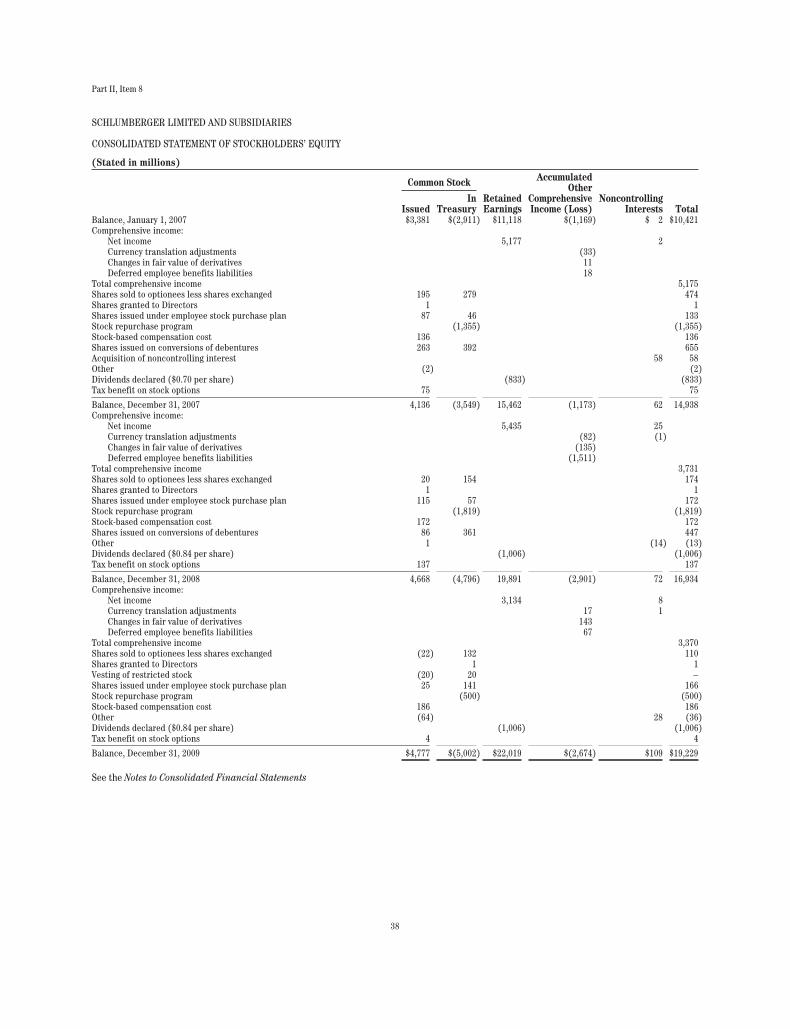
Part II, Item 8
SCHLUMBERGER LIMITED AND SUBSIDIARIES
CONSOLIDATED STATEMENT OF STOCKHOLDERS’ EQUITY
(Stated in millions)
Common Stock
RetainedEarnings
AccumulatedOther
ComprehensiveIncome (Loss)
NoncontrollingInterests TotalIssued
InTreasury
Balance, January 1, 2007 $3,381 $(2,911) $11,118 $(1,169) $ 2 $10,421Comprehensive income:
Net income 5,177 2Currency translation adjustments (33)Changes in fair value of derivatives 11Deferred employee benefits liabilities 18
Total comprehensive income 5,175Shares sold to optionees less shares exchanged 195 279 474Shares granted to Directors 1 1Shares issued under employee stock purchase plan 87 46 133Stock repurchase program (1,355) (1,355)Stock-based compensation cost 136 136Shares issued on conversions of debentures 263 392 655Acquisition of noncontrolling interest 58 58Other (2) (2)Dividends declared ($0.70 per share) (833) (833)Tax benefit on stock options 75 75
Balance, December 31, 2007 4,136 (3,549) 15,462 (1,173) 62 14,938Comprehensive income:
Net income 5,435 25Currency translation adjustments (82) (1)Changes in fair value of derivatives (135)Deferred employee benefits liabilities (1,511)
Total comprehensive income 3,731Shares sold to optionees less shares exchanged 20 154 174Shares granted to Directors 1 1Shares issued under employee stock purchase plan 115 57 172Stock repurchase program (1,819) (1,819)Stock-based compensation cost 172 172Shares issued on conversions of debentures 86 361 447Other 1 (14) (13)Dividends declared ($0.84 per share) (1,006) (1,006)Tax benefit on stock options 137 137
Balance, December 31, 2008 4,668 (4,796) 19,891 (2,901) 72 16,934Comprehensive income:
Net income 3,134 8Currency translation adjustments 17 1Changes in fair value of derivatives 143Deferred employee benefits liabilities 67
Total comprehensive income 3,370Shares sold to optionees less shares exchanged (22) 132 110Shares granted to Directors 1 1Vesting of restricted stock (20) 20 –Shares issued under employee stock purchase plan 25 141 166Stock repurchase program (500) (500)Stock-based compensation cost 186 186Other (64) 28 (36)Dividends declared ($0.84 per share) (1,006) (1,006)Tax benefit on stock options 4 4
Balance, December 31, 2009 $4,777 $(5,002) $22,019 $(2,674) $109 $19,229
See the Notes to Consolidated Financial Statements
38
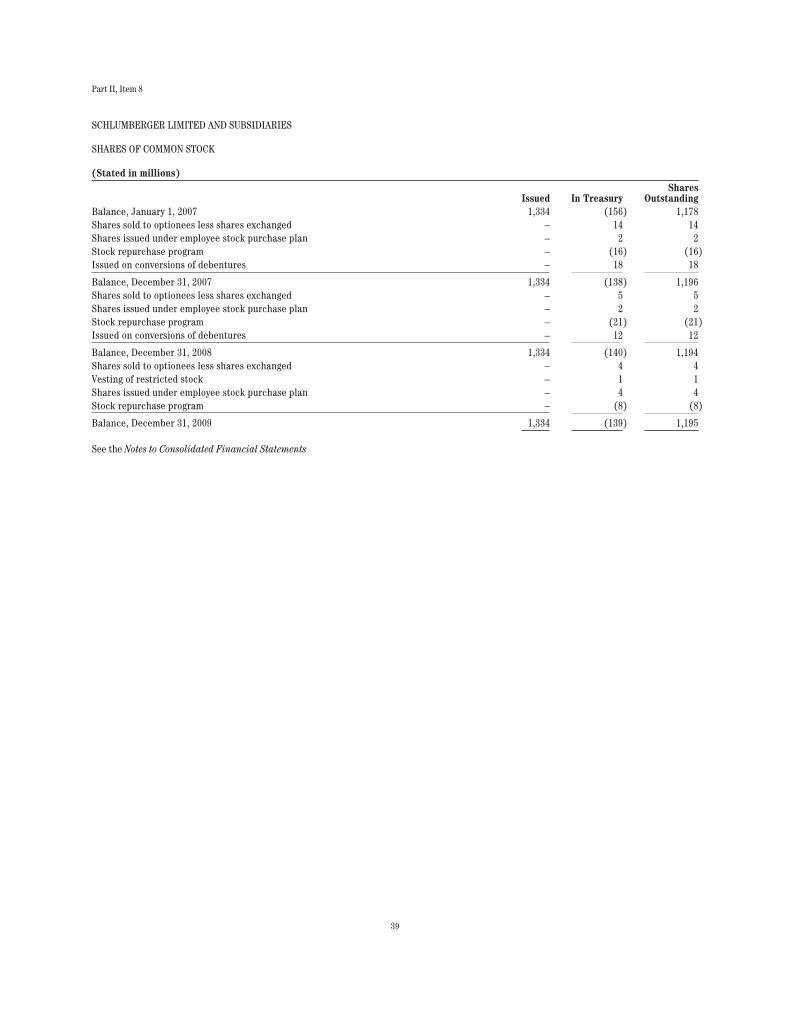
Part II, Item 8
SCHLUMBERGER LIMITED AND SUBSIDIARIES
SHARES OF COMMON STOCK
(Stated in millions)
Issued In TreasuryShares
OutstandingBalance, January 1, 2007 1,334 (156) 1,178Shares sold to optionees less shares exchanged – 14 14Shares issued under employee stock purchase plan – 2 2Stock repurchase program – (16) (16)Issued on conversions of debentures – 18 18
Balance, December 31, 2007 1,334 (138) 1,196Shares sold to optionees less shares exchanged – 5 5Shares issued under employee stock purchase plan – 2 2Stock repurchase program – (21) (21)Issued on conversions of debentures – 12 12
Balance, December 31, 2008 1,334 (140) 1,194Shares sold to optionees less shares exchanged – 4 4Vesting of restricted stock – 1 1Shares issued under employee stock purchase plan – 4 4Stock repurchase program – (8) (8)
Balance, December 31, 2009 1,334 (139) 1,195
See the Notes to Consolidated Financial Statements
39
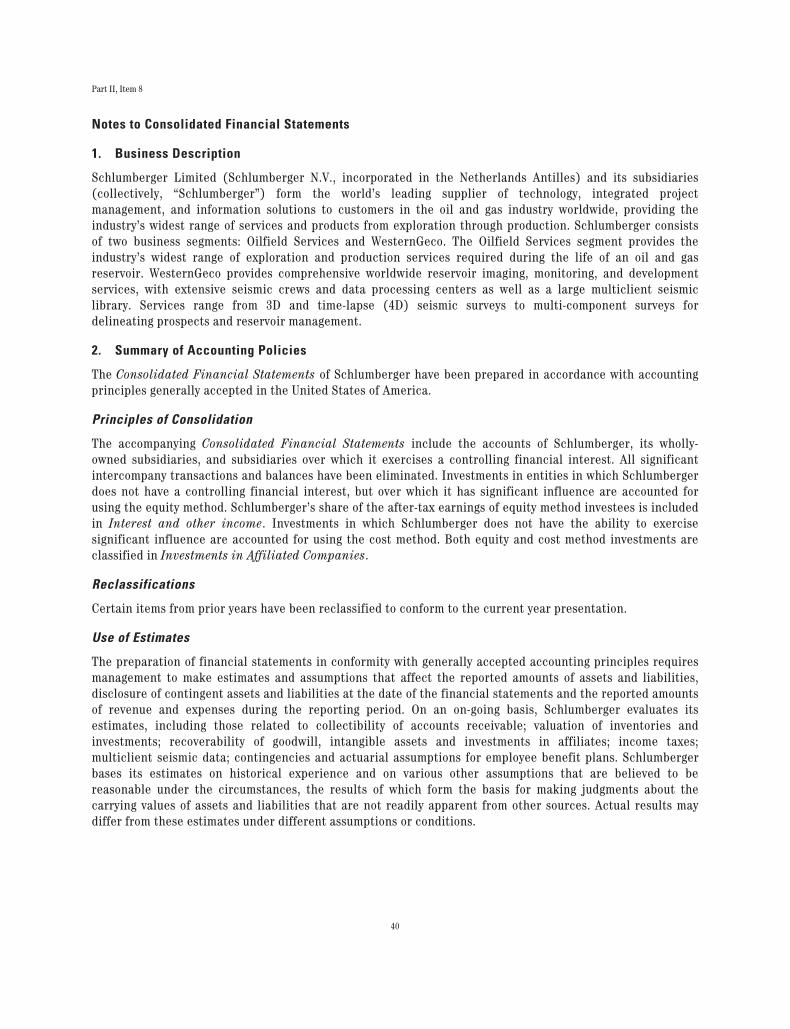
Part II, Item 8
Notes to Consolidated Financial Statements
1. Business Description
Schlumberger Limited (Schlumberger N.V., incorporated in the Netherlands Antilles) and its subsidiaries(collectively, “Schlumberger”) form the world’s leading supplier of technology, integrated projectmanagement, and information solutions to customers in the oil and gas industry worldwide, providing theindustry’s widest range of services and products from exploration through production. Schlumberger consistsof two business segments: Oilfield Services and WesternGeco. The Oilfield Services segment provides theindustry’s widest range of exploration and production services required during the life of an oil and gasreservoir. WesternGeco provides comprehensive worldwide reservoir imaging, monitoring, and developmentservices, with extensive seismic crews and data processing centers as well as a large multiclient seismiclibrary. Services range from 3D and time-lapse (4D) seismic surveys to multi-component surveys fordelineating prospects and reservoir management.
2. Summary of Accounting Policies
The Consolidated Financial Statements of Schlumberger have been prepared in accordance with accountingprinciples generally accepted in the United States of America.
Principles of Consolidation
The accompanying Consolidated Financial Statements include the accounts of Schlumberger, its wholly-owned subsidiaries, and subsidiaries over which it exercises a controlling financial interest. All significantintercompany transactions and balances have been eliminated. Investments in entities in which Schlumbergerdoes not have a controlling financial interest, but over which it has significant influence are accounted forusing the equity method. Schlumberger’s share of the after-tax earnings of equity method investees is includedin Interest and other income. Investments in which Schlumberger does not have the ability to exercisesignificant influence are accounted for using the cost method. Both equity and cost method investments areclassified in Investments in Affiliated Companies.
Reclassifications
Certain items from prior years have been reclassified to conform to the current year presentation.
Use of Estimates
The preparation of financial statements in conformity with generally accepted accounting principles requiresmanagement to make estimates and assumptions that affect the reported amounts of assets and liabilities,disclosure of contingent assets and liabilities at the date of the financial statements and the reported amountsof revenue and expenses during the reporting period. On an on-going basis, Schlumberger evaluates itsestimates, including those related to collectibility of accounts receivable; valuation of inventories andinvestments; recoverability of goodwill, intangible assets and investments in affiliates; income taxes;multiclient seismic data; contingencies and actuarial assumptions for employee benefit plans. Schlumbergerbases its estimates on historical experience and on various other assumptions that are believed to bereasonable under the circumstances, the results of which form the basis for making judgments about thecarrying values of assets and liabilities that are not readily apparent from other sources. Actual results maydiffer from these estimates under different assumptions or conditions.
40
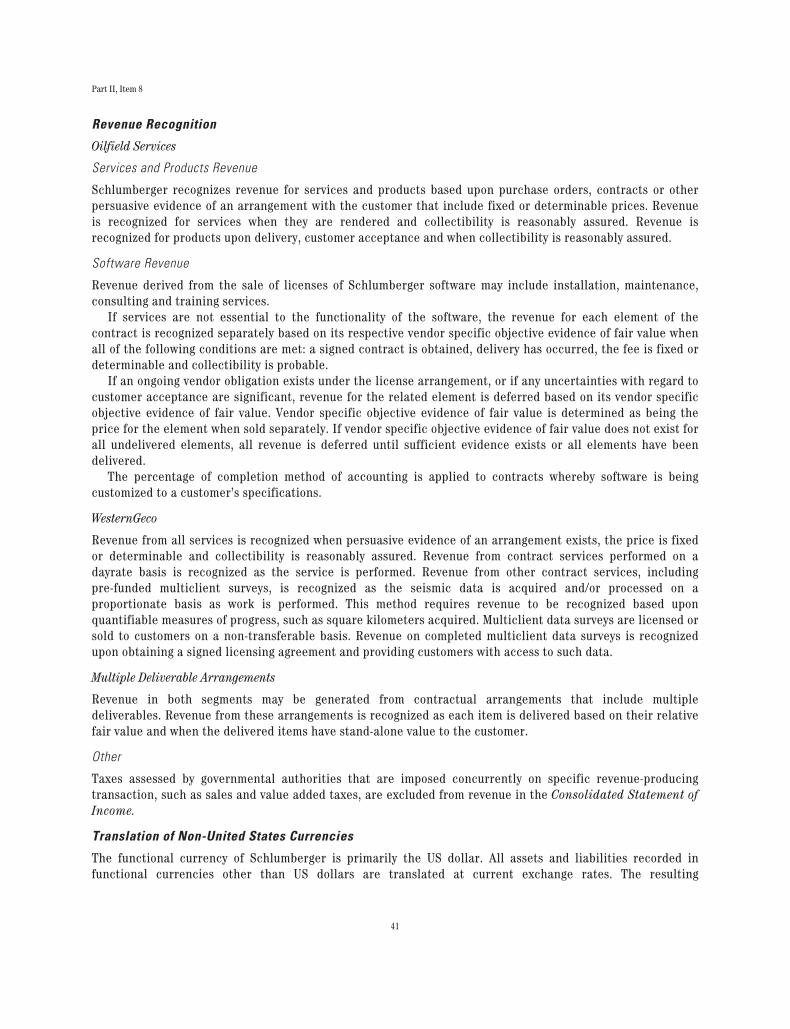
Part II, Item 8
Revenue Recognition
Oilfield Services
Services and Products Revenue
Schlumberger recognizes revenue for services and products based upon purchase orders, contracts or otherpersuasive evidence of an arrangement with the customer that include fixed or determinable prices. Revenueis recognized for services when they are rendered and collectibility is reasonably assured. Revenue isrecognized for products upon delivery, customer acceptance and when collectibility is reasonably assured.
Software Revenue
Revenue derived from the sale of licenses of Schlumberger software may include installation, maintenance,consulting and training services.
If services are not essential to the functionality of the software, the revenue for each element of thecontract is recognized separately based on its respective vendor specific objective evidence of fair value whenall of the following conditions are met: a signed contract is obtained, delivery has occurred, the fee is fixed ordeterminable and collectibility is probable.
If an ongoing vendor obligation exists under the license arrangement, or if any uncertainties with regard tocustomer acceptance are significant, revenue for the related element is deferred based on its vendor specificobjective evidence of fair value. Vendor specific objective evidence of fair value is determined as being theprice for the element when sold separately. If vendor specific objective evidence of fair value does not exist forall undelivered elements, all revenue is deferred until sufficient evidence exists or all elements have beendelivered.
The percentage of completion method of accounting is applied to contracts whereby software is beingcustomized to a customer’s specifications.
WesternGeco
Revenue from all services is recognized when persuasive evidence of an arrangement exists, the price is fixedor determinable and collectibility is reasonably assured. Revenue from contract services performed on adayrate basis is recognized as the service is performed. Revenue from other contract services, includingpre-funded multiclient surveys, is recognized as the seismic data is acquired and/or processed on aproportionate basis as work is performed. This method requires revenue to be recognized based uponquantifiable measures of progress, such as square kilometers acquired. Multiclient data surveys are licensed orsold to customers on a non-transferable basis. Revenue on completed multiclient data surveys is recognizedupon obtaining a signed licensing agreement and providing customers with access to such data.
Multiple Deliverable Arrangements
Revenue in both segments may be generated from contractual arrangements that include multipledeliverables. Revenue from these arrangements is recognized as each item is delivered based on their relativefair value and when the delivered items have stand-alone value to the customer.
Other
Taxes assessed by governmental authorities that are imposed concurrently on specific revenue-producingtransaction, such as sales and value added taxes, are excluded from revenue in the Consolidated Statement ofIncome.
Translation of Non-United States Currencies
The functional currency of Schlumberger is primarily the US dollar. All assets and liabilities recorded infunctional currencies other than US dollars are translated at current exchange rates. The resulting
41
Part II, Item 8
adjustments are charged or credited directly to the Stockholders’ Equity section of the Consolidated BalanceSheet. Revenue and expenses are translated at the weighted-average exchange rates for the period. Allrealized and unrealized transaction gains and losses are included in income in the period in which they occur.Transaction gains, net of hedging activities, of $73 million, $8 million and $17 million were recognized in 2009,2008 and 2007 respectively.
Investments
The Consolidated Balance Sheet reflects the Schlumberger investment portfolio separated between currentand long term, based on maturity. Under normal circumstances it is the intent of Schlumberger to hold theinvestments until maturity, with the exception of investments that are considered trading (December 31, 2009– $184 million; December 31, 2008 – $194 million). Both Short-term investments and Fixed IncomeInvestments, held to maturity are comprised primarily of money market funds, eurodollar time deposits,certificates of deposit, commercial paper, euro notes and Eurobonds, and are substantially denominated in USdollars. They are stated at cost plus accrued interest, which approximates market. Short-term investmentsthat are designated as trading are stated at fair value, which is estimated using quoted market prices for thoseor similar investments. The unrealized gains/losses on investments designated as trading were not significantat both December 31, 2009 and 2008.
For purposes of the Consolidated Statement of Cash Flows, Schlumberger does not consider short-terminvestments to be cash equivalents as a significant portion have original maturities in excess of three months.
Fixed Income Investments, held to maturity at December 31, 2009 of $738 million mature as follows: $274million in 2011, $289 million in 2012, $60 million in 2013 and $115 million in 2014.
Inventories
Inventories are stated at average cost or at market, whichever is lower. Inventory consists of materials,supplies and finished goods. Costs included in inventories consist of materials, direct labor and manufacturingoverhead.
Fixed Assets and Depreciation
Fixed assets are stated at cost less accumulated depreciation, which is provided for by charges to income overthe estimated useful lives of the assets using the straight-line method. Fixed assets include the manufacturingcost of oilfield technical equipment manufactured or assembled by subsidiaries of Schlumberger. Expendituresfor replacements and improvements are capitalized. Maintenance and repairs are charged to operatingexpenses as incurred. Upon sale or other disposition, the applicable amounts of asset cost and accumulateddepreciation are removed from the accounts and the net amount, less proceeds from disposal, is charged orcredited to income.
Multiclient Seismic Data
The multiclient library consists of completed and in-process seismic surveys that are licensed on anonexclusive basis. This data may be acquired and/or processed by Schlumberger or subcontractors.Multiclient surveys are primarily generated utilizing Schlumberger resources. Schlumberger capitalizes costsdirectly incurred in acquiring and processing the multiclient seismic data. Such costs are charged to Cost ofrevenue based on the percentage of the total costs to the estimated total revenue that Schlumberger expectsto receive from the sales of such data. However, under no circumstance will an individual survey carry a netbook value greater than a 4- year straight-line amortized value.
The carrying value of the multiclient library is reviewed for impairment annually as well as when an eventor change in circumstance indicating impairment may have occurred. Adjustments to the carrying value arerecorded when it is determined that estimated future cash flows, which involves significant judgment on the
42
Part II, Item 8
part of Schlumberger, would not be sufficient to recover the carrying value of the surveys. Significant adversechanges in Schlumberger’s estimated future cash flows could result in impairment charges in a future period.
Goodwill, Other Intangibles and Long-lived Assets
Schlumberger records the excess of purchase price over the fair value of the tangible and identifiableintangible assets acquired as goodwill. Goodwill is tested for impairment annually as well as when an event orchange in circumstance indicates an impairment may have occurred. Goodwill is tested for impairment bycomparing the fair value of Schlumberger’s individual reporting units to their carrying amount to determine ifthere is a potential goodwill impairment. If the fair value of the reporting unit is less than its carrying value,an impairment loss is recorded to the extent that the implied fair value of the goodwill of the reporting unit isless than its carrying value.
For purposes of performing the impairment test for goodwill, the Schlumberger reporting units areprimarily the geographic areas comprising the Oilfield Services segment in addition to the WesternGecosegment. Schlumberger estimates the fair value of these reporting units using a discounted cash flow analysisand/or applying various market multiples. Determining the fair value of a reporting unit is a matter ofjudgment and involves the use of significant estimates and assumptions. Schlumberger’s estimates of the fairvalue of each of its reporting units were significantly in excess of their respective carrying values for 2009,2008 and 2007. Schlumberger performs the annual goodwill impairment test of its WesternGeco reporting uniton October 1st of every year while the reporting units comprising the Oilfield Services segment are tested as ofDecember 31st.
Long-lived assets, including fixed assets and intangible assets, are reviewed for impairment wheneverevents or changes in circumstances indicate that the carrying value may not be recoverable. In reviewing forimpairment, the carrying value of such assets is compared to the estimated undiscounted future cash flowsexpected from the use of the assets and their eventual disposition. If such cash flows are not sufficient tosupport the asset’s recorded value, an impairment charge is recognized to reduce the carrying value of thelong-lived asset to its estimated fair value. The determination of future cash flows as well as the estimated fairvalue of long-lived assets involve significant estimates on the part of management. If there is a materialchange in economic conditions or other circumstances influencing the estimate of future cash flows or fairvalue, Schlumberger could be required to recognize impairment charges in the future.
Schlumberger capitalizes certain costs of internally developed software. Capitalized costs includepurchased materials and services, payroll and payroll related costs. The costs of internally developed softwareare amortized on a straight-line basis over the estimated useful life, which is principally 5 to 7 years. Otherintangible assets consist primarily of technology and customer relationships acquired in businesscombinations. Acquired technology is generally amortized over periods ranging from 5 to 15 years and acquiredcustomer relationships are generally amortized over periods ranging from 7 years to 20 years.
Taxes on Income
Schlumberger computes taxes on income in accordance with the tax rules and regulations of the many taxingauthorities where the income is earned. The income tax rates imposed by these taxing authorities varysubstantially. Taxable income may differ from pretax income for financial accounting purposes. To the extentthat differences are due to revenue or expense items reported in one period for tax purposes and in anotherperiod for financial accounting purposes, an appropriate provision for deferred income taxes is made. Anyeffect of changes in income tax rates or tax laws are included in the provision for income taxes in the period ofenactment. When it is more likely than not that a portion or all of the deferred tax asset will not be realized inthe future, Schlumberger provides a corresponding valuation allowance against deferred tax assets.
Schlumberger’s tax filings are subject to regular audit by the tax authorities in most of the jurisdictions inwhich it conducts business. These audits may result in assessments for additional taxes which are resolved
43
Part II, Item 8
with the authorities or, potentially, through the courts. Schlumberger recognizes the impact of a tax positionin its financial statements if that position is more likely than not of being sustained on audit, based on thetechnical merits of the position. Tax liabilities are recorded based on estimates of additional taxes which willbe due upon the conclusion of these audits. Estimates of these tax liabilities are made based upon priorexperience and are updated in light of changes in facts and circumstances. However, due to the uncertain andcomplex application of tax regulations, it is possible that the ultimate resolution of audits may result inliabilities which could be materially different from these estimates. In such an event, Schlumberger willrecord additional tax expense or tax benefit in the year in which such resolution occurs.
At December 31, 2009, approximately $18 billion of consolidated income retained for use in the businessrepresented undistributed earnings of consolidated subsidiaries and Schlumberger’s share of equity methodinvestees. Schlumberger has not recorded deferred taxes relating to any of its undistributed earnings as theyare all considered to be either indefinitely reinvested or earnings that would not be taxed when remitted.
Concentration of Credit Risk
Schlumberger’s assets that are exposed to concentrations of credit risk consist primarily of cash, short-terminvestments, fixed income investments held to maturity, receivables from clients and derivative financialinstruments. Schlumberger places its cash, short-term investments and fixed income investments held tomaturity with financial institutions and corporations, and limits the amount of credit exposure with any one ofthem. Schlumberger regularly evaluates the creditworthiness of the issuers in which it invests. The receivablesfrom clients are spread over many countries and customers. Schlumberger maintains an allowance foruncollectible accounts receivable based on expected collectibility and performs ongoing credit evaluations ofits customers’ financial condition. By using derivative financial instruments to hedge exposure to changes inexchange rates and, commodity prices, Schlumberger exposes itself to some credit risk. Schlumbergerminimizes this credit risk by entering into transactions with high-quality counterparties, limiting the exposureto each counterparty and monitoring the financial condition of its counterparties.
Research & Engineering
All research and engineering expenditures are expensed as incurred.
Earnings per Share
Basic earnings per share is calculated by dividing net income by the weighted average number of commonshares outstanding during the year. Diluted earnings per share is calculated by first adding back to net incomethe interest expense on the convertible debentures and then dividing this adjusted net income attributable toSchlumberger by the sum of (i) unvested restricted stock units; and (ii) the weighted average number ofcommon shares outstanding assuming dilution. The weighted average number of common shares outstandingassuming dilution assumes (a) that all stock options which are in the money are exercised at the beginning ofthe period and that the proceeds are used by Schlumberger to purchase shares at the average market price forthe period, and (b) the conversion of the convertible debentures.
44
Part II, Item 8
The following is a reconciliation from basic earnings per share to diluted earnings per share fromcontinuing operations for each of the last three years:
(Stated in million except per share amounts)
SchlumbergerIncome from
ContinuingOperations
WeightedAverage
SharesOutstanding
EarningsPer Share
fromContinuingOperations
2009:Basic $ 3,156 1,198 $ 2.63
Assumed conversion of debentures 8 8Assumed exercise of stock options – 7Unvested restricted stock – 1
Diluted $ 3,164 1,214 $ 2.61
2008:Basic $ 5,397 1,196 $ 4.51
Assumed conversion of debentures 12 13Assumed exercise of stock options – 13Unvested restricted stock – 2
Diluted $ 5,409 1,224 $ 4.42
2007:Basic $ 5,177 1,188 $ 4.36
Assumed conversion of debentures 24 29Assumed exercise of stock options – 21Unvested restricted stock – 1
Diluted $ 5,201 1,239 $ 4.20
Employee stock options to purchase approximately 17.1 million, 5.8 million and 0.8 million shares of commonstock at December 31, 2009, 2008 and 2007, respectively, were outstanding but not included in thecomputation of diluted earnings per share because the option exercise price was greater than the averagemarket price of the common stock, and therefore, the effect on diluted earnings per share would have beenanti-dilutive.
Recently Issued Accounting Pronouncements
Effective, January 1, 2009, Schlumberger adopted newly issued accounting guidance that changed theaccounting for, and reporting of, minority interest (now referred to as noncontrolling interests).Noncontrolling interests are now classified as Equity in the Schlumberger Consolidated Balance Sheet.
The new guidance also changed the way the consolidated income statement is presented by requiring netincome to include the net income for both the parent and the noncontrolling interests, with disclosure of bothamounts on the consolidated statement of income. The calculation of earnings per share continues to be basedon income amounts attributable to the parent.
Prior period amounts related to noncontrolling interests have been reclassified to conform to the currentperiod presentation.
45
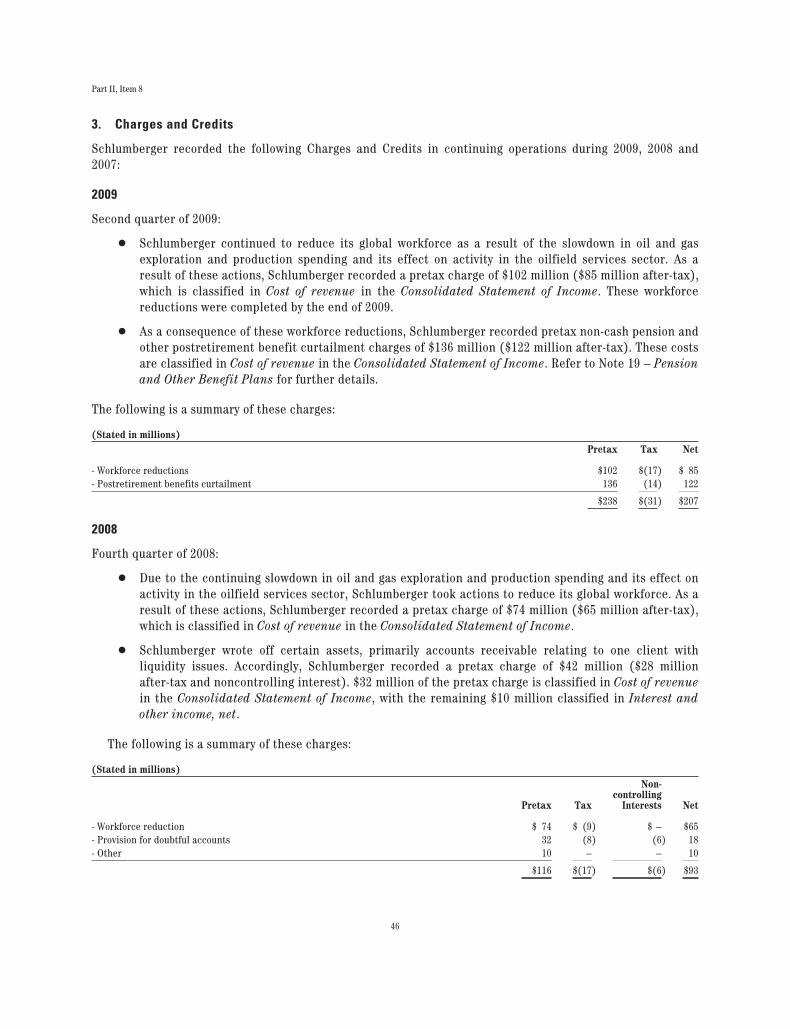
Part II, Item 8
3. Charges and Credits
Schlumberger recorded the following Charges and Credits in continuing operations during 2009, 2008 and2007:
2009
Second quarter of 2009:
Š Schlumberger continued to reduce its global workforce as a result of the slowdown in oil and gasexploration and production spending and its effect on activity in the oilfield services sector. As aresult of these actions, Schlumberger recorded a pretax charge of $102 million ($85 million after-tax),which is classified in Cost of revenue in the Consolidated Statement of Income. These workforcereductions were completed by the end of 2009.
Š As a consequence of these workforce reductions, Schlumberger recorded pretax non-cash pension andother postretirement benefit curtailment charges of $136 million ($122 million after-tax). These costsare classified in Cost of revenue in the Consolidated Statement of Income. Refer to Note 19 – Pensionand Other Benefit Plans for further details.
The following is a summary of these charges:
(Stated in millions)Pretax Tax Net
- Workforce reductions $102 $(17) $ 85- Postretirement benefits curtailment 136 (14) 122
$238 $(31) $207
2008
Fourth quarter of 2008:
Š Due to the continuing slowdown in oil and gas exploration and production spending and its effect onactivity in the oilfield services sector, Schlumberger took actions to reduce its global workforce. As aresult of these actions, Schlumberger recorded a pretax charge of $74 million ($65 million after-tax),which is classified in Cost of revenue in the Consolidated Statement of Income.
Š Schlumberger wrote off certain assets, primarily accounts receivable relating to one client withliquidity issues. Accordingly, Schlumberger recorded a pretax charge of $42 million ($28 millionafter-tax and noncontrolling interest). $32 million of the pretax charge is classified in Cost of revenuein the Consolidated Statement of Income, with the remaining $10 million classified in Interest andother income, net.
The following is a summary of these charges:
(Stated in millions)
Pretax Tax
Non-controlling
Interests Net
- Workforce reduction $ 74 $ (9) $ – $65- Provision for doubtful accounts 32 (8) (6) 18- Other 10 – – 10
$116 $(17) $(6) $93
46
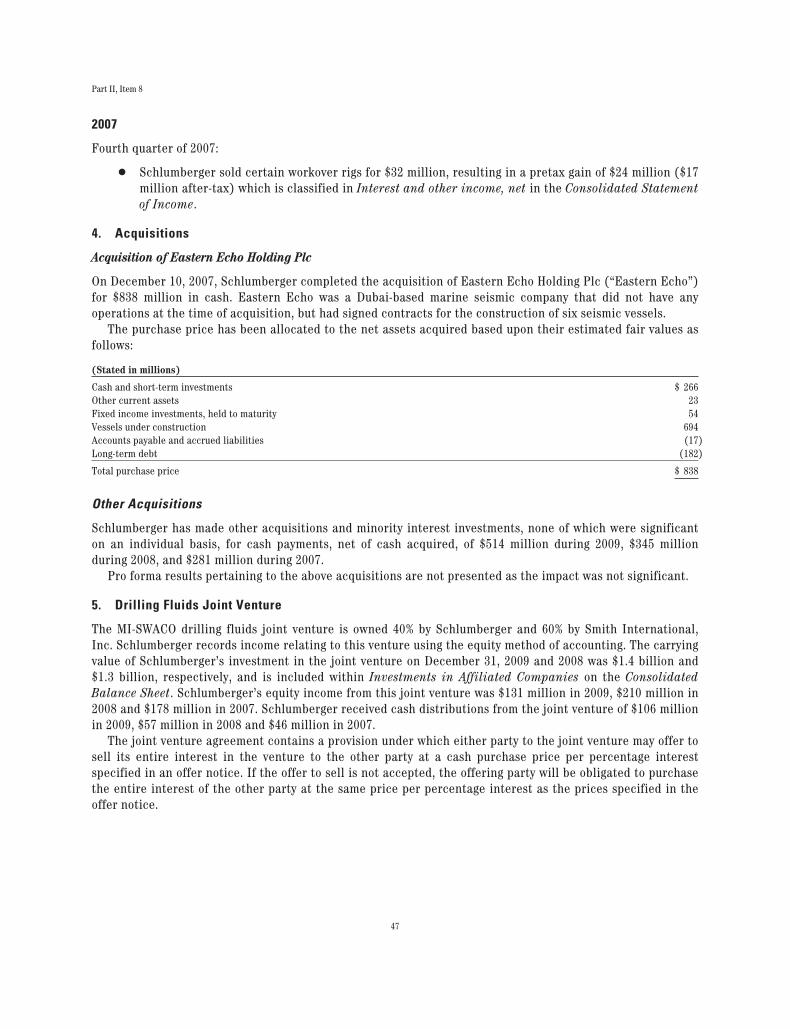
Part II, Item 8
2007
Fourth quarter of 2007:
Š Schlumberger sold certain workover rigs for $32 million, resulting in a pretax gain of $24 million ($17million after-tax) which is classified in Interest and other income, net in the Consolidated Statementof Income.
4. Acquisitions
Acquisition of Eastern Echo Holding Plc
On December 10, 2007, Schlumberger completed the acquisition of Eastern Echo Holding Plc (“Eastern Echo”)for $838 million in cash. Eastern Echo was a Dubai-based marine seismic company that did not have anyoperations at the time of acquisition, but had signed contracts for the construction of six seismic vessels.
The purchase price has been allocated to the net assets acquired based upon their estimated fair values asfollows:
(Stated in millions)
Cash and short-term investments $ 266Other current assets 23Fixed income investments, held to maturity 54Vessels under construction 694Accounts payable and accrued liabilities (17)Long-term debt (182)
Total purchase price $ 838
Other Acquisitions
Schlumberger has made other acquisitions and minority interest investments, none of which were significanton an individual basis, for cash payments, net of cash acquired, of $514 million during 2009, $345 millionduring 2008, and $281 million during 2007.
Pro forma results pertaining to the above acquisitions are not presented as the impact was not significant.
5. Drilling Fluids Joint Venture
The MI-SWACO drilling fluids joint venture is owned 40% by Schlumberger and 60% by Smith International,Inc. Schlumberger records income relating to this venture using the equity method of accounting. The carryingvalue of Schlumberger’s investment in the joint venture on December 31, 2009 and 2008 was $1.4 billion and$1.3 billion, respectively, and is included within Investments in Affiliated Companies on the ConsolidatedBalance Sheet. Schlumberger’s equity income from this joint venture was $131 million in 2009, $210 million in2008 and $178 million in 2007. Schlumberger received cash distributions from the joint venture of $106 millionin 2009, $57 million in 2008 and $46 million in 2007.
The joint venture agreement contains a provision under which either party to the joint venture may offer tosell its entire interest in the venture to the other party at a cash purchase price per percentage interestspecified in an offer notice. If the offer to sell is not accepted, the offering party will be obligated to purchasethe entire interest of the other party at the same price per percentage interest as the prices specified in theoffer notice.
47
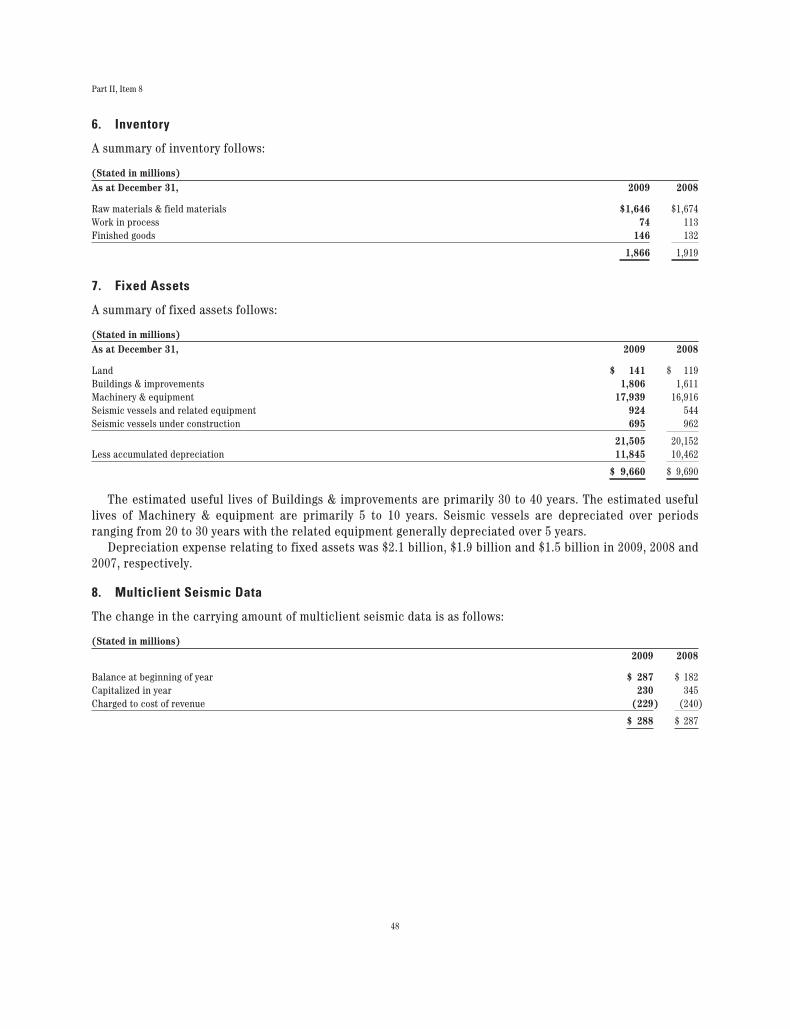
Part II, Item 8
6. Inventory
A summary of inventory follows:
(Stated in millions)As at December 31, 2009 2008
Raw materials & field materials $1,646 $1,674Work in process 74 113Finished goods 146 132
1,866 1,919
7. Fixed Assets
A summary of fixed assets follows:
(Stated in millions)As at December 31, 2009 2008
Land $ 141 $ 119Buildings & improvements 1,806 1,611Machinery & equipment 17,939 16,916Seismic vessels and related equipment 924 544Seismic vessels under construction 695 962
21,505 20,152Less accumulated depreciation 11,845 10,462
$ 9,660 $ 9,690
The estimated useful lives of Buildings & improvements are primarily 30 to 40 years. The estimated usefullives of Machinery & equipment are primarily 5 to 10 years. Seismic vessels are depreciated over periodsranging from 20 to 30 years with the related equipment generally depreciated over 5 years.
Depreciation expense relating to fixed assets was $2.1 billion, $1.9 billion and $1.5 billion in 2009, 2008 and2007, respectively.
8. Multiclient Seismic Data
The change in the carrying amount of multiclient seismic data is as follows:
(Stated in millions)2009 2008
Balance at beginning of year $ 287 $ 182Capitalized in year 230 345Charged to cost of revenue (229) (240)
$ 288 $ 287
48
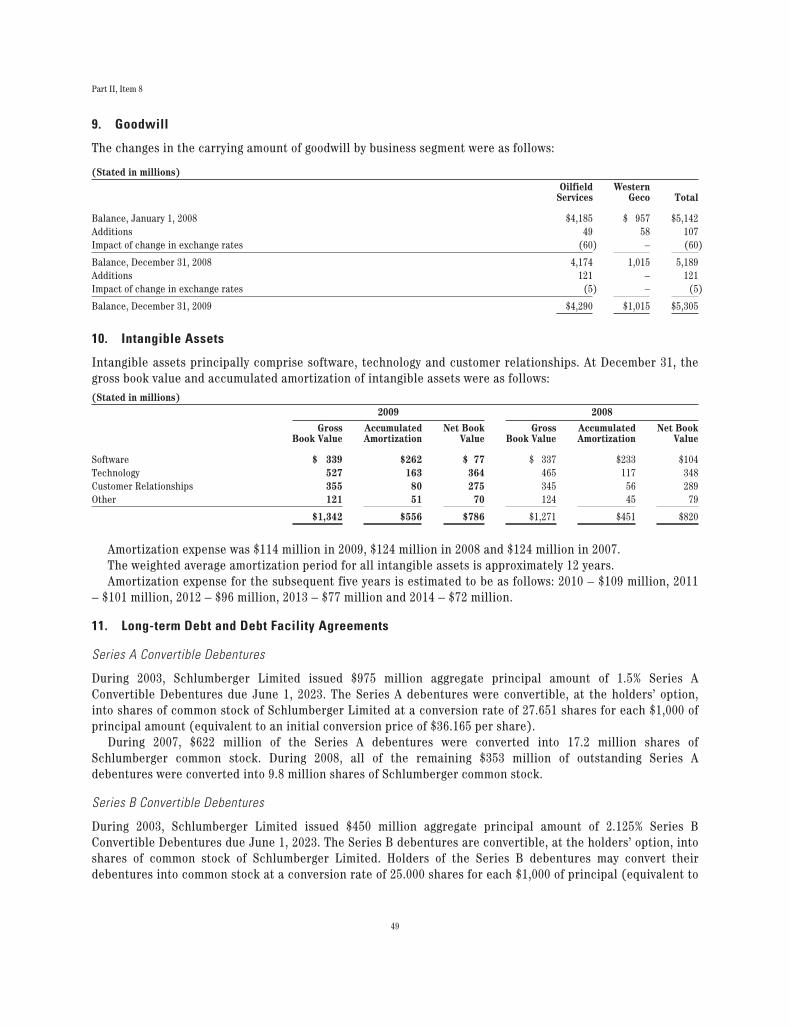
Part II, Item 8
9. Goodwill
The changes in the carrying amount of goodwill by business segment were as follows:
(Stated in millions)Oilfield
ServicesWestern
Geco Total
Balance, January 1, 2008 $4,185 $ 957 $5,142Additions 49 58 107Impact of change in exchange rates (60) – (60)
Balance, December 31, 2008 4,174 1,015 5,189Additions 121 – 121Impact of change in exchange rates (5) – (5)
Balance, December 31, 2009 $4,290 $1,015 $5,305
10. Intangible Assets
Intangible assets principally comprise software, technology and customer relationships. At December 31, thegross book value and accumulated amortization of intangible assets were as follows:(Stated in millions)
2009 2008
GrossBook Value
AccumulatedAmortization
Net BookValue
GrossBook Value
AccumulatedAmortization
Net BookValue
Software $ 339 $262 $ 77 $ 337 $233 $104Technology 527 163 364 465 117 348Customer Relationships 355 80 275 345 56 289Other 121 51 70 124 45 79
$1,342 $556 $786 $1,271 $451 $820
Amortization expense was $114 million in 2009, $124 million in 2008 and $124 million in 2007.The weighted average amortization period for all intangible assets is approximately 12 years.Amortization expense for the subsequent five years is estimated to be as follows: 2010 – $109 million, 2011
– $101 million, 2012 – $96 million, 2013 – $77 million and 2014 – $72 million.
11. Long-term Debt and Debt Facility Agreements
Series A Convertible Debentures
During 2003, Schlumberger Limited issued $975 million aggregate principal amount of 1.5% Series AConvertible Debentures due June 1, 2023. The Series A debentures were convertible, at the holders’ option,into shares of common stock of Schlumberger Limited at a conversion rate of 27.651 shares for each $1,000 ofprincipal amount (equivalent to an initial conversion price of $36.165 per share).
During 2007, $622 million of the Series A debentures were converted into 17.2 million shares ofSchlumberger common stock. During 2008, all of the remaining $353 million of outstanding Series Adebentures were converted into 9.8 million shares of Schlumberger common stock.
Series B Convertible Debentures
During 2003, Schlumberger Limited issued $450 million aggregate principal amount of 2.125% Series BConvertible Debentures due June 1, 2023. The Series B debentures are convertible, at the holders’ option, intoshares of common stock of Schlumberger Limited. Holders of the Series B debentures may convert theirdebentures into common stock at a conversion rate of 25.000 shares for each $1,000 of principal (equivalent to
49
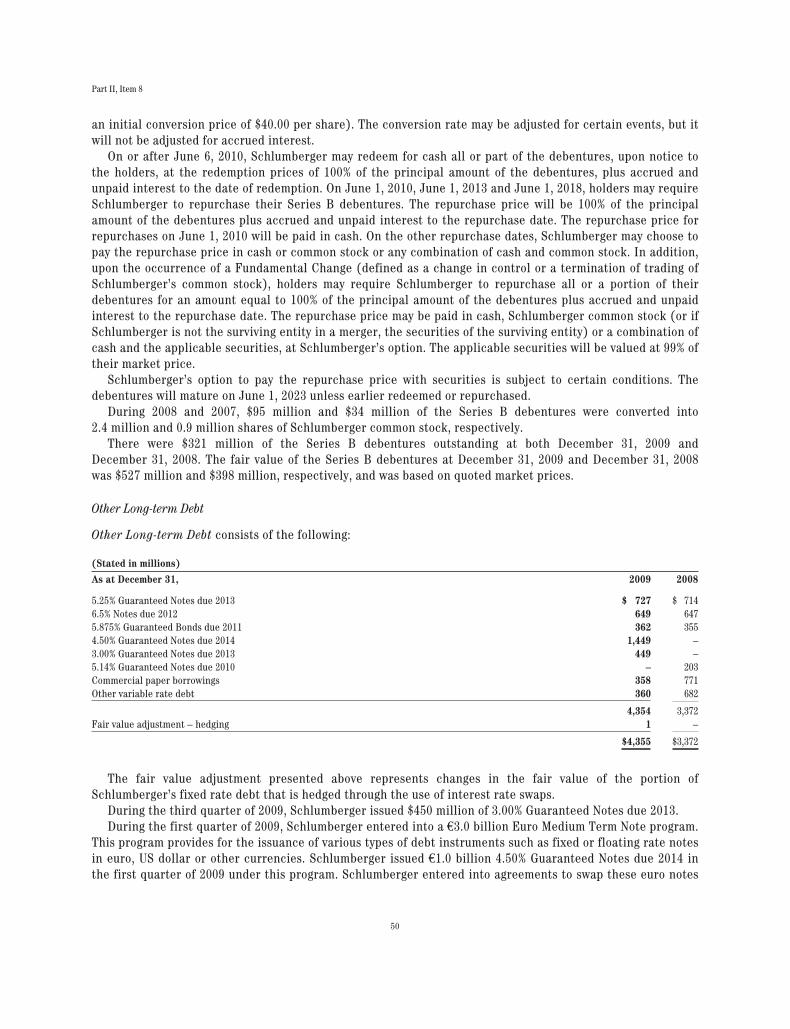
Part II, Item 8
an initial conversion price of $40.00 per share). The conversion rate may be adjusted for certain events, but itwill not be adjusted for accrued interest.
On or after June 6, 2010, Schlumberger may redeem for cash all or part of the debentures, upon notice tothe holders, at the redemption prices of 100% of the principal amount of the debentures, plus accrued andunpaid interest to the date of redemption. On June 1, 2010, June 1, 2013 and June 1, 2018, holders may requireSchlumberger to repurchase their Series B debentures. The repurchase price will be 100% of the principalamount of the debentures plus accrued and unpaid interest to the repurchase date. The repurchase price forrepurchases on June 1, 2010 will be paid in cash. On the other repurchase dates, Schlumberger may choose topay the repurchase price in cash or common stock or any combination of cash and common stock. In addition,upon the occurrence of a Fundamental Change (defined as a change in control or a termination of trading ofSchlumberger’s common stock), holders may require Schlumberger to repurchase all or a portion of theirdebentures for an amount equal to 100% of the principal amount of the debentures plus accrued and unpaidinterest to the repurchase date. The repurchase price may be paid in cash, Schlumberger common stock (or ifSchlumberger is not the surviving entity in a merger, the securities of the surviving entity) or a combination ofcash and the applicable securities, at Schlumberger’s option. The applicable securities will be valued at 99% oftheir market price.
Schlumberger’s option to pay the repurchase price with securities is subject to certain conditions. Thedebentures will mature on June 1, 2023 unless earlier redeemed or repurchased.
During 2008 and 2007, $95 million and $34 million of the Series B debentures were converted into2.4 million and 0.9 million shares of Schlumberger common stock, respectively.
There were $321 million of the Series B debentures outstanding at both December 31, 2009 andDecember 31, 2008. The fair value of the Series B debentures at December 31, 2009 and December 31, 2008was $527 million and $398 million, respectively, and was based on quoted market prices.
Other Long-term Debt
Other Long-term Debt consists of the following:
(Stated in millions)
As at December 31, 2009 2008
5.25% Guaranteed Notes due 2013 $ 727 $ 7146.5% Notes due 2012 649 6475.875% Guaranteed Bonds due 2011 362 3554.50% Guaranteed Notes due 2014 1,449 –3.00% Guaranteed Notes due 2013 449 –5.14% Guaranteed Notes due 2010 – 203Commercial paper borrowings 358 771Other variable rate debt 360 682
4,354 3,372Fair value adjustment – hedging 1 –
$4,355 $3,372
The fair value adjustment presented above represents changes in the fair value of the portion ofSchlumberger’s fixed rate debt that is hedged through the use of interest rate swaps.
During the third quarter of 2009, Schlumberger issued $450 million of 3.00% Guaranteed Notes due 2013.During the first quarter of 2009, Schlumberger entered into a €3.0 billion Euro Medium Term Note program.
This program provides for the issuance of various types of debt instruments such as fixed or floating rate notesin euro, US dollar or other currencies. Schlumberger issued €1.0 billion 4.50% Guaranteed Notes due 2014 inthe first quarter of 2009 under this program. Schlumberger entered into agreements to swap these euro notes
50
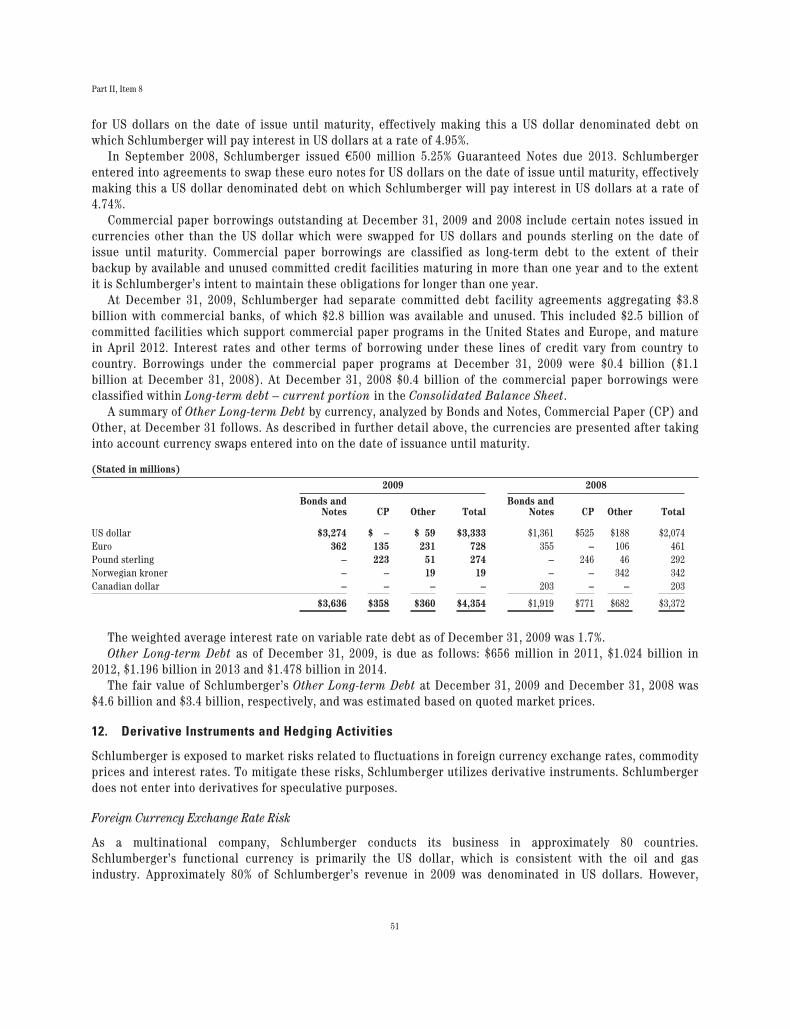
Part II, Item 8
for US dollars on the date of issue until maturity, effectively making this a US dollar denominated debt onwhich Schlumberger will pay interest in US dollars at a rate of 4.95%.
In September 2008, Schlumberger issued €500 million 5.25% Guaranteed Notes due 2013. Schlumbergerentered into agreements to swap these euro notes for US dollars on the date of issue until maturity, effectivelymaking this a US dollar denominated debt on which Schlumberger will pay interest in US dollars at a rate of4.74%.
Commercial paper borrowings outstanding at December 31, 2009 and 2008 include certain notes issued incurrencies other than the US dollar which were swapped for US dollars and pounds sterling on the date ofissue until maturity. Commercial paper borrowings are classified as long-term debt to the extent of theirbackup by available and unused committed credit facilities maturing in more than one year and to the extentit is Schlumberger’s intent to maintain these obligations for longer than one year.
At December 31, 2009, Schlumberger had separate committed debt facility agreements aggregating $3.8billion with commercial banks, of which $2.8 billion was available and unused. This included $2.5 billion ofcommitted facilities which support commercial paper programs in the United States and Europe, and maturein April 2012. Interest rates and other terms of borrowing under these lines of credit vary from country tocountry. Borrowings under the commercial paper programs at December 31, 2009 were $0.4 billion ($1.1billion at December 31, 2008). At December 31, 2008 $0.4 billion of the commercial paper borrowings wereclassified within Long-term debt – current portion in the Consolidated Balance Sheet.
A summary of Other Long-term Debt by currency, analyzed by Bonds and Notes, Commercial Paper (CP) andOther, at December 31 follows. As described in further detail above, the currencies are presented after takinginto account currency swaps entered into on the date of issuance until maturity.
(Stated in millions)
2009 2008
Bonds andNotes CP Other Total
Bonds andNotes CP Other Total
US dollar $3,274 $ – $ 59 $3,333 $1,361 $525 $188 $2,074Euro 362 135 231 728 355 – 106 461Pound sterling – 223 51 274 – 246 46 292Norwegian kroner – – 19 19 – – 342 342Canadian dollar – – – – 203 – – 203
$3,636 $358 $360 $4,354 $1,919 $771 $682 $3,372
The weighted average interest rate on variable rate debt as of December 31, 2009 was 1.7%.Other Long-term Debt as of December 31, 2009, is due as follows: $656 million in 2011, $1.024 billion in
2012, $1.196 billion in 2013 and $1.478 billion in 2014.The fair value of Schlumberger’s Other Long-term Debt at December 31, 2009 and December 31, 2008 was
$4.6 billion and $3.4 billion, respectively, and was estimated based on quoted market prices.
12. Derivative Instruments and Hedging Activities
Schlumberger is exposed to market risks related to fluctuations in foreign currency exchange rates, commodityprices and interest rates. To mitigate these risks, Schlumberger utilizes derivative instruments. Schlumbergerdoes not enter into derivatives for speculative purposes.
Foreign Currency Exchange Rate Risk
As a multinational company, Schlumberger conducts its business in approximately 80 countries.Schlumberger’s functional currency is primarily the US dollar, which is consistent with the oil and gasindustry. Approximately 80% of Schlumberger’s revenue in 2009 was denominated in US dollars. However,
51
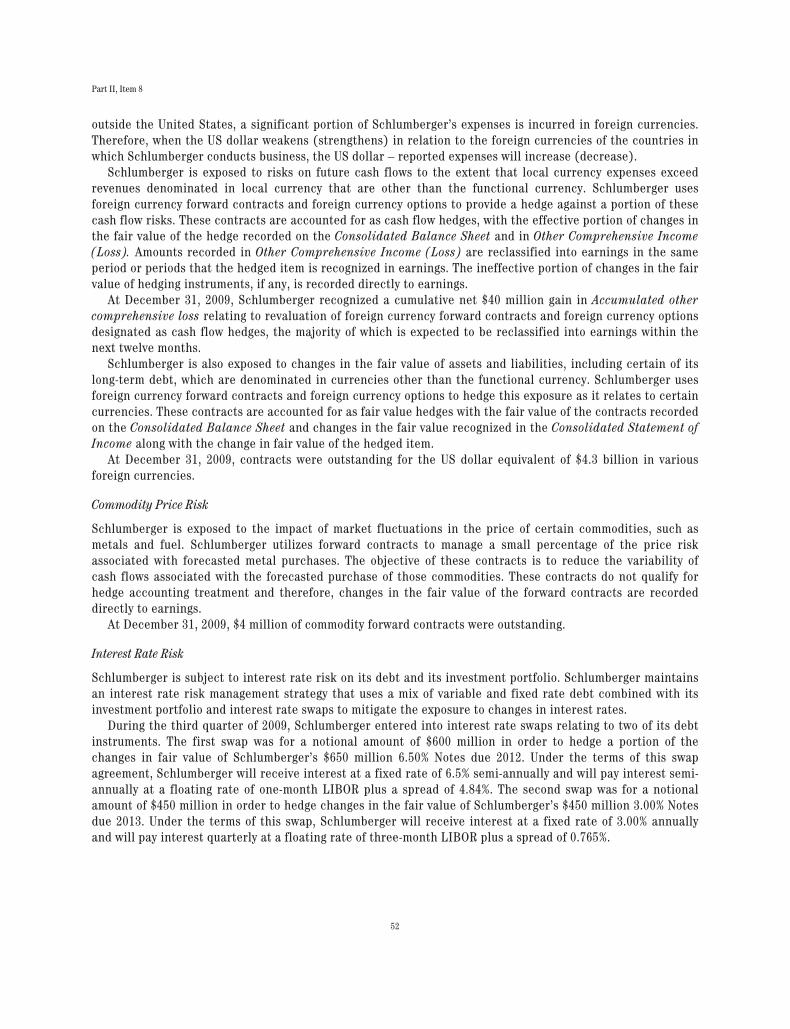
Part II, Item 8
outside the United States, a significant portion of Schlumberger’s expenses is incurred in foreign currencies.Therefore, when the US dollar weakens (strengthens) in relation to the foreign currencies of the countries inwhich Schlumberger conducts business, the US dollar – reported expenses will increase (decrease).
Schlumberger is exposed to risks on future cash flows to the extent that local currency expenses exceedrevenues denominated in local currency that are other than the functional currency. Schlumberger usesforeign currency forward contracts and foreign currency options to provide a hedge against a portion of thesecash flow risks. These contracts are accounted for as cash flow hedges, with the effective portion of changes inthe fair value of the hedge recorded on the Consolidated Balance Sheet and in Other Comprehensive Income(Loss). Amounts recorded in Other Comprehensive Income (Loss) are reclassified into earnings in the sameperiod or periods that the hedged item is recognized in earnings. The ineffective portion of changes in the fairvalue of hedging instruments, if any, is recorded directly to earnings.
At December 31, 2009, Schlumberger recognized a cumulative net $40 million gain in Accumulated othercomprehensive loss relating to revaluation of foreign currency forward contracts and foreign currency optionsdesignated as cash flow hedges, the majority of which is expected to be reclassified into earnings within thenext twelve months.
Schlumberger is also exposed to changes in the fair value of assets and liabilities, including certain of itslong-term debt, which are denominated in currencies other than the functional currency. Schlumberger usesforeign currency forward contracts and foreign currency options to hedge this exposure as it relates to certaincurrencies. These contracts are accounted for as fair value hedges with the fair value of the contracts recordedon the Consolidated Balance Sheet and changes in the fair value recognized in the Consolidated Statement ofIncome along with the change in fair value of the hedged item.
At December 31, 2009, contracts were outstanding for the US dollar equivalent of $4.3 billion in variousforeign currencies.
Commodity Price Risk
Schlumberger is exposed to the impact of market fluctuations in the price of certain commodities, such asmetals and fuel. Schlumberger utilizes forward contracts to manage a small percentage of the price riskassociated with forecasted metal purchases. The objective of these contracts is to reduce the variability ofcash flows associated with the forecasted purchase of those commodities. These contracts do not qualify forhedge accounting treatment and therefore, changes in the fair value of the forward contracts are recordeddirectly to earnings.
At December 31, 2009, $4 million of commodity forward contracts were outstanding.
Interest Rate Risk
Schlumberger is subject to interest rate risk on its debt and its investment portfolio. Schlumberger maintainsan interest rate risk management strategy that uses a mix of variable and fixed rate debt combined with itsinvestment portfolio and interest rate swaps to mitigate the exposure to changes in interest rates.
During the third quarter of 2009, Schlumberger entered into interest rate swaps relating to two of its debtinstruments. The first swap was for a notional amount of $600 million in order to hedge a portion of thechanges in fair value of Schlumberger’s $650 million 6.50% Notes due 2012. Under the terms of this swapagreement, Schlumberger will receive interest at a fixed rate of 6.5% semi-annually and will pay interest semi-annually at a floating rate of one-month LIBOR plus a spread of 4.84%. The second swap was for a notionalamount of $450 million in order to hedge changes in the fair value of Schlumberger’s $450 million 3.00% Notesdue 2013. Under the terms of this swap, Schlumberger will receive interest at a fixed rate of 3.00% annuallyand will pay interest quarterly at a floating rate of three-month LIBOR plus a spread of 0.765%.
52
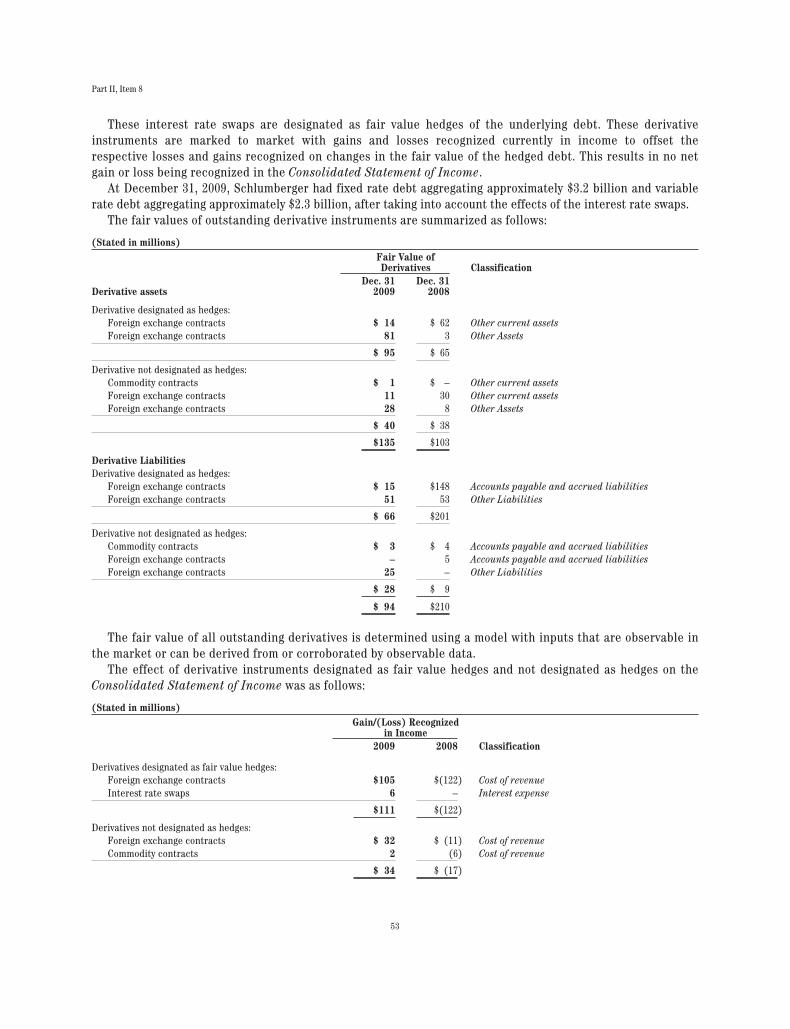
Part II, Item 8
These interest rate swaps are designated as fair value hedges of the underlying debt. These derivativeinstruments are marked to market with gains and losses recognized currently in income to offset therespective losses and gains recognized on changes in the fair value of the hedged debt. This results in no netgain or loss being recognized in the Consolidated Statement of Income.
At December 31, 2009, Schlumberger had fixed rate debt aggregating approximately $3.2 billion and variablerate debt aggregating approximately $2.3 billion, after taking into account the effects of the interest rate swaps.
The fair values of outstanding derivative instruments are summarized as follows:
(Stated in millions)Fair Value ofDerivatives Classification
Derivative assetsDec. 31
2009Dec. 31
2008
Derivative designated as hedges:Foreign exchange contracts $ 14 $ 62 Other current assetsForeign exchange contracts 81 3 Other Assets
$ 95 $ 65
Derivative not designated as hedges:Commodity contracts $ 1 $ – Other current assetsForeign exchange contracts 11 30 Other current assetsForeign exchange contracts 28 8 Other Assets
$ 40 $ 38
$135 $103
Derivative LiabilitiesDerivative designated as hedges:
Foreign exchange contracts $ 15 $148 Accounts payable and accrued liabilitiesForeign exchange contracts 51 53 Other Liabilities
$ 66 $201
Derivative not designated as hedges:Commodity contracts $ 3 $ 4 Accounts payable and accrued liabilitiesForeign exchange contracts – 5 Accounts payable and accrued liabilitiesForeign exchange contracts 25 – Other Liabilities
$ 28 $ 9
$ 94 $210
The fair value of all outstanding derivatives is determined using a model with inputs that are observable inthe market or can be derived from or corroborated by observable data.
The effect of derivative instruments designated as fair value hedges and not designated as hedges on theConsolidated Statement of Income was as follows:
(Stated in millions)Gain/(Loss) Recognized
in Income2009 2008 Classification
Derivatives designated as fair value hedges:Foreign exchange contracts $105 $(122) Cost of revenueInterest rate swaps 6 – Interest expense
$111 $(122)
Derivatives not designated as hedges:Foreign exchange contracts $ 32 $ (11) Cost of revenueCommodity contracts 2 (6) Cost of revenue
$ 34 $ (17)
53
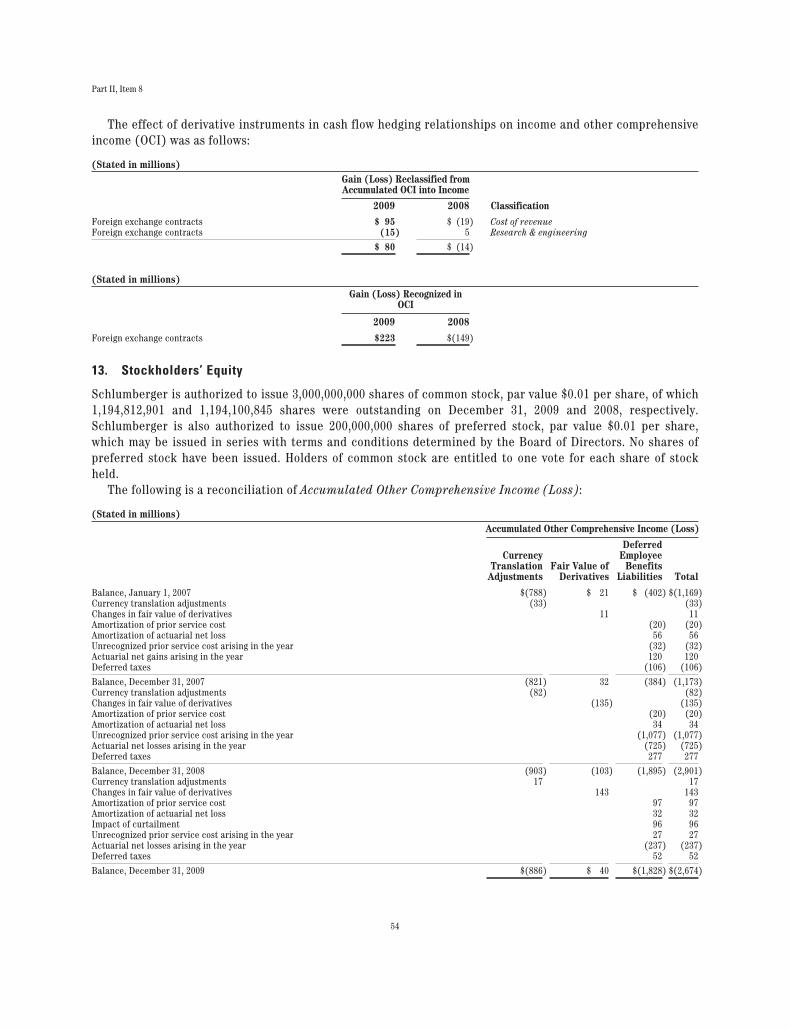
Part II, Item 8
The effect of derivative instruments in cash flow hedging relationships on income and other comprehensiveincome (OCI) was as follows:
(Stated in millions)Gain (Loss) Reclassified fromAccumulated OCI into Income
Classification2009 2008
Foreign exchange contracts $ 95 $ (19) Cost of revenueForeign exchange contracts (15) 5 Research & engineering
$ 80 $ (14)
(Stated in millions)Gain (Loss) Recognized in
OCI
2009 2008
Foreign exchange contracts $223 $(149)
13. Stockholders’ Equity
Schlumberger is authorized to issue 3,000,000,000 shares of common stock, par value $0.01 per share, of which1,194,812,901 and 1,194,100,845 shares were outstanding on December 31, 2009 and 2008, respectively.Schlumberger is also authorized to issue 200,000,000 shares of preferred stock, par value $0.01 per share,which may be issued in series with terms and conditions determined by the Board of Directors. No shares ofpreferred stock have been issued. Holders of common stock are entitled to one vote for each share of stockheld.
The following is a reconciliation of Accumulated Other Comprehensive Income (Loss):
(Stated in millions)Accumulated Other Comprehensive Income (Loss)
CurrencyTranslation
AdjustmentsFair Value of
Derivatives
DeferredEmployee
BenefitsLiabilities Total
Balance, January 1, 2007 $(788) $ 21 $ (402) $(1,169)Currency translation adjustments (33) (33)Changes in fair value of derivatives 11 11Amortization of prior service cost (20) (20)Amortization of actuarial net loss 56 56Unrecognized prior service cost arising in the year (32) (32)Actuarial net gains arising in the year 120 120Deferred taxes (106) (106)
Balance, December 31, 2007 (821) 32 (384) (1,173)Currency translation adjustments (82) (82)Changes in fair value of derivatives (135) (135)Amortization of prior service cost (20) (20)Amortization of actuarial net loss 34 34Unrecognized prior service cost arising in the year (1,077) (1,077)Actuarial net losses arising in the year (725) (725)Deferred taxes 277 277
Balance, December 31, 2008 (903) (103) (1,895) (2,901)Currency translation adjustments 17 17Changes in fair value of derivatives 143 143Amortization of prior service cost 97 97Amortization of actuarial net loss 32 32Impact of curtailment 96 96Unrecognized prior service cost arising in the year 27 27Actuarial net losses arising in the year (237) (237)Deferred taxes 52 52
Balance, December 31, 2009 $(886) $ 40 $(1,828) $(2,674)
54
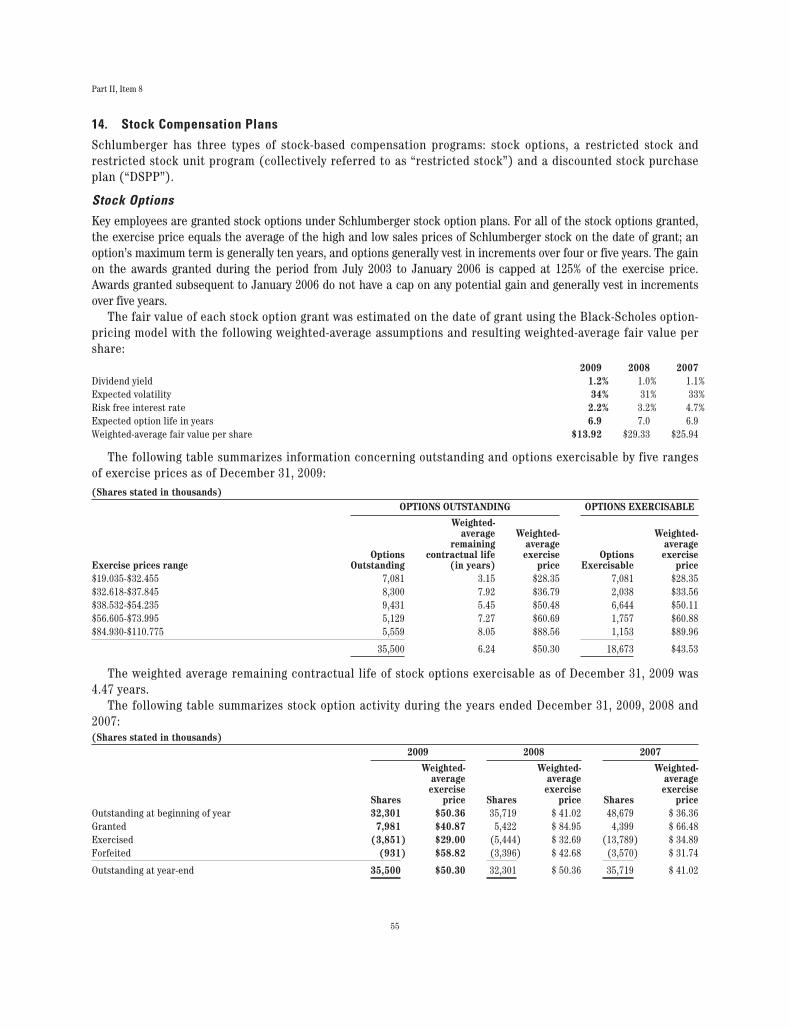
Part II, Item 8
14. Stock Compensation Plans
Schlumberger has three types of stock-based compensation programs: stock options, a restricted stock andrestricted stock unit program (collectively referred to as “restricted stock”) and a discounted stock purchaseplan (“DSPP”).
Stock Options
Key employees are granted stock options under Schlumberger stock option plans. For all of the stock options granted,the exercise price equals the average of the high and low sales prices of Schlumberger stock on the date of grant; anoption’s maximum term is generally ten years, and options generally vest in increments over four or five years. The gainon the awards granted during the period from July 2003 to January 2006 is capped at 125% of the exercise price.Awards granted subsequent to January 2006 do not have a cap on any potential gain and generally vest in incrementsover five years.
The fair value of each stock option grant was estimated on the date of grant using the Black-Scholes option-pricing model with the following weighted-average assumptions and resulting weighted-average fair value pershare:
2009 2008 2007Dividend yield 1.2% 1.0% 1.1%Expected volatility 34% 31% 33%Risk free interest rate 2.2% 3.2% 4.7%Expected option life in years 6.9 7.0 6.9Weighted-average fair value per share $13.92 $29.33 $25.94
The following table summarizes information concerning outstanding and options exercisable by five rangesof exercise prices as of December 31, 2009:(Shares stated in thousands)
OPTIONS OUTSTANDING OPTIONS EXERCISABLE
Exercise prices rangeOptions
Outstanding
Weighted-average
remainingcontractual life
(in years)
Weighted-averageexercise
priceOptions
Exercisable
Weighted-averageexercise
price$19.035-$32.455 7,081 3.15 $28.35 7,081 $28.35$32.618-$37.845 8,300 7.92 $36.79 2,038 $33.56$38.532-$54.235 9,431 5.45 $50.48 6,644 $50.11$56.605-$73.995 5,129 7.27 $60.69 1,757 $60.88$84.930-$110.775 5,559 8.05 $88.56 1,153 $89.96
35,500 6.24 $50.30 18,673 $43.53
The weighted average remaining contractual life of stock options exercisable as of December 31, 2009 was4.47 years.
The following table summarizes stock option activity during the years ended December 31, 2009, 2008 and2007:(Shares stated in thousands)
2009 2008 2007
Shares
Weighted-averageexercise
price Shares
Weighted-averageexercise
price Shares
Weighted-averageexercise
priceOutstanding at beginning of year 32,301 $50.36 35,719 $ 41.02 48,679 $ 36.36Granted 7,981 $40.87 5,422 $ 84.95 4,399 $ 66.48Exercised (3,851) $29.00 (5,444) $ 32.69 (13,789) $ 34.89Forfeited (931) $58.82 (3,396) $ 42.68 (3,570) $ 31.74
Outstanding at year-end 35,500 $50.30 32,301 $ 50.36 35,719 $ 41.02
55
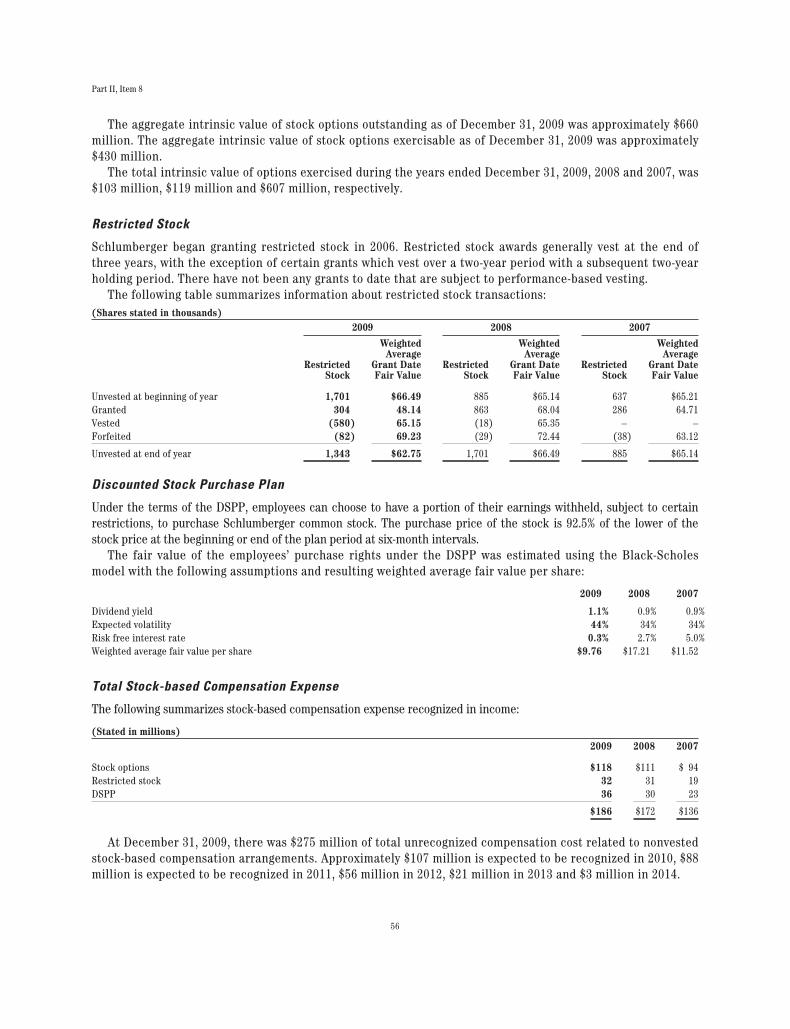
Part II, Item 8
The aggregate intrinsic value of stock options outstanding as of December 31, 2009 was approximately $660million. The aggregate intrinsic value of stock options exercisable as of December 31, 2009 was approximately$430 million.
The total intrinsic value of options exercised during the years ended December 31, 2009, 2008 and 2007, was$103 million, $119 million and $607 million, respectively.
Restricted Stock
Schlumberger began granting restricted stock in 2006. Restricted stock awards generally vest at the end ofthree years, with the exception of certain grants which vest over a two-year period with a subsequent two-yearholding period. There have not been any grants to date that are subject to performance-based vesting.
The following table summarizes information about restricted stock transactions:(Shares stated in thousands)
2009 2008 2007
RestrictedStock
WeightedAverage
Grant DateFair Value
RestrictedStock
WeightedAverage
Grant DateFair Value
RestrictedStock
WeightedAverage
Grant DateFair Value
Unvested at beginning of year 1,701 $66.49 885 $65.14 637 $65.21Granted 304 48.14 863 68.04 286 64.71Vested (580) 65.15 (18) 65.35 – –Forfeited (82) 69.23 (29) 72.44 (38) 63.12
Unvested at end of year 1,343 $62.75 1,701 $66.49 885 $65.14
Discounted Stock Purchase Plan
Under the terms of the DSPP, employees can choose to have a portion of their earnings withheld, subject to certainrestrictions, to purchase Schlumberger common stock. The purchase price of the stock is 92.5% of the lower of thestock price at the beginning or end of the plan period at six-month intervals.
The fair value of the employees’ purchase rights under the DSPP was estimated using the Black-Scholesmodel with the following assumptions and resulting weighted average fair value per share:
2009 2008 2007
Dividend yield 1.1% 0.9% 0.9%Expected volatility 44% 34% 34%Risk free interest rate 0.3% 2.7% 5.0%Weighted average fair value per share $9.76 $17.21 $11.52
Total Stock-based Compensation Expense
The following summarizes stock-based compensation expense recognized in income:
(Stated in millions)2009 2008 2007
Stock options $118 $111 $ 94Restricted stock 32 31 19DSPP 36 30 23
$186 $172 $136
At December 31, 2009, there was $275 million of total unrecognized compensation cost related to nonvestedstock-based compensation arrangements. Approximately $107 million is expected to be recognized in 2010, $88million is expected to be recognized in 2011, $56 million in 2012, $21 million in 2013 and $3 million in 2014.
56
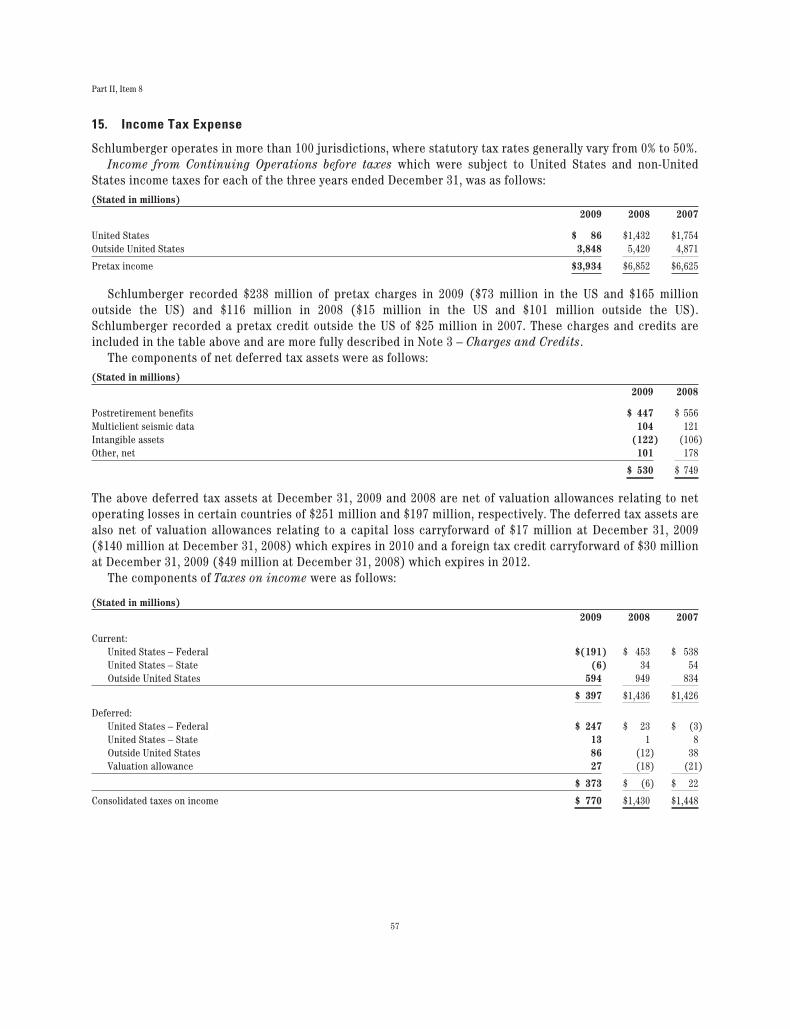
Part II, Item 8
15. Income Tax Expense
Schlumberger operates in more than 100 jurisdictions, where statutory tax rates generally vary from 0% to 50%.Income from Continuing Operations before taxes which were subject to United States and non-United
States income taxes for each of the three years ended December 31, was as follows:(Stated in millions)
2009 2008 2007
United States $ 86 $1,432 $1,754Outside United States 3,848 5,420 4,871
Pretax income $3,934 $6,852 $6,625
Schlumberger recorded $238 million of pretax charges in 2009 ($73 million in the US and $165 millionoutside the US) and $116 million in 2008 ($15 million in the US and $101 million outside the US).Schlumberger recorded a pretax credit outside the US of $25 million in 2007. These charges and credits areincluded in the table above and are more fully described in Note 3 – Charges and Credits.
The components of net deferred tax assets were as follows:(Stated in millions)
2009 2008
Postretirement benefits $ 447 $ 556Multiclient seismic data 104 121Intangible assets (122) (106)Other, net 101 178
$ 530 $ 749
The above deferred tax assets at December 31, 2009 and 2008 are net of valuation allowances relating to netoperating losses in certain countries of $251 million and $197 million, respectively. The deferred tax assets arealso net of valuation allowances relating to a capital loss carryforward of $17 million at December 31, 2009($140 million at December 31, 2008) which expires in 2010 and a foreign tax credit carryforward of $30 millionat December 31, 2009 ($49 million at December 31, 2008) which expires in 2012.
The components of Taxes on income were as follows:
(Stated in millions)2009 2008 2007
Current:United States – Federal $(191) $ 453 $ 538United States – State (6) 34 54Outside United States 594 949 834
$ 397 $1,436 $1,426
Deferred:United States – Federal $ 247 $ 23 $ (3)United States – State 13 1 8Outside United States 86 (12) 38Valuation allowance 27 (18) (21)
$ 373 $ (6) $ 22
Consolidated taxes on income $ 770 $1,430 $1,448
57
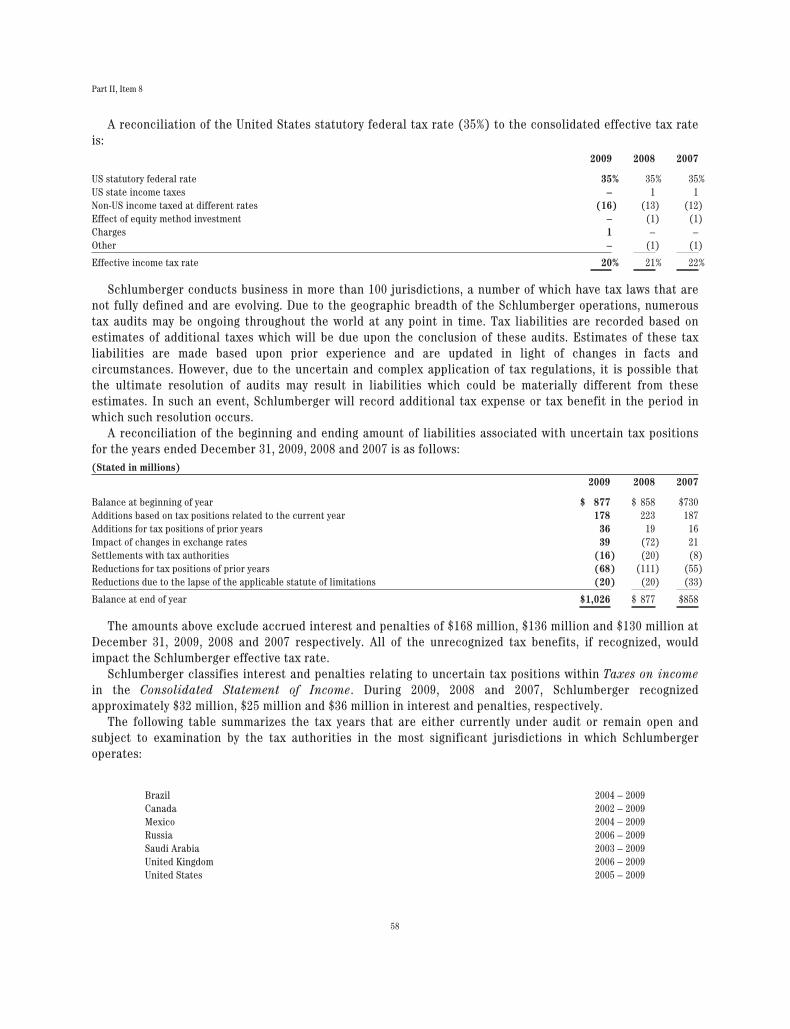
Part II, Item 8
A reconciliation of the United States statutory federal tax rate (35%) to the consolidated effective tax rateis:
2009 2008 2007
US statutory federal rate 35% 35% 35%US state income taxes – 1 1Non-US income taxed at different rates (16) (13) (12)Effect of equity method investment – (1) (1)Charges 1 – –Other – (1) (1)
Effective income tax rate 20% 21% 22%
Schlumberger conducts business in more than 100 jurisdictions, a number of which have tax laws that arenot fully defined and are evolving. Due to the geographic breadth of the Schlumberger operations, numeroustax audits may be ongoing throughout the world at any point in time. Tax liabilities are recorded based onestimates of additional taxes which will be due upon the conclusion of these audits. Estimates of these taxliabilities are made based upon prior experience and are updated in light of changes in facts andcircumstances. However, due to the uncertain and complex application of tax regulations, it is possible thatthe ultimate resolution of audits may result in liabilities which could be materially different from theseestimates. In such an event, Schlumberger will record additional tax expense or tax benefit in the period inwhich such resolution occurs.
A reconciliation of the beginning and ending amount of liabilities associated with uncertain tax positionsfor the years ended December 31, 2009, 2008 and 2007 is as follows:(Stated in millions)
2009 2008 2007
Balance at beginning of year $ 877 $ 858 $730Additions based on tax positions related to the current year 178 223 187Additions for tax positions of prior years 36 19 16Impact of changes in exchange rates 39 (72) 21Settlements with tax authorities (16) (20) (8)Reductions for tax positions of prior years (68) (111) (55)Reductions due to the lapse of the applicable statute of limitations (20) (20) (33)
Balance at end of year $1,026 $ 877 $858
The amounts above exclude accrued interest and penalties of $168 million, $136 million and $130 million atDecember 31, 2009, 2008 and 2007 respectively. All of the unrecognized tax benefits, if recognized, wouldimpact the Schlumberger effective tax rate.
Schlumberger classifies interest and penalties relating to uncertain tax positions within Taxes on incomein the Consolidated Statement of Income. During 2009, 2008 and 2007, Schlumberger recognizedapproximately $32 million, $25 million and $36 million in interest and penalties, respectively.
The following table summarizes the tax years that are either currently under audit or remain open andsubject to examination by the tax authorities in the most significant jurisdictions in which Schlumbergeroperates:
Brazil 2004 – 2009Canada 2002 – 2009Mexico 2004 – 2009Russia 2006 – 2009Saudi Arabia 2003 – 2009United Kingdom 2006 – 2009United States 2005 – 2009
58
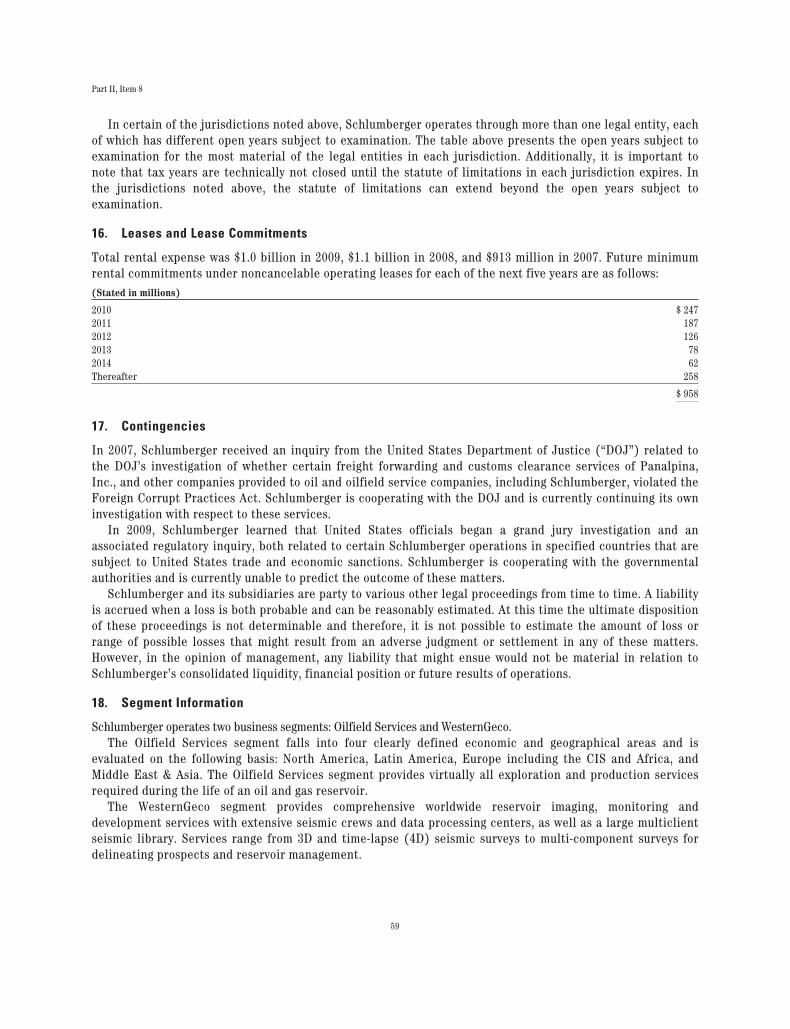
Part II, Item 8
In certain of the jurisdictions noted above, Schlumberger operates through more than one legal entity, eachof which has different open years subject to examination. The table above presents the open years subject toexamination for the most material of the legal entities in each jurisdiction. Additionally, it is important tonote that tax years are technically not closed until the statute of limitations in each jurisdiction expires. Inthe jurisdictions noted above, the statute of limitations can extend beyond the open years subject toexamination.
16. Leases and Lease Commitments
Total rental expense was $1.0 billion in 2009, $1.1 billion in 2008, and $913 million in 2007. Future minimumrental commitments under noncancelable operating leases for each of the next five years are as follows:(Stated in millions)
2010 $ 2472011 1872012 1262013 782014 62Thereafter 258
$ 958
17. Contingencies
In 2007, Schlumberger received an inquiry from the United States Department of Justice (“DOJ”) related tothe DOJ’s investigation of whether certain freight forwarding and customs clearance services of Panalpina,Inc., and other companies provided to oil and oilfield service companies, including Schlumberger, violated theForeign Corrupt Practices Act. Schlumberger is cooperating with the DOJ and is currently continuing its owninvestigation with respect to these services.
In 2009, Schlumberger learned that United States officials began a grand jury investigation and anassociated regulatory inquiry, both related to certain Schlumberger operations in specified countries that aresubject to United States trade and economic sanctions. Schlumberger is cooperating with the governmentalauthorities and is currently unable to predict the outcome of these matters.
Schlumberger and its subsidiaries are party to various other legal proceedings from time to time. A liabilityis accrued when a loss is both probable and can be reasonably estimated. At this time the ultimate dispositionof these proceedings is not determinable and therefore, it is not possible to estimate the amount of loss orrange of possible losses that might result from an adverse judgment or settlement in any of these matters.However, in the opinion of management, any liability that might ensue would not be material in relation toSchlumberger’s consolidated liquidity, financial position or future results of operations.
18. Segment Information
Schlumberger operates two business segments: Oilfield Services and WesternGeco.The Oilfield Services segment falls into four clearly defined economic and geographical areas and is
evaluated on the following basis: North America, Latin America, Europe including the CIS and Africa, andMiddle East & Asia. The Oilfield Services segment provides virtually all exploration and production servicesrequired during the life of an oil and gas reservoir.
The WesternGeco segment provides comprehensive worldwide reservoir imaging, monitoring anddevelopment services with extensive seismic crews and data processing centers, as well as a large multiclientseismic library. Services range from 3D and time-lapse (4D) seismic surveys to multi-component surveys fordelineating prospects and reservoir management.
59
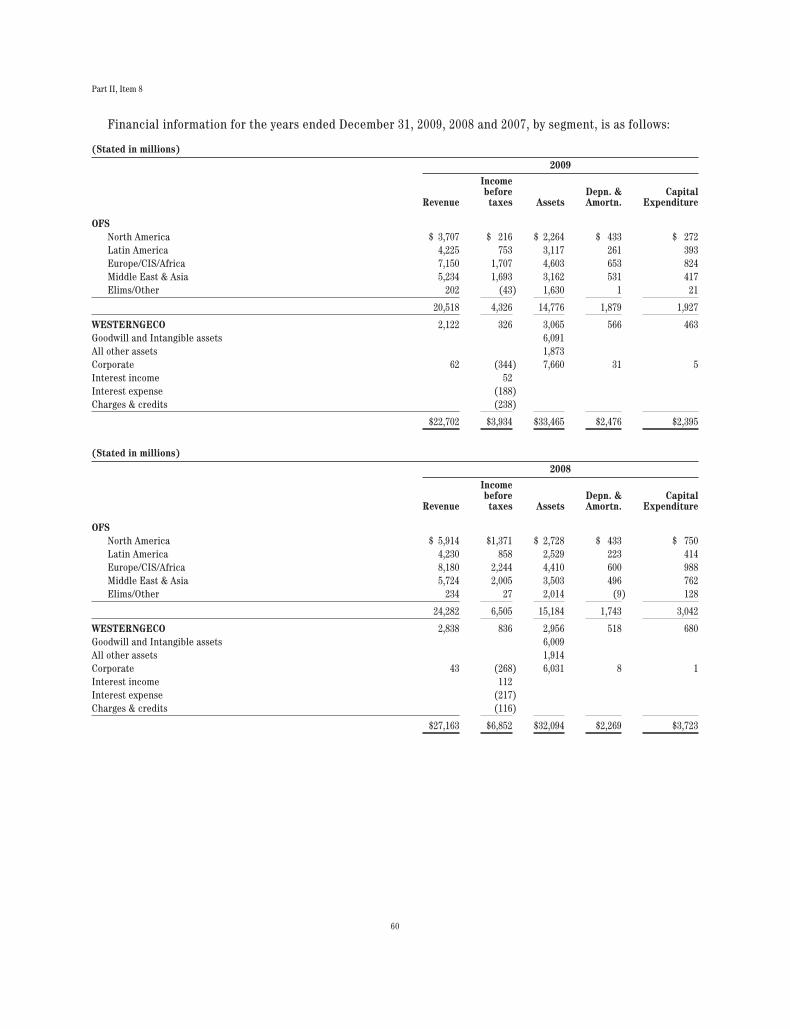
Part II, Item 8
Financial information for the years ended December 31, 2009, 2008 and 2007, by segment, is as follows:
(Stated in millions)
2009
Revenue
Incomebeforetaxes Assets
Depn. &Amortn.
CapitalExpenditure
OFSNorth America $ 3,707 $ 216 $ 2,264 $ 433 $ 272Latin America 4,225 753 3,117 261 393Europe/CIS/Africa 7,150 1,707 4,603 653 824Middle East & Asia 5,234 1,693 3,162 531 417Elims/Other 202 (43) 1,630 1 21
20,518 4,326 14,776 1,879 1,927
WESTERNGECO 2,122 326 3,065 566 463Goodwill and Intangible assets 6,091All other assets 1,873Corporate 62 (344) 7,660 31 5Interest income 52Interest expense (188)Charges & credits (238)
$22,702 $3,934 $33,465 $2,476 $2,395
(Stated in millions)
2008
Revenue
Incomebeforetaxes Assets
Depn. &Amortn.
CapitalExpenditure
OFSNorth America $ 5,914 $1,371 $ 2,728 $ 433 $ 750Latin America 4,230 858 2,529 223 414Europe/CIS/Africa 8,180 2,244 4,410 600 988Middle East & Asia 5,724 2,005 3,503 496 762Elims/Other 234 27 2,014 (9) 128
24,282 6,505 15,184 1,743 3,042
WESTERNGECO 2,838 836 2,956 518 680Goodwill and Intangible assets 6,009All other assets 1,914Corporate 43 (268) 6,031 8 1Interest income 112Interest expense (217)Charges & credits (116)
$27,163 $6,852 $32,094 $2,269 $3,723
60
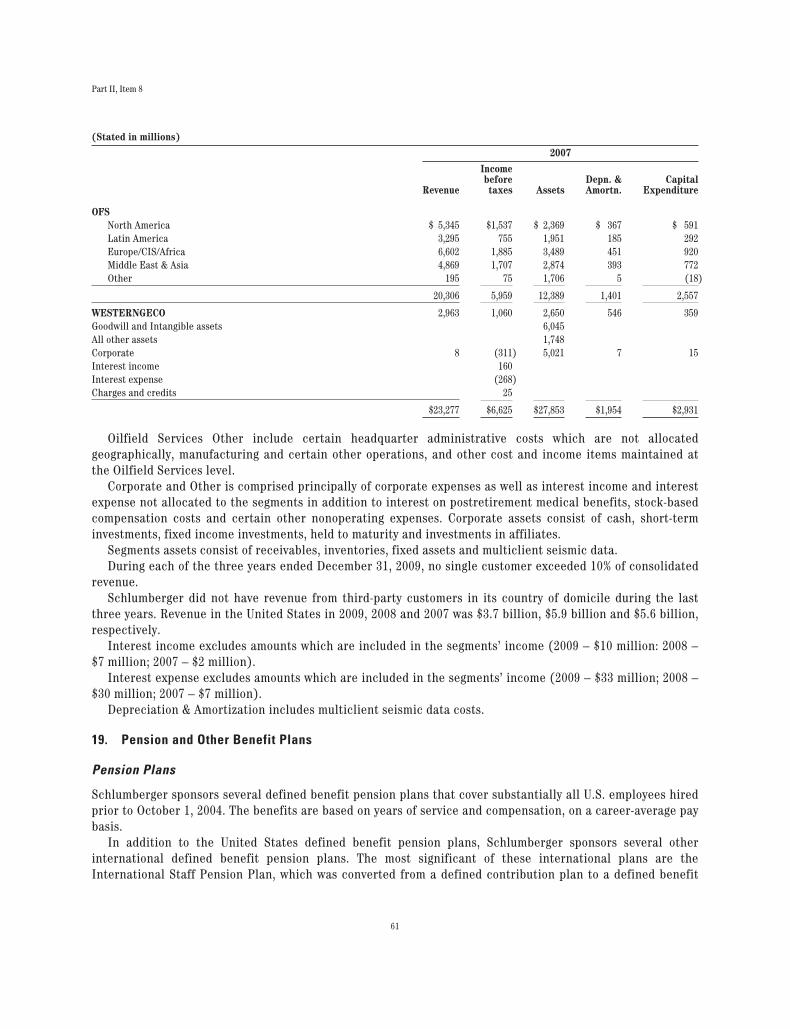
Part II, Item 8
(Stated in millions)
2007
Revenue
Incomebeforetaxes Assets
Depn. &Amortn.
CapitalExpenditure
OFSNorth America $ 5,345 $1,537 $ 2,369 $ 367 $ 591Latin America 3,295 755 1,951 185 292Europe/CIS/Africa 6,602 1,885 3,489 451 920Middle East & Asia 4,869 1,707 2,874 393 772Other 195 75 1,706 5 (18)
20,306 5,959 12,389 1,401 2,557
WESTERNGECO 2,963 1,060 2,650 546 359Goodwill and Intangible assets 6,045All other assets 1,748Corporate 8 (311) 5,021 7 15Interest income 160Interest expense (268)Charges and credits 25
$23,277 $6,625 $27,853 $1,954 $2,931
Oilfield Services Other include certain headquarter administrative costs which are not allocatedgeographically, manufacturing and certain other operations, and other cost and income items maintained atthe Oilfield Services level.
Corporate and Other is comprised principally of corporate expenses as well as interest income and interestexpense not allocated to the segments in addition to interest on postretirement medical benefits, stock-basedcompensation costs and certain other nonoperating expenses. Corporate assets consist of cash, short-terminvestments, fixed income investments, held to maturity and investments in affiliates.
Segments assets consist of receivables, inventories, fixed assets and multiclient seismic data.During each of the three years ended December 31, 2009, no single customer exceeded 10% of consolidated
revenue.Schlumberger did not have revenue from third-party customers in its country of domicile during the last
three years. Revenue in the United States in 2009, 2008 and 2007 was $3.7 billion, $5.9 billion and $5.6 billion,respectively.
Interest income excludes amounts which are included in the segments’ income (2009 – $10 million: 2008 –$7 million; 2007 – $2 million).
Interest expense excludes amounts which are included in the segments’ income (2009 – $33 million; 2008 –$30 million; 2007 – $7 million).
Depreciation & Amortization includes multiclient seismic data costs.
19. Pension and Other Benefit Plans
Pension Plans
Schlumberger sponsors several defined benefit pension plans that cover substantially all U.S. employees hiredprior to October 1, 2004. The benefits are based on years of service and compensation, on a career-average paybasis.
In addition to the United States defined benefit pension plans, Schlumberger sponsors several otherinternational defined benefit pension plans. The most significant of these international plans are theInternational Staff Pension Plan, which was converted from a defined contribution plan to a defined benefit
61
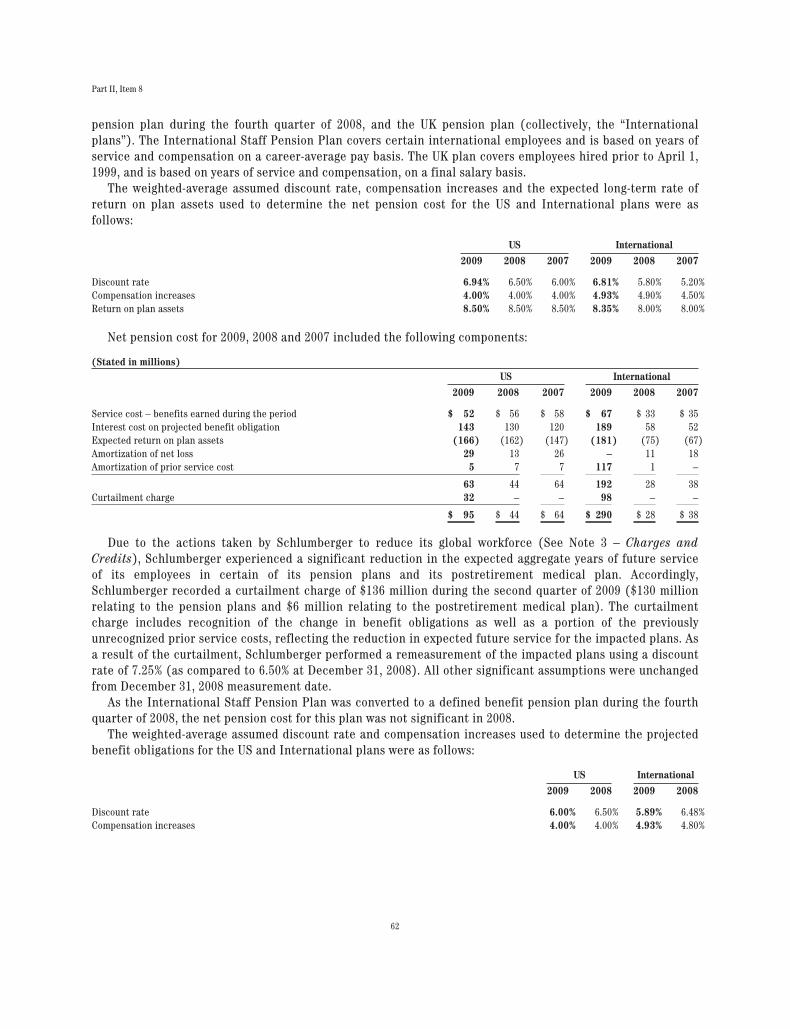
Part II, Item 8
pension plan during the fourth quarter of 2008, and the UK pension plan (collectively, the “Internationalplans”). The International Staff Pension Plan covers certain international employees and is based on years ofservice and compensation on a career-average pay basis. The UK plan covers employees hired prior to April 1,1999, and is based on years of service and compensation, on a final salary basis.
The weighted-average assumed discount rate, compensation increases and the expected long-term rate ofreturn on plan assets used to determine the net pension cost for the US and International plans were asfollows:
US International
2009 2008 2007 2009 2008 2007
Discount rate 6.94% 6.50% 6.00% 6.81% 5.80% 5.20%Compensation increases 4.00% 4.00% 4.00% 4.93% 4.90% 4.50%Return on plan assets 8.50% 8.50% 8.50% 8.35% 8.00% 8.00%
Net pension cost for 2009, 2008 and 2007 included the following components:
(Stated in millions)US International
2009 2008 2007 2009 2008 2007
Service cost – benefits earned during the period $ 52 $ 56 $ 58 $ 67 $ 33 $ 35Interest cost on projected benefit obligation 143 130 120 189 58 52Expected return on plan assets (166) (162) (147) (181) (75) (67)Amortization of net loss 29 13 26 – 11 18Amortization of prior service cost 5 7 7 117 1 –
63 44 64 192 28 38Curtailment charge 32 – – 98 – –
$ 95 $ 44 $ 64 $ 290 $ 28 $ 38
Due to the actions taken by Schlumberger to reduce its global workforce (See Note 3 – Charges andCredits), Schlumberger experienced a significant reduction in the expected aggregate years of future serviceof its employees in certain of its pension plans and its postretirement medical plan. Accordingly,Schlumberger recorded a curtailment charge of $136 million during the second quarter of 2009 ($130 millionrelating to the pension plans and $6 million relating to the postretirement medical plan). The curtailmentcharge includes recognition of the change in benefit obligations as well as a portion of the previouslyunrecognized prior service costs, reflecting the reduction in expected future service for the impacted plans. Asa result of the curtailment, Schlumberger performed a remeasurement of the impacted plans using a discountrate of 7.25% (as compared to 6.50% at December 31, 2008). All other significant assumptions were unchangedfrom December 31, 2008 measurement date.
As the International Staff Pension Plan was converted to a defined benefit pension plan during the fourthquarter of 2008, the net pension cost for this plan was not significant in 2008.
The weighted-average assumed discount rate and compensation increases used to determine the projectedbenefit obligations for the US and International plans were as follows:
US International
2009 2008 2009 2008
Discount rate 6.00% 6.50% 5.89% 6.48%Compensation increases 4.00% 4.00% 4.93% 4.80%
62
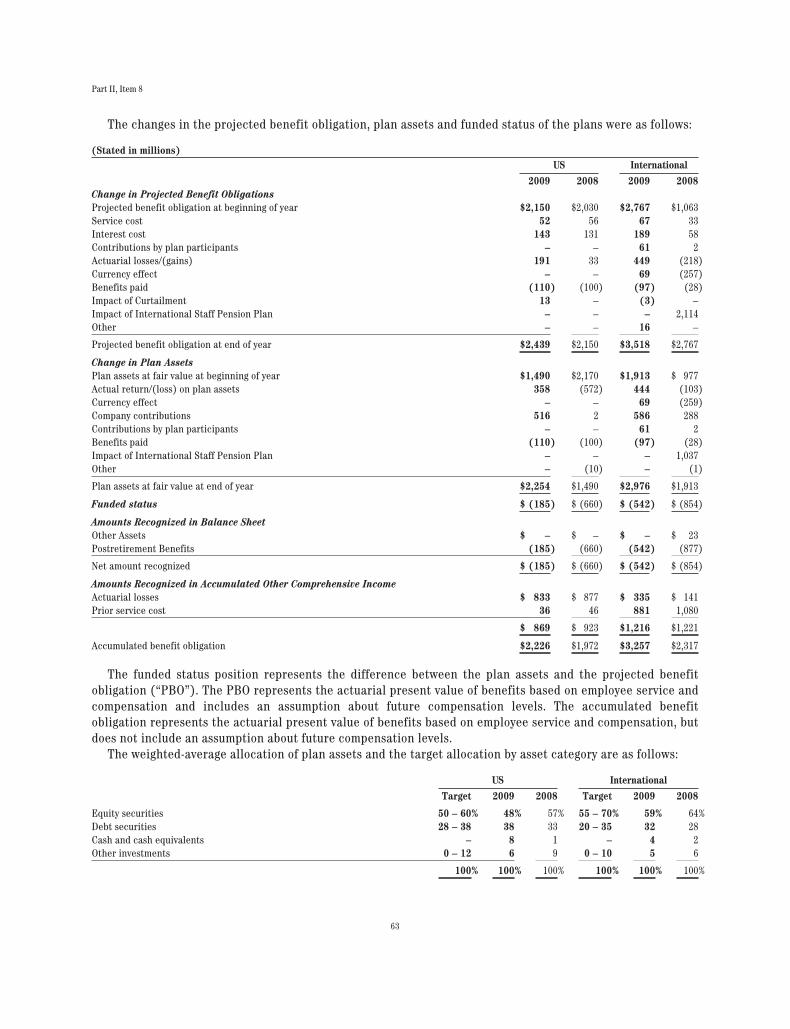
Part II, Item 8
The changes in the projected benefit obligation, plan assets and funded status of the plans were as follows:
(Stated in millions)US International
2009 2008 2009 2008Change in Projected Benefit ObligationsProjected benefit obligation at beginning of year $2,150 $2,030 $2,767 $1,063Service cost 52 56 67 33Interest cost 143 131 189 58Contributions by plan participants – – 61 2Actuarial losses/(gains) 191 33 449 (218)Currency effect – – 69 (257)Benefits paid (110) (100) (97) (28)Impact of Curtailment 13 – (3) –Impact of International Staff Pension Plan – – – 2,114Other – – 16 –
Projected benefit obligation at end of year $2,439 $2,150 $3,518 $2,767
Change in Plan AssetsPlan assets at fair value at beginning of year $1,490 $2,170 $1,913 $ 977Actual return/(loss) on plan assets 358 (572) 444 (103)Currency effect – – 69 (259)Company contributions 516 2 586 288Contributions by plan participants – – 61 2Benefits paid (110) (100) (97) (28)Impact of International Staff Pension Plan – – – 1,037Other – (10) – (1)
Plan assets at fair value at end of year $2,254 $1,490 $2,976 $1,913
Funded status $ (185) $ (660) $ (542) $ (854)
Amounts Recognized in Balance SheetOther Assets $ – $ – $ – $ 23Postretirement Benefits (185) (660) (542) (877)
Net amount recognized $ (185) $ (660) $ (542) $ (854)
Amounts Recognized in Accumulated Other Comprehensive IncomeActuarial losses $ 833 $ 877 $ 335 $ 141Prior service cost 36 46 881 1,080
$ 869 $ 923 $1,216 $1,221
Accumulated benefit obligation $2,226 $1,972 $3,257 $2,317
The funded status position represents the difference between the plan assets and the projected benefitobligation (“PBO”). The PBO represents the actuarial present value of benefits based on employee service andcompensation and includes an assumption about future compensation levels. The accumulated benefitobligation represents the actuarial present value of benefits based on employee service and compensation, butdoes not include an assumption about future compensation levels.
The weighted-average allocation of plan assets and the target allocation by asset category are as follows:
US International
Target 2009 2008 Target 2009 2008
Equity securities 50 – 60% 48% 57% 55 – 70% 59% 64%Debt securities 28 – 38 38 33 20 – 35 32 28Cash and cash equivalents – 8 1 – 4 2Other investments 0 – 12 6 9 0 – 10 5 6
100% 100% 100% 100% 100% 100%
63
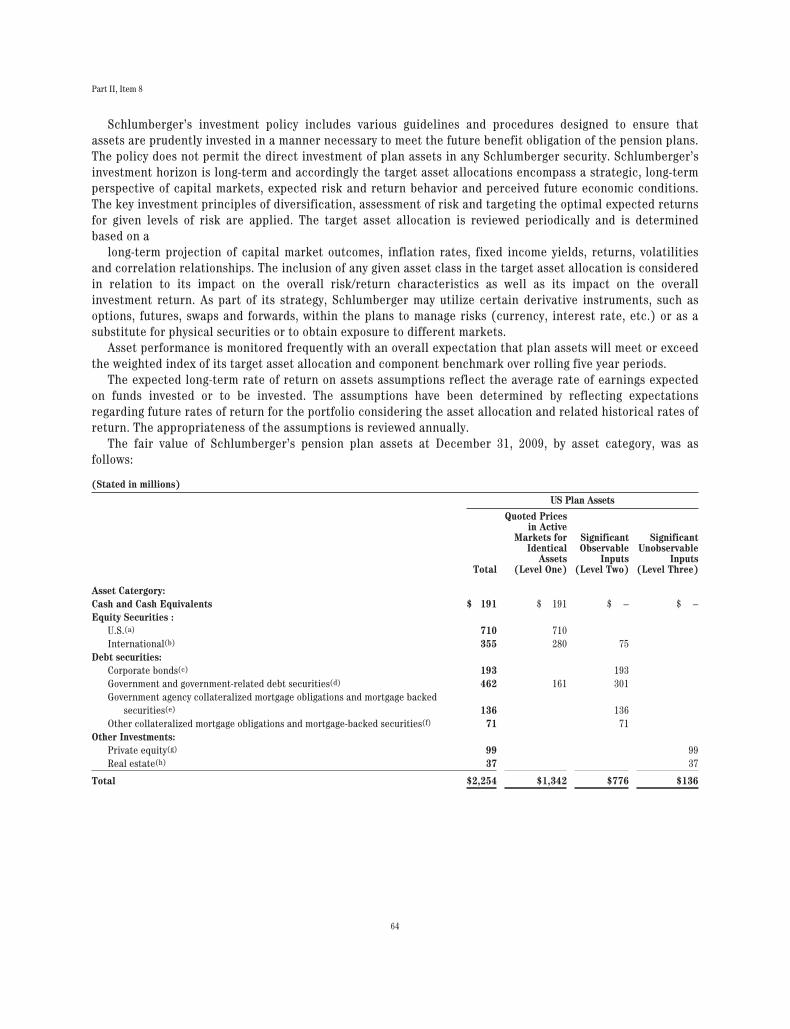
Part II, Item 8
Schlumberger’s investment policy includes various guidelines and procedures designed to ensure thatassets are prudently invested in a manner necessary to meet the future benefit obligation of the pension plans.The policy does not permit the direct investment of plan assets in any Schlumberger security. Schlumberger’sinvestment horizon is long-term and accordingly the target asset allocations encompass a strategic, long-termperspective of capital markets, expected risk and return behavior and perceived future economic conditions.The key investment principles of diversification, assessment of risk and targeting the optimal expected returnsfor given levels of risk are applied. The target asset allocation is reviewed periodically and is determinedbased on a
long-term projection of capital market outcomes, inflation rates, fixed income yields, returns, volatilitiesand correlation relationships. The inclusion of any given asset class in the target asset allocation is consideredin relation to its impact on the overall risk/return characteristics as well as its impact on the overallinvestment return. As part of its strategy, Schlumberger may utilize certain derivative instruments, such asoptions, futures, swaps and forwards, within the plans to manage risks (currency, interest rate, etc.) or as asubstitute for physical securities or to obtain exposure to different markets.
Asset performance is monitored frequently with an overall expectation that plan assets will meet or exceedthe weighted index of its target asset allocation and component benchmark over rolling five year periods.
The expected long-term rate of return on assets assumptions reflect the average rate of earnings expectedon funds invested or to be invested. The assumptions have been determined by reflecting expectationsregarding future rates of return for the portfolio considering the asset allocation and related historical rates ofreturn. The appropriateness of the assumptions is reviewed annually.
The fair value of Schlumberger’s pension plan assets at December 31, 2009, by asset category, was asfollows:
(Stated in millions)
US Plan Assets
Total
Quoted Pricesin Active
Markets forIdentical
Assets(Level One)
SignificantObservable
Inputs(Level Two)
SignificantUnobservable
Inputs(Level Three)
Asset Catergory:Cash and Cash Equivalents $ 191 $ 191 $ – $ –Equity Securities :
U.S.(a) 710 710International(b) 355 280 75
Debt securities:Corporate bonds(c) 193 193Government and government-related debt securities(d) 462 161 301Government agency collateralized mortgage obligations and mortgage backed
securities(e) 136 136Other collateralized mortgage obligations and mortgage-backed securities(f) 71 71
Other Investments:Private equity(g) 99 99Real estate(h) 37 37
Total $2,254 $1,342 $776 $136
64
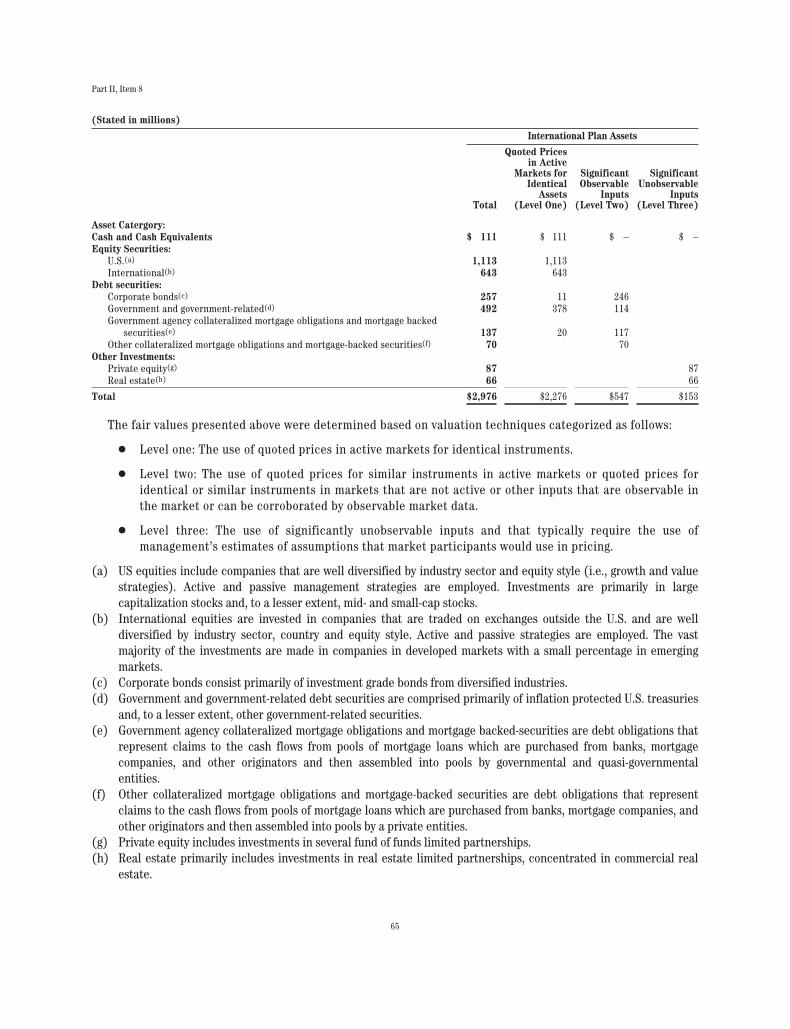
Part II, Item 8
(Stated in millions)
International Plan Assets
Total
Quoted Pricesin Active
Markets forIdentical
Assets(Level One)
SignificantObservable
Inputs(Level Two)
SignificantUnobservable
Inputs(Level Three)
Asset Catergory:Cash and Cash Equivalents $ 111 $ 111 $ – $ –Equity Securities:
U.S.(a) 1,113 1,113International(b) 643 643
Debt securities:Corporate bonds(c) 257 11 246Government and government-related(d) 492 378 114Government agency collateralized mortgage obligations and mortgage backed
securities(e) 137 20 117Other collateralized mortgage obligations and mortgage-backed securities(f) 70 70
Other Investments:Private equity(g) 87 87Real estate(h) 66 66
Total $2,976 $2,276 $547 $153
The fair values presented above were determined based on valuation techniques categorized as follows:
Š Level one: The use of quoted prices in active markets for identical instruments.
Š Level two: The use of quoted prices for similar instruments in active markets or quoted prices foridentical or similar instruments in markets that are not active or other inputs that are observable inthe market or can be corroborated by observable market data.
Š Level three: The use of significantly unobservable inputs and that typically require the use ofmanagement’s estimates of assumptions that market participants would use in pricing.
(a) US equities include companies that are well diversified by industry sector and equity style (i.e., growth and valuestrategies). Active and passive management strategies are employed. Investments are primarily in largecapitalization stocks and, to a lesser extent, mid- and small-cap stocks.
(b) International equities are invested in companies that are traded on exchanges outside the U.S. and are welldiversified by industry sector, country and equity style. Active and passive strategies are employed. The vastmajority of the investments are made in companies in developed markets with a small percentage in emergingmarkets.
(c) Corporate bonds consist primarily of investment grade bonds from diversified industries.(d) Government and government-related debt securities are comprised primarily of inflation protected U.S. treasuries
and, to a lesser extent, other government-related securities.(e) Government agency collateralized mortgage obligations and mortgage backed-securities are debt obligations that
represent claims to the cash flows from pools of mortgage loans which are purchased from banks, mortgagecompanies, and other originators and then assembled into pools by governmental and quasi-governmentalentities.
(f) Other collateralized mortgage obligations and mortgage-backed securities are debt obligations that representclaims to the cash flows from pools of mortgage loans which are purchased from banks, mortgage companies, andother originators and then assembled into pools by a private entities.
(g) Private equity includes investments in several fund of funds limited partnerships.(h) Real estate primarily includes investments in real estate limited partnerships, concentrated in commercial real
estate.
65
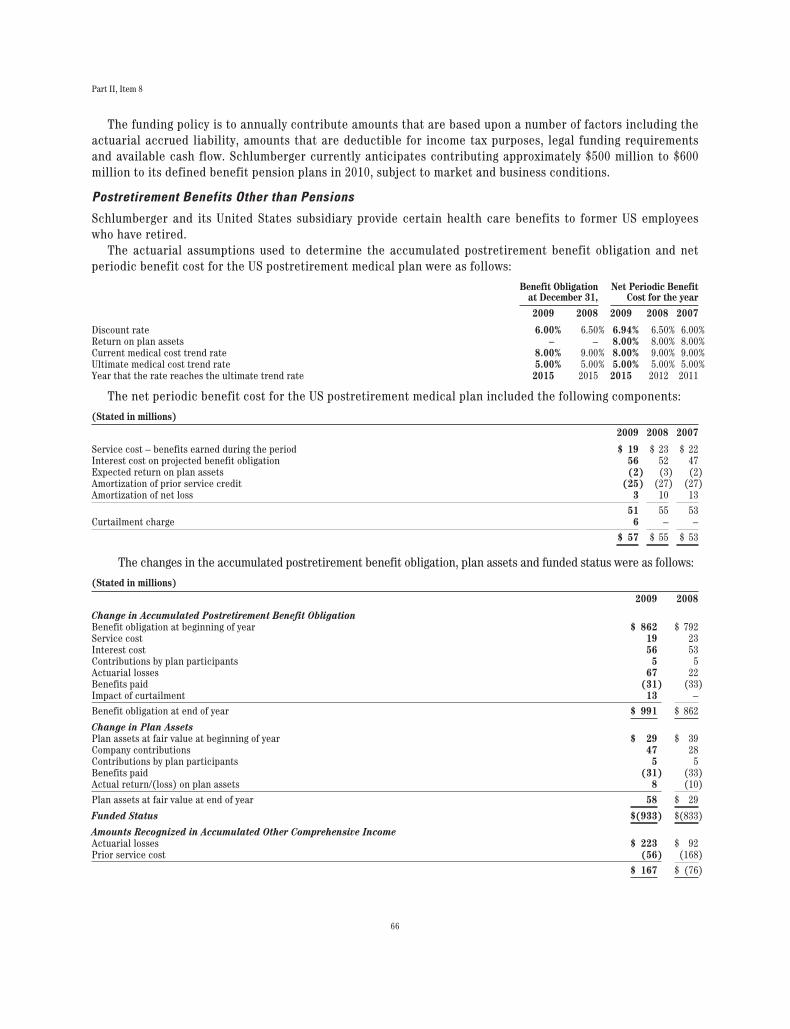
Part II, Item 8
The funding policy is to annually contribute amounts that are based upon a number of factors including theactuarial accrued liability, amounts that are deductible for income tax purposes, legal funding requirementsand available cash flow. Schlumberger currently anticipates contributing approximately $500 million to $600million to its defined benefit pension plans in 2010, subject to market and business conditions.
Postretirement Benefits Other than Pensions
Schlumberger and its United States subsidiary provide certain health care benefits to former US employeeswho have retired.
The actuarial assumptions used to determine the accumulated postretirement benefit obligation and netperiodic benefit cost for the US postretirement medical plan were as follows:
Benefit Obligationat December 31,
Net Periodic BenefitCost for the year
2009 2008 2009 2008 2007
Discount rate 6.00% 6.50% 6.94% 6.50% 6.00%Return on plan assets – – 8.00% 8.00% 8.00%Current medical cost trend rate 8.00% 9.00% 8.00% 9.00% 9.00%Ultimate medical cost trend rate 5.00% 5.00% 5.00% 5.00% 5.00%Year that the rate reaches the ultimate trend rate 2015 2015 2015 2012 2011
The net periodic benefit cost for the US postretirement medical plan included the following components:
(Stated in millions)
2009 2008 2007
Service cost – benefits earned during the period $ 19 $ 23 $ 22Interest cost on projected benefit obligation 56 52 47Expected return on plan assets (2) (3) (2)Amortization of prior service credit (25) (27) (27)Amortization of net loss 3 10 13
51 55 53Curtailment charge 6 – –
$ 57 $ 55 $ 53
The changes in the accumulated postretirement benefit obligation, plan assets and funded status were as follows:
(Stated in millions)
2009 2008
Change in Accumulated Postretirement Benefit ObligationBenefit obligation at beginning of year $ 862 $ 792Service cost 19 23Interest cost 56 53Contributions by plan participants 5 5Actuarial losses 67 22Benefits paid (31) (33)Impact of curtailment 13 –
Benefit obligation at end of year $ 991 $ 862
Change in Plan AssetsPlan assets at fair value at beginning of year $ 29 $ 39Company contributions 47 28Contributions by plan participants 5 5Benefits paid (31) (33)Actual return/(loss) on plan assets 8 (10)
Plan assets at fair value at end of year 58 $ 29
Funded Status $(933) $(833)
Amounts Recognized in Accumulated Other Comprehensive IncomeActuarial losses $ 223 $ 92Prior service cost (56) (168)
$ 167 $ (76)
66
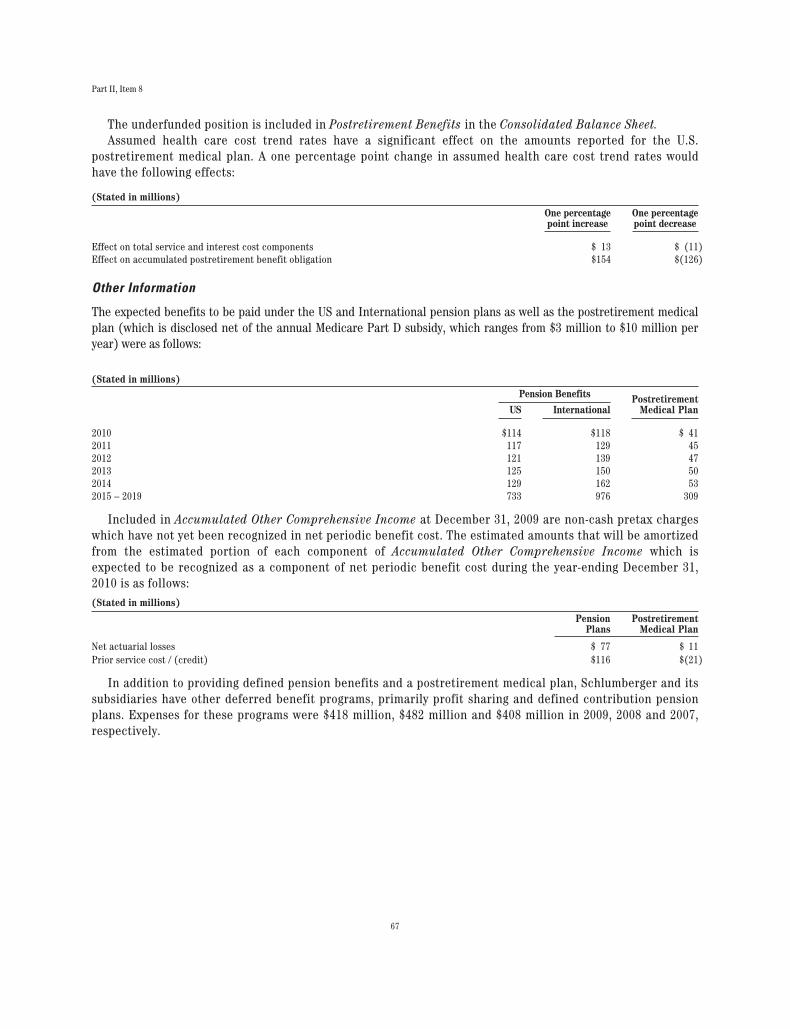
Part II, Item 8
The underfunded position is included in Postretirement Benefits in the Consolidated Balance Sheet.Assumed health care cost trend rates have a significant effect on the amounts reported for the U.S.
postretirement medical plan. A one percentage point change in assumed health care cost trend rates wouldhave the following effects:
(Stated in millions)
One percentagepoint increase
One percentagepoint decrease
Effect on total service and interest cost components $ 13 $ (11)Effect on accumulated postretirement benefit obligation $154 $(126)
Other Information
The expected benefits to be paid under the US and International pension plans as well as the postretirement medicalplan (which is disclosed net of the annual Medicare Part D subsidy, which ranges from $3 million to $10 million peryear) were as follows:
(Stated in millions)Pension Benefits Postretirement
Medical PlanUS International
2010 $114 $118 $ 412011 117 129 452012 121 139 472013 125 150 502014 129 162 532015 – 2019 733 976 309
Included in Accumulated Other Comprehensive Income at December 31, 2009 are non-cash pretax chargeswhich have not yet been recognized in net periodic benefit cost. The estimated amounts that will be amortizedfrom the estimated portion of each component of Accumulated Other Comprehensive Income which isexpected to be recognized as a component of net periodic benefit cost during the year-ending December 31,2010 is as follows:(Stated in millions)
PensionPlans
PostretirementMedical Plan
Net actuarial losses $ 77 $ 11Prior service cost / (credit) $116 $(21)
In addition to providing defined pension benefits and a postretirement medical plan, Schlumberger and itssubsidiaries have other deferred benefit programs, primarily profit sharing and defined contribution pensionplans. Expenses for these programs were $418 million, $482 million and $408 million in 2009, 2008 and 2007,respectively.
67
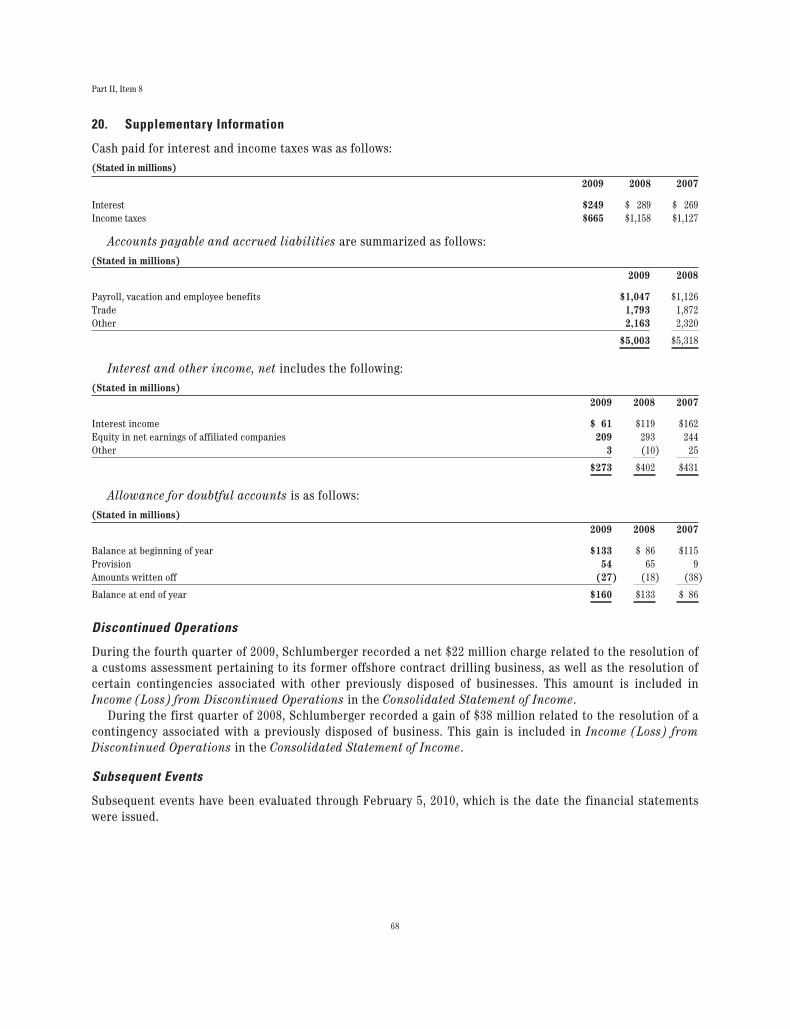
Part II, Item 8
20. Supplementary Information
Cash paid for interest and income taxes was as follows:(Stated in millions)
2009 2008 2007
Interest $249 $ 289 $ 269Income taxes $665 $1,158 $1,127
Accounts payable and accrued liabilities are summarized as follows:(Stated in millions)
2009 2008
Payroll, vacation and employee benefits $1,047 $1,126Trade 1,793 1,872Other 2,163 2,320
$5,003 $5,318
Interest and other income, net includes the following:(Stated in millions)
2009 2008 2007
Interest income $ 61 $119 $162Equity in net earnings of affiliated companies 209 293 244Other 3 (10) 25
$273 $402 $431
Allowance for doubtful accounts is as follows:(Stated in millions)
2009 2008 2007
Balance at beginning of year $133 $ 86 $115Provision 54 65 9Amounts written off (27) (18) (38)
Balance at end of year $160 $133 $ 86
Discontinued Operations
During the fourth quarter of 2009, Schlumberger recorded a net $22 million charge related to the resolution ofa customs assessment pertaining to its former offshore contract drilling business, as well as the resolution ofcertain contingencies associated with other previously disposed of businesses. This amount is included inIncome (Loss) from Discontinued Operations in the Consolidated Statement of Income.
During the first quarter of 2008, Schlumberger recorded a gain of $38 million related to the resolution of acontingency associated with a previously disposed of business. This gain is included in Income (Loss) fromDiscontinued Operations in the Consolidated Statement of Income.
Subsequent Events
Subsequent events have been evaluated through February 5, 2010, which is the date the financial statementswere issued.
68
Part II, Item 8
Management’s Report on Internal Control Over Financial Reporting
The management of Schlumberger Limited is responsible for establishing and maintaining adequate internalcontrol over financial reporting as defined in Rule 13a–15(f) of the Securities Exchange Act of 1934, asamended. Schlumberger Limited’s internal control over financial reporting is a process designed to providereasonable assurance regarding the reliability of financial reporting and the preparation of financialstatements for external purposes in accordance with generally accepted accounting principles.
Because of its inherent limitations, internal control over financial reporting may not prevent or detectmisstatements. Also, projections of any evaluation of effectiveness to future periods are subject to the risk thatcontrols may become inadequate because of changes in conditions, or that the degree of compliance with thepolicies or procedures may deteriorate.
Schlumberger Limited management assessed the effectiveness of its internal control over financialreporting as of December 31, 2009. In making this assessment, it used the criteria set forth by the Committeeof Sponsoring Organizations of the Treadway Commission (COSO) in Internal Control – Integrated Framework.Based on this assessment Schlumberger Limited management has concluded that, as of December 31, 2009, itsinternal control over financial reporting is effective based on those criteria.
The effectiveness of Schlumberger Limited’s internal control over financial reporting as of December 31,2009, has been audited by PricewaterhouseCoopers LLP, an independent registered public accounting firm, asstated in their report which appears herein.
69
Part II, Item 8
Report of Independent Registered Public Accounting Firm
To the Board of Directors and Stockholdersof Schlumberger Limited
In our opinion, the accompanying consolidated balance sheets and the related consolidated statements ofincome, of stockholders’ equity and of cash flows present fairly, in all material respects, the financial positionof Schlumberger Limited and its subsidiaries at December 31, 2009 and 2008, and the results of theiroperations and their cash flows for each of the three years in the period ended December 31, 2009 inconformity with accounting principles generally accepted in the United States of America. Also in our opinion,the Company maintained, in all material respects, effective internal control over financial reporting as ofDecember 31, 2009, based on criteria established in Internal Control – Integrated Framework issued by theCommittee of Sponsoring Organizations of the Treadway Commission (COSO). The Company’s management isresponsible for these financial statements, for maintaining effective internal control over financial reportingand for its assessment of the effectiveness of internal control over financial reporting, included in theaccompanying Management’s Report on Internal Control Over Financial Reporting. Our responsibility is toexpress opinions on these financial statements and on the Company’s internal control over financial reportingbased on our integrated audits. We conducted our audits in accordance with the standards of the PublicCompany Accounting Oversight Board (United States). Those standards require that we plan and perform theaudits to obtain reasonable assurance about whether the financial statements are free of materialmisstatement and whether effective internal control over financial reporting was maintained in all materialrespects. Our audits of the financial statements included examining, on a test basis, evidence supporting theamounts and disclosures in the financial statements, assessing the accounting principles used and significantestimates made by management, and evaluating the overall financial statement presentation. Our audit ofinternal control over financial reporting included obtaining an understanding of internal control over financialreporting, assessing the risk that a material weakness exists, and testing and evaluating the design andoperating effectiveness of internal control based on the assessed risk. Our audits also included performingsuch other procedures as we considered necessary in the circumstances. We believe that our audits provide areasonable basis for our opinions.
A company’s internal control over financial reporting is a process designed to provide reasonable assuranceregarding the reliability of financial reporting and the preparation of financial statements for externalpurposes in accordance with generally accepted accounting principles. A company’s internal control overfinancial reporting includes those policies and procedures that (i) pertain to the maintenance of records that,in reasonable detail, accurately and fairly reflect the transactions and dispositions of the assets of thecompany; (ii) provide reasonable assurance that transactions are recorded as necessary to permit preparationof financial statements in accordance with generally accepted accounting principles, and that receipts andexpenditures of the company are being made only in accordance with authorizations of management anddirectors of the company; and (iii) provide reasonable assurance regarding prevention or timely detection ofunauthorized acquisition, use, or disposition of the company’s assets that could have a material effect on thefinancial statements.
Because of its inherent limitations, internal control over financial reporting may not prevent or detectmisstatements. Also, projections of any evaluation of effectiveness to future periods are subject to the risk thatcontrols may become inadequate because of changes in conditions, or that the degree of compliance with thepolicies or procedures may deteriorate.
/s/ PRICEWATERHOUSECOOPERS LLP
PricewaterhouseCoopers LLPHouston, TexasFebruary 5, 2010
70
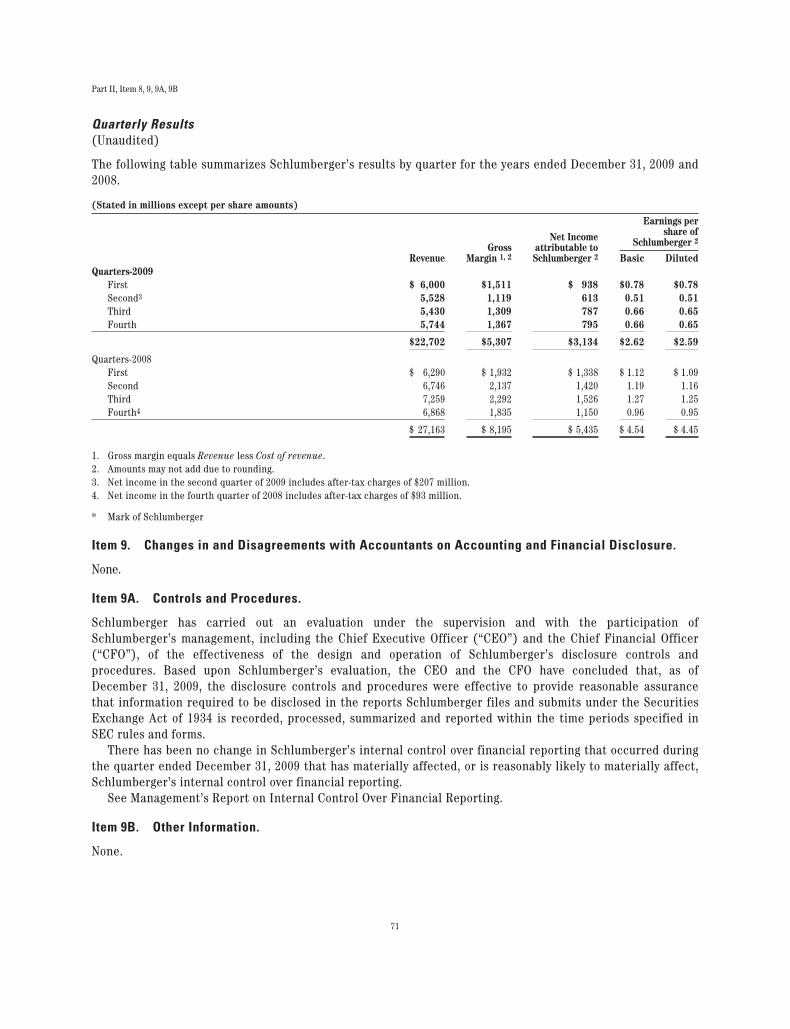
Part II, Item 8, 9, 9A, 9B
Quarterly Results(Unaudited)
The following table summarizes Schlumberger’s results by quarter for the years ended December 31, 2009 and2008.
(Stated in millions except per share amounts)
RevenueGross
Margin 1, 2
Net Incomeattributable toSchlumberger 2
Earnings pershare of
Schlumberger 2
Basic DilutedQuarters-2009
First $ 6,000 $1,511 $ 938 $0.78 $0.78Second3 5,528 1,119 613 0.51 0.51Third 5,430 1,309 787 0.66 0.65Fourth 5,744 1,367 795 0.66 0.65
$22,702 $5,307 $3,134 $2.62 $2.59
Quarters-2008First $ 6,290 $ 1,932 $ 1,338 $ 1.12 $ 1.09Second 6,746 2,137 1,420 1.19 1.16Third 7,259 2,292 1,526 1.27 1.25Fourth4 6,868 1,835 1,150 0.96 0.95
$ 27,163 $ 8,195 $ 5,435 $ 4.54 $ 4.45
1. Gross margin equals Revenue less Cost of revenue.2. Amounts may not add due to rounding.3. Net income in the second quarter of 2009 includes after-tax charges of $207 million.4. Net income in the fourth quarter of 2008 includes after-tax charges of $93 million.
* Mark of Schlumberger
Item 9. Changes in and Disagreements with Accountants on Accounting and Financial Disclosure.
None.
Item 9A. Controls and Procedures.
Schlumberger has carried out an evaluation under the supervision and with the participation ofSchlumberger’s management, including the Chief Executive Officer (“CEO”) and the Chief Financial Officer(“CFO”), of the effectiveness of the design and operation of Schlumberger’s disclosure controls andprocedures. Based upon Schlumberger’s evaluation, the CEO and the CFO have concluded that, as ofDecember 31, 2009, the disclosure controls and procedures were effective to provide reasonable assurancethat information required to be disclosed in the reports Schlumberger files and submits under the SecuritiesExchange Act of 1934 is recorded, processed, summarized and reported within the time periods specified inSEC rules and forms.
There has been no change in Schlumberger’s internal control over financial reporting that occurred duringthe quarter ended December 31, 2009 that has materially affected, or is reasonably likely to materially affect,Schlumberger’s internal control over financial reporting.
See Management’s Report on Internal Control Over Financial Reporting.
Item 9B. Other Information.
None.
71
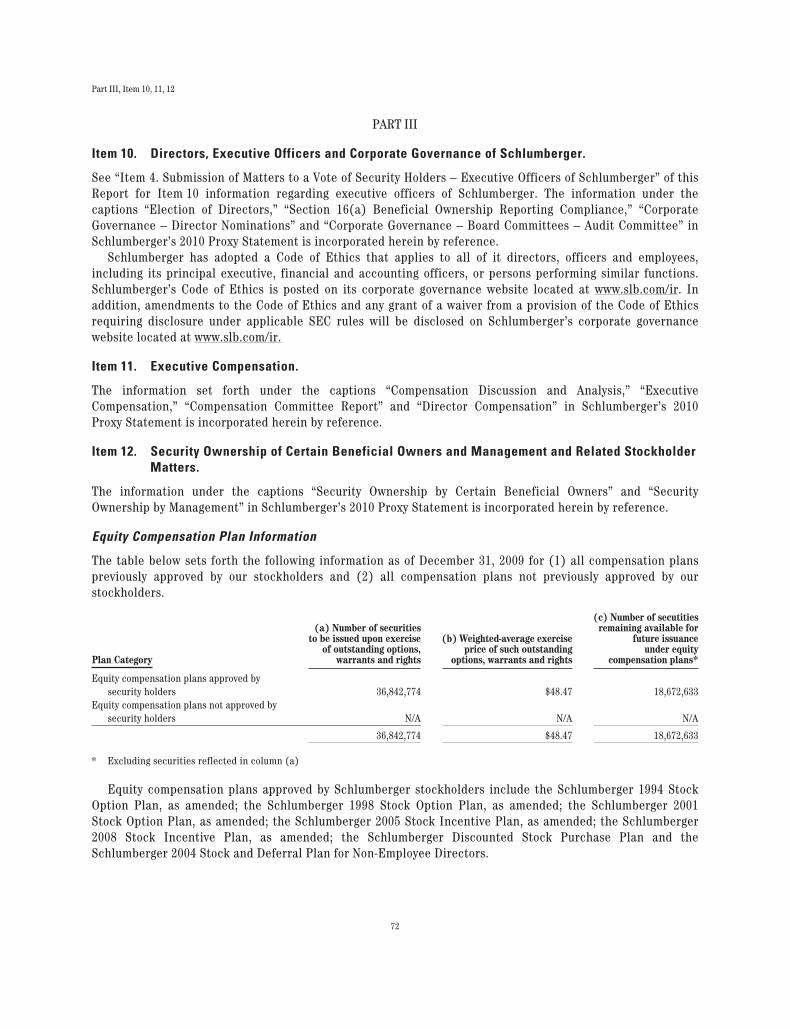
Part III, Item 10, 11, 12
PART III
Item 10. Directors, Executive Officers and Corporate Governance of Schlumberger.
See “Item 4. Submission of Matters to a Vote of Security Holders – Executive Officers of Schlumberger” of thisReport for Item 10 information regarding executive officers of Schlumberger. The information under thecaptions “Election of Directors,” “Section 16(a) Beneficial Ownership Reporting Compliance,” “CorporateGovernance – Director Nominations” and “Corporate Governance – Board Committees – Audit Committee” inSchlumberger’s 2010 Proxy Statement is incorporated herein by reference.
Schlumberger has adopted a Code of Ethics that applies to all of it directors, officers and employees,including its principal executive, financial and accounting officers, or persons performing similar functions.Schlumberger’s Code of Ethics is posted on its corporate governance website located at www.slb.com/ir. Inaddition, amendments to the Code of Ethics and any grant of a waiver from a provision of the Code of Ethicsrequiring disclosure under applicable SEC rules will be disclosed on Schlumberger’s corporate governancewebsite located at www.slb.com/ir.
Item 11. Executive Compensation.
The information set forth under the captions “Compensation Discussion and Analysis,” “ExecutiveCompensation,” “Compensation Committee Report” and “Director Compensation” in Schlumberger’s 2010Proxy Statement is incorporated herein by reference.
Item 12. Security Ownership of Certain Beneficial Owners and Management and Related StockholderMatters.
The information under the captions “Security Ownership by Certain Beneficial Owners” and “SecurityOwnership by Management” in Schlumberger’s 2010 Proxy Statement is incorporated herein by reference.
Equity Compensation Plan Information
The table below sets forth the following information as of December 31, 2009 for (1) all compensation planspreviously approved by our stockholders and (2) all compensation plans not previously approved by ourstockholders.
Plan Category
(a) Number of securitiesto be issued upon exercise
of outstanding options,warrants and rights
(b) Weighted-average exerciseprice of such outstanding
options, warrants and rights
(c) Number of secutitiesremaining available for
future issuanceunder equity
compensation plans*
Equity compensation plans approved bysecurity holders 36,842,774 $48.47 18,672,633
Equity compensation plans not approved bysecurity holders N/A N/A N/A
36,842,774 $48.47 18,672,633
* Excluding securities reflected in column (a)
Equity compensation plans approved by Schlumberger stockholders include the Schlumberger 1994 StockOption Plan, as amended; the Schlumberger 1998 Stock Option Plan, as amended; the Schlumberger 2001Stock Option Plan, as amended; the Schlumberger 2005 Stock Incentive Plan, as amended; the Schlumberger2008 Stock Incentive Plan, as amended; the Schlumberger Discounted Stock Purchase Plan and theSchlumberger 2004 Stock and Deferral Plan for Non-Employee Directors.
72
Part III, Item 13, 14
Item 13. Certain Relationships and Related Transactions, and Director Independence.
The information under the captions “Corporate Governance – Director Independence” and “CorporateGovernance – Policies and Procedures for Approval of Related Person Transactions” in Schlumberger’s 2010Proxy Statement is incorporated herein by reference.
Item 14. Principal Accounting Fees and Services.
The information under the caption “Appointment of Independent Registered Public Accounting Firm” inSchlumberger’s 2010 Proxy Statement is incorporated herein by reference.
73
Part IV, Item 15
PART IV
Item 15. Exhibits and Financial Statement Schedules.
(a) The following documents are filed as part of this Report:
Page(s)
(1) Financial Statements
Consolidated Statement of Income for the three years ended December 31, 2009 35
Consolidated Balance Sheet at December 31, 2009 and 2008 36
Consolidated Statement of Cash Flows for the three years ended December 31, 2009 37
Consolidated Statement of Stockholders’ Equity for the three years ended December 31, 2009 38 and 39
Notes to Consolidated Financial Statements 40 to 68
Report of Independent Registered Public Accounting Firm 70
Quarterly Results (Unaudited) 71
Financial statements of 20%-50% owned companies accounted for under the equity method and unconsolidatedsubsidiaries have been omitted because they do not meet the materiality tests for assets or income.
(2) Financial Statement Schedules not required
(3) Exhibits: the exhibits listed in the accompanying “Index to Exhibits” are filed or incorporated by referenceas part of this Form 10-K.
74
SIGNATURES
Pursuant to the requirements of Section 13 or 15(d) of the Securities Exchange Act of 1934, the Registrant hasduly caused this Report to be signed on its behalf by the undersigned, thereunto duly authorized.
Date: February 5, 2010 SCHLUMBERGER LIMITED
By: /s/ HOWARD GUILD
Howard GuildChief Accounting Officer
Pursuant to the requirements of the Securities Exchange Act of 1934, this Report has been signed below by thefollowing persons on behalf of the Registrant and in the capacities and on the dates indicated.
Name Title
*Andrew Gould
Director, Chairman and Chief Executive Officer(Principal Executive Officer)
/s/ SIMON AYAT
Simon AyatExecutive Vice President and Chief Financial Officer(Principal Financial Officer)
/s/ HOWARD GUILD
Howard GuildChief Accounting Officer(Principal Accounting Officer)
*Philippe Camus
Director
*Jamie S. Gorelick
Director
*Tony Isaac
Director
*Nikolay Kudryavtsev
Director
*Adrian Lajous
Director
*Michael E. Marks
Director
*Leo Rafael Reif
Director
*Tore Sandvold
Director
*Henri Seydoux
Director
*Linda G. Stuntz
Director
/s/ ALEXANDER C. JUDEN
*By Alexander C. Juden Attorney-in-FactFebruary 5, 2010
75
INDEX TO EXHIBITS
Exhibit
Articles of Incorporation of Schlumberger Limited (Schlumberger N.V.), as last amended on April 12, 2006(incorporated by reference to Exhibit 3.1 to Schlumberger’s Quarterly Report on Form 10-Q for thequarter ended March 31, 2006)
3.1
Amended and Restated By-Laws of Schlumberger Limited (Schlumberger N.V.), as last amended on April 21,2005 (incorporated by reference to Exhibit 3.1 to Schlumberger’s Current Report on Form 8-K filed onApril 22, 2005)
3.2
Indenture dated as of June 9, 2003, by and between Schlumberger Limited and Citibank, N.A., as Trustee(incorporated by reference to Exhibit 4.3 to Schlumberger’s Registration Statement on Form S-3 filed onSeptember 12, 2003)
4.1
First Supplemental Indenture dated as of June 9, 2003, by and between Schlumberger Limited and Citibank,N.A., as Trustee (incorporated by reference to Exhibit 4.4 to Schlumberger’s Registration Statement onForm S-3 filed on September 12, 2003)
4.2
Schlumberger 1994 Stock Option Plan, as conformed to include amendments through January 1, 2009(incorporated by reference to Exhibit 10.1 to Schlumberger’s Annual Report on Form 10-K for year endedDecember 31, 2009) (+)
Schlumberger Limited Supplementary Benefit Plan, as conformed to include amendments throughJanuary 1, 2009 (incorporated by reference to Exhibit 10.2 to Schlumberger’s Annual Report onForm 10-K for year ended December 31, 2009) (+)
Schlumberger Limited Restoration Savings Plan, as conformed to include amendments through January 1,2009 (incorporated by reference to Exhibit 10.3 to Schlumberger’s Annual Report on Form 10-K for yearended December 31, 2009) (+)
Schlumberger 1998 Stock Option Plan, as conformed to include amendments through January 1, 2009(incorporated by reference to Exhibit 10.4 to Schlumberger’s Annual Report on Form 10-K for year endedDecember 31, 2009) (+)
Schlumberger 2001 Stock Option Plan, as conformed to include amendments through January 1, 2009(incorporated by reference to Exhibit 10.5 to Schlumberger’s Annual Report on Form 10-K for year endedDecember 31, 2009) (+)
Schlumberger 2005 Stock Incentive Plan, as conformed to include amendments through January 1, 2009(incorporated by reference to Exhibit 10.6 to Schlumberger’s Annual Report on Form 10-K for year endedDecember 31, 2009) (+)
Schlumberger Limited 2004 Stock and Deferral Plan for Non-Employee Directors, as conformed to includeamendments through January 1, 2009 (incorporated by reference to Exhibit 10.7 to Schlumberger’sAnnual Report on Form 10-K for year ended December 31, 2009) (+)
Schlumberger 2008 Stock Incentive Plan, as conformed to include amendments through January 1, 2009(incorporated by reference to Exhibit 10.8 to Schlumberger’s Annual Report on Form 10-K for year endedDecember 31, 2009) (+)
Form of Option Agreement, Capped Incentive Stock Option (incorporated by reference to Exhibit 10.1 toSchlumberger’s Current Report on Form 8-K filed on January 19, 2006) (+)
10.9
Form of Option Agreement, Capped Non-Qualified Stock Option (incorporated by reference to Exhibit 10.2to Schlumberger’s Current Report on Form 8-K filed on January 19, 2006) (+)
10.10
Form of Option Agreement, Uncapped Incentive Stock Option (for 2001, 2005 and 2008 stock plans) (+) (*) 10.11
76
Exhibit
Form of Option Agreement, Uncapped Non-Qualified Stock Option (for 2001, 2005 and 2008 stock plans)(+) (*)
10.12
Employment Agreement dated January 18, 2007 and effective as of March 1, 2007, between SchlumbergerLimited and Jean-Marc Perraud (incorporated by reference to Exhibit 10.1 to Schlumberger’s CurrentReport on Form 8-K filed on January 22, 2007) (+)
10.13
Employment Agreement dated June 9, 2009 and effective as of May 1, 2009, between Schlumberger Limitedand Dalton Boutte (incorporated by reference to Exhibit 10.1 to Schlumberger’s Quarterly Report onForm 10-Q for the quarter ended June 30, 2009)
10.14
Form of Indemnification Agreement (incorporated by reference to Exhibit 10.1 to Schlumberger’s CurrentReport on Form 8-K filed on April 22, 2005)
10.15
Subsidiaries (*) 21
Consent of Independent Registered Public Accounting Firm (*) 23
Powers of Attorney (*)Philippe CamusJamie S. GorelickAndrew GouldTony IsaacNikolay KudryavtsevAdrian LajousMichael E. MarksLeo Rafael ReifTore I. SandvoldHenri SeydouxLinda G. Stuntz
dated:January 21, 2010
24
Certification of Chief Executive Officer pursuant to Rule 13a-14(a) as Adopted Pursuant to Section 302 ofthe Sarbanes-Oxley Act of 2002 (*)
31.1
Certification of Chief Financial Officer pursuant to Rule 13a-14(a) as Adopted Pursuant to Section 302 of theSarbanes-Oxley Act of 2002 (*)
31.2
Certification of Chief Executive Officer pursuant to 18 U.S.C. Section 1350, as Adopted Pursuant toSection 906 of the Sarbanes-Oxley Act of 2002 (*)
32.1
Certification of Chief Financial Officer pursuant to 18 U.S.C. Section 1350, as Adopted Pursuant toSection 906 of the Sarbanes-Oxley Act of 2002 (*)
32.2
The following materials from Schlumberger Limited’s Annual Report on Form 10-K for the year endedDecember 31, 2009, formatted in XBRL: (i) Consolidated Statement of Income, (ii) Consolidated BalanceSheet, (iii) Consolidated Statement of Cash Flows, (iv) Consolidated Statement of Equity and (v) Notes toConsolidated Financial Statements, tagged as blocks of text. (*)
101
(*) Exhibits physically filed with this Form 10-K. All other exhibits are incorporated by reference.
(+) Management contracts or compensatory plans or arrangements.
77
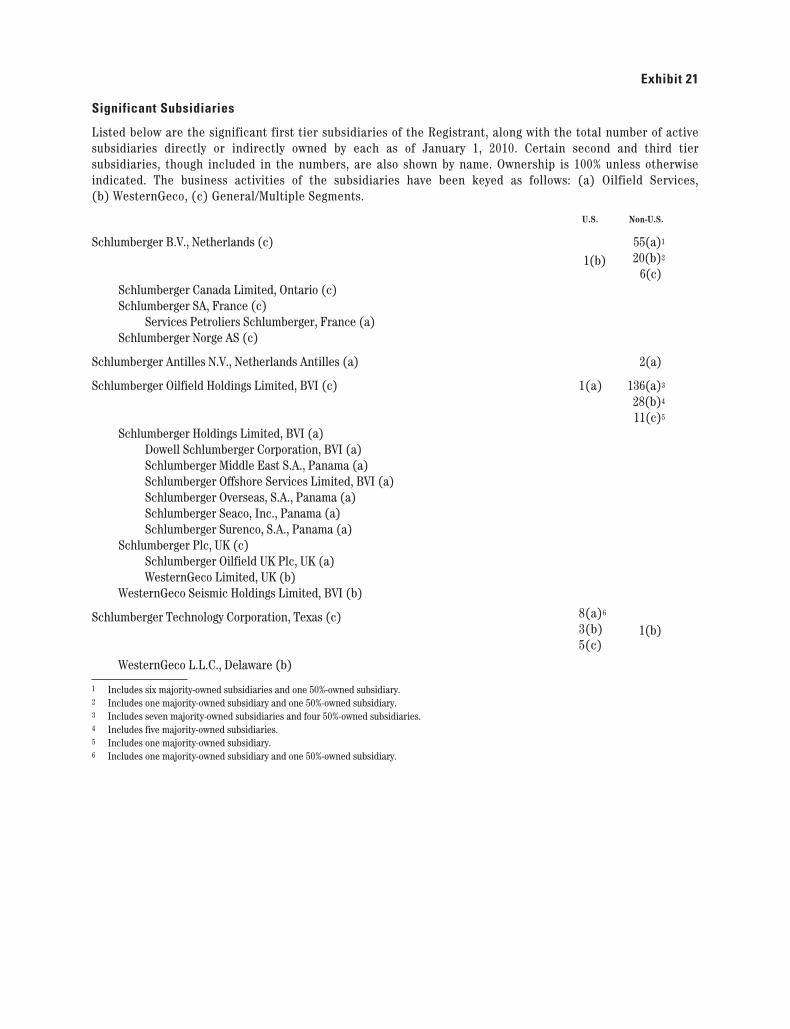
Exhibit 21
Significant Subsidiaries
Listed below are the significant first tier subsidiaries of the Registrant, along with the total number of activesubsidiaries directly or indirectly owned by each as of January 1, 2010. Certain second and third tiersubsidiaries, though included in the numbers, are also shown by name. Ownership is 100% unless otherwiseindicated. The business activities of the subsidiaries have been keyed as follows: (a) Oilfield Services,(b) WesternGeco, (c) General/Multiple Segments.
U.S. Non-U.S.
Schlumberger B.V., Netherlands (c)1(b)
55(a)1
20(b)2
6(c)Schlumberger Canada Limited, Ontario (c)Schlumberger SA, France (c)
Services Petroliers Schlumberger, France (a)Schlumberger Norge AS (c)
Schlumberger Antilles N.V., Netherlands Antilles (a) 2(a)
Schlumberger Oilfield Holdings Limited, BVI (c) 1(a) 136(a)3
28(b)4
11(c)5
Schlumberger Holdings Limited, BVI (a)Dowell Schlumberger Corporation, BVI (a)Schlumberger Middle East S.A., Panama (a)Schlumberger Offshore Services Limited, BVI (a)Schlumberger Overseas, S.A., Panama (a)Schlumberger Seaco, Inc., Panama (a)Schlumberger Surenco, S.A., Panama (a)
Schlumberger Plc, UK (c)Schlumberger Oilfield UK Plc, UK (a)WesternGeco Limited, UK (b)
WesternGeco Seismic Holdings Limited, BVI (b)
Schlumberger Technology Corporation, Texas (c) 8(a)6
3(b)5(c)
1(b)
WesternGeco L.L.C., Delaware (b)
1 Includes six majority-owned subsidiaries and one 50%-owned subsidiary.2 Includes one majority-owned subsidiary and one 50%-owned subsidiary.3 Includes seven majority-owned subsidiaries and four 50%-owned subsidiaries.4 Includes five majority-owned subsidiaries.5 Includes one majority-owned subsidiary.6 Includes one majority-owned subsidiary and one 50%-owned subsidiary.
Exhibit 23
Consent of Independent Registered Public Accounting Firm
We hereby consent to the incorporation by reference in the Registration Statements on Form S-8 (Nos.33-86424; 333-62545; 333-36366; 333-36364; 333-67330; 333-104225; 333-115277; 333-124534; and 333-151920),on Form S-3 (No. 333-108730) and on Form S-4 (No. 333-97899) of Schlumberger Limited of our report datedFebruary 5, 2010 relating to the consolidated financial statements and the effectiveness of internal controlover financial reporting, which appears in this Form 10-K.
/s/ PRICEWATERHOUSECOOPERS LLP
PricewaterhouseCoopers LLPHouston, TexasFebruary 5, 2010

Exhibit 24
Power of Attorney
Each of the undersigned, in the capacity or capacities set forth below his or her signature as a member of theBoard of Directors and/or an officer of Schlumberger Limited, a Netherlands Antilles corporation (“theCorporation”), hereby appoints Simon Ayat, Howard Guild and Alexander C. Juden, or either of them, theattorney or attorneys of the undersigned, with full power of substitution and revocation, for and in the name,place and stead of the undersigned to execute and file with the Securities and Exchange Commission theAnnual Report on Form 10-K under the Securities Exchange Act of 1934 (the “Exchange Act”) for the fiscalyear ending December 31, 2009, and any amendment or amendments to any such Annual Report on Form 10-K,and any agreements, consents or waivers relative thereto, and to take any and all such other action for and inthe name and place and stead of the undersigned as may be necessary or desirable in order to comply with theExchange Act or the rules and regulations thereunder.
/s/ Philippe Camus /s/ Michael E. MarksPhilippe Camus
DirectorMichael E. Marks
Director
/s/ Jamie S. Gorelick /s/ Leo Rafael ReifJamie S. Gorelick
DirectorLeo Rafael Reif
Director
/s/ Andrew Gould /s/ Tore SandvoldAndrew Gould
Chairman and Chief Executive OfficerTore Sandvold
Director
/s/ Tony Isaac /s/ Henri SeydouxTony Isaac
DirectorHenri Seydoux
Director
/s/ Nikolay Kudryavtsev /s/ Linda G. StuntzNikolay Kudryavtsev
DirectorLinda G. Stuntz
Director
/s/ Adrian LajousAdrian Lajous
Director
Date: January 21, 2010

Exhibit 31.1
CERTIFICATION OF CHIEF EXECUTIVE OFFICER
I, Andrew Gould, certify that:
1. I have reviewed this Annual Report on Form 10-K of Schlumberger Limited;
2. Based on my knowledge, this report does not contain any untrue statement of a material fact or omit tostate a material fact necessary to make the statements made, in light of the circumstances under which suchstatements were made, not misleading with respect to the period covered by this report;
3. Based on my knowledge, the financial statements, and other financial information included in thisreport, fairly present in all material respects the financial condition, results of operations and cash flows ofthe registrant as of, and for, the periods presented in this report;
4. The registrant’s other certifying officer and I are responsible for establishing and maintaining disclosurecontrols and procedures (as defined in Exchange Act Rules 13a-15(e) and 15d-15(e)) and internal control overfinancial reporting (as defined in Exchange Act Rules 13a-15(f) and 15d-15(f)) for the registrant and have:
a) Designed such disclosure controls and procedures, or caused such disclosure controls and procedures to bedesigned under our supervision, to ensure that material information relating to the registrant, including itsconsolidated subsidiaries, is made known to us by others within those entities, particularly during the periodin which this report is being prepared;
b) Designed such internal control over financial reporting, or caused such internal control over financialreporting to be designed under our supervision, to provide reasonable assurance regarding the reliability offinancial reporting and the preparation of financial statements for external purposes in accordance withgenerally accepted accounting principles;
c) Evaluated the effectiveness of the registrant’s disclosure controls and procedures and presented in thisreport our conclusions about the effectiveness of the disclosure controls and procedures, as of the end of theperiod covered by this report based on such evaluation; and
d) Disclosed in this report any change in the registrant’s internal control over financial reporting that occurredduring the registrant’s most recent fiscal quarter (the registrant’s fourth fiscal quarter in the case of anannual report) that has materially affected, or is reasonably likely to materially affect, the registrant’sinternal control over financial reporting; and
5. The registrant’s other certifying officer and I have disclosed, based on our most recent evaluation ofinternal control over financial reporting, to the registrant’s auditors and the audit committee of theregistrant’s board of directors (or persons performing the equivalent functions):
a) All significant deficiencies and material weaknesses in the design or operation of internal control overfinancial reporting which are reasonably likely to adversely affect the registrant’s ability to record, process,summarize and report financial information; and
b) Any fraud, whether or not material, that involves management or other employees who have a significantrole in the registrant’s internal control over financial reporting.
Date: February 5, 2010 /s/ Andrew Gould
Andrew GouldChairman and Chief Executive Officer
Exhibit 31.2
CERTIFICATION OF CHIEF FINANCIAL OFFICER
I, Simon Ayat, certify that:
1. I have reviewed this Annual Report on Form 10-K of Schlumberger Limited;
2. Based on my knowledge, this report does not contain any untrue statement of a material fact or omit tostate a material fact necessary to make the statements made, in light of the circumstances under which suchstatements were made, not misleading with respect to the period covered by this report;
3. Based on my knowledge, the financial statements, and other financial information included in thisreport, fairly present in all material respects the financial condition, results of operations and cash flows ofthe registrant as of, and for, the periods presented in this report;
4. The registrant’s other certifying officer and I are responsible for establishing and maintaining disclosurecontrols and procedures (as defined in Exchange Act Rules 13a-15(e) and 15d-15(e)) and internal control overfinancial reporting (as defined in Exchange Act Rules 13a-15(f) and 15d-15(f)) for the registrant and have:
a) Designed such disclosure controls and procedures, or caused such disclosure controls and procedures to bedesigned under our supervision, to ensure that material information relating to the registrant, including itsconsolidated subsidiaries, is made known to us by others within those entities, particularly during the periodin which this report is being prepared;
b) Designed such internal control over financial reporting, or caused such internal control over financialreporting to be designed under our supervision, to provide reasonable assurance regarding the reliability offinancial reporting and the preparation of financial statements for external purposes in accordance withgenerally accepted accounting principles;
c) Evaluated the effectiveness of the registrant’s disclosure controls and procedures and presented in thisreport our conclusions about the effectiveness of the disclosure controls and procedures, as of the end of theperiod covered by this report based on such evaluation; and
d) Disclosed in this report any change in the registrant’s internal control over financial reporting that occurredduring the registrant’s most recent fiscal quarter (the registrant’s fourth fiscal quarter in the case of anannual report) that has materially affected, or is reasonably likely to materially affect, the registrant’sinternal control over financial reporting; and
5. The registrant’s other certifying officer and I have disclosed, based on our most recent evaluation ofinternal control over financial reporting, to the registrant’s auditors and the audit committee of theregistrant’s board of directors (or persons performing the equivalent functions):
a) All significant deficiencies and material weaknesses in the design or operation of internal control overfinancial reporting which are reasonably likely to adversely affect the registrant’s ability to record, process,summarize and report financial information; and
b) Any fraud, whether or not material, that involves management or other employees who have a significantrole in the registrant’s internal control over financial reporting.
Date: February 5, 2010 /s/ Simon Ayat
Simon AyatExecutive Vice President and Chief Financial Officer

Exhibit 32.1
CERTIFICATION OF CHIEF EXECUTIVE OFFICERPURSUANT TO18 U.S.C. SECTION 1350AS ADOPTED PURSUANT TOSECTION 906 OF THE SARBANES-OXLEY ACT OF 2002
In connection with the Annual Report on Form 10-K of Schlumberger N.V. (Schlumberger Limited) (the“Company”) for the year ended December 31, 2009 as filed with the Securities and Exchange Commission onthe date hereof (the “Report”), I, Andrew Gould, Chairman and Chief Executive Officer of the Company,certify, pursuant to 18 U.S.C. § 1350, as adopted pursuant to § 906 of the Sarbanes-Oxley Act of 2002, that:
(1) The Report fully complies with the requirements of section 13(a) or 15(d) of the Securities ExchangeAct of 1934, as amended (the “Exchange Act”),
and
(2) The information contained in the Report fairly presents, in all material respects, the financialcondition and results of operations of the Company.
Date: February 5, 2010 /s/ Andrew Gould
Andrew GouldChairman and Chief Executive Officer
A signed original of this written statement required by Section 906 has been provided to SchlumbergerLimited and will be retained by Schlumberger Limited and furnished to the Securities and ExchangeCommission or its staff upon request.
This certification accompanies the Report pursuant to Section 906 of the Sarbanes-Oxley Act of 2002 andshall not be deemed filed by the Company for purposes of Section 18 of the Exchange Act.
Exhibit 32.2
CERTIFICATION OF CHIEF FINANCIAL OFFICERPURSUANT TO18 U.S.C. SECTION 1350AS ADOPTED PURSUANT TOSECTION 906 OF THE SARBANES-OXLEY ACT OF 2002
In connection with the Annual Report on Form 10-K of Schlumberger N.V. (Schlumberger Limited) (the“Company”) for the year ended December 31, 2009 as filed with the Securities and Exchange Commission onthe date hereof (the “Report”), I, Simon Ayat, Executive Vice President and Chief Financial Officer of theCompany, certify, pursuant to 18 U.S.C. § 1350, as adopted pursuant to § 906 of the Sarbanes-Oxley Act of 2002,that:
(1) The Report fully complies with the requirements of section 13(a) or 15(d) of the Securities ExchangeAct of 1934, as amended (the “Exchange Act”),
and
(2) The information contained in the Report fairly presents, in all material respects, the financialcondition and results of operations of the Company.
Date: February 5, 2010 /s/ Simon Ayat
Simon AyatExecutive Vice President and Chief Financial Officer
A signed original of this written statement required by Section 906 has been provided to SchlumbergerLimited and will be retained by Schlumberger Limited and furnished to the Securities and ExchangeCommission or its staff upon request.
This certification accompanies the Report pursuant to Section 906 of the Sarbanes-Oxley Act of 2002 andshall not be deemed filed by the Company for purposes of Section 18 of the Exchange Act.