Embed Size (px)
Citation preview

Automotive
Matthias ZinkCEO Automotive
July 20, 2017Capital Markets Day 2017
Bühl
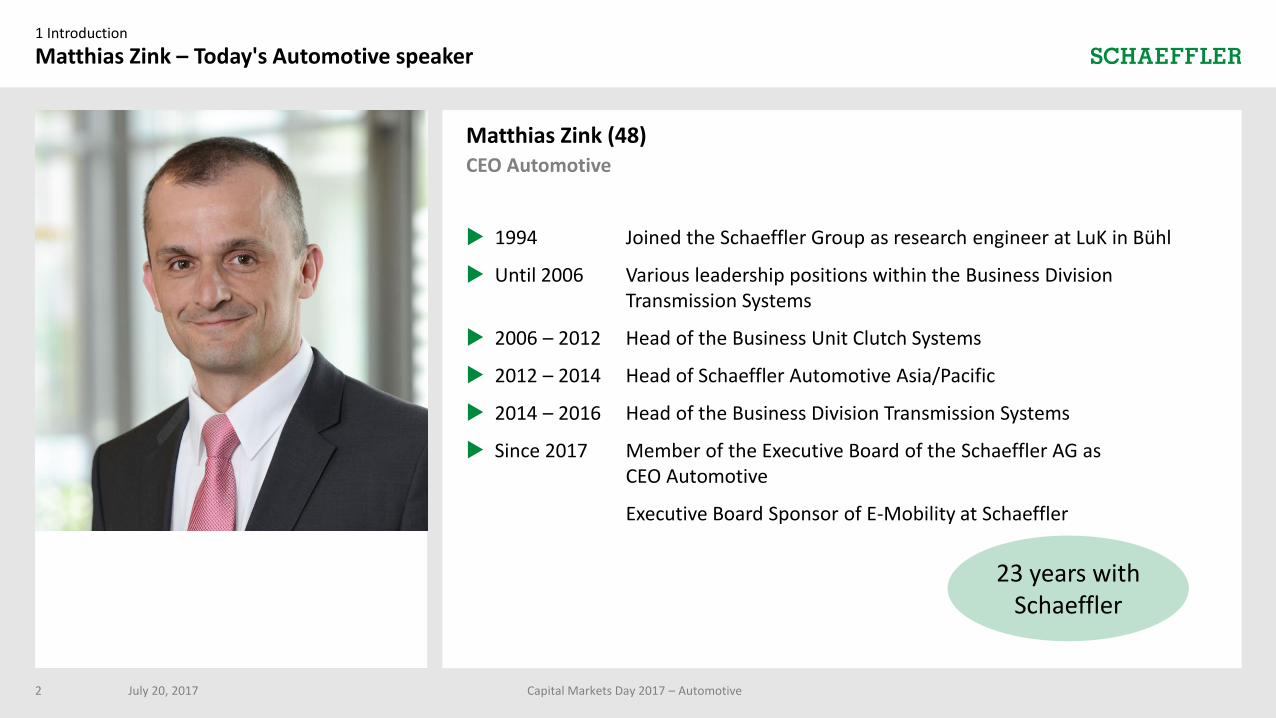
Matthias Zink (48)CEO Automotive
1994 Joined the Schaeffler Group as research engineer at LuK in Bühl
Until 2006 Various leadership positions within the Business Division Transmission Systems
2006 – 2012 Head of the Business Unit Clutch Systems
2012 – 2014 Head of Schaeffler Automotive Asia/Pacific
2014 – 2016 Head of the Business Division Transmission Systems
Since 2017 Member of the Executive Board of the Schaeffler AG as CEO Automotive
Executive Board Sponsor of E-Mobility at Schaeffler
Matthias Zink – Today's Automotive speaker
July 20, 2017 Capital Markets Day 2017 – Automotive2
1 Introduction
23 years withSchaeffler
8,164 8,9869,977 10,388
5,455
2013 2014 2015 2016 H1 2017
5,182
2 Overview Automotive
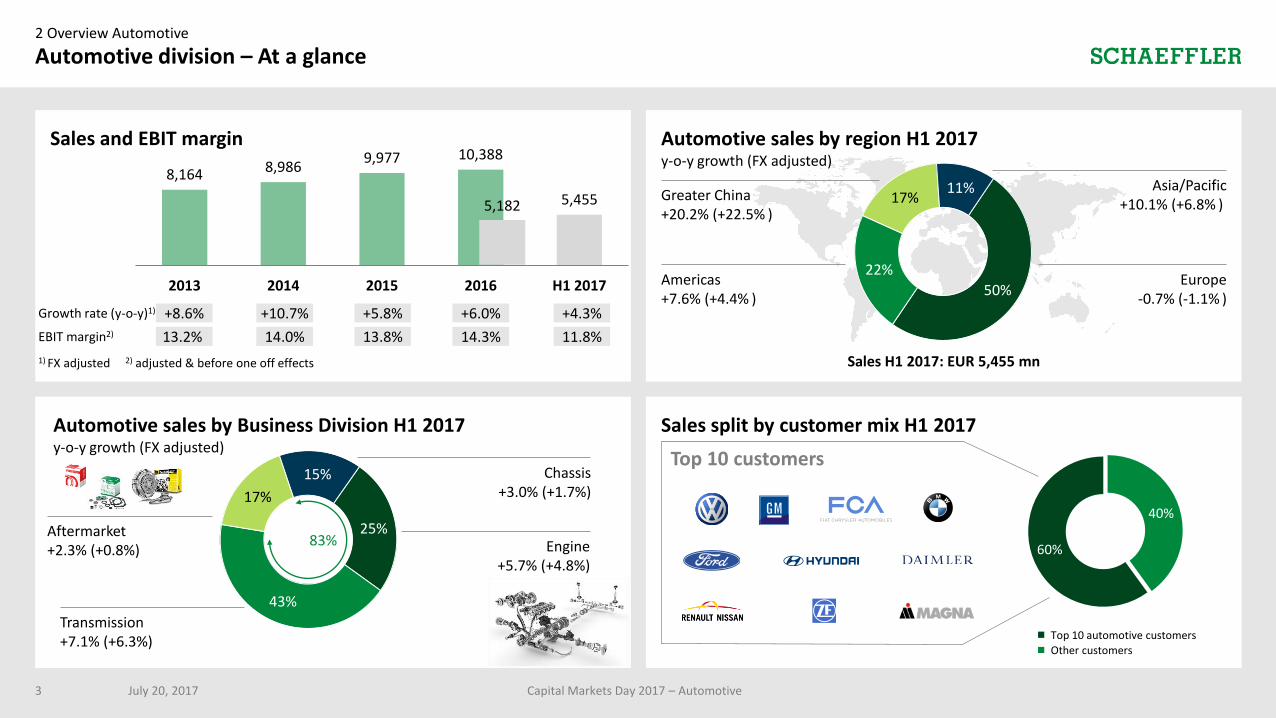
Automotive division – At a glance
July 20, 2017 Capital Markets Day 2017 – Automotive3
1) FX adjusted 2) adjusted & before one off effects
Growth rate (y-o-y)1)
EBIT margin2)
Sales and EBIT margin
+8.6% +10.7% +5.8%
13.2% 14.0% 13.8%
+6.0%
14.3%
+4.3%
11.8%
Sales split by customer mix H1 2017
Top 10 customers
40%
60%
Top 10 automotive customers
Other customers
Automotive sales by region H1 2017y-o-y growth (FX adjusted)
Sales H1 2017: EUR 5,455 mn
50%
22%
17%11%
Americas+7.6% (+4.4% )
Greater China+20.2% (+22.5% )
Europe-0.7% (-1.1% )
Asia/Pacific+10.1% (+6.8% )
Automotive sales by Business Division H1 2017y-o-y growth (FX adjusted)
25%
43%
17%
15% Chassis+3.0% (+1.7%)
Engine+5.7% (+4.8%)
Transmission+7.1% (+6.3%)
Aftermarket+2.3% (+0.8%)
83%
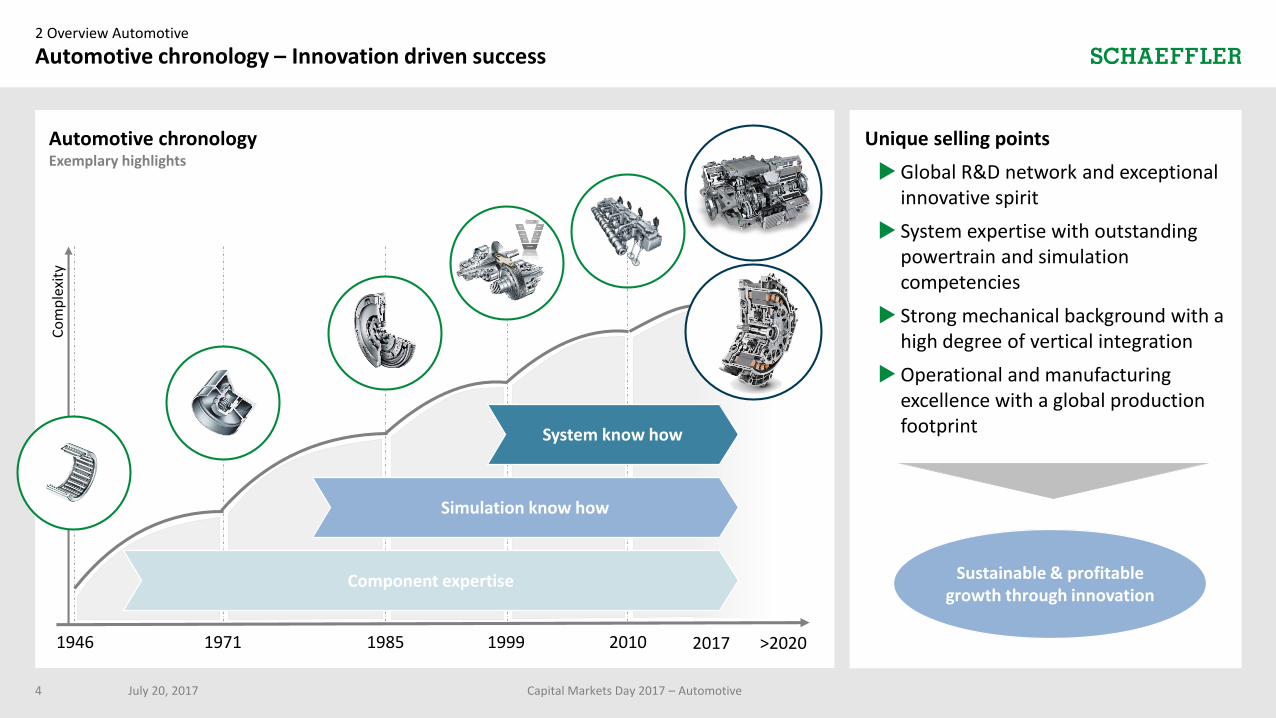
Unique selling points
Global R&D network and exceptional innovative spirit
System expertise with outstanding powertrain and simulation competencies
Strong mechanical background with a high degree of vertical integration
Operational and manufacturing excellence with a global production footprint
2 Overview Automotive
Automotive chronology – Innovation driven success
July 20, 2017 Capital Markets Day 2017 – Automotive4
1971 1985 19991946 2017
Automotive chronologyExemplary highlights
Sustainable & profitable growth through innovation
2010
Component expertise
Co
mp
lexi
ty
Simulation know how
>2020
System know how
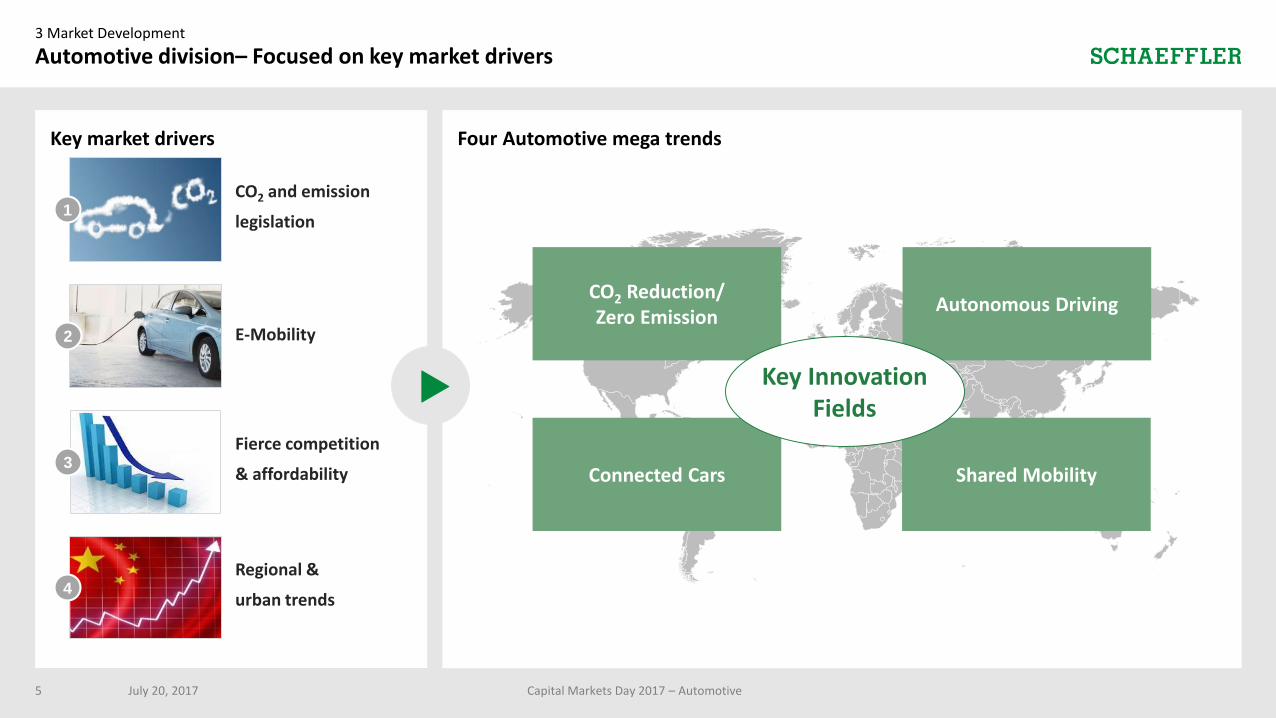
Key market drivers Four Automotive mega trends
3 Market Development
Automotive division– Focused on key market drivers
July 20, 2017 Capital Markets Day 2017 – Automotive5
Autonomous Driving
CO2 Reduction/Zero Emission
Autonomous Driving
Shared MobilityConnected Cars
Key Innovation Fields
2 E-Mobility
3Fierce competition
& affordability
4Regional &
urban trends
1CO2 and emission
legislation
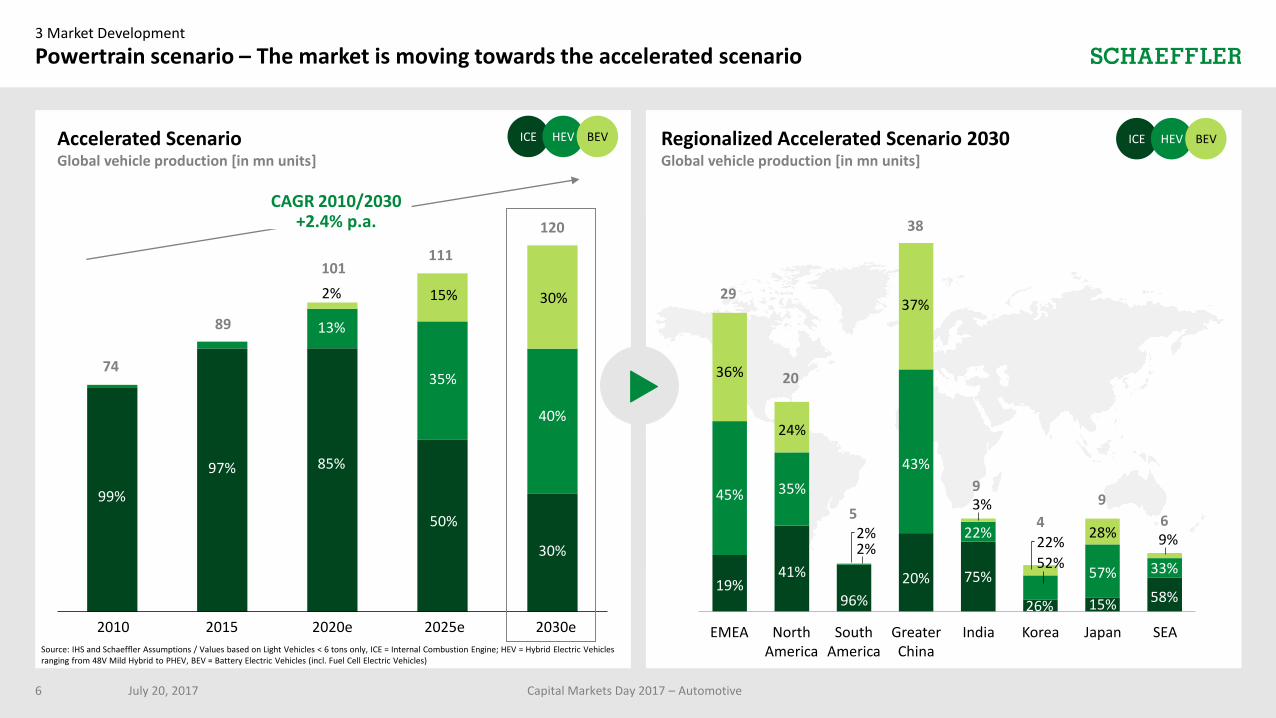
Accelerated ScenarioGlobal vehicle production [in mn units]
3 Market Development
Powertrain scenario – The market is moving towards the accelerated scenario
2020e20152010 2030e2025e
99%
97% 85%
50%
30%
13%
35%
40%
30%
CAGR 2010/2030 +2.4% p.a.
15%
74
89
101111
120
2%
July 20, 2017 Capital Markets Day 2017 – Automotive6
Source: IHS and Schaeffler Assumptions / Values based on Light Vehicles < 6 tons only, ICE = Internal Combustion Engine; HEV = Hybrid Electric Vehicles ranging from 48V Mild Hybrid to PHEV, BEV = Battery Electric Vehicles (incl. Fuel Cell Electric Vehicles)
Regionalized Accelerated Scenario 2030Global vehicle production [in mn units]
EMEA North America
South America
India SEAJapanKoreaGreater China
43%
96%
20
19%41%
35%
36%
37%
5
24%
29
45%
6
57%
15% 58%
9
28%
33%
26%
9
20% 75%
3%
22%
38
52%
22%
49%
2%2%
ICE HEV BEV ICE HEV BEV
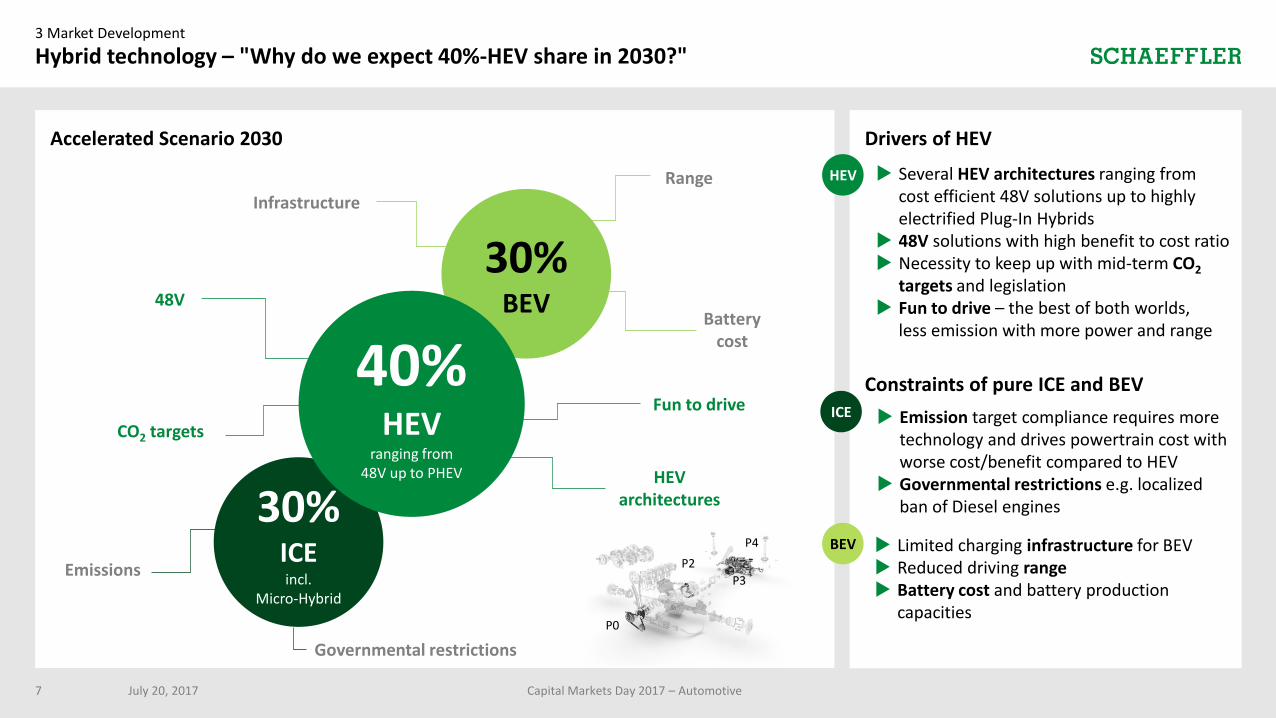
Accelerated Scenario 2030 Drivers of HEV
Constraints of pure ICE and BEV
3 Market Development
Hybrid technology – "Why do we expect 40%-HEV share in 2030?"
July 20, 2017 Capital Markets Day 2017 – Automotive7
30%ICEincl.
Micro-Hybrid
30%BEV
40%HEV
ranging from 48V up to PHEV
48V
Infrastructure
HEVarchitectures
Governmental restrictions
CO2 targets
Batterycost
Emissions
Range
BEV
HEV
ICE
Limited charging infrastructure for BEV Reduced driving range Battery cost and battery production
capacities
Several HEV architectures ranging from cost efficient 48V solutions up to highly electrified Plug-In Hybrids
48V solutions with high benefit to cost ratio Necessity to keep up with mid-term CO2
targets and legislation Fun to drive – the best of both worlds,
less emission with more power and range
Emission target compliance requires more technology and drives powertrain cost with worse cost/benefit compared to HEV
Governmental restrictions e.g. localized ban of Diesel engines
P0
P2
P3
P4
Fun to drive
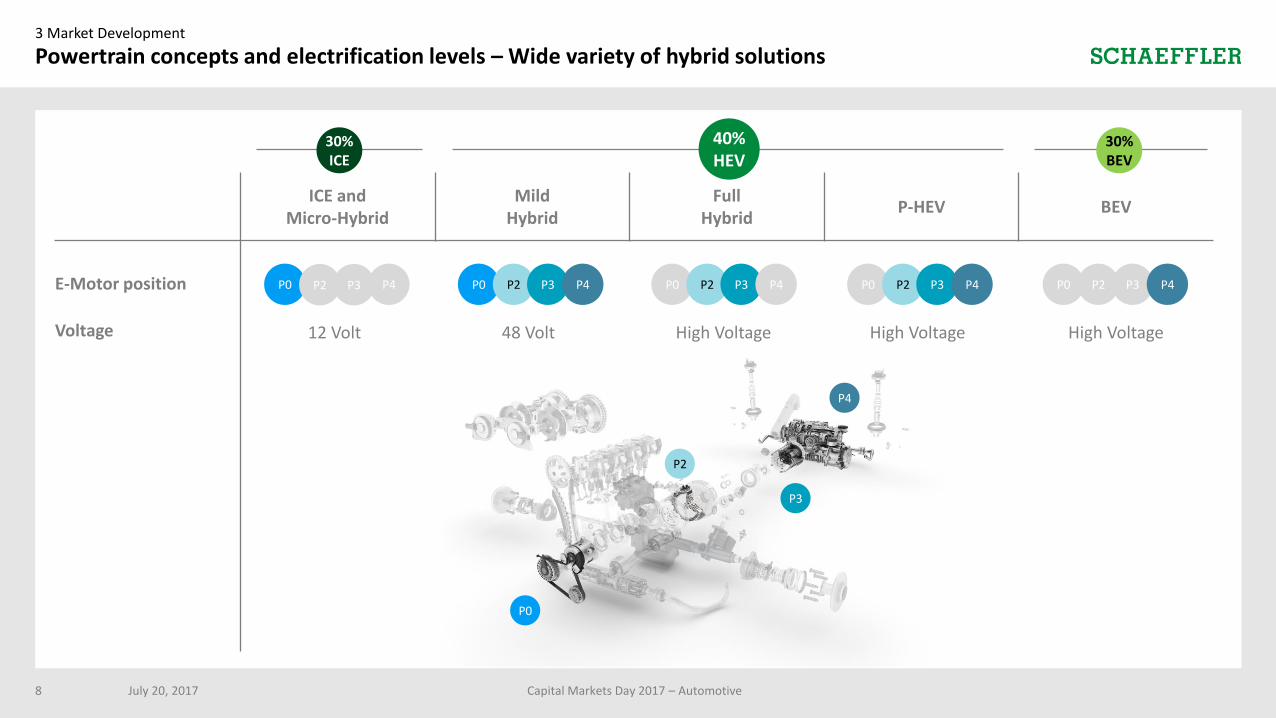
ICE andMicro-Hybrid
Mild Hybrid
FullHybrid
P-HEV BEV
3 Market Development
July 20, 2017 Capital Markets Day 2017 – Automotive8
Powertrain concepts and electrification levels – Wide variety of hybrid solutions
P2
P3
P0
P4
E-Motor position
Voltage
P0 P2 P3 P4
High Voltage
P0 P2 P3 P4
High Voltage
P0 P2 P3 P4
High Voltage
P0 P2 P3 P4
48 Volt
P0 P2 P3 P4
12 Volt
30%BEV
40%HEV
30%ICE
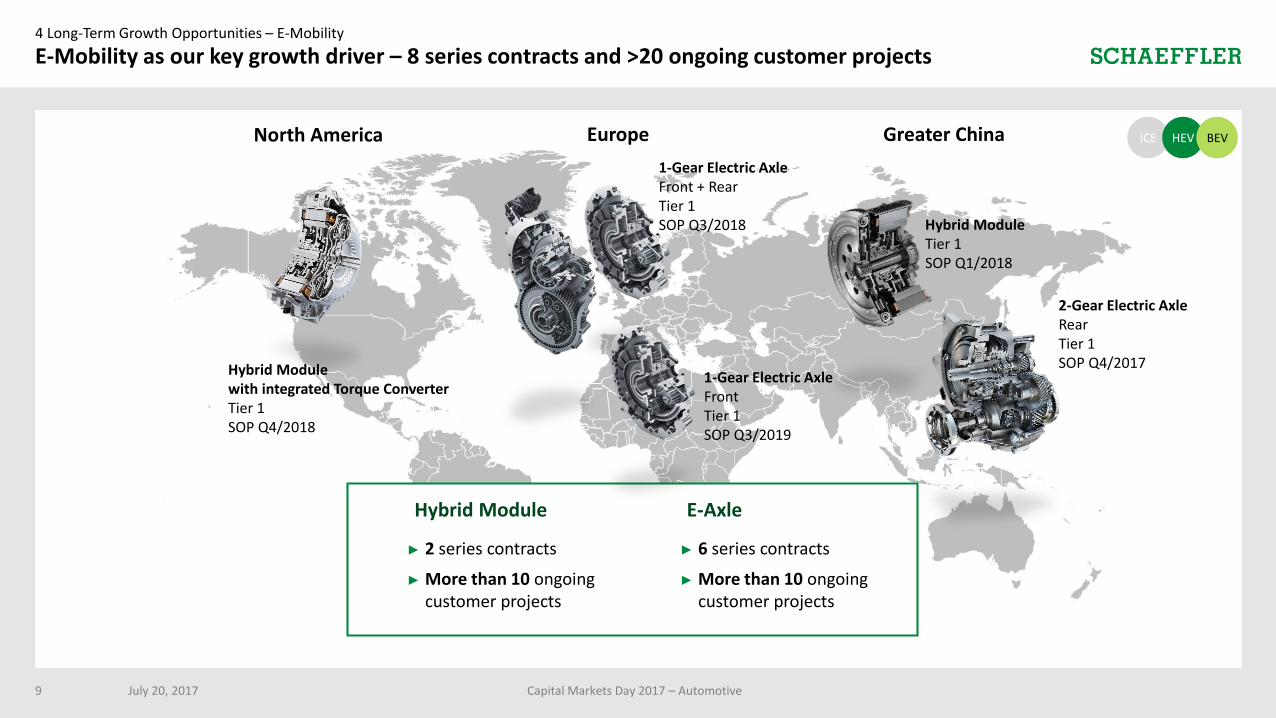
4 Long-Term Growth Opportunities – E-Mobility
E-Mobility as our key growth driver – 8 series contracts and >20 ongoing customer projects
Hybrid Module with integrated Torque ConverterTier 1SOP Q4/2018
North America
1-Gear Electric AxleFront + RearTier 1SOP Q3/2018
1-Gear Electric AxleFrontTier 1SOP Q3/2019
Europe
2-Gear Electric AxleRearTier 1SOP Q4/2017
Hybrid ModuleTier 1SOP Q1/2018
Greater China
► 2 series contracts
► More than 10 ongoing customer projects
Hybrid Module
► 6 series contracts
► More than 10 ongoing customer projects
E-Axle
July 20, 2017 Capital Markets Day 2017 – Automotive9
ICE HEV BEV
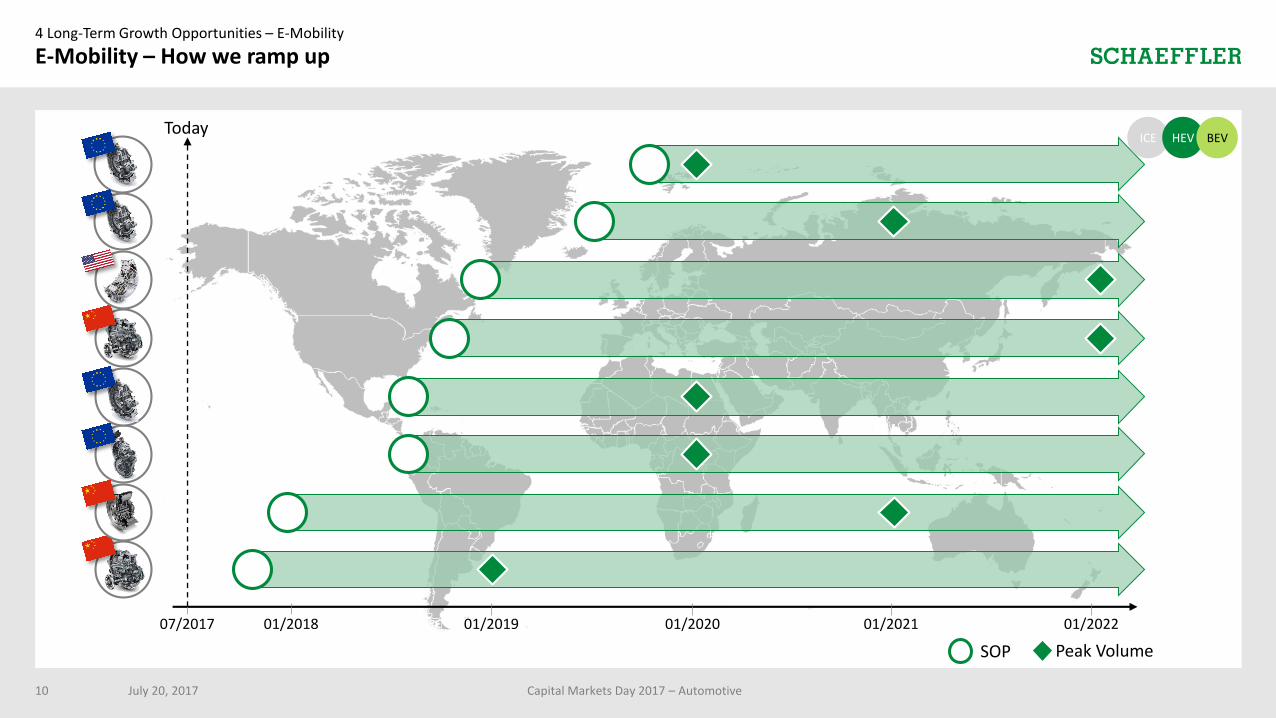
01/2018 01/2019 01/2020 01/2021 01/2022
4 Long-Term Growth Opportunities – E-Mobility
E-Mobility – How we ramp up
July 20, 201710
SOP Peak Volume
ICE HEV BEV
07/2017
Today
Capital Markets Day 2017 – Automotive
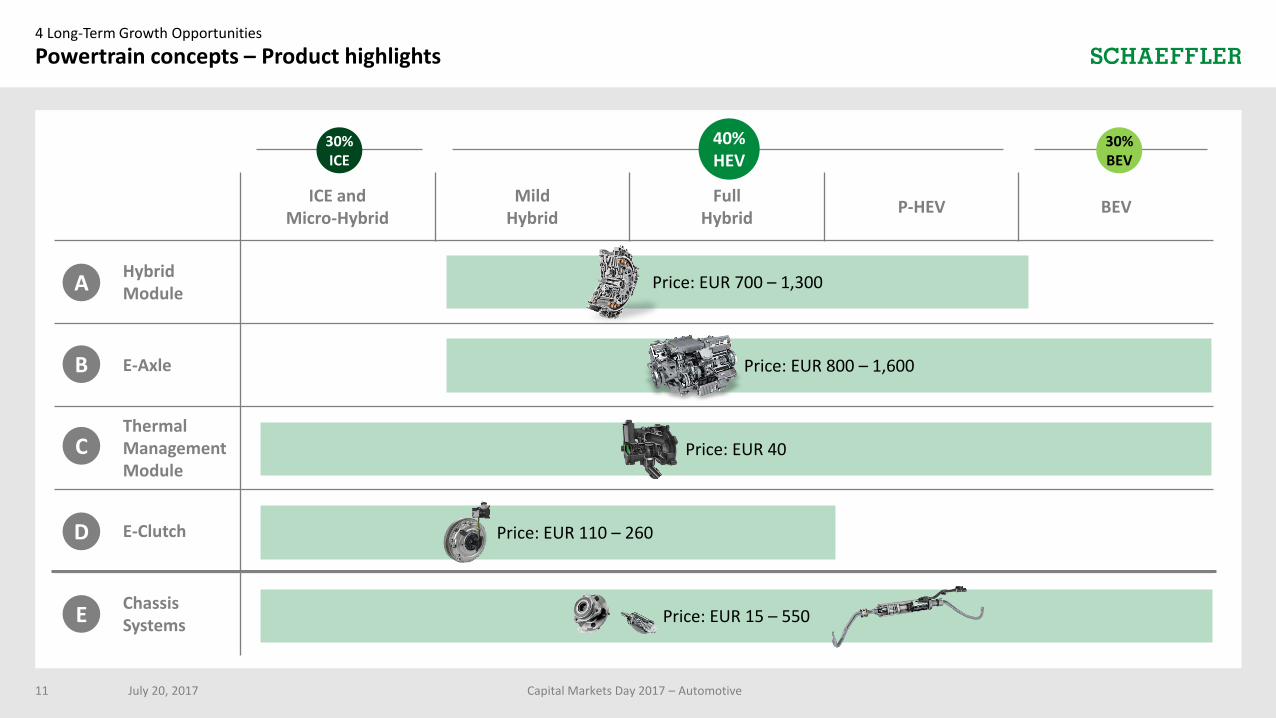
ICE andMicro-Hybrid
Mild Hybrid
FullHybrid
P-HEV BEV
HybridModule
E-Axle
Thermal Management Module
E-Clutch
ChassisSystems
Price: EUR 700 – 1,300
4 Long-Term Growth Opportunities
July 20, 2017 Capital Markets Day 2017 – Automotive11
Price: EUR 800 – 1,600
Price: EUR 40
Price: EUR 110 – 260
Price: EUR 15 – 550
30%BEV
Powertrain concepts – Product highlights
A
B
C
D
E
40%HEV
30%ICE
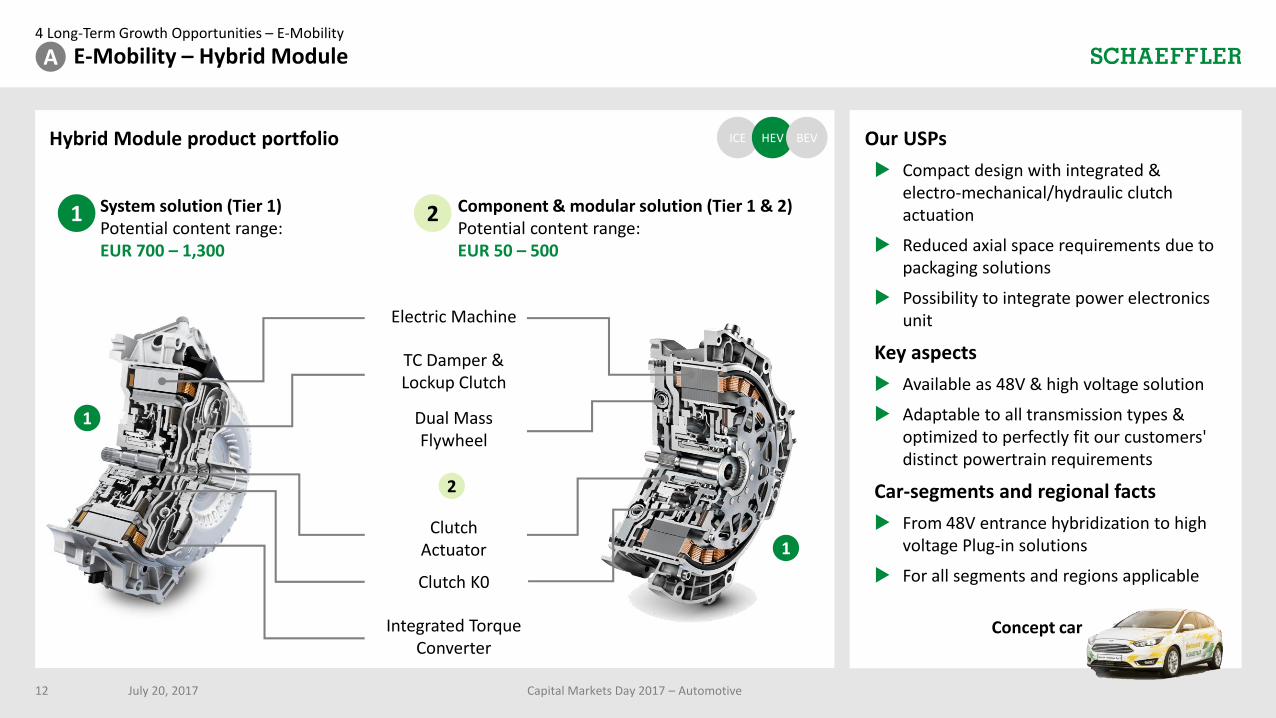
Hybrid Module product portfolio
4 Long-Term Growth Opportunities – E-Mobility
E-Mobility – Hybrid Module
July 20, 2017 Capital Markets Day 2017 – Automotive12
Our USPs
Compact design with integrated & electro-mechanical/hydraulic clutch actuation
Reduced axial space requirements due to packaging solutions
Possibility to integrate power electronics unit
Key aspects
Available as 48V & high voltage solution
Adaptable to all transmission types & optimized to perfectly fit our customers' distinct powertrain requirements
Car-segments and regional facts
From 48V entrance hybridization to high voltage Plug-in solutions
For all segments and regions applicable
Electric Machine
Clutch K0
Dual Mass Flywheel
Clutch Actuator
TC Damper & Lockup Clutch
Integrated Torque Converter
System solution (Tier 1) Potential content range: EUR 700 – 1,300
Component & modular solution (Tier 1 & 2)Potential content range: EUR 50 – 500
2
ICE HEV BEV
A
1
1
2
Concept car
1
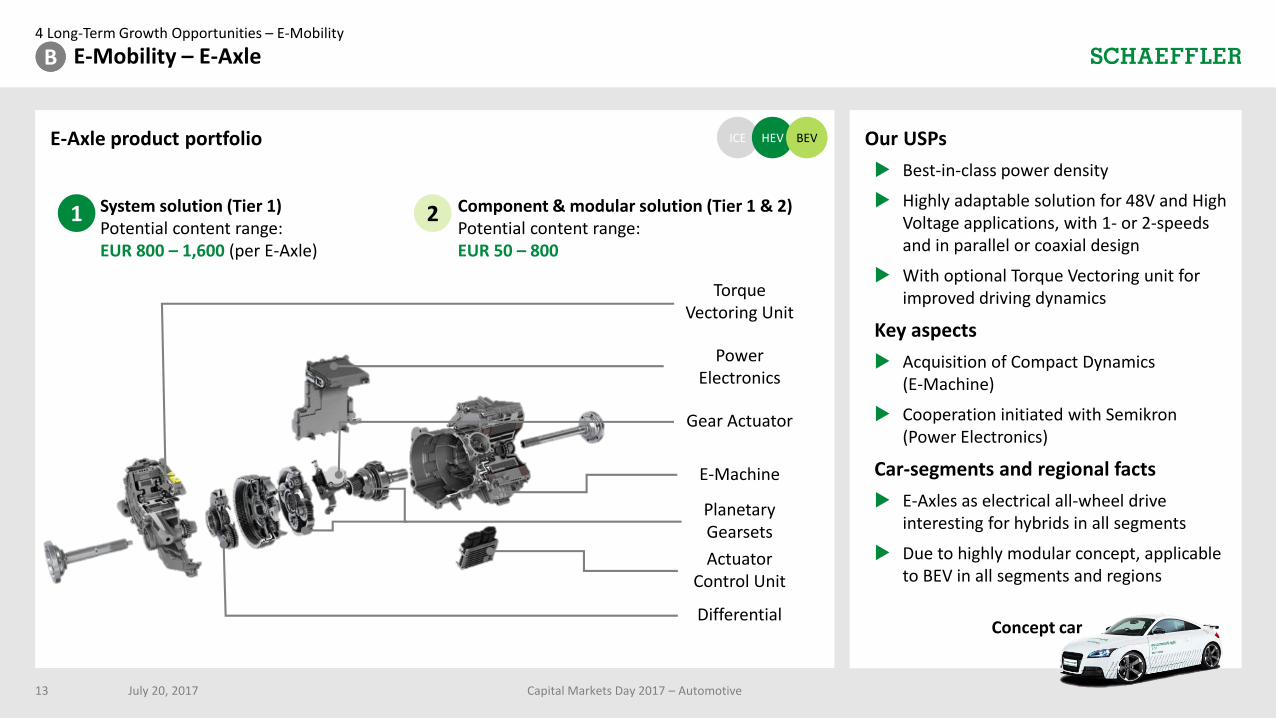
4 Long-Term Growth Opportunities – E-Mobility
E-Mobility – E-Axle
July 20, 2017 Capital Markets Day 2017 – Automotive13
Our USPs
Best-in-class power density
Highly adaptable solution for 48V and High Voltage applications, with 1- or 2-speeds and in parallel or coaxial design
With optional Torque Vectoring unit for improved driving dynamics
Key aspects
Acquisition of Compact Dynamics (E-Machine)
Cooperation initiated with Semikron(Power Electronics)
Car-segments and regional facts
E-Axles as electrical all-wheel drive interesting for hybrids in all segments
Due to highly modular concept, applicable to BEV in all segments and regions
E-Axle product portfolio
Torque Vectoring Unit
PowerElectronics
Gear Actuator
Planetary Gearsets
E-Machine
Actuator Control Unit
DifferentialConcept car
ICE HEV BEV
bB
Component & modular solution (Tier 1 & 2)Potential content range: EUR 50 – 800
2System solution (Tier 1) Potential content range:EUR 800 – 1,600 (per E-Axle)
1
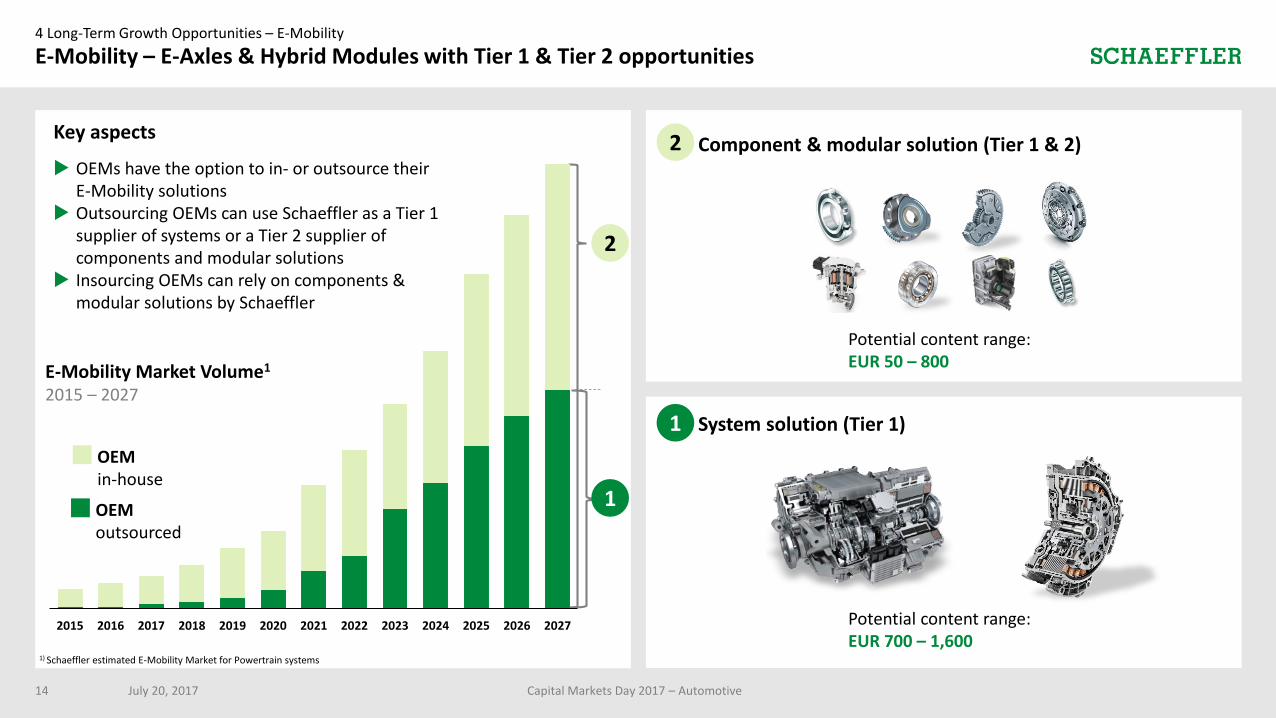
System solution (Tier 1)
Potential content range: EUR 700 – 1,600
Component & modular solution (Tier 1 & 2)
Potential content range: EUR 50 – 800
4 Long-Term Growth Opportunities – E-Mobility
E-Mobility – E-Axles & Hybrid Modules with Tier 1 & Tier 2 opportunities
July 20, 2017 Capital Markets Day 2017 – Automotive14
1) Schaeffler estimated E-Mobility Market for Powertrain systems
OEMin-house
OEMoutsourced
2
1
Key aspects
OEMs have the option to in- or outsource their E-Mobility solutions
Outsourcing OEMs can use Schaeffler as a Tier 1 supplier of systems or a Tier 2 supplier of components and modular solutions
Insourcing OEMs can rely on components & modular solutions by Schaeffler
E-Mobility Market Volume1
2015 – 2027
2
1
2015 2016 2017 2018 2019 2020 2021 2022 2023 2024 2025 2026 2027
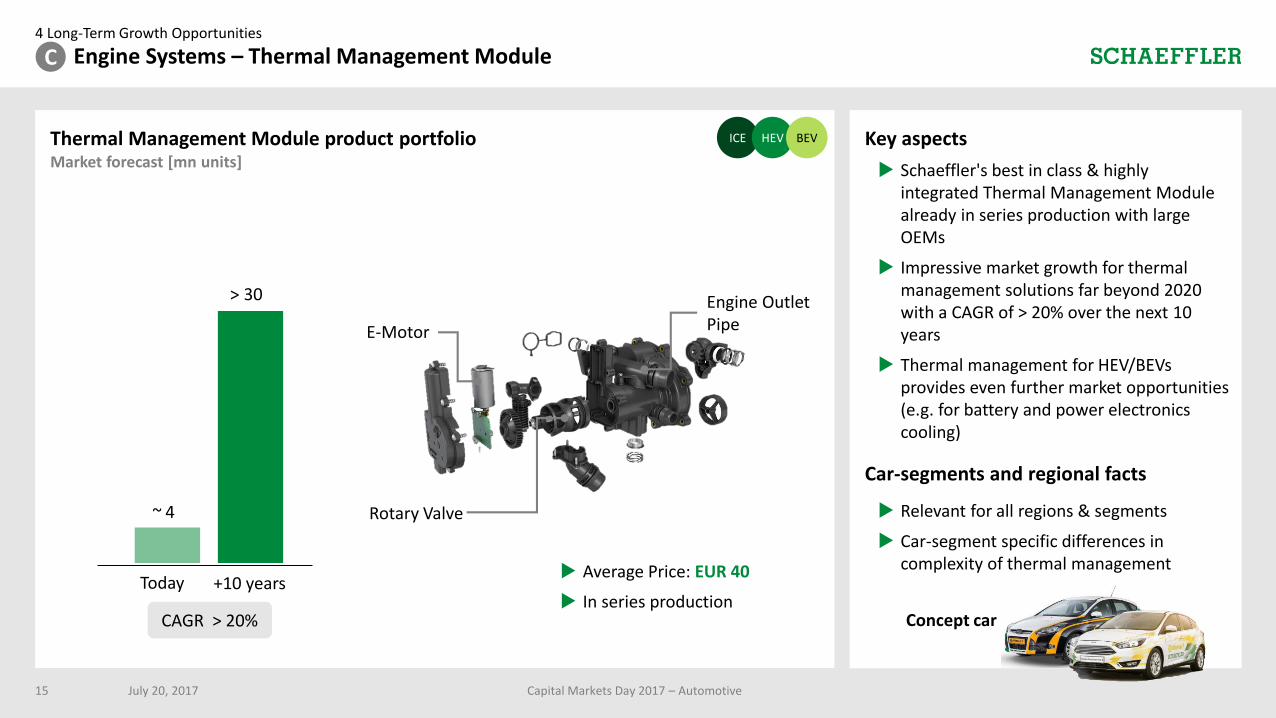
Engine Systems – Thermal Management Module
Thermal Management Module product portfolio Key aspects
Schaeffler's best in class & highly integrated Thermal Management Module already in series production with large OEMs
Impressive market growth for thermal management solutions far beyond 2020 with a CAGR of > 20% over the next 10 years
Thermal management for HEV/BEVs provides even further market opportunities (e.g. for battery and power electronics cooling)
Car-segments and regional facts
Relevant for all regions & segments
Car-segment specific differences in complexity of thermal management
4 Long-Term Growth Opportunities
July 20, 2017 Capital Markets Day 2017 – Automotive15
4
30
~
>
Today +10 years
Market forecast [mn units]
ICE HEV BEV
C
Concept car
E-Motor
Rotary Valve
Engine Outlet Pipe
CAGR > 20%
Average Price: EUR 40
In series production
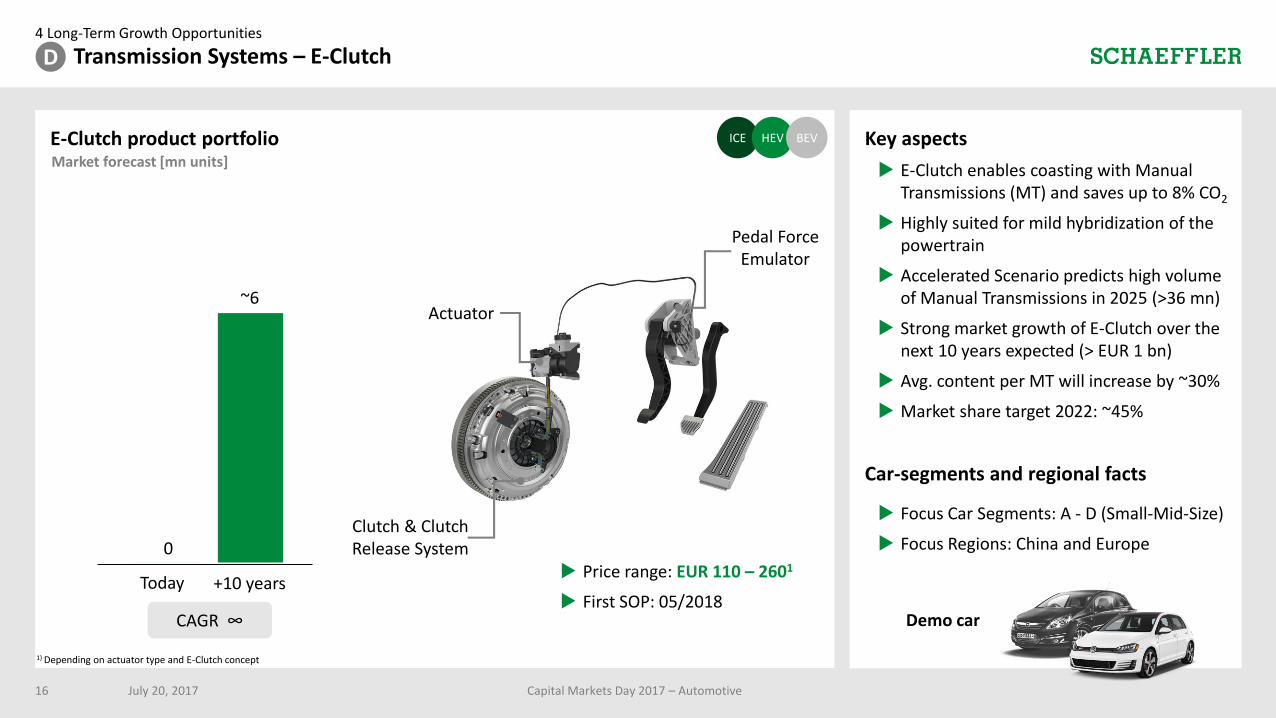
E-Clutch product portfolio Key aspects
E-Clutch enables coasting with Manual Transmissions (MT) and saves up to 8% CO2
Highly suited for mild hybridization of the powertrain
Accelerated Scenario predicts high volume of Manual Transmissions in 2025 (>36 mn)
Strong market growth of E-Clutch over the next 10 years expected (> EUR 1 bn)
Avg. content per MT will increase by ~30%
Market share target 2022: ~45%
Car-segments and regional facts
Focus Car Segments: A - D (Small-Mid-Size)
Focus Regions: China and Europe
4 Long-Term Growth Opportunities
July 20, 2017 Capital Markets Day 2017 – Automotive16
0
~6
Today +10 years
Market forecast [mn units]
1) Depending on actuator type and E-Clutch concept
ICE HEV BEV
Demo car
Transmission Systems – E-ClutchD
CAGR ∞
Actuator
Pedal Force Emulator
Clutch & Clutch Release System
Price range: EUR 110 – 2601
First SOP: 05/2018
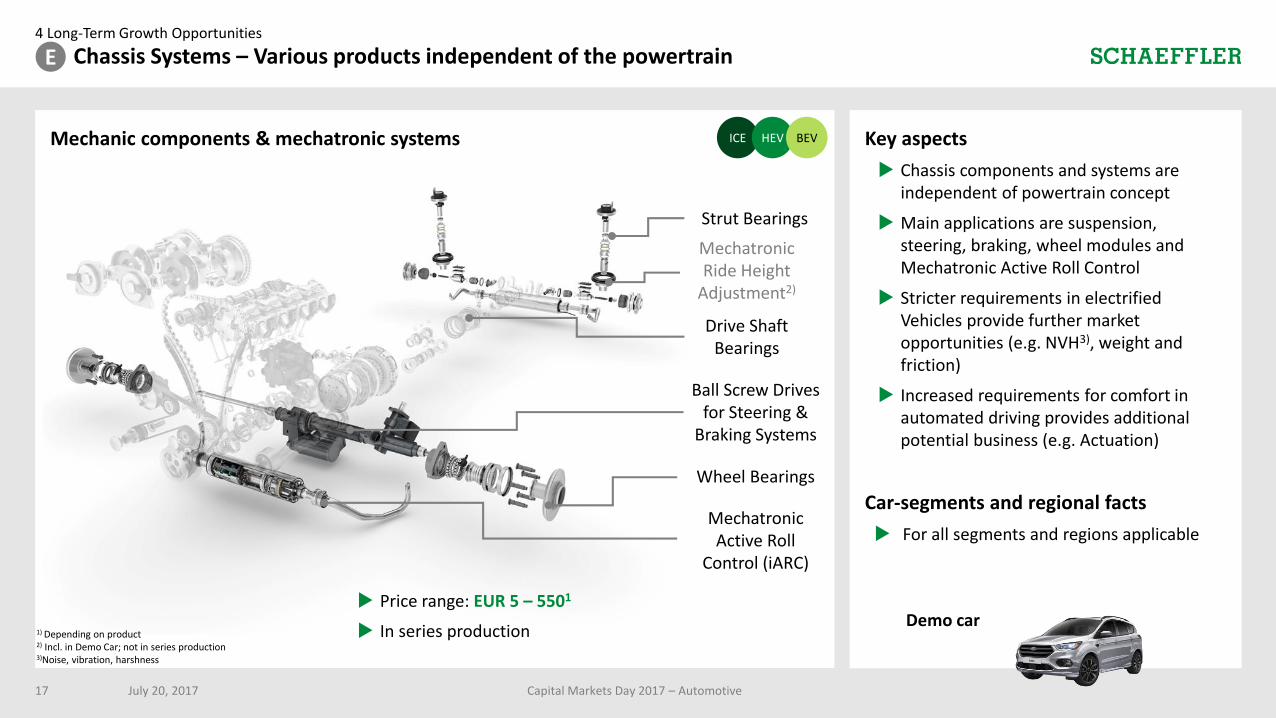
Mechanic components & mechatronic systems Key aspects
Chassis components and systems are independent of powertrain concept
Main applications are suspension, steering, braking, wheel modules and Mechatronic Active Roll Control
Stricter requirements in electrified Vehicles provide further market opportunities (e.g. NVH3), weight and friction)
Increased requirements for comfort in automated driving provides additional potential business (e.g. Actuation)
Car-segments and regional facts
For all segments and regions applicable
4 Long-Term Growth Opportunities
July 20, 2017 Capital Markets Day 2017 – Automotive17
Strut Bearings
ICE HEV BEV
Drive Shaft Bearings
Ball Screw Drives for Steering &
Braking Systems
Wheel Bearings
Mechatronic Active Roll
Control (iARC)
E Chassis Systems – Various products independent of the powertrain
1) Depending on product 2) Incl. in Demo Car; not in series production3)Noise, vibration, harshness
Price range: EUR 5 – 5501
In series productionDemo car
Mechatronic Ride Height
Adjustment2)
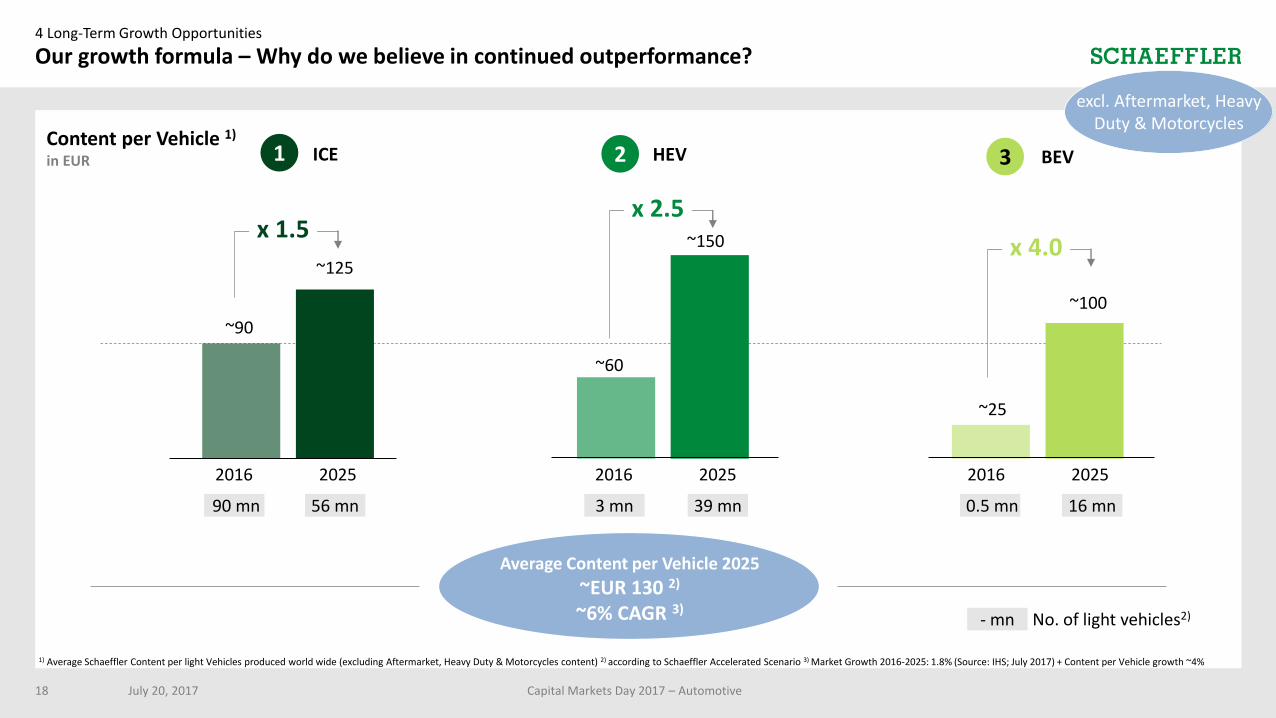
Content per Vehicle 1)
in EUR
4 Long-Term Growth Opportunities
July 20, 2017 Capital Markets Day 2017 – Automotive18
Our growth formula – Why do we believe in continued outperformance?
1 ICE 2 HEV 3 BEV
2016 2025 2016 2025 2016 2025
1) Average Schaeffler Content per light Vehicles produced world wide (excluding Aftermarket, Heavy Duty & Motorcycles content) 2) according to Schaeffler Accelerated Scenario 3) Market Growth 2016-2025: 1.8% (Source: IHS; July 2017) + Content per Vehicle growth ~4%
Average Content per Vehicle 2025
~EUR 130 2)
~6% CAGR 3)
~90
~125
~60
~150
~25
~100
90 mn 56 mn 3 mn 39 mn 0.5 mn 16 mn
No. of light vehicles2)- mn
x 1.5x 2.5
x 4.0
excl. Aftermarket, Heavy Duty & Motorcycles
4 Long-Term Growth Opportunities
July 20, 2017 Capital Markets Day 2017 – Automotive19
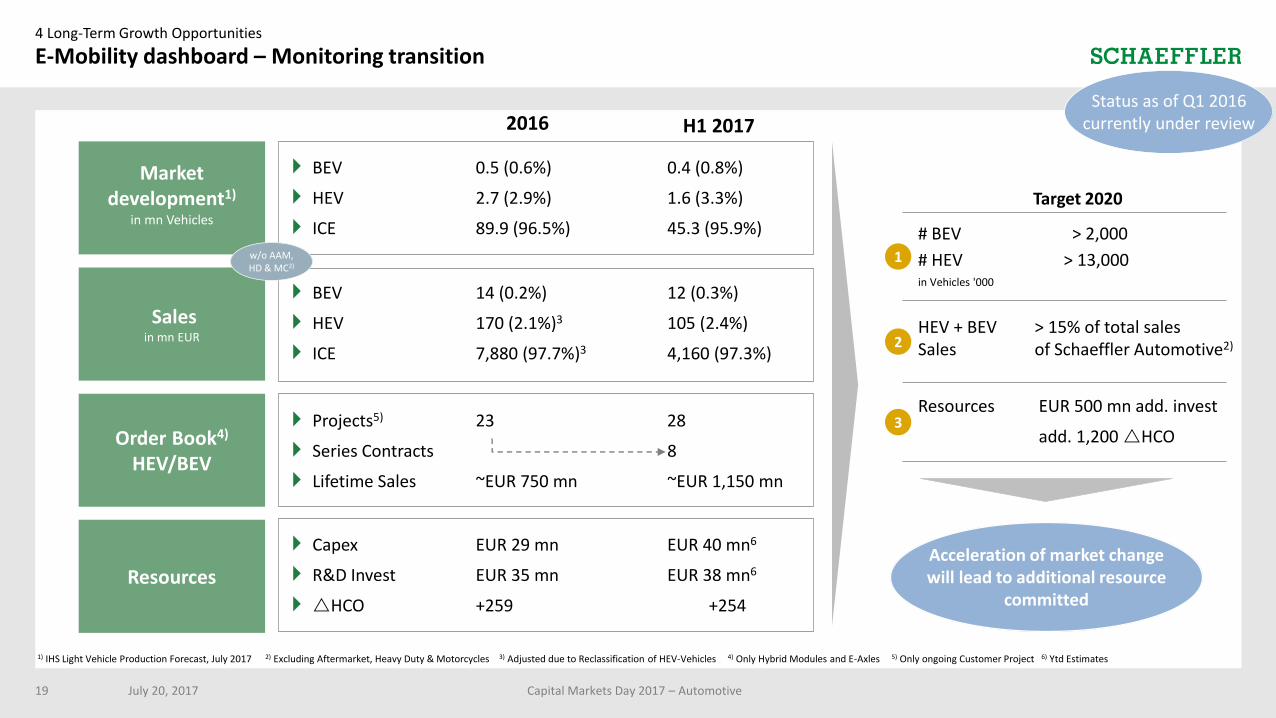
E-Mobility dashboard – Monitoring transition
Market development1)
in mn Vehicles
Salesin mn EUR
Order Book4)
HEV/BEV
Resources
2016 H1 2017
1) IHS Light Vehicle Production Forecast, July 2017 2) Excluding Aftermarket, Heavy Duty & Motorcycles 3) Adjusted due to Reclassification of HEV-Vehicles 4) Only Hybrid Modules and E-Axles 5) Only ongoing Customer Project 6) Ytd Estimates
BEV 0.5 (0.6%) 0.4 (0.8%)
HEV 2.7 (2.9%) 1.6 (3.3%)
ICE 89.9 (96.5%) 45.3 (95.9%)
BEV 14 (0.2%) 12 (0.3%)
HEV 170 (2.1%)3 105 (2.4%)
ICE 7,880 (97.7%)3 4,160 (97.3%)
w/o AAM, HD & MC2)
Projects5) 23 28
Series Contracts 8
Lifetime Sales ~EUR 750 mn ~EUR 1,150 mn
Capex EUR 29 mn EUR 40 mn6
R&D Invest EUR 35 mn EUR 38 mn6
HCO +259 +254
Target 2020
# BEV > 2,000
# HEV > 13,000in Vehicles '000
HEV + BEV > 15% of total salesSales of Schaeffler Automotive2)
Resources EUR 500 mn add. invest
add. 1,200 HCO
1
2
3
Acceleration of market change will lead to additional resource
committed
Status as of Q1 2016 currently under review

Today As of January 1st, 2018
Bundling of the E-Mobility activity at Schaeffler to advance the transition towards E-Mobility by:
Presenting one face to the customer
Creating R&D synergies
Quicker decision making processes
A unified controlling to monitor progress
4 Long-Term Growth Opportunities
Business Division E-Mobility – Better alignment between key activities effective January 1st, 2018
July 20, 2017 Capital Markets Day 2017 – Automotive20
EUCN
US
HZA
BHL
CustomerInterface
ProjectCulture
HybridModule
Simulation
Manu-facturing
Proto-typing
Pre-develop-
ment
E-Axle
R&D
R&D
HZA
BHL
Pre-develop-
ment
HybridModule
EU
ProjectCulture
Market
Proto-typing
Simulation
US
Manu-facturing
CN
CustomerInterface
E-Axle
Purchasing
Purchasing
Business DivisionE-Mobility
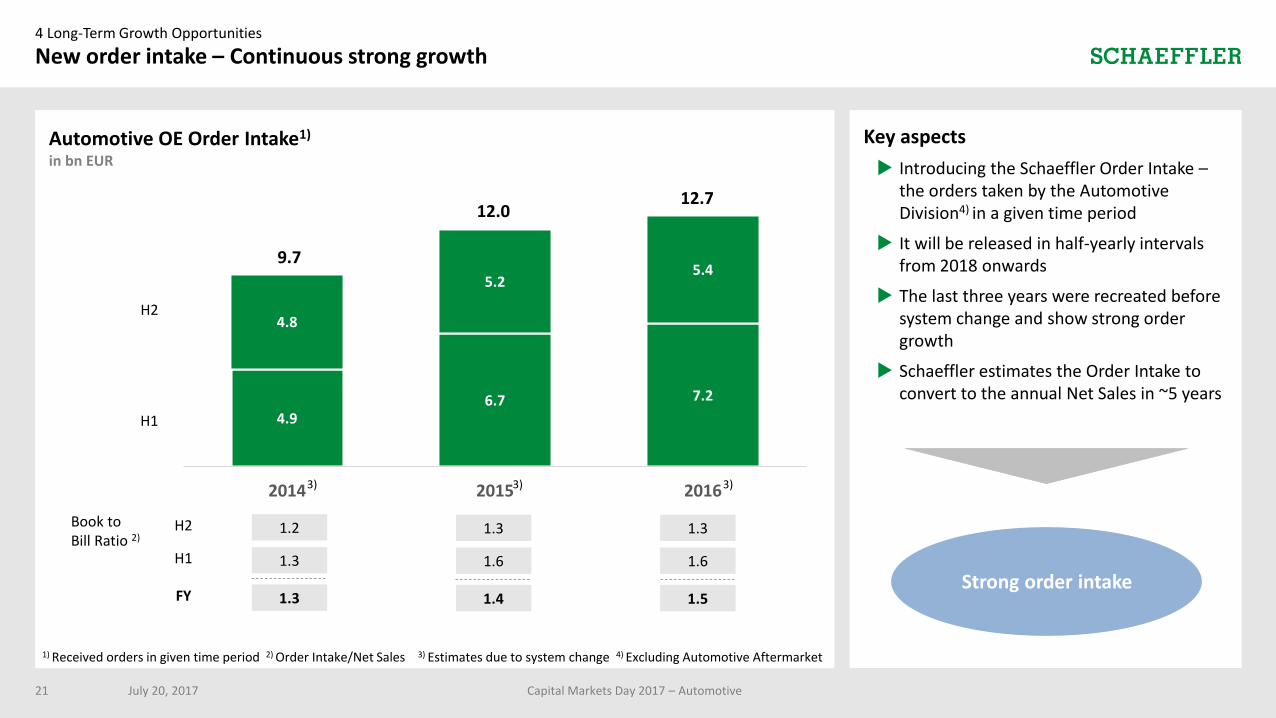
4.96.7 7.2
4.8
5.25.4
2014 2015 2016
H1 H2
4 Long-Term Growth Opportunities
New order intake – Continuous strong growth
July 20, 2017 Capital Markets Day 2017 – Automotive21
1) Received orders in given time period 2) Order Intake/Net Sales 3) Estimates due to system change 4) Excluding Automotive Aftermarket
12.012.7
1.6
Book to Bill Ratio 2)
1.3
1.5
1.6
1.3
1.4
Automotive OE Order Intake1)
in bn EUR
H1
H2
FY
Key aspects
Introducing the Schaeffler Order Intake –the orders taken by the Automotive Division4) in a given time period
It will be released in half-yearly intervals from 2018 onwards
The last three years were recreated before system change and show strong order growth
Schaeffler estimates the Order Intake to convert to the annual Net Sales in ~5 years
9.7
1.3
1.2
1.3
3) 3) 3)
Strong order intake
H1
H2
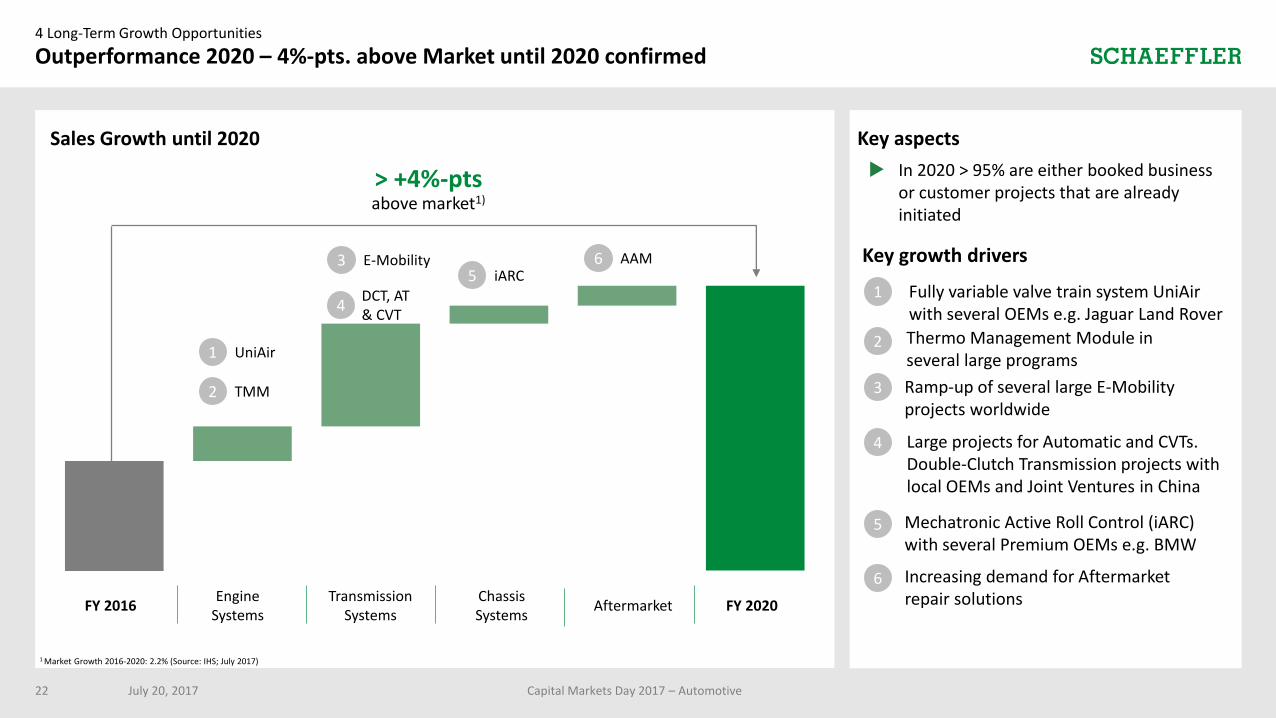
Sales Growth until 2020
4 Long-Term Growth Opportunities
Outperformance 2020 – 4%-pts. above Market until 2020 confirmed
July 20, 2017 Capital Markets Day 2017 – Automotive22
AftermarketChassis Systems
FY 2016Engine
SystemsTransmission
SystemsFY 2020
1 UniAir
4DCT, AT & CVT
2 TMM
3 E-Mobility5 iARC
Fully variable valve train system UniAir with several OEMs e.g. Jaguar Land Rover
1
Thermo Management Module in several large programs
2
Large projects for Automatic and CVTs.Double-Clutch Transmission projects with local OEMs and Joint Ventures in China
4
Ramp-up of several large E-Mobility projects worldwide
3
Mechatronic Active Roll Control (iARC) with several Premium OEMs e.g. BMW
5
6 AAM
Increasing demand for Aftermarket repair solutions
6
1 Market Growth 2016-2020: 2.2% (Source: IHS; July 2017)
> +4%-ptsabove market1)
Key aspects
In 2020 > 95% are either booked business or customer projects that are already initiated
Key growth drivers
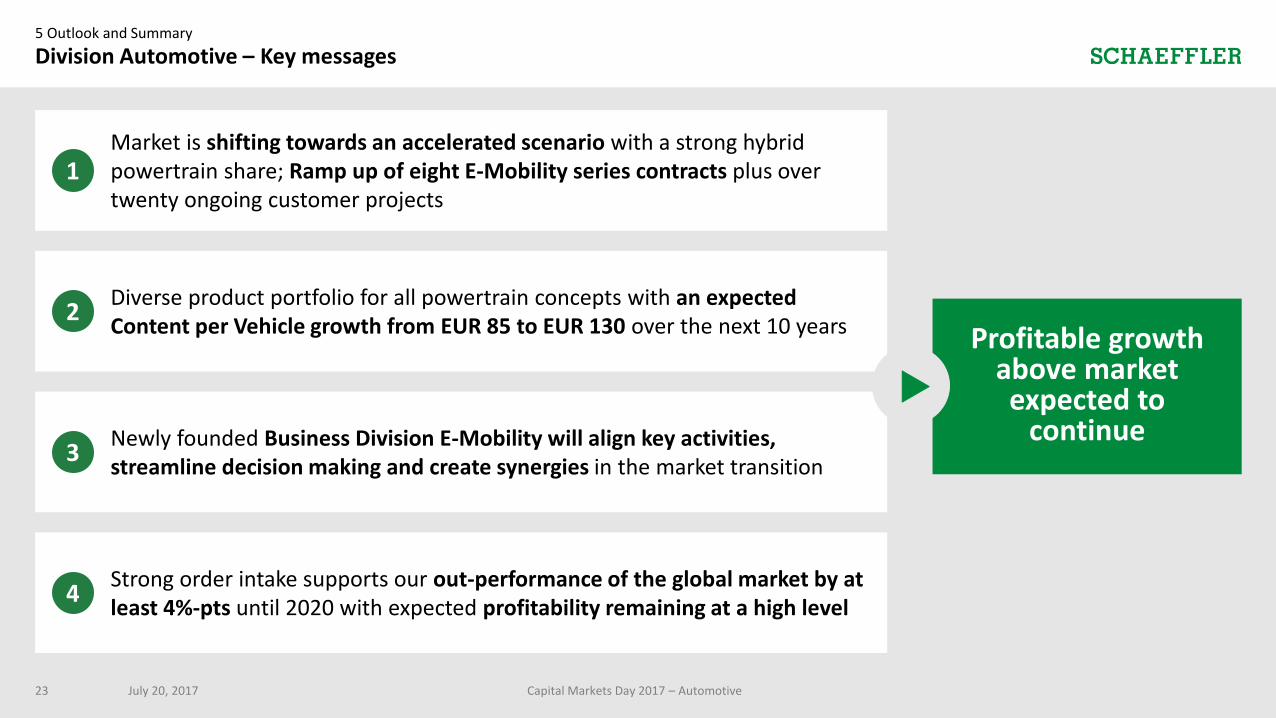
5 Outlook and Summary
Division Automotive – Key messages
Market is shifting towards an accelerated scenario with a strong hybrid powertrain share; Ramp up of eight E-Mobility series contracts plus over twenty ongoing customer projects
Diverse product portfolio for all powertrain concepts with an expected Content per Vehicle growth from EUR 85 to EUR 130 over the next 10 years
Newly founded Business Division E-Mobility will align key activities, streamline decision making and create synergies in the market transition
Strong order intake supports our out-performance of the global market by at least 4%-pts until 2020 with expected profitability remaining at a high level
1
2
3
4
Profitable growth above market expected to
continue
Capital Markets Day 2017 – Automotive23 July 20, 2017