Embed Size (px)
Citation preview

On-site natural gas piping
Scenarios and failure frequencies
Report 620550004/2011
A.A.C. van Vliet | L. Gooijer | G.M.H. Laheij
National Insitute for Public Healthand the Environment P.O. Box 1 | 3720 BA Bilthovenwww.rivm.com

On-site natural gas piping Scenarios and failure frequencies
RIVM Report 620550004/2011

RIVM Report 620550004
Page 2 of 79
Colophon
© RIVM 2011 Parts of this publication may be reproduced, provided acknowledgement is given to the 'National Institute for Public Health and the Environment', along with the title and year of publication.
A.A.C. van Vliet L. Gooijer G.M.H. Laheij Contact: RIVM Centrum Externe Veiligheid [email protected]
This investigation has been performed by order and for the account of Minstry of Infrastructure and the Environment, within the framework of M/620550/10/RI.

RIVM Report 620550004
Page 3 of 79
Abstract
On-site Natural Gas Piping RIVM has been commissioned by the Ministry of Infrastructure and the Environment to derive failure frequencies and scenarios for above-ground gas pipelines at natural gas establishments. These are part of the natural gas infrastructure. Flange connections are considered separately. The failure frequencies and scenarios can be used to determine third-party risks, using the risk methodology for natural gas establishments which is currently being developed. This methodology will be part of the Reference Manual Bevi Risk Assessments, which is to be used according to the External Safety (Establishments) Decree. This study was conducted because the current manual does not specifically address these types of establishments.
Two standard scenarios have been examined: leaks and ruptures. The failure frequencies for piping are derived from European data for transmission pipelines. This was decided because there is no useful specific information present for above-ground natural gas pipelines in literature or databases. Moreover, the Dutch gas industry data contain no relevant leaks or ruptures. For flange leaks, the failure frequency is based on statistics for the Dutch gas industry. Flange connections themselves cannot rupture. However, a leak from a flange connection can lead to a rupture of a pipe; it is therefore recommended to take this domino effect into account in risk calculations.
This study also shows that the contribution of external events, such as vehicle impact and lifting operations, should be included in the accident scenarios and failure frequencies. It is recommended to validate current models for these events. Another recommendation is to improve Dutch accident databases to make them suitable for detailed analysis of incidents and to determine failure frequencies.
Key words: QRA, natural gas, piping, failure frequency

RIVM Report 620550004
Page 4 of 79

RIVM Report 620550004
Page 5 of 79
Rapport in het kort
Aardgasleidingen op inrichtingen Het RIVM heeft in opdracht van het ministerie van Infrastructuur en Milieu ongevalskansen van scenario’s bepaald voor bovengrondse aardgasleidingen op aardgasinrichtingen. Dit zijn onderdelen van de aardgasinfrastructuur waarbij apart is gekeken naar ‘flensverbindingen’, die leidingdelen met elkaar verbinden. De scenario’s en ongevalskansen kunnen worden gebruikt om de risico’s voor de omgeving in kaart te brengen. Dit gebeurt met de rekenmethodiek voor aardgasinrichtingen die momenteel wordt ontwikkeld. Deze methodiek zal deel uitmaken van de Handleiding risicoberekeningen bij het Besluit externe veiligheid inrichtingen. Het onderzoek is uitgevoerd omdat aardgasinrichtingen onder dit Besluit komen te vallen, maar de bijbehorende Handleiding nog niet specifiek op deze inrichtingen ingaat.
Er zijn twee standaardscenario’s onderzocht: lekken en breuken. De ongevalskansen van de leidingen zijn afgeleid uit Europese gegevens van transportleidingen. Hiervoor is gekozen omdat er geen bruikbare specifieke gegevens voor de bovengrondse hogedruk aardgasleidingen in literatuur of databanken aanwezig zijn. Bovendien bevatten de gegevens van de Nederlandse gasindustrie geen relevante lekken of breuken. Voor flenslekkages is de ongevalskans gebaseerd op de statistieken van de Nederlandse gasindustrie. Flensverbindingen zelf kunnen niet breken. Wel kan een lekkage van een flensverbinding tot een breuk van een leiding leiden, waardoor wordt aanbevolen dit domino-effect mee te nemen in een risicoberekening.
Verder blijkt uit dit onderzoek dat de bijdrage van externe gebeurtenissen, zoals aanrijdingen en hijswerkzaamheden, moet worden meegenomen in de ongevalskansen en scenario’s. Hier vloeit de aanbeveling uit voort om de huidige modellen voor deze gebeurtenissen te valideren. Een andere aanbeveling is om de Nederlandse ongevalsdatabanken zo te verbeteren dat ze ook geschikt zijn om incidenten gedetailleerder te analyseren, en om ongevalskansen te bepalen.
Trefwoorden: QRA, aardgas, leidingen, faalfrequentie

RIVM Report 620550004
Page 6 of 79

RIVM Report 620550004
Page 7 of 79
Contents
Summary—9
1 Introduction—13
2 Framework—15 2.1 Aim—15 2.2 Scope—15 2.3 Approach—15 2.4 Structure of the report—18
3 Survey—19 3.1 Literature—19 3.2 Data sources—21 3.3 International approaches—23
4 Statistics Natural Gas Industry—29 4.1 N.V. Nederlandse Gasunie—29 4.2 Nederlandse Aardolie Maatschappij—30 4.3 TAQA—31 4.4 Vermilion Oil and Gas Netherlands—33 4.5 Overview of the Dutch natural gas industry data—33 4.6 Other data sources—34
5 Analogies—37 5.1 Offshore data (HCRD)—37 5.2 Natural gas transmission pipelines—39
6 Derivation of Scenarios—41 6.1 Flange connections—41 6.2 Piping—42 6.3 Domino effects—42
7 Derivation of failure frequencies—43 7.1 Flange connections—43 7.2 Piping—44
8 Discussion and conclusions—53 8.1 Scenarios and failure frequencies—53 8.2 Domino effects—54 8.3 Further work—54
References—55 Appendix 1 Study group members—59 Appendix 2 MHIDAS—71 Appendix 3 HSE/HSL’s Method for dealing with zero failures—77

RIVM Report 620550004
Page 8 of 79

RIVM Report 620550004
Page 9 of 79
Summary
Onshore natural gas establishments are mentioned in the Dutch External Safety (Establishments) Decree (Bevi). Therefore, a formal methodology needs to be available. This methodology for onshore natural gas establishments is currently under development. The available failure frequencies for leaks and ruptures of on-site pipelines or piping are generically defined and broadly applied and it is investigated whether it is possible to create specific scenarios and failure frequencies for natural gas piping on establishments.
As manager of the risk assessment methodology, RIVM initiated an investigation on the failure data of high-pressure natural gas piping. The results of the investigation should lead to a new section in the risk method for mining establishments and other relevant methods.
In the Netherlands, third-party risk calculations are bound to prescribed calculation methods. Basically, these calculation methods are applicable to all situations that may arise within their scope. For the implementation of structural adjustments, such as a revision of scenarios and failure frequencies, an assessment framework is being used, describing the elements to be discussed. This approach includes guidelines for adjustments in the four key elements of a calculation method: scenarios and modelling; failure frequencies; mitigating measures and event probabilities. To substantiate proposals for updating a calculation method, requirements have to be met concerning transparency, verifiability, robustness and validity of the data available.
To obtain an overview of information already available, a data survey has been carried out. From international literature, failure data on piping and flanges, (potentially) resulting in a Loss of Containment (LoC) are collected. From this survey it is concluded that no database with specific data for the aboveground high-pressure gas piping on establishments is available. However, two analogies emerge as possibly suitable: offshore and transmission pipelines. For offshore the HCRD (HydroCarbon Release Database) is mentioned. For transmission lines, there are several options including the EGIG database.
Initially, for both piping and flange connections, two standard scenarios have been identified: leak and rupture. As pinholes do not contribute to third-party risk, this scenario is not taken into account. The realism of a rupture of a flange connection has been investigated using fracture mechanics. It is concluded that a flange connection can withstand a larger impact and stress than the pipeline it is connected to. Therefore, ruptures of flange connections can be excluded from the risk calculations.
For piping scenarios one issue is the transition from a large leak to a rupture. Due to propagation, a large leak will result in a full bore rupture. Based on the results of the calculations of the Gasunie and in accordance with the Dutch guideline, the maximum leak size proposed is a leak with a diameter of 50 mm. This leads to the following relevant scenarios.

RIVM Report 620550004
Page 10 of 79
Table 1 Relevant scenarios
Scenario Leak size (Diameter)
Flange connection Leak 10% D (max. 50 mm)
Rupture -
Piping Leak 10% D (max. 50 mm)
Rupture 100% D
Data is supplied from the Dutch natural gas industry by Gasunie, NAM, TAQA and Vermillion. These data are aggregated to derive a failure frequency for both flange connections and piping. No relevant events for piping are present in the data supplied by the industry. This is the same for the other data sources considered, such as databases from the State Supervision of Mines (a governmental organisation) and NOGEPA (Netherlands Oil and Gas Exploration and Production Association). As no relevant events for piping are present, the analogue systems are considered for deriving failure frequencies.
For the offshore data, the UK Hydrocarbon Releases Database (HCRD) System has been analysed. The HCRD is not selected as the most suitable analogy. Firstly because the HCRD does not contain full bore ruptures but ends with a category of holes with a diameter larger then 100 mm. Further, the experience (number of system years) in the HCRD is smaller than the experience of the Dutch natural gas industry. With regard to the natural gas transmission lines, the conclusion is that these could be used as an analogy for aboveground pipelines within establishments.
With regard to the natural gas transmission lines, the EGIG data from transmission lines in Europe have been selected as the best matching option for piping, after rating several options using four basic criteria (transparency, verifiability, robustness and validity). The table below shows a summary of the results concerning piping based on EGIG data.
Table 2 Failure frequencies for piping based on EGIG data
Failure frequency [m-1·year-1] Event type Events Experience
[m·years] Average 95th percentile
Leak 63 3.15 × 10⁹ 2 × 10⁻⁸ 2.5 × 10⁻⁸
Rupture 17 3.15 × 10⁹ 5.5 × 10⁻⁹ 8 × 10⁻⁹
Flange connections will have to be treated separately, as they are generally not used for buried pipelines. It is therefore concluded that for flange leakages the failure frequency for the leak is to be based on the statistics of the Dutch gas industry.
Table 3 Failure frequency for flange connections based on Dutch industry data
Failure frequency [year-1] Event type Events Experience
[years] Average 95th percentile
Leak 1 1,802,355 5.5 × 10⁻⁷ 2.6 × 10⁻⁶
Leaks of aboveground pipelines or flange connections are identified as possible initiating events for pipeline ruptures. A conditional probability of about 0.001 pipeline ruptures as a result of a leak has been

RIVM Report 620550004
Page 11 of 79
determined. E.g., for flanges, this results in an additional failure frequency of 5.5 ×10⁻¹⁰ (average) or 2.6 ×10⁻⁹ (95th percentile) per year for the piping sections, which could fail as a result of the domino effect.
In addition to these frequencies, the contribution of external events such as vehicle impact and lifting operations should be taken into account for the aboveground pipelines within establishments. As lifting activities and vehicle impact might dominate the failure frequency of aboveground pipelines, it is recommended to do some further work on validating the current impact models.
For the derivation of failure frequencies, the reports of HCRD, EGIG and UKOPA could be used. Dutch generic incident databases (NOGEPA and from the State Supervision of Mines) were not suitable for the derivation of frequencies. It is therefore recommended to improve the Dutch databases in such a way they will also be suitable for more detailed incident analysis and the determination of frequencies for risk assessments.

RIVM Report 620550004
Page 12 of 79

RIVM Report 620550004
Page 13 of 79
1 Introduction
Onshore natural gas establishments (including gas treatment, production and injection facilities) will be included in the Dutch External Safety (Establishments) Decree (Bevi) [1] in 2011. Therefore, a formal quantitative risk assessment (QRA) methodology must be available. This methodology for onshore natural gas establishments is currently under development. The available failure frequencies for leaks and ruptures of on-site pipelines or piping are generically defined and broadly applied and it is investigated whether it is possible to identify specific scenarios and failure frequencies for natural gas piping within establishments. From the literature, flanges were identified as a topic of interest as flange ruptures were identified as possible Loss of Containment (LoC) events for aboveground pipelines [2]. The study focuses on aboveground piping.
As manager of the risk assessment methodology, RIVM has initiated an investigation on the failure data of high-pressure natural gas piping. The results of the investigation should lead to a new section in the risk method for mining establishments and other relevant methods (e.g., section 3.8 of the Reference Manual Bevi Risk Assessments, Module C [3]).
The results of the research have been written in this report. Background reports have been written by N.V. Nederlandse Gasunie about flange connections [4], by DNV concerning the Hydrocarbon Release Database (HCRD) [5] and by GL Noble Denton concerning the use of data from (buried) natural gas transmission pipelines [6]. These three documents are annexed to this report.
The research described in this report was conducted in consultation with an international study group with members from industry and government institutions (see Appendix 1).

RIVM Report 620550004
Page 14 of 79

RIVM Report 620550004
Page 15 of 79
2 Framework
Within the Dutch quantitative risk assessment method, generic failure frequencies are laid down for the various Loss of Containment events (LoCs) [3] [7]. The current failure frequencies for aboveground pipelines are generically defined and broadly applied and it is suggested to use specific failure frequencies for natural gas piping in establishments.
2.1 Aim
The aim of the project is to derive scenarios and frequencies for the failure of onshore aboveground high-pressure natural gas piping within establishments. The aspects addressed are the scenario descriptions and frequencies with their underlying causes.
2.2 Scope
In short, the project is about ‘on-site natural gas piping’. To be more specific, the scope is limited to aboveground, high-pressure natural gas piping (> 16 bar; > 2-inch diameter) on onshore natural gas establishments with dry gas and wet gas with a condensate/gas ratio ≤ 80 m3/106 normal m3.
In this report the term ‘piping’ is used for the aboveground pipelines within establishments. This term has been chosen to make a difference with ‘pipework’ (related to (small) process pipelines with a lot of equipment and significant pressure or temperature changes) and ‘pipelines’ (related to – often buried – transmission pipelines for the transport between establishments).
The presence of flange connections is one of the differences between aboveground and buried pipelines. As mentioned in the introduction, flanges were identified as possible Loss of Containment (LoC) events for piping [2] [8]. Therefore, the project also concerns ‘flange connections’ as a relevant topic for the failure of aboveground pipelines within establishments. A ‘flange connection’ or ‘flanged joint’ consists of two flanges with a gasket in between. The two flanges are held together using a bolted connection.
This project is about piping and flange connections; other equipment such as valves are out of the scope of this study and are not taken into account.
The quantitative risk assessment is based on various LoC events. Initially, for both piping and flange connections, two standard scenarios have been identified: leak and rupture. As pinholes do not contribute to third-party risk, this scenario is not taken into account.
2.3 Approach
Third-party risk calculations are bound to prescribed calculation methods. Basically, these calculation methods are applicable to all situations that may arise within their scope. During the development of the calculation methodologies, choices were made reflecting a balance between uniformity and location-specific modelling. In some situations, the prescribed method may not be adequate. Therefore, a user has the possibility of using specific data on some occasions. Location specific

RIVM Report 620550004
Page 16 of 79
modelling needs to be justified, with the considerations and choices being documented.
There can be various reasons to incorporate new insights into existing calculation methodologies. This may lead to structural adjustments in a calculation methodology. For the implementation of structural adjustments an assessment framework [9] has been defined, which describes the elements that must be discussed. This approach includes guidelines for adjustments in the four key elements of a calculation methodology: release scenarios; failure frequencies; mitigating measures and event probabilities. To substantiate proposals for updating a calculation methodology, requirements have to be met concerning transparency, verifiability, robustness and validity of the data available [10]. The use of the assessment framework ensures a consistent approach for implementing adjustments in the calculation methods.
The derivation of failure frequencies needs to be unambiguous. Specific aspects of failure frequencies are: • Transparency: is it clear? The selection of incidents and the
population used for the derivation is clearly described, understandable and unambiguous. If the derivation is transparent, each expert should come to the same conclusions for the same situation.
• Verifiability: is it traceable? The selection and derivation are well documented and the data are traceable to the original sources, which should be available.
• Robustness: is it solid? The derivation follows a realistically safe (or conservative) approach in case of uncertainty. If there is a large uncertainty, estimates are conservative (e.g., using a 95th percentile). If more information is available, the estimate will be closer to the realistic value.
• Validity: is it true? The outcome should be realistic. Aspects that play a role are completeness and the scientific basis. Applicability (representation) is also important.
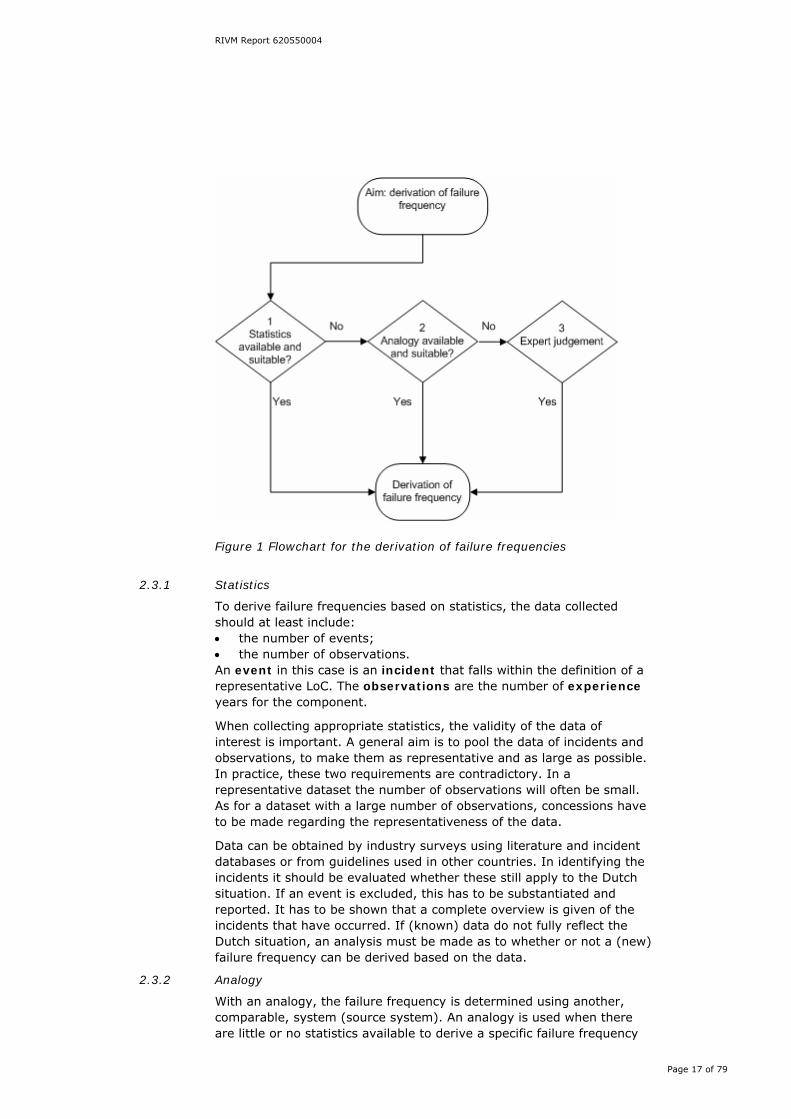
In Figure 1 the different steps in the derivation [9] are presented. Step 1 (statistics) and step 2 (analogy) are taken during this project and are discussed in the following sections. Step 3 (expert judgement) has not been used in this project and will thus not be discussed any further.
RIVM Report 620550004
Page 17 of 79
Figure 1 Flowchart for the derivation of failure frequencies
2.3.1 Statistics
To derive failure frequencies based on statistics, the data collected should at least include: • the number of events; • the number of observations. An event in this case is an incident that falls within the definition of a representative LoC. The observations are the number of experience years for the component.
When collecting appropriate statistics, the validity of the data of interest is important. A general aim is to pool the data of incidents and observations, to make them as representative and as large as possible. In practice, these two requirements are contradictory. In a representative dataset the number of observations will often be small. As for a dataset with a large number of observations, concessions have to be made regarding the representativeness of the data.
Data can be obtained by industry surveys using literature and incident databases or from guidelines used in other countries. In identifying the incidents it should be evaluated whether these still apply to the Dutch situation. If an event is excluded, this has to be substantiated and reported. It has to be shown that a complete overview is given of the incidents that have occurred. If (known) data do not fully reflect the Dutch situation, an analysis must be made as to whether or not a (new) failure frequency can be derived based on the data.
2.3.2 Analogy
With an analogy, the failure frequency is determined using another, comparable, system (source system). An analogy is used when there are little or no statistics available to derive a specific failure frequency

RIVM Report 620550004
Page 18 of 79
or if no incidents have occurred. If one or more relevant incidents have taken place, it should be determined whether an analogy can be applied.
A further analysis may be used to bring the systems in line with each other (e.g., excluding irrelevant failure causes and incidents of systems that do not match the initial system).
The source system should be representative of the initial system. They should at least be comparable. The following points should be taken into account regarding the systems: 1. The function of the systems is similar. 2. The construction of the systems is similar. 3. Maintenance and inspection regimes of the systems are similar. 4. The process and / or storage conditions are similar. 5. The intensity of the use of the systems must be at least comparable
to each other. 6. The failure causes of the system are similar. If more than one analogy is used, condition 1 prevails over condition 2, et cetera.
2.4 Structure of the report
A survey of the relevant literature, databases and international methods is given in Chapter 3. In Chapter 4 the available statistics of the Dutch natural gas industry (step 1 of Figure 1) are presented and analysed. Step 2 is the description of analogies. In this project two different analogies are considered: offshore data and transmission pipelines. This is done in Chapter 5. The derivation of the scenarios and failure causes based on the results of Chapters 3 to 5 are presented in Chapters 6 and 7. The last chapter contains the discussion and conclusions of the project.

RIVM Report 620550004
Page 19 of 79
3 Survey
Summary and conclusion
To obtain an overview of information already available, a data survey has been carried out. From international literature, failure data on piping and flanges (potentially) resulting in a Loss of Containment (LoC) are collected.
Based on the survey, the conclusion is that no published database can be used directly. There is no publicly available database with specific data for the aboveground high-pressure gas piping within establishments. On the other hand, from the survey two analogies emerge as possibly suitable: (1) offshore pipework and piping and (2) transmission pipelines. For offshore the HCRD (HydroCarbon Release Database) is mentioned. For transmission lines there are several options, including the EGIG database.
An overview is also made on how piping is included in risk assessments in other countries (UK, France and Belgium) and the basis thereof. In the UK, statistical information is being used for the derivation of failure frequencies. Although the background information of the UK method is not completely clear, the method itself (scenarios together with frequencies) matches the Dutch approach. In France, pipeline rupture scenarios are excluded if some conditions are met. Frequencies used in Flanders, Belgium are outdated, as they are based on a 30-year old study from DNV.
It can be concluded that the data used in other countries cannot be adopted directly in the Dutch method. The method in France does not match with the Dutch approach because all failure causes cannot be excluded from the very start. The data of Flanders are outdated. The UK method is worth analysing further if there is no other useful data from industry or analogies.
3.1 Literature
For a selection of the relevant literature, the Scopus database is used [11]. Scopus contains articles and papers from many different sources, such as scientific journals and publications of congresses. Keywords such as risk assessment, failure rate, frequency, natural gas, pipelines, high-pressure and aboveground are selected for the first search. This results in the selection of more than 120 abstracts. A quick scan of the abstracts reduces the number of more or less relevant abstracts to 21. The subjects of these articles can be divided into different categories, such as:
• Risk assessment approaches • Computer models for risk assessments • Databases • Ignition probability • Failure rates, failure frequency • Fault tree analysis • External interference • Consequence analysis
RIVM Report 620550004
Page 20 of 79
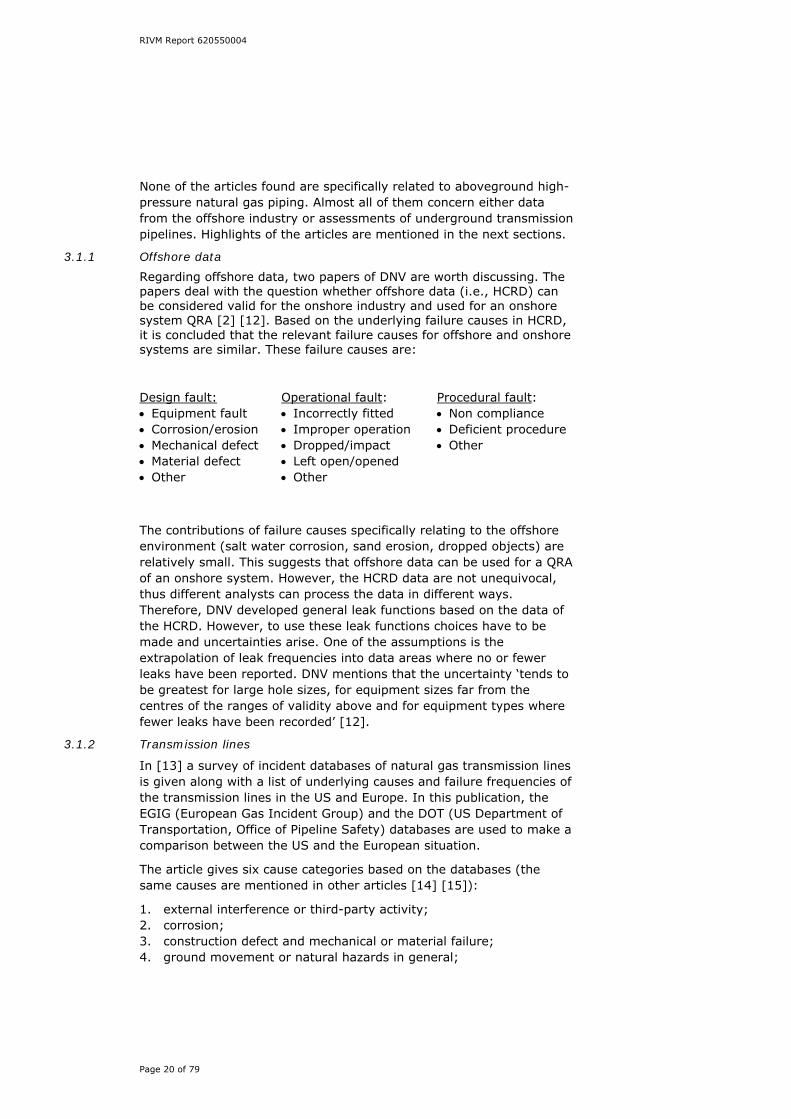
None of the articles found are specifically related to aboveground high-pressure natural gas piping. Almost all of them concern either data from the offshore industry or assessments of underground transmission pipelines. Highlights of the articles are mentioned in the next sections.
3.1.1 Offshore data
Regarding offshore data, two papers of DNV are worth discussing. The papers deal with the question whether offshore data (i.e., HCRD) can be considered valid for the onshore industry and used for an onshore system QRA [2] [12]. Based on the underlying failure causes in HCRD, it is concluded that the relevant failure causes for offshore and onshore systems are similar. These failure causes are:
Design fault: • Equipment fault • Corrosion/erosion • Mechanical defect • Material defect • Other
Operational fault: • Incorrectly fitted • Improper operation • Dropped/impact • Left open/opened • Other
Procedural fault: • Non compliance • Deficient procedure • Other
The contributions of failure causes specifically relating to the offshore environment (salt water corrosion, sand erosion, dropped objects) are relatively small. This suggests that offshore data can be used for a QRA of an onshore system. However, the HCRD data are not unequivocal, thus different analysts can process the data in different ways. Therefore, DNV developed general leak functions based on the data of the HCRD. However, to use these leak functions choices have to be made and uncertainties arise. One of the assumptions is the extrapolation of leak frequencies into data areas where no or fewer leaks have been reported. DNV mentions that the uncertainty ‘tends to be greatest for large hole sizes, for equipment sizes far from the centres of the ranges of validity above and for equipment types where fewer leaks have been recorded’ [12].
3.1.2 Transmission lines
In [13] a survey of incident databases of natural gas transmission lines is given along with a list of underlying causes and failure frequencies of the transmission lines in the US and Europe. In this publication, the EGIG (European Gas Incident Group) and the DOT (US Department of Transportation, Office of Pipeline Safety) databases are used to make a comparison between the US and the European situation.
The article gives six cause categories based on the databases (the same causes are mentioned in other articles [14] [15]):
1. external interference or third-party activity; 2. corrosion; 3. construction defect and mechanical or material failure; 4. ground movement or natural hazards in general;

RIVM Report 620550004
Page 21 of 79
5. hot tap by error1, and 6. other or unknown causes. For the incidents mentioned in EGIG, external interference is the most important cause and the EGIG data show a decrease of the external interference with increasing diameter. The overall failure frequency derived by EGIG is 5.75 × 10⁻⁴ per km·year (1970–1992) or 3.81 × 10⁻⁴ per km·year (1988–1992). The same EGIG data are used in other articles [15] [17]. From the US DOT database the overall failure frequency is 7.4 × 10⁻⁴ per km·year (1970–1985) or 1.7 × 10⁻⁴ per km·year (1984-1992).
3.1.3 OGP reports
In March 2010, the International Association of Oil and Gas Producers (OGP) published the Risk Assessment Data Directory (RADD). The corresponding reports contain frequencies for different systems and subsystems of facilities from the oil and gas industry.
Report 434-4 gives release frequencies for risers and pipelines [18]. The failure frequencies for the onshore gas pipelines are based on data from EGIG. The release frequencies of process equipment, such as process pipes and flanges, are included in report 434-1 [19]. These data are based on the HCRD and for the results, DNV’s leak function [2] is used. The overall frequencies have been divided into full, limited and zero pressure frequencies. The report mentions that the data are suitable for onshore pipes within process units but not for inter-unit pipes or cross-country pipelines [19]. The data can be used also for onshore facilities handling hydrocarbons. In a footnote of the report the justification for using the offshore data for onshore facilities is given: “The justification for using offshore data for onshore facilities is two-fold. First, no public domain dataset for onshore facilities is available that is comparable to HCRD, considering both the equipment population and completeness of recording releases. Second, although offshore facilities operate in a more challenging (e.g., more corrosive) environment, this is compensated for in the design, inspection and maintenance. Hence, there is no apparent reason why onshore and offshore release frequencies should differ significantly (…)” [19].
Finally, the report gives modification factors to use the frequencies for steel pipes also for inter-unit pipes (factor 0.9) and transfer pipes (factor 0.8). The factors are based on data from confidential DNV reports.
3.2 Data sources
3.2.1 Survey
There are several databases and other possible sources of failure frequency information. A review has been carried out of possible sources of historical data relevant to aboveground installations [6]. The review considers fifteen data sources:
• Hydrocarbon Release Database (HCRD) (UK HSE) • Land Use Planning Guidelines (UK HSE)
1 The term ‘Hot tap by error’ means that a connection has been made by error to a high-pressure
gas transmission pipeline, which has been incorrectly identified as another pipeline [16].
RIVM Report 620550004
Page 22 of 79
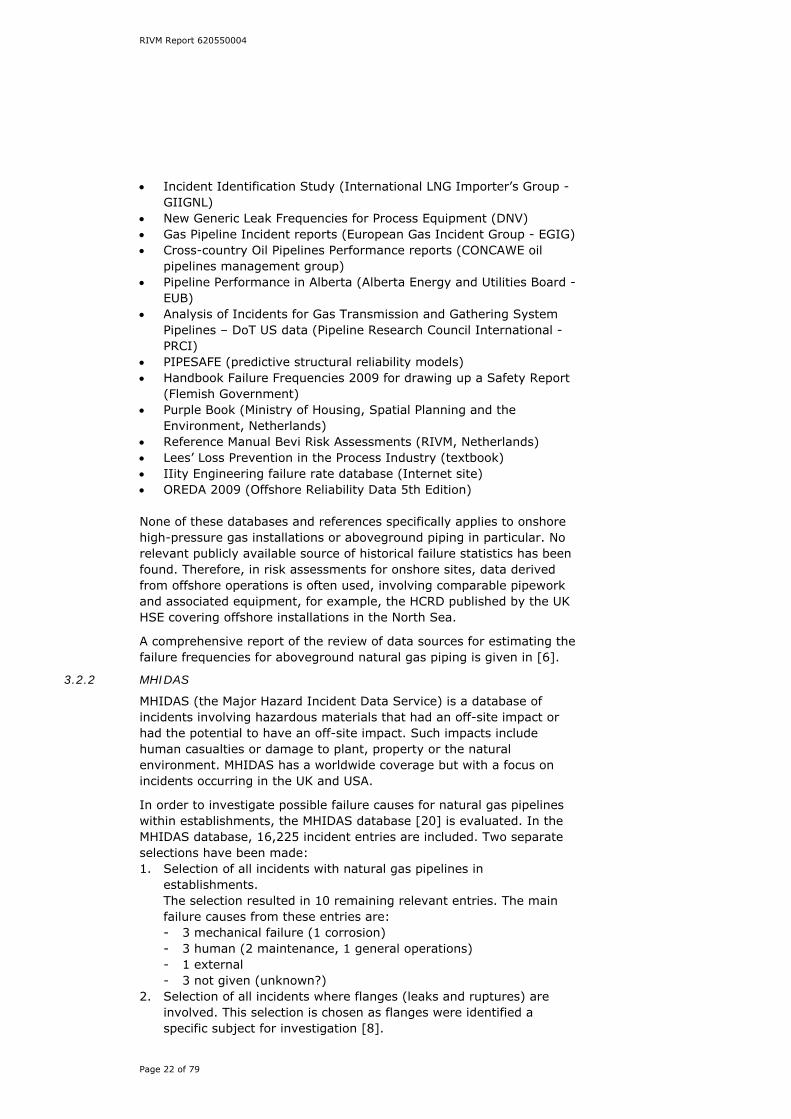
• Incident Identification Study (International LNG Importer’s Group - GIIGNL)
• New Generic Leak Frequencies for Process Equipment (DNV) • Gas Pipeline Incident reports (European Gas Incident Group - EGIG) • Cross-country Oil Pipelines Performance reports (CONCAWE oil
pipelines management group) • Pipeline Performance in Alberta (Alberta Energy and Utilities Board -
EUB) • Analysis of Incidents for Gas Transmission and Gathering System
Pipelines – DoT US data (Pipeline Research Council International - PRCI)
• PIPESAFE (predictive structural reliability models) • Handbook Failure Frequencies 2009 for drawing up a Safety Report
(Flemish Government) • Purple Book (Ministry of Housing, Spatial Planning and the
Environment, Netherlands) • Reference Manual Bevi Risk Assessments (RIVM, Netherlands) • Lees’ Loss Prevention in the Process Industry (textbook) • IIity Engineering failure rate database (Internet site) • OREDA 2009 (Offshore Reliability Data 5th Edition) None of these databases and references specifically applies to onshore high-pressure gas installations or aboveground piping in particular. No relevant publicly available source of historical failure statistics has been found. Therefore, in risk assessments for onshore sites, data derived from offshore operations is often used, involving comparable pipework and associated equipment, for example, the HCRD published by the UK HSE covering offshore installations in the North Sea.
A comprehensive report of the review of data sources for estimating the failure frequencies for aboveground natural gas piping is given in [6].
3.2.2 MHIDAS
MHIDAS (the Major Hazard Incident Data Service) is a database of incidents involving hazardous materials that had an off-site impact or had the potential to have an off-site impact. Such impacts include human casualties or damage to plant, property or the natural environment. MHIDAS has a worldwide coverage but with a focus on incidents occurring in the UK and USA.
In order to investigate possible failure causes for natural gas pipelines within establishments, the MHIDAS database [20] is evaluated. In the MHIDAS database, 16,225 incident entries are included. Two separate selections have been made: 1. Selection of all incidents with natural gas pipelines in
establishments. The selection resulted in 10 remaining relevant entries. The main failure causes from these entries are: - 3 mechanical failure (1 corrosion) - 3 human (2 maintenance, 1 general operations) - 1 external - 3 not given (unknown?)
2. Selection of all incidents where flanges (leaks and ruptures) are involved. This selection is chosen as flanges were identified a specific subject for investigation [8].

RIVM Report 620550004
Page 23 of 79
Four incidents describe a flange being broken or ruptured. For the ruptures, the following substances were involved: crude oil (1), vinyl chloride (1), sulphuric acid (1) and trichlorosilane (1). From the other 34 incidents with flange leaks it can be concluded that flange leakages not only occur during maintenance, but also during normal operation. However, as no entry is related to a release of natural gas and as a number of incidents occur, for example, during transfer, i.e., loading or unloading operations using rigid pipework (6 entries) or storage (1), it cannot be concluded that this will also be the case for piping or pipelines with natural gas.
Based on these selections and the few remaining entries after selection, it is concluded that no reliable conclusive remarks can be made on the distribution of the relevant failure causes for pipeline leaks and ruptures. Further information on the MHIDAS database selection is given in Appendix 1.
3.3 International approaches
3.3.1 United Kingdom
HSE advises planning authorities on land use planning developments near hazardous installations. This advice is based on the results of a risk assessment in which three different zones are calculated [21].
For risk assessments for land use planning, a HSE report with failure frequencies is available [22]. In this document the failure frequencies of vessels, components (such as valves and flanges), pipework, pipelines, tankers, et cetera, are listed. The failure frequencies for aboveground pipelines are presented in Table 4.
Table 4 Failure frequencies aboveground pipelines
Failure category Failure frequency (m-1 year-1)
Rupture (>1/3 diameter) 6.5 x 10⁻⁹
Large Hole (1/3 diameter) 3.3 x 10⁻⁸
Small Hole (5 mm – 25 mm diameter) 6.7 x 10⁻⁸
Pin Hole (≤5 mm diameter) 1.6 x 10⁻⁷
The values of Table 4 are applicable to general natural gas aboveground installations and are subject to the following limitations:
• Pipeline not to be more than 1.5 metres aboveground level. • Aboveground section of pipeline under assessment to be entirely
within a secure compound. • Sites containing high-speed rotating machines (e.g., compressor
stations) should be referred to the Topic Specialist for advice. • Sites where the presence of the pipeline is ancillary to the main
activity (e.g., processing plants) should be referred to the Topic Specialist for advice.
• The Topic Specialist should be informed on each occasion that these failure frequencies are used.
It is mentioned that the origin of the derivation of the failure frequencies is uncertain and no references are mentioned in [22]. However, another document contains the derivation of the failure frequencies based on fault tree assessments [23]. The underlying

RIVM Report 620550004
Page 24 of 79
causes of pipeline failures are mechanical failure, corrosion and external events. The last one is studied by fault trees of four components:
• Vehicle impact • Lifting operations • Natural events • Aircraft crash The summation of the frequencies of mechanical failures, corrosion and external events leads to the total failure frequencies as shown in Table 4. The background information of the derivation of the underlying frequencies is not described in [23]. The HSL/HSE study group members mentioned that current values are based on either EGIG [16] or UKOPA [24] data.
The failure frequencies of flanges and gaskets are based on the comparison of different sources [22]. The next tables show the failure frequencies of flanges and gaskets and the frequency for the fixed pipe flange.
Table 5 Failure frequencies gaskets
Event Failure frequency
(per flange connection
per year)
Notes
Failure of one segment
of a gasket.
5.0 x 10⁻⁶ The hole size is calculated as
the distance between two bolts
and the gasket thickness.
Failure of Spirally-Wound
Gasket
1.0 x 10⁻⁷ Hole size calculated as gasket
thickness multiplied by pipe
circumference.
Table 6 Spray release frequency fixed pipe flange
Category Frequency (per flange per year) Effective length of crack
Fixed pipe flange 5.0 x 10⁻⁶ Pipe diameter
(max. 150mm crack length)
In the report a spray release is defined as a release where the spray from a hole is broken into droplets small enough to not rain out. Spray releases are normally only considered when assessing risks from toxic substances that would otherwise have very small hazard ranges because of their low volatility [22]. So the spray release means a small release from a very narrow breach.
3.3.2 France
In the French regulatory framework industrial activities are classified according to their potential risk. This section gives the French approach for defining the relevant scenarios for a risk assessment of natural gas piping in an underground gas storage facility. In particular, the conditions are described which have to be fulfilled in order to exclude the pipe rupture scenario from the quantitative risk analysis. These principles are defined by the French regulatory framework in the “circulaire du 10 Mai 2010” [25].

RIVM Report 620550004
Page 25 of 79
Industrialists are free to choose the methodology to be used for the selection of scenarios, the probability assessment and the consequences calculation, but the relevance of the methodology used must be justified in the safety report. Results of the risk assessment are used for licensing, defining the land-use planning around the establishment and defining external emergency plan scenarios. In this framework, the risk generated by high-pressure natural gas piping on-site aboveground must be assessed. Some of the establishments where this piping is used are underground natural gas storages. In the specific case of piping used in these storages, the French Ministry gives guidance for the definition of scenarios to be used in risk assessment.
The scenarios which have to be studied in the safety report for piping are described in Table 7.
Table 7 Scenarios to be used in risk assessment for aboveground pipes in underground gas storage facilities
Loss of containment Type of release Dangerous phenomena
25 mm hole Horizontal Jet fire; Vapour Cloud Explosion
(to be investigated by the industrialist)
50 mm hole
(if a distinction in hole
sizes is made)
Horizontal Jet fire; Vapour Cloud Explosion
(to be investigated by the industrialist)
Rupture
(hole with diameter >
50 mm)
Horizontal Jet fire; Vapour Cloud Explosion
(to be investigated by the industrialist)
When the scenarios in Table 7 are assessed with regard to their probability, kinetic, intensity and severity, some specific causes are excluded from the analysis. These are: • falling meteorites; • earthquakes of an intensity superior to the reference intensity in
the area; • flooding of an intensity superior to the reference intensity in the
area; • climatic events of an intensity superior to the reference intensity in
the area; • airplane crashes if there is no airport in a radius of two kilometres; • large dam ruptures and large dike ruptures; • events related to malevolence. The rupture scenario may be excluded from the quantitative analysis for both the probabilistic and consequence assessment, used for licensing and land-use planning, if specific conditions are fulfilled. The rupture scenario is kept for defining external emergency plan scenarios. The conditions to be fulfilled are the following: 1. Mechanical and thermal external interferences (e.g., vehicle
collision and domino effects) must be excluded as a possible cause of accidents and this must be justified in the safety report;
2. Pipes must be protected against external impact resulting from human activities. The mechanical impact of a 32-ton shovel is thought to be representative of these external impacts;
3. Pipes are made of a steel grade suitable for the temperature of transported fluids. In some specific cases reheating installations are

RIVM Report 620550004
Page 26 of 79
present. Here, the mechanical specifications of the pipe should allow for the gas temperature. In this type of case, industrialists have to justify this specifically;
4. The mechanical specifications of the pipe are suitable with regard to the temperature of the gas transported;
5. If a reheating system is used, the design, exploitation, maintenance, et cetera, of this system must guarantee the compatibility between pipe specifications and gas temperature;
6. Industrialists must provide technical documentation on pipe design and prevention measures implemented for preventing metallurgic defaults, corrosion and hammer effects. Industrialist must also demonstrate to the inspectorate that no rupture caused by these causes has occurred in the statistics;
7. Pipes must be inspected in accordance with a GESIP guide, the UFIP-UIC DT 84 document or the professional guide for the implementation of inspection plans from Gaz de France.
8. Pipes must be designed in order to resist to an earthquake of the reference intensity in the area;
9. Pipes must be weighted in order to avoid loss of containment in case of floods of the reference intensity in the area;
10. Industrialists must study in their risk analysis the maintenance and construction works phases.
These conditions have been agreed on by the French ministry and Gaz de France and ended a long discussion between the ministry and this operator. The text formalises something that had been already decided. The argumentation had a high level of detail. Still, as the exclusion of a scenario is quite sensitive, if a specific lay-out is identified, the inspectorate may ask for more details, for example, on the protection against jet fires.
3.3.3 Belgium – Flanders
As part of the safety report, Seveso companies in Flanders have to perform a Quantitative risk assessment (QRA). In 2009 a new version of the guideline concerning the scenarios and failure frequencies for the QRA was published [26]. This is based on the research of SGS [27]. The background information of the guideline is written in a separate report [28]. In the chapter of the SGS report describing the peer-review, it is mentioned that the frequencies of pipelines includes flanges and appendages. The scenarios and frequencies for aboveground pipelines in Flanders [26] are shown in Table 8. These scenarios and frequencies apply to all types of industries.
Table 8 Scenarios and frequencies for pipelines
Event Frequency (per year) Note
Small leak 2.8 x 10⁻⁷ L/D deq = 0.1 D
Middle leak 1.2 x 10⁻⁷ L/D deq = 0.15 D
Large leak 5.0 x 10⁻⁸ L/D deq = 0.36 D
Rupture 2.2 x 10⁻⁸ L/D
with: • L = Length of the pipeline (mm) (at least 10 m) • D = Internal diameter of the pipelines (mm) • deq = equivalent hole size (mm)

RIVM Report 620550004
Page 27 of 79
These failure frequencies have been derived from the 1978 Gulf data. Based on these data, DNV derived an overall leak frequency equation: F = 4.72 × 10⁻⁷ L/D per year [28].
3.3.4 Germany
In Germany no QRA approach with default scenarios and failure frequencies is used. However, for this project one research report of the Federal Institute for Materials Research and Testing (BAM) is relevant [29]. In this research the risks of transmission pipelines were analysed, particularly the effects (damage) of pipeline failures. For the investigation of incidents concerning pipelines with natural gas, the EGIG database [16] and the Alberta EUB database [30] are used. BAM concludes that accident frequencies can be determined on the basis of databases (such as, e.g., EGIG) but that in contrast, there is little information on the extent of effects. Based on the analyses of the possible effects it is also concluded that safety distances should be considered in case of land use planning in the vicinity of transmission pipelines.

RIVM Report 620550004
Page 28 of 79

RIVM Report 620550004
Page 29 of 79
4 Statistics Natural Gas Industry
Summary and conclusions
From the Dutch natural gas industry, data is supplied by Gasunie, NAM, TAQA and Vermillion. These data are aggregated in order to derive failure frequencies for both flange connections and piping. Table 9 and Table 10 show the number of events and the associated experience. Using this data an average failure frequency and the upper 95% limit of the one-sided confidence interval of the mean frequency (being the 95th percentile). This confidence interval is calculated assuming the number of incidents is Poisson distributed.
Table 9 Failure frequencies for flange connections based on Dutch industry data
Failure frequency [year-1] Event
type
Events Experience
[years] Average 95th percentile
Leak 1 1,802,355 5.5 × 10⁻⁷ 2.6 × 10⁻⁶
Rupture 0 1,802,355 0 1.7 × 10⁻⁶
Table 10 Failure frequencies for piping based on Dutch industry data
Failure frequency [m-1year-1] Event
type
Events Experience
[m·years] Average 95th percentile
Leak 0 2,787,310 0 1.1 × 10⁻⁶
Rupture 0 2,787,310 0 1.1 × 10⁻⁶
No relevant events for piping are present in the data supplied by the industry. This is the same for the other data sources considered, such as databases from the State Supervision of Mines (a governmental organisation) and NOGEPA (Netherlands Oil and Gas Exploration and Production Association). As no relevant events for piping are present, analogue systems are considered for deriving failure frequencies (see Chapter 5).
4.1 N.V. Nederlandse Gasunie
N.V. Nederlandse Gasunie (hereafter Gasunie) is a Dutch gas infrastructure company. The network of Gasunie is one of the largest high-pressure gas networks in Europe. In the Netherlands their network consists of about 12,500 kilometres of transmission pipelines, dozens of plants and approximately 1,100 gas receiving stations. In Table 11 an estimate is presented of the number of flanges per Gasunie station type [4].
In the aboveground part of the Gasunie pipeline system on establishments many connections are flanged. Gasunie has incidents of the last 12 years available in a searchable database. Querying this database resulted in 34 reported incidents with flange leakages [4]. All these leakages concerned equivalent hole sizes of less than 10 mm. At Gasunie stations only one larger incident occurred with a flange fifteen years ago. According to Gasunie this was the only major incident with a flange connection during at least the last 20 years [4]. During

RIVM Report 620550004
Page 30 of 79
maintenance, a crack was initiated in a flange on a valve that was still under pressure, resulting in a leakage. In Table 12 an overview of the gas leakages is given.
Table 11 Aboveground piping length and number of flanges on Gasunie establishments
Category Number
of stations
Total
number of
compressors
/ pipes
Length
piping
[m]
Total
piping
length [m]
Flange
connections
[per pipe /
compressor]
Total
number
of flange
connections
CS 11 86 30 2,580 5 430
MPRS 1,100 3,000 20 60,000 25 75,000
HPRS 85 220 40 8,800 15 3,300
ES 9 60 60 3,600 10 600
BS 10 40 100 4,000 10 400
Total 78,980 79,730
CS: Compressor station; MPRS: Middle-pressure Reducing station; HPRS: High-pressure
Reducing Station; ES: Export Station; BS: Blending Station.
Table 12 Gas releases at Gasunie establishments
Leakage type Number of incidents Time period Experience
Flange leak < 10 mm 34 12 years 956,760 years
Flange leak > 25 mm 1 20 years 1,594,600 years
Flange rupture 0 20 years 1,594,600 years
Pipeline leak 0 12 years 947,760 m·years
Pipeline rupture 0 12 years 947,760 m·years
4.2 Nederlandse Aardolie Maatschappij
NAM (Nederlandse Aardolie Maatschappij) is the largest gas producer in the Netherlands. Slightly more than half of this gas comes from the Groningen gas field and the rest from various smaller fields (both on land and in the North Sea). NAM provides about 75 per cent of total gas production in the Netherlands. An overview of pipes and pipe lengths from the NAM assets is given in Table 13. NAM has estimated the number of flange connections as one per ten metres of piping.

RIVM Report 620550004
Page 31 of 79
Table 13 Process and gas piping lengths for the onshore part of NAM
Asset Installation
types
Number of
installations
Piping length
[m]
Total piping
length [m]
Groningen
Cluster 20 6,600 131,200
UGS 2 10,000 20,000
Satellite location 2 3,000 6,000
Transfer 7 300 2,000
Land
Satellite location 72 500 36,000
Treatment
location
100 1,000 100,000
Flare 89 100 8,900
Den Helder Treatment
location
1 10,000 10,000
Total 314,100
NAM has analysed all gas leakages within the past 5.5 years (2005 to mid-2010) using their annual incident reports. A total of 147 gas leakages occurred in this period [31]. These incidents can partially be attributed to equipment and partially to pipes. Another part is attributable to appliances, leaking PSVs (pressure safety valves) (which are actually not relevant LoC events), leaks during commissioning, et cetera. There have been 48 incidents where a leak in piping (or piping component) is found and reported. Components are, e.g., instrumentation connections, flanges and valves. The location of the leak was not always clearly evident from the description in the reports, it can, e.g., relate to leaks in the connection of a vessel or heat exchanger.
None of these incidents have had a direct impact on the environment [32]. The release rates are small. The release duration is estimated and the total amount released can be obtained. The number of releases and their sources are given in Table 14. There has been no incident involving failure of a pipe or a large leak, so the figures in Table 14 are all about small to very small leaks (all <10 mm).
Table 14 Gas releases at NAM (2005 – mid 2010)
Leakage type Number of incidents
Flange leakage 17
Valve leakage (stem leakage) 12
Other leakages (including pinholes, unknown) 19
Ruptures 0
4.3 TAQA
In the Netherlands, TAQA Energy operates and produces gas, both onshore and offshore. It has a natural gas storage facility in Alkmaar and interests in pipelines and multiple oil and gas producing fields in the Dutch part of the North Sea. TAQA Energy operates the following onshore installations: • PGI – Peak Gas installation (1996). This is a gas storage and
treatment facility adjacent to the well site in Alkmaar. In the winter

RIVM Report 620550004
Page 32 of 79
this plant supplies extra gas to the Dutch gas transport network from the Alkmaar gas field;
• Bergen Concession – Production facilities and Well sites (1972). This concession consists of gas production from five well sites with a central processing and compression plant in Alkmaar.
In Table 15 the number of pipes and flanges from both TAQA assets are shown [33]. These quantities are determined by TAQA based on a known number of pipes (piping list) and an estimated mean length and number of flanges per pipeline and based on a combination of pipe diameters (from 1½" to about 20"). Instrument tubing and smaller flange sizes are not included.
Table 15 List of piping and flanges per TAQA asset
Asset Number of pipes
(gas service)
Number of flanges
(gas service)
estimation
total piping
length [m]
PGI-locations 490 3,000 10,000
Bergen Concession 310 2,000 6,000
Total 800 5,000 16,000
TAQA Energy has data available from 2003 to 2010 in issue and leak reports [34]. In this period there have been eight reported cases of gas leakage: • Flange: 1 • PSV (Pressure Safety Valve) failure: 3 • Material (Corrosion / Fatigue / Other): 4 In all cases except the PSV gas leakages (which are actually venting to safe location incidents) it concerns very low gas leakage rates (pinhole dimensions) observed during routine inspections. The leakage duration is often undetermined; total volumes, therefore, are difficult to estimate. The above cases with gas leakages are listed in more detail in Table 16.
Table 16 Gas leakages at TAQA (2003 – 2010)
Description Calculated
leakage
Leakage type Pipe diameter Release
dimensions
Flange gas
leakage
< 1 m3 Gasket leakage due
to too little tension on
bolts
Unknown Unidentifiable
Glass of gauge
broken
<0.1 m3 Gauge was blocked in About 1 inch
(connection)
Volume gauge
Thermowell
coupling
1 m3 Leakage along fatigue
crack
1.5 inch Unidentifiable
Welded elbow Unknown but
> 1 m3
Corrosion Unknown Crack dimensions
unknown
Condenser
bank
Unknown Unknown N/A Unknown

RIVM Report 620550004
Page 33 of 79
4.4 Vermilion Oil and Gas Netherlands
Vermilion Oil and Gas Netherlands BV is a subsidiary of the Canadian company Vermilion Energy Trust. Vermilion produces oil and gas in Canada, Australia, France and, since May 2004, in the Netherlands.
Vermilion produces gas from one area in the province of Noord-Holland, from two areas in Friesland and from a location in the Dutch Waddenzee.
Incident data from Vermillion is available for the years 2008 and 2009 [35]. In this period there have been 16 gas leaks. From these, the compressor and fuel gas system leakages have been removed because these accidents are outside the scope of the current investigation. In Table 17 the remaining gas leakages are displayed.
Table 17 Gas leakages at Vermilion in 2008 and 2009
Equipment Leakage
quantity
Principal cause Leakage type
Turbo expander KO drum 23 m3 External corrosion under isolation Pin hole leak
Turbo expander seal gas 6 m3 External corrosion under isolation Pin hole leak
Flow line 3 m3 Internal corrosion Pin hole leak
Level transmitter line 2 m3 External corrosion under isolation Pin hole leak
Gas cooler Nil No particular reason Flange leak
As no data on hole sizes, piping / pipeline lengths and number of flanges has been made available, the data from Vermilion cannot be used for the derivation of failure frequencies. The data does give an indication of the failure causes of the incidents.
4.5 Overview of the Dutch natural gas industry data
Table 18 and Table 19 give an overview of the data used for the derivation of the failure frequencies of flange connections and piping (Table 9 and Table 10). For NV Nederlandse Gasunie, data for flange connections are available for a period of 12 years (zero events) and (at least) 20 years (one event). Although the data for the 20-year period are not documented extensively, it was decided to use the data for the derivation of the failure frequencies of flanges. This choice has however no effect on the derived 95th percentile value of the leak scenario. It has also no effect on the conclusions for the rupture scenario.
Table 18 Overview of events and experience for flange connections from the Dutch natural gas industry
Events
Leaks Ruptures
Number of flange
connections
Number of
years
Experience
[years]
Gasunie 1 0 79,730 20 1,594,600
NAM 0 0 31,410 5.5 172,755
TAQA 0 0 5,000 7 35,000
Vermillion 0 0 Unknown 2 0
Total 1 0 1,802,355

RIVM Report 620550004
Page 34 of 79
Table 19 Overview of events and experience for piping from the Dutch natural gas industry
Events
Leaks Ruptures
Piping length [m] Number of
years
Experience
[m·years]
Gasunie 0 0 78,980 12 947,760
NAM 0 0 314,100 5.5 1,727,550
TAQA 0 0 16,000 7 112,000
Vermillion 0 0 Unknown 2 0
Total 0 0 2,787,310
4.6 Other data sources
4.6.1 State Supervision of Mines
State Supervision of Mines (SSM) is a governmental organisation and is situated in the Hague. The department falls under the ministerial responsibility of the Minister of Economic Affairs, Agriculture and Innovation. SSM oversees compliance with statutory regulations applicable to mineral exploration, extraction, storage and transport of minerals, focusing on the aspects of health, safety, the environment, effective extraction and soil movements.
All mining industries (including natural gas establishments) are obliged to report accidents and incidents to SSM. A standard reporting form is used. Data from these reports is recorded in a database. Recorded items are: date, company name, installation or location name and an incident description.
The instrumentation involved is not specifically recorded and no data on hole sizes or leakage duration is given. For the reported incidents the data does give an indication of the distribution of failure causes. The release rate and duration are not reported but from sections 4.1 to 4.4 it can be concluded that for these companies no large holes or ruptures are reported in the database. Thus, the distribution of failure causes drawn from the SSM database are valid for small hole sizes (< 10 mm). As the failure cause distribution changes with the hole size [16], no conclusions can be drawn for large holes and ruptures.
4.6.2 NOGEPA
NOGEPA is the Netherlands Oil and Gas Exploration and Production Association. It represents companies that possess permits to drill for and produce oil and gas, both on land and on the Dutch continental shelf. NOGEPA’s 15 members annually produce 75 billion cubic metres of natural gas and 2 million cubic metres of oil from Dutch soil.
NOGEPA keeps a database in which all natural gas accidents and incidents are reported by its members. This database is used for reporting to State Supervision of Mines. For this study, a part of the information from the database is made available. The incident descriptions made available include a short description, equipment type, principle cause, leak quantity and significance.
The available data from the database have a number of limitations that restrict their applicability to this project. One of the major issues is that no information is present about hole sizes. No distinction is also made between onshore and offshore and between above and below ground or water.

RIVM Report 620550004
Page 35 of 79
All things considered, it can be concluded that the database does not contain the desired data suitable for this study. However the data might give an indication of relevant failure causes for these incidents. As the industry data mentioned in Sections 4.1 to 4.4 is a subset of the NOGEPA dataset, it can be concluded that for these companies no large holes or ruptures are reported in the database. Thus, the distribution of failure causes is only valid for very small hole sizes. As the failure cause distribution changes with the hole size [16], no conclusions can be drawn for large holes and ruptures.

RIVM Report 620550004
Page 36 of 79

RIVM Report 620550004
Page 37 of 79
5 Analogies
Summary and conclusion
For this study two possible analogies were identified for further investigation: (1) offshore data and (2) data for transmission pipelines (Chapter 3).
For the offshore data the UK Hydrocarbon Releases Database (HCRD) System has been analysed. The HCRD is not selected as the most suitable analogy. First because the HCRD does not contain full bore ruptures but ends with a category of holes with a diameter larger then 100 mm. Furthermore, the experience (number of system years) in the HCRD is less than the experience of the Dutch natural gas industry.
With regard to the natural gas transmission lines, the conclusion is that these could be used as analogy for aboveground pipelines within establishments.
5.1 Offshore data (HCRD)
The Hydrocarbon Releases Database (HCRD) System contains detailed voluntary information on offshore hydrocarbon release incidents on the UK continental shelf [36]. This information is supplementary to that provided under the 1995 UK RIDDOR legislation [37].
The HCRD was created in response to Recommendation 39 of Lord Cullen's Report into the Piper Alpha disaster. This required that such a database be set up by the regulator (HSE) for and on behalf of the industry and that industry access be given to the data. The data are stored on a web-based system, which became operational in 2003. Prior to that date statistical reports were produced annually by the HSE. Now, standard reports can be generated by duty holders and other authorised users.
The suitability of this analogy has been investigated by DNV [5]. Regarding the points of comparability as mentioned in section 2.3.2, it can be concluded that the function of offshore and onshore systems is quite similar, when only gas data is used from the HCRD.
The construction specifications and codes used in offshore vary for each platform. They vary with the location of the platform, age, maximum pressure, et cetera. In general, it can be concluded that there is a lot more variation in codes than for onshore systems. Maintenance and inspection schemes offshore are generally more detailed than for onshore systems. However, implementation of these schemes might be an issue.
As for process conditions (such as pressure) and the intensity of the use of the system, the offshore system is comparable to the onshore system. On the other hand the ‘external’ conditions of onshore and offshore are different because offshore there is a much harsher environment. However the specific offshore failure causes (salt water corrosion, sand erosion, dropped objects) are relatively minor in the HCRD (see section 3.1.1. and [5]).

RIVM Report 620550004
Page 38 of 79
The frequencies derived from the database can vary widely because of different interpretations of the data. The data from the database should therefore be interpreted with caution. For the derivation of frequencies, three approaches have been considered [5]. The pros and cons of each of the three methods are given in the following sections.
5.1.1 HCRD standard reports
From the HCRD, authorised users can create standard leak frequency reports. Using such a standard report, releases with hole sizes larger than 10 mm are selected for flanges and pipes with a diameter of 3" or more. The data allow no discrimination between leakages and ruptures.
The standard reports contain a number of restrictions which render the results from these reports less useful for this project [5]. The restrictions are:
• the number of leaks does not correspond with data that can be extracted from HCRD;
• there is only one frequency for both small and large leakages and ruptures;
• the experience in the database is fairly limited compared to the Dutch gas industry data.
5.1.2 DNV method
As DNV acknowledges that different interpretations of the HCRD data are possible, they have developed a standard interpretation method [12]. The basic principle of the method is the derivation of analytical leak frequency functions. These functions combine both equipment and hole size with a failure frequency.
As the DNV method is an interpretation of the data using analytical functions, there are some considerations regarding the transparency, verifiability, robustness and validity of the method:
• the data selection on which the functions are derived is unknown; • the parameters of the analytical functions are not publicly available; • it has not been proven that the functions are valid for the selected
flanges and piping; • interpolation between known incidents might be invalid, considered
that discontinuities might occur due to a transition from one design standard to another;
• extrapolation from 100 mm holes to full bore ruptures is questionable because the functions cannot be validated beyond their initial data range.
5.1.3 Gas data selection
Specific gas data can be extracted from the HCRD. These data are used to derive specific failure frequencies. From these data, flanges and steel piping can be selected, together with incidents with a hole size of 10 mm or more to match the study boundaries. From the remaining data flares, drains, vents and other offshore specific systems are removed.
The resulting frequencies for flange connections and steel piping are reported in Table 20. In the table, frequencies for flanges are in terms of flange connections per year and for piping are in terms of per metre per year. More detailed information on the causes can be found in [5].

RIVM Report 620550004
Page 39 of 79
Table 20 Failure frequencies for leakages based on HCRD gas data
Failure frequency Equipment type Events Experience
Average 95th percentile
Flange connection >3" 7 646,956 years 1.1 × 10⁻⁵ 2.0 × 10⁻⁵
Steel piping >3" 9 1,918,347 m·years 4.7 × 10⁻⁶ 8.2 × 10⁻⁶
The gas data selection has a number of restrictions which render the results from these reports less useful for this project. Firstly, there is only one frequency for large leakages and not for ruptures. The experience in the database is also fairly limited compared to the Dutch gas industry data.
5.1.4 Discussion
For this project the gas data selection from HCRD fits with the onshore on-site gas pipelines. Nevertheless, the HCRD is not selected as a suitable analogy because ruptures are not reported [5]. It ends with a category of holes with a diameter larger then 100 mm. So using offshore data no rupture frequency can be derived directly. Use of the HCRD for the derivation of ruptures would require a mathematical method (extrapolation) or judgement such as applying the failure frequencies for full holes as derived from HCRD by Spouge [2] for pipeline ruptures.
Furthermore, the number of system years (experience) in the HCRD is less than the number of system years from the statistics for the Dutch gas industry (Section 4). There is also no overlap between confidence intervals of the frequencies using the Dutch gas industry data and HCRD data; the 95th percentile from the Dutch gas industry being 1.1 × 10⁻⁶ per metre per year for piping and the 5th percentile using HCRD being 2.4 × 10⁻⁶ per year. Underreporting might be an issue, however to get the same frequencies as HCRD, the Dutch gas industry should have underreported 14 to 25 flange releases and 12 to 15 piping events in the last 5 to 12 years.
Therefore, it is concluded that for ruptures failure frequencies should not be derived from the analogy using offshore data.
5.2 Natural gas transmission pipelines
Underground natural gas transmission pipelines might be a useful analogue system for aboveground piping. There are also various methods and databases available with information on the failure of pipelines.
The suitability of this analogy was investigated by GL Noble Denton [6]. Regarding the points of comparability as mentioned in section 2.3.2 between the gas transmission pipelines and on-site (aboveground) natural gas piping it can be concluded that the function of on-site an cross country gas pipelines is similar, that is to transport gas from one installation to another. For on-site piping only the distances are smaller.
Construction and specification for aboveground piping and buried pipelines can be regarded as similar, as for both types of piping similar codes and standards are used for the pipe segments and welds. One difference is that where almost all connections for underground pipelines are welded, for aboveground pipelines mostly flange connections are used in places where equipment such as measuring

RIVM Report 620550004
Page 40 of 79
devices or valves are incorporated in the pipeline system. This makes for easier maintenance or replacement of parts.
Regarding maintenance, for buried pipelines cathodic protection can be regarded as a continuous maintenance system used to mitigate adverse consequences which may arise due to coating defects. For aboveground piping corrosion under isolation programmes should result in the same mitigation with the benefit that for aboveground pipes significant leakages can be noted either visibly or audibly.
As for process conditions (such as pressure) and the intensity of use of the system, the buried transmission pipelines are equal to the on-site piping aboveground. For ‘external’ conditions there is some difference between aboveground piping and buried pipelines with respect to external interference.
Regarding the failure causes six categories are mentioned [16]): 1. external interference or third-party activity; 2. corrosion; 3. construction defect and mechanical or material failure; 4. ground movement or natural hazards in general; 5. hot tap by error; 6. other or unknown causes.
The main difference concerns the external interference. Where cross-country pipelines cross land over which the operator has limited control (and hence are vulnerable to third-party damage); pipes at an installation are contained within a controlled site, but where they may be exposed to lifting activities and vehicle movements.
For corrosion there are differences in the exposure of buried and aboveground pipelines. This can also be argued for causes such as vibrations and high or low temperatures. It is assumed that these differences are addressed sufficiently in the construction standards used for aboveground pipelines. These differences are recognised but could not be quantified. Further, the causes ground movement and hot tap by error are regarded as not relevant for aboveground piping on-site.
In spite of the differences in the failure causes, it can be concluded that the use of gas transmission pipelines is basically a sound analogy for on-site piping and pipelines. If vehicle impact or lifting activities cannot be excluded, these causes should be addressed separately [6]. Flange connections will have to be treated separately, as they are generally not used for buried pipelines.
Although metering streets are not investigated explicitly, the same approach is used as for piping and pipelines. In [6] it is stated that the analogy by gas transmission pipelines is not intended to be applied to process pipe work, characterised by complex piping and instrumentation arrangements or changes in process fluid composition and temperatures, et cetera. Based on this description metering streets are more defined by piping than by process pipe work and therefore, the same approach as for piping and pipelines is chosen.

RIVM Report 620550004
Page 41 of 79
6 Derivation of Scenarios
Summary and conclusion
Initially, for both piping and flange connections, two standard scenarios have been identified: leak and rupture. As pinholes do not contribute to third-party risk, this scenario is not taken into account.
The realism of a rupture of a flange connection has been investigated using fracture mechanics. It is concluded that a flange connection can withstand a larger impact and stress than the pipeline it is connected to. Therefore, ruptures of flange connections can be excluded from the risk calculations.
For piping scenarios one issue is the transition from a large leak to a rupture. Due to propagation a large leak will result in a full bore rupture. Based on the results of the calculations of the Gasunie and in accordance with the Dutch guideline, the maximum leak size proposed is a leak with a diameter of 50 mm.
This leads to the following relevant scenarios.
Table 21 Relevant scenarios
Scenario Leak size (Diameter)
Flange connection Leak 10% D (max. 50 mm)
Rupture -1)
Piping Leak 10% D (max. 50 mm)
Rupture 100% D 1) Given that flange connections are hydrostatically tested before use.
In the case of a situation in which the failure of one piece of piping or flange clearly leads to the failure of another piece of piping, an internal domino effect needs to be included.
6.1 Flange connections
6.1.1 Leak
A relevant flange leak occurs when a gasket is (partially) blown out from between the two flanges, or when a small crack occurs in the flange itself. As a flange connection is a mechanical connection, small leakages and gas diffusion also may occur but these are considered to be irrelevant for the calculation of third-party risks.
A leak from a flange connection is to be modelled as a leak with an effective diameter of 10% of the nominal diameter, with a maximum of 50 mm [3].
As there is limited statistical information available on the failure causes of relevant flange leakages, there is no differentiation in scenarios between gasket failures or flange body failures.

RIVM Report 620550004
Page 42 of 79
6.1.2 Rupture
A flange rupture is defined as a catastrophic failure of one of the flange bodies, which leads to a full size hole with an effective diameter of 100% of the nominal diameter of the attached pipe.
Within the Dutch gas industry statistics no incidents have been found describing ruptures of flange connections. No conclusive remarks could be made from the MHIDAS database evaluation. Therefore, it has been investigated if an analogy could be applied. However, no fitting analogy could be found for flange ruptures (see also section 5).
As no analogy can be applied, the statistics as given in chapter 3, are to be applied for deriving the rupture frequency. However, as this value is based on zero incidents it has been further investigated whether a flange rupture is truly a realistic scenario [4]. Based on fracture mechanics calculations it is concluded that a flange connection can withstand a larger impact and stress as the pipeline it is connected to. Therefore ruptures of flange connections are to be excluded from the risk calculations. An important requisite for this exclusion is that the flange connection is hydrostatically tested before it is taken into operation. The design and maintenance of the flange connection should also be according to industry standards.
6.2 Piping
6.2.1 Leak
A leak from piping is defined as a leak with an effective diameter of 10% of the nominal diameter, with a maximum of 50 mm [3]. The maximum of 50 mm corresponds to the results of Gasunie calculations [4]. For piping it shows that fracture propagation (resulting in a rupture) could take place at larger leaks [4][38]. The leak size of 50 mm is also the transition used in France from leak to rupture (see 3.3.2).
6.2.2 Rupture
A rupture of a pipe is defined as a catastrophic failure, which leads to a full size hole with an effective diameter of 100% of the nominal diameter of the piping. This scenario is considered to be representative for all large leaks and full bore ruptures (guillotine). Due to fracture propagation, larger leaks result in full bore ruptures.
6.3 Domino effects
In the case of a situation in which the failure of one installation clearly leads to the failure of another, an internal domino effect needs to be included in a QRA [3]. Leaks from aboveground piping or flange connections are identified as possible initiating events for piping ruptures.
The conditional probability of 0.001 for a piping rupture as a result of a leak has been (conservatively) determined [4]. This additional probability has to be taken into account in the rupture frequency of the receiving piece of piping when domino effects are expected.

RIVM Report 620550004
Page 43 of 79
7 Derivation of failure frequencies
Summary and conclusion
With regard to the natural gas transmission lines, the conclusion is that these could be used as an analogy for aboveground pipelines within establishments. Here, three options are identified: (1) The HSE method for land use planning, (2) the method for buried transmission lines used in the Netherlands and (3) the EGIG data from transmission lines in Europe. After rating the options using four basic criteria (transparency, verifiability, robustness and validity), the EGIG data has been selected as the best matching option for piping. Table 22 shows a summary of the results concerning piping based on EGIG data.
Table 22 Failure frequencies for piping based on EGIG data
Failure frequency [m-1·year-1] Event type Events Experience
[m·years] Average 95th percentile
Leak 63 3.15 × 10⁹ 2 × 10⁻⁸ 2.5 × 10⁻⁸
Rupture 17 3.15 × 10⁹ 5.5 × 10⁻⁹ 8 × 10⁻⁹
In addition to these frequencies, the contribution of external events such as vehicle impact and lifting operations should be taken into account for aboveground pipelines within establishments.
Flange connections will have to be treated separately as they are generally not used for buried pipelines. Therefore, it is concluded that for flange leakages the failure frequency for the leak is to be based on the statistics of the Dutch gas industry.
Table 23 Failure frequency for flange connections based on Dutch industry data
Failure frequency [year-1] Event type Events Experience
[years] Average 95th percentile
Leak 1 1,802,355 5.5 × 10⁻⁷ 2.6 × 10⁻⁶
7.1 Flange connections
Within the Dutch gas industry statistics, only one incident has been found describing a flange leak. As only one incident was found, an analogy has been investigated. Two analogies have been examined: offshore data and gas transmission pipelines.
For the offshore data [5] the number of observations is less than the number of observations from the Dutch gas industry statistics (Section 4). The number of incidents is also significantly larger than the Dutch statistics. Thus for flange connections leaks the offshore data is not a suitable analogy. Gas transmission pipelines are also not suitable as an analogy, as flange connections are rare in the Dutch underground transmission pipeline systems.
Therefore, it is concluded that for flange leakages the failure frequency should be based on the statistics of the Dutch gas industry (see

RIVM Report 620550004
Page 44 of 79
Table 9). As mentioned before, ruptures of flange connections are excluded (section 6.1.2).
7.2 Piping
The failure frequencies for piping are derived using an analogy. Two options have been investigated and the analogy with transmission pipelines has been selected as the best analogy to be used.
Three options are identified for deriving base failure frequencies for on-site piping from the data for transmission pipelines: (1) HSE LUP method, (2) the Dutch buried gas transmission lines method and (3) the EGIG data.
The first one is the method for aboveground pipelines used in the United Kingdom, as described in section 3.3.1. The second option is the Dutch risk methodology for cross-country buried gas transmission pipelines, which has become statutory as of January 2011. The third option is the use of the EGIG data. EGIG is the European Gas pipeline Incident data Group and the EGIG database contains pipeline incident data of fifteen major gas transmission operators in Europe. The N.V. Nederlandse Gasunie is one of the participants in EGIG.
As a counterpart of the EGIG data there is a database of pipeline product loss incidents in the United Kingdom from UKOPA [24]. The UKOPA database contains incidents concerning pipelines with different products (oil and gas), but more than 90% of the pipeline lengths concern natural gas. For this research it is worth considering the UKOPA data besides the EGIG data. Because (i) the EGIG data also contains Dutch data from the Gasunie, (ii) the EGIG data is just about natural gas incidents and (iii) the total exposure of the EGIG data is larger than the UKOPA data (3.15 × 10⁹ metre years versus 7.41 x 10⁸ metre years), the EGIG data are chosen as an option above the UKOPA data. The UKOPA data will be used to compare and verify the EGIG data.
The options are given in sections 7.2.1 to 7.2.3; in the last section the comparison of EGIG with the UKOPA data is also made. In section 7.2.4 lifting activities and vehicle impact are discussed separately. This section ends with a discussion and conclusion.
7.2.1 HSE LUP frequencies
GL Noble Denton modified the HSE LUP frequencies for the on-site piping and pipelines [6] [23]. The HSE LUP Methodology (see section 3.3.1) considers the failure causes external events, mechanical failures and corrosion, whereby external events are sub-divided into: • vehicle impact; • lifting operations; • natural events; • aircraft crashes. The last one (aircraft crashes) is only relevant for sites in the vicinity of an airport. This is also the approach in the Netherlands [3]. This leads to the figures listed in Table 24.
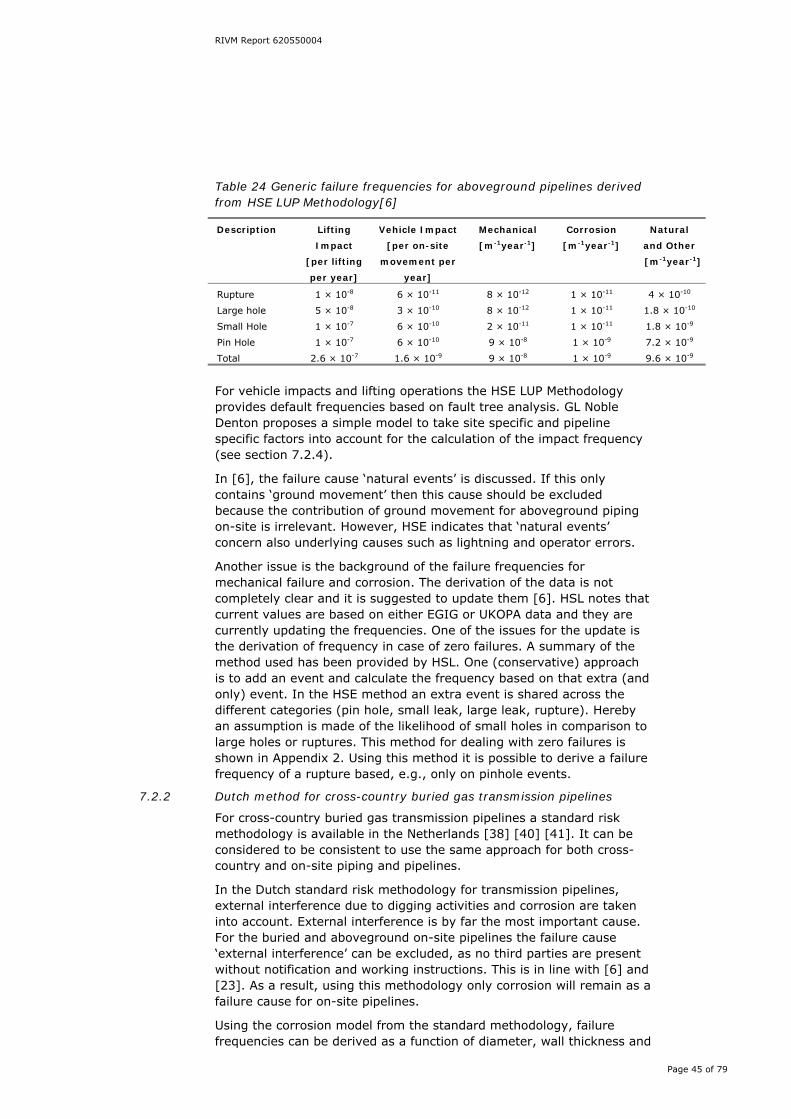
RIVM Report 620550004
Page 45 of 79
Table 24 Generic failure frequencies for aboveground pipelines derived from HSE LUP Methodology[6]
Description Lifting
Impact
[per lifting
per year]
Vehicle Impact
[per on-site
movement per
year]
Mechanical
[m-1year-1]
Corrosion
[m-1year-1]
Natural
and Other
[m-1year-1]
Rupture 1 × 10⁻⁸ 6 × 10-11 8 × 10-12 1 × 10-11 4 × 10⁻¹⁰
Large hole 5 × 10⁻⁸ 3 × 10⁻¹⁰ 8 × 10-12 1 × 10-11 1.8 × 10⁻¹⁰
Small Hole 1 × 10⁻⁷ 6 × 10⁻¹⁰ 2 × 10-11 1 × 10-11 1.8 × 10⁻⁹
Pin Hole 1 × 10⁻⁷ 6 × 10⁻¹⁰ 9 × 10⁻⁸ 1 × 10⁻⁹ 7.2 × 10⁻⁹
Total 2.6 × 10⁻⁷ 1.6 × 10⁻⁹ 9 × 10⁻⁸ 1 × 10⁻⁹ 9.6 × 10⁻⁹
For vehicle impacts and lifting operations the HSE LUP Methodology provides default frequencies based on fault tree analysis. GL Noble Denton proposes a simple model to take site specific and pipeline specific factors into account for the calculation of the impact frequency (see section 7.2.4).
In [6], the failure cause ‘natural events’ is discussed. If this only contains ‘ground movement’ then this cause should be excluded because the contribution of ground movement for aboveground piping on-site is irrelevant. However, HSE indicates that ‘natural events’ concern also underlying causes such as lightning and operator errors.
Another issue is the background of the failure frequencies for mechanical failure and corrosion. The derivation of the data is not completely clear and it is suggested to update them [6]. HSL notes that current values are based on either EGIG or UKOPA data and they are currently updating the frequencies. One of the issues for the update is the derivation of frequency in case of zero failures. A summary of the method used has been provided by HSL. One (conservative) approach is to add an event and calculate the frequency based on that extra (and only) event. In the HSE method an extra event is shared across the different categories (pin hole, small leak, large leak, rupture). Hereby an assumption is made of the likelihood of small holes in comparison to large holes or ruptures. This method for dealing with zero failures is shown in Appendix 2. Using this method it is possible to derive a failure frequency of a rupture based, e.g., only on pinhole events.
7.2.2 Dutch method for cross-country buried gas transmission pipelines
For cross-country buried gas transmission pipelines a standard risk methodology is available in the Netherlands [38] [40] [41]. It can be considered to be consistent to use the same approach for both cross-country and on-site piping and pipelines.
In the Dutch standard risk methodology for transmission pipelines, external interference due to digging activities and corrosion are taken into account. External interference is by far the most important cause. For the buried and aboveground on-site pipelines the failure cause ‘external interference’ can be excluded, as no third parties are present without notification and working instructions. This is in line with [6] and [23]. As a result, using this methodology only corrosion will remain as a failure cause for on-site pipelines.
Using the corrosion model from the standard methodology, failure frequencies can be derived as a function of diameter, wall thickness and

RIVM Report 620550004
Page 46 of 79
pressure. Results for some of the combinations are given in Table 25 and Table 26 [38] [42] [43]. The values in the tables are frequencies expected for a pipeline after 50 years of service without any measures being taken. This basic principle gives conservative results for pipeline ruptures but underestimates the leak frequencies, as leaks will eventually propagate into a rupture if not detected and no measures are taken. Thus, the corrosion model is only conservative when looking at ruptures. In the risk methodology for the natural gas transmission pipelines, the leak frequencies are not used because leaks do not significantly contribute to the risk [38].
Table 25 Base corrosion leak frequencies for transmission pipelines
Diameter
[inch]
Steel
Grade
Wall thickness [mm]
and pressure
Leak frequency
[m-1year-1]
40 bar 66.2 bar 80 bar 40 bar 66.2 bar 80 bar
2 DN50 Grade B 5.5 5.5 5.5 7.7× 10⁻⁹ 7.6× 10⁻⁹ 7.6× 10⁻⁹
6 DN150 Grade B 6.3 6.3 6.3 1.2× 10⁻⁸ 1.1× 10⁻⁸ 8.8× 10⁻⁹
8 DN200 Grade B 6.3 7.9 7.9 1.2× 10⁻⁸ 1.2× 10⁻⁸ 1.0× 10⁻⁸
12 DN300 Grade B 7.1 11.0 11.0 2.6× 10⁻¹⁰ 5.7× 10⁻¹¹ 1× 10-12
16 DN400 Grade B 8.7 14.2 14.2 4.1× 10⁻¹⁰ 2.2× 10⁻¹⁰ 1× 10-12
24 DN600 X60 9.3 11.1 1× 10-12 1× 10-12
36 DN900 X60 13.9 16.4 2.8× 10⁻¹⁰ 1.8× 10⁻¹⁰
Table 26 Base corrosion rupture frequencies for transmission pipelines
Diameter
[inch]
Steel
Grade
Wall thickness [mm]
and pressure
Rupture frequency
[m-1year-1]
40 bar 66.2 bar 80 bar 40 bar 66.2 bar 80 bar
2 DN50 Grade B 5.5 5.5 5.5 1.5× 10⁻¹⁰ 1.5× 10⁻¹⁰ 2.5× 10⁻¹⁰
6 DN150 Grade B 6.3 6.3 6.3 2.7× 10⁻¹⁰ 1.8× 10⁻⁹ 2.6× 10⁻⁹
8 DN200 Grade B 6.3 7.9 7.9 7.2× 10⁻¹⁰ 1.5× 10⁻⁹ 2.2× 10⁻⁹
12 DN300 Grade B 7.1 11.0 11.0 1.1× 10⁻⁹ 8.8× 10⁻¹⁰ 1.5× 10⁻⁹
16 DN400 Grade B 8.7 14.2 14.2 8.0× 10⁻¹⁰ 3.8× 10⁻¹⁰ 7.5× 10⁻¹⁰
24 DN600 X60 9.3 11.1 1.2× 10⁻⁹ 1.0× 10⁻⁹
36 DN900 X60 13.9 16.4 4.3× 10⁻¹⁰ 3.1× 10⁻¹⁰
The overall rupture failure frequency for transmission pipelines has been fitted using statistics. This has been done using N.V. Nederlandse Gasunie rupture data [40]. All ruptures have external interference due to digging activities as the underlying failure cause [38]. Even though external interference has been identified as the only cause from statistics, corrosion has been added as a failure cause [40]. Other failure causes such as material defects and construction failures and ground movement and others have not been observed in the Netherlands and thus can be omitted, since they can be neglected relative to external interference.
7.2.3 Data from EGIG
In Table 27, failure frequencies based on EGIG [16] (1970-2007) are presented. Failure data for external interference due to digging activities, ground movement and hot tapping by error are excluded as a failure causes for on-site aboveground piping and pipelines. Both external interference and hot tapping by error are caused by third-party

RIVM Report 620550004
Page 47 of 79
activities, which are not present within establishments. Ground movements such as landslides are natural events which, like flooding, are not considered. This means that the causes ‘construction defect/mechanical failure’, ‘corrosion’ and ‘other/unknown’ remain.
Table 27 Failure frequencies for piping based on EGIG data
Failure frequency [m-1·year-1] Event type Events Experience
[m·years] Average 95th percentile
Leak 63 3.15 × 10⁹ 2 × 10⁻⁸ 2.5 × 10⁻⁸
Rupture 17 3.15 × 10⁹ 5.5 × 10⁻⁹ 8 × 10⁻⁹
It should be noted that the derivation of the relative contribution of holes and ruptures from EGIG is an estimate because these are only given in a figure (exact numbers are confidential). The contribution from the Dutch industry through N.V. Nederlandse Gasunie is one leak with an experience of 2.47×10⁸ m·years [42] [44]. To improve the quality of this analogy, RIVM has requested the EGIG-group secretary to deliver some background information [45]. However, the delivery of more information has been vetoed by members of EGIG [46]. Thus no additional information could be given by the EGIG secretary. As the holders of the data refused to provide details on failure causes, any derived failure frequencies from this dataset will be conservative and ways to reduces risks cannot be given.
It is investigated whether the EGIG data are representative for the Dutch situation using a Poisson regression model. The conclusion is that the leak data from Gasunie and EGIG for transmission pipelines (without external interference) differ significantly (p = 0.03), with EGIG giving larger frequencies. The rupture data however do not differ significantly (p = 0.1).
In Table 28 the relative contributions of the underlying failure causes are shown. Construction defect/mechanical failure is the main cause. Corrosion leads only to leak scenarios.
Table 28 Relative contribution of underlying failure causes from EGIG
Failure cause Leak Rupture
Construction defect or material
failure
0.72 0.89
Corrosion (external) 0.22 0
Other or unknown 0.06 0.11
Another approach is to use the 5-year moving average that is presented by EGIG. GL Noble Denton proposed to use this approach as it would give a better representation of current practise. This would result in an average rupture frequency of 1.5×10⁻⁹ per metre per year [6]. As the protocol [9] sets as a minimum period to be included a period of 10 years and also the derived frequencies are in the same magnitude of order as the frequencies derived from the total period (1977–2008), it was decided not to follow this approach.
Comparison of EGIG with UKOPA data As noted previously, the UKOPA data are used to compare the results from the EGIG data. The failure frequencies based on UKOPA [24]

RIVM Report 620550004
Page 48 of 79
(from the period 1962–2008) are given in Table 29. The failure causes external interference and ground movement are excluded as failure causes for on-site pipelines. The remaining causes in the database are ‘construction defect/mechanical failure’ (including girth weld defects, seam weld defects and piping defects), ‘corrosion’ (internal and external) and ‘other/unknown’.
Table 29 Failure frequencies for piping based on UKOPA data
Failure frequency [m-1·year-1] Event type Events Experience
[m·years] Average 95th percentile
Leak 28 7.4 × 10⁸ 3.8 × 10⁻⁸ 5.1 × 10⁻⁸
Rupture 2 7.4 × 10⁸ 2.2 × 10⁻⁹ 7.5 × 10⁻⁹
The derivation of the relative contribution of holes and ruptures from UKOPA is an estimate because these are based on a graph. The categories of holes of 6–20 mm, 20–40 mm and 40–110 mm are put together as ‘leaks’ and the categories of holes of 110 mm – full bore rupture and full bore rupture and larger are combined to ‘rupture’.
The derived failure frequencies from UKOPA are of the same order of magnitude as the failure frequencies based on EGIG data. However, two remarks are made:
• The two ‘rupture incidents’ are from the category of holes of 110 mm – full bore. Aligned with UKOPA, it can also be decided to mark them as leaks instead of ruptures. This will lead to a rupture failure frequency of 4 × 10⁻⁹ m-1·year-1 (95th percentile).
• The relative contribution of the underlying causes of UKOPA differs from EGIG. Based on EGIG data ‘Construction defect or material failure’ is the most important cause. From UKOPA the cause ‘Other/unknown’ is the most important, followed by ‘External corrosion’.
7.2.4 Lifting activities and vehicle impact
For lifting and vehicle impact, a model already exists (Spider), developed by Advantica [47]. With this model the probability of pipeline failure can be calculated. Considered failure modes are denting and bending due to vehicle impact or lifting activities, using energy equations and hit probability assumptions. The size of the failure (pinhole, small leak or rupture) cannot be determined.
For the determination of the leak size, it was therefore proposed [6] to use the same ratios as by HSE-LUP [23]. This would result in conditional probability of about 0.25 on a pipeline rupture (= rupture and large hole) and 0.75 for a leak (= small hole and pinhole).
7.2.5 Discussion and conclusions
For the use of transmission lines as an analogy for aboveground pipelines within establishments, three options have been described:
• A. the HSE LUP method (section 7.2.1), • B. the Dutch method for transmission pipelines (section 7.2.2) and • C. the EGIG data (section 7.2.3). For the evaluation of these options the four criteria as mentioned in section 2.3 are used: transparency, verifiability, robustness and validity. All three methods are compared using these criteria.

RIVM Report 620550004
Page 49 of 79
Transparency • Method A shows the failure causes (lifting, vehicle impact,
mechanical, corrosion and natural/others) with their frequencies (divided for rupture, large hole, small hole and pinhole) in a clear way.
• Method B uses a structural reliability model. The background information is only available within the model, making it somewhat less transparent.
• Data from method C are published in a public report [6]. This report gives current information with an insight into trends, number of incidents, failure causes (external interference, construction / material failure, corrosion, ground movement, hot-tap, other/unknown) and frequencies, et cetera.
Verifiability • The source of the data from method A and the way derivations have
been done is not laid down in a publicly available document, making verification difficult (this is one of the reasons the method is currently being revised by HSL).
• For method B, background information is available within the model, being the original data source.
• Data from method C are available from the public report, also giving information on contributing companies. However, the background information from the individual incidents is not available.
Robustness • Method A results in failure frequencies being smaller than can be
justified using a statistical approach. • In method B average numbers are used based on statistics. • In the failure frequencies from method C, the uncertainties are also
quantified. Validity • Method A uses a best estimate method for dealing with the
derivation of frequencies in case of zero failures. One of the issues with this method is the assumption of the likelihood of small holes in comparison to large holes or ruptures. For example, if there are a lot of pinhole incidents, the derived frequency of a rupture will be smaller than if only a few pinholes have occurred.
• In method B only the failure causes external interference and corrosion are considered, where external interference is the most important cause. Other causes such as, e.g., construction failures are not considered. For aboveground pipelines external interference (due to excavating, drilling or piling) is not important and can be de-selected. As the method is completely based on external interference, its validity is limited when the main cause is removed.
• Regarding method C, figures from the report had to be interpreted before the information could be used because the numbers on which the figures are based are not given in the report. Further refinement of the analysis (e.g., to focus on leaks and ruptures relevant for the Dutch situation) is not possible. As the holders of the data refused to provide details, any derived failure frequencies from this dataset will be conservative and ways to reduce risks cannot be given.
The remarks as given above have resulted in Table 30, where all three methods are mentioned using the four criteria.

RIVM Report 620550004
Page 50 of 79
Table 30 Comparison of the three methods
Criterion A B C
Transparency ●●●●● ●●●● ●●●●●
Verifiability ●● ●●●● ●●●
Robustness ●● ●●● ●●●●
Validity ●● ●● ●●●
Based on this comparison, the EGIG data has been selected as the best matching analogy. A request for background information by RIVM to improve the quality and validity of the analogy has been vetoed by members of EGIG. [46]. As the holders of the data have refused to provide details on failure causes, any derived failure frequencies from this dataset will be conservative and ways to reduce risks cannot be given.
The selection of the EGIG data as an analogy has several consequences. The use of EGIG data leads to frequencies with no diversification due to pipeline parameters such as diameter, material, wall thickness and pressure. The frequencies can only be divided into the contributions of the underlying failure causes ‘construction’, ‘corrosion’ and ‘other causes’ (see Table 28). For external impact it was decided to take the lifting and vehicle impact into account. This can be seen as an additional failure cause next to the failure causes mentioned in EGIG. An option is to adopt the Spider model [6] for this failure cause.
Another issue is the failure frequencies might be considered to be conservative in comparison with the other two options (HSE LUP method and the Dutch method for buried transmission lines). At RIVM’s request, GL Noble Denton used the EGIG data for the update of the HSE LUP frequencies [6]. The failure frequencies for ‘mechanical/construction failure’, ‘corrosion’ and ‘other’ were updated using the EGIG data and the lifting and vehicle impacts were replaced by the Spider model. The results of two cases show that the contribution from impact is negligible compared to the other causes. With the HSE LUP method this would not be the case.
Thus, the frequencies derived from the EGIG data will be higher than the frequencies from the HSE LUP method and also higher than the frequencies predicted by structural analysis techniques (such as Pipesafe). On the other hand, the comparison with UKOPA data shows that the results based on EGIG are of the same magnitude as the frequencies based on UKOPA data. Further, the choices made in the methodology for deriving frequencies, such as applying a confidence interval, also contribute to the robustness of the EGIG data.
Because the Dutch method for transmission lines is based on structural analysis techniques, the choice of the EGIG data will keep the difference between buried transmission lines outside and aboveground pipelines within establishments. To avoid this inconsistency, GL Noble Denton recommends the development of structural analysis models for aboveground pipelines within establishments [6]. Such a model is available for corrosion but not for mechanical/construction failures and other causes, while the failure cause ‘Construction defect or material failure’ is dominant (see Table 28). At the moment, it is not possible to

RIVM Report 620550004
Page 51 of 79
select a structural analysis model which incorporates all the relevant failure causes mentioned by EGIG.

RIVM Report 620550004
Page 52 of 79

RIVM Report 620550004
Page 53 of 79
8 Discussion and conclusions
8.1 Scenarios and failure frequencies
This report concerns the derivation of the scenarios and failure frequencies of aboveground high-pressure pipelines and flange connections within establishments. Using the protocol for the adjustment of quantitative risk assessment calculation methodologies [9], first the statistics for pipelines and flange connections of the Dutch gas industry have been investigated (Chapter 4). The failure frequencies derived from this analysis are given in Table 9 and Table 10. For both piping and flange connections no ruptures occurred and therefore an analogy could be investigated. This is also true for the pipeline leaks.
Two analogies have been identified: offshore data and gas transmission pipelines (see Chapter 5). The gas transmission pipelines have been selected as a best analogy for aboveground high-pressure pipelines. In Chapter 6 the relevant and representative scenarios for the aboveground high-pressure piping and the flange connections have been described. The derivation of the failure frequencies for these scenarios is based on EGIG data for the piping scenarios. For flange connections the data from the Dutch gas industry have been used (Chapter 7).
The combination of scenarios and derived failure frequencies are shown in the next two tables.
Table 31 Scenarios for flange connections
Scenario Leak size (Diameter) Frequency
[year-1]
Frequency
[year-1]
Average 95th percentile
Leak 10% D with max. 50 mm 5.5 × 10⁻⁷ 2.6 × 10⁻⁶
Rupture Not included
Table 32 Scenarios for piping
Scenario Leak size (Diameter) Frequency
[m-1⋅year-1]
Frequency
[m-1⋅year-1]
Average 95th percentile
Leak 10% D with max. 50 mm 2 × 10⁻⁸ 2.5 × 10⁻⁸
Rupture 100% D 5.5 × 10⁻⁹ 8 × 10⁻⁹
An important requisite for the exclusion of ruptures of flange connections is that the flange connection is hydrostatically tested before it is taken into operation. The design and maintenance of the flange connection should also be according to industry standards. The contribution of external events, such as vehicle impact and lifting operations, should be taken into account for aboveground piping within establishments. To do this, some further work must be done.

RIVM Report 620550004
Page 54 of 79
8.2 Domino effects
Only in the case of a situation in which the failure of one installation clearly leads to the failure of another installation does an internal domino-effect need to be included in a QRA [3]. Leaks of aboveground piping or flange connections are identified as possible initiating events for piping ruptures. A conditional probability of about 0.001 piping ruptures as a result of a leak has been (conservatively) determined [4]. E.g., for flanges, this results in an additional failure frequency of 5.5 ×10⁻¹⁰ (average) or 2.6 ×10⁻⁹ (95th percentile) per year for the piping sections which could fail as a result of a domino effect.
8.3 Further work
8.3.1 Vehicle impact and lifting activities
If vehicle impact or lifting activities cannot be excluded during normal operation of the plant, it is proposed to evaluate the proposed model [6] [47]. As lifting activities and vehicle impact can dominate the failure frequency of aboveground pipelines it is recommended: • to check the by GL Noble Denton proposed model using Finite
Element (FE) modelling and to derive well-founded conditional probabilities on pipeline leaks and ruptures
• to investigate the kind of detail to be taken into account in the calculation of the failure frequency. For vehicle impact, besides pipeline parameters such as wall thickness and yield strength, the weight and maximum speed are of importance. For the impact of lifting activities the maximum load and maximum load height are of importance. It should therefore be investigated whether it is workable solution to incorporate these parameters.
8.3.2 Incident reporting
For the derivation of failure frequencies the reports of HCRD [5], EGIG [6] and UKOPA [24] could be used. Dutch generic incident databases (NOGEPA or from the State Supervision of Mines) were not suitable for the derivation of frequencies. Therefore, the recommendation is to improve the Dutch databases in such a way that they will also be suitable for more detailed incident analysis and the determination of frequencies for risk assessments. To do this at least the following information has to be taken into account: • the amount of material being released • hole size dimensions • the duration of the release • underlying causes of an incident • the consequences of an incident If this information is available it is possible to refine the frequencies based on the contribution of the underlying causes and specific measures.

RIVM Report 620550004
Page 55 of 79
References [1] Decree of May 27, 2004, on environmental quality requirements
for external safety for establishments under the environmental law (Decree external safety establishments). Staatsblad 521. 2004 (in Dutch).
[2] Spouge J. New Generic Leak Frequencies for Process Equipment. Process Safety Progress (Vol. 24, No.4). December 2005.
[3] Reference Manual Bevi Risk Assessments version 3.2. National Institute for Public Health and the Environment (RIVM). 2010. (www.rivm.nl/milieuportaal/bibliotheek/veelgesteldevragen/-waar-vind-ik-de-handleiding-risicoberekeningen-bevi.jsp). Consulted September 2010.
[4] Brand D, Dröge MT, Keesom WJM. Failure in Aboveground Pipeline Systems, Rev.1. NV Nederlandse Gasunie. July 15, 2010.
[5] Crossthwaite Ph. The HCR database – Its Potential for Use at Aboveground Gas Facilities. DNV report EP028197. 2010.
[6] Acton MR. Estimating failure frequencies for above-ground pipelines. GL Noble Denton. Report 10287. January 18, 2011.
[7] Publicatiereeks Gevaarlijke Stoffen 3, Guidelines for Quantitative Risk Assessment. Ministry of Housing, Spatial Planning and the Environment (VROM). PGS 3. 2005.
[8] Aart MFJ van der. Failure Data Analysis Pumps and Compressors, Research Report. Arcadis Vectra. Prepared for National Institute for Public Health and the Environment (RIVM). Rev.1 (draft). April 6, 2010.
[9] Protocol for the adjustment of quantitative risk assessment calculation methodologies. National Institute for Public Health and the Environment (DORA). Draft. Feb. 2011. (in Dutch).
[10] Gooijer L. Improving the QRA tools using criteria - a first exploration. DORA 08-011. November 20, 2009. (in Dutch).
[11] SciVerse Scopus. Elsevier BV. (http://www.info.sciverse.com/scopus/) Consulted July 2010.
[12] Falck A, Bain B, Rødsætre LK. Leak Frequency modelling for offshore QRA based on the Hydrocarbon Release Database (HCRD). Hazards XXI, Symposium Series No. 155, ICHEME. 2009.
[13] Papadakis GA. Major hazard pipelines: a comparative study of onshore transmission accidents. Journal of Loss Prevention in the Process Industries 12 (1999) 91-107. 1999.
[14] Yuhua D, Datao Y. Estimation of failure probability of oil and gas transmission pipelines by fuzzy fault tree analysis. Journal of Loss Prevention in the Process Industries, 18 (2005) 83–88. 2005.
[15] Jo YD, Ahn BJ. A method of quantitative risk assessment for transmission pipeline carrying natural gas. Journal of Hazardous Materials A123 (2005) 1–12. 2005.
[16] EGIG. Gas pipeline incidents. 7th EGIG report, 1970-2007. EGIG 08.TV-B.0502. 2008.
[17] Han ZY, Weng WG. An integrated quantitative risk analysis method for natural gas pipeline network. Journal of Loss Prevention in the Process Industries, 23. 2010.
[18] Riser and pipeline release frequencies. OGP, International Association of Oil and Gas Producers, Risk Assessment Data Directory. Report No. 434-4. March 2010.

RIVM Report 620550004
Page 56 of 79
[19] Process release frequencies. OGP, International Association of Oil and Gas Producers, Risk Assessment Data Directory. Report No. 434-1. March 2010.
[20] Major Hazard Incident Data Service (MHIDAS). Health and Safety Executive (HSE). March 2007.
[21] HSE’s Land use planning methodology. Health and Safety Executive (HSE) and PADHI. September 2009.
[22] Failure Rate and Event Data for use within Land Use Planning Risk Assessments. Health and Safety Executive (HSE).
[23] Pointer SC. Failure Frequencies for Aboveground Natural Gas Pipelines. CI5B. July 2004.
[24] UKOPA, UKOPA Pipeline Product Loss Incidents (1962–2008), 6th Report of the UKOPA Fault Database Management Group, GL Report Reference 9046, December 2009.
[25] Circular 1013761C DEVP of May 10, 2010, summarising the methodological rules applicable to hazard studies, the assessment of the process of reducing risk at source and plans for prevention of technological risks (PPRT) in classified installations under Act of July 30, 2003. May 10, 2010. (in French)
[26] Handbook Failure Frequencies 2009 for drawing up a safety report. LNE Department, Safety Reporting Division. May 5, 2009.
[27] Actualisatie van de faalfrequenties in risicoberekeningen in Sevesobedrijven. SGS. TWOL-project. July 2007. (in Dutch)
[28] Handbook Failure Frequencies 2009 – background information. LNE Department, Safety Reporting Division. May 5, 2009.
[29] Konersmann R, Kühl C, Ludwig J. On the risks of transporting liquid and gaseous fuels in pipelines, Federal Institute for Materials Research and Testing BAM, Research report 289, Berlin, 2009.
[30] Alberta Energy and Utilities Board (EUB), Pipeline Performance in Alberta 1990-2005 Report 2007-A, April 2007.
[31] Rozendal S. Delivery of failure statistics (process) piping. E-mail to Gooijer L. July 22, 2010. (in Dutch)
[32] Rozendal S. Delivery of failure statistics for (process) piping. E-mail to Vliet AAC van. August 16, 2010. (in Dutch)
[33] Dijk R van. Reply to Request for contribution to QRA methodology piping on establishments. E-mail to Vliet AAC van. August 6, 2010. (in Dutch)
[34] Dijk R van. Reply to Request for contribution to QRA methodology piping on establishments. E-mail to Laheij GMH. July 23, 2010. (in Dutch)
[35] Bolt M. Reply to Request for contribution to QRA methodology piping within establishments. E-mail to Gooijer L. August 23, 2010. (in Dutch)
[36] Health and Safety Executive, Offshore Hydrocarbon Releases 2001-2008, Research Report, RR672, 2008.
[37] The Reporting of Injuries, Diseases and Dangerous Occurrences Regulations 1995 (RIDDOR). Statutory Instrument 1995 No. 3163.
[38] Code of practice for pipelines – part 3. BSI British Standards. PD 8010-3:2009.
[39] Gielisse M, Dröge MT, Kuik GR. Risicoanalyse aardgastransportleidingen. N.V. Nederlandse Gasunie. Report DEI2008.R.0939. 2008. (in Dutch).

RIVM Report 620550004
Page 57 of 79
[40] Laheij GMH, Vliet AAC van, Kooi ES. Achtergronden bij de vervanging van zoneringsafstanden hoge druk aardgastransportleidingen van de N.V. Nederlandse Gasunie. National Institute for Public Health and the Environment (RIVM). Report 620121001. 2008. (in Dutch).
[41] Laheij GMH, Vliet AAC van, Hansler RJ. Consequences of new risk methodologies for transmission pipelines. 13th International Symposium on Loss Prevention and Safety Promotion in the Process Industries. Brugge, 6 – 9 June 2010.
[42] Bolt R, Kuik R, Zanting J, Jager E. Risicoanalyse aardgastransportleidingen. N.V. Nederlandse Gasunie. Report RT 2003.R.0355. 2003 (in Dutch)
[43] KEMA. Risicoanalyse aardgastransportinrichtingen. Draft 13 January 2010.
[44] Dröge MT. Reply to Request for contribution to QRA methodology piping within establishments. E-mail to Laheij GMH. September 30, 2010. (in Dutch)
[45] Vliet AAC van. EGIG data request. E-mail to Brand D van den. October 14, 2010.
[46] Dröge MT. Reply to EGIG data request. E-mail to Laheij GMH. December 2, 2010. (in Dutch)
[47] Cooper M.G. Failure frequency of aboveground pipework due to impact damage, Advantica, R 6161, April 2003.

RIVM Report 620550004
Page 58 of 79

RIVM Report 620550004
Page 59 of 79
Appendix 1 Study group members and memo
The research described in this report was conducted in consultation with an international study group with members from industry and government institutions. The members were (in alphabetical order):
Aart, Marc van der NL personally, from DORA (consultation group on risk analysis)
Acton, Mike UK GL Noble Denton Chaplin, Zoe UK Health and Safety Laboratory Crossthwaite, Phil UK DNV Dröge, Marc NL NV Nederlandse Gasunie Frijns, Peter NL Ministry of Infrastructure and the Environment Harper, Peter UK Health and Safety Executive Keesom, Wil NL NV Nederlandse Gasunie Lenoble, Clément F INERIS Pinxteren, Marco van NL State Supervision of Mines, Ministry of
Economic Affairs, Agriculture and Innovation Rozendal, Schelte NL Nederlandse Aardolie Maatschappij BV The study group does not unanimously endorse all the results and conclusions of this research. Phil Crossthwaite (DNV) wrote his reservations down in a memo. See the next page.

RIVM Report 620550004
Page 60 of 79
Memo - Phil Crossthwaite (DNV)

RIVM Report 620550004
Page 61 of 79

RIVM Report 620550004
Page 62 of 79

RIVM Report 620550004
Page 63 of 79

RIVM Report 620550004
Page 64 of 79

RIVM Report 620550004
Page 65 of 79

RIVM Report 620550004
Page 66 of 79

RIVM Report 620550004
Page 67 of 79

RIVM Report 620550004
Page 68 of 79

RIVM Report 620550004
Page 69 of 79

RIVM Report 620550004
Page 70 of 79

RIVM Report 620550004
Page 71 of 79
Appendix 2 MHIDAS
Incidents involving natural gas pipelines on establishments In the MHIDAS database 10 database entries (from the original 16,225 entries) can be assigned to incidents at establishments with natural gas pipelines (possibly aboveground). For this, the following selections were made in the database: 1. Selection on the substance involved (natural gas (incl. natural gas
condensate (1 entry) and natural gas liquid(s) (12 entries)). This resulted in 563 remaining entries;
2. Selection on the origin/location of the incident. Entries with origin “unknown” (6), “domestic/ commercial” (24), “transport” (431) and “warehouse” (1) were removed. This resulted in 101 remaining entries;
3. Selection on the equipment involved (pipework, pipeline and unknown). This resulted in 59 remaining entries. In MHIDAS, pipework is defined as ’all process piping within the plant boundary, and associated valves and joints’;
4. In the last selection, entries were manually removed based on incident descriptions.
The selections resulted in 10 remaining relevant entries. The main failure causes from these entries are: • 3 mechanical failure (1 corrosion) • 3 human (2 maintenance, 1 general operations) • 1 external • 3 not given (unknown?) Based on these 10 entries it can be concluded that no reliable conclusive remarks on the distribution of the relevant failure causes for pipeline leaks and ruptures can be made. Description of incidents with natural gas pipelines
1. Allied Chemical Corp compressor pump station. Three compressor units, building and pipeline heavily damaged. One of the compressor discharge lines ruptured + the release was ignited. Plant (1 mile) west of station extracts natural gas from casing head gas.
2. Seven workers burned at Phillips petroleum plant when caught between two fires in ruptured pressurised pipelines during routine maintenance. Fire led to three explosions. Fire extinguished five hours after first explosion.
3. A 34.5 bar pipe at a gas oil separation plant developed a leak which grew in size but eventually broke, releasing a large gas cloud. Ignition source 450 m away. Seven-metre section of pipe struck a spheroid 120 m away causing a second cloud ignited by first.
4. Six workers were injured during maintenance work on flare line. 5. Residents were evacuated for about three hours after a volatile gas
cloud formed over a natural gas facility. The source of the leak was tracked down to a section of pipe, which was repaired.
6. Explosion and fire occurred when workers carrying out maintenance on a high-pressure flare line. Men admitted to hospital and

RIVM Report 620550004
Page 72 of 79
two later died. Fire extinguished in 30 minutes, no major damage to plant.
7. Gas pipeline exploded at a gas works facility. A section of nearby interstate was closed as the fire service fought the fire. Some residents voluntarily left their homes although they were not under threat. Some effect on gas pressure supplied to customers.
8. Natural gas pipeline leak at power plant of recycled newsprint mill resulted in massive explosion. Slowly leaking gas was probably ignited by a spark a from passing car.
9. The metering unit of the natural gas distribution station was rocked by an explosion. A fire also occurred.
10. Valves on some pipelines leading to LNG storage tank where men were working were left open. When pipes were tested, gas seeped into tank. Men never noticed unodourised gas + may have lit a cigarette causing the explosion.
Incidents involving flanges In the MHIDAS database, there are 38 database entries concern flanges on pipework at establishments. The following selections were made in the database: 1. Selection on flanges. This resulted in 79 entries. 2. Selection on the origin/location of the incident and the equipment
involved (pipework, pipeline and unknown) was made. This is done similarly to the selections for the ‘natural gas’ incidents and resulted in 38 remaining incidents. None are however related to a release of natural gas.
Four incidents describe a flange being broke or ruptured. For the ruptures, the following substances were involved: crude oil (1), vinyl chloride (1), sulphuric acid (1) and trichlorosilane (1). From the other 34 incidents with flange leaks it can be concluded that flange leakages not only occur during maintenance, but also during normal operation. However, as no entry is related to a release of natural gas and as a number of incidents occur, for example, during transfer, i.e., loading or unloading operations using rigid pipework (6 entries) or storage (1), it can not be concluded that this will also be the case for piping or pipelines with natural gas.
Based on these entries it is concluded that no reliable conclusive remarks on the distribution of the relevant failure causes for pipeline leaks and ruptures can be made. Description of incidents where a flange broke or ruptured
1. Vinyl chloride escaped from an unbolted flanged connection at a pressure of 5 bar during start-up of polymerisation plant. Gas ignited and exploded destroying unit
2. Six splashed by acid when 500 gallons of sulphuric acid spilled when a flange broke on a pipe leading from a railroad tank car to a building. Three released from hospital and three reported in a stable condition
3. Flange broke and spilled trichlorosilane, which converted to silicone dioxide and hydrochloric acid when it came into contact with moisture in the air. Small fire was put out with dry chemical fire extinguisher. Fire fighters knocked down vapour cloud

RIVM Report 620550004
Page 73 of 79
4. Rupture of a flange on pipeline 8 km from pump station caused 400 te of crude to leak before line was shutdown. Main pipeline was shutdown and 2 auxiliary lines were brought into operation 5 hours later
Description of other incidents with flanges
1. Serious fire damaged 10 per cent of ICI no1 aromatics plant following leak from flange. Ten fire engines took much of the day to control the fire. No injuries or effects on river traffic
2. Ethylene plant shut down as a result of leak of nitrogen from tank due to valve failure. Entire plant being checked. 400,000 tpy unit was shut down during tests as a result of a flange fire.
3. Defect in new pipeline spilled 1/2 million gallons of aviation fuel. Flange on valve caused leak. Pollution caused 25,000 gallons recovered by booms. Pipeline carries kerosene from storage tanks to fuelling points at airport.
4. Explosion in benzene unit of petrochemical / styrene plant. Crew starting up system increased pressure in hydrogen system. Hydrogen released from a manhead flange and ignited. Benzene released from pipe flange burned for 8 hours. Buildings severely damaged.
5. Chlorination plant shut down because of leaking flange in acid waste line. Acid pool prevented access to switch box. After emptying line benzene/chlorobenzene vapours escaped from flange and ignited by static or acid damage to electrical installation.
6. Butane leak from a flange caught fire killed the operator who was shutting down the plant. Company and state fire fighters took three hours to put out the blaze.
7. Release of chlorine after workman separated flange with liquid still inside. Response seemed to be well organised with gas protection equipment available. High wind 16–18 metres/sec and heavy rain at the time carried gas to buildings in vicinity.
8. Undisclosed amount of chlorine released to the atmosphere by the DOW chemical company of Canada. The injured workers were at a site 0.4–0.8km away. Release due to maintenance worker removing valve bonnet flanges on liquid chlorine line. Between 83–94 injuries.
9. Singapore petroleum company Leak from three-inch water injection flange of desalter in crude distillation unit. After ignition, the fire fed from ruptured overhead receiver and lines.
10. Crude oil leaked from check valve on oil desulphurisation plant pipework and caught fire. The plant was shut down immediately and the fire was extinguished within two hrs. Check valve/pipework flange gasket was loose. Company=general petroleum refinery.
11. A flange fire occurred during start-up after maintenance at an oil refinery. There was minimal damage but one person was injured.
12. Following two shutdowns due to industrial action, a loose flange allowed crude oil to spill out and catch fire. Nearby electrical substation under threat and flights from Sydney airport halted. More than 75 fire fighters responded.
13. Fitter at Monsanto broke pipe flange on vessel and overcome. Claimed he was not told to wear protective clothing. Maintenance staff out in support of demand for better first-aid facilities.

RIVM Report 620550004
Page 74 of 79
14. Leak from flanged joint or broken thermowell on high-pressure piping caused a spill lasting about 30 min before ignition. Windows broken in 180 m radius. Roofs and ceilings in 4 buildings damaged. Blast had TNT equivalence of >7 kg.
15. Low quality exit flange/sealing on polyethylene reactor responsible for gas leak which ignited sending flames 30 ft high. Line isolated and fire out after 8 min.
16. Leaking flange connection in ethylene oxide plant gave gas cloud which subsequently detonated. Explosion caused overheating of drainage column, which burst and was completely destroyed.
17. Leaking flange in oil refinery distillate hydrotreater released gas-oil/hydrogen vapour, which ignited at nearby furnace. Overhead product pipes fractured, fuelling the blaze. Process lines/vessels were severely damaged. 2000 gallons of distillate destroyed.
18. Leak detected at valve on naphtha distillation line. Line purged with nitrogen but not isolated. Valve removed and flange ground. Grinder sparks ignited hydrocarbon in line.
19. Subcontractor erroneously loosened flange bolts on separating vessel valve during preparation for kerosene/gas oil unit inspection. 30% hydrogen sulphide blew off from condensate separator, causing death/injuries.
20. Explosion in refinery injured 20–21 persons, six seriously. Investigations point to a flange leak on an elevated LPG feed line to the alkylation unit apparently leaking. Fire brought under control within two hours by refinery fire brigade.
21. Chlorination plant shut down because of leaking flange in acid waste line. Acid pool prevented access to switch box. After emptying line, benzene/chlorobenzene vapours escaped from flange and ignited by static or acid damage to electrical installation.
22. Up to 20 gal of oleum leaked from unmatched flanges at Rhone Poulenc at 7.45pm, causing a sulphuric acid cloud. Local roads blocked for 1 hr, residents warned to stay indoors. Company prosecuted under health and safety at work act.
23. Return line from storage to road tanker for reject phthalic anhydride blocked when heating turned off. Maintenance operator died from 55% burns after being sprayed with phthalic anhydride at 150 degrees Celsius when flange ruptured.
24. Power failure caused rupture of expansion joint in refrigeration compressor pipeline. Resulting gas cloud was ignited by furnace 100 m away. Subsequent fire caused additional leaks at flanges. Shock wave estimated at equivalent of 8.8 te TNT.
25. Pipe connecting polymerisation reactor and separating tank in polypropylene unit blocked. Gas leaking through flange ignited due to polypropylene particles becoming charged with static.
26. A leak of 100 gallons of titanium tetrachloride occurred Apparently from a flange on the pipework. A gas cloud was formed which moved towards nearby villages. Residents were warned to keep windows and doors shut. Fire crews swilled residue away.
27. Flange bolts not tightened on pump installed on line to propane and butane receivers. On starting, the pump propane escaped and was ignited by a nearby welding torch. Gas supply shut-off and fire allowed to burn out.
28. Precautionary evacuations after leak of ammonia at phosphoric acid plant. Liquid cargo being prepared for transfer from rail tanker to

RIVM Report 620550004
Page 75 of 79
storage tanks. Concern that warning siren not sounded. Flange leak sealed. At least nine hospitalised, seven for observation.
29. 1000 l diesel spilled due to flange failure on pipe along sea wall in vicinity of jetty. some spilled to shoreline but most went down drain system. Spill occurred at low tide, assisting company in clean-up.
30. Workmen acted quickly when dimethyl amine gas leaked from the flange of a pipe connected to a road tanker at a chemical products production area.
31. No casualties were reported following an explosion at a refinery. Explosion was thought to have occurred after hydrogen leaked from a flange during unit pressurisation. The explosion and subsequent fire led to the refinery being temporarily closed.
32. Faulty flange released 100,000 litres of petrol forming a lake in the middle of the refinery. Spill blanketed with foam until petrol could be transferred to tankers.
33. A 10-inch valve was prevented from closing by powder build-up. When workmen depressurised the pipe and the flange was opened, powder blew out and liquid butane was released. Ignition took place 100 ft away, flashback occurred. Other process vessels involved in fire.
34. Removal of wrong blind flange led to spill of unknown quantity. Ignited by heater 18 m from spill point.

RIVM Report 620550004
Page 76 of 79

RIVM Report 620550004
Page 77 of 79
Appendix 3 HSE/HSL’s Method for dealing with zero failures
Zero failure rates can be generated when using historical data to calculate failure rates. The zero implies that no failures occurred for a specific type of event in a given time period; however, it does not indicate that an event will never occur in such circumstances.
In categories where zero failures occur, assumptions have to be made in order to reflect the chance of a failure, even if not seen historically (over the observation period). In these circumstances, the difficultly is in how the failure rate should be estimated. Previous calculations of failure rates for pipelines have added one extra event into each failure mode, or one extra event across a range of failure modes. Both methods have drawbacks, either over- or underestimating the failure rate for the different groups or proportioning the failure rate unevenly or unrealistically between failure modes. However, the former approach appears overly conservative. Therefore, an approach similar to that agreed and previously used by HSE has been adopted. Where deviations to this approach have been made, for example, making use of expert judgement to share events across all categories, this has been discussed in the appropriate place in this report.
If we take, as an example, a case of a 200 km pipeline that has seen 3 ruptures and 1 large hole over a time period of 20 years, then it is possible to calculate an overall failure rate of (3+1)/(200*20) = 0.001 per km yr. It is also possible to calculate failure rates for ruptures (3/(200*20) = 7.5 ×10⁻⁴ per km yr) and large holes (1/(200*20) = 2.5 ×10⁻⁴). There is no obvious way, however, to obtain a failure rate for either pin holes or small holes so, in this case, one extra failure will be added to the total (i.e., there are now five failures in total rather than four) and that extra failure will be apportioned to each of the hole sizes as follows:
• 3/5 will be added to ruptures, giving a total number of failures of 3.6 and a failure rate of 3.6/(200*20) = 9 ×10⁻⁴ per km yr;
• 1/5 will be added to large holes, giving a total number of failures of 1.2 and a failure rate of 1.2/(200*20) = 3 ×10⁻⁴ per km yr;
• 1/5 will be split equally (i.e., 1/10 each) between pin holes and small holes, giving each a failure rate of 0.1/(200*20) = 2.5 ×10⁻⁵ per km yr.
Example using mechanical data
NB This is an example only and is not intended to be used in earnest.
Over the 20-year period, 35 events were recorded which were attributed to mechanical failure. This gives a failure rate of 8.4 ×10⁻⁵ (35/414734) per km yr.
All hole sizes were less than 10 mm equivalent diameter and were classified as pinholes. No small holes, large holes or ruptures were observed in the data due to this failure mode in the last 20 years.

RIVM Report 620550004
Page 78 of 79
The failures were further subdivided according to the wall thickness, shown in Table 33, and the pipeline diameter, shown in Table 34, to determine if any relationship existed between the failure rate and either of these two variables.
Table 33 Mechanical failure rate as a function of wall thickness
Wall thickness (mm)
Exposure (km yr) Number of events Failure rate
(per km yr)
0 – 5 23846.44 24 1.0 × 10⁻³
5 – 10 202697.6 11 5.4 × 10⁻⁵
10 + 188190 0 0
Table 34 Mechanical failure rate as a function of pipeline diameter
Pipeline diameter (in)
Exposure (km yr) Number of events Failure rate
(per km yr)
< 8 43575.63 26 6.0 × 10⁻⁴
8 - <12 59145.94 4 6.8 × 10⁻⁵
12 - <16 53638.92 2 3.7 × 10⁻⁵
16 - <24 74609.36 2 2.7 × 10⁻⁵
24 - <30 62857.04 1 1.6 × 10⁻⁵
≥ 30 120907.1 0 0
The failure rates shown in Tables 33 and 34 indicate a greater chance of a failure occurring on smaller diameter or thinner-walled pipelines.
Tables 35 and 36 show the failure rate as a function of hole size, where Table 36 shows adjustments for the zero failure events. Given that only pinholes have been observed in the last 20 years, it is assumed that small holes are twice as likely as large holes or ruptures.
Table 35 Mechanical failure rate as a function of hole size
Hole size Number of events Failure rate (per km yr)
Rupture 0 0
Large hole 0 0
Small hole 0 0
Pinhole 35 8.4 × 10⁻⁵
Table 36 Mechanical failure rate as a function of hole size after adjustment for zero failures
Hole size Number of
events Modified number
of events Failure rate (per km yr)
Rupture 0 =0 + (1/36)/4 = 0.00694 1.7 × 10⁻⁸
Large hole 0 = 0 + (1/36)/4 = 0.00694 1.7 × 10⁻⁸
Small hole 0 = 0 + (1/36)/2 = 0.0139 3.3 × 10⁻⁸
Pinhole 35 = 35 + (35/36) = 35.972 8.7 × 10⁻⁵
Table 37 shows the derivation of the mechanical failure rate as a function of hole size and pipeline diameter. In this case, there were many categories with zero events.

RIVM Report 620550004
Page 79 of 79
Table 37 Mechanical failure rate as a function of hole size and pipeline diameter
Pipeline diameter (in) Pinhole Small hole Large hole Rupture
Event data
< 8 26 0 0 0
8 - <12 4 0 0 0
12 - <16 2 0 0 0
≥ 16 3 0 0 0
Failure rate (per km yr)
< 8 6.0 × 10⁻⁴ 0 0 0
8 - <12 6.8 × 10⁻⁵ 0 0 0
12 - <16 3.7 × 10⁻⁵ 0 0 0
≥ 16 1.2 × 10⁻⁵ 0 0 0
Table 38 illustrates the derivation of the mechanical failure rate as a function of hole size and pipeline diameter after a zero rate analysis had been performed.
Table 38 Mechanical failure rate as a function of hole size and pipeline diameter, with zero rate analysis
Pipeline diameter (in) Pinhole Small hole Large hole Rupture
Event data
< 8 26 + 26/27 1/27 x 1/2 1/27 x 1/4 1/27 x 1/4
8 - <12 4 + 4/5 1/5 x 1/2 1/5 x 1/4 1/5 x 1/4
12 - <16 2 + 2/3
1/3 x 1/2 1/3 x 1/4 1/3 x 1/4
≥ 16 3 + 3/4 1/4 x 1/2 1/4 x 1/4 1/4 x 1/4
Failure rate (per km yr)
< 8 6.2 × 10⁻⁴ 4.2 × 10⁻⁷ 2.1 × 10⁻⁷ 2.1 × 10⁻⁷
8 - <12 8.1 × 10⁻⁵ 1.7 × 10⁻⁶ 8.5 × 10⁻⁷ 8.5 × 10⁻⁷
12 - <16 5.0 × 10⁻⁵ 3.1 × 10⁻⁶ 1.6 × 10⁻⁶ 1.6 × 10⁻⁶
≥ 16 1.5 × 10⁻⁵ 4.8 × 10⁻⁷ 2.4 × 10⁻⁷ 2.4 × 10⁻⁷
Given the number of zero events in Table 37, it is judged that the best representative failure rates are given, with the exception of pinholes, by the failure rates presented in Table 36. For pinholes, it is recommended that the failure rates given in Table 37 are used. The recommended failure rates are shown in Table 39.
Table 39 Mechanical failure rate as a function of hole size and pipeline diameter
Pipeline diameter (in) Pinhole Small hole Large hole Rupture
Failure rate (per km yr)
< 8 6.0 × 10⁻⁴ 3.3 × 10⁻⁸ 1.7 × 10⁻⁸ 1.7 × 10⁻⁸
8 - <12 6.8 × 10⁻⁵ 3.3 × 10⁻⁸ 1.7 × 10⁻⁸ 1.7 × 10⁻⁸
12 - <16 3.7 × 10⁻⁵ 3.3 × 10⁻⁸ 1.7 × 10⁻⁸ 1.7 × 10⁻⁸
≥ 16 1.2 × 10⁻⁵ 3.3 × 10⁻⁸ 1.7 × 10⁻⁸ 1.7 × 10⁻⁸

On-site natural gas piping
Scenarios and failure frequencies
Report 620550004/2011
A.A.C. van Vliet | L. Gooijer | G.M.H. Laheij
National Insitute for Public Healthand the Environment P.O. Box 1 | 3720 BA Bilthovenwww.rivm.com