Embed Size (px)
Citation preview

NCHRP REPORT 750 Strategic Issues Facing Transportation
Scenario Planning for Freight Transportation Infrastructure Investment
Volume 1

TRANSPORTATION RESEARCH BOARD 2013 EXECUTIVE COMMITTEE*
OFFICERS
Chair: Deborah H. Butler, Executive Vice President, Planning, and CIO, Norfolk Southern Corporation, Norfolk, VA ViCe Chair: Kirk T. Steudle, Director, Michigan DOT, LansingexeCutiVe DireCtor: Robert E. Skinner, Jr., Transportation Research Board
MEMBERS
Victoria A. Arroyo, Executive Director, Georgetown Climate Center, and Visiting Professor, Georgetown University Law Center, Washington, DCScott E. Bennett, Director, Arkansas State Highway and Transportation Department, Little RockWilliam A. V. Clark, Professor of Geography (emeritus) and Professor of Statistics (emeritus), Department of Geography, University of
California, Los AngelesJames M. Crites, Executive Vice President of Operations, Dallas–Fort Worth International Airport, TXJohn S. Halikowski, Director, Arizona DOT, PhoenixPaula J. C. Hammond, Secretary, Washington State DOT, OlympiaMichael W. Hancock, Secretary, Kentucky Transportation Cabinet, FrankfortSusan Hanson, Distinguished University Professor Emerita, School of Geography, Clark University, Worcester, MA Steve Heminger, Executive Director, Metropolitan Transportation Commission, Oakland, CAChris T. Hendrickson, Duquesne Light Professor of Engineering, Carnegie Mellon University, Pittsburgh, PAJeffrey D. Holt, Managing Director, Bank of Montreal Capital Markets, and Chairman, Utah Transportation Commission, Huntsville, UTKevin L. Keith, Missouri DOT, Jefferson CityGary P. LaGrange, President and CEO, Port of New Orleans, LAMichael P. Lewis, Director, Rhode Island DOT, ProvidenceJoan McDonald, Commissioner, New York State DOT, AlbanyDonald A. Osterberg, Senior Vice President, Safety and Security, Schneider National, Inc., Green Bay, WISteve Palmer, Vice President of Transportation, Lowe’s Companies, Inc., Mooresville, NCSandra Rosenbloom, Director, Innovation in Infrastructure, The Urban Institute, Washington, DCHenry G. (Gerry) Schwartz, Jr., Chairman (retired), Jacobs/Sverdrup Civil, Inc., St. Louis, MOKumares C. Sinha, Olson Distinguished Professor of Civil Engineering, Purdue University, West Lafayette, INDaniel Sperling, Professor of Civil Engineering and Environmental Science and Policy; Director, Institute of Transportation Studies;
University of California, DavisGary C. Thomas, President and Executive Director, Dallas Area Rapid Transit, Dallas, TXPhillip A. Washington, General Manager, Regional Transportation District, Denver, CO
EX OFFICIO MEMBERS
Rebecca M. Brewster, President and COO, American Transportation Research Institute, Smyrna, GA Anne S. Ferro, Administrator, Federal Motor Carrier Safety Administration, U.S. DOT LeRoy Gishi, Chief, Division of Transportation, Bureau of Indian Affairs, U.S. Department of the Interior, Washington, DCJohn T. Gray II, Senior Vice President, Policy and Economics, Association of American Railroads, Washington, DCMichael P. Huerta, Administrator, Federal Aviation Administration, U.S. DOT Joung Ho Lee, Associate Director for Finance and Business Development, American Association of State Highway and Transportation Officials,
and Chair, TRB Young Members Council, Washington, DCDavid T. Matsuda, Administrator, Maritime Administration, U.S. DOT Michael P. Melaniphy, President and CEO, American Public Transportation Association, Washington, DCVictor M. Mendez, Administrator, Federal Highway Administration, U.S. DOT Robert J. Papp (Adm., U.S. Coast Guard), Commandant, U.S. Coast Guard, U.S. Department of Homeland SecurityCynthia L. Quarterman, Administrator, Pipeline and Hazardous Materials Safety Administration, U.S. DOTPeter M. Rogoff, Administrator, Federal Transit Administration, U.S. DOTDavid L. Strickland, Administrator, National Highway Traffic Safety Administration, U.S. DOTJoseph C. Szabo, Administrator, Federal Railroad Administration, U.S. DOTPolly Trottenberg, Under Secretary for Policy, U.S. DOT Robert L. Van Antwerp (Lt. General, U.S. Army), Chief of Engineers and Commanding General,
U.S. Army Corps of Engineers, Washington, DCBarry R. Wallerstein, Executive Officer, South Coast Air Quality Management District, Diamond Bar, CA Gregory D. Winfree, Acting Administrator, Research and Innovative Technology Administration, U.S. DOTFrederick G. (Bud) Wright, Executive Director, American Association of State Highway and Transportation Officials, Washington, DC
*Membership as of February 2013.
N A T I O N A L C O O P E R A T I V E H I G H W A Y R E S E A R C H P R O G R A M
NCHRP REPORT 750
Strategic Issues Facing Transportation
Volume 1: Scenario Planning for Freight Transportation Infrastructure Investment
Chris CapliceShardul Phadnis
Massachusetts InstItute of technology
Cambridge, MA
Subscriber Categories
Freight Transportation • Planning and Forecasting • Terminals and Facilities
TRANSPORTAT ION RESEARCH BOARDWASHINGTON, D.C.
2013www.TRB.org
Research sponsored by the American Association of State Highway and Transportation Officials in cooperation with the Federal Highway Administration

NATIONAL COOPERATIVE HIGHWAY RESEARCH PROGRAM
Systematic, well-designed research provides the most effective
approach to the solution of many problems facing highway
administrators and engineers. Often, highway problems are of local
interest and can best be studied by highway departments individually
or in cooperation with their state universities and others. However, the
accelerating growth of highway transportation develops increasingly
complex problems of wide interest to highway authorities. These
problems are best studied through a coordinated program of
cooperative research.
In recognition of these needs, the highway administrators of the
American Association of State Highway and Transportation Officials
initiated in 1962 an objective national highway research program
employing modern scientific techniques. This program is supported on
a continuing basis by funds from participating member states of the
Association and it receives the full cooperation and support of the
Federal Highway Administration, United States Department of
Transportation.
The Transportation Research Board of the National Academies was
requested by the Association to administer the research program
because of the Board’s recognized objectivity and understanding of
modern research practices. The Board is uniquely suited for this
purpose as it maintains an extensive committee structure from which
authorities on any highway transportation subject may be drawn; it
possesses avenues of communications and cooperation with federal,
state and local governmental agencies, universities, and industry; its
relationship to the National Research Council is an insurance of
objectivity; it maintains a full-time research correlation staff of specialists
in highway transportation matters to bring the findings of research
directly to those who are in a position to use them.
The program is developed on the basis of research needs identified
by chief administrators of the highway and transportation departments
and by committees of AASHTO. Each year, specific areas of research
needs to be included in the program are proposed to the National
Research Council and the Board by the American Association of State
Highway and Transportation Officials. Research projects to fulfill these
needs are defined by the Board, and qualified research agencies are
selected from those that have submitted proposals. Administration and
surveillance of research contracts are the responsibilities of the National
Research Council and the Transportation Research Board.
The needs for highway research are many, and the National
Cooperative Highway Research Program can make significant
contributions to the solution of highway transportation problems of
mutual concern to many responsible groups. The program, however, is
intended to complement rather than to substitute for or duplicate other
highway research programs.
Published reports of the
NATIONAL COOPERATIVE HIGHWAY RESEARCH PROGRAM
are available from:
Transportation Research BoardBusiness Office500 Fifth Street, NWWashington, DC 20001
and can be ordered through the Internet at:
http://www.national-academies.org/trb/bookstore
Printed in the United States of America
NCHRP REPORT 750
Project 20-83(1) ISSN 0077-5614 ISBN 978-0-309-25892-0 Library of Congress Control Number 2013932452
© 2013 National Academy of Sciences. All rights reserved.
COPYRIGHT INFORMATION
Authors herein are responsible for the authenticity of their materials and for obtaining written permissions from publishers or persons who own the copyright to any previously published or copyrighted material used herein.
Cooperative Research Programs (CRP) grants permission to reproduce material in this publication for classroom and not-for-profit purposes. Permission is given with the understanding that none of the material will be used to imply TRB, AASHTO, FAA, FHWA, FMCSA, FTA, or Transit Development Corporation endorsement of a particular product, method, or practice. It is expected that those reproducing the material in this document for educational and not-for-profit uses will give appropriate acknowledgment of the source of any reprinted or reproduced material. For other uses of the material, request permission from CRP.
NOTICE
The project that is the subject of this report was a part of the National Cooperative Highway Research Program, conducted by the Transportation Research Board with the approval of the Governing Board of the National Research Council.
The members of the technical panel selected to monitor this project and to review this report were chosen for their special competencies and with regard for appropriate balance. The report was reviewed by the technical panel and accepted for publication according to procedures established and overseen by the Transportation Research Board and approved by the Governing Board of the National Research Council.
The opinions and conclusions expressed or implied in this report are those of the researchers who performed the research and are not necessarily those of the Transportation Research Board, the National Research Council, or the program sponsors.
The Transportation Research Board of the National Academies, the National Research Council, and the sponsors of the National Cooperative Highway Research Program do not endorse products or manufacturers. Trade or manufacturers’ names appear herein solely because they are considered essential to the object of the report.

The National Academy of Sciences is a private, nonprofit, self-perpetuating society of distinguished scholars engaged in scientific
and engineering research, dedicated to the furtherance of science and technology and to their use for the general welfare. On the
authority of the charter granted to it by the Congress in 1863, the Academy has a mandate that requires it to advise the federal
government on scientific and technical matters. Dr. Ralph J. Cicerone is president of the National Academy of Sciences.
The National Academy of Engineering was established in 1964, under the charter of the National Academy of Sciences, as a parallel
organization of outstanding engineers. It is autonomous in its administration and in the selection of its members, sharing with the
National Academy of Sciences the responsibility for advising the federal government. The National Academy of Engineering also
sponsors engineering programs aimed at meeting national needs, encourages education and research, and recognizes the superior
achievements of engineers. Dr. Charles M. Vest is president of the National Academy of Engineering.
The Institute of Medicine was established in 1970 by the National Academy of Sciences to secure the services of eminent members
of appropriate professions in the examination of policy matters pertaining to the health of the public. The Institute acts under the
responsibility given to the National Academy of Sciences by its congressional charter to be an adviser to the federal government
and, on its own initiative, to identify issues of medical care, research, and education. Dr. Harvey V. Fineberg is president of the
Institute of Medicine.
The National Research Council was organized by the National Academy of Sciences in 1916 to associate the broad community of
science and technology with the Academy’s purposes of furthering knowledge and advising the federal government. Functioning in
accordance with general policies determined by the Academy, the Council has become the principal operating agency of both the
National Academy of Sciences and the National Academy of Engineering in providing services to the government, the public, and
the scientific and engineering communities. The Council is administered jointly by both Academies and the Institute of Medicine.
Dr. Ralph J. Cicerone and Dr. Charles M. Vest are chair and vice chair, respectively, of the National Research Council.
The Transportation Research Board is one of six major divisions of the National Research Council. The mission of the Transporta-
tion Research Board is to provide leadership in transportation innovation and progress through research and information exchange,
conducted within a setting that is objective, interdisciplinary, and multimodal. The Board’s varied activities annually engage about
7,000 engineers, scientists, and other transportation researchers and practitioners from the public and private sectors and academia,
all of whom contribute their expertise in the public interest. The program is supported by state transportation departments, federal
agencies including the component administrations of the U.S. Department of Transportation, and other organizations and individu-
als interested in the development of transportation. www.TRB.org
www.national-academies.org

C O O P E R A T I V E R E S E A R C H P R O G R A M S
CRP STAFF FOR NCHRP REPORT 750, Volume 1
Christopher W. Jenks, Director, Cooperative Research ProgramsCrawford F. Jencks, Deputy Director, Cooperative Research ProgramsWilliam C. Rogers, Senior Program OfficerCharlotte Thomas, Senior Program AssistantEileen P. Delaney, Director of PublicationsScott E. Hitchcock, Editor
NCHRP PROJECT 20-83(1) PANELArea of Special Projects
Barbara A. Ivanov, Washington State DOT, Olympia, WA (Chair)Steven A. Brown, Port Authority of New York & New Jersey, New York, NY Robert Costello, American Trucking Associations, Arlington, VA John T. Gray, Association of American Railroads, Washington, DC Jeffrey D. Holt, BMO Capital Markets, Inc., Huntsville, UT John Isbell, Starboard Alliance, LLC, Manzanita, OR H. Thomas Kornegay, Consultant, Houston, TX Bruce E. Seely, Michigan Technological University, Houghton, MI Keith M. Sherman, Consultant, Petersburg, IL Kenneth R. Wykle, National Defense Transportation Association, Alexandria, VA Tony Furst, FHWA Liaison Leo Penne, AASHTO Liaison Joseph R. Morris, TRB Liaison Thomas Palmerlee, TRB Liaison Ann R. Purdue, TRB Liaison

Major trends affecting the future of the United States and the world will dramatically reshape transportation priorities and needs. The American Association of State Highway and Transportation Officials established the NCHRP Project 20-83 research series to exam-ine global and domestic long-range strategic issues and their implications for departments of transportation (DOTs) to help prepare the DOTs for the challenges and benefits created by these trends. NCHRP Report 750: Strategic Issues Facing Transportation, Volume 1: Sce-nario Planning for Freight Transportation Infrastructure Investment is the first report in this series.
NCHRP Report 750, Volume 1 provides decision makers with a critical analysis of the driving forces behind high-impact economic and social changes as well as sourcing patterns that may affect the U.S. freight transportation system. A detailed discussion of the driving forces is contained in NCHRP Web-Only Document 195: Driving Forces Influencing Future Freight Flows. NCHRP Report 750, Volume 1 also introduces scenario planning as a tool that can be used in conjunction with other planning methods to improve the quality of long-range transportation infrastructure planning.
The U.S. freight transportation system is a key underpinning of American economic activity. Understanding the driving forces that could most significantly affect the transpor-tation system over the next 50 years will allow local, regional, and national transportation decision makers to anticipate and invest in transportation system improvements that enable the system to continue to provide key structural support to the U.S. economy. Foreseeing changes over the longer term future and the consequences of such changes is difficult but not entirely impossible. Management strategies that recognize emerging trends and are flexible, adaptive, and able to respond effectively will help ensure that the transportation system continues to support the growth of the economy and the delivery of an increas-ingly high quality of life for the nation. By identifying the most significant trends and other forces between now and 2050, considering plausible trend lines (scenarios) for these forces, examining how they might interact with each other, identifying what indicators should be monitored and what the potential tipping points are that would indicate a systematic shift, and determining how the indicators can be monitored, decision makers will be enabled to make better infrastructure investments.
Under NCHRP Project 20-83(01), the Massachusetts Institute of Technology was asked to provide decision makers with a critical analysis of the driving forces behind high-impact economic changes and business sourcing patterns that may affect the U.S. freight trans-portation system. To accomplish the research objective, the research team catalogued and assessed driving forces, points where systemic changes occur, leading indicators, and critical
F O R E W O R D
By William C. RogersStaff OfficerTransportation Research Board

dependencies, as well as the relative importance of these factors to future freight patterns. The research team then identified plausible representative scenarios of driving forces and their impacts on future levels and patterns of freight movement, fully articulated to enable “what-if” discussions of consequences, opportunities, and threats posed. The team also identified the means for realizing, accommodating, or managing policy strategies under the various scenarios.
Four future scenarios were developed as part of the research project, as well as a detailed methodology for planners to follow to conduct their own scenario planning workshops, and are included herein on this report’s companion DVD package and are available for download as an ISO image on the TRB website (search for “Scenario Planning for Freight Transportation Infrastructure Investment”).

1 Section 1 Introduction and Background 2 1.1 Challenges Specific to Transportation Planning 3 1.2 Research Project Objectives 4 1.3 Background on the Scenario Planning Methodology 5 1.4 Organization of the Report
6 Section 2 Scenario Development 6 2.1 Traditional Scenario Planning Process 7 2.2 Criteria of Good Scenarios 8 2.3 Examples of Scenario Planning Initiatives 8 2.3.1 United Parcel Service 1997—Centennial Scenarios of 2007 8 2.3.2 United Parcel Service 2004—Horizon 2017 Scenarios 9 2.3.3 Cisco 2010—Evolving Internet of 2025 Scenarios 9 2.3.4 Shell Oil 2005—Global 2025 Scenarios 9 2.3.5 U.S. Pharmaceutical Supply Chain 2011–2016 10 2.3.6 Chemical Industry Supply Chains in South America—2020 10 2.3.7 Other Scenario Studies 11 2.4 FFF versus Traditional Scenario Development 12 2.5 Generation of Driving Forces and Critical Uncertainties 12 2.5.1 Future Freight Flow Symposium 16 2.5.2 Stakeholders Survey 19 2.6 Analysis of Driving Forces 20 2.6.1 Snapshot Scenarios 21 2.6.2 Impact Matrices / Influence Curves 21 2.6.3 Analysis of Snapshot Scenarios 23 2.6.4 Stakeholder Survey 27 2.7 Selection of the Scenario Logic 28 2.7.1 Classification of Driving Forces 31 2.7.2 Other Forces 33 2.7.3 Summary of Scenario Logic
34 Section 3 Future Freight Flow Scenarios 34 3.1 Scenario Overviews 34 3.2 Individual Scenario Narratives 35 3.2.1 Global Marketplace Narrative 36 3.2.2 One World Order Narrative 37 3.2.3 Naftástique! Narrative 38 3.2.4 Millions of Markets Narrative
40 Section 4 Scenario Planning Workshop Design 41 4.1 Workshop Design 42 4.1.1 Engagement with the Planning Organization 42 4.1.2 Workshop Design Components
C O N T E N T S

50 4.1.3 Workshop Facilitation 50 4.1.4 Summary 50 4.2 Future Freight Flows Workshops: Process 51 4.2.1 Resources Used in the Workshop 53 4.2.2 Pre-Workshop Activities 53 4.2.3 Workshop-Day Activities 56 4.2.4 Post-Workshop Activities 56 4.2.5 Summary
57 Section 5 Future Freight Flows Workshops: Results 57 5.1 Method for Comparing Results Across Workshops 58 5.2 Comparison of Results from Evaluation Sessions 60 5.2.1 Observations from Comparison of Evaluations Across Workshops 62 5.3 Comparison of Results from Visioning Sessions 62 5.3.1 Observations from Comparison of Initiatives Across Workshops 64 5.4 Summary
65 Section 6 Integration into Established Planning Process 65 6.1 The Generic Transportation Planning Process 67 6.1.1 Key Documents for Transportation Planning 68 6.1.2 Transportation Planning Framework 70 6.2 Incorporating Scenario Planning into Transportation Planning 70 6.2.1 When to Use Future Freight Flows Scenarios? 71 6.2.2 How to Use Future Freight Flows Scenarios for Visioning? 71 6.2.3 Three Approaches for Using FFF Scenarios for Evaluation
74 Section 7 Conclusions and Future Research 74 7.1 Future Driving Forces 75 7.2 Scenario Planning Workshops 76 7.2.1 Gateway Investments 76 7.2.2 Corridor Investments 76 7.2.3 Connector Investments 76 7.2.4 Common Initiatives Across Workshops 77 7.3 Integration of Workshops into Existing Planning
79 Section 8 References
80 Section 9 Appendices 81 Appendix A. Future Freight Flows Symposium 85 Appendix B. Summaries of Thought Leader Presentations 121 Appendix C. Snapshot Scenario Output 126 Appendix D. Description of an Interactive Workshop Session 129 Appendix E. Six Workshops: Agendas, Facilitators’ Scripts, Voting Results

1
The future rarely moves in predictable, incremental ways. Often seemingly small changes in technology, demographics, regulations, economics, or a myriad of other factors have dramatic and unintended impacts on how any organization (public or private) plans and operates. These nonlinear impacts are very difficult to predict using traditional forecasting methods and techniques since they, by definition, do not follow any historical patterns.
For example, few in April 1956 would have foreseen the global trade implications (and resulting freight infrastructure requirements) of Malcolm McLean’s small experimental move of 58 metal containers on the ship the Ideal-X from Newark to Houston. What had been intended as a way to reduce traffic congestion on the highways through short sea shipping along the East Coast ended up playing a key role in making offshoring of manufacturing in low-cost locations across the globe economically viable. Containerization is ultimately the driving force behind the tremendous infrastructure projects at and adjacent to ports on the East and West Coasts as well as the Gulf. While this impact might seem obvious in retrospect, it certainly was not at the time.
Are we facing a similar situation today? In 10, 20, 30 years from now, will people look back and be amazed that we were unable to predict the full impact that some new innovation had on the economy? Probably. It is never easy at any point in time to be able to predict which, out of all of the possible future outcomes, will actually happen and should therefore be planned for.
For example, consider the effect of digitization. We are all familiar with the impact that digiti-zation has had on recorded music, movies, and books. What was once a physical product that had to be sourced, manufactured, and distributed has been transformed into a purely digital form that can be reproduced and delivered almost instantaneously at close to no cost. The reduction in the number of physical retailers, increased incidence of piracy, and the collapse of much of the logistics supporting these industries have been well reported. The bankruptcy of such stal-wart companies such as Blockbuster (video rental), Kodak (photography), and Borders (book retailer) is an example of how disruptive these step changes can be to companies and industries. All information-based products seem to be headed in the same direction.
However, what about physical products? Will personal microfabrication technologies, such as additive manufacturing or three-dimensional printing, become widely adopted and transform the consumer package goods industry in a similar fashion? Imagine if each small city or town had the ability to manufacture (and personalize) the majority of the products used every day within their own community—using only basic raw materials. How would that change the industry, the logistics providers, and the retailers? What would the supporting infrastructure need to look like? Or will it never take hold?
It is not just technology. Consider the impact of changes in government regulations. Suppose that environmental regulations within the next 20 years require the tagging and tracking of
S e c t i o n 1
Introduction and Background

2 Scenario Planning for Freight transportation infrastructure investment
potentially hazardous or recyclable materials with the retailer being responsible for safe disposal. What new challenges and market opportunities would this create? Again, how would the underlying freight transportation infrastructure need to change?
Or demographics. The percentage of people worldwide living within urban areas has increased from 30 percent in 1950 to almost 50 percent today—with forecasts putting this at 60 percent by 2030. The distribution of this population between top-tier and second-tier cities is less certain, however. In the United States (U.S.), for example, of the 15 fastest growing urban areas from 1990 to 2010, only one was in the top in 1990. The idea of urban logistics is no longer just a problem for New York City, Los Angeles, and Chicago. How will this increased urban concentration of residences across the United States affect the way products are manufactured and distributed? Will this mean that the local urban governments will need to take ownership of the last mile distribution? How will the underlying freight transportation infrastructure need to adapt to meet these changing requirements?
There are countless other examples of potential step changes in economics, energy, regulations, technology, and other areas that can have tremendous impacts on how businesses and other organizations operate in the future.
1.1 Challenges Specific to Transportation Planning
While it is a very difficult thing for a company to try to plan for these different potential outcomes, it is even more difficult for the governments to do so—especially when it comes to infrastructure investment. Not only do public-sector investments require consensus across a wide variety of diverse and competing stakeholders, the projects also take a very long time.
The planning lifecycle of public infrastructure projects needs to be measured in decades, as opposed to months or quarters as is the case for most businesses. For example, one of the most successful freight infrastructure projects is the Alameda Corridor. This 20-mile-long partially sunken intermodal corridor links the ports of Long Beach and Los Angeles to the transcontinental rail lines near Los Angeles. While initial planning began in 1981, approval did not occur until 1994, construction began in 1997, and it was finally opened for traffic in 2002. The Alameda Corridor took over 20 years from concept to first use and is considered to be a very successful project! Similarly, the Big Dig or Central Artery/Tunnel Project in Boston, Massachusetts, took slightly over 25 years from planning to first opening.
This lengthy gestation time is not a reflection on the competence of the planners or officials involved—it is the nature of building public infrastructure. Also, the design lives of these structures are very long. For example, the Alameda Corridor had a 20-plus-years design life. So, the original design in 1981 had to forecast traffic patterns and flows 30 to 40 years in the future. Thus, the time spent in planning is obviously worthwhile. In any case, it makes the government’s task of trying to forecast and plan in an uncertain future exceptionally difficult.
A project that is entering the planning stage in 2012 will probably not be ready for use until 2020 at the earliest and most likely 2030 or later. And then it is expected to have a life of up to 50 or 75 years beyond that. So the idea of trying to develop a better planning method for uncertain events in the future fits very well to the planning horizon that the government is required to live with.
Additionally, the United States freight transportation network is a highly complex system serving a diverse set of stakeholders and facing tremendous uncertainties and risk. It is also massive, consisting of almost a million miles of federal-aid highways, over a hundred thousand miles of railroad, over ten thousand miles of inland waterways, and more than a million miles

introduction and Background 3
of pipeline. The system, as a whole, moves more than 50 million tons of freight valued at over 45 billion dollars each day.
The complexity arises from more than size, however. Most shipments traveling through the system usually involve two or more organizations, cross multiple borders (municipality, state, or international), and utilize a mix of both public and private infrastructure. One of the defining characteristics of freight transportation is the incredibly diverse set of stakeholders engaged in its design, planning, management, and operations. This set of stakeholders includes shippers (ranging from retailers to manufacturers to distributors and beyond), carriers (across all physical and economic modes such as full truckload, less than truckload, parcel, national rail, short-haul rail, air, barge, and pipeline), third-party firms (such as brokers, forwarders, and third-party logistics providers), and governmental agencies (at the federal, state, regional, and metropolitan planning organization (MPO) levels). It is estimated that over 117 million households, 7.6 million business establishments, and almost one hundred thousand units of government are involved in freight transportation every day (“Freight Facts and Figures 2010,” U.S. Department of Transporta-tion, Federal Highway Administration, Office of Freight Management and Operations).
Unfortunately, the planning and strategic development conducted by these key stakeholders (shippers, carriers, third parties, and government agencies) is usually insular and does not involve the other stakeholders. There is tremendous “silo-ing” within freight transportation. Each stake-holder group tends to hold its own conferences, belong to different professional organizations, and lobby independently. This separation is even worse when considering the gap between the private and the public sectors. A 2005 survey of over 500 shippers, carriers, third-party providers, and government officials from the federal, state, and local levels found that two-thirds of shippers and more than half of the carriers had never met with any government official at any level! (Caplice, C., and E. Blanco. 2006. Freight Transportation Infrastructure Survey: Causes and Solutions to the Current Capacity Crisis, MIT Center for Transportation and Logistics (CTL) Working Paper Series, Cambridge, MA.)
Adding to the vast size, inherent complexity, and diverse set of stakeholders, are the increas-ingly high levels of uncertainty that the U.S. freight transportation system must address. Much of the uncertainty comes from forces outside of the stakeholders’ immediate control. These include the price and availability of fuel, emerging technologies, demographic trends, national and global economic conditions, international balance of trade, regulatory concerns, and many more.
For all of these reasons, the ability to effectively plan for future freight infrastructure investments is becoming both more critical and more difficult for government planning agencies at all levels.
1.2 Research Project Objectives
This research project has two major objectives. First, it provides decision makers (at all levels and across all stakeholders) with a critical and comprehensive analysis of the factors, trends, and uncertainties that may affect the U.S. freight transportation system over the next 30 to 50 years. Second, and most importantly, it introduces the Scenario Planning Methodology to these decision makers (primarily at the state department of transportation (DOT) level) for their use in creating a more flexible, adaptive, and responsive transportation management strategy on an ongoing basis. As a side benefit, this methodology will engender more productive interaction between the diverse stakeholders of the U.S. freight transportation system.
It is important to point out that this project was not to develop the official version of the future for the U.S. freight transportation system to be used by all of the decision makers. As mentioned above, the system is too large and complex and faces too many uncertainties for this to be possible. Also, the planning and assessment of policy and management strategies should be an ongoing

4 Scenario Planning for Freight transportation infrastructure investment
process involving as many stakeholders as possible—not a one-time event. Therefore, the project will not simply provide a static list of actions that a DOT might undertake to prepare for the future. Instead, it will provide a set of customized scenario planning tools and procedures that can be adopted and immediately implemented by the various decision makers across the stakeholders.
1.3 Background on the Scenario Planning Methodology
Scenario planning is a process of long-term strategic planning that involves the development and use of future scenarios of the problem or system at hand. A scenario is simply a vision of a possible future state of the world and the relevant environment. Scenarios are methodi-cally constructed stories about alternative futures in which today’s decisions might play out. A good scenario must be plausible, internally consistent, and challenging for strategic purposes. It should make the decision makers see the future in new ways and question their unspoken assumptions. A scenario planning engagement should involve the use of multiple, mutually exclusive scenarios.
In addition to gaining key insights through this process, decision makers uncover their hidden assumptions about the future and possible opportunities. A major impediment to planning successfully in the face of uncertainty is that we become tethered to established beliefs and accepted wisdom—in other words, hidden assumptions. Yet to operate effectively in this envi-ronment, we must open up our minds to multiple possibilities, rather than use mental constructs that are rooted in past experience and guided by personal beliefs and preferences.
Scenario planning as a methodology grew out of military planning in World War II. It has long been the practice in the U.S. Air Force and other branches of the military to envision different potential future engagements or situations and then to develop appropriate strategies. These forms of “sandbox exercises” were used by the military throughout the Cold War, and beyond, to train its leaders and planners with the ability to consider multiple potential situations and to adapt accordingly.
The RAND Corporation, a not-for-profit think tank founded in 1948, was one of the pioneers of scenario planning in the 1950s and the 1960s. At that point in time, however, most of these planning engagements were more along the line of scenario analysis than scenario planning. The distinction is that probabilities for each potential outcome are estimated and used during scenario analysis, while this is eschewed for scenario planning. Scenario analysis utilizes game theory to a greater extent than scenario planning, which is designed to be more of a brainstorming and thought-expanding tool. Herman Kahn, the founder of the Hudson Institute and a leading futurist, was part of the RAND team that developed scenarios centered on nuclear warfare. Kahn also became one of the first people to apply the scenario planning techniques to businesses. He, for example, developed scenarios foretelling the rise of Japan as an economic powerhouse.
It was in the 1970s that scenario planning became truly established. Pierre Wack, a planner in the group planning department of Royal Dutch/Shell, was charged with looking for events that would cause changes in oil prices. Oil prices had been relatively stable since World War II and the conventional wisdom did not see any reasons why this would change. Wack and his team developed two scenarios. The first was a reflection of the conventional wisdom where oil prices moved along historical trends. The second scenario, however, made the dramatic assumption that the Organization of Petroleum Exporting Countries (OPEC) nations would not renew their oil agreements that were set to retire in 1975. Instead, they would leverage the United States’ growing dependence on their oil and withhold the supply, thus dramatically driving the price of oil up. Both scenarios were briefed to senior management along with price projections and other statistics, but senior management did not take any immediate actions.

introduction and Background 5
Wack made the realization that to make management truly understand and prepare for potential unforeseen effects was to get it emotionally engaged—not just by presenting financial projections. He fleshed out his scenarios, especially the second more controversial one, with detailed descriptions of the ramifications and the aftermath of what a strong OPEC would look like. This included the realization that they should be prepared to be part of a slow-growth industry.
In 1973, the second scenario essentially came true following the Yom Kippur war. While the Shell management had not taken proactive steps for preparing for this outcome, they had become emotionally prepared for such an event. The energy crisis hit all oil firms hard, but throughout the 1970s Shell grew from being one of the smallest of the seven major oil firms to being, arguably, the most profitable. The upper management at Shell had been able to react quickly to the unfolding events in part due to Wack’s earlier scenario planning engagements.
This marked a dramatic change in how scenario planning was viewed. Instead of being treated as a forecasting or prognostication tool, it was used as a way of changing the way decision makers think. Peter Schwartz notes that this was when it became apparent that the end result of scenario planning for any organization “is not an accurate picture of tomorrow, but better decisions about the future” (Schwartz, 1991).
Over the past 40 years, a number of organizations and companies have used scenario planning to help them better prepare their leaders and managers to make better decisions. These have included the Australian government, AutoNation, BASF, British Airways, California Teachers Association, Cisco, Corning, Disney, General Electric, JDS Uniphase, KinderCare (a large U.S. chain of day care centers), Mercedes, UPS, the United States Environmental Protection Agency, the World Bank, and others. Several references on scenario planning and its history and use can be found in the References section of this report.
1.4 Organization of the Report
The remainder of the report is organized as follows. Section Two describes the methodology used to develop the scenarios. Traditional methods are presented along with examples from different organizations. These methods are then compared and contrasted with the methodology used for the development of the Future Freight Flows (FFF) scenarios created as part of this project. Section Three provides an overview of the scenarios themselves. Each of the four scenarios is described and compared. Section Four details how these scenarios were used in the six Scenario Planning Workshops held across the United States in the fall of 2010 through the summer of 2011. Section Five summarizes the results of the workshops. Section Six provides suggestions on how the scenario planning process can be incorporated into existing freight infrastructure processes within a state department of transportation. Finally, Section Seven concludes the report and provides recommended areas for future research. There are also five appendices to the report that provide greater detail on the Future Freight Flow symposium held at MIT and the six workshops held across the United States.

6
This section provides an overview of the traditional formal process used by most organizations to create scenarios. We also provide several examples of how this was used and the resulting scenarios. We then explain why the development of the Future Freight Flows (FFF) scenarios differed from traditional ones. Finally, we detail the method used and the resulting analysis of driving forces and critical uncertainties.
2.1 Traditional Scenario Planning Process
While there is not a single, formal process for developing scenarios, there are generally accepted practices. For an in-depth review of scenario planning methodologies, see Phadnis (2012). The most commonly used, or referenced, method is associated with Peter Schwartz who founded the firm Global Business Network. Schwartz’s method has eight steps, as follows:
1. Identify Focal Issue—What is the central question to be answered?2. Identify Key Local Factors—These are things that influence the success or failure of the focal
issue and usually relate to stakeholders of the organization.3. Identify Driving Forces—These are macro factors that affect the organization but are neither
controlled nor influenced by it.4. Rank Driving Forces by Importance and Uncertainty—This ranking helps focus scenario
creation on the critical forces.5. Select Scenario Logic—Scenario logic is the set of the most critical driving forces, which are
specified to take different values in the different scenarios being developed. The most common method of choosing scenario logic is to oppose the two most important and uncertain driving forces thereby creating a two by two matrix and thus four potential outcomes.
6. Flesh Out the Scenarios—After specifying the logic, the less critical factors are feathered in to create realistic and internally consistent scenarios.
7. Apply the Scenarios and Uncover Implications—Appropriate stakeholders are invited to evaluate the focus issue in different scenarios. The resulting scenario-specific evaluations are contrasted to identify the robust and contingent decisions.
8. Identify Leading Indicators and Signposts—Scenario evaluation separates robust strategies (useful in all scenarios) from contingent ones (useful in some but not all scenarios). Leading indicators and signposts are the variables that help discriminate among the scenarios to suggest which scenario the world may be heading toward.
Other methods have similar steps, but with different names. For example, Scearce and Fulton (2004) have five stages: Orient (Schwartz steps 1 to 3), Explore (4), Synthesize (5 and 6), Act (7), and Monitor (8). Garvin and Levesque (2006) also describe a five-step process: Define Focal Issue (1), Define Driving Forces (2 and 3), Create Scenarios with Narratives (4 to 6), Define Options (7), and Integrate (8). Lindgren and Bandhold (2009) have a five-step process they trademarked as
S e c t i o n 2
Scenario Development
Scenario Development 7
TAIDA: Tracking (1), Analyzing (2 to 5), Imaging (6), Deciding (7), and Acting (8). The tasks within each step for these different methods are essentially identical.
In any case, the development of the scenarios involves a tremendous amount of interviews and discussions with the stakeholders most affected by the scenario. The scenarios are in effect customized to that organization and to that organization’s specific focal issue.
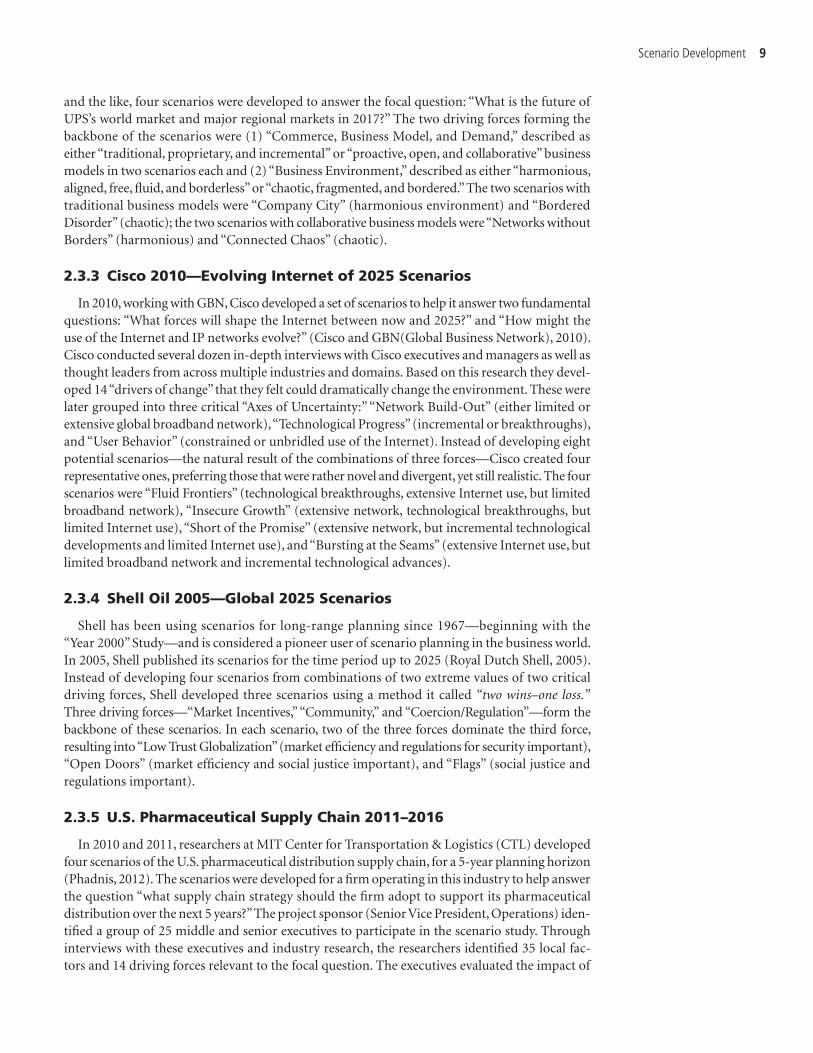
2.2 Criteria of Good Scenarios
One of the most difficult questions related to the scenario creation process is how to evaluate the quality of scenarios created by the process. Scenarios are planning aids used to develop long-range plans by considering potentially different futures; they are not predictions. Therefore, their validity cannot be evaluated by seeing if one of the scenarios in a set comes to fruition. In lieu of objective tests, scenario planning literature provides the desired attributes of scenarios. These can be divided into two groups: qualities of good scenario sets and qualities of good scenarios (Lindgren and Bandhold, 2009; Phadnis, 2012).
Desired attributes of scenario sets include the following:
• Number of Scenarios—Two to four.• Challenging—The scenarios should challenge the organization’s conventional wisdom about
the future. If they only reflect the current thinking then the resulting brainstorming will not uncover new insights. These are typically achieved by having multiple, diverse scenarios in a scenario set.
• Differentiated—The scenarios should present stark and dramatically different future envi-ronments. If the scenarios are too similar to each other, the exercise will be limited and will tend to stay in the commonly accepted bounds of the projected future.
• Contain Alternatives—There should not be a favorite or preferred scenario. Avoid perfect “heaven or hell on earth” scenarios. Also, avoid creating scenarios that reflect either the orga-nization’s established vision or the current forecast of the future. These “unofficial–official” scenarios tend to attract and anchor stakeholders and lead them to ignore the other scenarios. This defeats the purpose of the exercise.
Desired attributes of scenarios include the following:
• Centered on the Focal Issue—The scenarios should capture the ultimate decision the orga-nization is trying to make. The underlying structure of the scenarios should be based on the decision at hand.
• Plausible—The users should believe that the scenario can “grow logically from the past and the present” (van der Heijden, 2005). Having a scenario with “save the world” technology, for example, can be unrealistic.
• Internally Consistent—The logic in the scenario should be consistent, that is, the scenario’s internal logic needs to be aligned. One aspect of the scenario cannot contradict others. This also helps improve plausibility.
• Memorable—The scenarios should be easy to recall after an event. The names, for example, should be descriptive, evocative, and catchy. The names of the scenarios will ultimately become touchstones for future conversations. They can form a common language or shortcut codes within the organization to connote a certain outcome.
• Doesn’t Answer the Focal Question Directly—The material developed for the scenario should not overtly answer the focal question. The purpose of using scenarios is to provide decision makers an alternate vision of the future and to let them apply their knowledge to devise creative solutions suitable for that vision. Prescribing answers in the scenario suggests that scenario-creator(s) know(s) the decision context better than the people who live in it.

8 Scenario Planning for Freight transportation infrastructure investment
In most cases, these scenarios are developed in an iterative fashion. The initial scenarios are tested in small groups for plausibility, consistency, and so forth and are continually tweaked until they represent a full set of potential futures from which to work.
2.3 Examples of Scenario Planning Initiatives
In this section, we briefly describe some of the scenarios created and used by different organi-zations in their long-range planning. The objective here is to illustrate how critical uncertainties are combined to form multiple scenarios. Note that publication of scenarios used by organizations for long-range planning is rather an exception than the norm, because of their strategic value to the organization.
2.3.1 United Parcel Service 1997—Centennial Scenarios of 2007
The United Parcel Service (UPS) is one of the organizations that has embraced the culture of scenario planning for developing long-range plans. The first reported use of scenario planning at UPS was in 1997. Today, scenario planning is now an accepted and integral component of the UPS strategy development and analysis process. Engagements vary in planning horizon (1 to 3 years versus decades), scope (global versus regional), and breadth (single topic versus multiple) (Rogers, 2011).
In 1997 UPS developed a set of scenarios for use in its larger strategy planning process in order to better prepare for its 100th anniversary in 2007 (see Garvin and Levesque, 2006 or De Wit and Meyer, 2010). Extensive interviews of executives, managers, and others were conducted both inside and outside of UPS. The ultimate focal question was: “What is UPS’s global business in this ever-changing competitive environment?”
From the driving forces identified through interviews and discussions, two were found to be most critical for the focal question: (1) “Market Environment,” defined as the level of cross-border trade, which could be either “regional/national with border restrictions” or “free-flowing global trade,” and (2) “Demand Characteristics,” referring to the nature of the UPS consumers, which could lie on the continuum between “traditional users of UPS services” and “proactive, sophisticated consumers demanding high value-added supply chain services.” Combinations of the two extreme values of these two driving forces yielded four scenarios: “Tangled Paths” which described a nationalistic world with tight border controls and demanding customers; “Regressive World,” a world with restrictions on cross-border trade and traditional customers; “Global Scale Prevails,” a world with global trade where customers preferred traditional services; and “Brave New World,” a flat world of global trade and customers demanding high value-added supply chain solutions.
The use of these 1997 scenarios made the UPS managers aware of establishing a retail presence, to meet the needs of the sophisticated customers—if the world were to evolve that way. After monitoring of the business environment and detailed analysis for a few years, UPS ultimately decided to acquire Mail Boxes Etc.—a network of retail stores providing business services— to gain a retail presence to attract the sophisticated consumers.
2.3.2 United Parcel Service 2004—Horizon 2017 Scenarios
In 2004, UPS launched another round of scenario planning to develop a new set of scenarios, as some of the driving forces that were uncertainties in 1997—such as industry consolidation, growth of the Internet—had been resolved, and new uncertain driving forces seemed to be influ-encing UPS’s future business environment. Using a similar process for creating scenarios as it did in 1997, except with input from a broader group of academics, politicians, key customers,
Scenario Development 9
and the like, four scenarios were developed to answer the focal question: “What is the future of UPS’s world market and major regional markets in 2017?” The two driving forces forming the backbone of the scenarios were (1) “Commerce, Business Model, and Demand,” described as either “traditional, proprietary, and incremental” or “proactive, open, and collaborative” business models in two scenarios each and (2) “Business Environment,” described as either “harmonious, aligned, free, fluid, and borderless” or “chaotic, fragmented, and bordered.” The two scenarios with traditional business models were “Company City” (harmonious environment) and “Bordered Disorder” (chaotic); the two scenarios with collaborative business models were “Networks without Borders” (harmonious) and “Connected Chaos” (chaotic).
2.3.3 Cisco 2010—Evolving Internet of 2025 Scenarios
In 2010, working with GBN, Cisco developed a set of scenarios to help it answer two fundamental questions: “What forces will shape the Internet between now and 2025?” and “How might the use of the Internet and IP networks evolve?” (Cisco and GBN(Global Business Network), 2010). Cisco conducted several dozen in-depth interviews with Cisco executives and managers as well as thought leaders from across multiple industries and domains. Based on this research they devel-oped 14 “drivers of change” that they felt could dramatically change the environment. These were later grouped into three critical “Axes of Uncertainty:” “Network Build-Out” (either limited or extensive global broadband network), “Technological Progress” (incremental or breakthroughs), and “User Behavior” (constrained or unbridled use of the Internet). Instead of developing eight potential scenarios—the natural result of the combinations of three forces—Cisco created four representative ones, preferring those that were rather novel and divergent, yet still realistic. The four scenarios were “Fluid Frontiers” (technological breakthroughs, extensive Internet use, but limited broadband network), “Insecure Growth” (extensive network, technological breakthroughs, but limited Internet use), “Short of the Promise” (extensive network, but incremental technological developments and limited Internet use), and “Bursting at the Seams” (extensive Internet use, but limited broadband network and incremental technological advances).
2.3.4 Shell Oil 2005—Global 2025 Scenarios
Shell has been using scenarios for long-range planning since 1967—beginning with the “Year 2000” Study—and is considered a pioneer user of scenario planning in the business world. In 2005, Shell published its scenarios for the time period up to 2025 (Royal Dutch Shell, 2005). Instead of developing four scenarios from combinations of two extreme values of two critical driving forces, Shell developed three scenarios using a method it called “two wins–one loss.” Three driving forces—“Market Incentives,” “Community,” and “Coercion/Regulation”—form the backbone of these scenarios. In each scenario, two of the three forces dominate the third force, resulting into “Low Trust Globalization” (market efficiency and regulations for security important), “Open Doors” (market efficiency and social justice important), and “Flags” (social justice and regulations important).
2.3.5 U.S. Pharmaceutical Supply Chain 2011–2016
In 2010 and 2011, researchers at MIT Center for Transportation & Logistics (CTL) developed four scenarios of the U.S. pharmaceutical distribution supply chain, for a 5-year planning horizon (Phadnis, 2012). The scenarios were developed for a firm operating in this industry to help answer the question “what supply chain strategy should the firm adopt to support its pharmaceutical distribution over the next 5 years?” The project sponsor (Senior Vice President, Operations) iden-tified a group of 25 middle and senior executives to participate in the scenario study. Through interviews with these executives and industry research, the researchers identified 35 local fac-tors and 14 driving forces relevant to the focal question. The executives evaluated the impact of
10 Scenario Planning for Freight transportation infrastructure investment
the local factors on the focal issue and assessed the relationship between driving forces and local factors. This data was used to estimate the effect of driving forces on the focal issue. Two driving forces—“Health of the U.S. Economy” (weak, strong) and “Complexity of U.S. Healthcare Supply Chains” (low, high)—formed the backbone of four scenarios, which included “Frenzy” (highly complex supply chains due to increased points of care, regulations, and so forth—operating in a weak economy where only large firms have survived and consolidated); “Innovo-Nation” (highly complex supply chains delivering temperature-sensitive drugs in a complex regulatory environment and a strong economy in which smaller biotech firms flourish); “Hiber-Nation” (weak economy in which firms have resorted to cost reduction by cutting down innovation, reducing product variety, and simplifying their supply chains); and “Zen” (strong economy that enabled an information technology revolution in healthcare, allowing patients to seek advice and buy prescription drugs online in the U.S.; this reduced the importance of brick-and-mortar stores and greatly reduced the complexity of the U.S. pharmaceutical supply chains).
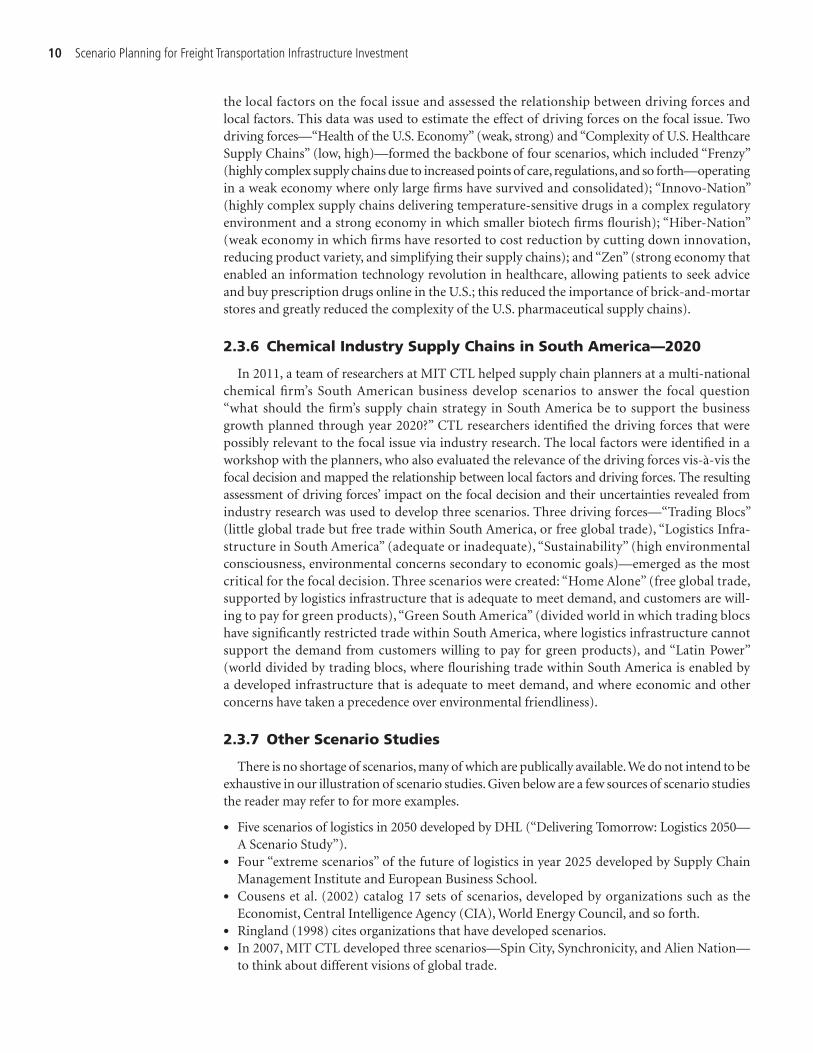
2.3.6 Chemical Industry Supply Chains in South America—2020
In 2011, a team of researchers at MIT CTL helped supply chain planners at a multi-national chemical firm’s South American business develop scenarios to answer the focal question “what should the firm’s supply chain strategy in South America be to support the business growth planned through year 2020?” CTL researchers identified the driving forces that were possibly relevant to the focal issue via industry research. The local factors were identified in a workshop with the planners, who also evaluated the relevance of the driving forces vis-à-vis the focal decision and mapped the relationship between local factors and driving forces. The resulting assessment of driving forces’ impact on the focal decision and their uncertainties revealed from industry research was used to develop three scenarios. Three driving forces—“Trading Blocs” (little global trade but free trade within South America, or free global trade), “Logistics Infra-structure in South America” (adequate or inadequate), “Sustainability” (high environmental consciousness, environmental concerns secondary to economic goals)—emerged as the most critical for the focal decision. Three scenarios were created: “Home Alone” (free global trade, supported by logistics infrastructure that is adequate to meet demand, and customers are will-ing to pay for green products), “Green South America” (divided world in which trading blocs have significantly restricted trade within South America, where logistics infrastructure cannot support the demand from customers willing to pay for green products), and “Latin Power” (world divided by trading blocs, where flourishing trade within South America is enabled by a developed infrastructure that is adequate to meet demand, and where economic and other concerns have taken a precedence over environmental friendliness).
2.3.7 Other Scenario Studies
There is no shortage of scenarios, many of which are publically available. We do not intend to be exhaustive in our illustration of scenario studies. Given below are a few sources of scenario studies the reader may refer to for more examples.
• Five scenarios of logistics in 2050 developed by DHL (“Delivering Tomorrow: Logistics 2050— A Scenario Study”).
• Four “extreme scenarios” of the future of logistics in year 2025 developed by Supply Chain Management Institute and European Business School.
• Cousens et al. (2002) catalog 17 sets of scenarios, developed by organizations such as the Economist, Central Intelligence Agency (CIA), World Energy Council, and so forth.
• Ringland (1998) cites organizations that have developed scenarios.• In 2007, MIT CTL developed three scenarios—Spin City, Synchronicity, and Alien Nation—
to think about different visions of global trade.

Scenario Development 11
2.4 FFF versus Traditional Scenario Development
The process used to develop the four FFF scenarios for this project had similarities and dif-ferences as compared to more traditional scenario planning engagements, such as the examples in the previous section. The basic eight step process as outlined in Section 2.1 was followed. However, there were four unique aspects to this project that required us to modify the process somewhat.
The first unique aspect is that the FFF scenarios had to be designed so that they could be used “out of the box” by different decision makers than the ones who helped develop them. In the traditional process, the people who help develop the scenario also apply the scenario. This means that the executives become very well attuned to and familiar with the driving forces, key local factors, and critical uncertainties involved. For the FFF project, the users will be exposed to scenario planning and the specific scenarios for the first time when they engage in a workshop.
Second, the scenarios had to be flexible enough to be used by planners in different levels of government: federal, state, local, MPO. The scenarios had to be general enough to be used at any level without significant customization. This meant that the scenarios could not drill down to state- or MPO-specific issues but instead had to stay at the national level with macro-economic forces.
Third, the scenarios had to be generalizable enough to be used at different levels of regional specificity (nation, state, multi-state, city, county) and geography. We had to make the scenarios flexible enough to be used at any location within the United States and at essentially any level of specificity. Again, this forced us to remain at a national level. We could not include forces or uncertainties that dealt with one state or another. These local customizations could always be added to the formal descriptions.
Fourth, the strategic question or focal issue will change with each user. In traditional scenario planning, the scenarios are designed around a core question. For the FFF scenarios, we had to assume a generic question, “Where should investments in freight transportation infrastructure be made in [location TBD] today for the year 2040?” Different users might have slightly different questions, such as, “What should the priorities for the DOT be?” or “How should we fund different port investments?”
The project dictated that the development and use of the scenarios be divided into three phases. Each of these phases can be mapped to the eight steps discussed in Section 2.1. The first phase focused on the analysis of the critical uncertainties and the driving forces (covering steps 1 to 4). The second phase was dedicated to the writing and full development of the scenarios (steps 5 and 6). Finally, the third phase involved testing the scenarios in six workshops across the United States (steps 7 and 8). Figure 1 illustrates the steps taken in each of the first two phases. The details for phase three are discussed in Section 4.
The process started with the FFF Symposium at which thought leaders from five primary dimensions (social, technology, environment, economic, and political) presented potential future trends to a hand-picked group of expert practitioners. The selection of the expert practitioners replaced the one-on-one interviews used in traditional scenario development. This led to a brainstorming session during which the attendees generated potential Driving Forces and critical uncertainties. These were then analyzed, harmonized, and consolidated into 12 representative “Snapshot Scenarios.” These Snapshot Scenarios were presented back to the practitioners in an interactive setting in which they developed estimates of each force’s influence/uncertainty over time, its impact on freight flows, and how it would stress the existing U.S. infrastructure.

12 Scenario Planning for Freight Transportation Infrastructure Investment
The results of these 12 analyses were analyzed and translated into 20 more detailed Driving Forces. The Driving Forces were incorporated into a survey that was distributed to a large set of freight stakeholders for further prioritization. The survey respondents came from a diverse set of practitioners to include shippers, carriers, third-party logistics providers, and governmental transportation planners at the federal, state, and local levels. The results of the survey were analyzed to determine the key dimensions or axes that should be used in the development of the future scenarios.
The remainder of this section is organized as follows. Section 2.5 provides details on the process and methodology used to uncover the driving forces and critical uncertainties. This includes a discussion of the FFF Symposium, a review of the workshop materials tested, and a summary of the stakeholders survey instrument. Section 2.6 presents the combined analysis of the results from these activities.
2.5 Generation of Driving Forces and Critical Uncertainties
This section describes the process used by the research team to develop the underlying logic that will define the scenarios.
2.5.1 Future Freight Flow Symposium
The FFF Symposium was held March 11–12, 2010. The final agenda and attendance list is attached in Appendix A. A total of 60 handpicked non-MIT professionals participated as “expert practitioners.”
Figure 1. Process used for the development of the FFF scenarios.

Scenario Development 13
The symposium opened with a restatement of the objective of the project as a whole and of the two-day symposium in particular. Additionally, the attendees were introduced to the concept of flow impacts. This was done in order to get the attendees to focus specifically on how any poten-tial force or uncertainty would affect freight flows within a specified region. For the purpose of this symposium, we focused on the United States as a whole. However, all of the analysis and methods can be used on any predefined region or area.
2.5.1.1 Flow Impacts
There are an unlimited number of potential events, trends, or occurrences that can happen in the future. It is almost impossible to identify, much less plan for, all of these potential events. Instead, it is useful to translate these into a finite set of outcome types. We refer to these as flow impacts.
We created five flow impacts that capture the effect that any potential driving force or critical uncertainty might have on FFF. These are shown graphically in Figure 2.
Sourcing patterns capture any changes in the location of the origins for most freight movements. This includes procurement of raw materials, manufacturing, and distribution. Changes to flow destinations capture any shifting in the locations of final demand—such as increased urbanization. Routing impacts capture any changes that affect the path that product will take to move from origin to destination. This could include, for example, changes in mode, such as from over-the-road truck to intermodal or rail. Changes to a region’s flow volume include any increase or decrease to the total tonnage or volume. Finally, value density impacts capture events that change the characteristics of the freight being shipped. The value density is used as a proxy for all of the various changes that can occur since this ratio is a primary criterion for mode choice as well as supply chain network design. Products with a higher value density (think diamonds) tend to be shipped by faster more expensive modes (air) than lower value density products (bricks).
In order to illustrate how the flow impacts are used, consider the effect that containeriza-tion has had on business. Containerization has very strong sourcing pattern impacts since it enabled the offshoring of manufacturing across the globe. This shifted the point of origin for most manufactured products from domestic locations distributed across the country to a hand-ful of ports—mainly on the West Coast. Containerization also has strong routing impacts since this shifting increased flow through fewer collection points (ports) and tended to use intermodal transportation to move the product inland to major metropolitan areas. There was minimal flow destination impact since containerization has not really changed location of the ultimate
Impact on Flow Destination
Impact on Sourcing Patterns
Impact on Routing
Impact on Flow Volume
Impact on Value Density $
Figure 2. Descriptions of flow impacts.

14 Scenario Planning for Freight transportation infrastructure investment
demand. There was strong flow volume impact as the number of containers moved through the United States increased dramatically. Finally, containerization has not significantly impacted the value density of the freight. Other technological innovations over the past 30 years have caused the value density to increase.
2.5.1.2 Thought Leader Presentations and Brainstorming Sessions
The first day (Thursday, March 11) was a diverging session in which the participants were encouraged to brainstorm potential critical uncertainties and driving forces. The day consisted of seven speakers presenting different visions of the future along standard STEEP themes (social, technological, environmental, economic, and political). The expert practitioner participants were also asked to brainstorm their own potential driving forces during the sessions. The seven topics and keynote speakers were as follows:
• A Nation Of Floridas: Aging, Changing Lifestyles & The Future of Freight,Dr. Joseph Coughlin, Director, MIT Agelab.
• After The Storm: New Challenges for the Global Economy in 2010–2030,Sara Johnson, IHS Global Insight.
• Public Policy and Freight,David Luberoff, Harvard University Kennedy School of Government.
• Transporting Bits and Atoms,Professor Neil Gershenfeld, MIT Center for Bits and Atoms.
• The New Age of Sensing,Prof. Sanjay Sarma, MIT Mechanical Engineering.
• Wired for Innovation: How IT Is Reshaping the Economy,Prof. Erik Brynjolfsson, MIT Sloan School of Management.
• Measuring and Managing Sustainability,Dr. Jonathan Johnson, The Sustainability Consortium.
Complete summaries of each of the thought leaders’ presentations are in Appendix B, while video and slides are available on the companion DVD package and online at www.trb.org (search for “Scenario Planning for Freight Transportation Infrastructure Investment”).
After each speaker, the attendees were asked to write down the three most critical drivers from that presentation that they thought might impact the FFF for the United States. Additionally, they were asked to classify which of the five Flow Impacts this force or uncertainty fit into. A sample sheet is shown in Figure 3.
The attendees were asked to complete a separate sheet after each of the seven speakers as well as an additional one at the end of the day to capture any factors that were missed. Over 1,200 individual candidate drivers were collected.
The sheets were collected after each session and the team began harmonizing them. As expected, there was a fair amount of redundancy in the responses. Also, many of the responses tended to mirror the speakers’ specific points. Beyond this, however, we were able to collect a large number of interesting and oftentimes unexpected responses. Unfortunately, we found that the respondents’ classification of the specific flow impacts for each driver was not worth capturing. In most cases, the attendees simply checked all of the boxes for each driver.
The team boiled the submitted drivers down into 12 representative snapshot scenarios. The snapshot scenarios were then used in Friday’s interactive workshop.
2.5.1.3 Interactive Workshop
The objective of the Friday session was to merge all of the different ideas and concepts that came up in the previous day’s discussions. The attendees were divided into six cross-industry

Scenario Development 15
groups and assigned two snapshot scenarios. Each team, facilitated by an MIT researcher, worked through a series of five tasks, as follows:
• Definition—the facilitator makes sure the team understands the Snapshot Scenario they are assigned.
• Adoption/Influence Matrix—the team estimates when and if the specific driver will influence the market.
• Flow Impacts—the facilitator asks the team to provide insights into how the specific driver would affect the freight system: sourcing patterns, destination distribution, routing, flow volume, and value density.
• Stress Map—the team allocates its assigned poker chips (used choice indicator) to a set of predetermined areas on an infrastructure map of the United States based on how it would be stressed under the given driving force.
• Wrap Up—the team can provides any detail on what was missed.
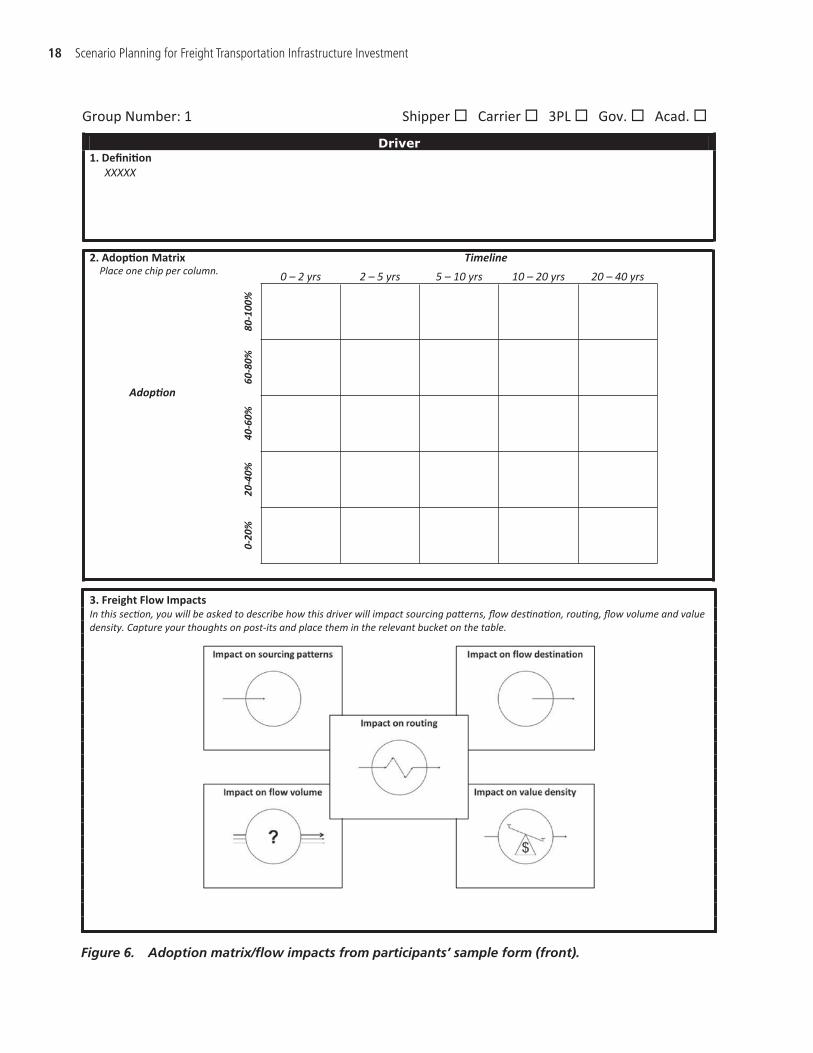
The facilitator’s guide with instructions is shown in Figure 4 and Figure 5. The participants each had a worksheet outlining these steps, as shown in Figure 6 and Figure 7.
For the adoption matrix (see the middle section of Figure 6), each participant had poker chips—one for each time frame—and they had to place them according to the level of adoption or influence of that driver by that time period. They did this individually and then, after discussion,
Figure 3. Potential driving forces/corresponding flow impacts data sheet.
emaN ______________ ________________ ______________ ______________ :noisseS A“ noitaN fo ,”sadirolF eoJ nilhguoC
revirD
swolF thgierF no tcapmI
noitpircseD / stnemmoC
So
urc
ing
P
att
ern
s
Flo
w
De
sti
na
tio
n
Ro
uti
ng
Vo
lum
e
Va
lue
D
en
sit
y
om eerht eht nwod etirw ,noisses siht ni draeh uoy tahw no desaB ierf erutuf eht tcapmi thgim kniht uoy taht srevird lacitirc ts .setatS detinU eht rof swolf thgf dna snoisnemid tcapmi tnaveler eht ni kramkcehc a ecalP .revird hcae fo noitpircsed trohs a edivorp ot eerf lee
From the Thursday brainstorming sessions

16 Scenario Planning for Freight transportation infrastructure investment
Note: The yellow circles to the right of each section contain the number of minutes each section is expected to take.
Figure 4. Facilitator’s guide to interactive workshop (part 1).
were allowed to change their choices. We found very little change in the individual versus team based influence curves.
For the flow impacts task, the participants wrote specific impacts for that scenario on sticky pads and classified them under the appropriate flow impact. This was not a very fruitful portion of the exercise as the attendees had a hard time clearly separating the flow classifications. Finally, on the stress map, each participant placed three chips on the communal map. This was very successful—the participants tended to discuss this with each other as they placed their chips. A refinement would be to have them set a benchmark or baseline level of stress prior to “betting” on the impact of the scenario under question. There were also recommendations on how to modify the stress map to include more and different investment options.
The adoption/impact matrices and summaries of the flow implications for each of the 12 snapshot scenarios are shown in Appendix C. Additionally, a description of the discussion and debate arising from two of the snapshot scenarios is captured in Appendix D.
2.5.2 Stakeholders Survey
Following the workshop, the team created a web-based survey containing a set of representative driving forces that were culled from the analysis of the workshop results.

Scenario Development 17
The objective of the survey was to prioritize the set of driving forces and critical uncertainties that were generated by our industry experts. A wider net was thrown to incorporate a larger set of perspectives. Because this was going out to a large number of individuals, it had to be self-explanatory and short. Based on the 12 snapshot scenarios in combination with the feedback received from participants at the end of the March 11–12 Symposium, we developed 20 comprehensively described driving forces and asked each respondent to assess both the impact (assuming it occurs) and the probability of it even occurring. For the impact, respondents rated each force on a scale of 1 (no impact at all) to 5 (tremendous impact). For the probability, they indicated how widespread the factor will be over the next 10 to 20 years by selecting from the following choices (on a 1 to 5 scale):
1. Unlikely to Happen (0–20%).2. Present at Fringes Only (20–40%).3. Generally Present (40–60%).4. Widely Present (60–80%).5. Omnipresent (80–100%).
The survey also collected information on role, industry, company size, and other demographic information.
Note: The yellow circles to the right of each section contain the number of minutes each section is expected to take.
15’
10’
Figure 5. Facilitator’s guide to interactive workshop (part 2).
18 Scenario Planning for Freight transportation infrastructure investment
Group Number: 1 Shipper Carrier 3PL Gov. Acad.
Driver1. Defini�on
XXXXX
2. Adop�on Matrix Timeline Place one chip per column.
Adop�on
0 – 2 yrs 2 – 5 yrs 5 – 10 yrs 10 – 20 yrs 20 – 40 yrs
0 8 -
%
0 0 1
0 6 -
%
0 8
0 4 -
%
0 6
0 2 -
%
0 4
0 -
%
0 2
3. Freight Flow Impacts In this sec�on, you will be asked to describe how this driver will impact sourcing pa�erns, flow des�na�on, rou�ng, flow volume and value density. Capture your thoughts on post - its and place them in the relevant bucket on the table.
Figure 6. Adoption matrix/flow impacts from participants’ sample form (front).

Scenario Development 19
The survey instrument was completed and sent out in April 2010. A total of 264 complete and usable responses were collected from professionals across multiple industries and backgrounds. The results are discussed in Section 2.6, below.
2.6 Analysis of Driving Forces
While the initial brainstorming session yielded over 1,200 potential critical factors to consider, most of these were repetitive or obvious. It became apparent that most of the attendees were heavily influenced by both their current work situation as well as the topics addressed by the specific speakers. For example, Professor Gershenfeld’s presentation on personal fabrication generated many suggestions of this having an impact—but, since we did not have a specific pre-sentation on nanotechnology, for example, no one mentioned it. Similarly, the rising and volatile cost of oil was another common submission—which is predominately a current concern.
However, several potential factors came out of the analysis of these responses. We harmonized the responses and generated 12 factors that we called snapshot scenarios. Each of the snapshot scenarios is essentially a bundle of common driving forces. It is worth noting that the snapshot
Figure 7. Stress Map of the United States from participants’ sample form (back).

20 Scenario Planning for Freight transportation infrastructure investment
scenarios were formulated as end states rather than trends. Indeed, our experience proves that people react better to a description of what the future may look like rather than a simple direction it may take.
2.6.1 Snapshot Scenarios
The 12 Snapshot Scenarios were as follows:
2.6.1.1 Aging of the U.S. Population
The majority of the aging U.S. population lives alone in non-urban settings and still has very specific product and service needs shared within their extended social network. Women tend to exhibit a willingness to remain involved in the workforce.
2.6.1.2 Increase in Global Trade
Global trade has made the majority of the countries strongly interdependent. This leads to higher volatility and extreme swings in GDP growth. Protectionism occurs but is only reactionary and is not permanent. The system is generally resilient with fluid trading blocks.
2.6.1.3 Rising Power of Emerging Markets
The dollar and the Euro have weakened. Emerging markets gained in affluence and purchasing power as well as political stability and financial strength. They are less focused on exporting as a means to grow and thus, are importing more.
2.6.1.4 International Climate Regulation
Climate change proved to be a reality with rising sea levels and higher overall temperature. However, the major disruptions actually stemmed from the higher variability in weather systems leading to more extreme and abrupt manifestations. A sense of urgency shared across developing and developed countries led to the creation of a Global Environment Council, which redefined business rules and regulations globally in alignment with the World Trade Organization (WTO).
2.6.1.5 Rise of Protectionism
Following the COP15 debacle and a longer than anticipated recession, countries reacted by raising tariffs and duties to protect their own industries. (The COP15 was the 5th session of the Conference of the Parties from 15 countries that met in Copenhagen in December 2009 to discuss climate change policies. It was noted for its failure to come to any conclusions or consensus.) While the U.S. tried to save the WTO, internal debates between the states led to the U.S. also adopting protectionist measures—sealing the fate of the WTO.
2.6.1.6 New Technology: Personal Fabrication
Fueled by the innovative high-tech tools, personal fabrication has become a reality. Open-source design and social network platforms empower people with creating the products that best reflect their personal universe and needs. Although more manufacturing will be done locally in the U.S., automation limits the number of jobs created.
2.6.1.7 New Technology: The “Senseable” Network
Cheap wireless technology enables ubiquitous presence of sensors on products, vehicles, and the infrastructure. This allows collection, transmission, and analysis of multiple attributes such as temperature, humidity, location, and the like.

Scenario Development 21
2.6.1.8 Increase in Sustainability Regulations
Several layers of all-encompassing regulations at the international, federal, and state levels are enacted. These regulations cover at varying degrees social responsibility, environmental emissions, resource usage, and trade practices. This results in a patchwork of often conflicting rules and penalties.
2.6.1.9 Increase in Sustainability Customer Demand
Consumer demand for sustainable products is a reality led by different segments of the popula-tion including aging baby boomers, young mothers, and so forth. This is further fueled by innovative technology that enables consumers to make real-time decisions at the point of purchase.
2.6.1.10 Rise in Global Security Concerns
Due to heightened security concerns, federal regulations now require 100% scanning and tracking of all flows within and across the country. These procedures require state-of-the-art technology that both consumes time and is costly.
2.6.1.11 Rise in Commodity Prices and Availability
Unreliable supply or unpredictable demand has led to dramatic increase in volatility and price of commodities, including oil, metals, grain, and the like. Financial markets have further exacerbated the situation and new technologies have failed to solve the issue.
2.6.1.12 Additional Points of Entry Open Up
The Panama Canal is completed. The Northwest Passage is now open during summer. Manufacturing is no longer concentrated in the Pacific Rim as regions such as Africa have emerged as reliable suppliers for Europe and North America.
2.6.2 Impact Matrices/Influence Curves
The influence curve for each driving force is a graphical representation of how that factor will influence business (and thus potential freight flows) over time. We selected five time buckets (0 to 2 years, 2 to 5 years, 5 to 10 years, 10 to 20 years, and 20 to 40 years). The 0 to 2 years bucket can be considered current day while the 2 to 5 and 5 to 10 year buckets are more short term and the 10+ year buckets are long term. A k-means cluster analysis was conducted on the influence curves to identify any patterns. We found that all of the driving forces followed one of four types of influence curves: steady growth, rapid growth, peak and crest, and flat. These are shown in slightly stylized form in Figure 8.
The steady growth and rapid growth factors tend to start and end in the same places, but the path is very different. The steady growth forces tend to start out slowly but gather steam and eventu-ally have widespread influence. The rapid growth forces have a more accelerated influence that reaches steady state. Peak and crest forces exhibit a rising influence but at some point lose their influence. The idea is that as the factor becomes widespread, the businesses and the economy adapt to it, and it loses any of its individual influence. Finally, there are flat forces that never really influence either the freight patterns or business in general.
2.6.3 Analysis of Snapshot Scenarios
The detailed impact matrices for each snapshot scenario are shown in Appendix C. Table 1 provides a summary of the scenarios in terms of the general classification (social, technology, economic, environmental, and political), the flow impact (sourcing, destinations, routing, volume, and value density), and influence type (steady growth, rapid growth, peak and crest, and flat).

22 Scenario Planning for Freight transportation infrastructure investment
20%
40%
60%
80%
100%
0-2yr 2-5yr 5-10yr 10-20yr 20-40yr
Steady Growth Rapid Growth Peak & Crest Flat
0%
Infl
uen
ce o
n F
utu
re F
reig
ht
Flo
ws
Figure 8. Types of influence curves.
Classification Flow Impact Influence Type
Driving Force
Soci
al
Tec
hnol
ogy
Eco
nom
ic
Env
iron
men
tal
Pol
itic
al
Sour
cing
Des
tina
tion
s
Rou
ting
Vol
ume
Val
ue D
ensi
ty
Stea
dy G
row
th
Rap
id G
row
th
Pea
k an
d C
rest
Fla
t
Comment
Aging of the U.S. Population X X X X Predetermined element
Increase in Global Trade X X X X Tight consensus—potential blind spot
Rising Power of Emerging Markets X X X X X Tied to global trade
International Climate Regulation X X X X X Low uncertainty in short and mid term – high in long term
Rise of Protectionism X X X X X High uncertainty with decreasing impact
Personal Fabrication X X X X X High uncertainty in the long term
The “Senseable” Network X X X Predetermined element
Increase in Sustainability Regulations
X X X X X Moderate levels of uncertainty
Increase in Sustainability Customer Demand
X X X X X Uncertainty and impact increases with time
Rise in Global Security Concerns X X X X X Very low uncertainty and impact levels—potential blind spot
Rise in Commodity Prices and Availability
X X X X Too general for commodities—need to isolate fuel
Additional Points of Entry Open X X X X Uncertainty and impact increases with time
X = classification; ⇑ = flow impact increases; ⇓ = flow impact decreases; ⇔ = mixed flow impact.
Table 1. Classification of the 12 single-shot driving forces.

Scenario Development 23
Note from Table 1 that the scenarios were a mix of social, technology, economic, environ-mental, and political forces. The flow impact and the influence type ratings were culled from the workshop responses. Some key takeaways from this analysis are as follows:
• The participants tended to be overly influenced by current events and situations. The “Rise in Commodity Prices” force included fuel along with other commodities. The influence of fuel on the transportation professionals overwhelmed the other commodity effects. We separated out fuel from other commodities going forward.
• The attendees classified the “Aging of the U.S. Population” force as being a steady growth type. While this force will have tremendous effect on freight flows, it can be considered a predetermined element. That is, it is a force that is slow changing and will occur regard-less of the scenario. The idea is that while this might be a driving force, it will occur in any and all futures and thus is not a defining or differentiating factor. We further refined the demographic forces for the stakeholders survey. Specifically, we focused on two of the more contentious aspects of demographic trends for the survey: life expectancy and urban density.
• The “Senseable Network” force, like the aging force, was also seen to be a predetermined element. The presence of easily accessible sensor data should be included in all future scenarios.
• The “Increase in Global Trade” force was interesting in that it had tight consensus in the group for being rapid growth. This implies that there might be a blind spot in the participants’ forecast of the future. This force is essentially an extension of the situation today—so it can be considered the “unofficial-official” future. It was important to further refine this in the survey to understand the dimensions of global trade that might have severe implications.
• The “Rise in Protectionism” force was unique in that it was thought to have peak and crest type of influence. As protectionism increases, it has less of an effect over time. This was the only force that fit this pattern.
• The three environmental forces (international climate regulation, increase in sustainability regulations, and increase in sustainability customer demand) were designed to capture different aspects of the environment’s impact on freight flows. The first captured the impact of interna-tional regulations and bureaucracy, the second captured the impact of domestic “top-down” green rules, and the last captured “bottom-up” or demand-driven green practices. The top-down forces were viewed as being more likely to occur and have more impact than the consumer-driven force.
• The “Security Concerns” force was viewed as having little to no impact or influence on business. It was thought that this is more of the current situation and might be considered a predetermined element as well as a potential blind spot.
2.6.4 Stakeholder Survey
Based on the results of the interactive workshop, a set of 20 more refined driving forces were created as shown in Tables 2 and 3.
As shown in Table 4, there was a wide range of responses in terms of the expected impact and probability of occurrence.
The average value (for both impact and probability) is the average ranking from 1 (low) to 5 (high). The standard deviation is a measure of the dispersion around the mean or average value. The coefficient of variation is the ratio of the standard deviation to the mean—it essentially normalizes the variability. The columns with the rank are simply the ranking of each of the forces by average, standard deviation, and coefficient of variation, respectively—having a score of “1” respectively means having the highest average, the lowest standard deviation, and the lowest coefficient of variation.

24 Scenario Planning for Freight transportation infrastructure investment
Driving Force Description
l a i c o S
y g o l o n
h c e T
E
cono
mic
Env
iron
men
tal
l a c i t i l o P
ourc
ing
S
s n o i t a
n i t s e D
g n i t
u o R
e
m
u l o V
y t i s n e
D
e u l a
V
Re - domestication of manufacturing
Substantial re-domestication of manufacturing back to the United States
X X X X X
Reduction in global trade
Sustained reduction in global trade volume (both imports and exports) possibly due to rise of protectionism, pandemics, etc.
X X X
Increased security threats
Large increase in both the number and magnitude of security threats (domestic and abroad)
X X X X
Green regulations Stringent environmental and sustainability regulations adopted and strictly enforced by the United States and most other countries
X X X X
High and volatile fuel prices
Dramatic increase in price and volatility of all oil - based fuels X X X X X X
Rise of BRIC markets
Ascendancy of consumer markets in Brazil, Russia, India, China, and other countries leading to increased demand for products manufactured in the United States
X X X X
Low-cost batch manufacturing
Widespread adoption of technologies enabling efficient and low-cost small batch manufacturing for most consumer goods
X X X X
Online retailing Dramatic shift towards online purchase and point-of-use delivery leading to reduction of physical retail stores
X X X X X X
“Senseable” network
Widespread ability to capture and monetize real-time sensing data on all products, vehicles, and facilities across a supply chain at essentially no cost
X X
Recycling regulations
Omnipresent enforcement of regulations and rules requiring recycling and re-use of all manufactured products
X X X X
Average age of 100 Average life expectancy reaching 100 years in the United States X X X
Note: BR IC = Brazil, Russia, India, China.
Table 2. Candidate driving forces for stakeholders survey (part 1).
Figure 9 plots the impact against the probability for each of the 20 driving forces. The driving force in the upper right corner (high impact and high probability) is the high and volatile fuel price force.
Another way to look at the driving forces is to compare how they rank. Figure 10 plots the rankings of each of the driving forces for impact versus probability. Note that most of the forces have correlated probabilities and impacts. There are some anomalies, however.
Reducing global trade and the re-domestication of manufacturing are both viewed to be very impactful (ranked 4th and 6th respectively) but are viewed to be extremely unlikely to occur (ranked 25th and 24th respectively). This implies that these might be blind spots worth includ-ing in the potential scenarios. Conversely, the recycling regulations, online retailing, and battery vehicles forces are viewed as being very likely to happen (ranked 5th, 4th, and 2nd, respectively) but will have next to no impact (ranked 10th, 12th, and 17th, respectively). These appear to be forces that are already having an effect today and should probably be considered as predetermined elements.
Figure 11 shows the driving forces grouped into their STEEP classifications and plotted for impact versus probability. Note that the political forces are both the least impactful as a group, and the least likely to occur. The other four categories are fairly similar in location.

Scenario Development 25
The full distributions and plots of the probability versus the impact for each driving force are shown in Figures 12 to 16.
Further analysis of the driving forces did not reveal any significant correlations in the rating of probability and impact to background (shipper, carrier, government, etc.), position (C-level, vice president, director, manager), sector, or firm size.
The following insights were gathered from the survey results:
• Most of the driving forces had highly correlated probabilities and impacts. This indicates that the survey respondents did not separate out the two different dimensions. The cases where there were anomalies stand out.
• The following forces appear to be predetermined and therefore will be included to some degree in each of the proposed scenarios: high and volatile fuel prices, battery vehicles, “senseable” networks, and online retailing.
• The two forces that seemed to be the most impactful without the corresponding high prob-abilities are reducing global trade and re-domestication of manufacturing. These are related
Driving Force Description
l a i c o S
y g o l o n
h c e T
E
cono
mic
E
nvir
onm
enta
l
l a c i t i l o P
ourc
ing
S
s n o i t a
n i t s e D
g n i t
u o R
e
m
u l o V
y t i s n e
D
e u l a
V
East Coast ports
Shifting point of entry for a majority of imports to the East Coast (e.g., due to rise in manufacturing in Africa, more ships using the Panama Canal, etc.)
X X X X
New agriculture powerhouses
New countries (such as Russia or India) emerging as agricultural powerhouses supplanting the United States in some food commodities
X X X X X
Water scarcity
Pervasive water scarcity in some regions leading to a reduction in exporting products that either contain water (e.g., fruit) or require a water intensive manufacturing process (e.g., soda, electronic chips)
X X X X
Green customer demand
The sustainability and environmental “friendliness” of a product becoming the dominant factor for consumer demand for most products supplanting cost
X X X X X
Mega cities Over 90% of the United States consumers living and working in mega-region cities and built up urban areas
X X X X
Zero immigration Immigration into the United States reduced essentially to zero
X X X
Battery vehicles New battery technologies dramatically reducing the cost and increasing the efficiency and range of electronic vehicles
X X X X
Commodity price volatility
Shifting geopolitics and other factors leading to tremendous price volatility for almost all commodities such as wheat, copper, and lithium
X X X X
Increased value density
Advancements in manufacturing, materials and other technologies increasing the average value per ton moved in the United States from ~$700 per ton (in 2008) to over $2000 per ton
X X X X
Table 3. Candidate driving forces for stakeholders survey (part 2).
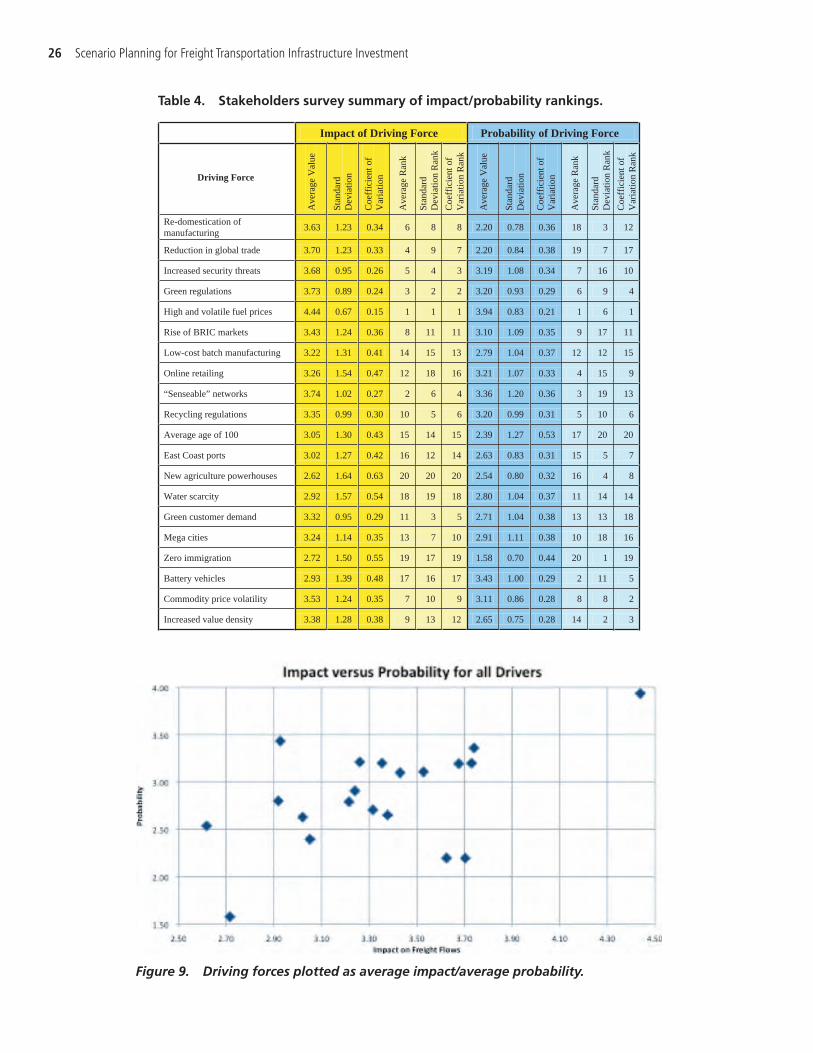
26 Scenario Planning for Freight Transportation Infrastructure Investment
Impact of Driving Force Probability of Driving Force
Driving Force
Ave
rage
Val
ue
Stan
dard
Dev
iatio
n
Coe
ffic
ient
of
Var
iatio
n
Ave
rage
Ran
k
Stan
dard
Dev
iatio
n R
ank
Coe
ffic
ient
of
Var
iatio
n R
ank
Ave
rage
Val
ue
Stan
dard
Coe
ffic
ient
of
Var
iatio
n
Ave
rage
Ran
k
Stan
dard
Dev
iatio
n R
ank
Coe
ffic
ient
of
Var
iatio
n R
ank
Re-domestication of manufacturing
3.63 1.23 0.34 6 8 8 2.20 0.78 0.36 18 3 12
Reduction in global trade 3.70 1.23 0.33 4 9 7 2.20 0.84 0.38 19 7 17
Increased security threats 3.68 0.95 0.26 5 4 3 3.19 1.08 0.34 7 16 10
Green regulations 3.73 0.89 0.24 3 2 2 3.20 0.93 0.29 6 9 4
High and volatile fuel prices 4.44 0.67 0.15 1 1 1 3.94 0.83 0.21 1 6 1
Rise of BRIC markets 3.43 1.24 0.36 8 11 11 3.10 1.09 0.35 9 17 11
Low-cost batch manufacturing 3.22 1.31 0.41 14 15 13 2.79 1.04 0.37 12 12 15
Online retailing 3.26 1.54 0.47 12 18 16 3.21 1.07 0.33 4 15 9
“Senseable” networks 3.74 1.02 0.27 2 6 4 3.36 1.20 0.36 3 19 13
Recycling regulations 3.35 0.99 0.30 10 5 6 3.20 0.99 0.31 5 10 6
Average age of 100 3.05 1.30 0.43 15 14 15 2.39 1.27 0.53 17 20 20
East Coast ports 3.02 1.27 0.42 16 12 14 2.63 0.83 0.31 15 5 7
New agriculture powerhouses 2.62 1.64 0.63 20 20 20 2.54 0.80 0.32 16 4 8
Water scarcity 2.92 1.57 0.54 18 19 18 2.80 1.04 0.37 11 14 14
Green customer demand 3.32 0.95 0.29 11 3 5 2.71 1.04 0.38 13 13 18
Mega cities 3.24 1.14 0.35 13 7 10 2.91 1.11 0.38 10 18 16
Zero immigration 2.72 1.50 0.55 19 17 19 1.58 0.70 0.44 20 1 19
Battery vehicles 2.93 1.39 0.48 17 16 17 3.43 1.00 0.29 2 11 5
Commodity price volatility 3.53 1.24 0.35 7 10 9 3.11 0.86 0.28 8 8 2
Increased value density 3.38 1.28 0.38 9 13 12 2.65 0.75 0.28 14 2 3
Dev
iatio
n
Table 4. Stakeholders survey summary of impact/probability rankings.
Figure 9. Driving forces plotted as average impact/average probability.

Scenario Development 27
Social
Environ. Economic
Technology
Political
Figure 11. Plot of STEEP factors for impact versus probability.
in that they both signal a retreat from the global trading trends of the past half of a century. These are wild cards that bear inclusion in the final scenarios.
• The coefficient of variation is a good indicator of uncertainty or variability. The driving forces with the most variability in the probability of occurring are average age of 100, zero immigration, green customer demand, and reduction in global trade. The high coefficient of variation (CV) numbers indicate a lot of disagreement over the potential outcome and while these forces might not define the different scenarios, they should be included.
• While forces previously identified as either predetermined or wild cards will constitute the main features of the future scenarios, the rest of the forces will not be overlooked but rather woven into the storyline to enrich the scenarios on a case by case basis.
2.7 Selection of the Scenario Logic
Based on the survey results and the input from the expert practitioners during the FFF sympo-sium, the team began identifying and classifying the different driving forces in order to select the underlying logic for the scenarios. Several ways of looking at the data were used.
Figure 10. Plot of impact rank/probability rank.Rank of 1 = most important.
0
4
8
12
16
20
0 4 8 12 16 20
Pro
bab
ility
of
Dri
vin
g F
orc
e
Impact of the Driving Force
Reduce GlobalTrade
Re-domestication of Mfg
Battery Vehicles
Recycling Regulations
Online Retailing

28 Scenario Planning for Freight Transportation Infrastructure Investment
Figure 12. Histogram of candidate driving forces (part 1 of 5).
2.7.1 Classification of Driving Forces
One approach was to cluster the different forces and classify them based on their probability and impact scores. Forces with high impact and high probability were called structuring forces. Forces with low impact and high probability were labeled background forces. Forces with high impact and low probability were called wild cards. And, finally, forces with low impact and low probability were labeled variations to theme. The reason for clustering and classifying the forces in this way is to identify any insights into the practitioners’ “mental models” of the world.
2.7.1.1 Structuring Forces
These are forces for which both the impact and the probability of occurrence are rated very high. These can be highly influenced by what the participants are experiencing today. They are important, but might not be uncertain enough to be used to define the scenario logic. These forces were as follows:
• Dramatic increase in price and volatility of all oil-based fuels.• Stringent environmental and sustainability regulations adopted and strictly enforced by the
United States and most other countries.• Large increase in both the number and magnitude of security threats (domestic and abroad).• Widespread ability to capture and monetize real-time sensing data on all products, vehicles,
and facilities across a supply chain at essentially no cost.

Scenario Development 29
Figure 13. Histogram of candidate driving forces (part 2 of 5).
• Ascendancy of consumer markets in Brazil, Russia, India, China, and other countries leading to increased demand for products manufactured in the United States.
• Shifting geopolitics and other factors leading to tremendous price volatility for almost all commodities such as wheat, copper, and lithium.
• Omnipresent enforcement of regulations and rules requiring recycling and re-use of all manu-factured products.
2.7.1.2 Background Forces
These are forces for which the impact is low while the probability of occurrence is rated high. These are less critical in the formulation of scenario logic. However, different elements can be woven into the larger background stories for the scenarios. These forces were as follows:
• Dramatic shift towards online purchase and point-of-use delivery leading to reduction of physical retail stores.
• Over 90% of the United States consumers living and working in mega-region cities and built-up urban areas.
• New battery technologies dramatically reducing the cost and increasing the efficiency and range of electronic vehicles.

30 Scenario Planning for Freight Transportation Infrastructure Investment
Figure 14. Histogram of candidate driving forces (part 3 of 5).
2.7.1.3 Variations to Theme
These are forces for which the impact and the probability of occurrence are rated low. Interestingly, these can become cornerstones of the scenarios. Forces that are viewed as highly improbable can be blind spots. These forces were as follows:
• The sustainability and environmental “friendliness” of a product becoming the dominant factor for consumer demand for most products, supplanting cost.
• Widespread adoption of technologies enabling efficient and low-cost small batch manufacturing for most consumer goods.
• Shifting point of entry for a majority of imports to the East Coast (e.g., due to rise in manufac-turing in Africa, more ships using the Panama Canal, etc.).
• Average life expectancy reaching 100 years in the United States.• Pervasive water scarcity in some regions leading to a reduction in exporting products that
either contain water (e.g., fruit) or require a water intensive manufacturing process (e.g., soda, electronic chips).
• Immigration into the United States reduced essentially to zero.• New countries (such as Russia or India) emerging as agricultural powerhouses supplanting
the United States in some food commodities.

Scenario Development 31
Figure 15. Histogram of candidate driving forces (part 4 of 5).
2.7.1.4 Wild Cards
These are forces for which the impact is high while the probability of occurrence is rated low. These are even more important to the scenario logic. These forces can represent things that the practitioners believe could dramatically change their operations, but since they have too low a probability of occurring, are most likely not planned for. These forces were as follows:
• Substantial re-domestication of manufacturing back to the United States.• Sustained reduction in global trade volume (both imports and exports) possibly due to rise
of protectionism, pandemics, etc.• Advancements in manufacturing, materials, and other technologies increasing the aver-
age value per ton moved in the United States from ~$700 per ton (in 2008) to over $2000 per ton.
2.7.2 Other Forces
In addition to the 20 candidate forces that were evaluated in the survey, we asked for suggestions on other driving forces that were not included. We received over 100 open-ended responses. The

32 Scenario Planning for Freight Transportation Infrastructure Investment
Figure 16. Histogram of candidate driving forces (part 5 of 5).
three most common were: aging transportation infrastructure, green energy for transportation, and growing labor strength. Others that were collected include the following:
• Increased worker and driver requirements.• Increasing disparity of knowledge workers versus manual labor.• World population levels.• Digitization and miniaturization of supply chains.• Level of taxation for businesses.• Stronger non-U.S. trading blocs (less Asian dependence on U.S.).• Changing cultural face of America (Hispanics).• Rising sea levels.• Dollar valuation.• Solvency of airline industry.• Rising power of China.• Opening of Northwest Passage.• Forming of political and trading blocs (Venezuela, Bolivia, and Iran).• Lack of credit availability.• Advances in robotics make logistics workers redundant.
Several of these mirrored some of the other forces—such as non-U.S. trading blocs. Some of these were included in the eventual scenarios.

Scenario Development 33
2.7.3 Summary of Scenario Logic
Out of the analysis, several key elements arose. These helped to determine which forces and uncertainties should be used to define the scenarios, which to feather in, and which to ignore.
A number of the forces (aging population and increasing urbanization) were found to be so exceptionally certain to occur that they were classified as predetermined. This means that the trends are in effect and are exceptionally unlikely to deviate. These forces were to be included in all of the scenarios. The only exception to this is that the specific geographies for the increased urbanization to occur were allowed to vary between mega-cities (New York City, Chicago, etc.) and second-tier cities (Madison, Burlington, Boise).
Another group of forces had high levels of uncertainty with two (or more) potential end points. These included the level of trade (ranging from global to blocs to regions to local only); resource availability (ranging from restricted and allocated to available); and manufacturing structure (ranging from highly centralized to decentralized). These became prime candidates for the opposing structure to create the scenarios.
In the end, the team selected to frame the scenarios by juxtaposing the global trade and the resource availability forces. The resulting scenarios are discussed in the following section.

34
Future Freight Flow Scenarios
Four scenarios were created based on the structural axes of level of global trade and resource availability.
3.1 Scenario Overviews
Global Marketplace (high global trade and high resource availability) is a highly competitive and volatile world. Open, vigorous trade between virtually all nations has led to market-based approaches to most contemporary challenges.
One World Order (high global trade and low or restricted resource availability) is a highly regulated and managed world. Facing global scarcity of key resources, nations establish inter-national rules to ensure their fair and sustainable use. Global trade thrives, but the very visible hand of regulation, at times an iron fist in a velvet glove, shapes its course.
Millions of Markets (low global trade and high resource availability) is a world where advanced technological breakthroughs have enabled the United States (and other countries) to become highly self-reliant in terms of energy, agriculture, manufacturing, and other needs. There is increased migration toward smaller urban areas that are supported by nearby regional innovation hubs that can manufacture highly customized goods.
Naftástique! (low global trade and low resource availability) is a world where trade has moved away from a single global market toward a number of emerging regional trading blocs. China, Europe, and South America form their own clusters. The United States leads an effort to make North America a self-sufficient economic community.
In addition to the two structural axes, the scenarios incorporated a number of other forces. In order to keep the number of scenarios to four, we could not create separate scenarios for each combination of forces. Instead, these were feathered in to help make the scenarios more believable and to provide depth. (See Table 5.)
A variety of collateral was developed for use in a Scenario Planning Toolkit to support each of the scenarios. These “immersion tools” included separate brochures with narratives and comparative charts as well as an assortment of introductory and “newscast” videos. The complete Scenario Planning Toolkit can be found on the companion DVD package or online at www.trb.org (search for “Scenario Planning for Freight Transportation Infrastructure Investment”).
3.2 Individual Scenario Narratives
In order to provide some additional context while reading how the scenarios were applied, this section contains the narratives for each of the four scenarios.
S e c t i o n 3

Future Freight Flow Scenarios 35
3.2.1 Global Marketplace Narrative
U.S. firms have established and maintain intense collaboration with companies across the world. The private sector has taken the lead in addressing the pressing issues of the day. Any attempt by governments to get involved in regulating business is seen as unnecessary intrusion. Citizens trust markets and they are more than willing to allow them to “work the magic.” So far, their patience and confidence in the market forces has paid off. Case in point is the now routine hassle-free immigration across most nations and the dramatic increase in global food production.
Traditional powerhouses such as Japan, Germany, and the United States no longer control the capabilities and resources needed to manufacture highly specialized, high-value products. Although developing countries are not on par with the advanced nations yet, they have found niches and are investing heavily in developing their industrial competencies. To exploit their comparative advantages, countries are specializing in producing what they do best and rely on other countries—halfway across the world in some cases—for everything else they need. The interconnectedness and speed of this global market has a very clear downside as well: increased volatility. For example, a labor strike in South Korea can have huge ripple effects in a Madison, Wisconsin manufacturing plant. As a result, firms are taking extensive precautions to keep the flow of goods both smooth and secure.
Affordable and seamless supply chains are encouraging companies to invest in global manu-facturing capabilities with most large firms using a mix of offshore and near-shore plants to remain low-cost and flexible. The cost of moving goods anywhere in the world is very reasonable, primarily due to new and cheaper energy sources and technologies and non-obtrusive environ-mental regulations. Energy costs, although relatively low, remain extremely volatile because of the continual natural and man-made supply disruptions of oil-based fuels.
Raw materials and commodities are brought to the market from all over the world, as there are minimal trade barriers limiting their availability. The free flow of goods is, however, driving extreme volatility in commodity prices, which is a persistent problem for most firms. Therefore, price—rather than access—is the key criterion for choosing a commodity item. Postponement of final product customization until the very end has led to higher value density in products being
Driving Force Naftástique! One World Order
Global Marketplace
Millions of Markets
Global Trade Low High High Low (physical)
Resource Availability Low Low High High
Energy Cost Level High High Low Low
Energy Cost Variability Low High High Low
Level of Environmental Awareness
Same as Today High Low High
Population Dispersion Growth in SW Growth in
Biggest Growth in
Biggest Cities Rise in Mid-Tiered Cities
Energy Sources Majority NA Mix Foreign & Domestic
Majority Foreign
Majority Domestic
Level of Migration High w/in Bloc, Low between
High High Low
Migration Policy High High Low Low
Currency Fluctuations Low w/in Bloc High Moderate Low
Table 5. Driving forces used for each scenario.

36 Scenario Planning for Freight transportation infrastructure investment
moved within the United States. Retail sales are predominantly conducted online, even for grocery vendors. With a significant proportion of the U.S. population living in large and dense cities, individual delivery to residences is the norm in most retail transactions.
The collaboration between firms across national boundaries has further expanded the regional markets to the point that they have overlapped and blended into a single, global market, with a minimal set of regulations in place. It is said by cynics that, in this brave new world, “the only regulation is that there are no regulations.” Finally, a true global marketplace has emerged, where ideas, technology, labor, and goods are exchanged freely and quickly.
3.2.2 One World Order Narrative
It has become clear that oil production has peaked. Renewable energy technologies have failed to live up to the heightened expectations of replacing coal and oil. The environmental crisis faced by the world’s population has taken on an urgent dimension, as looming scarcity increases social and political tensions within and across nations. Policy avenues are aggressively pursued at a global level to ensure equitable access to clean air, drinkable water, and healthy food for vast populations across the world, as well as the raw materials and energy required to sustain their communities.
Fearing conflicts and war over the growing scarcity of vital resources, the governments of the most powerful countries come together to create a supranational entity, the World Sustainable Trade Organization (WSTO), to regulate the use of resources and resolve disputes among nations. While many see the WSTO as a replacement for the World Trade Organization, it is in fact much stronger than the WTO ever was. The WSTO reaches far beyond trade and has been given real teeth for strict enforcement. Also, through monitoring and reporting, it dictates efficiency and penalizes waste, prioritizing usage according to global needs. All world powers and most other countries have signed the Charter of the WSTO, and are working towards full compliance with its regulatory framework.
Paradoxically, and despite the forecasts of detractors, global trade has not only remained strong, but it has actually continued to thrive in this heavily regulated world. The regulation-based system of balancing availability and needs did not replace the traditional market-based system of balancing supply and demand. Instead, it has redefined boundaries of the free market, therefore complementing it in unexpected ways. For example, grains are shipped from greener regions where they are produced in abundance to places where the land is not fertile. Metals are shipped in the opposite direction, from the arid yet mineral-rich countries toward the agricultural foci of the world. Technology and labor follow a similar pattern: less developed countries serve as providers of young labor for more technologically advanced countries, which in turn export their technology and knowledge back to the developing countries in the form of finished goods and services. Many analysts describe the new system as one of “global optima” for the long run, where the objective is sustainable use, not just short-term corporate profits.
What gives shape to trade flows is not the invisible hand of the market, but a very visible body of regulations. Many people view these regulations as a “green bureaucracy” and a necessary nui-sance. At the end of the day, while individual firms still get to make—for the most part—their own decisions as to what to produce and where, it is in the “how” that the influence of the WSTO’s global bureaucracy and its ever growing tapestry of regulations play an influential role, sending the right signals to the market: how much water can be used, how much CO2 can be emitted, how discards should be recycled, and so forth. As a result, the speed of global trade—once mercu-rial and chaotic in the days of globalization—has slowed down into an optimized order, more entangled in regulations and quotas, yet less volatile and, in consequence, more predictable.
Forged by the struggle for survival of globalized markets, firms have adapted relatively quickly to the new demands of a regulated world. Tracking and offsetting of greenhouse gases, even to

Future Freight Flow Scenarios 37
the level of zero emissions, is now a prerequisite for doing business. Manufacturers with similar needs have grouped together to create large-scale facilities, known as production clusters, where they find relief in numbers. They have found it is more cost effective to comply with tight regulations when the cost of required technology can be shared by many. Production clusters, coupled with ultra-efficient supply chains that make use of sensing and advanced computing, are emerging as the greenest solution.
Regulations for urban areas have also forced local governments to adapt. Through a series of stick-and-carrot regulations, the WSTO has sent municipalities a clear message: cities must clean up their acts, too. Regulations promote a more efficient use of energy and water in urban areas, a reduction in transportation emissions, and a more effective treatment of waste and sewage. The largest cities in the world now compete for subsidies, and try to avoid penalties, on the basis of improving their performance against a series of sustainability indexes. As a result, large cities have continued to grow even bigger, even as they strive to make their environmental footprint smaller and easier to offset.
Regulators have become aware that online purchasing has a much higher carbon footprint than shopping in person. In order to offset the higher per-pound emissions of home delivery, most states in the U.S. have mandated parcel carriers to charge customers a flat tax on all home deliveries. The effect of this tax is felt more on smaller, cheaper packages. Since for consumers it makes little sense to pay a $5 tax for the home delivery of a $10 book, most large cities have seen the appearance of consolidation centers, where goods from many retailers are consolidated and delivered to the final customer only when a certain amount of products have accumulated. This has radically changed “last mile” delivery of goods in metropolitan areas.
3.2.3 Naftástique! Narrative
A lack of significant technological advances, coupled with continued growth of the world’s population has pushed the ability of most nations to provide for their citizens. Basic commodities have become scarce. Relationships among world powers are strained by prolonged and intense competition for raw materials and energy sources. Military and political tensions follow. Inward facing policies designed to protect dwindling resources have served to reduce and fragment global trade through tariffs and trade barriers. Regional trading blocs have emerged across the globe.
China, for example, has forged a particularly intense alliance with Africa. Many African nations, rich in natural resources and desperate for investments and new technology, found a natural partner in the resource-starved and over-populated China. Intense trade of materials, technol-ogy, and labor started taking place inside this Sino-African economic bloc, with the Yuan as the de facto currency. Other regional blocs have emerged over the past 30 years. The European bloc, trading almost exclusively with Russia and the Middle East, has adopted the Euro. Powerhouse Brazil led the Mercosur bloc; Japan, Korea, and Southeast Asian nations formed a Pacific bloc. Smaller countries were forced to ally themselves with existing blocs to keep their economies alive. However, a few larger nations like India, Venezuela, and Australia decided to remain “unaligned” to any particular bloc and trade with all clusters.
The United States formed its own bloc along with Canada and Mexico, called the North American Economic Community (NAMEC). Complementing each other in natural resources, technological capabilities, and workforce availability, NAMEC has emerged as a strong economic cluster. Commerce among NAMEC nations has increased tremendously. U.S. borders with Canada and Mexico are essentially seamless for freight and passenger movements. Widespread use of domestic natural gas and coal, and heavy investment in renewable sources, made the North American nations less dependent on foreign oil. While energy prices inside NAMEC tend to be higher than the historical averages, they are also significantly less volatile than in the past.

38 Scenario Planning for Freight transportation infrastructure investment
The United States undertook a re-domestication of manufacturing to NAMEC countries, with a clear emphasis on promoting processes that take advantage of local resources and talent. Migration among NAMEC nations has become fluid. U.S. work visas are issued for millions of young workers from both Canada and Mexico. Millions of aging Americans retire to Mexico and Canada. This influx of retirees has made some parts of the Mexican coastline the “New Florida,” creating new demand south of the border for higher-value goods.
Environmental regulations are driven from the bottom-up by activism of the consumers inside the blocs. Previously disparate environmental regulations in Mexico, the United States, and Canada have been uniformed into a stricter corpus of rules. Rising temperatures have increased the agricultural output of countries located in higher latitudes. In North America, Canada’s production of cereals and other agricultural produce has increased dramatically. So far, however, the global increase in temperatures has had no major impact on coastal cities and in the operation of maritime ports.
Fixed currency exchange rates are established within the blocs, which in turn has stabilized currency fluctuations across blocs. While the majority of global trade is conducted within regional trading blocs, there is still trade between the blocs. This inter-bloc trade is, however, mostly limited to supplementing technologies and materials that are not available in member nations. Many are surprised that despite the lack of a true global market the regional clusters manage to operate as self-contained trade systems. Inside each of these blocs, trade links have led to stronger political links and a sense of shared purpose. Member nations take pride in working together towards self-sufficiency.
3.2.4 Millions of Markets Narrative
The past three decades have been witness to tremendous technological advances and social changes that have led to a high level of regional self-reliance in matters of energy, health, food production, and manufacturing. Not only has the United States as a whole become highly self-sufficient, individual regions and cities have also become much more self-sustaining. The primary drivers of these changes were technical breakthroughs that are collectively referred to now as the “Three Pillars.”
The first pillar is energy independence. Advances in drilling techniques and improved seismic testing enabled the economical location, capture, and production of tremendous quantities of natural gas from the massive shale formations along the Atlantic coastline. At the same time, improvements in the efficiency and safety of nuclear generators led to a “Nuclear Renaissance.” Renewable energy sources, such as solar and wind power, while still being pursued, have had only minor impact on the total United States energy production. Natural gas and nuclear power have led to almost complete energy independence for the United States and have facilitated the widespread decentralization of affordable and stable electricity production. This contributed to the growing adoption of initially hybrid but eventually completely electronic vehicles.
The second pillar is the widespread use of intelligent manufacturing. These advances enabled the production of small to medium batches of a wide variety of products at reasonable costs. Essentially, the cost advantages of leveraging economies of scale that dominated manufacturing throughout the past several decades of the 20th century were replaced by the ability to cheaply produce a wide range of highly customized products. While manufacturing has not advanced to the stage of “home replicators” that enthusiasts once envisioned, it has led to the development of regional manufacturing hubs across the country. These manufacturing facilities are close to consumption centers and are fueling the expectations of consumers for rapid creation and delivery of highly personalized goods. A key innovation that transformed the manufacturing industry was the separation of the digital design from the physical production process. This has

Future Freight Flow Scenarios 39
in turn lead to the creation of a new industry sector of pure digital design firms that develop and sell small-run or custom designs.
The third technological advancement was the widespread adoption and use of virtualization. Working and shopping from home—or from any other location—has become the standard rather than the exception for many people. Most households order products and services directly from the home and receive them there as well. Online shopping with prompt delivery to residences has largely replaced physical stores. People still go shopping in person—but the retail experience has evolved into an event rather than just a way to acquire physical products—similar to how movie theaters adapted when home entertainment systems were introduced. As goods and services have become more mobile than people, there is less physical commuting to work. Ironically, the level of travel for pleasure has increased since a large percentage of the workforce can work from any location.
A social change that has emerged over the last several decades is the increase in social inter-action—both virtually and in person. It appears that while people can now work and live totally isolated from other humans, very few actually do. Instead, there has been a groundswell migration towards “livable cities” of a moderate size where people can enjoy the benefits of interacting with others in an urban setting without the drawbacks of an impersonal mega-city.
In this widely fragmented, yet highly connected society, small and mid-sized cities are growing at a faster rate than the mega-cities. Local governments compete with each other to attract investments to create “innovation clusters” that feature a mix of technology, manufacturing, and distribution facilities.
Technological advancements and cheaper energy have ushered in a new age of affluence: average household income has increased, personal consumption has soared, and standards of living have improved. It is not a technology-utopia, however. The income gap has widened between the traditional “blue collar,” “white collar,” and the newly established “no collar” creative class. Many traditional jobs have been displaced and those workers struggle to find new vocations. This is especially true for older workers who are not as able to adapt to the newer technology. Also, while new agricultural techniques, mainly genetically modified fruits, vegetables, fish, and livestock, have significantly increased the quantity and variety of food products available to consumers; there has been a significant amount of resistance from some sectors of the population. Food considered “100% Organic” is generally available, but at a much higher cost. In this fast-paced environment, the optimal production site is closer to consumption centers. The affluent and savvy buyers of this world demand products customized to their needs and tastes. While American consumers prefer locally produced goods, they are not inherently against foreign products, provided they meet their high expectations of personalization and delivery speed.
Trade between countries is still active, but for the first time in history, the value of imported and exported services exceeds that of goods. The United States is a net exporting country when considering services, such as digital designs. Physical trade still occurs, but at a lower level and in different forms. For example, global trade of raw materials has increased while transportation of finished goods has decreased. Raw materials and components are transformed into goods when and where demanded by the final consumer. Also, intellectual property that is used within most local manufacturing is traded freely across the globe although there are some risks concerning theft of these “recipes” and instructions in certain areas of the world.

40
Scenario Planning Workshop Design
The research team conducted six Future Freight Flows Scenario Planning workshops from November 4, 2010 to June 28, 2011. In order to test the validity and the robustness of both the scenarios and the workshop methodology, each workshop was held in a different location and explored a different set of strategic questions. The workshops were run with a local host organi-zation and were held in the locations listed in Table 6.
The six workshops were similar in that each included a diverse set of stakeholders who discussed and debated potential infrastructure investment strategies across different potential future sce-narios through both small and large group activities. While the framework was common, each workshop was unique in that it was designed specifically for that host organization and the respective geographic region. There are nine key design components for running a scenario planning workshop, as follows:
• Scope (geographic and planning horizon).• Objective (visioning or evaluating).• Duration (half day, full day, multi-day).• Participants (stakeholder distribution and level).• Strategic Questions (what to have the teams decide or provide input on).• Evaluation Elements (infrastructure segments, corridors, themes, etc.).• Evaluation Mechanism (voting rules and data collection methods).• Scenarios (which future scenarios to employ and what collateral to use).• Debrief (how to present outcomes and to whom).
Over the course of the six workshops, the research team tried different designs in order to test the effectiveness of each element.
In each workshop, the participants discussed potential investment strategies for their specific regions in question. While each workshop focused on a different region and had a different set of strategies to evaluate, each region’s investment options could be roughly categorized into three common classes: gateways, corridors, and connectors.
Gateways are points of entry for freight into the geographic region in scope. These cover water, air, and land (both rail and road), ports, and border crossings. Corridors are the high-volume trunk lines that connect different locations across the region. They consist of highways, rail lines, and waterways. Connectors are the elements of the infrastructure that enable the movement of freight between the production or consumption locations and the corridors.
Looking across all of the workshops, we found that the overall priority of investment for future freight flows favored connectors first, then corridors, and finally gateways. There were exceptions, of course. But, in general, the connectors were viewed as being critical to any future freight system, while currently experiencing under-investment. Corridors (mainly highways and railroads) were
S e c t i o n 4

Scenario Planning Workshop Design 41
seen as important, but additional funding was not seen as being as critical since they have been the focus of investment for a fairly long time. The gateways were the least favored investment class across all the workshops. Interestingly, though, gateways were seen as being exceptionally important within the Global Marketplace scenarios whenever they were run! Because the Global Marketplace scenario was viewed by the workshop participants both as the most similar to today and the most likely to occur, this finding identifies a potential blind spot in planning where a single future is unconsciously designed for.
Confirming the importance of connectors to freight infrastructure, the workshop participants overwhelmingly identified “develop or improve intermodal connections” as the most critical initiative to pursue. This initiative took slightly different forms in each workshop as dictated by the specific freight network of the region in question, but was dominant across all workshops and scenarios. The next closest common initiatives were “develop freight-only corridors” and “standardize regulations to facilitate freight.”
Overall, the six workshops demonstrated that government planning agencies could successfully complement their existing methodologies using scenario planning. The final deliverables from this project included a “Scenario Planning Toolkit” that contains all materials needed to run a scenario planning workshop. It is available on the companion DVD package and online at www.trb.org (search for “Scenario Planning for Freight Transportation Infrastructure Investment”).
The remainder of this section is organized as follows. Section 4.1 presents the design of the six workshops, including the duration and objective of each workshop, infrastructure segments evaluated, scenarios used, types of participants, and so forth. Section 4.2 describes the process used for the six workshops. This section presents how workshop participants were engaged in the scenario planning process, questions asked, and tools used for extracting insights from the participants. The results from these workshops are discussed in Section 5.
4.1 Workshop Design
This section describes the choices made for various components of the six Future Freight Flows workshops. This section begins by describing the nature of engagement between the MIT research team and the host organization for each workshop (Section 4.1.1). This is followed by a discussion of how the nine design components were selected for each workshop (Section 4.1.2). Finally, we describe the skills required to facilitate a workshop in Section 4.1.3. The gist of this section is contained in more of a workbook format in the Future Freight Flows Workshop Planning Guide (available on the companion DVD package and online at www.trb.org (search for “Scenario Planning for Freight Transportation Infrastructure Investment”).
ID D ate Host O rganization Location
DVRPC Nov 4, 2010 Delaware Valley Regional Planning Commission (DVRPC)
Philadelphia, PA
MNDOT Feb 11, 2011 Minnesota Department of Transportation (MNDOT) and the Metropolitan Council
St. Paul, MN
WSDOT Mar 9, 2011 Washington State Department of Transportation (WSDOT)
Seattle, WA
POLB Apr 13, 2011 Port of Long Beach (POLB) Long Beach, CA
GDOT May 9, 2011 Georgia Department of Transportation (GDOT) and the Atlanta Regional Council (ARC)
Atlanta, GA
U . S . DOT Jun 28, 2011 U.S. Department of Transportation (U.S.DOT) Washington, D.C.
Table 6. The six future freight flows workshops.

42 Scenario Planning for Freight transportation infrastructure investment
4.1.1 Engagement with the Planning Organization
The project team from the MIT Center for Transportation & Logistics (CTL) started the engagement with each host organization about 8 weeks prior to the workshop. Regularly sched-uled phone calls were conducted between MIT and the host throughout the planning period. The workshop dates and locations were usually set in the first call. The later calls were used to make various choices about the design of the workshop. These choices are presented in Section 4.1.2, in rough chronological order.
The level of engagement of the host organization in planning the workshop varied across the six workshops and ranged from being intimately involved in all aspects of the planning details to essentially just providing space to run the workshop. As a general observation, we found that the more engaged the host organization was in the design, development, and delivery of the workshop, the more successful it was.
The planning agencies at the DVRPC, MNDOT, WSDOT, and U.S.DOT were the most heavily involved hosts. DVRPC took the most effort in the logistics and execution of the workshop—most of the details of the later workshops used the material developed at this first session to include the logo itself. MNDOT, along with the Metropolitan Council and the Volpe Center, focused the workshop design to complement an existing planning project for the twin cities. Together, the three organizations chalked the scope of the project and customized the focus of the workshop on “themes” rather than specific investments. They also took copious notes of the discussions facilitated by the scenario planning session and used the output of the workshop in their ongoing project. WSDOT took much initiative in planning the workshop and selecting the portfolio of attendees. They focused on evaluating entire corridors for freight movement and combined some of the “open-ended” aspects from the MNDOT session. The U.S.DOT sessions tackled the more difficult national problem by introducing components of a freight network (gateways, corridors, and connectors) instead of specific modal infrastructure segments. Also, we utilized interactive electronic polling response tools during this national session.
4.1.2 Workshop Design Components
The general framework of each workshop was the same. There was an introduction to the concepts and approach followed by small group immersion and breakout sessions, with a final group debrief and discussion. Within this general structure, however, each workshop was designed differently using nine key components. These are as follows, in roughly chronological order they should be selected:
• Scope (geographic and planning horizon).• Objective (visioning or evaluating).• Duration (half day, full day, multi-day).• Participants (stakeholder distribution and level).• Strategic Questions (on what to have the teams decide or provide input).• Evaluation Elements (infrastructure segments, corridors, themes, etc.).• Evaluation Mechanism (voting rules and data collection methods).• Scenarios (which future scenarios to employ and what collateral to use).• Debrief (how to present outcomes and to whom).
As mentioned in the opening paragraph, the sections are presented in the chronological order in which they were chosen by the planning organization and research team. The following sections describe each individual design component, discuss how they were selected for each workshop, and provide a recommendation for future workshops.

Scenario Planning Workshop Design 43
4.1.2.1 Scope
The selection of the scope should be the first element decided for any workshop. The scope includes the geographic region being considered (state, national, multi-state, etc.) as well as the desired planning horizon (10, 20, 30 years, etc.). The scope was usually agreed upon during the first phone call between the research team and the planning organization—right after the date and location of the workshop was set.
The geographic regions differed for each workshop but, with the exception of POLB, each was the area under the jurisdiction of the host organization. POLB used a multi-state geographic region to get at the import/export issues that cross multiple state and jurisdictional lines. The geographic scope for each workshop is listed below.
DVRPC: City of Philadelphia and the nine counties (five in Pennsylvania, four in New Jersey) for which the Delaware Valley Regional Planning Commission develops plans.
MNDOT: Entire state of Minnesota, with an emphasis on the Saint Paul and Minneapolis metropolitan areas.
WSDOT: Entire state of Washington.POLB: All major corridors and ports in the Los Angeles and Southern California area
that connect the port with the rest of the U.S.GDOT: Entire state of Georgia.U.S.DOT: The contiguous 48 states of the United States.
As discussed later in the report, evaluation elements used within a workshop can fall outside of the geographic region if they affect the area under consideration. For example, for the WSDOT workshop, a Canadian highway was one of the potential investment segments. Similarly, improvements to water ports in neighboring states were considered in the GDOT workshop.
The same planning horizon was used for each of the workshops: 20 to 30 years from today. The scenario collateral for all of the workshops used the date of November 2, 2037 for the newscast videos that were shown as part of the scenario immersion process.
For future workshops, we recommend that the geographic scope be in line with the jurisdictional control or responsibility of the host organization. This provides more in-depth knowledge for the underlying network and increases the quality of the preparation.
4.1.2.2 Objective (Visioning or Evaluating)
Scenario planning workshops are designed to either enable visioning of potential future strategies or facilitate the evaluation, ranking, and selection of a strategy from an existing set of potential choices. Visioning workshops are pure brainstorming exercises that are used to develop new unfettered thoughts or ideas: a “clean sheet of paper” approach.
Evaluating workshops, however, require the participants to compare and contrast between a set of alternatives. This forces the participants to make choices and trade-offs, debating the pros and cons of the alternatives with each other.
Both workshop objectives have strengths and weaknesses. Visioning workshops are good for areas where innovative thinking is required and no established options are desirable or sufficient. These sessions are great for bringing up new and out of the box ideas, but they rarely drive to a consensus or produce an actionable recommendation. These sessions tend to have very open-ended discus-sions and are more akin to a brainstorming session that generates ideas rather than makes deci-sions. Evaluation workshops are just the opposite. Presenting a closed set of options to a group of participants focuses the participants’ attention and forces them to make decisions. There is a risk of missing potential strategies not initially considered, but providing an “other” category can mitigate this. Collecting, harmonizing, and analyzing evaluation data is much easier than visioning data.

44 Scenario Planning for Freight transportation infrastructure investment
Of course, most workshops will combine a mix of these approaches, but, in general, a workshop will lean one way or another. Presenting options in a visioning session can lead to some anchoring of discussion by some participants.
The DVRPC and U.S.DOT workshops were pure evaluation exercises: the participants evaluated the chosen infrastructure segments and did not engage in any visioning or open-ended exercises. The U.S.DOT workshop did, however, employ a series of more in-depth evaluation questions that explored funding and other issues beyond selecting investments. These additional evaluation questions served as a starting point for the larger group discussions—and helped to bring out more “visioning” comments in the final debrief session. The MNDOT workshop was predominantly a visioning exercise. The remaining three workshops (WSDOT, POLB, and GDOT) were pre-dominately evaluation workshops with a small amount of visioning in each of the small group breakout sessions.
For future workshops, we recommend that if time and schedule permits, the host initially runs an open-ended visioning session with a small, core group of stakeholders. Then, using the sug-gested approaches and strategies from this session as the set of strategies to pick from, they can run a series of evaluation workshops for a larger set of stakeholders. In the evaluation workshops there should still be some open-ended element to capture things that have not been previously considered. As was done in the U.S.DOT workshop, the use of more focused follow-on evalua-tion questions can help generate additional discussion and more open-ended comments. As one host mentioned, the actual selection of the potential investments is not as important as under-standing the thinking and the logic that went into that selection.
4.1.2.3 Duration (Half Day, Full Day, Multi-day)
Future Freight Flows scenario planning workshops have been run in durations ranging from half to a full day. The DVRPC was the only half-day workshop that the research team ran. Afterwards, the MIT team realized that a four-hour workshop did not provide sufficient time to understand the scenarios, explore their implications, and evaluate various infrastructure segments and/or generate ideas for strategies in each scenario. All of the remaining five workshops lasted three-quarters of a day or about 6 hours.
In all of these workshops, however, we found that the debriefing session of the results was always rushed. We recommend that for future workshops, a second day be included for a detailed debrief of the results from the session to a select group of decision makers. The workshop itself should remain 6 hours—any longer taxes the attention span and attentiveness of the participants.
4.1.2.4 Participants (Stakeholder Distribution and Level)
Participation in all six workshops was by invitation only with a priority going to individuals with first-hand knowledge of the region’s freight infrastructure needs. This suggested that government transportation planners in the region, shippers, carriers, as well as community and environmental groups be invited to participate in the workshop. This also suggested that consulting firms and independent consultants should not be invited, unless such a person was deemed to be highly insightful by the host organization.
The number of people from each category who agreed to actively participate (which excludes members of the host/planning organization participating as note takers) in each workshop is mentioned in Table 7.
Once the workshop date, location, and duration were finalized, MIT and the host organiza-tion started identifying and contacting the potential participants (about 6 to 8 weeks before the workshop). Besides MIT and the planning organization, the candidate participants for the workshops were also sought through recommendations from the members of the research panel.

Scenario Planning Workshop Design 45
The participants from varied backgrounds were invited to attend the workshop. While they were categorized slightly differently for each workshop, the participants fell into three large groups: shippers, carriers, and public sector. Within these groups there were 12 more specific categories.
4.1.2.5 Strategic Questions (What to Have the Teams Decide or Provide Input On)
Once they were immersed in their respective future scenarios, the workshop participants were tasked with addressing one or more strategic questions. Table 8 shows the specific questions used for each of the workshops.
Participant C ategory DVRPC MNDOT WSDOT POLB GDOT U.S.DOT TOTAL
3PL 8 3 2 5 5 23
Academic 1 2 2 1 6
Association 2 4 1 1 8
Carrier 15 12 8 10 3 9 57
Citizens, environment 4 4
Consultant 5 2 2 3 12
Government—Fed 2 5 1 3 11
Government—Local 1 5 17 1 2 8 52
Government—State 5 8 10 3 5 2 33
Panel 2 4 5 11
Port 6 8 5 9 28
Shipper 8 8 10 1 2 9 13 60
Total : 6 8 53 61 41 36 46 305
Note: 3PL = third-party logistics.
Table 7. Number of invitees agreeing to participate (by category).
Workshop Objective Strategic Question(s)
DVRPC Evaluating “Which infrastructure investment bundles [should] we invest in TODAY to prepare for the scenario in YEAR 2037?”
MNDOT Visioning “How should MNDOT prioritize different themes?”
“What initiatives within each theme should be pursued today to improve freight infrastructure in 2037?”
WSDOT Evaluating “Which freight investment segments will be most critical in 2037?”
“What will be the primary (and secondary) freight corridor in 2037?”
“What are some initiatives that WSDOT should take to improve this freight c orridor?”
POLB Evaluating “Which freight infrastructure segments should be invested in TODAY to be ready for the year 2037?”
“What initiatives should be undertaken TODAY to prepare for this scenario?”
GDOT Evaluating “Which freight infrastructure segments should be invested in TODAY to be ready for the year 2037?”
“What actionable initiatives should be undertaken TODAY to prepare for this scenario?”
U . S . DOT Evaluating “Where should we prioritize federal funds NOW given that the future described in your scenario in 2037 is going to occur?”
“What level of investment should the federal government take for each type of infrastructure (maintain existing, improve existing, or add new)?”
“Where should the policy be made (local or federal) and how should primary funding be provided (private, public, private–public)?”
Table 8. Strategic questions for each workshop.

46 Scenario Planning for Freight transportation infrastructure investment
The strategic questions for all of the workshops, except MNDOT, were very similar, differing only in the naming of the options (investment bundles, segments, etc.) and some follow-on questions. The MNDOT workshop was a visioning session so its questions were more open ended. Even the prioritization of the freight action bundles (FABs) was more open ended—real trade-offs were hard to make as the FABs consisted of “highway system improvements/congestion management,” “rail, water, and air improvements/congestion management,” “modal balance and intermodal options,” “land-use strategies,” and “policy and regulatory initiatives.”
The main point of the strategic questions was to get the participants to think of present-day actions or investments to take given that their assigned future scenario occurs. The participants were typically told to ignore where the funds will come from or the timing or sequencing of the funding.
For future workshops, we recommend that the host continue to have the participants vote on the priority of the individual options but that the follow-on questions can be more open ended. Forcing the participants to make hard decisions between the competing alternatives brings up valuable discussion that leads to potential insights on future freight flows. Also, it is important that the host organization capture the decision making behind the specific votes.
4.1.2.6 Evaluation Elements (Infrastructure Segments, Corridors, Themes, etc.)
The selection of the elements or segments to evaluate was usually the most discussed component of the workshop design. The elements had to be finalized no later than 2 weeks before the workshop, as they were used in a pre-workshop survey conducted by MIT as part of the research project.
Generally, each element consisted of a single-mode contiguous artery used for transporting freight in the defined region. The choice of elements was made by the host organization alone (e.g., WSDOT), primarily by MIT (e.g., POLB, GDOT), or jointly (e.g., DVRPC). As discussed earlier, MNDOT did not have elements per se, but instead created FABs that were more thematic than infrastructure oriented. For the U.S.DOT workshop, the elements chosen were not specific physical elements of the freight infrastructure, but rather mode-independent classes of infra-structure: gateways, corridors, and connectors.
In fact, all of the elements used in the five evaluation workshops can be categorized into the three classes used in the U.S.DOT workshop: gateways, corridors, and connectors. Gateways are points of entry for freight into the geographic region in scope. These cover water, air, and land (both rail and road) ports and border crossings. Corridors are the high-volume trunk lines that connect different locations across the region. They consist of highways, rail lines, and waterways. Connectors are the elements of the infrastructure that enable the movement of freight between the production or consumption locations and the corridors. The gateways, corridors, and con-nectors chosen for the evaluation workshops were often, but not always, specified by the mode. The number of segments of each type used in the workshops is listed in Table 9.
There was significant discussion with the host organizations as to the number, size, and form of the elements to use. For future workshops, we recommend that between eight and a dozen elements be selected. Using fewer than this does not appear to provide sufficient variety while providing more than a dozen elements to evaluate seems to overwhelm the participants. We recommend that the elements selected be of sufficient size or magnitude to be worth the dis-cussion and be important to multiple stakeholders (improving a specific exit ramp, for example, is too small of an element). Also, the elements should not already be in the current funded investment plan. The challenge is to select elements that are big enough to warrant the discus-sion, but specific enough to avoid generalities (such as, “build more roads”). We like the idea of examining the complete infrastructure in a region and classifying it into the three major catego-ries (corridors, gateways, and connectors) and making sure that each category is represented. If there are multiples of each (such as more than one seaport or airport), they can be collapsed into common group categories without any loss of detail. The distinctions between the multiple
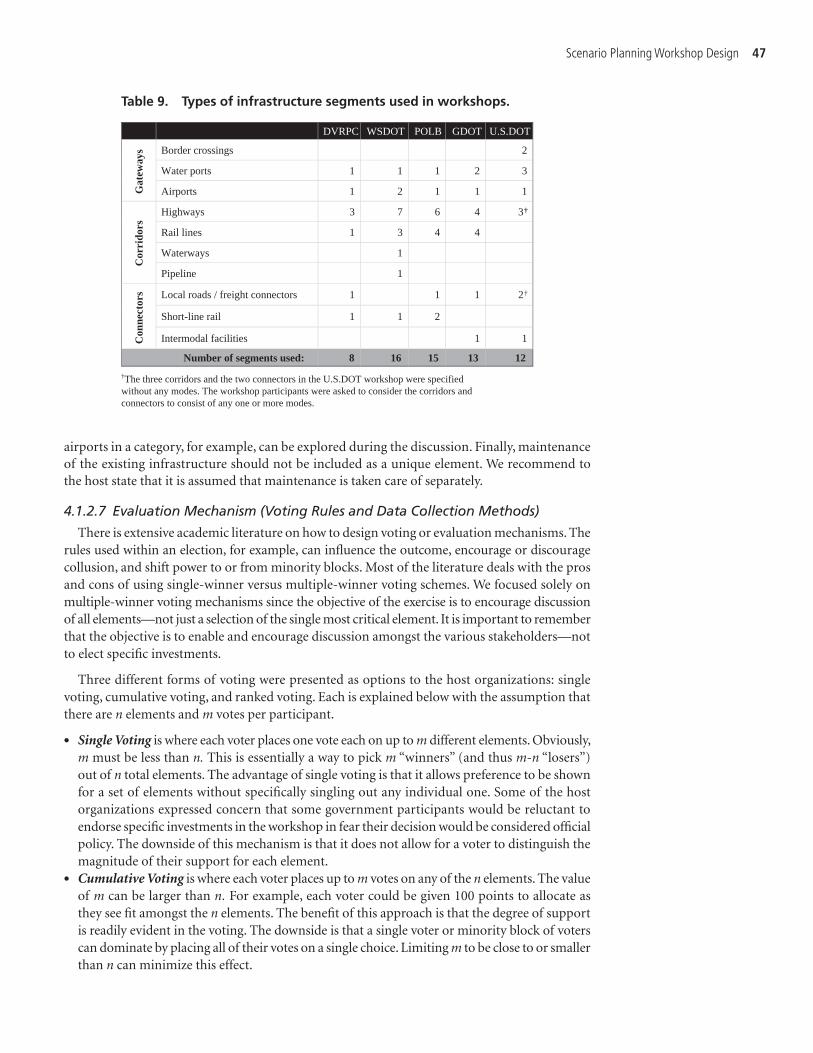
Scenario Planning Workshop Design 47
airports in a category, for example, can be explored during the discussion. Finally, maintenance of the existing infrastructure should not be included as a unique element. We recommend to the host state that it is assumed that maintenance is taken care of separately.
4.1.2.7 Evaluation Mechanism (Voting Rules and Data Collection Methods)
There is extensive academic literature on how to design voting or evaluation mechanisms. The rules used within an election, for example, can influence the outcome, encourage or discourage collusion, and shift power to or from minority blocks. Most of the literature deals with the pros and cons of using single-winner versus multiple-winner voting schemes. We focused solely on multiple-winner voting mechanisms since the objective of the exercise is to encourage discussion of all elements—not just a selection of the single most critical element. It is important to remember that the objective is to enable and encourage discussion amongst the various stakeholders—not to elect specific investments.
Three different forms of voting were presented as options to the host organizations: single voting, cumulative voting, and ranked voting. Each is explained below with the assumption that there are n elements and m votes per participant.
• Single Voting is where each voter places one vote each on up to m different elements. Obviously, m must be less than n. This is essentially a way to pick m “winners” (and thus m-n “losers”) out of n total elements. The advantage of single voting is that it allows preference to be shown for a set of elements without specifically singling out any individual one. Some of the host organizations expressed concern that some government participants would be reluctant to endorse specific investments in the workshop in fear their decision would be considered official policy. The downside of this mechanism is that it does not allow for a voter to distinguish the magnitude of their support for each element.
• Cumulative Voting is where each voter places up to m votes on any of the n elements. The value of m can be larger than n. For example, each voter could be given 100 points to allocate as they see fit amongst the n elements. The benefit of this approach is that the degree of support is readily evident in the voting. The downside is that a single voter or minority block of voters can dominate by placing all of their votes on a single choice. Limiting m to be close to or smaller than n can minimize this effect.
DVRPC WSDOT POLB GDOT U.S.DOTG
atew
ays Border crossings 2
Water ports 1 1 1 2 3
Airports 1 2 1 1 1
Cor
rido
rs
Highways 3 7 6 4 3†
Rail lines 1 3 4 4
Waterways 1
Pipeline 1
Con
nect
ors Local roads / freight connectors 1 1 1 2†
Short-line rail 1 1 2
Intermodal facilities 1 1
Number of segments used: 8 16 15 13 12
†The three corridors and the two connectors in the U.S.DOT workshop were specifiedwithout any modes. The workshop participants were asked to consider the corridors andconnectors to consist of any one or more modes.
Table 9. Types of infrastructure segments used in workshops.

48 Scenario Planning for Freight transportation infrastructure investment
• Forced Ranking is where each voter places n votes for his or her first choice, n–1 votes for his or her second choice, n–2 votes for his or her third choice, and so on. Each voter is essentially rank ordering the n elements. If all elements are to be ranked, then each voter would need n(n +1)/2 votes. If only a subset is to be ranked, say, k < n, then each voter would get k(k +1 )/2 votes. This mechanism brings out each voter’s priority, but does not reveal the degree of preference between the elements. This also minimizes the minority block issue.
While there was initially a lot of discussion with the host organization on how to vote, we ended up using some form of cumulative voting in each workshop. Professional weight poker chips were used for casting the votes on a large sheet of paper that geographically displays the different ele-ments. Using poker chips forced the participants to get up and physically place their chips around a table, forcing interaction with each other and making the votes more visible. It also reinforced the sense of playing a game and this led to more interesting and open discussions. In all of the work-shops except the U.S.DOT, each voter was given 100 points worth of chips in 25-, 10-, and 5-point increments. Thus, they essentially had 20 votes each. For the U.S.DOT, we restricted the number of votes to 12, the same as the number of elements (12), and each chip counted as one vote. This was a better method since it made counting faster and removed the need to make change.
In addition to these “positive” votes, we introduced the concept of “negative” or “veto” votes. Each voter was given three black poker chips—We actually had a skull and crossbones embossed on them for effect!!—that they could use to express their opposition to a specific element. They had to place at least one and up to three negative votes on different elements with only one negative vote per element allowed (single voting). The negative votes were used to force each participant to say no to something. It is a truism in management that having a strategy means saying “no” to something. We wanted to force this aspect in order to get more discussion out of the participants. It was very successful. Negative voting was not used in MNDOT since the FABs were not conducive to this mechanism. For example, we could not envision a voter saying no to “land-use strategies” or “policy and regulatory initiatives.” The FABs were not designed to be traded off. We found that, in general, private-sector participants tended to use more negative votes than public-sector participants.
For future workshops, we recommend that a hybrid positive/negative voting mechanism be used with poker chips. For positive voting, a cumulative mechanism should be used with each voter receiving as many chips as there are elements to evaluate (n). For negative voting, a single vote mechanism should be used with each voter receiving three chips of which they have to use at least one. The combination of positive and negative votes worked well in establishing points of discussion during the breakout sessions—which is the sole purpose of the voting mechanism.
4.1.2.8 Scenarios (Which Future Scenarios to Employ and Collateral to Use)
Four scenarios were created for the project: Global Marketplace, Naftástique!, One World Order, and Millions of Markets. Millions of Markets was initially called Technology Savior in the first three workshops. The name was changed to remove the anchoring bias of the name to all things technological. Full descriptions of these are not included in this report. Each scenario describes the world assuming a different set of macro sociotechnical and economic factors. The primary driving forces were level of trade (global to regional) and availability of resources (high to low).
Whenever possible, we used all four scenarios within a workshop. However, the decision of the number of scenarios to use was based on the number of workshop participants. The optimal size of a breakout section is between 10 and 15 people. Thus, this decision was made as late as about one week before the workshop. Table 10 shows which scenarios were used in each of the six workshops (indicated with an “x”).
With the exception of the workshops at the POLB and GDOT, each workshop used all four scenarios. POLB and GDOT each used only three scenarios because to their smaller size. The

Scenario Planning Workshop Design 49
selection of which scenarios to use if the attendance does not justify using all four is arbitrary, but since Global Marketplace is consistently viewed as most like today, we recommend removing this one first. We do recommend, however, that during the debrief session all four scenarios are discussed and presented. Similarly, if the attendance is so large that the breakout sessions exceed 15 people, multiple separate breakout sessions can be run using the same scenario.
For future workshops, we recommend that the host organization target a total attendance of 60 people. The number of breakout groups should be determined by dividing the number of confirmed attendees by four.
• If this number is between 10 and 15, use all four scenarios.• If this number is less than 10, find the largest number of breakout groups that gives you at least
10 per group: this is the number of scenarios to use. We recommend (not that strongly, though) that the scenarios be used in this priority order: Naftástique!, One World Order, Millions of Market, and Global Marketplace.
• If this number is greater than 15, find the smallest number of breakout groups that gives you no more than 15 per group: this is the number of scenario breakout sessions you will need to run. We recommend that the selection of which scenarios to double up on be in the same order as above.
The assignment of specific attendees to specific scenarios should be made about a week before the workshop. This was done ahead of the workshop since the brochures were sent out ahead of time. The selection was made such that each scenario had the same number of participants and roughly the same proportion of participants from different categories. When it was not possible to evenly distribute members of one category across all chosen scenarios, similar categories were combined and then the participants from the broader categories were randomly assigned to the selected scenarios. This method of sampling is known as stratified sampling, and is used in order to have a diverse perspective represented in each scenario and to have a mix of perspectives across all selected scenarios.
The same collateral should be used within each breakout session regardless of the number of scenarios being run. This should include the respective brochure and the newscast video.
4.1.2.9 Debrief (How to Present Outcomes and to Whom)
In each of the scenarios, we held a debrief session with all of the participants present. Additionally, for some of the workshops we held informal post-debrief sessions with the host organization members alone. The specific results will be discussed in Section 5.
For future workshops, we recommend a two-tiered debrief approach. First, we recommend that the host organization run a “public” debrief during the workshop. This should follow the same format as was done in the six workshops. The objective is to give the participants an idea of the consensus and differences in investment strategies between the future scenarios. If facilitated correctly, this session is great for getting insights from the attendees.
Second, we recommend a more formal and longer “private” debrief be held for just the host organization one or more days later. This session would go into much more depth and the objective
DVRPC MNDOT WSDOT POLB GDOT U.S.DOT
Global Marketplace X X X X X
Millions of Markets X X X X X
Naftástique! X X X X X X
One World Order X X X X X X
Table 10. Scenarios used in future freight flows workshops.

50 Scenario Planning for Freight transportation infrastructure investment
would be for the host to wring as much insight as possible out of the results. By holding it a few days later, it allows the team to clean up and spend more time with the results of the sessions.
4.1.3 Workshop Facilitation
One of the deliverables for the Future Freight Flows project is a facilitator’s guide that will outline how a scenario planning workshop should be conducted. A team of researchers at the MIT CTL, having the experience of conducting dozens of scenario planning workshops, facilitated all six workshops in this project. For each workshop, the team prepared a facilitator’s guide, which all facilitators followed. These can be found in Appendix E, Exhibits 2 through 7.
After the first workshop, the MIT team varied the process followed in the subsequent work-shops based on what had worked well previously and what needed to be improved. In three workshops (DVRPC, MNDOT, and WSDOT), the staff at the host/planning organization or the agency’s collaborators helped the MIT facilitators during the scenario breakout sessions by taking notes and answering any participants’ questions about the freight transportation infrastructure in the region being considered. For example, associates from the Volpe Center worked with the associates from MNDOT and the Metropolitan Council at the MNDOT workshop.
Initially, we had planned for the facilitator role to be taken over by the host organization. The MIT team had planned to develop and use a “train the trainers” approach over the course of the six workshops. This was not successful. We found that while the host organizations had domain and local expertise on the freight network, they did not typically possess the required group facilitation skills. We inadvertently discovered that having non-host affiliated facilitators led to a more trusted session. The MIT facilitators, for example, had no vested interests in the outcome of the work-shop. Some hosts mentioned that if members of the local DOT facilitated the session, it would be perceived that they were biasing the discussion to their preferred investment decisions. For this reason, we recommend having non-interested third-party facilitators for future workshops.
4.1.4 Summary
This section presented the design of the six scenario planning workshops in the Future Freight Flows project. We pointed out the similarities and differences in the designs of the six workshops along the nine key dimensions: Scope, Objective, Duration, Participants, Strategic Questions, Evaluation Elements, Evaluation Mechanisms, Scenarios, and Debriefs. The next section describes the process that brought these different elements together to facilitate a strategic conversation about investing in the region’s freight infrastructure to be prepared for an unknown and unpredictable future 20 to 30 years from now.
4.2 Future Freight Flows Workshops: Process
This section describes the specific scenario planning process used at the six workshops. There are four subsections. The first subsection (4.2.1) presents the resources used in the workshop. This consists of the “human resources,” that is, the roles performed by various actors in the workshop, facilities and equipment, and reading and voting material. Sub sections 4.2.2, 4.2.3, and 4.2.4 present the activities performed before, during, and after the workshop, respectively.
4.2.1 Resources Used in the Workshop
This section describes various resources used in the six workshops. This section first describes the roles played by various members of the MIT team and the host organization. This is followed

Scenario Planning Workshop Design 51
by the facilities and equipment used for the workshop, folders prepared for individual participants, scenario videos, and the instruments used for voting.
4.2.1.1 Roles
The personnel from MIT and the host organization performed eight roles. The roles are described below.
• Host: The host, a high-level executive at the host/planning agency, whose role was to welcome the workshop participants, and inform them of the importance of the workshop for which they were going to invest a day of their time. The following were the hosts at the workshops:– DVRPC: Mr. Barry Seymour, Executive Director of Delaware Valley Regional Planning
Commission.– MNDOT: Mr. Bill Gardner, Director of Freight, Rail and Waterways for Minnesota
Department of Transportation.– WSDOT: Ms. Paula Hammond, Secretary of the Washington State Department of
Transportation.– POLB: Mr. Eric C. Shen, Director of Transportation Planning for the Port of Long
Beach, California.– GDOT: None. The Georgia DOT preferred to participate in the session but not publically
endorse it. This decision was announced to the MIT team a few weeks prior to the workshop.
– U.S.DOT: Mr. John Horsley, Executive Director of the American Association of State Highway and Transportation Officials (AASHTO).
• Planning Manager: The planning manager was the one who had been engaged with MIT in designing the workshop for the 8 to 12 weeks leading to the workshop day. In many workshops, the planning manager—Ms. Barbara Ivanov at WSDOT being a great example—took the leadership role of ensuring that the insights collected at this workshop would be brought into the organization’s planning process. In all workshops, except the POLB and GDOT workshops, the planning manager described the infrastructure segments to the workshop participants.
• Lead Facilitator: The role of the lead facilitator was to set the stage for a productive scenario planning session. At the beginning of each workshop, the lead facilitator introduced the workshop participants to the philosophy of scenario planning and described how the workshop would be conducted. For all six workshops, Dr. Chris Caplice of MIT played this role.
• Scenario Facilitator: The role of the scenario facilitators was to facilitate the discussion within their breakout groups. The main objective of the facilitator was to help the participants in his/her group immerse themselves into the scenario. The facilitator then helped them apply their knowledge and insights to express through a voting mechanism the utility of the can-didate freight segments in their scenario. The scenario facilitator had to manage the dynamic interaction within the group so that individual group members could express their unique insights and then combine the individual insights to bring forth the group’s insights. Five expe-rienced facilitators from MIT—Dr. Chris Caplice, Jim Rice, Dr. Mahender Singh, Dr. Roberto Perez-Franco, and Shardul Phadnis—played this role in the six workshops.
• Note Takers: The responsibility of the note takers was to capture the insights being shared by the participants in the breakout session. They were members of the planning organization, and were used in the first three workshops. Each breakout group had one or two listeners.
• Associate Facilitator: In three workshops (DVRPC, MNDOT, and WSDOT), the associate facili-tator helped the lead facilitator compile the data generated by individual scenario teams during the breakout sessions. This helped to expedite the cross-scenario analysis so that a fairly thorough analysis could be presented to the workshop participants during the debrief and discussion session. Miguel Sánchez-Valero of MIT played this role. After the WSDOT workshop, the MIT researchers enhanced the spreadsheets used for analyzing the data by the scenario team. This automated much of the analysis, and the role of the associate facilitator was eliminated for the last three workshops.
52 Scenario Planning for Freight transportation infrastructure investment
• Cross-Scenario Facilitator: The role of the cross-scenario facilitator was to orchestrate the presentation of results from individual scenarios, engage the participants in comparing the results across scenarios, and to present the cross-scenario analysis. Dr. Caplice of MIT played this role in the first three and the last (U.S.DOT) workshop. Shardul Phadnis of MIT played this role in the POLB and GDOT workshops.
• Organization and Reception: Eric Greimann of MIT played this role. Before the workshop, he helped organize the resources needed for the workshop by coordinating with representatives from the planning organization. On the day of the workshop, Eric manned the registration desk, signed in the attendees, and handed out individual folders containing the material used in the workshop.
4.2.1.2 Facilities and Equipment
Three types of facilities and equipment were used in all six workshops, as follows:
• Conference Room: This room was large enough to seat the entire group of workshop attendees. The room had large projector screens and audio-visual equipment that were used for the PowerPoint presentations.
• Breakout Rooms: The breakout sessions were conducted in separate rooms—one for each scenario. Whenever possible, the participants were seated around tables in a U-shape so they faced each other and the facilitator. Each breakout room had audio-visual equipment, which was used for showing the video of the newscast in each scenario.
• Audio-Visual (AV) Equipment: Each breakout room had a projector, a screen, and speakers. The AV equipment in the breakout rooms was used to show the video of each scenario (audio needed). The AV equipment in the main conference room was used to show the videos of all four scenarios during lunch and for the presentations before and after the interactive workshop breakouts.
4.2.1.3 Individual Folders
Each workshop participant received a folder containing information about the exercise when he or she registered in the morning. The folders were made specific to each scenario. Each folder contained a copy of the day’s agenda, a brief description of freight infrastructure segments (or FABs in MNDOT), maps of the segment (except for the MNDOT and U.S.DOT workshops), and the brochure of the participant’s assigned scenario.
4.2.1.4 Scenario Videos
Each breakout group was shown a scenario-specific newscast video. The video first describes the scenario in about 30 seconds, and then shows a newscast from that scenario dated Nov 2, 2037. The video lasts for about six minutes. The reason for using this video is to help the participants immerse themselves in the scenario by showing them a vivid description of the world. After the breakout sessions, all participants saw either a summary video of all of the scenarios, or each of the individual newscast videos of all four scenarios before engaging in a cross-scenario analysis.
4.2.1.5 Voting Instruments
Three instruments were used in each breakout session to facilitate voting.
• Individual Investment Decision Form: Each participant in the scenario breakout session was given one form to write his/her individual vote. For “evaluation” workshops, the form listed all the infrastructure segments chosen for the workshop, with spaces to write the number of positive (votes) or negative (veto) points assigned by the participant to that segment. For the “visioning” (MNDOT) workshop, this form listed the five FABs considered and a box for writing the points assigned to that FAB. All forms also had a space for the participant to write in the infrastructure segment or FAB not covered in the list provided. The segments on the

Scenario Planning Workshop Design 53
“evaluation” forms were presented together according to their modes. The reason for using these forms was to allow the individuals to write their investment decision based only on their own thoughts and insights before participating in a group discussion and voting process.
• Voting Chips: Professional size and weight poker chips were used for the participants to reveal their votes to the entire group. The chips made the votes of the entire group participating in a scenario “visual” and facilitated the discussion about the utility of various segments perceived by the members of the group. For the “evaluation” workshop, the participants were given chips of three different colors, representing three different values (blue for 25, red for 10, and white for 5 points), to represent the positive votes and black chips to represent the veto votes. For the details of the voting mechanism, please refer to the reports for individual workshops in Appendix E.
• Group Voting Sheets: A form listing all the infrastructure segments or the FABs was used for the group members to place their voting chips on to represent their individual votes. The scenario facilitator tallied all the votes on each segment or FAB and wrote the total on the form. If any participant changed his/her vote after the group discussed the votes, the changed vote was noted on the form. The final tally of votes from this form was entered into the spreadsheets used by MIT to summarize the group’s vote in each scenario and to compare the votes across scenarios.
4.2.2 Pre-Workshop Activities
One week before the workshop, the workshop participants were sent a pre-workshop survey via email. This survey was a part of the research work conducted by MIT during the Future Freight Flows Symposium. The objective of the pre-workshop survey was to capture the work-shop participants’ assessments of the usefulness of investing in various freight infrastructure segments used in the workshop. The survey was conducted in all except the MNDOT work-shop since that particular workshop did not involve any evaluation of infrastructure segments. After completing the survey, each participant was sent reading material for the workshop. This included a web-link to the scenario he or she was assigned to, description of the infrastructure segments used in the workshop, and a one-page description of the workshop.
4.2.3 Workshop-Day Activities
With the exception of the first workshop (DVRPC), all other workshops were 6 to 8 hours long. The DVRPC workshop was a half day exercise held from 8 a.m. to 1 p.m. The agendas for all six workshops are presented in Exhibit 1 in Appendix E. All workshops began with the regis-tration and signing in of the participants. After signing in, the participants were given name tags and their individual folders containing material related to the workshop. The duration of each workshop was divided in three large blocks: introduction, interactive workshop, and debrief and discussion. The activities performed in each are explained in Sections 4.2.3.1 to 4.2.3.4 below.
4.2.3.1 Introduction
The introduction consisted of three segments: a welcome to the workshop participants, an introduction to scenario planning method, and an introduction to the infrastructure segments chosen for the workshop.
• Welcome: A high-level executive at the host organization (such as Ms. Paula Hammond at WSDOT or Mr. Bill Gardner at MNDOT) kicked off the workshop with a welcome. Besides formally welcoming the participants to the workshop, the hosts also noted that their organi-zations were planning to bring the results of the workshop into their planning process. This speech was an endorsement to the gravity of the workshop. While most workshops had a high-profile official from the planning organization give this speech, not all did due to different levels of involvement of the agencies. The lead facilitator gave the welcome address at POLB (Long Beach) and GDOT (Atlanta) workshops.

54 Scenario Planning for Freight transportation infrastructure investment
• Introduction to Scenario Planning: In all six workshops, the lead facilitator (Dr. Chris Caplice of MIT) introduced the workshop participants to scenario planning. Dr. Caplice used several examples of societal, technological, and political changes that have happened over 20 to 30 years to show that the world we live in today was far different from the 1980s, and could not have been predicted 30 years ago. He also used examples of forecasts being egregiously wrong, to make a case for using scenario planning. This presentation evolved over the series of workshops, and was generally the highest rated part of the exercise. This presentation lasted between 30 and 45 minutes. The PowerPoint slides are part of the Scenario Planning Toolkit and are available on the companion DVD package or online at www.trb.org (search for “Scenario Planning for Freight Transportation Infrastructure Investment”).
• Introduction to Freight Infrastructure Segments: In this part of the introduction, the infra-structure segments to be evaluated in the workshop were illustrated to the participants. The goal of doing this was to ensure that all participants had a uniform understanding of what the segments meant. Where applicable, the segments were shown on maps of the region. In the MNDOT workshop, where FABs were used instead of infrastructure segments, this section described the FABs. The introduction to segments or FABs generally took about 15 minutes, and was done by either the planning manager (such as Ms. Barbara Ivanov at WSDOT) or the lead facilitator.
At the conclusion of this introductory section, the group took a 15-minute break before partici-pating in the interactive workshop. Before breaking, the lead facilitator informed the participants of the “rules of engagement” in the interactive workshop: no questioning of the scenario, no criticism of ideas, and free sharing of insights.
4.2.3.2 Breakout Sessions
For the individual, small group breakout sessions, the participants broke into their pre-assigned groups—one per scenario. The purpose of this exercise was to identify how the planning organization should prioritize its investments in the region’s freight infrastructure in order to be prepared for each scenario. The interactive workshops consisted of several segments lasting from 15 to 30 minutes each. The segments of this session were always performed in the same order, as mentioned below.
• Scenario Immersion: At the beginning of the interactive workshop, the scenario facilitators asked their groups to “live in the year 2037” in their scenarios. The participants were then asked to describe the scenario. (All participants were sent the scenario and asked to read it before the workshop.) All scenario facilitators had lists of important facets of their respective scenarios, and facilitated the discussion so that the group would identify most, if not all, of those features. Following this, the scenario facilitators showed the scenario videos (Section 4.2.1.4). The four “Future Newscast” videos are part of the Scenario Planning Toolkit and are available on the companion DVD package or online at www.trb.org (search for “Scenario Planning for Freight Transportation Infrastructure Investment”). The goal of the immersion was to ensure that all participants had understood their scenario well, so they could judge the usefulness of investing in various segments or identify the initiatives for the scenario. Scenario immersion took approximately 30 minutes.
• Scenario Implications: After the immersion, the participants were asked to identify the implications of the scenario for the region’s freight infrastructure. The implications were of five types: origin, destination, volume, value density, and the transportation mode of the freight originating, coming into, and passing through the region. Identification of implica-tions took approximately 15 minutes.
• Individual Voting: After immersion and identifying implications, the participants were asked to work individually and answer how freight infrastructure funds should be invested today to prepare for the scenario. The participants first wrote their answers individually on the “Individual invest decisions form” (see Section 4.2.1.5) and then placed voting chips on the

Scenario Planning Workshop Design 55
“group voting sheets.” The voting exercise took about 20 minutes. The group took a brief break following the voting, during which the scenario facilitator tallied the group’s vote. Tem-plates for collecting these votes are part of the Scenario Planning Toolkit and are available on the companion DVD package or online at www.trb.org (search for “Scenario Planning for Freight Transportation Infrastructure Investment”). In the “visioning” exercise conducted at MNDOT, the participants wrote their ideas for initiatives in different FABs on sticky notes and posted them on a flip chart. The group and the scenario facilitator summarized the ideas to reveal common themes.
• Group Discussion and Consensus: The scenario facilitator then discussed the group’s vote, to identify the reasons why the group had voted as it did. In the workshops where used, the note takers (Section 4.2.1.1) captured the insights shared by the workshop participants. After the discussion, the participants were allowed to change their votes. The group discussions typically lasted for about 20 minutes.
• Identification of Initiatives: If a workshop involved a “visioning” exercise after “evaluation,” the participants were asked to identify specific initiatives the planning agency should take today to prepare for the scenario. For this qualitative exercise, the participants wrote their ideas on sticky notes and placed them on a large pad. The group and the scenario facilitator read the notes to identify the common themes for initiatives suggested by the group. The initiative identification exercise lasted for about 30 minutes.
The interactive workshops lasted from 1 hour and 45 minutes to 2 hours and 30 minutes. At the end of the workshop, the scenario group was asked to choose two representatives to share the results with the entire group of workshop participants in the “debrief and discussion session” (Section 4.2.3.4). The scenario representatives captured the insights from the group discussion, and the groups broke for lunch. A Facilitators Guide is part of the Scenario Planning Toolkit and is available on the companion DVD package or online at www.trb.org (search for “Scenario Planning for Freight Transportation Infrastructure Investment”).
4.2.3.3 Summary of the Breakout Sessions
During lunch, the facilitators tabulated the output of each scenario group (votes, initiatives, insights, etc.) in spreadsheets prepared for the analysis. The charts generated by these spread-sheets were linked into the presentation used for sharing the results of individual scenarios as well the cross-scenario analysis. MIT facilitators prepared the presentations to be shared with the group in the “debrief and discussion session” after lunch. The Excel file used to tabulate and generate results is part of the Scenario Planning Toolkit and is available on the companion DVD package or online at www.trb.org (search for “Scenario Planning for Freight Transportation Infrastructure Investment”).
4.2.3.4 Debrief and Discussion
After lunch, all scenario groups assembled together as one group, as they did for the intro-duction session (Section 4.2.3.1). In the first workshop (DVRPC), the debrief session was held over lunch and lasted for only one hour. It was realized that the debrief session needed much more time and focus. Therefore, the debrief and discussion sessions in all subsequent workshops were held after lunch and lasted from 1 hour and 30 minutes to 2 hours. This session typically had the following four components:
• Scenario Reveal: The debrief sessions began with the revealing of all the scenarios used in the workshop to the participants. Until this time, each participant had known one and only one scenario—the one he or she participated in. The reason for revealing all the scenarios for the debrief session was to ensure that all participants got to know the different scenarios so as to form a basis for discussion within the group. The scenario videos (Section 4.2.1.4) were used for this purpose. The scenarios summary video containing the overviews of each of the
56 Scenario Planning for Freight transportation infrastructure investment
four future scenarios is part of the Scenario Planning Toolkit and is available on the companion DVD package or online at www.trb.org (search for “Scenario Planning for Freight Transporta-tion Infrastructure Investment”).
• Presentation of Individual Scenario Results: After revealing all scenarios, the cross-scenario facilitator (Section 4.2.1.1) invited the representatives from each scenario to present their group’s results. The scenario representative used the presentation MIT facilitators had prepared during the lunch hour (Section 4.2.3.3). The cross-scenario facilitator encouraged the participants in other scenarios to compare their findings to the ones being presented. These often resulted into a lively exchange of ideas among the group.
• Presentation of Cross-Scenario Analysis: Following the presentation of results from indi-vidual scenarios, the cross-scenario facilitator presented the charts comparing the results from all scenarios. These charts were used to show the participants how different infrastructure segments can be classified into robust and contingent segments. The Excel and PowerPoint files for this debrief session are part of the Scenario Planning Toolkit and are available on the companion DVD package or online at www.trb.org (search for “Scenario Planning for Freight Transportation Infrastructure Investment”). The classification developed by MIT’s Supply Chain 2020 research group was used for this analysis, as follows:– No-brainer segments are the ones found to be favorable for investment in all scenarios.– No-gainer segments are those that are unfavorable for investment in more than one scenario
and not found to be favorable in any.– No-regret segments are those that are favorable in some, but not all, scenarios and are not
unfavorable in any scenario. The above three types of segments are robust investments, that is, the decision to invest in them remains the same regardless of the scenario.
– Contingent segments are those that are favorable in some scenario(s) and unfavorable in some others. The decisions to invest in these segments are contingent upon which scenario the world comes to be like. The strategy to invest in these segments involves making some “flexible” investments that can be adapted once the planning organization gets a better sense of which way the future may evolve.
• Sensors in the Ground: The cross-scenario analysis was followed by a presentation of “sensors in the ground.” Sensors are those events in the business environment that change the assessment of the subjective likelihood of the future evolving in the direction of a particular sce-nario. Sensors provide indications for if and when flexible options in the contingent segment should be exercised. The lead facilitator always gave this presentation. After the discussion of sensors in the ground, the lead facilitator wrapped up the workshop.
4.2.4 Post-Workshop Activities
One day after the workshop, the workshop participants were sent a post-workshop survey via email. This survey had two parts. In the first part, the survey asked the workshop participants to assess the usefulness of investing in the freight infrastructure segments used in the workshop. These questions were identical to those in the pre-workshop survey. The reason for asking these questions again was to see if and how the participants’ evaluations had changed after participating in the scenario planning workshop. In the second part, the participants were asked to rate the effectiveness of various parts of the workshop (described in Section 4.2.3) and the material used to describe the scenarios.
4.2.5 Summary
This section described the scenario planning process used at the six workshops. The section first presented the resources used in the workshop (Section 4.2.1). This was followed by a detailed account of the activities performed before (Section 4.2.2), during (Section 4.2.3), and after (Section 4.2.4) the workshop.

57
The previous section compared the scenario planning process used across the six scenario planning workshops. In this section, we compare the results obtained from the six workshops. The workshops had different geographic focus areas (Northeast, Midwest, Northwest, Southwest, South, and the entire United States), region sizes (state, multi-state, national, etc.), strategic questions, and infrastructure segments. Additionally, each workshop used the scenarios devel-oped for the Future Freight Flows project differently. In some workshops, the host organization evaluated the utility of investing in a set of pre-selected freight infrastructure segments. In some others, the scenarios were used to leverage the insights of the workshop participants to identify freight initiatives.
These results are compared in this section. Section 5.1 describes the method used for com-paring the results across six disparate workshops. Following this, the results from infrastructure segments evaluation sessions are compared in Section 5.2. The comparison of initiatives from the “visioning” sessions across the workshops is presented in Section 5.3.
5.1 Method for Comparing Results Across Workshops
The scenarios in the six Future Freight Flows workshops were used for two purposes: evaluation of specific freight infrastructure segments and visioning of initiatives in the chosen region. The results of the evaluation session are quantitative; those of the visioning session are qualitative. These quantitative and qualitative results from the six workshops are summarized separately in Sections 5.2 and 5.3, respectively.
Five workshops (all except MNDOT) included an evaluation of infrastructure segments. The segments were physical components of the freight infrastructure specific to the regions in four of these workshops, and abstract concepts in the U.S.DOT workshop. In order to compare the results across these five workshops, the segments used in all workshops are first classified into one of the three types: gateways, corridors, and connectors. The three types are defined in Section 4.1.2.6. The number of segments of each type used in the five work-shops is presented in Table 9 in the same section. For comparing the “evaluation” results from the five workshops, the positive votes and vetoes assigned to individual segments in each workshop are rolled up into the corresponding segment types. These results are discussed in Section 5.2.
Four of the six workshops (all except DVRPC and U.S.DOT) used a visioning session to identify initiatives the planning organization should consider. These are qualitative results; the themes are identified and compared across the four workshops. The comparison of results of the “visioning” sessions is presented in Section 5.3.
S e c t i o n 5
Future Freight Flows Workshops: Results

58 Scenario Planning for Freight transportation infrastructure investment
5.2 Comparison of Results from Evaluation Sessions
The results from voting in the evaluation sessions in five of the workshops are summarized by types of segments, and presented in Appendix E, Exhibits 8 through 12. Each exhibit has three sections: a, b, and c.
• Section (a) shows the number of individual segments of each type, followed by the total points (positive votes) and vetoes (negative votes) received in each scenario used in the workshop. For example, in the DVRPC workshop (Exhibit 8), the participants in the Global Marketplace scenario assigned a total of 1,360 points and 18 vetoes.
• Section (b) shows the proportion of total points and vetoes each segment type received in each scenario. Thus, in each scenario, the proportions of points for the three segment types add to 1. Similarly, in each scenario, the proportions of vetoes for the three segment types add to 1.– If the proportion of points received by a segment type in a scenario is greater than the
proportion of vetoes received, then the former is shown in blue font. This suggests that the segment type, overall, was more often preferred than vetoed.
– If the proportion of vetoes received by a segment type in a scenario is greater than the propor-tion of points received, then the former is shown in red font. This suggests that the segment type, overall, was more often vetoed than preferred.
• Section (c) shows the proportion of points and vetoes per segment. Thus, this section is section (b) normalized by the number of infrastructure segments in the segment type. For each scenario in a given workshop, the highest proportion of votes and vetoes per segment are shown using a bold font. The bold font highlights the most preferred and most vetoed segment types of the three, in each scenario.
Before delving into the results, we want to remind the reader about the number of segment types in each workshop. These results were presented in Table 9 by modes, and are reproduced here in Table 11 by combining all modes.
The results from individual workshops presented in Appendix E, Exhibit 8 through Exhibit 12, are summarized in one table (Table 12) for an easy, visual comparison of votes across the five workshops. However, because the information density of this table is high, it is described in detail first.
• Each column represents one of the five evaluation workshops (DVRPC, WSDOT, POLB, GDOT, U.S.DOT).
• Each workshop column has two sub-columns: one for positive points (“votes”) and one for negative votes (“vetoes”).
• The votes and vetoes are shown for gateways, corridors, and connectors for each scenario used in the workshop.– Remember that these workshops used four scenarios: Global Marketplace (GM), Millions of
Markets (MM), Naftástique! (N!), and One World Order (OWO).
DVRPC MNDOT WSDOT POLB GDOT U.S.DOT
Gateways 2 - 3 2 3 6
Corridors 4 - 12 10 8 3
Connectors 2 - 1 3 2 3
Number of segments 8 16 15 13 12
Table 11. Types of infrastructure segments used in evaluation workshops.

Future Freight Flows Workshops: Results 59
– Scenario Millions of Markets was not used in POLB; scenario Global Marketplace was not used in GDOT. Therefore, the cells in the POLB and GDOT columns in rows MM and GM, respectively, are blank.
• In each scenario—for a given segment type in a particular scenario—the votes are shown in two rows.
The first row shows the percentage of all the votes (in sub-column “votes”) and percentage of all the vetoes (in sub-column “vetoes”) received by the type of segment in that scenario in that workshop. This data is taken from sections (b) in Appendix E, Exhibit 8 through Exhibit 12.
• The second row shows a bar-chart depicting the proportion of votes in the total proportion of votes and vetoes. Thus, the length of the bar is equal to votes/(votes + vetoes). Thus, the longer the bar, the more important the participants in that scenario in that workshop thought that segment to be.
• The bar charts in the scenarios are color-coded: Global Marketplace (blue), Millions of Markets (gray), Naftástique! (red), and One World Order (green).
Table 12 is shown above. Key observations from this table are presented in Section 5.2.1.
votes vetoes votes vetoes votes vetoes votes vetoes votes vetoes
0.36 0.17 0.21 0.00 0.25 0.15 0.47 0.29
0.21 0.47 0.20 0.05 0.26 0.36 0.45 0.57
0.25 0.20 0.15 0.23 0.08 0.54 0.21 0.21 0.42 0.89
0.17 0.47 0.15 0.44 0.26 0.22 0.25 0.50 0.35 0.83
0.46 0.50 0.75 0.85 0.37 0.75 0.24 0.21
0.61 0.29 0.77 0.76 0.48 0.64 0.33 0.24
0.45 0.67 0.85 0.47 0.77 0.38 0.63 0.71 0.32 0.00
0.53 0.47 0.84 0.31 0.47 0.67 0.55 0.44 0.24 0.13
0.19 0.33 0.03 0.15 0.38 0.10 0.30 0.50
0.19 0.24 0.03 0.19 0.26 0.00 0.22 0.19
0.31 0.13 0.00 0.30 0.15 0.08 0.15 0.07 0.26 0.11
0.30 0.05 0.02 0.25 0.28 0.11 0.20 0.06 0.41 0.04
100%
65%
37%
54%
71%
90%
100%
68%
76%
62%
44%
32%
79%
66%
71%
42%
50%
33%
43%
47%
56%
19%
15%
0%
7%
63%
13%
54%
33%
67%
47%
50%
64%
73% 41%
30%
52%
58%
81%
40%
25%
Co
nn
ecto
rs
GM36%
MM44%
N!70%
OWO85%
Gat
eway
sC
orr
ido
rs
GM48%
MM67%
N!40%
OWO53%
30%
55%
26%
GM
MM
N!
OWO
DVRPC WSDOT POLB GDOT U.S.DOT
68% 100%
Table 12. Summary of “evaluation” votes by segment types in all workshops.

60 Scenario Planning for Freight transportation infrastructure investment
5.2.1 Observations from Comparison of Evaluations Across Workshops
The sections below describe the positive and negative voting results for the five evaluation workshops. The analysis combined the common infrastructure elements into three categories: gateway, corridor, or connector. Each is discussed in turn below.
Let us make three general comments on the combined results before discussing the details. First, these results and insights are limited in that they represent the opinions from only a small set of professionals from six different regions on a limited set of options presented by the host organizations. It is not meant to be conclusive or final.
Second, it is interesting to note that each scenario demonstrated slightly different priorities. No two workshops behaved quite the same across all segment types. This is probably due to the location at which each workshop was held as well as the particular economics of that area.
Third, we can get a rough sense of priority for the three different segment types by com-paring the positive vote to negative veto ratio for each of the 18 scenario-workshop pairings. (A scenario-workshop pairing is simply one breakout group’s results in one workshop. We ran five evaluation workshops with three using four scenarios and the other two using three scenarios. This gives us a total of 18: 4 GM, 4 MM, 5 OWO, and 5 N!). For gateways, only seven of 18 had more positive votes than negative vetoes, while for corridors this was reversed with 11 of 18 having more positive votes than negative vetoes. Connectors are a little more complicated since the WSDOT workshop had only a single segment that could be classified as a connector, which was heavily vetoed. Removing it, we can see that 11 of 14 scenario-workshop pairings had higher positive votes than negative vetoes. As a general insight, we can take away that connectors seem to be viewed as the most critical infrastructure elements to invest in followed by corridors. Gateways appear to be less valuable for further investment.
5.2.1.1 Gateways
The evaluation workshops had two (DVRPC, POLB), three (WSDOT, GDOT), or six (U.S.DOT) gateway segments. All five workshops had waterport and airport gateways. Only the U.S.DOT workshop had land gateways (i.e., border crossings with Mexico and Canada).
Gateways were found to be useful investments in all workshops in the Global Marketplace scenario. At least 62% of the total votes (including vetoes) received in the Global Marketplace scenario were in favor of investing in this segment type. In the remaining three scenarios, gateway segments, overall, were found to be useful to invest in at most one workshop in each of the remain-ing three scenarios, and found to be bad investments in the remaining workshops.
Of the four scenarios, Global Marketplace resembles the global world we live in today. This is the only scenario in which gateway segments are found to be useful to make investments in today. This suggests that, based on the results from all five workshops, it makes sense to make investments into gateway segments only if we believe that the future will be similar to today—that is, marked by global trade, which provides access to resources to anybody at any place in the world.
Actually, across all of the other scenarios, the general priority for gateway infrastructure is quite low; negative vetoes outweigh positive votes in 11 of 18 potential scenario-workshop pairings! Given that the official projections about the future often consider the continuation of the existing trends, there is a real danger that infrastructure planning agencies will continue to invest in gateway segments (because they are useful segment types in which to invest in Global Marketplace), and these investments will turn out to be futile if the official projections of the future are wrong. Therefore, investments in gateways must be done judiciously. The consensus of the other scenarios seems to be that there is sufficient gateway capacity for trade and further investment might not be needed.

Future Freight Flows Workshops: Results 61
5.2.1.2 Corridors
Corridors were the most common segments in each the Future Freight Flows workshops. With the exception of the U.S.DOT workshop, at least 50% of the segments evaluated in all workshops were corridors. WSDOT evaluated the most corridors, both by number (12) and by the percentage of total segments (75%). The most common corridors evaluated were highways, followed by rail lines.
Corridors were not found to be uniformly useful investments within any scenario across all five workshops. However, it was found to be generally useful to invest into corridor segments today to prepare for a Naftástique! or a One World Order scenario. The net proportion of votes received by corridor segments (including positive and negative votes) never fell below 40%, and was above 50% in seven out of 10 scenario sessions in the five workshops—reaching as high as 100% in Naftástique! in the U.S.DOT workshop and 73% in One World Order in the WSDOT workshop.
Corridor segments were also voted favorably in the Millions of Markets scenario in three of the four workshops where they were used. Only in the GDOT workshop was investing in corridors favored by less than 50% of the votes.
Corridor segments were found to be of the least use to invest to prepare for the Global Marketplace scenario. They received a higher proportion of vetoes than positive votes in three out of four workshops where they were evaluated for usefulness to prepare for a Global Marketplace world. Only in the U.S.DOT workshop was the proportion of positive invest points received by corridor segments slightly greater than the proportion of vetoes received. However, even in the scenarios for which corridor segments received a greater proportion of vetoes than invest points, the proportion of invest points was fairly high. One way to interpret this result is that the participants across all workshops felt that corridor segments were useful, but did not require additional investments at this time to prepare for a future similar to today.
Overall, comparing the results of evaluation in four scenarios in five workshops, corridors stand out as fairly robust investments. However, these investments will be a lot more valuable if the future were to be significantly different from the world dominated by global trade. One way to invest in corridors today would be to prioritize investments in those corridor segments that urgently need to be invested in even to meet today’s demands. Those investments will not only help us meet the present day needs, but also prepare us for a future quite different from today’s fairly resourceful world of global trade.
5.2.1.3 Connectors
All five workshops evaluated one (WSDOT), two (DVRPC, GDOT), or three (POLB, U.S.DOT) connectors. The connectors consisted of local roads, short-line rails, or intermodal facilities.
The only connector evaluated in the WSDOT workshop was the “Grays Harbor to Chehalis Rail Line.” This segment was heavily vetoed and received few positive invest points in all four scenarios used in the workshop. Because the results of evaluation of connectors in the WSDOT workshop are specific to one peculiar infrastructure segment only, they are omitted from the cross-workshop comparison presented below.
After discarding the evaluation from the WSDOT workshop, the connector segments emerge as highly useful investments to make to prepare for a Naftástique! or a One World Order scenario. Among the eight evaluations in these two scenarios from four workshops, the lowest proportion of positive points received by the connector segments is 66%. The connectors were also found to be useful investments in the Millions of Markets scenario in the GDOT and U.S.DOT workshops, and received 44% of the positive votes in DVRPC.

62 Scenario Planning for Freight transportation infrastructure investment
The connectors received mixed evaluations in the Global Marketplace scenario. They were found to be highly useful investments to make in the POLB workshop, but somewhat not useful investments in the DVRPC and U.S.DOT workshops. This suggests that connectors only in some specific regions or connectors only of specific types are useful investments to prepare for a business-as-usual future.
Overall, connectors emerge as useful to invest in to prepare for Millions of Markets, Naftástique!, or One World Order—any future in which the world looks different from today’s Global Marketplace. Connectors are also found to be useful in some specific regions. Thus, one broad investment strategy for connectors would be to invest in those connector segments that urgently need to be invested in to meet today’s demands. Those investments will help meet the present needs, and help prepare for a future quite different from today’s Global Marketplace world.
5.3 Comparison of Results from Visioning Sessions
Four of the six Future Freight Flows workshops included a visioning session. The MNDOT workshop was a pure visioning workshop. The visioning sessions were conducted within indi-vidual scenarios, where the participants were asked to identify initiatives the planning organiza-tion should take today to be prepared for the corresponding scenario. The data collected in these visioning sessions is analyzed to identify similarities. Similar initiatives are grouped together under a category heading. Table 13 lists the most common initiatives across the four workshops. Only those initiatives are shown that were identified in at least two different scenarios in one workshop and in at least two different workshops. There are nine categories of initiatives, which are illustrated using the actual initiative identified by the workshop participants. An “x” next to the initiative indicates the workshop and the scenario in which it was identified. The rightmost column indicates the number of scenario groups across the four workshops in which the category of initiative was suggested.
5.3.1 Observations from Comparison of Initiatives Across Workshops
Of the four workshops with visioning sessions, two workshops used all four scenarios (MNDOT and WSDOT), and two workshops used three scenarios each (POLB and GDOT). Thus, the list of initiatives is generated in 14 scenario-workshop pairings.
By far, the most common group of initiatives was to “develop or improve intermodal con-nections.” The initiatives in this category included increasing capacity of intermodal exchanges, improving interoperability among different modes at the intermodal facilities, and development of regional logistics hubs. These initiatives were identified in 11 out of 14 scenario sessions. They were identified in all four workshops and across all four scenarios used in the Future Freight Flows project. These initiatives are related to the “connector” type segments discussed in the previous section.
The next two most common initiatives were “creating freight-only lanes” and “making regula-tions and standards to facilitate freight.” Each of these was identified by eight out of 14 scenario sessions, and across all four scenarios. While “freight lanes” was suggested in all four workshops, “regulatory initiatives” were suggested in three of the four workshops (except WSDOT). The initiatives in the “freight lanes” category suggested creation of dedicated truck lanes on highways, separating freight transportation from passenger transportation, and even taking the passen-ger traffic off the highways completely through improved transit! The motivating idea behind this initiative is to create “freight-only corridors” to facilitate goods flow in the country. The “regulatory initiatives” are also motivated by the need to improve the existing freight flows by eliminating regulations that hinder them. The common themes in this group of initiatives were

Future Freight Flows Workshops: Results 63
having a national freight policy and funding to take freight planning out of regional provincial policies, developing policies to improve flow of goods across the U.S.-Mexico border, and repeal or revision of the Jones Act (Merchant Marine Act of 1920), which prohibits foreign shops from carrying cargo between U.S. ports.
The next three most commonly cited initiatives were related to improving the capacity of corridors—highways, rail lines, and waterways and ports. These initiatives were identified in seven, six, and five scenario sessions respectively. The initiatives related to adding new capacity (such as adding highway lanes or rail lines) or making the existing infrastructure carry more cargo (enabling double-stack transportation by rail, dredging ports, etc.). These initiatives were often mentioned in context of specific segments of the freight infrastructure (such as highway I-5, the Alameda Corridor, the Port of Savannah, etc.).
MNDOT WSDOT POLB GDOT #GM x x xMM xN! x x x x
OWO x x x
GM x x
MM x x
N! x x
OWO x x
GM x x
MM x
N! x x x
OWO x x
GMMM x x xN! x x
OWO x xGM xMM xN! x x
OWO x x
GM x x
MM x
N! x
OWO x x
GM x
MM
N! x
OWO x x x
GM x xMM xN! x
OWO xGM xMM xN!
OWO x
5
5
3
11
8
8
7
6
6
Improve capacity of waterways: Dredge waterways, build
new locks along waterways, build new barge facilities, etc.
Freight-only lanes: Create dedicated truck lanes on highways,
separate passenger and freight transportation infrastructure,
initiatives to take passenger traffic off highways, etc.
Reduce environmental impact of transportation:
Incentivize use of greener modes of transportation, identify
environmental initiatives, etc.
Make regulations and standards to facilitate freight: National freight policy, repeal/revise Jones Act, improve goods
flow across US-Mexico border, fast-track Environmental Impact
Review process, standardize truck weights and sizes, etc.
Expand rail capacity: Increase capacity, double-track,
separate freight from passenger traffic, improve operations
(increase speed, reduce variability), etc.
Develop or improve intermodal connections: Improve
capacity of intermodal exchanges, improve inter-operability via
policy changes & technology, create regional logistics hubs, etc.
Increase highway capacity: Increase highway capacity,
improve road conditions, streamline interchanges for commercial
traffic, improve last-mile infrastructure, etc.
Land use: Reserve industrial land for industrial use, create multi-
modal zones for industrial use and long-haul distribution, simplify
zoning process, etc.
Use information technology to improve freight flows:
Implement demand management, implement technology to track
and monitor cargo, use technology to charge for port usage, etc.
Table 13. Summary of initiatives from “visioning” session in all workshops.

64 Scenario Planning for Freight transportation infrastructure investment
The other commonly identified initiatives included creating policies to reduce the environ-mental impact of freight transportation (six sessions), policies related to land use, specifically setting aside industrial land for creating long-haul distribution and multimodal facilities, and leveraging information technology to improve freight flows.
5.4 Summary
This section presented the results obtained in the six workshops, which used the Future Freight Flows scenarios project for evaluating different freight infrastructure segments and for identify-ing initiatives in different regions of the country. The six workshops had six different geographic focus areas: Northeast, Midwest, Northwest, Southwest, South, and the entire United States. To compare the results across the workshops with such diverse foci, some common themes had to be identified. Section 5.1 describes the method used for comparing the results across six disparate workshops. The actual comparison of results is presented in Sections 5.2 and 5.3. The former compares the results from evaluations of freight infrastructure segments and the latter summarizes the results from the visioning sessions used to identify freight infrastructure initiatives.
65
Scenario planning workshops have been shown to be very engaging as well as effective in gather-ing input and feedback on freight transportation infrastructure investments from a diverse group of stakeholders. Clearly, running a workshop is not sufficient by itself to determine investment priori-ties and strategies. The scenario planning workshop is a simple and efficient method for collecting external feedback, uncovering unexpected insights, and “acid-testing” different strategies. Each state DOT has an established and (presumably) well-functioning process for freight investments. Transportation planners, however, are challenged with how to incorporate the workshop results (typically soft and qualitative) into their existing planning process (typically hard and quantitative).
While neither requested nor specified in the scope of the project initially, the integration of the workshops into traditional state planning processes has been a concern of the research team from the start of the project. The fact that each state follows its own process makes it more challenging for a standard or common process to be developed. We have addressed this through a separate Master’s thesis (see Sánchez-Valero, M. A. 2011. Merging Qualitative and Quantitative Criteria for Freight Investment Using Scenario Planning. Massachusetts Institute of Technology, Cambridge, MA) that presents several case studies from WSDOT and makes recommendations on some potential methods. While this process is not adhered to by all states, it does serve as a starting point for states to consider how to incorporate a workshop into established processes.
The remainder of this section outlines the generic transportation planning process (mainly derived from WSDOT, but not completely) and then proposes three ways in which the results of a workshop can be incorporated.
6.1 The Generic Transportation Planning Process
Transportation planning is usually conducted at the state and metropolitan planning orga-nization (MPO) levels. State departments of transportation are government agencies devoted to transportation, with official responsibilities for transportation planning, programming, and project implementation within their state or territory. MPOs are federally-funded transportation policy-making organizations made up of representatives from local government and governmen-tal transportation authorities. Federal legislation requires the formation of an MPO for any urbanized area (UA) with a population greater than 50,000. In some states, planning for smaller communities and rural areas is conducted by their respective state DOTs, while others aggregate rural areas to form rural planning organizations. When developing transportation planning that includes Indian tribal lands, MPOs and state DOTs consult with the affected Indian tribal governments.
The transportation investment process is comprised of a large number of steps and involves many layers of multiple agencies, legislators, and jurisdictions. Its complexity is further enhanced by the lack of uniformity across regional administrations. For the purpose of simplification, and
S e c t i o n 6
Integration into Established Planning Process
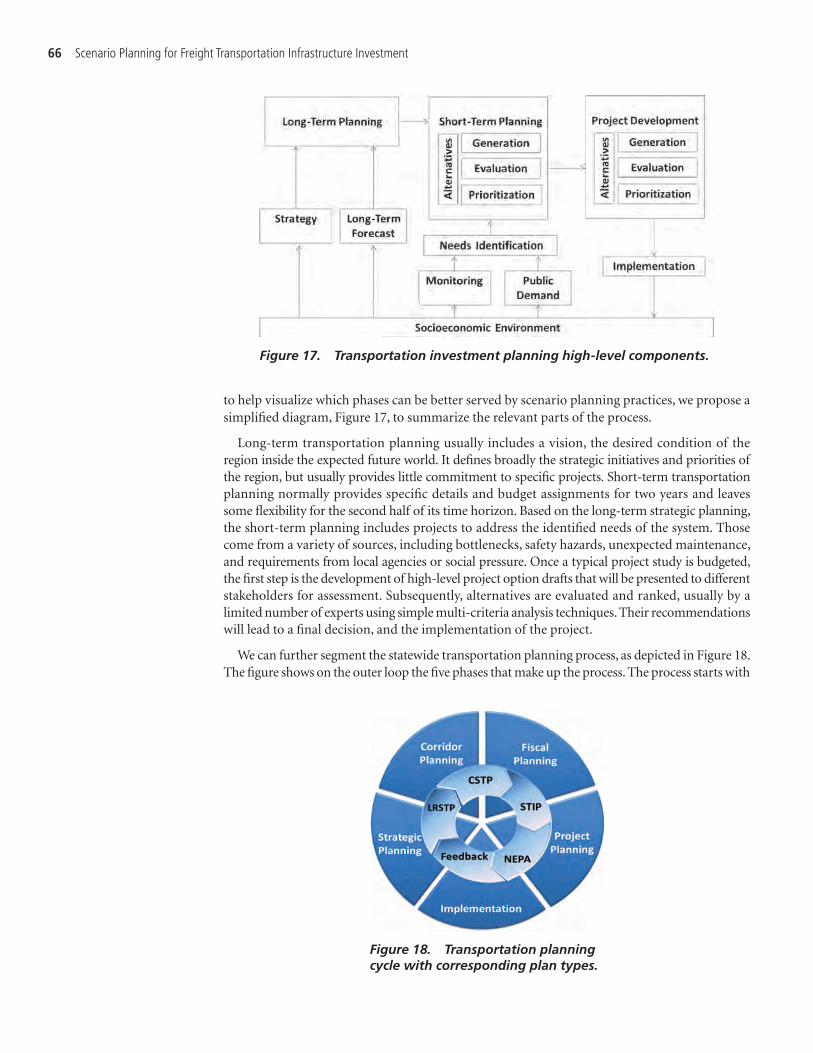
66 Scenario Planning for Freight Transportation Infrastructure Investment
to help visualize which phases can be better served by scenario planning practices, we propose a simplified diagram, Figure 17, to summarize the relevant parts of the process.
Long-term transportation planning usually includes a vision, the desired condition of the region inside the expected future world. It defines broadly the strategic initiatives and priorities of the region, but usually provides little commitment to specific projects. Short-term transportation planning normally provides specific details and budget assignments for two years and leaves some flexibility for the second half of its time horizon. Based on the long-term strategic planning, the short-term planning includes projects to address the identified needs of the system. Those come from a variety of sources, including bottlenecks, safety hazards, unexpected maintenance, and requirements from local agencies or social pressure. Once a typical project study is budgeted, the first step is the development of high-level project option drafts that will be presented to different stakeholders for assessment. Subsequently, alternatives are evaluated and ranked, usually by a limited number of experts using simple multi-criteria analysis techniques. Their recommendations will lead to a final decision, and the implementation of the project.
We can further segment the statewide transportation planning process, as depicted in Figure 18. The figure shows on the outer loop the five phases that make up the process. The process starts with
Figure 17. Transportation investment planning high-level components.
Figure 18. Transportation planning cycle with corresponding plan types.

integration into established Planning Process 67
the strategic planning phase and continues clockwise through corridor planning to fiscal planning, then financial planning and finally to implementation. Not all projects make it through all phases of the process. The inner circle shows the documents or plans that are handed off between the phases—these are explained in detail below.
In the strategic planning phase, a desired future state of the transportation system is produced. This is usually based on overall growth strategies for the region and a common vision developed through public outreach and stakeholder involvement, and derives into a final product, the long-range statewide transportation plan (LRSTP), which describes the strategic objectives to be reached and in varying degrees of detail, the specific actions and projects that will achieve them. Transportation scenario planning, as described later in this section, occurs in the strategic planning phase.
The corridor planning phase serves as a meeting point between the system-based view of the previous phase and the project-based approach of the next phases. In this phase, groups of possible investments are discussed and usually bundled into major multimodal corridors. This phase produces the corridor statewide transportation plan (CSTP), which describes specific projects in greater detail and ranks them in priority order for different corridors. Compared to the other documents in Figure 18, CSTPs are not required from the federal government, and therefore are not implemented in all planning organizations, especially when these decide to provide project-level details in their LRSTP, or have a previous planning system in place. But even if the name differs, the connecting phase between system-level and project-level thinking is always present, tying the LRSTP to the statewide transportation improvement program (STIP), and thus helping to reduce complexity and facilitate the transition from strategy to planning.
Fiscal planning, usually called programming, is the phase that produces the STIP, a formal document that lists all improvement projects planned for the next four years. A project must be included in the STIP to receive federal funding, and careful calculations of the estimated costs and benefits of each project are taken into account before submitting the projects and their priority ranking for funding allocation. It is interesting to note that priorities are allocated according to the current system data, forecasts, and perceived needs for each investment in each of the strategic goals of the planning agency (for example, in WSDOT these are mobility, safety, envi-ronmental enhancement, and economic vitality). Because funding needs always surpass available funding, if a clear and actionable strategic vision is not adequately stated and communicated from the LRSTP to the STIP (via the CSTP in some instances) so that the decision makers can use it as criteria to prioritize between similar ranking projects, the planning organization will always be in “firefighting mode,” unable to implement its intended strategy and unable to react to emergent strategies to advance its goals.
Project planning is the phase in which a project is fully developed once it has received (or is expected to receive) funding for construction and preliminary studies. Based in the previous study at the corridor plan level, local planners produce an implementation plan. During this process, environmental permits and documentation must be obtained as required for federal and state funding. In some cases, environmental documentation can be prepared at the program-level in the corridor planning phase to ensure a faster implementation once funding is secured. The phase finishes with the approval of the National Environmental Policy Act (NEPA) documentation.
Implementation is the phase in which rights-of-way and real estate are acquired, a construction contract is released for bidding, and the project is finally built and becomes operational.
6.1.1 Key Documents for Transportation Planning
There are five key documents used for transportation planning: the unified planning work program (UPWP), the metropolitan transportation plan (MTP), the transportation improvement

68 Scenario Planning for Freight Transportation Infrastructure Investment
program (TIP), the LRSTP, and the STIP. The key characteristics are described below and shown in Figure 19.
The UPWP lists the transportation planning activities that are to be undertaken by the MPO in support of the goals, objectives, and actions established in the LRSTP (for example, public outreach activities, planning workshops, etc.).
The MTP is a blueprint for transportation programs and spending in a specific metropolitan area. The Code of Federal Regulations requires the plan to “include both long-range and short-range program strategies/actions that lead to the development of an integrated intermodal transportation system that facilitates the efficient movement of people and goods” (CFR 450C, 2006). These plans usually follow a systems-level approach and are strategic in nature, proposing policies to deal with all aspects of transportation. They include projections for socioeconomic development, transportation demand, and cost estimates for operation, maintenance, and capital investments in the system over the next 20 years.
The TIP is a listing of all projects, project phases, and strategies scheduled to begin in the next four fiscal years in a metropolitan area. All projects that are candidates for federal funding must be documented in the TIP.
The LRSTP fulfills the same function as the MTP but at a statewide level. Both plans must be consistent with each other.
The STIP serves the same purpose as the TIP at a statewide level. All metropolitan TIPs are incorporated directly, without change, into their respective STIPs.
6.1.2 Transportation Planning Framework
Each of the planning phases described at the beginning of this section goes through a variety of steps. Figure 20 shows a transportation planning framework suggested by Transportation for Communities—Advancing Projects through Partnerships (TCAPP), a federal project to help
Figure 19. Key documents for transportation planning (FHWA 2007).

Integration into Established Planning Process 69
Note: wrt = with respect to.
Figure 20. Suggested planning framework (TCAPP 2011).

70 Scenario Planning for Freight transportation infrastructure investment
standardize planning steps and collaborative transportation decision-making processes across different states.
The description of each step is too lengthy to include here, but can be found online at http://www.transportationforcommunities.com/shrpc01/. Each phase can be conducted at the MPO or state DOT level, and all of them, except for corridor planning, involve more than one agency with decision-making authority, usually a federal agency (FHWA or a resource agency in the project phase) that decides whether to approve the final document or not. For this reason, all organiza-tions with decision-making authority in any part of the process are usually engaged either in the scoping or in the alternative evaluation phases, to ensure their engagement and buy-in. The longitudinal areas shaded in gray in Figure 20 represent similar steps between all phases. These are depicted in Figure 21.
We can expect the use of exploratory scenario planning exercises to enhance the process in the scoping and alternative generation steps because of their ability to expose preconceptions and foster creativity and imagination. Normative scenario planning exercises can help in the alternative generation and final decision steps, assessing the robustness, the risk sensitivity, and the ability to capture unexpected opportunities for each alternative investment, as well as facilitating consensus among decision makers. The actual methodologies used in each of these steps vary among DOTs and even among projects, so no attempt to fully categorize them is made in this section.
6.2 Incorporating Scenario Planning into Transportation Planning
This section describes how the four scenarios created for the Future Freight Flows (FFF) project could be incorporated into the transportation planning process currently used by the state DOTs or MPOs.
6.2.1 When to Use Future Freight Flows Scenarios?
As discussed earlier, Future Freight Flows scenarios can be used in two general ways: visioning and evaluation.
• In “visioning,” the FFF scenarios are used to stimulate thinking and facilitate discussion among the leadership team of the transportation planning agency to envision strategic objectives and/or
Figure 21. Common steps between all planning phases.

integration into established Planning Process 71
particular projects for the region. This is done by asking a participant to envision the region in one of the four scenarios and to identify corridors and/or strategies the region should have for the planning organization to best fulfill its overarching mission in that scenario.
• In “evaluation,” the FFF scenarios are used to compare the usefulness of various projects previously identified by the leadership team under multiple scenarios. This is done by asking a participant to envision the region in one the four scenarios and then to vote on the set of projects chosen for the workshop.
In either case, the appropriate time for using scenarios is in the “strategic planning” phase. This means using the workshops to help develop the MTP for MPOs and to develop the LRSTP for state DOTs.
6.2.2 How to Use Future Freight Flows Scenarios for Visioning?
The FFF scenarios can be used for visioning exercises by the leadership team of the transportation planning agency to set the strategies for the transportation planning process. Here, the scenarios are used as thinking devices to help the leaders envision different future environments the region may experience. Using ideation methods—such as brainstorming—the scenario users identify the strategies, segments, and projects that would be useful in each scenario. These strategies, ideated across multiple scenarios, are compiled and are then evaluated quantitatively under multiple FFF scenarios using one of the “evaluation” methods as described in Section 6.2.3.
Additionally, the visioning exercise can also be used to identify the appropriate criteria for each scenario. Similar to the strategies, the criteria ideated under multiple scenarios are compiled and given appropriate weights for different scenarios (including the possibility of having weight zero on some criteria in some scenarios). A voting mechanism using non-negative points can be used to specify the relative importance of different criteria in multiple scenarios.
6.2.3 Three Approaches for Using FFF Scenarios for Evaluation
The Future Freight Flows scenarios can be incorporated into the existing evaluation structure either qualitatively or quantitatively—these are not mutually exclusive.
In the qualitative method, the workshop participants vote individually on the segments, and the scenario facilitator leads a discussion of the group’s vote, asking the participants to explain why they voted as they did. This discussion uncovers values and insights of different stakeholders about how different segments would fare in their given scenario. These qualitative insights become the input to the transportation agency’s planning process to help shape the MTP or the LRSTP for an MPO or state DOT, respectively. The planning agency would note these insights during the discussion and then incorporate them into strategic planning and/or corridor planning subjectively by adjusting the valuations of different projects.
To incorporate the quantitative results from the workshops, we assume that the existing transportation planning process evaluates the potential investments using multiple criteria. For example, each project or initiative might be evaluated along six criteria, as follows:
1. Economic Growth—Expected economic impact in the region, including direct and indirect effects.
2. Freight Mobility—Influence of each alternative on congestion levels; there is a set of projected data for each alternative and scenario.
3. Environmental Impact—Environmental damage of each alternative, including all viable attenuation measures.
4. Economic Feasibility—Net present value (NPV) projections including construction costs, revenue streams, and maintenance costs for each alternative.
72 Scenario Planning for Freight transportation infrastructure investment
5. Development Impact—Impact on land use and current long-term regional growth strategy.6. Safety—Effect on a variety of safety metrics.
We assume that the planning agency has a vetted and established method for making trade-offs between these different dimensions. This could be as simple as ranking each project by individual criteria and weighting the results, or a more complicated multi-attribute optimization. In any case, the scenario results can be incorporated either by the following:
1. Evaluating each investment along its existing criteria within each scenario and then comparing across scenarios; or
2. Introducing a new dimension and adding it to the existing trade-off methodology.
The first method is discussed in great deal along with an example in Sánchez-Valero (2011). It is quite quantitative and incorporates mathematical expressions for reducing the regret, increas-ing the robustness, and minimizing the risk. While this is mathematically interesting, it would essentially require each workshop sub-group to apply its own multi-attribute evaluation. This is seen as being very time consuming and not very useful in a large-scale planning process.
In the second method, we create a new dimension that is populated based on the cross-scenario results. The workshop participants evaluate and vote on the different options as described earlier in the report. Each segment is then evaluated under all of the different scenarios. The votes on individual scenarios are combined in the cross-scenario analysis to compare the usefulness of investing in each segment under the multiple FFF scenarios. This exercise results in defining each segment as of one of the following four types:
• No-brainer (NB): Should be invested in all selected scenarios.• No-regret (NR): Should be invested in some of the selected scenarios and not invested in none.• No-gainer (NG): Should not be invested in any of the selected scenarios.• Contingent (C): Should be invested in some of the selected scenarios and not invested in some
other scenarios.
This qualification of each segment is added to the multi-criterion evaluation as described below:
• The NB and NR segments represent low-risk investments and should be promoted to the fis-cal planning stage. Their cost-benefit estimation would be fairly straightforward and can be performed using traditional probabilistic decision-analysis methods. The scenarios should be considered equally probable for decision analysis.
• The NG segments also represent low-risk decisions, for not making investments. These segments should not be promoted to the fiscal planning stage.
• The C segments represent high-risk decisions and require a more extensive analysis during fiscal planning.– First, the planning agency should try to redefine the segment so that it consists of two parts:
a base part that will be a NB and NR type investment, and a C part. Fiscal planning for the NB and NR part should be conducted as mentioned above.
– The planning agency should identify real options to make the contingent part operational. A real option is a right, but not an obligation, to make an investment. A couple of examples of real options in transportation are as follows:(1) Acquiring land rights to build a four-lane road, but constructing only a two-lane road
initially, or(2) Building a bridge with wide columns to add one more level, but constructing only a
single level initially, and so forth. The agency should identify “sensors in the ground” to watch. The sensors are the environ-mental events that are used to update the likelihood of moving toward one of the scenarios, and are used to trigger the decision to exercise (or not) the real option.

integration into established Planning Process 73
In either method, the general approach is to add the results of the scenario planning workshop as one element within the decision-making process. Of course, by selecting investments one by one, we are ignoring system effects. Transportation investments are more effective if created as a “system” of transportation elements forming a corridor. Therefore, the evaluation process somehow needs to consider the value of forming a corridor. Additionally, transportation investments are budget constrained. The planning agency’s goal is to maximize the utility of its investments that satisfy this constraint. The process we use evaluates each investment on its own merit, and does not take cost into account. The costs would be considered in the fiscal planning stage where cost-benefit analyses are performed.
This section was intended to summarize a generic transportation planning process and describe a potential method to incorporate the workshop results into that process. We understand that more research is required here to better integrate the workshops into the planning process.

74
Conclusions and Future Research
This research project had two major objectives.
The first was to provide decision makers (at all levels and across all stakeholders) with a critical and comprehensive analysis of the driving forces and uncertainties that may affect the U.S. freight transportation system over the next 30 to 50 years. It is important to point out that this objective was not to develop the official version of the future for the U.S. freight transportation system to be used by all of the decision makers.
The second, and most important, was to create and disseminate a customized scenario planning methodology for these decision makers (primarily at the state DOT level) to use in creating a more flexible, adaptive, and responsive transportation management strategy on an ongoing basis. As a side benefit, this methodology was hoped to engender more productive interaction between the diverse stakeholders of the U.S. freight transportation system.
As the project progressed, a third (unofficial and out of scope) objective of the project arose. The need for integrating the scenario planning workshops into the established transportation planning process became apparent as we met and talked with different government planners at the MPO, state, and federal levels.
The remainder of this section is organized as follows. The first section recaps the analysis of future driving forces. The second section summarizes the scenario planning workshop method-ology that was developed and presents some overall insights that were gathered. The third and final section briefly summarizes a potential method of integrating the scenario planning into the traditional existing planning process.
7.1 Future Driving Forces
The research team found a number of driving forces and critical uncertainties that we feel could influence future freight flows and thus freight infrastructure investment decisions. The conclusions were reached through a series of interactive exercises, surveys, and interviews with industry experts and practitioners. The forces were further classified and analyzed based on the probability of occurrence and the level of impact. The following conclusions were reached.
• The forces that appeared to both have the most impact and the most uncertainty were the level of global trade, potential re-domestication of manufacturing, and resource availability. These are all related in that they could signal a retreat from the global trading trends of the past half-century. These factors have tremendous impact on infrastructure investments and therefore were critical in the design of the four future scenarios.
• A number of important driving forces were seen to be present now and will continue to be important in the future with limited uncertainty. While important—the lack of uncertainty
S e c t i o n 7

conclusions and Future Research 75
limited their influence in infrastructure planning. Planners should assume that these trends will only increase. These included high and volatile fuel prices, increased use of battery vehicles, widespread use of “senseable” networks, and increased use of virtual working and online retailing.
• Several driving forces had very high levels of uncertainty—as measured across the industry surveys. The driving forces with the most variability in the probability of occurring are average age of 100, zero immigration, green customer demand, and reduction in global trade. The high variability indicates a lot of disagreement over the potential outcome and while these forces might not define the different scenarios, they were included.
Out of the analysis, several key elements arose. These helped to determine which forces and uncertainties should be used to define the scenarios, which to feather in, and which to ignore.
A number of the forces (aging population and increasing urbanization) were found to be so exceptionally certain to occur that they were classified as predetermined. This means that the trends are in effect and are exceptionally unlikely to deviate. These forces were deemed to be included in all of the scenarios. The only exception to this is that the specific geographies for the increased urbanization to occur were allowed to vary between mega-cities (New York City, Chicago, etc.) and second-tier cities (Madison, Burlington, Boise).
Another group of forces had high levels of uncertainty with two (or more) potential end points. These included the level of trade (ranging from global to blocs to regions to local only); resource availability (ranging from restricted and allocated to available); and manufacturing structure (ranging from highly centralized to decentralized). These structural forces became prime candidates for defining the four potential scenarios. Juxtaposing the two or three different forces can create a matrix of potential options. So, for example, using trade and resource availability would create a 2 × 2 matrix with the cells: Global Trade & Restricted Resources, Global Trade & Available Resources, Local Trade & Restricted Resources, and Local Trade & Available Resources. These are sometimes called “framing” forces since they form the framework or backbone of the set of scenarios.
7.2 Scenario Planning Workshops
The research team developed four scenarios to be used by government planning agencies to assist in long-term freight transportation infrastructure investment decisions. Rather than being developed for a single entity or location, the scenarios were designed to be usable at any level of government across any geography, and for a wide range of potential strategic questions.
The scenarios were tested in six workshops held at different levels of government (national, state, MPO, local) and different locations. The workshop design was tested and improved throughout the six workshops. Based on its experience through running these six workshops, the team created a Scenario Planning Toolkit for use by any planning organization. The toolkit includes guidebooks to assist in the planning and facilitation of the workshops as well as brochures, supporting videos, presentation slides, and spreadsheet templates to be used in the workshop itself. The complete Scenario Planning Toolkit can be found on the accompanying DVD package or online at www.trb.org (search for “Scenario Planning for Freight Transportation Infrastructure Investment”).
Because each workshop was held in a different geography, under a different governmental organization, and evaluated different infrastructure investments, it was difficult to find any universal results. However, if we generalize to the type of infrastructure rather than a specific investment, we can glean a few insights. Specifically, any freight infrastructure (regardless of mode) can be classified into being a gateway (airport, sea port, etc.), a connector (intermodal connection, short-line rail, secondary road, etc.), or a corridor (highway, Class I rail line, etc.). We found some commonalities in the investment strategy for each of these infrastructure types.

76 Scenario Planning for Freight transportation infrastructure investment
7.2.1 Gateway Investments
Gateways were found to be useful investments in all workshops in the Global Marketplace scenario. Interestingly, of the four scenarios, Global Marketplace most closely resembles the global world we live in today. Because this is the only scenario in which gateway segments were found to be useful, it suggests that it makes sense to make investments into gateway segments only if we believe that the future will be similar to today—i.e., marked by global trade, which provides access to resources to anybody at any place in the world.
Given that the official projections about the future often consider the continuation of the existing trends, there is a real danger that infrastructure planning agencies will continue to invest in gateway segments (because they are useful segment types to invest in Global Marketplace), and these investments will turn out to be futile if the official projections of the future are wrong.
Therefore, investments in gateways must be done judiciously. The consensus of the other scenarios seems to be that there is sufficient gateway capacity for trade and further investment might not be needed.
7.2.2 Corridor Investments
Corridors were the most common segment type offered across the six workshops. They were found to be useful investments in three scenarios (Naftástique!, One World Order, and Millions of Markets) and only slightly useful in the Global Marketplace scenario. In no scenario were corridor investments considered detrimental.
One way to interpret these results is that the participants across all workshops felt that corridor segments were useful, but did not require additional investments at this time to prepare for a future similar to today.
Overall, corridors stand out as fairly robust investments. However, these investments will be a lot more valuable if the future were to be significantly different from the world dominated by global trade. One way to invest in corridors today would be to prioritize investments in those corridor segments that urgently need to be invested in even to meet today’s demands. Those investments will not only help us meet the present day needs, but also prepare us for a future quite different from today’s fairly resourceful world of global trade.
7.2.3 Connector Investments
Connector segments emerged as highly useful investments within three scenarios (Naftástique!, One World Order, and Millions of Markets) with mixed evaluations in the Global Marketplace scenario (depending on location). This suggests that connectors only in some specific regions or connectors only of specific types are useful investments to prepare for a business-as-usual future.
Connectors emerged as useful investments in those futures for which the world looks different from today’s Global Marketplace. Connectors were also found to be useful in some specific regions. Thus, one broad investment strategy for connectors would be to invest in those connector segments that urgently need to be invested in to meet today’s demands. Those investments will help meet the present needs, and help prepare for a future quite different from today’s Global Marketplace world.
7.2.4 Common Initiatives Across Workshops
The workshops also collected qualitative suggestions and recommendations on potential initiatives. By far, the most common group of initiatives was to “develop or improve inter-modal connections.” The initiatives in this category included increasing capacity of intermodal
conclusions and Future Research 77
exchanges, improving interoperability among different modes at the intermodal facilities, and development of regional logistics hubs. These initiatives are related to the “connector” type segments discussed in the previous section.
The next two most common initiatives were “creating freight-only lanes” and “making regulations and standards to facilitate freight.” The initiatives in the “freight-only lanes” category suggested creation of dedicated truck lanes on highways, separating freight transportation from passenger transportation, and even taking the passenger traffic off the highways completely through improved transit! The motivating idea behind this initiative is to create “freight-only corridors” to facilitate goods flow in the country. The “regulatory initiatives” are also motivated by the need to improve the existing freight flows by eliminating regulations that hinder them. The common themes in this group of initiatives were having a national freight policy and funding to take freight plan-ning out of regional provincial policies, developing policies to improve flow of goods across the U.S.–Mexico border, and repealing or revision of the Jones Act (Merchant Marine Act of 1920), which prohibits foreign shops from carrying cargo between U.S. ports.
The next three most commonly cited initiatives were related to improving the capacity of corridors—highways, rail lines, and waterways/ports. The initiatives related to adding new capacity (such as adding highway lanes or rail lines) or making the existing infrastructure carry more cargo (enabling double-stack transportation by rail, dredging ports, etc.). These initiatives were often mentioned in context of specific segments of the freight infrastructure (such as highway I-5, the Alameda Corridor, the Port of Savannah, etc.).
The other commonly identified initiatives included creating policies to reduce the environmental impact of freight transportation, policies related to land use, the setting aside of industrial land for creating long-haul distribution and multimodal facilities, and leveraging information technology to improve freight flows.
7.3 Integration of Workshops into Existing Planning
The scenario planning workshops were well received as separate stand-alone events used to gather input and feedback from a wide set of stakeholders with different perspectives. The two challenges that state and MPO planners face are (1) the ability to run the workshops on their own and (2) the integration of the results into the established planning process.
The Scenario Planning Toolkit was designed to address the first challenge by providing a com-plete methodology as well as training materials required to run a workshop. The complete Sce-nario Planning Toolkit can be found on the accompanying DVD package or online at www.trb.org (search for “Scenario Planning for Freight Transportation Infrastructure Investment”).
However, if a planning agency does not have sufficiently trained staff to facilitate or plan a workshop, it can always utilize a third party to assist. In fact, we found that there are many ben-efits to having a neutral third-party organization play an active role in facilitating the session. This third-party organization does not need to be the MIT research team. We recommend that the planning agency work with local university faculty and staff to identify qualified facilitators. It would also be worthwhile for the U.S.DOT to develop (or support) a training program to grow this strength across the various agencies and state DOTs.
The second challenge of integrating the workshop into an established planning process is more daunting. Each agency uses slightly (though sometimes dramatically) different methods for long-range planning of infrastructure investments. At a generic level, however, the workshops can be incorporated into the existing evaluation structure either qualitatively or quantitatively.
In the qualitative method, the suggestions and insights brought out by the workshop partici-pants would become the input to help shape the MTP or the LRSTP for an MPO or state DOT,

78 Scenario Planning for Freight transportation infrastructure investment
respectively. The planning agency would note these insights during the discussion and then incorporate them into strategic planning and/or corridor planning subjectively by adjusting the valuations of different projects.
A more quantitative method would be to generate a robustness metric based on the cross-scenario voting results for the proposed infrastructure investments. This could then be categorized and ranked. The robustness metric could then be considered as another criteria in the existing multi-attribute evaluation system. The weighting could be adjusted accordingly to reflect the importance compared to the other established factors (e.g., economic growth, freight mobility, environmental impact, economic feasibility, development impact, safety, etc.).
Of course, by selecting investments one by one, we are ignoring system effects. Transportation investments are more effective if created as a “system” of transportation elements forming a corridor. Therefore, the evaluation process somehow needs to consider the value of forming a corridor. Additionally, transportation investments are budget constrained. The planning agency’s goal is to maximize the utility of its investments that satisfy this constraint. The process we use evaluates each investment on its own merit, and does not take cost into account. The costs would be considered in the fiscal planning stage where cost-benefit analyses are performed.

79
Caplice, C., and E. Blanco. 2006. Freight Transportation Infrastructure Survey: Causes and Solutions to the Current Capacity Crisis, MIT Center for Transportation and Logistics (CTL) Working Paper Series, Cambridge, MA.
CISCO and GBN. 2010. The Evolving Internet: Driving Forces, Uncertainties, and Four Scenarios to 2025.Cousens, R., Steinberg, T., White, B., & Walton, S. (2002). Generic Scenarios: A Strategic Futures Paper. Strategic
Futures.De Jouvenel, Hugues. 2000. A Brief Methodological Guide to Scenario Building. Technological Forecasting and
Social Change 65:37–48.Deutsche Post AG. 2012. Delivering Tomorrow: Logistics 2050—A Scenario Study. Bonn, Germany: Deutsche
Post AG.De Wit, B., and Meyer, R. 2010. Strategy: Process, Content, Context. Cengage Learning EMEA Higher Education.Federal Highway Administration. 2007. The Transportation Planning Process: Key Issues. A Briefing Book for
Transportation Decisionmakers, Officials, and Staff. Retrieved 11/17/2010 from www.planning.dot.gov/documents/BriefingBook/BBook.htm.
Garvin, David A., and Lynne C. Levesque. 2006. Strategic Planning at United Parcel Service. Harvard Business School Case Study, 9-306-002.
Lempert, Robert J., Steven W. Popper, and Steven C. Bankes. 2003. Shaping the Next One Hundred Years: New Methods for Quantitative Long-Term Policy Analysis. Santa Monica, CA: RAND Corporation.
Lindgren, Matts, and Hans Bandhold. 2009. Scenario Planning: The Link Between Future and Strategy. Palgrave MacMillan.
Office of Freight Management and Operations. 2010. Freight Facts and Figures 2010, U.S. Department of Transportation, Federal Highway Administration.
Phadnis, Shardul. 2012. Influencing Managerial Cognition and Decisions Using Scenarios for Long-Range Planning. Unpublished Doctoral Dissertation, Massachusetts Institute of Technology, Cambridge, MA.
Ringland, G. 1998. Scenario planning: Managing for the Future. West Sussex, England: John Wiley & Sons.Rogers, E. 2011. Global Strategy Manager, UPS, Conversation with authors.Royal Dutch. 2005. Shell Global Scenarios to 2025—The Future Business Environment: Trends, Trade-Offs, and
Choices. Shell International Limited.Sánchez-Valero, Miguel Ángel. 2011. Merging Qualitative and Quantitative Criteria for Freight Investment Using
Scenario Planning. Unpublished Master’s Thesis, Massachusetts Institute of Technology, Cambridge, MA.Scearce, Diana, and Katherine Fulton. 2004. What if? The Art of Scenario Thinking for Non-Profits. Global Business
Network—Monitor Group. (www.gbn.com/articles/pdfs/GBN_What%20If.pdf).Schoemaker, Paul J. H. 1993. Multiple Scenario Development: Its Conceptual and Behavioral Foundation.
Strategic Management Journal, vol. 14, pp. 193–213.Schoemaker, Paul J. H. 1995. Scenario Planning: A Tool for Strategic Thinking. MIT Sloan Management Review,
vol. 36(2), pp. 25–40.Schwartz, Peter. 1991. The Art of the Long View. New York, NY: Doubleday Currency.Transportation for Communities Advancing Projects through Partnerships. 2011. Retrieved from http://www.
transportationforcommunities.com/shrpc01/.Wack, Pierre. 1985a. The Gentle Art of Re-Perceiving—Scenarios (Part 2): Uncharted Waters Ahead. Harvard
Business Review. 85(5) pp. 72–89.Wack, Pierre. 1985b. The Gentle Art of Re-Perceiving—Scenarios (Part 1): Shooting the Rapids. Harvard Business
Review. 85(6) pp. 139–150.Zegras, Chris, Joseph Sussman, and Christopher Conklin. 2004. Scenario Planning for Strategic Regional
Transportation Planning. Journal of Urban Planning and Development. March, pp. 2–13.
S e c t i o n 8
References

80
Appendices
S e c t i o n 9

Appendix A 81
Thursday, March 11, 2010 – MIT MediaLab Extension Building, Room E14-633 8:30 Registration & Continental Breakfast
9:00 Welcome and Introduction Dr. Chris Caplice, MIT Center for Transportation & Logistics
9:15 A Nation of Floridas: Aging, Changing Lifestyles & the New Future of Freight Dr. Joseph Coughlin, MIT AgeLab
10:00 Break
10:30 After the Storm: New Challenges for the Global Economy in 2010-2030 Sara Johnson, IHS Global Insight
11:15 Public Policy and Freight: History, Trends, and Issues Dr. David Luberoff, Harvard University Kennedy School of Government
12:00 Lunch
1:00 Transporting Bits and Atoms Professor Neil Gershenfeld, MIT Center for Bits and Atoms
1:45 The New Age of Sensing Professor Sanjay Sarma, MIT Mechanical Engineering
2:30 Break
3:00 Wired for Innovation: How IT is Reshaping the Economy Professor Erik Brynjolfsson, MIT Sloan School of Management
3:45 Measuring and Managing Sustainability Professor Jonathan Johnson, The Sustainability Consortium
4:30 Wrap Up Dr. Chris Caplice
5:00 Adjourn
5:30 Social and Light Hors d’Oeuvres
Friday, March 12, 2010 – MIT Engineering Systems Division Building, Room E40-298 8:30 Continental Breakfast
9:00 Synthesis of Thursday’s Expert Sessions Dr. Chris Caplice
9:30 Brainstorming Session: Key Driving Forces & Uncertainties All attendees and MIT facilitators
10:30 Break
10:45 Translation and Mapping to Freight Flows All attendees and MIT facilitators
11:30 Wrap Up and Preview of Next Steps Dr. Chris Caplice
12:00 Lunch

82 Scenario Planning for Freight Transportation Infrastructure Investment

Appendix A 83

84 Scenario Planning for Freight Transportation Infrastructure Investment

Appendix B 85

86 Scenario Planning for Freight transportation infrastructure investment
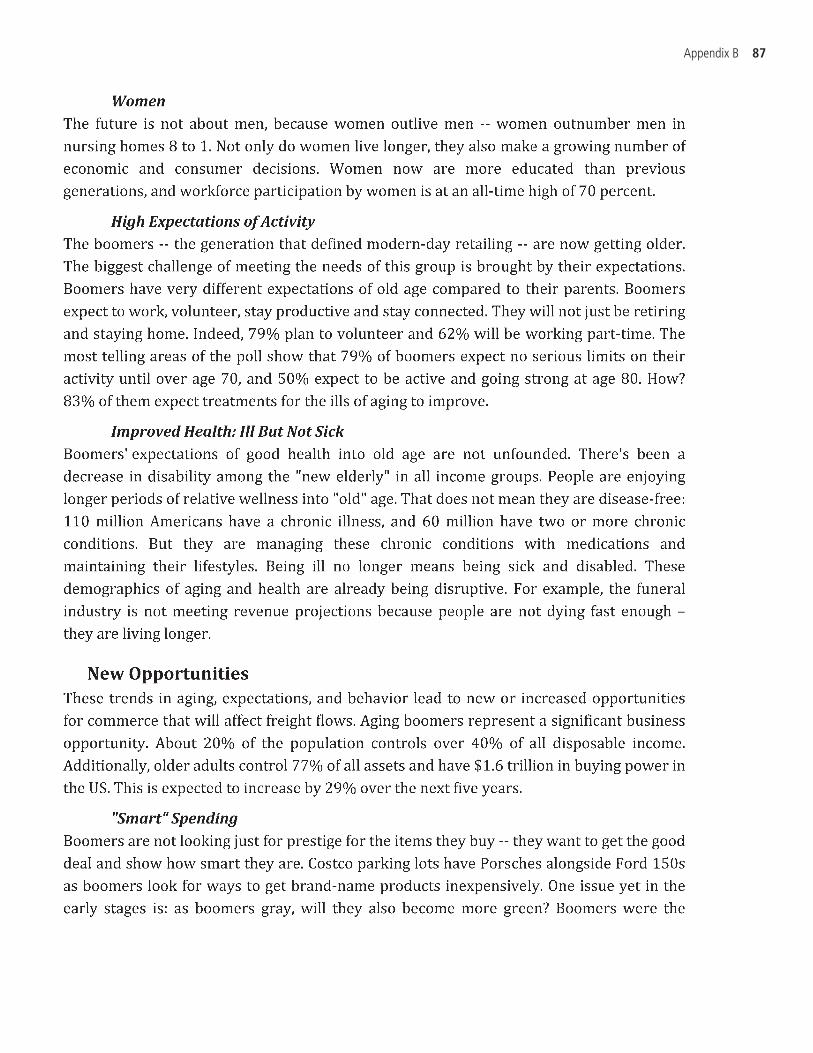
Appendix B 87
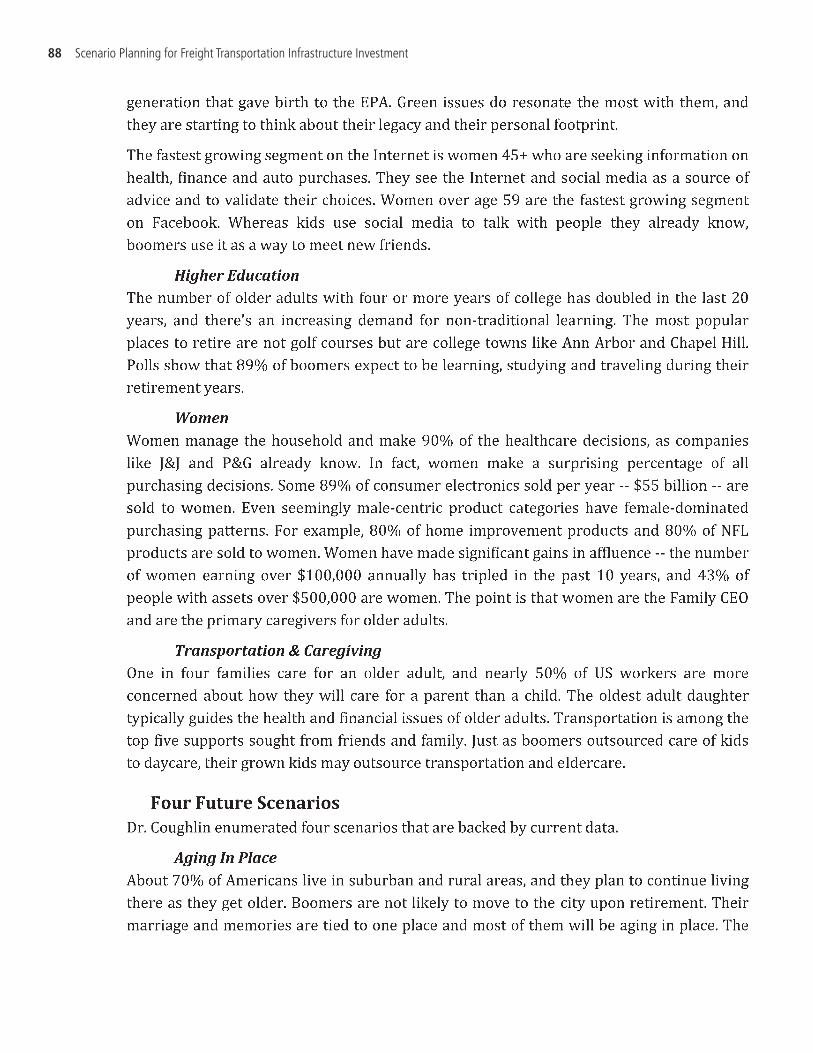
88 Scenario Planning for Freight transportation infrastructure investment

Appendix B 89

90 Scenario Planning for Freight transportation infrastructure investment

Appendix B 91

92 Scenario Planning for Freight transportation infrastructure investment

Appendix B 93

94 Scenario Planning for Freight transportation infrastructure investment

Appendix B 95
96 Scenario Planning for Freight transportation infrastructure investment

Appendix B 97

98 Scenario Planning for Freight transportation infrastructure investment

Appendix B 99

100 Scenario Planning for Freight transportation infrastructure investment

Appendix B 101

102 Scenario Planning for Freight transportation infrastructure investment

Appendix B 103

104 Scenario Planning for Freight transportation infrastructure investment

Appendix B 105

106 Scenario Planning for Freight transportation infrastructure investment

Appendix B 107

108 Scenario Planning for Freight transportation infrastructure investment

Appendix B 109

110 Scenario Planning for Freight transportation infrastructure investment

Appendix B 111

112 Scenario Planning for Freight transportation infrastructure investment

Appendix B 113

114 Scenario Planning for Freight transportation infrastructure investment

Appendix B 115
116 Scenario Planning for Freight transportation infrastructure investment

Appendix B 117

118 Scenario Planning for Freight transportation infrastructure investment

Appendix B 119

120 Scenario Planning for Freight transportation infrastructure investment

Appendix c 121

122 Scenario Planning for Freight transportation infrastructure investment

Appendix c 123

124 Scenario Planning for Freight transportation infrastructure investment

Appendix c 125

126 Scenario Planning for Freight transportation infrastructure investment
Appendix D 127

128 Scenario Planning for Freight transportation infrastructure investment

Appendix e 129
time from DVRPC MNDOT WSDOT POLB GDOT USDOT7:458:008:158:30 Welcome Welcome Welcome8:459:009:159:30 FAB Welcome Segments9:45 -break- -break- -break-10:00 -break-10:15 Segments10:30 -break- Segments10:45 -break-11:0011:1511:3011:4512:0012:1512:3012:4513:0013:1513:3013:4514:0014:1514:3014:4515:0015:1515:3015:4516:00 Wrap-up16:15 Wrap up16:3016:45
Wrap up
Registration
Segments
Intro to ScenPlan
Interactive workshop
Lunch
Reveal, Team
debrief
Discussion
Registration
Intro to ScenPlan
Interactive workshop
Lunch
Wrap up
Reveal, Team
debrief
Cross-scenario
comparisonCross-scenario
comparison
Technical tour of POLB
Registration
Intro to ScenPlan
Interactive workshop
Lunch
Reveal, Team
debrief
Cross-scenario
comparison
Registration
Intro to ScenPlan
Interactive workshop
Lunch
Reveal, Team
debrief
Lunch
Reveal, Team
debrief, Discussion
Wrap up
Registration
Intro to ScenPlan
Interactive workshop
Registration
Welcome
Intro to ScenPlan
Segments
Interactive workshop
Lunch; Workshop summary

130 Scenario Planning for Freight transportation infrastructure investment
PHASE / TASKS TIMEBefore star�ng the workshop
• DVRPC will have 2-3 note-takers per room.
• Meet with the note-takers and introduce yourself.
• Tell the note-takers the rules of the game:
o You (the facilitator) will do all the facilita�on and talking.
o The note-takers will NOT interact with the group at all.
o Emphasize to them that one of the most important outputs
of the workshop are the insights of the par�cipants. Tell
them, your job is to get the par�cipants talking and their
(note-takers’) job is to capture all of those insights. Tell them
it can be difficult and they need to listen carefully.
o Briefly describe the plan for the breakout session.
o Tell them up front that they will have to listen very closely
especially a�er the video, a�er the par�cipants place bets
on the map.
o Suggest the note takers to divide the par�cipants among
themselves (e.g. first six si�ng up front on the le� side of
the table, etc). They will be primarily responsible to capture
what this group of people said.
• Tell the note-takers how to take notes:
o Write name or ini�als of the person and gist of what s/he is
saying.
o Ideally capture what is said verba�m.
9:45 – 10:00

Appendix e 131
PHASE / TASKS TIMEIntroduc�on
• Introduce yourself (name and associa�on)
• Ask note takers to introduce themselves. Inform the group that one
of the most important outputs of this workshop is the par�cipants’
insights and the note takers will be capturing those notes.
• Tell which scenario this group is going to discuss and ask everyone
to make sure they are in the right room
10:00 – 10:05
Immersion in the scenario
• Inform that the audience needs to “live” in the <scenario name> in
year 2037 for next 40 minutes. “I want you to describe the world in
<scenario name>”
• Ask if they have read the scenario. (Some heads will nod). Ask
par�cipants nodding heads to describe the key facets of the
scenario. Go around the room and ask different people to describe
the world. There are two goals: (1) get people talking and (2) start
highligh�ng important aspects of the scenario.
• Before workshop: Prepare a list of important facets of your
scenario.
During “Immersion…”: mentally cross items off this list as people
bring them out.
• A�er about 10 minutes, the audience should have hit most, if not
all, of the major points.
• Tell: “Now that we understand the world we are living in, let’s check
our news…” Play the video.
• Ask what aspects of “our world” they saw in the video. The goal
here is to reemphasize the key points.
• If the par�cipants have missed any key point, ask them “what do
you think about…?”
10:05 – 10:35
(end by 10:20)
(end by 10:25)
(end by 10:30)
(end by 10:35)
Scenario implica�ons
• Ask: “So, how does the freight environment of the US and the
10:35 – 10:55

132 Scenario Planning for Freight transportation infrastructure investment
PHASE / TASKS TIMEDelaware Valley look like in this scenario?” (There are no
right/wrong answers here. We are looking for individual insights.
There are three goals: Make sure that (1) everyone gets to
contribute, (2) no one is domina ng the group, and (3) people are
not talking nonsense.)
• The group should be talking about some of the following things
o Macro freight environment (global vs. local)
o For the freight (i) origina ng from, (ii) coming into and (iii)
passing through Delaware Valley region: volume, value
density, origin, des na on, and mode.
o Change in the preference/demand for different modes
(roads, rail, water, air)
o Store-delivery versus home-delivery
o Rela ve prices and availability of various energy sources;
socio-poli cal preferences for energy sources
• This discussion should begin to create a sense of which routes and
modes will experience higher demand, and which ones won’t.
Vote on candidate investment bundles
• Inform the par cipants that now we want to understand which
infrastructure investment bundles we want to invest in TODAY to
prepare for the scenario in YEAR 2037 we have just described.
• Place the big map of candidate investments on the table (if not
already there). Inform the group that each one has to evaluate the
a�rac veness of eight investment bundles described in the
morning. Tell them the map on the table shows those investment
bundles. Give them a minute to view the map. Also inform them
that each one has a copy of this map in their packet.
• Give each par cipant a bag containing chips. Tell the group that we
are going to use chips to indicate which projects we want to invest
in NOW to be prepared for the world.
• Tell them what the chips mean:
10:55 – 11:25
(end by 11:00)
(end by 11:05)

Appendix e 133
PHASE / TASKS TIMEo Tell them they have 1 chip (color?) worth 25 points, 5 chips
worth 10 points each, and 5 chips worth 5 points each. Thus they have 100 points. These chips are used to indicate rela�ve importance of the investment bundles DVRPC should invest in today to prepare for 2040.
o They also have 3 black chips. One chip indicates which bundles to not invest in.
• Ask everyone to pull out “Individual Investment Decision” form. Ask them to write down individually how they will assign the chips to each investment. Give the following instruc�ons:
o Each has at most 100 points to assign to bundles to invest in (one may use less than 100)
o Each one has to choose at least one bundle and at most threebundles to NOT invest in.
o They cannot assign investment points to a bundle and say do not invest (but okay if group does that)
• Give about 3-5 minutes to think and write.
• Once everyone seems to have wri�en their answers, ask them to place their chips on the map as per their votes on the Individual Investment Decision form:
o
by color
• Facilitate the discussion based on the votes. The goal of the discussion is to capture the insights behind the vo�ng. Here are some pointers for which investment bundles to discuss:
o Bundles with both “Invest” and “Do not invest” chips
o Bundles with maximum “Invest” points
o Bundles with maximum “Do not invest” chips
o Bundles that have no votes at all – either “Invest” or “Do not invest”
(end by 11:07)
(end by 11:12)
(end by 11:17)
(end by 11:30)
Ask the par�cipants to create stacks for each investment

134 Scenario Planning for Freight transportation infrastructure investment
PHASE / TASKS TIMEo Bundles that have very li�le chips
Discuss any “Other” projects
• Ask if there are any “Other” bundles to invest in.
• Ask par�cipants if they have suggested any other projects, ask them to describe the investment. Ask if any other par�cipants would vote on them.
11:30 – 11:35
Change in vote based on group discussion
• Ask the par�cipants if they would like to change the vote based on the discussion. If they do, let them and have discussion.
• Ask them to circle any votes they changed on the form and write their new vote next to it – without erasing or crossing out the old vote.
11:35 – 11:48
Wrap up
• Ask if the par�cipants have any comments before they break.
• Ask the group to submit the Individual Investment Decision form to you.
• Break the group for a working lunch and scenario debrief in the main conference room star�ng at noon.
11:48 – 11:50
A�er the workshop
• Write the number of chips of each of four types on the investment map on the table.
• Ask the note-takers to give three to five important insights they captured.
• Give the map with the number of votes to the main facilitator for the workshop. From the insights given by note-takers and the ones you captured, find top five or six. Pass these to the main facilitator to include in the presenta�on.
• Main facilitator will have 10 minutes to enter data and prepare the presenta�on.
11:50 – 12:15
(end by 12:00)
(end by 12:10)
(end by 12:15)
(end by 12:25)

Appendix e 135
Time Ac�vity
8:00 – 8:30 Registra�on and Sign In
8:30 – 8:45 Welcome and Project Overview (Minnesota DOT)
8:45 – 9:15 Introduc�on to the Scenario Planning (Dr. Chris Caplice)
9:15 – 9:40 Overview of Freight Ac�on Bundles (Minnesota DOT)
9:40 – 9:50 Direc�ons for Exercise (Dr. Chris Caplice)
9:50 – 10:00 Break and report to breakout group
10:00 – 12:15
Interactiveworkshop
Scenario immersion (~30 minutes)
• Inform that the group needs to “live” in the <scenario name> in year 2037 for next 2 hours.
• Ask if they have read the scenario. (Some heads will nod). Ask par�cipants nodding heads to describe the key facets of the scenario. Go around the room and ask different people to describe the world. There are two goals: (1) get people talking and (2) start highligh�ng key aspects of the scenario.
• Mentally cross items off the list of important facets of your scenario as people bring them out. A�er about 10 minutes, the audience should have hit most, if not all, of the major points.
• Tell: “Now that we understand the world we are living in, let’s check our news…” Play the video.
• Ask what aspects of “our world” they saw in the video. The goal here is to reemphasize the key points.
• If the par�cipants have missed any key point, ask them “what do you think about…?”
Scenario implica�ons (~15 minutes)
• Ask: “How does the freight environment of the US and Minnesota look like in this scenario?” (No right/wrong answers here. We are looking for individual insights. There are three goals: (1) everyone gets to

136 Scenario Planning for Freight transportation infrastructure investment
Time Ac�vity
contribute, (2) no one is domina ng the group, and (3) people are not talking nonsense
• The group should be talking about some of the following things
o Macro freight environment (global vs. local)
o For the freight (i) origina ng from, (ii) coming into and (iii) passing through Minn: volume, value density, origin, des na on, and mode.
o Change in the preference for different modes (roads, rail, water, air)
o Store-delivery versus home-delivery
o Rela ve prices and availability of various energy sources; socio-poli cal preferences for energy sources
• Ask if the implica ons are any different within the ring, outside the ring but inside the county, and outside the county.
Vo�ng on FAB: (~15 minutes)
• Hand out printout of the FAB to all par cipants. Ask if everyone understands the FABs. (If there are any ques ons, Minn DOT reps will be in each group.)
• Assign 100 points to five FABs, represen ng the rela ve important of each FAB in a given scenario. (There are no vetoes)
• Individuals vote on their vote sheet and place chips on a large board • A�er individual vo ng, ask if anyone wants to change the vote • Tally the votes for each FAB
*Optional break (discre on of the facilitator while tallying the votes)
Iden�fy three ini�a�ves in each FAB (~65 minutes)
• Start with the FAB with the most votes (break any es randomly) • Nominal group brainstorm with s cky notes and easel pad (~3 min per
FAB)• Real group brainstorm based on s cky notes; summarize and iden fy
three key ini a ves for the FAB (~10 min per FAB) • Repeat for all FABs
Real group brainstorm to iden�fy sensors in the ground for the scenario (5 min)

Appendix e 137
Time Ac�vity
Appoint two representa�ves to present the group’s results (one each from private and public sectors)
12:15 – 13:00 Lunch
(During lunch, MIT facilitators summarize the results for all groups for cross-scenario analysis)
13:00 – 14:30
Plenary session
Presenta�on of results for individual scenario (~10-12 min/group x 4 = 45 minutes)
• Ranking of FAB and brief ra�onale • Three ini�a�ves within each FAB • Sensors in the ground
Cross-scenario discussion (~45 minutes), led by CTL facilitators
• Show ranking of FABs across four scenarios (one slide) • For each FAB (star�ng with one with maximum total points in all four
groups)o Present all ini�a�ves iden�fied by the par�cipants from four
groupso Iden�fy the ini�a�ves common across more than one scenario.
For each such ini�a�ve Ask the groups that iden�fied them, why they found it useful
▪ Ask the group(s) that did not iden�fy them, if they are useful, hur�ul, or benign (neither useful nor hur�ul) in their scenario
o For ini�a�ves iden�fied in only one scenario, ask if they are useful, hur�ul, or benign each of the remaining scenarios
• Present list of sensors iden�fied by each scenario group
14:30 – 14:45 Wrap up
▪
●�▪▪����

138 Scenario Planning for Freight transportation infrastructure investment
Time Ac�vity
8:00 – 8:30 Registra�on and Sign In
8:30 – 8:50 Welcome and Project Overview (Washington DOT, WSDOT)
8:50 – 9:00 Overview of Freight Infrastructure Segments (WSDOT)
9:00 – 9:45 Introduc�on to the Scenario Planning (Dr. Chris Caplice)
9:45 – 10:00 Break and report to breakout group
10:00 – 12:30
Interactiveworkshop
Scenario immersion (~30 minutes)
• Tell the group that for next 2 hours they will be living in the <scenario name> world and that it is 2037. Ask if they have read the scenario. (Some heads will nod).
• Ask participants to describe the world. Go around the room and ask different people to. The two goals are: (1) get people talking and (2) start highligh�ng key aspects/facets of that scenario.
• Mentally cross items off the list of important facets of your scenario as people bring them out. A�er about 10 minutes, the audience should have hit most, if not all, of the major points.
• Say, “Now that we understand the world we are living in, let’s check our news…” Play the video.
• Ask how the newscast changed or reinforced their thoughts on their scenario. The goal here is to reemphasize the key points.
• If the par�cipants have missed any key point, ask them “what do you think about…?”
Scenario implications (~15 minutes)
• Ask: “How does the freight environment of the US and Washington state look like in this scenario?” (No right/wrong answers here. We are looking for individual insights. There are three goals: (1) everyone gets to contribute, (2) no one is domina�ng the group, and (3) people are not talking nonsense

Appendix e 139
Time Ac�vity
• The group should be talking about some of the following things
o Macro freight environment (global vs. local)
o For the freight (i) origina�ng from, (ii) coming into and (iii) passing through Washington state: volume, value density, origin, des�na�on, and mode.
o Change in the preference for different modes (roads, rail, water, air)
o Rela�ve prices and availability of various energy sources; socio-poli�cal preferences for energy sources
Individual vo�ng: (~15 minutes)
• Ask “Does everyone understand the Freight Infrastructure Segments?”Make sure everyone has the maps. (If there are any ques�ons, WSDOT reps will be in each group.)
• Say, “Please pull out and fill in your Individual Investment Decision forms.” They will first vote privately (on paper) and then publically with chips. The rules:
o Posi�ve Votes - Assign 100 points across the 16 segments (in mul�ples of 5), represen�ng the rela�ve importance of each segment in the given scenario. More points = more importance
o Veto Votes – they must veto at least one and up to three segments.
o One cannot assign investment points and veto the same segment
• A�er 3-5 minutes to think and write, tell them to place chips on the board
• Tally the votes for each segment Group discussion of votes and real-group vo�ng: (~30 minutes)
• Facilitate the discussion based on the votes. Ask “Why did you vote this way?” or “What was your thinking for these segments?”
• Priori�ze the segment discussion by the more controversial ones first:
o Segments with both “Invest” and “Veto” chips

140 Scenario Planning for Freight transportation infrastructure investment
Time Ac�vity
o Segments with maximum “Invest” points
o Segments with maximum “Veto” chips
o Segments with no or very few chips (either “Invest” or “Veto” chips)
• Ask, “Does anyone wants to change their vote?” Allow people to change votes accordingly. Change chips and display the final score.
Post-voting survey and brief break after survey (~15 minutes)
• You will hand out a paper survey and ask them take a short break while they fill it out.
• Also, tell them that aer the break, “You will be asked to combine these individual segments into Freight Corridors. Start thinking how you want to do this.”
Forming Freight Corridors (~15 minutes)
• Ask “Now let's try to form a primary corridor for the State of Washington.” Have them iden�fy which of the 16 segments to bundle into a con�guous corridor
• A corridor is a mul�-modal collec�on of segments put together as a “transporta�on system.” Therefore, the individual segments may or may not appear in the final corridor despite its earlier vote.
• Pick one of the maps and draw the corridor on it. Iden�fying Corridor Ini�a�ves (~30 minutes)
• Ask “Now let's try to iden�fy some ini�a�ves that WSDOT should take to improve this Freight Corridor.” Have them brainstorm silently with s�cky pads – one ini�a�ve per – and put them on the easels.
• Aer 5-10 minutes ask, “I need two volunteers to report out to the larger group.” Have the group brainstorm out loud to consolidate and iden�fy up to five ini�a�ves for this corridor.
12:30 – 13:15 Lunch (Show scenario videos)
13:15 – 14:30
Plenarysession
Cross-scenario summary (10 minutes)
• Overview of all Scenarios – level se�ng • Show a few slides with invest & veto results for all 16 segments across the
scenarios

Appendix e 141
Time Ac�vity
Presenta�on of corridors and ini�a�ves by scenario (~10 min. x 4 = 40 minutes)
• Each scenario team will describe their corridors (including segments included and not) and the reason for the choice
• Each scenario team will then describe the five ini�a�ves they iden�fied Cross-scenario discussion of ini�a�ves (20 minutes)
• Discussion facilitated by CTL
14:30 – 14:45 Wrap up
Time Ac�vity
9:00 – 9:30 Registra�on and Sign In
9:30 – 10:30 Welcome, Project Overview, Overview of Freight Infrastructure Segments, Introduc�on to the Scenario Planning (Dr. Chris Caplice)
10:30 – 10:45 Break and report to breakout group
10:45 – 13:00
Interactiveworkshop
Scenario immersion (~35 minutes)
• Tell the group that for the next 45 minutes they will be living in the <scenario name> world in year 2037. Ask if they have read the scenario. (Some heads will nod).
• Ask participants to describe the world. Go around the room and ask different people. The two goals are: (1) get people talking and (2) start highligh�ng key aspects/facets of that scenario.
• Mentally cross items off the list of important facets of your scenario as people bring them out. A�er about 10 minutes, the audience should have hit most, if not all, of the major points.
• Say, “Now that we understand the world we are living in, let’s check our news…” Play the video.
• Ask how the newscast changed or reinforced their thoughts on their scenario. The goal here is to reemphasize the key points.

142 Scenario Planning for Freight transportation infrastructure investment
Time Ac�vity
• If the par�cipants have missed any key point, ask them “what do you think about…?”
Scenario implications (~20 minutes)
• Ask: “How does the import/export environment of the US through Southern California look like in this scenario?” (No right/wrong answers here. We are looking for individual insights. There are three goals: (1) everyone gets to contribute, (2) no one is domina�ng the group, and (3) people are not talking nonsense
• The group should be talking about some of the following things
o Macro freight environment (global vs. local)
o For the freight (i) origina�ng from, (ii) coming into and (iii) passing through Southern California: volume, value density, origin, des�na�on, and mode.
o Change in the preference for different modes (roads, rail, water, air)
o Rela�ve prices and availability of various energy sources; socio-poli�cal preferences for energy sources.
Individual vo�ng: (~20 minutes)
• Ask “Pull out the le�er-sized paper in your folder called “Freight Infrastructure Segments.” This shows 15 segments chosen for today’s exercise.” Make sure everyone has the maps.
• Say, “Now, come back to Apr 13, 2011. Think about which of these segments we need to invest in TODAY to be ready for <scenario name> in year 2040.” Give instruc�ons to complete the Individual Investment Decision forms. The par�cipants first vote privately on these forms and then publically with chips. Explain the following rules:
o Posi�ve Votes - Assign 100 points across the 15 segments (in mul�ples of 5), represen�ng the rela�ve importance of each segment in the given scenario. More points = more importance. The number of posi�ve votes assigned to each segment refers to the importance of the segment – not budget!
o Veto Votes – Each par�cipant must veto at least one and up to three segments.

Appendix e 143
Time Ac�vity
o One cannot assign investment points and veto the same segment
• A�er about 5 minutes to think and write, tell them to place chips on the board
• Tally the votes for each segment Brief break (15 minutes) – count the chips
• Display the group’s vote to the en�re group. Everyone should be able to see the number of invest points and vetoes assigned to each segment.
Group discussion of votes and real-group vo�ng: (~20 minutes)
• Facilitate the discussion based on the votes. The goal is to understand the ra�onale behind the investment decisions made by the individuals.
• Priori�ze the segment discussion by the interesting segments, in the following order:
o Segments with both “Invest” and “Veto” chips
o Segments with maximum “Invest” points
o Segments with maximum “Veto” chips
o Segments with no or very few chips (either “Invest” or “Veto” chips)
• Ask, “Does anyone wants to change their vote”. Allow people to change votes accordingly. Change chips and display the final score.
Iden�fying ini�a�ves (~35 minutes)
• Ask “Now let's try to iden�fy some ini�a�ves we need to take TODAY to prepare for this scenario.” Have the group brainstorm nominally with s�cky pads – one ini�a�ve per s�cky note. Ask the individuals to put the s�cky notes on the poster pad.
• A�er 5-10 minutes ask, “I need two volunteers to report out to the larger group.” Have the group brainstorm out loud to consolidate and iden�fy up to five ini�a�ves for this corridor.
Post-voting survey (~25 minutes)
• Thank the group for par�cipa�ng in the exercise. Inform them that other two groups are engaged in a similar exercise. We will get to see the other

144 Scenario Planning for Freight transportation infrastructure investment
Time Ac�vity
scenarios a�er lunch. Ask them what they thought about the scenario and the exercise. This is a 5-10 minute chitchat to bring them out of the scenario.
• Hand out the ques�onnaire. Say: “Now you have seen one scenario. This may or may not have changed the way you think about the future. What I would like you to do next is to complete the ques onnaire I am passing out. This is the same ques onnaire that you completed online before the workshop. While filling this ques onnaire, don’t think about the scenario we lived in anymore… But, take a few minutes to think about the kind of world we may live in in year 2040… You may or may not believe in the scenario. Just answer the ques ons based on what comes to your mind easily.”
Thank the group for comple ng the ques onnaire.
13:00 – 14:00 Lunch
14:00 – 15:30
Plenarysession
Cross-scenario summary (30 minutes)
• Have everyone sit with his or her scenario teams. • Show scenario videos for all three scenarios used • Overview of all Scenarios – level se�ng
Presenta�on of ini�a�ves by scenario (~10 min. x 3 = 30 minutes)
• Each scenario team will describe their corridors (including segments includes and not) and the reason for the choice
• Each scenario team will then describe the five ini a ves they iden fied • Encourage cross-discussion and ques oning from other teams
Cross-scenario discussion of ini�a�ves (30 minutes)
• Show a few slides with invest & veto results for all segments across the scenarios
• Discuss robust and con ngent investments • Have individuals vote for the segments (pick most robust) – vote by hand • Make a group vote for the priority segments • Show the Tech Savior video • Ask group how they would change their vo ng
15:30 – 16:00 Wrap up

Appendix e 145
Time Ac�vity
9:30 – 10:00 Registra�on and Sign In
10:00 – 10:45 Welcome, Project Overview, Overview of Freight Infrastructure Segments, Introduc�on to the Scenario Planning (Dr. Chris Caplice)
10:45 – 11:00 Break and report to breakout group rooms
11:00 – 13:15
Interactiveworkshop
end @11:30
Scenario immersion (~30 minutes) MINDSTATE 1(Future/Known)
• Tell the group “For the next 45 minutes they will be living in the <scenario name> world in year 2037”. Ask “Have you read the scenario?”
• Ask par�cipants to “describe the world”. Go around the room and ask different people. The two goals are: (1) get people talking and (2) start highligh�ng key aspects/facets of that scenario.
• Mentally cross items off the list of important facets of your scenario as people bring them out. A�er about 10 minutes, the audience should have hit most of the major points.
• Say, “Now that we understand the world we are living in, let’s check our news…” Play the video.
• A�er the video, ask “How has the newscast changed or reinforced your thoughts on the scenario?” The goal here is to reemphasize the key points.
• If the par�cipants have missed any key point, ask them “what do you think about…?”
Scenario implications (~15 minutes) MINDSTATE 1(Future/Known)
• Ask: “How does the freight environment for the State of Georgia and the Southeastern U.S. look like in this scenario?” (No right/wrong answers here. We are looking for individual insights. There are three goals: (1) everyone gets to contribute, (2) no one is domina�ng the group, and (3) people are not talking nonsense
• The group should be talking about some of the following things
o Macro freight environment (global vs. local)
o For the freight (i) origina�ng from, (ii) coming into and (iii) passing

146 Scenario Planning for Freight transportation infrastructure investment
Time Ac�vity
end @ 11:45
take break @ ~ 12:05
start up by 12:15
end @12:35
through Georgia state: volume, value density, origin, des�na�on, and mode.
o Change in the preference for different modes (roads, rail, water, air)
o Rela�ve prices and availability of various energy sources; socio-poli�cal preferences for energy sources
Individual vo�ng: (~20 minutes) MINDSTATE 2(Now/Known)
• Ask “Pull out the le�er-sized paper in your folder called “Freight Infrastructure Segments”. This shows 13 segments chosen for today’s exercise.” Make sure everyone has the maps.
• Say, “Now, come back to May 9, 2011. Think about which of these segments we need to invest in TODAY to be ready for <scenario name> in year 2037.” Give instruc�ons to complete the Individual Investment Decision forms. The par�cipants first vote privately on these forms and then publically with chips. Explain the following rules:
o Posi�ve Votes - Assign 100 points across the 13 segments (in mul�ples of 5), represen�ng the rela�ve importance of each segment in the given scenario. More points = more importance. The number of posi�ve votes assigned to each segment refers to the importance of the segment – not budget!
o Veto Votes – Each par�cipant must veto at least one and up to three segments.
o One cannot assign investment points and veto the same segment
• A�er about 5 minutes to think and write, tell them to place chips on the board
Brief break (10 minutes) – count the chips
• Display the group’s vote to the en�re group. Everyone should be able to see the number of invest points and vetoes assigned to each segment.
Group discussion and Consensus: (~20 minutes) MINDSTATE 2(Now/Known)
• Facilitate the discussion based on the votes. The goal is to understand the ra�onale behind the investment decisions made by the individuals.

Appendix e 147
Time Ac�vity
End No Later than 13:15
• Priori�ze the segment discussion by the interesting segments, in the following order:
o Segments with both “Invest” and “Veto” chips
o Segments with maximum “Invest” points
o Segments with maximum “Veto” chips
o Segments with no or very few chips (either “Invest” or “Veto” chips)
• Ask, “Does anyone want to change their vote”. Allow people to change votes accordingly. Change chips and display the final score.
Iden�fying ini�a�ves (~35 minutes) MINDSTATE 2(Now/Known)
• Ask “Now let's try to iden�fy some ac�onable ini�a�ves we need to take TODAY to prepare for this scenario.” Have the group brainstorm nominally with s�cky pads – one ini�a�ve per s�cky note. Ask the individuals to put the s�cky notes on the poster pad.
• A�er 5-10 minutes ask, “I need two volunteers to report out to the larger group.” Have the group brainstorm out loud to consolidate and iden�fy up to five ini�a�ves for the scenario.
Distribute ques�onnaire and break for lunch MINDSTATE 3(Now/Unknown)
• Thank the group for par�cipa�ng in the exercise. Hand out the ques�onnaire.
• Say: “Now you have seen one scenario. What I would like you to do next is to complete the ques�onnaire I am passing out. Turn it in before we start the next session after lunch….
• This is the same ques�onnaire that you completed online before the workshop. While filling this ques�onnaire, assume the �me is NOW and that the future is UNCERTAIN - it will not necessarily follow your scenario.
• Also please write your name. Your responses are completely confidential.”
13:15 – 14:15 Lunch
14:15 – 16:00 Ask everyone to turn in their ques�onnaires.
end @13:10

148 Scenario Planning for Freight transportation infrastructure investment
Time Ac�vity
end @14:45
end @15:15
end @16:00
Cross-scenario summary: Reveal videos of all scenarios used (30 minutes)
• Have everyone sit with his or her scenario teams. Show scenario videos for all three scenarios used. Provide short overview of all Scenarios – level se�ng
Presenta�on of results and ini�a�ves by scenario (~10 min. x 3 = 30 minutes)
• Each scenario team will then describe the five ini�a�ves they iden�fied • Encourage cross-discussion and ques�oning from other teams
Cross-scenario discussion of ini�a�ves (45 minutes)
• Show the slide with invest & veto results for all segments across the scenarios
• Discuss robust and con�ngent investments • Ask “Please now pick one segment that is the most cri�cal for the
future”• Show the Global Marketplace video and ask “How would you change
Your votes?”
16:00 – 16:30 Wrap up
Time Ac�vity
8:00 – 8:30 Registra�on and Sign In
8:30 – 8:45 Welcome & Introduc�ons (Tony Furst, Polly Tro�enberg, John Horsley)
8:45 – 9:45 Introduc�on to the Scenario Planning & Freight Segments (Dr. Chris Caplice)
9:45 – 10:00 Break and report to breakout group rooms
10:00 – 12:30
Interactiveworkshop
Scenario immersion (~30 minutes) MINDSTATE 1(Future/Known)
• Tell the group “For the next 45 minutes they will be living in the <scenario name> world in year 2037”. Ask “Have you read the scenario?”
• Ask par�cipants to “describe the world”. Go around the room and ask different people. The two goals are: (1) get people talking and (2) start highligh�ng key aspects/facets of that scenario.

Appendix e 149
Time Ac�vity
end @10:30
end @ 10:45
• Mentally cross items off the list of important facets of your scenario as people bring them out. A�er about 10 minutes, the audience should have hit most of the major points.
• Say, “Now that we understand the world we are living in, let’s check our news…” Play the video.
• A�er the video, ask “How has the newscast changed or reinforced your thoughts on the scenario?” The goal here is to reemphasize the key points.
• If the par�cipants have missed any key point, ask them “what do you think about…?”
Scenario implications (~15 minutes) MINDSTATE 1(Future/Known)
• Ask: “How does the freight environment for the United States look like in this scenario?” (No right/wrong answers here. We are looking for individual insights. There are three goals: (1) everyone gets to contribute, (2) no one is domina�ng the group, and (3) people are not talking nonsense
• The group should be talking about some of the following things
o Macro freight environment (global vs. local)
o For the freight (i) origina�ng from, (ii) coming into and (iii) passing through US: volume, value density, origin, des�na�on,and mode.
o Change in the preference for different modes (roads, rail, water, air)
o Rela�ve prices and availability of various energy sources; socio-poli�cal preferences for energy sources
Q1 Priority of Components: (~15 minutes) MINDSTATE 2(Now/Known)
• Ask “Pull out the le�er-sized paper in your folder called “Infrastructure Components”. This shows the 12 infrastructure components chosen for today’s exercise.”
• Say, “Now, come back to JUNE 28th, 2011. Where should we priori�ze federal funds NOW given that the future described in your scenario in 2037 is going to occur?”

150 Scenario Planning for Freight transportation infrastructure investment
Time Ac�vity
take break @ ~ 11:00
start up by 11:10
• Tell them, “Remember, this is for federal funds (including the US Army Corps of Engineers). You should not feel constrained about silo-ed funding.”
• Hand out the Q1 Investment Programs individual vo�ng sheets and put the 11x17 Group Vo�ng sheets on a center table.
• Ask them to first vote privately on these forms and then publically with chips.
• Hand out the chips – each person gets 12 colored and three black chips.
• Explain the following rules:
o Posi�ve Votes – Place your 12 chips across the 12 components to represent the rela�ve importance of each component in the given scenario. More points = more importance. The number of posi�ve votes assigned to each segment refers to the importance of the segment – not budget! Colors of chips are irrelevant.
o Veto Votes – Each par�cipant must veto at least one and up to three components.
o One cannot assign investment points and veto the same segment
• A�er about 5 minutes to think and write, tell them to place chips on the board
Brief break (10 minutes) – count the chips
• Write the number of chips and vetoes on the chart. Display the group’s vote to the en�re group. Everyone should be able to see the number of invest points and vetoes assigned to each segment.
Group discussion and Consensus: (~15 minutes) MINDSTATE 2(Now/Known)
• Facilitate the discussion based on the votes. The goal is to understand the ra�onale behind the investment decisions made by the individuals.
• Priori�ze the segment discussion by the interesting segments, in the following order:

Appendix e 151
Time Ac�vity
FINISH NLT 12:30 and NET 12:20
o Segments with both “Invest” and “Veto” chips
o Segments with maximum “Invest” points
o Segments with maximum “Veto” chips
o
chips)
• Ask, “Does anyone wants to change their vote”. Allow people to change
votes accordingly. Change chips and display the final score.
Q2 - Level of Investment ini�a�ves (~30 minutes) MINDSTATE 2(Now/Known)
• Ask “Now let's drill in a li�le deeper. We have combined the Gateways a li�le bit here by type. What level of investment should the federal Government take for each type of infrastructure? Choose between Maintain Existing, Improve Existing, and Add New.”
• Explain the levels – refer to the Infrastructure Components sheet – on the back.
• Hand out the Q2 Level of Investment Individual Vo�ng Sheet and have them vote individually on the sheet – Only one check per row.
• While they are filling out their sheets, hand each par�cipant nine chips of any color and have them vote.
• There are chip limits by investment level: o Maintain Exis�ng– unlimited o Improve Exis�ng – No More Than 3 o Add New – No More Than 2
• Quickly tally the votes, write it on the sheet, post it, and open discussion. Q3 – Policy & Funding (~20 minutes) MINDSTATE 2(Now/Known)
• Ask “Now let's look at where POLICY should be made and how FUNDING should be provided. For POLICY, check the level where it should be made for each component. For FUNDING, check where the PRIMARY funding should come from for each component.”
• Hand out the Q3 Policy Level and Funding Source Individual vo�ng sheets.
• Have them vote individually where each person puts one check per row for POLICY and one per row for FUNDING. Thus, each row should have two and only two checks.
• While they are vo�ng, hand each person 18 chips (color does not
end @11:25
end @11:55
end @12:15
Segments with no or very few chips (either “Invest” or “Veto”

152 Scenario Planning for Freight transportation infrastructure investment
Time Ac�vity
ma�er). Have them place them according to their individual votes. They must use all chips.
• Quickly tally the votes, write it on the sheet, post it, and open discussion. Wrap Up and Final Comments (use remaining �me)
• Ask, “I need two volunteers to report out to the larger group.” Tellthem we will show their responses on the screen – they only need to explain their choices
12:30 – 13:30 Lunch
13:30 – 14:00
End @ 14:00
End @14:45
end @15:30
Cross-scenario summary: Reveal (30 minutes)
• Have people sit in their groups. • Show scenario videos for all scenarios used. • Provide short overview of all Scenarios – level se�ng. • ELECTRONIC VOTING. –
1. Which scenario is most like TODAY? 2. Which scenario is MOST LIKELY to occur? 3. Which Scenario is MOST PREFERRED?
Presenta�on of results and ini�a�ves by scenario (~10 min. x 4 = 45 minutes)
• Each scenario team will then describe the five ini�a�ves they iden�fied • Encourage cross-discussion and ques�oning from other teams
Cross-scenario discussion of ini�a�ves (45 minutes)
• Show the slide with invest & veto results for all segments across the scenarios
• Discuss robust and con�ngent investments • ELECTRONIC VOTING –
1. Which component is MOST cri�cal? 2. Which component is LEAST cri�cal?
• Discuss Sensors in the Ground 1. Vote on specific sensors (which is the most likely direc�on)
15:30 – 16:00 Wrap up
• ELECTRONIC VOTING – 1. What is the value of this type of workshop? (likert) 2. Likelihood that DOTs will use this process?

Appendix e 153
(a) sum of points and vetoes
nbr of segments Points Vetoes Points Vetoes Points Vetoes Points VetoesGateway 2 485 3 275 8 290 3 235 9Corridor 4 620 9 810 5 525 10 740 9Connector 2 255 6 250 4 360 2 410 1
1360 18 1335 17 1175 15 1385 19
(b) proportion of points and vetoes
Points Vetoes Points Vetoes Points Vetoes Points VetoesGateway 2 0.357 0.167 0.206 0.471 0.247 0.200 0.170 0.474Corridor 4 0.456 0.500 0.607 0.294 0.447 0.667 0.534 0.474Connector 2 0.188 0.333 0.187 0.235 0.306 0.133 0.296 0.053
(c) proportion of points and vetoes per segment
Points Vetoes Points Vetoes Points Vetoes Points VetoesGateway 0.178 0.083 0.103 0.235 0.123 0.100 0.085 0.237Corridor 0.114 0.125 0.152 0.074 0.112 0.167 0.134 0.118Connector 0.094 0.167 0.094 0.118 0.153 0.067 0.148 0.026
GM MM N! OWO
Delaware Valley Regional Planning Commission (DVRPC)
GM MM N! OWO
GM MM N! OWO
(a) sum of points and vetoes
nbr of segments Points Vetoes Points Vetoes Points Vetoes Points VetoesGateway 3 275 0 240 1 240 7 190 7Corridor 12 980 17 925 16 1330 14 1095 5Connector 1 45 3 40 4 0 9 25 4
1300 20 1205 21 1570 30 1310 16
(b) proportion of points and vetoes
Points Vetoes Points Vetoes Points Vetoes Points VetoesGateway 3 0.212 0.000 0.199 0.048 0.153 0.233 0.145 0.438Corridor 12 0.754 0.850 0.768 0.762 0.847 0.467 0.836 0.313Connector 1 0.035 0.150 0.033 0.190 0.000 0.300 0.019 0.250
(c) proportion of points and vetoes per segment
Points Vetoes Points Vetoes Points Vetoes Points VetoesGateway 0.071 0.000 0.066 0.016 0.051 0.078 0.048 0.146Corridor 0.063 0.071 0.064 0.063 0.071 0.039 0.070 0.026Connector 0.035 0.150 0.033 0.190 0.000 0.300 0.019 0.250
GM MM N! OWO
GM MM N! OWO
Washington State Department of Transportation (WSDOT)
GM MM N! OWO

154 Scenario Planning for Freight transportation infrastructure investment
(a) sum of points and vetoes
nbr of segments Points Vetoes Points Vetoes Points VetoesGateway 2 295 3 105 14 315 6Corridor 10 430 15 1025 10 575 18Connector 3 450 2 195 2 340 3
1175 20 1325 26 1230 27
(b) proportion of points and vetoes
Points Vetoes Points Vetoes Points VetoesGateway 2 0.251 0.150 0.079 0.538 0.256 0.222Corridor 10 0.366 0.750 0.774 0.385 0.467 0.667Connector 3 0.383 0.100 0.147 0.077 0.276 0.111
(c) proportion of points and vetoes per segment
Points Vetoes Points Vetoes Points VetoesGateway 0.126 0.075 0.040 0.269 0.128 0.111Corridor 0.037 0.075 0.077 0.038 0.047 0.067Connector 0.128 0.033 0.049 0.026 0.092 0.037
GM N! OWO
GM N! OWO
GM N! OWO
Port of Long Beach (POLB)
(a) sum of points and vetoes
nbr of segments Points Vetoes Points Vetoes Points VetoesGateway 3 180 4 190 3 220 8Corridor 8 325 7 565 10 480 7Connector 2 175 0 135 1 175 1
680 11 890 14 875 16
(b) proportion of points and vetoes
Points Vetoes Points Vetoes Points VetoesGateway 3 0.265 0.364 0.213 0.214 0.251 0.500Corridor 8 0.478 0.636 0.635 0.714 0.549 0.438Connector 2 0.257 0.000 0.152 0.071 0.200 0.063
(c) proportion of points and vetoes per segment
Points Vetoes Points Vetoes Points VetoesGateway 0.088 0.121 0.071 0.071 0.084 0.167Corridor 0.060 0.080 0.079 0.089 0.069 0.055Connector 0.129 0.000 0.076 0.036 0.100 0.031
MM N! OWO
Georgia Department of Transportation (GDOT)
MM N! OWO
MM N! OWO
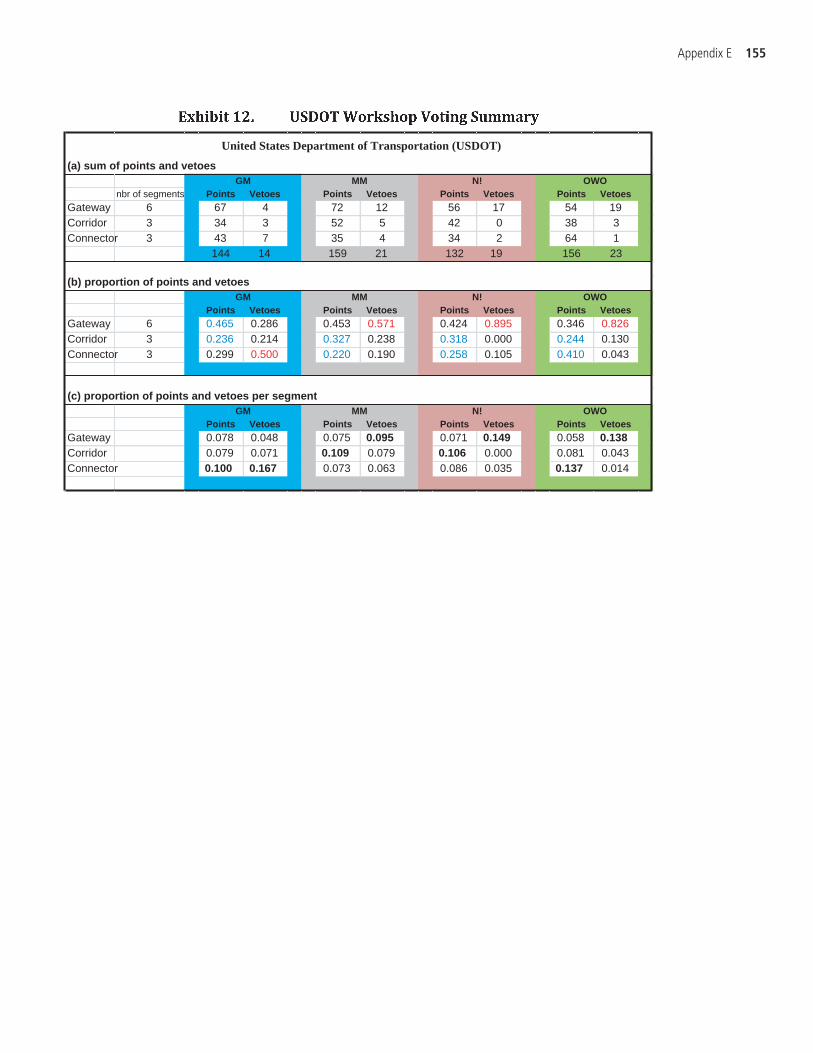
Appendix e 155
(a) sum of points and vetoes
nbr of segments Points Vetoes Points Vetoes Points Vetoes Points VetoesGateway 6 67 4 72 12 56 17 54 19Corridor 3 34 3 52 5 42 0 38 3Connector 3 43 7 35 4 34 2 64 1
144 14 159 21 132 19 156 23
(b) proportion of points and vetoes
Points Vetoes Points Vetoes Points Vetoes Points VetoesGateway 6 0.465 0.286 0.453 0.571 0.424 0.895 0.346 0.826Corridor 3 0.236 0.214 0.327 0.238 0.318 0.000 0.244 0.130Connector 3 0.299 0.500 0.220 0.190 0.258 0.105 0.410 0.043
(c) proportion of points and vetoes per segment
Points Vetoes Points Vetoes Points Vetoes Points VetoesGateway 0.078 0.048 0.075 0.095 0.071 0.149 0.058 0.138Corridor 0.079 0.071 0.109 0.079 0.106 0.000 0.081 0.043Connector 0.100 0.167 0.073 0.063 0.086 0.035 0.137 0.014
GM MM N! OWO
GM MM N! OWO
United States Department of Transportation (USDOT)
GM MM N! OWO

Abbreviations and acronyms used without definitions in TRB publications:
A4A Airlines for AmericaAAAE American Association of Airport ExecutivesAASHO American Association of State Highway OfficialsAASHTO American Association of State Highway and Transportation OfficialsACI–NA Airports Council International–North AmericaACRP Airport Cooperative Research ProgramADA Americans with Disabilities ActAPTA American Public Transportation AssociationASCE American Society of Civil EngineersASME American Society of Mechanical EngineersASTM American Society for Testing and MaterialsATA American Trucking AssociationsCTAA Community Transportation Association of AmericaCTBSSP Commercial Truck and Bus Safety Synthesis ProgramDHS Department of Homeland SecurityDOE Department of EnergyEPA Environmental Protection AgencyFAA Federal Aviation AdministrationFHWA Federal Highway AdministrationFMCSA Federal Motor Carrier Safety AdministrationFRA Federal Railroad AdministrationFTA Federal Transit AdministrationHMCRP Hazardous Materials Cooperative Research ProgramIEEE Institute of Electrical and Electronics EngineersISTEA Intermodal Surface Transportation Efficiency Act of 1991ITE Institute of Transportation EngineersMAP-21 Moving Ahead for Progress in the 21st Century Act (2012)NASA National Aeronautics and Space AdministrationNASAO National Association of State Aviation OfficialsNCFRP National Cooperative Freight Research ProgramNCHRP National Cooperative Highway Research ProgramNHTSA National Highway Traffic Safety AdministrationNTSB National Transportation Safety BoardPHMSA Pipeline and Hazardous Materials Safety AdministrationRITA Research and Innovative Technology AdministrationSAE Society of Automotive EngineersSAFETEA-LU Safe, Accountable, Flexible, Efficient Transportation Equity Act: A Legacy for Users (2005)TCRP Transit Cooperative Research ProgramTEA-21 Transportation Equity Act for the 21st Century (1998)TRB Transportation Research BoardTSA Transportation Security AdministrationU.S.DOT United States Department of Transportation