Embed Size (px)
Citation preview

APRIL 1945
SURVEY OF
CURRENTBUSINESS
UNITED STATES DEPARTMENT OF COMMERCE
BUREAU OF FOREIGN AND DOMESTIC COMMERCE
Digitized for FRASER http://fraser.stlouisfed.org/ Federal Reserve Bank of St. Louis

Survey of
CURRENTBUSINESS
VOLUME 25, No. 4
Statutory Functions "The Bureau ofForeign and Domestic Commerce • • • tofoster, promote, and develop the foreignand domestic commerce of the UnitedStates" [Law creating the Bureau, Aug.23,1912 [37 Slat. 408].]
w
Department of CommerceField Service
Atlanta 3, Ga.s 603 Rhodes Bldg.Ffcr»otr»« 0 TVTacc 1 RAH Pnetrtmlinnapuoston y, iviass., IOUU v»usiomiiousc.
Buffalo 3, N. Y., 242 Federal Bldg.Charleston 3, S. C, Chamber of Commerce
Bldg.Chicago 4, 111., 357 U. S. Courthouse.Cincinnati 2, Ohio, Chamber of Commerce.Cleveland 14, Ohio, 750 Union Commerce
Bldg.Dallas 2, Tex., Chamber of Commerce Bldg.Denver 2, Colo., 566 Customhouse.Detroit 26, Mich., 371 New Federal Bldg.Houston 14, Tex., 603 Federal Office Bldg.Jacksonville 1, Fla., 425 Federal Bldg.Kansas City 6, Mo., 724 Dwight Bldg.Los Angeles 12, Calif., 1540 U. S. Post Office
and Courthouse.Memphis 3, Tenn., 229 Federal Bldg.Minneapolis 1, Minn., 201 Federal Bldg.New Orleans 12, La., 408 Maritime Bldg.New York 18, N. Y., Room 1950, 500 Fifth
Ave.Philadelphia 2, Pa., 1510 Chestnut St.Pittsburgh 19, Pa., 1013 New Federal Bldg.Portland 4, Oreg., Room 313, 520 S. W. Mor-
rison St.Richmond 19, Va., 601 Atlantic Life Bldg.St. Louis 1, Mo., 107 New Federal Bldg.San Francisco 11, Calif., 307 Customhouse.Savannah, Ga., 403 U. S. Post Office and
Courthouse Bldg.Seattle 4, Wash., 809 Federal Office Bldg.
APRIL 1945
Contents
THE BUSINESS SITUATION
Consumer Buying StrongCivilian Manufactured ProductsFood SuppliesCivilian Use of Petroleum ProductsThe Mexico City Conference
INDUSTRIAL CONCENTRATION OF EMPLOY-MENT
TRENDS IN TEXTILES AND CLOTHING
STATISTICAL DATA:
Page
1
34
579
10
15
S-l
i \ 01C—Contents of this publication are not copyrighted andmay be reprinted freely. Mention of source will be appreciated•
Published by the Department of Commerce, HENRY A. WALLACE, Secretary, and issued through the Bureauof Foreign and Domestic Commerce, Amos E. Taylor, Director. Subscription price of the monthly SURVEY OFCURRENT BUSINESS, $2; Foreign, $2.75 a year. Single copy, 20 cents. Price of the 1942 Supplement is 50 cents.Make remittances only to Superintendent of Documents, U. S. Government Printing Office, Washington 25, D. C.
Digitized for FRASER http://fraser.stlouisfed.org/ Federal Reserve Bank of St. Louis

The Business SituationBy Division of Research and Statistics, Bureau of Foreign and Domestic Commerce
THE outstanding characteristic of theopening months of 1945 was the shift
in perspective on the economic outlookfrom the beginning to the end of the firstquarter. The opening weeks of the yearsaw a spurt in orders on the books ofmanufacturers reminiscent of themonths following Pearl Harbor, uppingof military requests for civilian-typegoods as well as combat materiel, andconsequent growing concern over thepossibility of reductions in civilian sup-plies. By the end of March, the empha-sis began to shift again to forthcomingcutbacks of munitions programs and theanticipation of the economic conse-quences of the reductions to follow V-Eday.
Despite these developments, the dis-tinguishing feature of economic activityin the first quarter was its similarity,rather than contrast, with the precedingquarter.
The major reason for the shifting ofemphasis from rising military require-ments is the forward march of the AlliedArmies into Central Germany. Plansand programs in the early part of thequarter were still influenced by the Ger-man counterattack resulting in the Bat-tle of the Bulge. But by the end ofMarch, the Rhine was no longer a bar-rier, General Eisenhower could an-nounce a breaching of the entire West-ern Front, the last of the large industrialareas of Germany was being lopped off,and Allied forces from the East werepushing through Austria.
The effect of these developments wasoutlined in the second report by theDirector of War Mobilization and Re-conversion issued at the end of March.The report indicated that plans werebeing effectuated for a large release ofresources from munitions production inthe first quarter following the defeat ofGermany.
The victory in Europe will, therefore,signify an appreciable shift in the dis-tribution of resources. Although mili-tary production will remain high andadequate, a considerable easing of thecivilian supply situation will become pos-sible and the over-all economic indica-tors will reflect an easing of the pressurefor production.New Orders Higher—Output Steady.
Business activity in the first quarterwas dominated, however, by the pres-sure of military procurement, as evi-denced by the unusual sharp increase innew orders placed with manufacturers.These were larger than in the last quar-ter of 1944, and about one-fifth abovethe first quarter of last year. The risewas entirely the result of a marked gainin new business reported by durablegoods producers.
The explanation of the spurt in orderslies in the effectiveness of the policiesurged on industry by the services andthe War Production Board to get orders
placed as early in the year as possible,and in the placing of new orders whileprocurement policies were heavily in-fluenced by the Belgium Bulge.
The striking aspect of this new orderspurt was that it was out of proportionto the trend in shipments or the exist-ing schedules of production for the re-mainder of the year. There have beenearlier instances during the war whenheavy bunching of orders was one aspectof rising output ahead. The spurt thisyear was not a forerunner of rising pro-duction.
A glance at the lower middle sectionof the chart on this page shows estimatedmanufacturers' shipments in the first,quarter of this year only slightly abovethose of the corresponding quarter a yearago. This is representative of the slightchange characteristic of the past yearand, as has been pointed out in earlierissues of the SURVEY, there will be no im-portant change until the cutbacks inmunitions reduce aggregate output.
Slight Shift in Resources.
The contrast between the expansion oforders and production trends and mili-tary schedules ahead is a factor in theconcern over the outlook for civiliansupplies. While the order upsurge didnot presage a similar expansion in out-put, the overflowing high priority orderson the books of manufacturers pointedto the seeming lack of room for civilianoutput. These have to be examined crit-
ically and weighed carefully before con-cluding that they indicate a fundamentalchange in available supplies.
Viewed in this manner, the policy de-cisions for the first half of this year,though resulting in many changes inprograms and schedules, did not call forany significant alteration in either theaggregate goods and services producedor in the distribution of resources be-tween the military and civilian sectors ofthe economy. They meant, however,that expectations that there would be atransfer of resources to nonmilitary pro-grams, as a result of declines in somesegments of munitions production, wouldnot be realized because other newly ex-panded munitions programs would ab-sorb these released resources.
Strains Evident.Naturally, the stresses and strains of
three years of war economy continued toshow up in the first quarter of this year.Some civilian products were in tightersupply and changing military demandsaffected the position of others". In someareas, pre-war stocks were getting nearthe depletion point.
The aggregate picture of new civiliansupply in the first quarter of this year,however, did not differ appreciably fromlast year, as can be seen, for example, inthe way shipments of manufacturedgoods to civilians held up in the firstthree months of the year and in therecord retail trade of the past fewmonths.
Chart 1.—Business Indicators
INDEX, 1ST QR. 1939 = 10040 0
300
200
100
0
400
300
200 -
100 -
" 1943 1944 1945
INCOME_ PAYMENTS
HIWAGE EARNERS,
_ MANUFACTURING
111
RETAIL_ PRICES
inMANUFACTURERS'SHIPMENTS _ _in
FARM MARKET-_ INGS, VOLUME
inCOMMODITYTRANSPORTATION _
HI1943 1944 1945
FIRST QUARTER —
INDEX, 1ST QR. 1939 = 10040 0
300
200
100
0
400
300
] 200
100
1943 1944 |945
D. D. 45-213
Sources : U. S. Department of Commerce, except farm marketings and wage earners which wererecomputed with the first quarter of 1939 as base from indexes of the U. S. Departments of Agricul-ture and Labor, respectively. The first quarter of 1945 wTas estimated by the U. S. Department ofCommerce.
634686—45-Digitized for FRASER http://fraser.stlouisfed.org/ Federal Reserve Bank of St. Louis

SURVEY OF CURRENT BUSINESS April 1945
Military Schedules.The essence of the situation is that the
increases in the military schedules initi-ated in December and January predi-cated upon indefinite prolongation of thewar in Europe, resulted in a program forthis year that is smaller than the 1944program set forth at the beginning ofthat year, and about equal to the actualproduction of last year.
Recent developments have called intoquestion the need for much of the ex-pansion in those military programs withpeaks ahead—as in segments such asammunition and some other groundArmy equipment.
Cuts in the naval vessel as well asother military programs have been an-nounced. Thus, it is highly unlikely un-der any circumstances that the 1945 pro-gram, as built up over the year end, rep-resents a probability of what will actu-ally be required.
Munitions Employment Steadies.With this background, the over-all
economic aspects of the first quarter arerecognized as much in the same patternas the preceding five quarters. A majorexception was that the decline in muni-tions employment which began in late1943 came to a halt in the first 3 monthsof this year.
The concerted drive to recruit laborfor the urgent programs and the highermunitions schedules set ahead served tomaintain employment in munitionsplants even with the volume reached lastNovember. Considerable progress wasmade during January and February inplacing workers where needed. The Di-rector of War Mobilization and Recon-version announced that in these monthsthe United States Employment Servicedirected 2 million persons to war andwar-supporting jobs. Approximately450,000 of these were placed in "must"plants, accounting for a net addition of150,000 employees after allowance for300,000 separations.
Employment in all manufacturing in-dustries combined showed the same rel-ative stability in the first quarter. Thelower left-hand panel of the chart onpage 1, especially when compared withthe adjoining panel on shipments, por-trays the main movements that havetaken place.
The rise in manufacturers shipmentsbetween the first quarter of 1943 and1944 was accomplished with a very slightincrease in employment. But betweenthe comparable quarters of 1944 and 1945the rise in output per worker throughmore effective utilization of facilitiesand manpower as over-all peak rates ofoperations were reached, was larger thanthe expansion of shipments. The de-cline in the number of employees re-flected this factor, rather than anyshortage of labor, notwithstanding thatreal difficulties were encountered in ade-quately staffing some plants.
The retardation of the decline in em-ployment in the initial quarter of thisyear indicates efforts made to staff theplants having rising schedules, and plac-ing of new orders with others whichtended to halt the reduction.
Chart 2.—Sales of Retail Stores,Seasonally Adjusted
INDEX, 1st QR. 1944 = 100120
100
90
120
100
90
130
120
110
90
80 L
DURABLE GOODSSTORES **.
+ ALL RETAIL STORES
^NONDURABLE GOODS STORES 1/
FOOD STORES'i
EATING ANDDRINKING PLACES
MEN'S CLOTHING ANDFURNISHINGS STORESV
'SHOE STORES
s WOMEN'S APPAREL ANDACCESSORIES STORES
2nd QR. 3rd QR.
19444th QR. 1st QR. (Est.)
^^1945-^a a 45-214
1 Includes sales for some nondurable goodsstores not shown separately in the chart.
Source : U. S. Department of Commerce.
Munitions Output Maintained.
Despite the considerable shifting inoutput among munitions programs—withits emphasis on improved materiel, as incommunication equipment and the heav-ier and more complicated models of air-craft and tanks—aggregate munitionsoutput was maintained in the first quar-ter at approximately the same volume asin the preceding quarter.
The major changes in composition be-tween the fourth quarter of 1944 and thepast three months were the increase inammunition and aircraft, especially thelong-range heavy bombers, and a con-tinuation of the decline in shipbuilding.Outstanding accomplishments were reg-istered in the critical programs that re-quire steep rises in output. In February,the latest month for which detailed in-formation is available, output of thecritical programs averaged 9 percentabove January—equivalent to betterthan a 20 percent gain- in the daily rateof production.Revisions in Measures.
The statistics of munitions output indollar terms have recently been revisedfor 1943 and 1944. The estimates ofmunitions output are designed to meas-ure changes in the volume of output, andthe dollar totals are a summation of thephysical volume of individual items mul-tiplied by their respective "standard"prices.
In general, the prices used have beenas of August 1943, but the considerablechanges since that time have been takeninto account to give, in effect, a newweighting in some items. Since the pricechanges were generally downward theseresult in lowered dollar aggregates.They likewise lower the increase as maybe seen in the following comparison oftotal munitions production in billions ofdollars:
Revisedestimates
56.361.2
Instead of a 12 percent rise in 1944over 1943 the current totals show 9 per-cent.
The major reason for the revision wasthe adjustment in prices for some typesof aircraft, though there were smallchanges in most of the major munitionscategories. The effect of the adjustmentfor 1944 by type of product is presentedbelow, the figures again being aggregatesin billions of dollars:
1943_1944_
Previousestimates
.___ 56.9
.___ 63.8
Aircraft-.ShipsGuns and fire control .AmmunitionCombat and motor vehicles-Communication and electronic
equipment. __Other equipment and supplies-
Total
Previousestimates
IS 914.03.36 75.3
4.311. 1
63.8
lie visedestimates
16 713.73.46 75.4
4. 211.0
61.2
Railroad Traffic Lower.The high volume of output continued
to exert pressure on the Nation's trans-portation system during the first quarter.Special difficulties imposed by the severeweather conditions and the heavy exportmovements, particularly on the WestCoast, created no serious bottlenecksaside from some localized shortages offreight cars.
Both railroad freight and passengertraffic were below the correspondingquarter of 1944. The unusually bad win-ter significantly reduced the turn-aroundtime of freight cars and thus decreasedrailroad capacity. Carloadings declined2 percent from last year.
The decreasing military demand forrailroad passenger accommodations asour continental forces declined, and fur-ther restrictions on civilian travel, re-sulted in a drop of 4 or 5 percent inpassenger-miles.
In contrast, other segments of thetransportation system handled moretraffic. Truck tonnages in the first quar-ter, despite the weather, were back atfirst quarter 1944 volumes after showingdeclines throughout the months of 1944.The supply of truck tires, while stillcritical, was eased somewhat by increasedallocations to the trucking industry.
The attainment of practical capacityoperation of the emergency pipelines bythe latter months of last year precludedany further significant gain in the earlymonths of 1945. However, total pipelineoperations were about 20 percent higherthan in the first quarter of last year.
Digitized for FRASER http://fraser.stlouisfed.org/ Federal Reserve Bank of St. Louis

April 1945
Domestic airline and waterway trafficlikewise was higher than last year.
Livestock Flow Reduced.In contrast to the maintenance of
manufacturing and munitions output, theflow of farm products to market wassomewhat lower in the first quarter of1945, as compared with the same quarterof 1944. However, it was still above thefirst quarter of 1943 volume.
The sharp decline in the movement oflivestock and its products, reflectinglargely the continuation of the down-ward trend in hog slaughterings, morethan offset the larger crop movementwhich was stimulated by special contra-seasonal marketings in January andFebruary and, to a lesser extent, inMarch.
The lateness of the harvest resulted ina delayed movement of cotton and cot-ton seed to market in the last few monthsof 1944, and the past quarter witnessedunusually high marketings of these com-modities.
Income Payments Continue To Rise.
Because of the later marketings ofsome crops, agricultural income pay-ments were up on a seasonally adjustedbasis. Income payments to individuals inthe nonagricultural categories in the pastquarter continued the steady rise whichwas typical of 1944, all groups experi-encing gains. The largest absolute in-creases occurred in manufacturing andtrade. Military payments continued toexpand though at a lower rate than pre-vailed throughout 1944.
The flow of income in the first 3 monthsof 1945 was equivalent to the annual rate(seasonally adjusted) of about 164 bil-lion dollars. In the correspondingfirst quarter 1944 total was 155 billion,and the full year 1944 aggregate was 157billion. The steady rise in income and theconsequent higher potential consumer de-mand showed in highly active retail tradelittle disturbed by price increases and theshift in consumer supplies to the higher-priced lines.
Consumer Buying StrongConsumer buying chalked up another
record during the first quarter of 1945.Retail stores experienced unprecedentedpre-Easter business. One of the chieffactors behind this buying rush verylikely was apprehension by consumersover the possible disappearance of high-quality goods, particularly clothing, andover predictions of more acute shortagesand more drastic restrictions on civiliangoods production.
Sales of retail stores during the firstquarter of this year are estimated at 17billion dollars, 11 percent above the samequarter of 1944. This gain is significant,especially in the light of what happenedlast year. In 1944, March sales wereboosted not only by heavy pre-Easterbuying but a wave of pretax purchasingon such items as jewelry, toiletries, furs,handbags, and liquor. New Federal ex-cise taxes, which became effective April1, 1944, stimulated a rush to stock up onsuch goods.
SURVEY OF CURRENT BUSINESS
The value of retail inventories at theend of January was slightly below thesame month of 1944. The rising vol-ume of sales in the face of fairly stableflow of aggregate supplies must in-evitably result in inroads being madeinto retail inventories.
Apparel Sales Lead.Consumer interest has naturally cen-
tered in new spring apparel and acces-sories. Department stores all over thecountry reported the largest pre-Eastersales on record. Apparel and generalmerchandise stores averaged gains of 25and 15 percent, respectively, over salesin the first quarter of 1944.
The War Production Board's an-nouncement that it would channel thelarger part of the civilian supply of fab-rics into low-cost merchandise directedconsumer attention to quality apparel.This development helped to stimulate theEaster buying.
Sales of apparel stores during the firstquarter were 18 percent above the firstquarter, 1944, after adjusting for theearlier date of Easter this year and forthe additional day in February last year.As can be seen from chart 2, shoe storesales have shown a sharp upward trendsince the second quarter of 1944.
In addition to heavy Easter buying, theincrease in shoe sales during the firstquarter of 1945 was accelerated by therelease of "odd-lot" shoes from rationingin February. Stock of shoes at retailstores are well below a year ago.Furthermore, an increasing portion of
current stocks is composed of unra-tioned, less durable type of footwear.
Although the sales trend of women'swear stores has been upward for the pastyear, their inventories at the end of Jan-uary were valued above the precedingyear. The decline in the first quarterfrom the heavy Christmas buying inmen's wear stores was more than sea-sonal. Full replacement of merchandisesold was no longer possible and retailstocks of men's wear at the end of thequarter were below a year ago.
Clothing prices advanced 6 percentover the first quarter of 1944, the largestincreases occurring in women's apparel.Lack of standardization makes it par-ticularly difficult to correct for pricechanges in this field, but it is common ob-servation that quality deterioration andupgrading of merchandise have been im-portant factors in the expansion of salesin these lines.
A detailed analysis of the textile andclothing situation is given in the articleon this subject in this issue.Food Sales Up Despite Rationing.
Food store sales during the first threemonths of 1945 were 9 percent above lastyear but slightly below the fourth quar-ter aggregate on a seasonally adjustedbasis (chart 2). Shortages of civiliansupplies of meat and butter relative todemand resulted in all meats being placedagain under rationing late in December.In addition, a sharp increase was effec-tive in ration point requirements forbutter and those meats which had con-tinued to be rationed in 1944. Most
Chart 3.—Manufacturers9 Shipments, War and Nonwar
BILLIONS OF DOLLARS100
8 0
6 0
4 0
20
NONDURABLE GOODSINDUSTRIES
DURABLE GOODSINDUSTRIES _
BILLIONS OF DOLLARS100
— 40
— 20
1941 1942 1943 1944 1945 1941 1942 1943 1944-« FIRST QUARTER OF EACH YEAR AT ANNUAL RATE
1945
D.D. 45-2171 Data for 1945 are preliminary estimates.Source : U. S. Department of Commerce.
Digitized for FRASER http://fraser.stlouisfed.org/ Federal Reserve Bank of St. Louis
SURVEY OF CURRENT BUSINESS April 1945
processed fruits and vegetables were alsoreturned to rationing in December.
Following a sharp wartime increase,sales of eating and drinking places lev-eled off during much of 1944. Season-ally adjusted sales increased substan-tially in the fourth quarter, and againin the first quarter of 1945 to a point 13percent above the first quarter of 1944.
Durable Sales Up.Sales of durable goods stores during
the first quarter of 1945 were 10 percentabove the same period last year in dollarterms. This gain is the result of substan-tial increases in sales of automobile partsand accessories stores and hardwarestores.
During the first three months of 1945home furnishing store sales declinedmore than seasonally from the holidaybuying of the fourth quarter of lastyear. However, sales were still 15 per-cent above the first quarter a year ago,reflecting for the most part, price rises.Jewelry stores recorded first quarter sales10 percent below the heavy volume ofpretax purchases made last year.
Despite the fact that the developmentssince the beginning of the year pointedto shrinking supplies of some consumergoods, the rate of consumer buying inthe first three months of the year gaveno indication of slackening off.
Since there has been only a relativelysmall depletion of inventories comparedto the volume of sales and no importantchange in the flow of the physical vol-ume of goods to consumers, the explana-tion for the continuous rise in retail salesrests in the shift in the composition ofthe products sold, upgrading, and con-centration of sales in the higher pricelines.
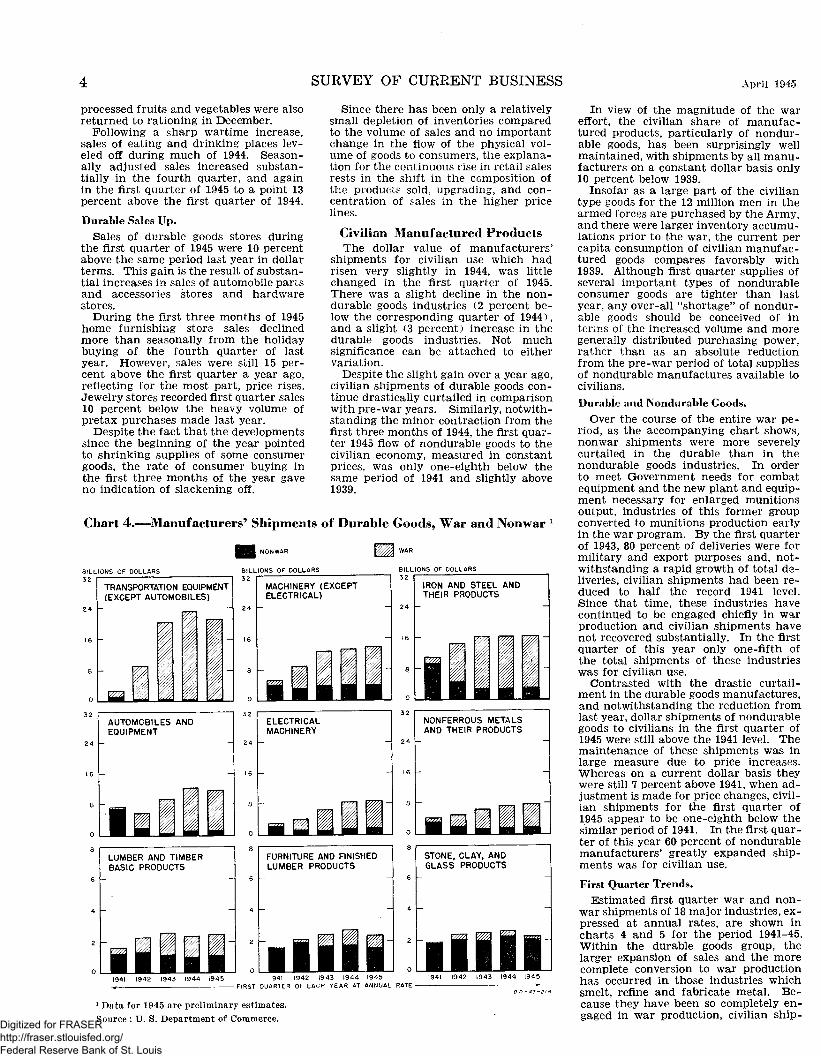
Civilian Manufactured ProductsThe dollar value of manufacturers'
shipments for civilian use which hadrisen very slightly in 1944, was littlechanged in the first quarter of 1945.There was a slight decline in the non-durable goods industries (2 percent be-low the corresponding quarter of 1944),and a slight (3 percent) increase in thedurable goods industries. Not muchsignificance can be attached to eithervariation.
Despite the slight gain over a year ago,civilian shipments of durable goods con-tinue drastically curtailed in comparisonwith pre-war years. Similarly, notwith-standing the minor contraction from thefirst three months of 1944, the first quar-ter 1945 flow of nondurable goods to thecivilian economy, measured in constantprices, was only one-eighth below thesame period of 1941 and slightly above1939.
Chart 4.—Manufacturers' Shipments of Durable Goods, War and Nonwar
BILLIONS OF DOLLARS32
TRANSPORTATION EQUIPMENT(EXCEPT AUTOMOBILES)
•if
ti1I
AUTOMOBILES ANDEQUIPMENT
I B M NONWAR
BILLIONS OF DOLLARS32
MACHINERY (EXCEPTELECTRICAL)
ELECTRICALMACHINERY
WAR
BILLIONS OF DOLLARS32
IRON AND STEEL ANDTHEIR PRODUCTS
NONFERROUS METALSAND THEIR PRODUCTS
LUMBER AND TIMBERBASIC PRODUCTS
FURNITURE AND FINISHEDLUMBER PRODUCTS
STONE, CLAY, ANDGLASS PRODUCTS
H Q H m~
1941 1942 1943 1944 1945 1941 1942 1943 1944 1945 1941 1942 1943 1944 1945t FIRST QUARTER OF EACH YEAR AT ANNUAL RATE *-
1 Data for 1945 are preliminary estimates.
Source : U. S. Department of Commerce.
In view of the magnitude of the wareffort, the civilian share of manufac-tured products, particularly of nondur-able goods, has been surprisingly wellmaintained, with shipments by all manu-facturers on a constant dollar basis only10 percent below 1939.
Insofar as a large part of the civiliantype goods for the 12 million men in thearmed forces are purchased by the Army,and there were larger inventory accumu-lations prior to the war, the current percapita consumption of civilian manufac-tured goods compares favorably with1939. Although first quarter supplies ofseveral important types of nondurableconsumer goods are tighter than lastyear, any over-all "shortage" of nondur-able goods should be conceived of interms of the increased volume and moregenerally distributed purchasing power,rather than as an absolute reductionfrom the pre-war period of total suppliesof nondurable manufactures available tocivilians.Durable and Nondurable Goods.
Over the course of the entire war pe-riod, as the accompanying chart shows,nonwar shipments were more severelycurtailed in the durable than in thenondurable goods industries. In orderto meet Government needs for combatequipment and the new plant and equip-ment necessary for enlarged munitionsoutput, industries of this former groupconverted to munitions production earlyin the war program. By the first quarterof 1943, 80 percent of deliveries were formilitary and export purposes and, not-withstanding a rapid growth of total de-liveries, civilian shipments had been re-duced to half the record 1941 level.Since that time, these industries havecontinued to be engaged chiefly in warproduction and civilian shipments havenot recovered substantially. In the firstquarter of this year only one-fifth ofthe total shipments of these industrieswas for civilian use.
Contrasted with the drastic curtail-ment in the durable goods manufactures,and notwithstanding the reduction fromlast year, dollar shipments of nondurablegoods to civilians in the first quarter of1945 were still above the 1941 level. Themaintenance of these shipments was inlarge measure due to price increases.Whereas on a current dollar basis theywere still 7 percent above 1941, when ad-justment is made for price changes, civil-ian shipments for the first quarter of1945 appear to be one-eighth below thesimilar period of 1941. In the first quar-ter of this year 60 percent of nondurablemanufacturers' greatly expanded ship-ments was for civilian use.
First Quarter Trends.Estimated first quarter war and non-
war shipments of 18 major industries, ex-pressed at annual rates, are shown incharts 4 and 5 for the period 1941-45.Within the durable goods group, thelarger expansion of sales and the morecomplete conversion to war productionhas occurred in those industries whichsmelt, refine and fabricate metal. Be-cause they have been so completely en-gaged in war production, civilian ship-
Digitized for FRASER http://fraser.stlouisfed.org/ Federal Reserve Bank of St. Louis

April 1945 SURVEY OF CURRENT BUSINESS
merits of most of these metal industrieshave for the last 2 years been very sub-stantially below 1941. The declines havebeen sharpest for the automobile andother transportation industries where, bythe first quarter of 1943, civilian saleswere less than 10 percent of those of1941. The reduction was also extremefor both the iron and steel and the non-ferrous metals industry.
For the first quarter of 1945, civiliansales of the automobile industry showedsome improvement from last year, as aresult of the enlarged output of civiliantrucks, production of which in 1943 wasnegligible. Civilian deliveries of the non-ferrous metals industry in the first quar-ter also improved. Stability or slight in-crease was similarly characteristic ofnonwar sales in the other metal-produc-ing and fabricating industries.
In the lumber, furniture, stone-clay-and-glass industries, which are the onlyindustries of the durable goods groupnot engaged in the manufacture of metalproducts, military and export require-ments have encroached much less seri-ously on civilian manufacture. As com-pared with 1944, civilian sales rose inthe lumber industry but declined some-what in the other two. Among thesethree industries, the war portion has ex-ceeded 50 percent only for lumber manu-facturers, and in the first quarter of1945 civilian sales on a current dollarbasis were below the corresponding periodof 1941. However, when account is takenof price increases since 1941, it appearsnot only that a fairly substantial reduc-tion of civilian shipments has occurredin the lumber industry, but that nonwardeliveries of both the furniture andstone-clay-and-glass industries for thefirst 3 months of the year were somewhatbelow the first quarter of 1941.
Unlike the situation which prevailedfor the major durable goods industries inthe first quarter, civilian shipments ofseveral important nondurable goods in-dustries were curtailed below 1944. Asa result of large Government purchases,nonwar sales of the food industrydropped 6 percent below the first 3months of last year. Curtailment wasfelt especially in the meat-packing por-tion of the industry. Even after thisreduction, nonwar sales of the food in-dustry were still substantially largerthan in the corresponding period of 1941,primarily as the result of the consider-able increase in food prices which oc-curred between the two periods. Ex-pressed in terms of constant prices, how-ever, food industry deliveries to thecivilian economy were 5 percent below1941 and only slightly above 1939.
After declining throughout most of1944, Government requirements for tex-tile products were raised sharply for thefirst half of 1945. Military needs wereincreased especially for woolen andworsted fabrics and the War ProductionBoard limited worsted plants to militaryand other priority production for thefirst five months of the year. The prob-lem of civilian supply in the textile andapparel industries as a whole has beenaggravated by the decline of total pro-duction over the past several years. Inthe first quarter of the year, the dollar
Chart 5.—Manufacturers9 Shipments of Nondurable Goods, War andNonwar 1
BILLIONS OF DOLLARS32
FOOD AND KINDREDPRODUCTS
PAPER AND ALLIEDPRODUCTS
LEATHER AND LEATHERPRODUCTS
BILLIONS OF DOLLARS32
TEXTILE-MILL PRODUCTSAND APPAREL
PRINTING, PUBLISHING, ANDALLIED INDUSTRIES
RUBBER PRODUCTS
BILLIONS OF DOLLARS16
CHEMICALS ANDALLIED PRODUCTS
PRODUCTS OFPETROLEUM AND COAL
TOBACCOMANUFACTURES
• •111i34l 1942 1343 1344 1945 1941 1942 1943 1944 1945 1941 1942 1943 1944 1945
FIRST QUARTER OF EACH YEAR AT ANNUAL RATE -D 0 45-219
1 Data for 1945 are preliminary estimates.
Source : U. S. Department of Commerce.
value of civilian sales by these industriesis estimated at 5 percent below 1944 andabout one-fourth under 1942. Since tex-tile and apparel prices have risen con-siderably during the war, the diminutionin actual goods made available to civil-ians has been larger than that indicatedby the sales figures alone.
Food Supplies
The uncertain effect of the progressof the war in Europe upon Governmentfood procurement programs adds anotherunknown to the problem of assessingthe adequacy of the food supplies whichwill be available for domestic civilianconsumption in the current calendaryear. Nevertheless, while the details ofthe prospective supply and demand situ-ation are not known, the broad outlinesof what may be expected are clear.
In the first place, it is apparent thatthe total food supply—including suppliesfor both civilian and noncivilian consum-ers—will be somewhat reduced from lastyear's record amount. On the basis of1945 production goals and "normal" cropyields and disposition, the indicated dropis about 6 percent. However, the pro-spective supply is still almost 30 percenthigher than average production in1935-39.
Weather, of course, is an importantvariable in the 1945 outlook. The waryears have seen exceptional crop yieldsand a continuance of this experiencewould result in supplies above currentexpectations. Even with such an even-tuality, however, last year's over-all pro-duction record probably would not beexceeded, chiefly because the reductionin the 1944 spring and fall pig crops—which were 29 percent below the pre-ceding year—is being reflected in asharply reduced supply of pork this year.On the other hand, the possibility ofbelow-normal yields should also be rec-ognized.
Reductions in Civilian Supplies.The prospect of reduced output means
that civilian consumers should expect tomake changes in their diets and to reducetheir consumption of some foods. Infact, the pinch of smaller supplies hasalready been felt as a result of the suc-cessive tightenings of the food rationingprogram in recent months. Currentpoint values for most foods are the high-est of the war period and the generalcoverage of the rationing program is thebroadest so far.
Just how large the cut in civilianconsumption will be in 1945 obviouslydepends to a great extent on the require-Digitized for FRASER
http://fraser.stlouisfed.org/ Federal Reserve Bank of St. Louis
6 SURVEY OF CURRENT BUSINESS April 1945
Chart 6.—-Production and CivilianConsumption of Food
INDEX, 1935-39 = 100140
120
100
80
PRODUCTION,
PER CAPITA CIVILIANCONSUMPTION
(•) PRELIMINARY INDICATION
1935-39 1940AVERAGE
194! 1942 1943 1944 19450. D. 45-215
Sources : Data through 1944, U. S. Depart-ment of Agriculture; 1945, U. S. Departmentof Commerce.
merits of the military and export agen-cies. Even under the most favorablecircumstances, however, the absolutemagnitudes of these latter requirementsare not likely to be significantly belowlast year. Thus, changes in these re-quirements should not be expected tocushion the decline in over-all produc-tion in any appreciable amount.
Judged by pre-war standards, the re-duction that will be necessary in theaverage civilian diet, even should non-civilian takings expand substantiallyover last year's amounts, is not causefor major concern. Food supplies will beadequate—both quantitatively and nu-tritionally. The changed supply situa-tion from 1944 will create certain diffi-culties which can be met by appropriateactions.
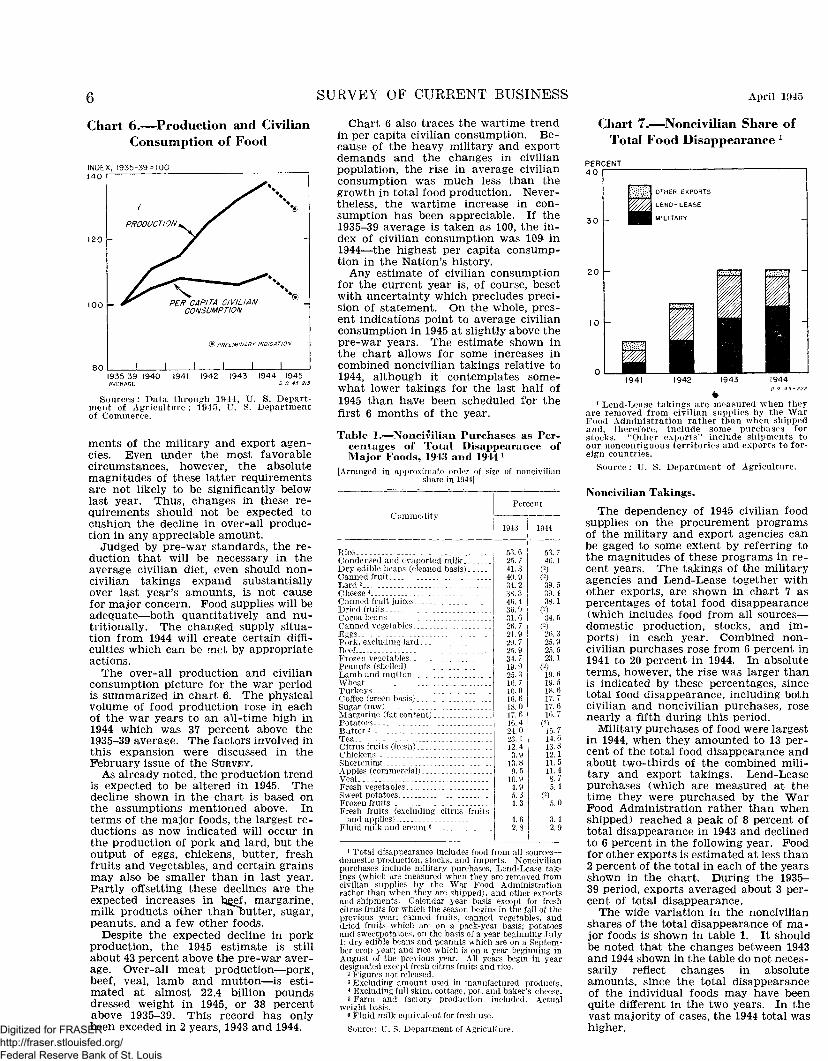
The over-all production and civilianconsumption picture for the war periodis summarized in chart 6. The physicalvolume of food production rose in eachof the war years to an all-time high in1944 which was 37 percent above the1935-39 average. The factors involved inthis expansion were discussed in theFebruary issue of the SURVEY.
As already noted, the production trendis expected to be altered in 1945. Thedecline shown in the chart is based onthe assumptions mentioned above. Interms of the major foods, the largest re-ductions as now indicated will occur inthe production of pork and lard, but theoutput of eggs, chickens, butter, freshfruits and vegetables, and certain grainsmay also be smaller than in last year.Partly offsetting these declines are theexpected increases in b^ef, margarine,milk products other thanbutter, sugar,peanuts, and a few other foods.
Despite the expected decline in porkproduction, the 1945 estimate is stillabout 43 percent above the pre-war aver-age. Over-all meat production—ports,beef, veal, lamb and mutton—is esti-mated at almost 22.4 billion poundsdressed weight in 1945, or 38 percentabove 1935-39. This record has onlybeen exceded in 2 years, 1943 and 1944.
Chart 6 also traces the wartime trendin per capita civilian consumption. Be-cause of the heavy military and exportdemands and the changes in civilianpopulation, the rise in average civilianconsumption was much less than thegrowth in total food production. Never-theless, the wartime increase in con-sumption has been appreciable. If the1935-39 average is taken as 100, the in-dex of civilian consumption was 109 in1944—the highest per capita consump-tion in the Nation's history.
Any estimate of civilian consumptionfor the current year is, of course, besetwith uncertainty which precludes preci-sion of statement. On the whole, pres-ent indications point to average civilianconsumption in 1945 at slightly above thepre-war years. The estimate shown inthe chart allows for some increases incombined noncivilian takings relative to1944, although it contemplates some-what lower takings for the last half of1945 than have been scheduled for thefirst 6 months of the year.
Table 1.-—•Noncivilian Purchases as Per-centages of Total Disappearance ofMajor Foods, 1943 and 1944 l
[Arranged in approximate order of size of noncivilianshare in 1944]
Chart 7.—Noncivilian Share ofTotal Food Disappearance *
Commodity
Rice_- - _ _ - - _Condensed and evaported milk _Dry edible beans (cleaned basis)Canned fruitLard3
Cheese i
Canned fruit juices_.- _Dried fruitsCocoa beansCanned vegetables -EggsPork, excluding lardBeefFrozen vegetables^Peanuts (shelled)Lamb and muttonWheat - -TurkeysCoffee (green basis)Sugar (raw) _ . _ _ _ _ .. - _.Margarine (fat content)PotatoesButter 5 _TeaCitrus fruits (fresh)_ . __ __ .ChickensShorteningApples (commercial)VealFresh vegetablesSweet potatoes, - - -- -.- .Frozen fruits -Fresh fruits (excluding citrus fruits
and applies) _ _ _Fluid milk and cream 6 -
Percent
1943
53.625.741.340.934.238.346.436.931.626.721 929.725 934.719.925.316.710.016. 618.017.616.424.023.112.43.9
13.89.5
10 94 95.34.3
4.62.8
1944
53.746.1
39.539.438.1
C2)34.5
26. 325.925. 523.1
19.619.518.617.717.616.7
15 714.613.812.111.511.48.75.4
5.0
3.42.9
1 Total disappearance includes food from all sources-domestic production, stocks, and imports. Noncivilianpurchases include military purchases, Lend-Lease tak-ings (which are measured when they are removed fromcivilian supplies by the War Food Administrationrather than when they are shipped), and other exportsand shipments. Calendar year basis except for freshcitrus fruits for which the season begins in the fall of theprevious year; canned fruits, canned vegetables, anddried fruits which are on a pack-year basis; potatoesand sweetpotatoes, on the basis of a year beginning July1; dry edible beans and peanuts which are on a Septem-ber crop year; and rice which is on a year beginning inAugust of the previous year. All years begin in yeardesignated except fresh citrus fruits and rice.
2 Figures not released.s Excluding amount used in manufactured products.4 Excluding full skim, cottage, pot, and baker's cheese.s Farm and factory production included. Actual
weight basis,e Fluid milk equivalent for fresh use.
Source: U. S. Department of Agriculture.
10 -
1 Lend-Lease takings are measured when theyare removed from civilian supplies by the WarFood Administration rather than when shippedand, therefore, include some purchases forstocks. "Other exports'' include shipments toour noncontiguous territories and exports to for-eign countries.
Source : U. S. Department of Agriculture.
Noncivilian Takings.The dependency of 1945 civilian food
supplies on the procurement programsof the military and export agencies canbe gaged to some extent by referring tothe magnitudes of these programs in re-cent years. The takings of the militaryagencies and Lend-Lease together withother exports, are shown in chart 7 aspercentages of total food disappearance(which includes food from all sources—domestic production, stocks, and im-ports) in each year. Combined non-civilian purchases rose from 6 percent in1941 to 20 percent in 1944. In absoluteterms, however, the rise was larger thanis indicated by these percentages, sincetotal food disappearance, including bothcivilian and noncivilian purchases, rosenearly a fifth during this period.
Military purchases of food were largestin 1944, when they amounted to 13 per-cent of the total food disappearance andabout two-thirds of the combined mili-tary and export takings. Lend-Leasepurchases (which are measured at thetime they were purchased by the WarFood Administration rather than whenshipped) reached a peak of 8 percent oftotal disappearance in 1943 and declinedto 6 percent in the following year. Foodfor other exports is estimated at less than2 percent of the total in each of the yearsshown in the chart. During the 1935-39 period, exports averaged about 3 per-cent of total disappearance.
The wide variation in the noncivilianshares of the total disappearance of ma-jor foods is shown in table 1. It shouldbe noted that the changes between 1943and 1944 shown in the table do not neces-sarily reflect changes in absoluteamounts, since the total disappearanceof the individual foods may have beenquite different in the two years. In thevast majority of cases, the 1944 total washigher.Digitized for FRASER
http://fraser.stlouisfed.org/ Federal Reserve Bank of St. Louis
April 1945 SURVEY OF CURRENT BUSINESS
In contrast to the over-all average of20 percent, the noncivilian takings ofsome foods exceeded 40 percent in 1944.The range shown in the table extendsfrom 54 percent down to 3 percent. Therelative amounts of the different com-modities purchased by the military andexport agencies are determined by suchfactors as nutritive value, transportationrequirements, perishability, ease of prep-aration, the tastes of our fighting men,and availability of supplies both at homeand abroad.
Other Factors in 1945 Outlook.
While the general maintenance of ade-quate civilian food standards seems as-sured for the current year, the supplyconditions confronting various familiesand various sections of the country mayvary markedly. Moreover, there may besignificant variations in conditions dur-ing the year because of seasonal factorsand shifts in the noncivilian procure-ment programs.
Geographical maldistributions of foodsupplies have been particularly notice-able in the case of meat. These haveresulted in part from the fact that theGovernment procures only Federally in-spected meats. Consequently civiliansupplies in the areas normally served byplants slaughtering under Federal in-spection (most of such plants are inthe Midwest) have been disproportion-ately reduced. Interstate shipments ofnoninspected meats are closely re-stricted by Federal regulations.
In the first 6 months of 1945, for ex-ample, the military and export programsare scheduled to take about 46 percentof the supply of Federally inspectedmeats. Relative to the total meat sup-ply, however, the amount to be taken is32 percent. Since nearly half the ci-vilian meat supply at present is nonfed-erally inspected, it is very possible tohave ample supplies in surplus produc-ing areas while there are acute shortageselsewhere. New measures to cope withthis problem are expected to be an-nounced shortly.
Chart 8.—Allocation of Gasolineand Distillate Fuels for CivilianUse
MILLIONS OF BARRELS
Chart 9.—Motor-Vehicle Registra-tions and Highway Use of MotorFuel
.5
.0
.5
0
^GASOLINE
DISTILLATE FUEL
1 i 1
\
S'-J
1 ! 1
BILLIONS OFGALLONS30
MILLIONS OFREGISTRATIONS
60
1944 1945
1 Includes light heating and Diesel oils.Source : Petroleum Administration for War.
1 Includes private and commercial vehicles,and vehicles owned by Federal, State, county,and municipal governments ; does not includetrailers, semitrailers, motorcycles or dealers'registrations and plates.2 Partly estimated.
Source : Public Roads Administration, FederalWorks Agency.
Another factor should be stressed re-garding the 1945 outlook. In interpret-ing the civilian supply estimates, oneshould not lose sight of the prevailingemployment and income situation.More families than before the war cannow afford adequate diets. To some ex-tent, therefore, current shortages of cer-tain foods represent more even distribu-tion. Thus, to say that the 1945 percapita civilian meat supply, for example,will be close to the 1935-39 average isquite different than saying that eachindividual consumer will eat about asmuch meat as in the earlier period.
Civilian Use of Petroleum ProductsThe volume of petroleum products—
especially gasoline and fuel oil—avail-able to the civilian economy, includingwar-supporting activities, in the first halfof 1945 is virtually identical to that avail-able in the comparable period of 1944, onthe basis of allocations by the PetroleumAdministrator for War. Comparisons ofthe first two quarters of 1945 with com-parable quarters of 1944 show slight in-creases in both components of chart 8.
The rises reflect increases in industrialuse of these products with no changeother than seasonal for individual con-sumers. The increase in gasoline resultsfrom expanded allocation to meet the re-quirements for agricultural productionwhile the rise in heating and Diesel oilfollows from mounting use of this fuelby railroad Diesel locomotives. In thecase of heavy residual fuel oils, usedchiefly for industrial power, expandedproduction of crude has permitted notonly relaxation of rationing restrictionsbut also reconversion of firing equipmentto oil.
Civilian Supplies Restricted.Consumption of petroleum products of
a strictly civilian character—gasoline forpassenger automobiles, kerosene and fueloil for domestic heating—has in 1943 and1944 been maintained at approximately65 percent of the 1941 volume. Adjust-ments have been made over the 2-yearperiod which have resulted in a slightincrease in total civilian supplies, as, forexample, the changes in the basic gaso-line rations on the East Coast in thefall of 1943.
Despite the large increases in con-sumption of petroleum and its productsfor industrial use, the proportion goingto the civilian economy, including usefor war-supporting activities as well asfor individual consumers, has been re-duced from 85 percent in 1941 to 37 per-cent in 1944, measured in terms of dollarvalue of manufacturers' shipments.
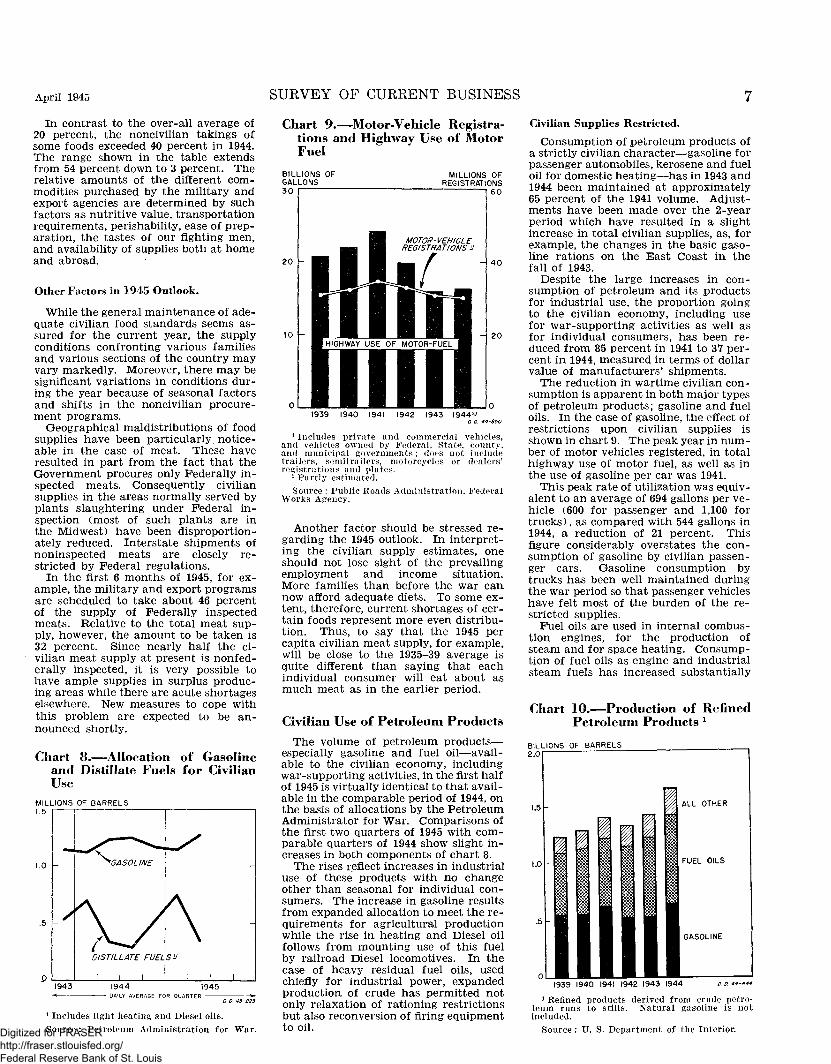
The reduction in wartime civilian con-sumption is apparent in both major typesof petroleum products; gasoline and fueloils. In the case of gasoline, the effect ofrestrictions upon civilian supplies isshown in chart 9. The peak year in num-ber of motor vehicles registered, in totalhighway use of motor fuel, as well as inthe use of gasoline per car was 1941.
This peak rate of utilization was equiv-alent to an average of 694 gallons per ve-hicle (600 for passenger and 1,100 fortrucks), as compared with 544 gallons in1944, a reduction of 21 percent. Thisfigure considerably overstates the con-sumption of gasoline by civilian passen-ger cars. Gasoline consumption bytrucks has been well maintained duringthe war period so that passenger vehicleshave felt most of the burden of the re-stricted supplies.
Fuel oils are used in internal combus-tion engines, for the production ofsteam and for space heating. Consump-tion of fuel oils as engine and industrialsteam fuels has increased substantially
Chart 10.—Production of RefinedPetroleum Products 1
B1LLIONS OF BARRELS2.0
1939 1940 1941 1942 1943 19441 Refined products derived from crude petro-
leum runs to stills. Natural gasoline is notincluded.
Source : U. S. Department of the Interior.Digitized for FRASER http://fraser.stlouisfed.org/ Federal Reserve Bank of St. Louis

8 SURVEY OF CURRENT BUSINESS April 1945
Chart 11.—Daily Capacity ofPetroleum Refineries x
MILLIONS OF BARRELS6
1940 1944 1940 1944 1940 1944CRUDE-OIL CRACKED CATALYTIC
REFINING GASOLINE CRACKINGDO. 44-843
1 Crude-oil refining is measured by input ofcrude ; cracked gasoline by output of gasolinefrom thermal and catalytic processes; andcatalytic cracking by input of gas-oil charge.
Sources : U. S. Department of the Interior,Petroleum Administration for War, and Oil andGas Journal.
during the war period. On the otherhand, fuel oils used for space heatingpurposes, both commercial and domestic,have been restricted by rationing since1942. The basic ration provided has beentwo-thirds of consumption in the baseyear 1941-42, adjusted for variations intemperature during winter months.Under these controls, the fuel oil usedfor domestic and commercial heatingpurposes for 1944 equalled 183 millionbarrels, 18 percent below 1941 consump-tion.
Production Increase Slackening.
Although increased production of pe-troleum products is expected in 1945, therate of increase will be smaller than inprevious years. A substantial increasein supplies for civilians, therefore, willdepend upon future military demands.However, production has been so ex-panded that a relatively small decreasein military requirements should result inconsiderable improvement in the civiliansupply situation. Stocks of civiliangrades of gasoline are currently risingand at the end of the quarter were 16percent above a year ago.
Crude Supplies Increase.Curtailed civilian consumption of gas-
oline and fuel oil provided about 40 per-cent of military needs for petroleumfuels. Thus increased production ofcrude and expansion of refinery runswere required.
The availability of petroleum productsis determined by the ability of wells toproduce crude, by the capacity of re-fineries to convert crude into its prod-ucts (including in particular the fuel oiland gasoline specially desired in our war-time economy), and the. ability of thetransportation system to bring bothcrude and refined products to points ofuse. Each one of these is a limitingfactor in the availability of petroleum
products. The responsible factor in thecase of civilian supply of petroleum prod-ucts has been transportation, particu-larly in the East and Northwest areas.Refining' operations are now close topractical limits and further expansionwill be at substantially reduced rates.
The production of crude petroleum in-creased from 1,353 million barrels in1940 to a record high of 1,678 in 1944.The increase in the past year over 1943was 11 percent. The increased flow ofcrude has been achieved without seriousrelaxation of accepted standards of con-servation and the war drain has not re-duced known and proven undergroundreserves.
Refining Capacity Expands.
The volume of crude petroleum run torefinery stills has increased steadily dur-ing the war period (chart 10) with theexception of 1942 when transportationproblems were most acute. The 1944 vol-ume was 35 percent higher than 1939with the succeeding 5 years averaging 27percent above the years 1935-39.
While a substantial part of the neces-sary growth in petroleum refining ca-pacity was accomplished by increasedand improved use of existing facilities,huge war demands required an expansionboth of crude distillation and of crackedgasoline facilities. As may be seen inchart 11, crude oil distillation capacityhas been expanded by more than 10percent by new construction.
War demands for a gasoline of veryhigh quality, as measured by octane rat-ing, brought into large scale use cata-lytic cracking methods. Such capacitywas available before the war but in verysmall quantities. Since 1940, catalyticcapacity has increased eight times to arate of about 1,000,000 barrels daily.
Whereas refining operations prior to1939 were rarely at more than 80 percentof capacity, since that time the ratio ofproduct to capacity has climbed steadilywith the exception of 1942. Operationsin the past year have been well over 90percent of capacity, at times exceeding95 percent.
No increase in refinery operations in1945 paralleling that achieved in 1944 isto be expected, because available facil-ities are now operated at rates whichcannot be greatly expanded. Further-more no significant expansion of Govern-ment-owned refining capacity aside froma few aviation gasoline plants is pres-ently planned and privately financed in-dustry additions will be of small volume,local and specialized in character.
Changes in Product Composition.The requirements of war have not only
resulted in an expansion of total pro-duction of refined petroleum products buthave also called forth changes in theirrelative proportions. Production ofpetroleum products from crude is sub-ject to variation, particularly with crack-ing and catalytic refining equipment bywhich the heavier components can beconverted into the lighter and more vola-tile products. The major changes havebeen an increase in fuel oil, an expan-sion in aviation gasoline and the related
Table 2.—Percentage Distribution ofPetroleum Refinery Products by Type
Aviation gasolineAutomotive gasolineFuel oilsAll other
1941
1.2442.9942.8712.90
100. 00
1944
13.4625.8946.7713.88
100.00
Source: Petroleum Administrator for War.
products, toluene and butadiene, and areduction in automotive grades of gaso-line.
This is illustrated in the changes in thecomponents of refined petroleum prod-ucts since 1941 (table 2). Comparisonwith chart 11 indicates that the increasein fuel oil output and of aviation gasolineoccurred not only because of the in-creased volume of crude petroleum re-fined but also because of the reductionin automotive gasoline. Although totalgasoline supplies were larger in 1944than in any previous year, the expan-sion in fuel oil production reduced totalgasoline from 44 to 39 percent of petro-leum processed, thus reversing the up-ward trend in gasoline produced fromcrude which had continued for manyyears.
While supplies of gasoline were thusrelatively reduced, automotive supplieswere further curtailed by requirementsfor the highly volatile gasoline types,aviation gasoline, toluene, and butadiene.Automotive grades of gasoline decreasedfrom 97 percent of all gasoline in 1941to 66 in 1944.
A third factor in reduced automotivegasoline supplies has been the relativelysmall expansion of natural gasoline pro-duction during the war period and its
Chart 12.—Percentage Distribu-tion of Deliveries of Petroleumand Products Into District I9 byTransportation Facility x
50 -
25 -
1941 1942 1943 19441 Percentages are based upon number of bar-
rels daily. District I includes the New Eng-land, Middle Atlantic, and South AtlanticStates, and the District of Columbia. Total in-cludes a negligible amount delivered by truckwhich is not shown separately in the chart.2 Includes ocean, lake, and river shipments.
Source : Petroleum Administration for War.Digitized for FRASER http://fraser.stlouisfed.org/ Federal Reserve Bank of St. Louis

April 1945 SURVEY OF CURRENT BUSINESS 9diversion to nonautomotive uses. Nat-ural gasoline is recovered from naturalgas and is not included in the volumeof crude petroleum run to stills. Thebulk of natural gasoline is normallyblended with the refinery product to in-crease the volume of automotive gaso-line.
During the war period, however, natu-ral gasoline has been processed to secureas large a volume as possible of thosefractions suitable for use in aviation gas-oline. Hence, the supply of naturalgasoline for automotive use has beensubstantially reduced both in quantityand in quality.
Transportation Difficulties Diminish.Under peacetime conditions large vol-
umes of petroleum and its products weretransported by barge and tankers. TheEast Coast was particularly dependentupon deep water movement from Gulfports for supplies, 94 percent being trans-ported in this manner in 1941 as illus-trated in chart 12.
The need for tankers for military pur-poses along with the danger and lossesfrom submarine attack shortly after thebeginning of the war greatly reducedthe number of vessels available for thismovement and hence severely curtailedshipments to East Coast ports. Pipe-line facilities from refinery to marketswere of small capacity and the limitedsupply of rail equipment was pressedinto very intensive service. Rail haulageof petroleum to this area thus increasedto 60 percent of total petroleum receiptsin 1943, equivalent to more than 20 timesthe volume of petroleum carried by railin 1941 but insufficient to prevent a dropin total petroleum deliveries of about8 percent.
Completion of pipeline facilities in1944 and stabilization of tanker opera-tions have served to reduce the strainupon rail operations as well as the shareof the movement handled in this man-ner. Nevertheless railroad transporta-tion continued in 1944 at a volume ex-ceeding 1942.
The flexible nature of tank car utiliza-tion permits their disposition to meetspecial transportation problems whenand where they arise. The decline inrail haul to the East Coast has resultedin no idle tank car facilities since carsnot needed to maintain the flow at de-sired volume were immediately trans-ferred to other areas and uses.
The Mexico City Conference
The recent Inter-American Confer-ence at Mexico City had unusual busi-ness significance. It provided impressiveevidence of the determination of thecountries of this Hemisphere to solvetheir political and economic problemsthrough cooperative international actionrather than along narrowly nationalisticlines. It brought forth both general andspecific policy declarations which willcondition business dealings between theUnited States and Latin America foryears to come.
The core of the foreign economic pol-icy of the United States, as further re-
634686—45 2
vealed at the Conference, is the beliefthat the economic problems of the Hemi-sphere as well as of the world at largehave a fair chance of solution only in asteadily expanding world economy. Thecounterpart is found in the extreme em-phasis placed by all the other countriesrepresented at Mexico City upon the con-tinued development of their resources,especially through industrialization.
This overriding objective may be takenas at least one fixed point in the Inter-American picture. A means of imple-menting the policy of industrializationwill be the conservation of war-accumu-lated reserves of gold and foreign ex-change of the other American Republicsto prevent their dissipation in the pur-chase of imported "nonessentials." An-other will be the attraction of foreigncapital to participate on equitable termswith domestic capital in carrying out de-velopmental programs.
Transition Adjustments.
The economic discussions at the Inter-American Conference in Mexico City thusserved as a curtain-raiser on problems ofboth the transition and post-war pe-riods. The principal problem of thetransition period from the point of viewof the other American Republics is, ofcourse, precisely the problem which facesour own economy. It is the problem ofreadjusting production as the procure-ment of war materials declines.
Spokesmen for the United States at theConference made it clear that the UnitedStates Government lacks legal authority,under existing legislation, to procure ma-terials which are not needed in the prose-cution of the war.1 Even if it were pos-sible, the continuation of procurement atwartime levels would delay inevitableadjustments in production to peacetimedemands and result in the accumulationof surpluses which would overhang anddepress post-war markets and prices.
However, it was agreed that the UnitedStates would adopt, through bilateral ar-rangements with the countries the sta-bility of whose economies is seriouslythreatened by reductions in governmentprocurement, measures designed to min-imize the adverse consequences of suchreductions. These measures may consistof the orderly adjustment of procurementcontracts "or any other suitable means."Furthermore, the countries concernedwill, where necessary, seek legislative au-thority to accomplish these purposes.
In the spirit of this general undertak-ing the United States promised to con-tinue to give due notice of prospectivereductions in procurement and to seek totaper off purchases in accordance withplans made as far in advance as possible.
In the view of the United States thesolution of the essential problem of thetransition period lies not in measures tosupport uneconomic production butrather in a many-sided program designedto replace wartime with peacetime de-mand as quickly and smoothly as possibleand thus keep domestic and internationaltrade at high levels. This is the sameprogram that is being offered at home; it
1 Section 202 of the War Mobilization andReconversion Act of 1944.
is both a short-run and a long-run pro-gram.
The elements of this program are welldefined. It proceeds from the fact thatprocurement for war will not cease ab-ruptly with the end of hostilities in Eu-rope but will remain heavy to meet therequirements of the Pacific war. It as-sumes that maximum employment will bemaintained in the United States and thatimports into the United States to meet in-dustrial and consumer requirements willbe much larger than before the war. Ittakes into account also the heavy back-logs of demand for United States prod-ucts and the accumulations of purchasingpower to make this demand effective.
In addition to ready purchasing powerin the form of cash or its equivalent, newreservoirs of international credit are be-ing created. The proposed InternationalBank will have $9,000,000,000 of lendingpower. Steps are being taken to increasethe capital of the Export-Import Bankby $1,500,000,000. Private investmentcapital is plentiful and will be placed inforeign countries on a substantial scaleif conditions are favorable.Long-Term Objectives.
Discussion at Mexico City of postwareconomic problems centered around thetheme of development of resources andindustrialization. On this subject, theUnited States was able to give the mostunequivocal assurances of assistance byall possible means to sound projects andprograms, to be undertaken primarily byprivate enterprise. These means includethe equitable allocation of materials andequipment in short supply so long as war-time controls continue in effect, equalaccess thereafter to the producers' goodsneeded for economic development and in-dustrialization, provision of ample long-term credit on reasonable terms, andtechnical cooperation through trainingof personnel and interchange of expertsand information.
Together, the agreements and under-standings reached at Mexico City con-stitute a postwar economic programwhich has as its fixed objective an ex-panding United States economy in anexpanding world economy. It is recog-nized that the achievement of either de-pends largely upon the achievement ofthe other.
The broad principles underlying thisgeneral policy were declared in the Eco-nomic Charter of the Americas, whichcalls for (1) reduction of barriers tointernational trade; (2) elimination ofthe excesses of economic nationalism;(3) prevention of restrictive practices bycartels or through other private businessarrangement; (4) just and equitabletreatment for foreign enterprise andcapital; and (5) promotion of privateenterprise; (6) equality of access to rawmaterials and producers' goods; (7) in-ternational action to facilitate the or-derly distribution of burdensome sur-pluses of certain commodities; and (8)progressive realization of the Declara-tion of Philadelphia adopted by the In-ternational Labor Conference.
It remains to give these principlesforce and effect through specific inter-national undertakings and obligations.
Digitized for FRASER http://fraser.stlouisfed.org/ Federal Reserve Bank of St. Louis

10 SURVEY OF CURRENT BUSINESS April 1945
Industrial Concentration of EmploymentBy Donald W. Paden
THE IMPACT OF THE WAR uponbusiness and employment has led to
an awareness of the importance of smallbusiness and a growing interest in itsrole in the post-war economy. Beforethe war approximately eight million em-ployees and over two million business-men depended for a livelihood upon firmswith fewer than 50 employees.
Chart 1 indicates that these small or-ganizations in 1939 employed roughlyone-third of the wage and salary earnersin all industries other than agriculture,Government, and the railroads. Thesmallest firms—those employing 1-3 per-sons—accounted for 7 percent of suchemployment.
The requirements of war productionand the armed services have producedmarked changes in the total numberof business enterprises and in the rela-tive importance of large and small sizedfirms. These changes are particularlysignificant in the light of the paramountpost-war needs for expanding, over pre-war levels, the volume of consumption,sales, and employment.
Over-All TrendsIn analyzing wartime changes in the
distribution of firms and employment bysize of firm, third quarter statistics ofthe number of employers covered by theSocial Security program have been usedfor the period 1939-43/ In general, thefigures indicate general trends in thesize structure of American business dur-ing the 5 years, 1939-43.2
The concept of business size is a rela-
NOTE: Mr. Paden is a member of the Busi-ness Structure Unit, Bureau of Foreign andDomestic Commerce.
1 In 1940 the Census of the Labor Forcelisted 8,475,000 people engaged in agriculture,forestry, and fishing; 3,318,000 in the pro-fessions and related services; 2,327,000 in do-mestic service; 1,753,000 in Government; andover a million in the railways. These figuresindicate roughly the number of people inthe labor force who are not covered by theSocial Security program. Approximately halfa million employees in national banks anddocumented United States vessels were in-cluded for the first time in the 1940 SocialSecurity tabulation. The number of firmsinvolved was not sufficiently large to affectthe over-all trends.
The data are based on information sup-plied to the Bureau of Old-Age and Sur-vivors Insurance by business firms coveredby the Social Security Act. Owner-oper-ated enterprises with no employees, to-gether with agricultural ard railroad estab-lishments, are excluded.
2 A statement of qualifications togetherwith a description of the methods andsources, can be found at the end of the ar-ticle. More precise use of the statistics mustawait the further development and improve-ment of the basic data available in the rec-ords of the Bureau of Old-Age and SurvivorsInsurance.
tive one, depending on the technologyand integration which has occurred inparticular industries. A firm employing50 workers in the manufacture of steelingots would indeed be small; on theother hand, a concern in the retail foodbusiness with the same number of em-ployees would be relatively large.
The designation of concerns with fewerthan 50 employees as "small" and othersas "large" was dictated in large part bythe nature of the basic data rather thanbecause of any inherent usefulness of thecriterion itself. The definition does havethe advantage, however, of marking offfor examination a sizable and importantsegment of the economy. For all indus-try groups in 1939 and 1943, firms withfewer than 50 employees employed be-tween 25 and 33 percent of the total num-ber of workers covered by the Social Se-curity program.
Suitably qualified, the number of em-ployees engaged by a firm is a usefulmeasure of the size of the firm in the non-agricultural economy. Except for somebranches of finance and some types ofindustry where the investment or volumeof turnover per worker is extremely high,the number of employees is also an indi-cator, though admittedly a very roughone, of the relative resources of a busi-ness enterprise.
While many exceptions come to mind
Chart 1.—Percentage Distributionof Employing Organizations andEmployment, by Size of Firm,1939 x*
FIGURES IN BAR REFER TOEMPLOYEE SIZE OF FIRM
100
80
60
20
0
Ipiilii
/
/ //
/ X I 1,0001OR
IMORE I
FIRMS EMPLOYMENTa a 45-209
1 Percentage of firms having 1,000 or moreemployees is 0.12 and does not show in thechart.
Source : Bureau of Old-Age and Survivors In-surance, Social Security Board.
in dealing with specific industries, theredoes exist in general a common set ofproblems for the smaller sized firms.These are determined in large measureby the limited financial resources at theirdisposal and their special competitive sit-uation, either as it relates to the particu-lar industry in which they do business orwith respect to other firms in the in-dustry.
Number of Concerns.
A summary picture of the changes inrelative importance of concerns of dif-ferent sizes can be gathered from chart2 and the supporting data in table 1. Thechart shows changes for the period 1939-43 in the number of firms and employ-ment in these firms for concerns in threemajor groups.
Referring to the top panel of chart 2on the number of employing organiza-tions, two points stand out. First, from1939 up to the time of Pearl Harbor—aperiod of expansion in business activity—the number of firms in each of the threecategories increased, with the larger sizedfirms consistently pacing the small. Itmust be noted that, with employment ex-panding rapidly, some of the firms whichwere in the medium size group un-doubtedly shifted to the larger size group.The fact remains, however, that prior tothe restrictions and special problems ofthe war period, the 2 years preceding ourentry into the war, which were also yearsof increasing prosperity, witnessed asteady growth in the number of busi-nesses in each of the three major sizecategories.
The indexes, however, need some quali-cation. With over 96 percent of the firmsin the lowest size group, over 3 percent inthe middle size group, and less than 1 per-cent in the upper size group, the samenumber of concerns added to each of thethree groups would show a higher pro-portionate increase in the large than inthe small concerns.
Second, since 1941 there was a disparityof movement in the number of businessenterprises in the various size groups.The number of firms with 1,000 or moreemployees continued to increase in 1942,and though it dropped in 1943 was stilldefinitely above that in 1941. The othertwo groups showed decreases in each ofthe 2 years.
Only a small part of the divergencebetween the size groups can be attributedto a shift in the classification of thesmaller sized firms due to increased em-ployment, since the total number of con-cerns decreased only slightly less than didthe smallest size group. Prom 1941 to1943, the largest size group increased bya few hundred concerns, while the nexttwo size groups decreased by roughly 12,-000 and 270,000 concerns respectively.
Digitized for FRASER http://fraser.stlouisfed.org/ Federal Reserve Bank of St. Louis

April 1945 SURVEY OF CURRENT BUSINESS 11
The predominant reason for the shiftwas the discontinuance of many smallbusinesses and a sharp decline of newfirms entering business. The changes innumber of concerns, moreover, do not in-dicate the total amount of shifting whichhas occurred. Many concerns which werelarge in 1941 may have been replaced byother concerns which expanded as a re-sult of the war.
The decline in new enterprises wasvery marked in both 1942 and 1943. Inthe case of firms with from 1-49 persons,the number of new businesses in the firsttwo war years was less than half thenumber entering in 1940 and 1941. Thenumber of discontinued businesses in-creased markedly in 1942—over 40 per-cent above 1941 for the small firms—butby 1943 the number declined to aboutthe same total as in 1940 and 1941. Inthe case of the smallest firms it was evenlower than in the 2 years prior to thewar.3
The operation of Selective Service indrafting men into the armed services wasundoubtedly an important factor in de-termining changes in the number of busi-ness enterprises during the war years.Wartime uncertainties encouraged thediscontinuance of business, rather thanabsentee ownership or transfer, in thecase of many small employers who werecalled to arms. Another factor contrib-uting to the decline of small businesseswas the attractive alternative of em-ployment in war production, with itspecuniary as well as patriotic incentives.The shifts in war production, with thedecline in consumer durable goods pro-duction, also had its effects.
Employment.
The trend in employment for firms ofdifferent sizes is shown in the lower panelof chart 2. By the end of 1943 small con-cerns as a group were employing fewerpeople than in 1939. Even in the 50-999group, employment was only slightlylarger than before the war. Very largeconcerns, on the other hand, were addingmore people to their working force thanever before. Approximately 3,500 of thelargest firms employed almost all of the8,000,000 people added to the industriallabor force during the past 5 years.
The expansion of normal business ac-tivity during 1939 through 1941 wasaccompanied by an increase in the num-ber of workers in firms of all sizes. Afterthe outbreak of the war the large plantswhich could easily be converted to war-time production 'and the new speciallybuilt war plants accounted for a doublingof employment in plants with over 1,000workers. In large part, the war de-manded a type and magnitude of productwhich could be manufactured most ex-peditiously only in large plants. TheGovernment, moreover, was the sole cus-tomer, the goods moving directly fromthe manufacturer to the armed forces.As a consequence, although industrialoutput increased enormously, the volumeof goods moving through ordinary dis-tributive channels did not increase much.
Chart 2.—Employing Organiza-tions and Employment, by Sizeof Firm x
ii FIRMS WITH 1000 OR MORE EMPLOYEES• • - • F I R M S WITH 5 0 - 9 9 9 EMPLOYEES
FIRMS WITH 1-49 EMPLOYEES
INDEX, 1939 = 100150
2 5
75
200
175 -
150
125 -
100 -
7 5
EMPLOYINGORGANIZATIONS^
EMPLOYEES
1939 1940 1941 1942 1943D. D. 45-187
3 "New and Discontinued Businesses, 1940-43," SURVEY OF CURRENT BUSINESS, July 1944.
1 Data for 1941-43 are adjusted for nonreport-ing of employment.
2 Excludes firms without employees.
Source : Bureau of Old-Age and Survivors In-surance, Social Security Board.
In the fields in which small concernswere dominant., especially retail, whole-sale, and service trades, employment de-clined below the 1941 volume. The re-sult, of course, was a decline in the over-all figure for small business. As in thecase of the owners, many of the em-ployees in these small firms were draftedinto the army, while many more foundthat their earnings would be markedlyincreased in large war plants. Thus, oneof the contributions of small business tothe war effort was in providing a pool ofworkers upon which war industries coulddraw.
Part of the increase in employment inthe very large concerns can be accountedfor by the increase in the number offirms in war industries. Medium sizedbusinesses engaged in war work expandedtheir labor force sufficiently to be classi-fied with the larger organizations. Aswas pointed out above, in terms of num-ber of concerns the shift was limited to afew hundred firms. But with pre-warshipyards and aircraft factories addingworkers by the hundreds of thousands,the employment picture was undoubtedlyimportantly influenced by the growth insize of these medium-sized concerns.
Earnings.
The amount of wages paid by employ-ers offers another indication of thechanging position of large and smallbusiness. As indicated in chart 3, therelative increase in wages differed widelyfor concerns in different size groups.Total wage payments of small concerns
rose by 40 percent. Payments in con-cerns with 50 to 999 employees went up70 percent, and in the largest organiza-tions increased over 200 percent. Need-less to say, a great part of the rise inwage payments for the largest concernswas due to the tremendous increase inthe number of people employed. Al-though the total wage bill followedclosely the number of employees hired,it was influenced also by wage rates, over-time, and decreased seasonal and casualunemployment. Even in small concernswhere the number of employees has de-creased, the total wage bill has gone up.
The result of the changes in employ-ment and wages is shown in table 2 whichpresents, by size of firm, average thirdquarter earnings per job, found by divid-ing wage payments by the number ofemployees as of a specific pay period inthe quarter. Although earnings perworker in excess of $3,000 per year arenot included, the data are fairly repre-sentative of differentials which existamong firms of various sizes. Not onlywere earnings higher in the larger firmsbut they increased more rapidly than inconcerns with fewer than 50 employees.Overtime and high rates of pay were un-doubtedly effective in enabling shipyards,airplane plants, and other war industriesto attract employees away from less es-sential and less remunerative activity.
In 1943, 3,500 large employing organi-zations employed 45 percent of all em-ployees and paid 52 percent of the totalwage bill of persons in the covered indus-tries. The corresponding percentages in1939 were 30 and 36, respectively.
Changes in the concentration of firms,employment, and wage payments areshown in more detail in table 3. Thepercentage distributions of firms re-mained remarkably stable from 1939 to1943 in spite of differences in the rate ofchange noted in chart 2. As was to beexpected from the foregoing analysis,
Table 1.—Indexes of Number of Employ-ing Organizations, Employees, andTaxable Wages, by Size of Firm,1939-43 1
[1939 = 100]
Size of firm
Total, all size classes-1-49 employees _50-999 employees1,000 or more employees.- |l00. 0
1939 1940 19412 19422 19432
Employing organizations
Employees
Total, all size classes_1-49 employees..
1100.0 109.2 123.3.1100.01107. 3
50-999 employees J100. 0 107. 51,000 or more employees.-j 100. 0J113.1
116. 4120. 5
132.6101.9 98.3119.9 112.4
194.6
Taxable wages
0 1Total, all size classes 100.0 110. 4|145. 51-49 employees 100.0 104. 7|116. 750-999 employees 100.0 108.1 140. 21,000 or more employees., j 100.0 117. 6 174. 7 248. 5 312.
130.2167.5
185. 3 2) 5. 4142. 5172. 4
1 Firms without employees excluded. Data are for thelast pay period of the third quarter of each year.
2 Adjusted for nonreporting of employment.
Source: Basic data from Bureau of Old-Age and Sur-vivors Insurance.
Digitized for FRASER http://fraser.stlouisfed.org/ Federal Reserve Bank of St. Louis
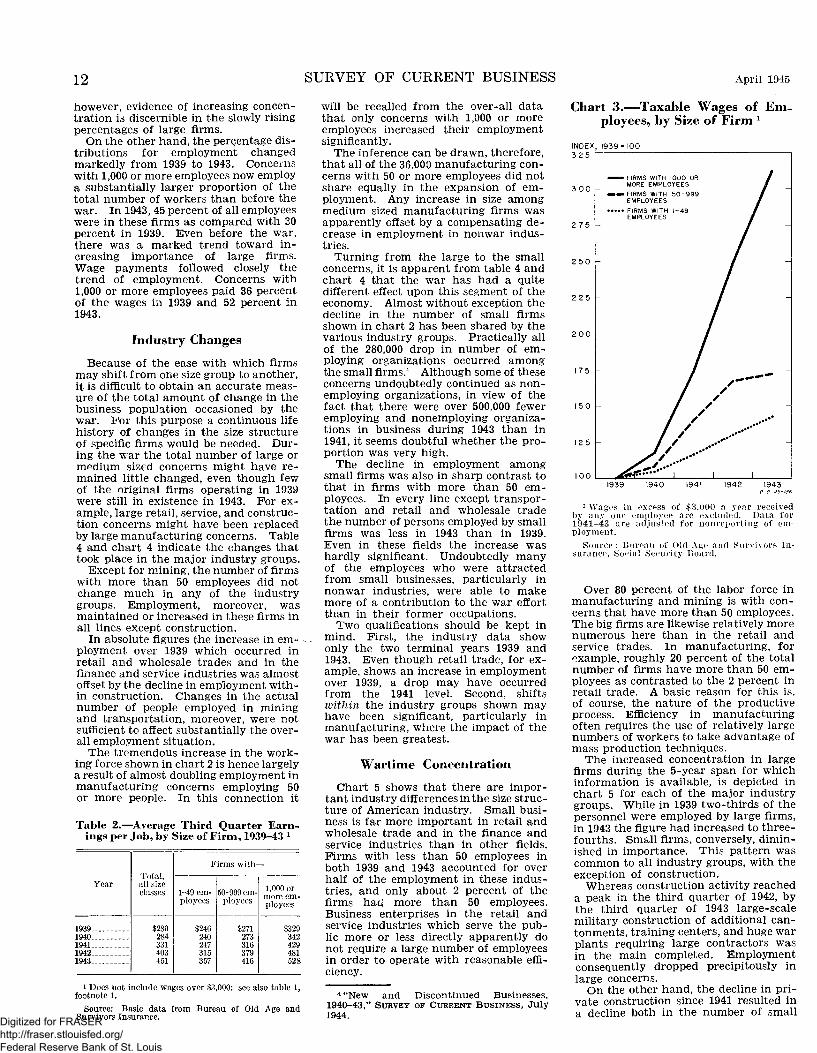
12 SURVEY OF CURRENT BUSINESS April 1945
however, evidence of increasing concen-tration is discernible in the slowly risingpercentages of large firms.
On the other hand, the percentage dis-tributions for employment changedmarkedly from 1939 to 1943. Concernswith 1,000 or more employees now employa substantially larger proportion of thetotal number of workers than before thewar. In 1943, 45 percent of all employeeswere in these firms as compared with 30percent in 1939. Even before the war,there was a marked trend toward in-creasing importance of large firms.Wage payments followed closely thetrend of employment. Concerns with1,000 or more employees paid 36 percentof the wages in 1939 and 52 percent in1943.
Industry Changes
Because of the ease with which firmsmay shift from one size group to another,it is difficult to obtain an accurate meas-ure of the total amount of change in thebusiness population occasioned by thewar. For this purpose a continuous lifehistory of changes in the size structureof specific firms would be needed. Dur-ing the war the total number of large ormedium sized concerns might have re-mained little changed, even though fewof the original firms operating in 1939were still in existence in 1943. For ex-ample, large retail, service, and construc-tion concerns might have been replacedby large manufacturing concerns. Table4 and chart 4 indicate the changes thattook place in the major industry groups.
Except for mining, the number of firmswith more than 50 employees did notchange much in any of the industrygroups. Employment, moreover, wasmaintained or increased in these firms inall lines except construction.
In absolute figures the increase in em-ployment over 1939 which occurred inretail and wholesale trades and in thefinance and service industries was almostoffset by the decline in employment with-in construction. Changes in the actualnumber of people employed in miningand transportation, moreover, were notsufficient to affect substantially the over-all employment situation.
The tremendous increase in the work-ing force shown in chart 2 is hence largelya result of almost doubling employment inmanufacturing concerns employing 50or more people. In this connection it
Table 2.—Average Third Quarter Earn-ings per Job, by Size of Firm, 1939-43 1
Year
19391940194119421943
Total,all sizeclasses
$280284331403451
Firms with—
1-49 em-ployees
$246240247315357
50-999 em-ployees
$271273316379416
1,000 ormore em-ployees
$329342429481528
will be recalled from the over-all datathat only concerns with 1,000 or moreemployees increased their employmentsignificantly.
The inference can be drawn, therefore,that all of the 36,000 manufacturing con-cerns with 50 or more employees did notshare equally in the expansion of em-ployment. Any increase in size amongmedium sized manufacturing firms wasapparently offset by a compensating de-crease in employment in nonwar indus-tries.
Turning from the large to the smallconcerns, it is apparent from table 4 andchart 4 that the war has had a quitedifferent effect upon this segment of theeconomy. Almost without exception thedecline in the number of small firmsshown in chart 2 has been shared by thevarious industry groups. Practically allof the 280,000 drop in number of em-ploying organizations occurred amongthe small firms.4 Although some of theseconcerns undoubtedly continued as non-employing organizations, in view of thefact that there were over 500,000 feweremploying and nonemploying organiza-tions in business during 1943 than in1941, it seems doubtful whether the pro-portion was very high.
The decline in employment amongsmall firms was also in sharp contrast tothat in firms with more than 50 em-ployees. In every line except transpor-tation and retail and wholesale tradethe number of persons employed by smallfirms was less in 1943 than in 1939.Even in these fields the increase washardly significant. Undoubtedly manyof the employees who were attractedfrom small businesses, particularly innonwar industries, were able to makemore of a contribution to the war effortthan in their former occupations.
Two qualifications should be kept inmind. First, the industry data showonly the two terminal years 1939 and1943. Even though retail trade, for ex-ample, shows an increase in employmentover 1939, a drop may have occurredfrom the 1941 level. Second, shiftswithin the industry groups shown mayhave been significant, particularly inmanufacturing, where the impact of thewar has been greatest.
Wartime Concentration
Chart 5 shows that there are impor-tant industry differences in the size struc-ture of American industry. Small busi-ness is far more important in retail andwholesale trade and in the finance andservice industries than in other fields.Firms with less than 50 employees inboth 1939 and 1943 accounted for overhalf of the employment in these indus-tries, and only about 2 percent of thefirms had more than 50 employees.Business enterprises in the retail andservice industries which serve the pub-lic more or less directly apparently donot require a large number of employeesin order to operate with reasonable effi-ciency.
Chart 3.—Taxable Wages of Em-ployees, by Size of Firm 1
INDEX, 1933 = 1003 2 5
2 7 5
2 2 5
2 0 0
175
1 5 0
125
• FIRMS WITH 1000 ORMORE EMPLOYEES
• FIRMS WITH 5 0 - 9 9 9EMPLOYEES
• FIRMS WITH 1-49EMPLOYEES
i Does not include wages over $3,000: see also table 1,footnote 1.
Source: Basic data from Bureau of Old Age andSurvivors Insurance.
4 "New and Discontinued Businesses,1940-43," SURVEY OF CURRENT BUSINESS, July1944.
1 Wages in excess of $3,000 a year receivedby any one employee are excluded. Data for1941-43 are adjusted for nonreporting of em-ployment.
Source : Bureau of Old-Age and Survivors In-surance, Social Security Board.
Over 80 percent of the labor force inmanufacturing and mining is with con-cerns that have more than 50 employees.The big firms are likewise relatively morenumerous here than in the retail andservice trades. In manufacturing, forexample, roughly 20 percent of the totalnumber of firms have more than 50 em-ployees as contrasted to the 2 percent inretail trade. A basic reason for this is,of course, the nature of the productiveprocess. Efficiency in manufacturingoften requires the use of relatively largenumbers of workers to take advantage ofmass production techniques.
The increased concentration in largefirms during the 5-year span for whichinformation is available, is depicted inchart 5 for each of the major industrygroups. While in 1939 two-thirds of thepersonnel were employed by large firms,in 1943 the figure had increased to three-fourths. Small firms, conversely, dimin-ished in importance. This pattern wascommon to all industry groups, with theexception of construction.
Whereas construction activity reacheda peak in the third quarter of 1942, bythe third quarter of 1943 large-scalemilitary construction of additional can-tonments, training centers, and huge warplants requiring large contractors wasin the main completed. Employmentconsequently dropped precipitously inlarge concerns.
On the other hand, the decline in pri-vate construction since 1941 resulted ina decline both in the number of small
Digitized for FRASER http://fraser.stlouisfed.org/ Federal Reserve Bank of St. Louis
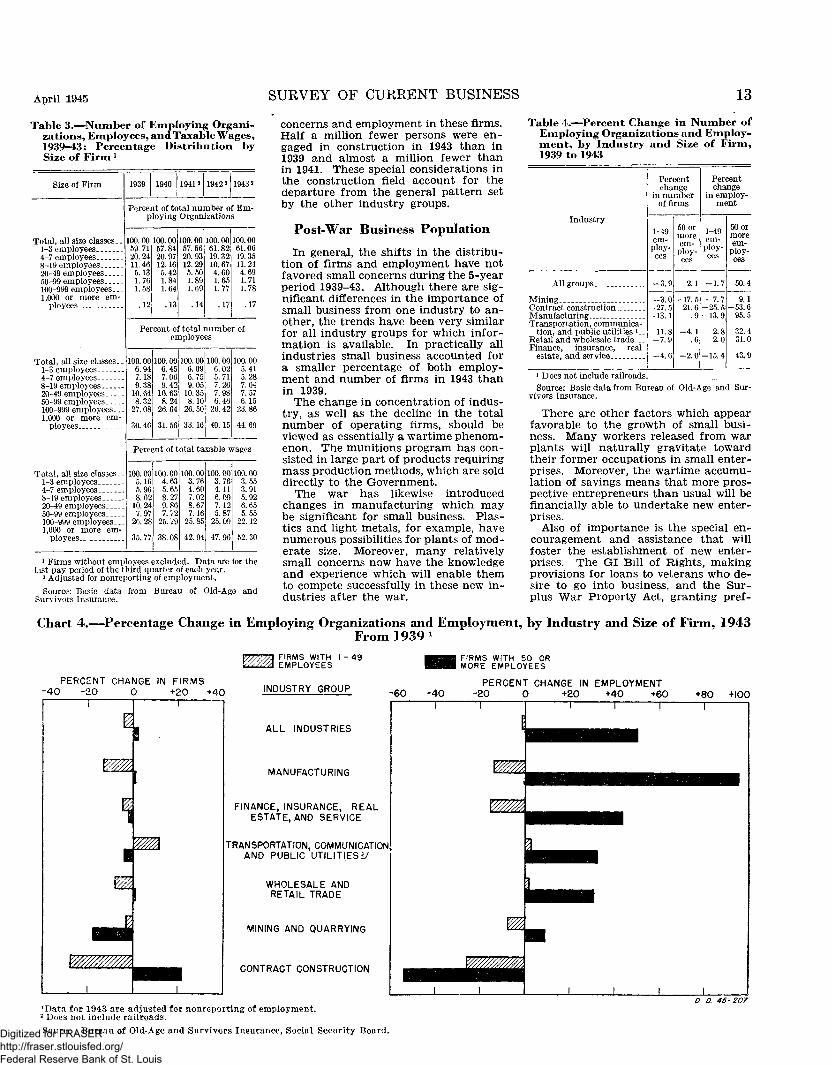
April 1945
Table 3.—Number of Employing Organi-zations, Employees, and Taxable Wages,1939-43: Percentage Distribution bySize of Firm J
Size of Firm
Total, all size classes..1-3 employees4-7 employees8-19 employees20-49 employees50-99 employees100-999 employees. __1,000 or more em-
ployees
Total, all size classes- -1-3 employees4-7 employees8-19 employees20-49 employees50-99 employees100-999 employees-..1,000 or more em-
ployees
Total, all size classes. _1-3 employees4-7 employees8-19 employees20-49 employees50-99 employees100-999 employees.._1,000 or more em-
ployees
100.0059.7120.2411.465.131.761.58
.12
1939 1940 19412 1942 2 1943 2
Percent of total number of Em-ploying Organizations
100.0057.8420.9712.165.421.84L64
.13
100.0057.5620.12.
5.11
9329508969
14
10061
0082
19.3210.67411
606577
17
100.0061.0619.3511.244.691.711.78
.17
Percent of total number ofemployees
100.00 100.00 100.00 100.00 100.006.94 6.45 6.09 6.02 5.417.18 7.06 6.75 5.71 5.289.38 9.42 9.05 7.26 7.0410.64 10.63 10.35 7.98 7.578.32 8.24 8.10 6.46 6.1527.08 26.64 26.50 26.42 23.86
30.46 31.56 33.16 40.15 44.69
Percent of total taxable wages
100.005.165.968.62
10.247.97
26.28
35.77
100.004.635.658.279.867.72
25.79
38.08
100.003.764.607.028.677.16
25.85
42.94
100.003.764.116.097.125.87
25.09
47.96
L00. 003.553.915.926.655.5522.12
52.30
1 Firms without employees excluded. Data are for thelast pay period of the third quarter of each year.
2 Adjusted for nonreporting of employment.
Source: Basic data from Bureau of Old-Age andSurvivors Insurance.
SURVEY OF CURRENT BUSINESS
concerns and employment in these firms.Half a million fewer persons were en-gaged in construction in 1943 than in1939 and almost a million fewer thanin 1941. These special considerations inthe construction field account for thedeparture from the general pattern setby the other industry groups.
Post-War Business Population
In general, the shifts in the distribu-tion of firms and employment have notfavored small concerns during the 5-yearperiod 1939-43. Although there are sig-nificant differences in the importance ofsmall business from one industry to an-other, the trends have been very similarfor all industry groups for which infor-mation is available. In practically allindustries small business accounted fora smaller percentage of both employ-ment and number of firms in 1943 thanin 1939.
The change in concentration of indus-try, as well as the decline in the totalnumber of operating firms, should beviewed as essentially a wartime phenom-enon. The munitions program has con-sisted in large part of products requiringmass production methods, which are solddirectly to the Government.
The war has likewise introducedchanges in manufacturing which maybe significant for small business. Plas-tics and light metals, for example, havenumerous possibilities for plants of mod-erate size. Moreover, many relativelysmall concerns now have the knowledgeand experience which will enable themto compete successfully in these new in-dustries after the war.
13
Table 4.—Percent Change in Number ofEmploying Organizations and Employ-ment, by Industry and Size of Firm,1939 to 1943
Industry
All groups
MiningContract constructionManufacturingTransportation, communica-
tion, and public utilities 1
Retail and wholesale trade. __Finance, insurance, real
estate, and service
1 Does not include railroads
Percentchange
in numberof firms
1-49em-
ploy-ees
-3 .9
-3 .0-27.5-13.1
11.8-7 .9
-4 .6
Source: Basic data from Bureau ofvivors Insurance.
50 ormoreem-
ploy-ees
2.1
-17.521.6
.9
- 4 . 1.6
-2 .0
Old-i
Percentchange
in employ-ment
1-49em-
ploy-ees
-1 .7
-7 .7-25.5-13.9
2.82.0
-15.4
50 ormoreem-
ploy-ees
50.4
9.1-53.6
95.5
32.431.0
43.9
Lge and Sur-
There are other factors which appearfavorable to the growth of small busi-ness. Many workers released from warplants will naturally gravitate towardtheir former occupations in small enter-prises. Moreover, the wartime accumu-lation of savings means that more pros-pective entrepreneurs than usual will befinancially able to undertake new enter-prises.
Also of importance is the special en-couragement and assistance that willfoster the establishment of new enter-prises. The GI Bill of Rights, makingprovisions for loans to veterans who de-sire to go into business, and the Sur-plus War Property Act, granting pref-
Charl 4.—-Percentage Change in Employing Organizations and Employment, by Industry and Size of Firm, 1943From 1939 1
PERCENT CHANGE IN FIRMS-40 -20 0 +20 +40
FIRMS WITH \ - 49EMPLOYEES
INDUSTRY GROUP
ALL INDUSTRIES
MANUFACTURING
FINANCE, INSURANCE, REALESTATE, AND SERVICE
TRANSPORTATION, COMMUNICATIONAND PUBLIC UTILITIES*/
WHOLESALE ANDRETAIL TRADE
MINING AND QUARRYING
CONTRACT CONSTRUCTION
1Data for 1943 are adjusted for nonreporting of employment.2 Does not include railroads.Source : Bureau of Old-Age and Survivors Insurance, Social Security Board.
-60 -40
FIRMS WITH 50 ORi MORE EMPLOYEES
PERCENT CHANGE IN EMPLOYMENT-20 O +20 +40 +60 +80 +IOO
D. D. 45-207
Digitized for FRASER http://fraser.stlouisfed.org/ Federal Reserve Bank of St. Louis
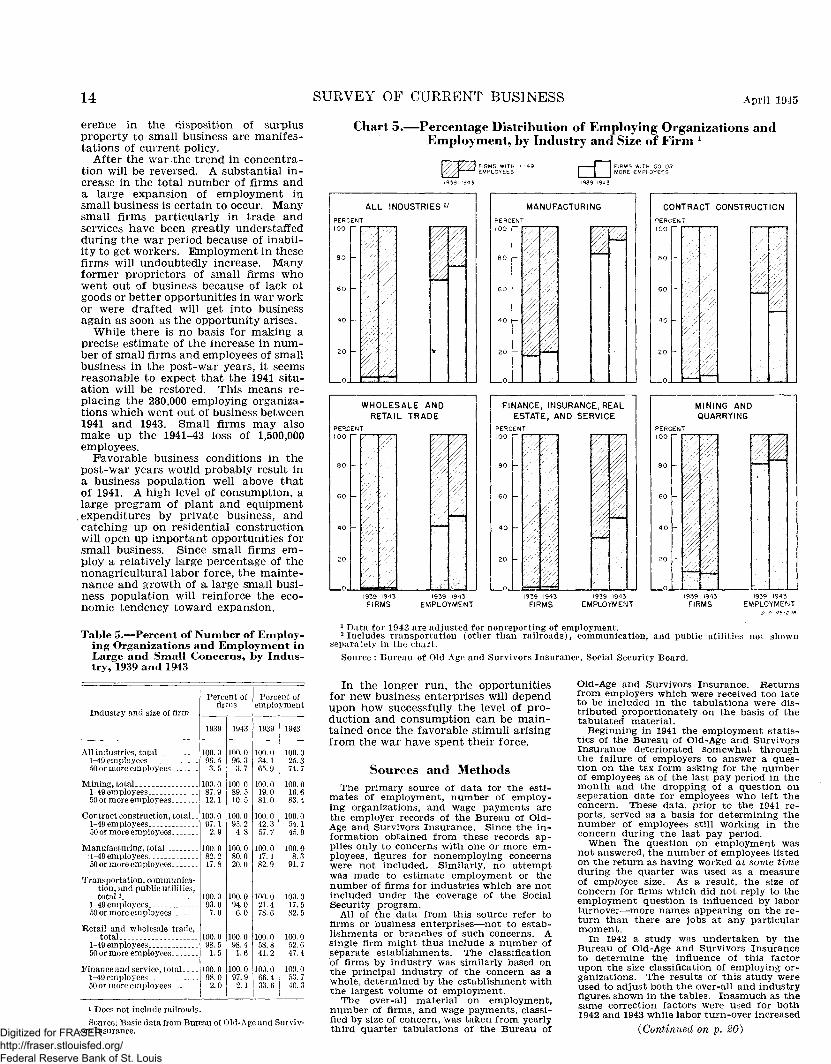
14 SURVEY OF CURRENT BUSINESS April 1945
erence in the disposition of surplusproperty to small business are manifes-tations of current policy.
After the war the trend in concentra-tion will be reversed. A substantial in-crease in the total number of firms anda large expansion of employment insmall business is certain to occur. Manysmall firms particularly in trade andservices have been greatly understaffedduring the war period because of inabil-ity to get workers. Employment in thesefirms will undoubtedly increase. Manyformer proprietors of small firms whowent out of business because of lack ofgoods or better opportunities in war workor were drafted will get into businessagain as soon as the opportunity arises.
While there is no basis for making aprecise estimate of the increase in num-ber of small firms and employees of smallbusiness in the post-war years, it seemsreasonable to expect that the 1941 situ-ation will be restored. This means re-placing the 280,000 employing organiza-tions which went out of business between1941 and 1943. Small firms may alsomake up the 1941-43 loss of 1,500,000employees.
Favorable business conditions in thepost-war years would probably result ina business population well above thatof 1941. A high level of consumption, alarge program of plant and equipment
.expenditures by private business, andcatching up on residential constructionwill open up important opportunities forsmall business. Since small firms em-ploy a relatively large percentage of thenonagricultural labor force, the mainte-nance and growth of a large small busi-ness population will reinforce the eco-nomic tendency toward expansion.
Table 5.—Percent of Number of Employ-ing Organizations and Employment inLarge and Small Concerns, by Indus-try, 1939 and 1943
Industry and size of firm
All industries, total1-49 employees50 or more employees
Mining, total1-49 employees50 or more employees-
Contract construction, total. _1-49 employees50 or more employees
Manufacturing, total: 1-49 employees50 or more employees
Transportation, communica-tion, and public utilities,total i
1-49 employees50 or more employees
Retail and wholesale trade,total
1-49 employees50 or more employees
Finance and service, total1-49 employees50 or more employees
Percent offirms
1939
100.096.53.5
100.087.912.1
100.097.1
2.9
100.082.217.8
100.093.07.0
100.098.51.5
100.098.0
2.0
1943
100.096.33.7
100.089.510.5
100.095.2
4.8
100.080.020.0
100.094.06.0
100.08.41.6
100.097.92.1
Percent ofemployment
1939 1943
100.034.165.9
100.019.081.0
100. 012.357. 7
100.017.182.9
100.021.478.6
100.058.841.2
100.066.433.6
100.025.374.7
100.016.683. 4
100.054.145.9
100.08.3
91.7
100.017.582.5
100.052.647.4
100.053.746.3
Chart 5.—Percentage Distribution of Employing Organizations andEmployment, by Industry and Size of Firm x
. T~ I FIRMS WITH 50 OR1 1 I M 0 R E EMPLOYEES
ALL INDUSTRIES^
PERCENT
100
80
60
40
20
. .O
:
-
-
i
MANUFACTURING
PERCENT
1 0 0
8 0
6 0
4 0
2 0
n
-
-
/
• y / /
/
CONTRACT CONSTRUCTION
PERCENT
WHOLESALE ANDRETAIL TRADE
PERCENT
80
60
40
20
-
-
'/''/•
FINANCE, INSURANCE, REALESTATE, AND SERVICE
PERCENT
IOO
80
60
40
20
O_
-
' ' / / / •
' / / / ^
Y/Y.////'/.'/'
MINING ANDQUARRYING
PERCENT
IOO
80
60
40
20
n
-
-
1939 1943FiRMS
1939 1943EMPLOYMENT
1939 1943FIRMS
1939 1943EMPLOYMENT
1939 1943FIRMS
1939 !943EMPLOYMENT
1 Data for 1943 are adjusted for nonreporting of employment.2 Includes transportation (other than railroads), communication, and public utilities not shownseparately in the chart.
Source : Bureau of Old-Age and Survivors Insurance, Social Security Board.
1 Does not include railroads.Source: Basic data from Bureau of Old-Age and Surviv-
ors Insurance.
In the longer run, the opportunitiesfor new business enterprises will dependupon how successfully the level of pro-duction and consumption can be main-tained once the favorable stimuli arisingfrom the war have spent their force.
Sources and MethodsThe primary source of data for the esti-
mates of employment, number of employ-ing organizations, and wage payments arethe employer records of the Bureau of Old-Age and Survivors Insurance. Since the in-formation obtained from these records ap-plies only to concerns with one or more em-ployees, figures for nonemploying concernswere not included. Similarly, no attemptwas made to estimate employment or thenumber of firms for industries which are notincluded under the coverage of the SocialSecurity program.
All of the data from this source refer tofirms or business enterprises—not to estab-lishments or branches of such concerns. Asingle firm might thus include a number ofseparate establishments. The classificationof firms by industry was similarly based onthe principal industry of the concern as awhole, determined by the establishment withthe largest volume of employment.
The over-all material on employment,number of firms, and wage payments, classi-fied by size of concern, was taken from yearlythird quarter tabulations of the Bureau of
Old-Age and Survivors Insurance. Returnsfrom employers which were received too lateto be included in the tabulations were dis-tributed proportionately on the basis of thetabulated material.
Beginning in 1941 the employment statis-tics of the Bureau of Old-Age and SurvivorsInsurance deteriorated somewhat throughthe failure of employers to answer a ques-tion on the tax form asking for the numberof employees as of the last pay period in themonth and the dropping of a question onseparation date for employees who left theconcern. These data, prior to the 1941 re-ports, served as a basis for determining thenumber of employees still working in theconcern during the last pay period.
When The question on employment wasnot answered, the number of employees listedon the return as having worked at some timeduring the quarter was used as a measureof employee size. As a result, the size ofconcern for firms which did not reply to theemployment question is influenced by laborturnover—more names appearing on the re-turn than there are jobs at any particularmoment.
In 1942 a study was undertaken by theBureau of Old-Age and Survivors Insuranceto determine the influence of this factorupon the size classification of employing or-ganizations. The results of this study wereused to adjust both the over-all and industryfigures shown in the tables. Inasmuch as thesame correction factors were used for both1942 and 1943 while labor turn-over increased
(Continued on p. 20)Digitized for FRASER http://fraser.stlouisfed.org/ Federal Reserve Bank of St. Louis

April 1945 SURVEY OF CURRENT BUSINESS 15
Trends in Textiles and ClothingBy Loughlin F. McHugh
SINCE the general stabilization pro-grams went into effect in the spring
of 1943, the pressures of income on ci-vilian supplies have been fairly well con-tained, with the cost of living held to amoderate increase. Analysis of thecomponents of the cost of living reveals,however, that the stabilization programhas not been uniformly successful. Themajor factor in the stability of over-allliving costs has been the food and rentcontrols. Foremost among the compo-nents of living costs which now commandthe attention of the anti-inflationary au-thorities is the civilian clothing situ-ation.
Clothing Expenditures UpThus far in the war, production of
clothing to meet civilian needs has beenwell maintained. Although men's ci-vilian clothing output was in 1944 con-siderably below the record output of1941, the reduction has not been muchmore than the decline in the civilian malepopulation resulting from the growthof the armed forces. Production ofwomen's clothing, on the other hand,reached record levels in 1943, andthough slightly lower in 1944, was stillsubstantially above 1939 production bothin total and on a per capita basis.
The situation is similar in infants' andchildren's wear. War Production Boardestimates of 1944 production indicatethat from prewar years increases of sub-stantial amounts occurred in such cate-gories as overalls, playsuits, sleepinggarments and coat and legging sets-.These increases were accompanied bydecreases in other items, such as dresses,children's knit union suits (largely ex-plained by style trends), and waist suits.It appears, however, that 1944 produc-tion was considerably above 1939, evenif account is taken of the increased childpopulation over this period.
It would seem that the shortage on anover-all basis which has appeared in in-fants' and children's clothing has beenprimarily the result of increased pur-chasing power, and consequently in-creased demand.Price Rise Important.
As durable consumer goods disap-peared from the market under wartimerestrictions of output, clothing outlayshave constituted an increasing portionof total outlays for goods (as distinctfrom total expenditures which also in-clude services), the relative share risingfrom about 13.6 percent in 1941 to over16 percent in 1944.
Consumer expenditures have doubledsince 1939, reaching about 11.5 billion
dollars in 1944. The greatly expandedoutlays in 1944 over pre-war appear tohave been the result not so much of in-creased production as purchases from ac-cumulated stocks, shifts in kinds of ap-parel bought, and most important, in-creased prices. It may be noted, for ex-ample, that expenditures in 1944 rose atabout the same rate as prices, whichaveraged about 8 percent above 1943, asmeasured by the Bureau of Labor Sta-tistics index of clothing costs. Over thewhole war period, from 1939 through1944, this same index shows an advanceof clothing prices of 42 percent, whichmay be compared with a rise of 29 per-cent in the over-all cost of living index.
Recent trends in clothing prices areparticularly disturbing in that after aperiod of relative stability following theinstitution of price controls, prices haveagain assumed a strong upward trend,with many items showing acceleratedincreases.
The rise in clothing prices over thewar period has varied for different typesof apparel, as may be seen in the ac-companying table showing the percentchange in major group prices and thoseof selected items. (See table 1.) Pres-sures have been felt most in cottonclothes. The advance in women's cloth-ing has been more than in men's. Par-ticularly large increases have occurredin women's cotton house dresses and
nightgowns, girls' wool coats, men'sshorts, pajamas, work shirts and over-alls.
It also appears that lower income fami-lies have faced the sharpest price in-creases. The Department of Agricul-ture's index of clothing prices paid byfarmers, in which the articles priced arerelatively low, shows a price increase ofalmost 70 percent over the war period.
The Bureau of Agricultural Economicsestimates price increases from 1939 to1944 of 137 percent for percale house-dresses, 129 percent for cotton work shirtsand 96 percent in percale yard goods.While these considerably larger increasesin prices, as compared with those shownby the Department of Labor index, aredue in part to the different methods ofmeasurement, a major share of the di-vergence results from the generally lowerprice range of the items bought by farm-ers.
In discussing the wartime increases inprices of clothing, it should be remem-bered that the currently available meas-ures of prices take little or no accountof quality deterioration, which while al-most impossible to measure accurately,has been generally regarded as serious.The Mitchell Committee, appointed byChairman W. H. Davis of the President'sCommittee on the Cost of Living, madea rough estimate that this factor wouldadd about 5 percent to the increased
Chart 1.—Percentage Change in Production of Selected Women's andChildren's Outerwear, by Price Lines, First Half 1944 From First Half1943 1
TYPE OF OUTERWEAR- 6 0 - 40 -20
PERCENT+20 +40 +60 +80 +100
GIRLS7 AND TEENS' DRESSES
WOMEN'S, MISSES', ANDJOJIORS' DRESSES
CHILDREN'S AND INFANTS'DRESSES AND SUIT DRESSES
WOMEN'S, MISSES', ANDJUNIORS' BLOUSES, WAISTSAND SHIRTS, AND DICKIES
CHILDREN'S ANDINFANTS' COATS
NOTE.—Mr. McHugh is a member of theCurrent Business Analysis Unit, Bureau ofForeign and Domestic Commerce.
D. D. 45-1321 Percentage changes are based upon preliminary indexes of production for identical firms. Prices
are shown at retail levels.Source : U. S. Department of Commerce.Digitized for FRASER
http://fraser.stlouisfed.org/ Federal Reserve Bank of St. Louis
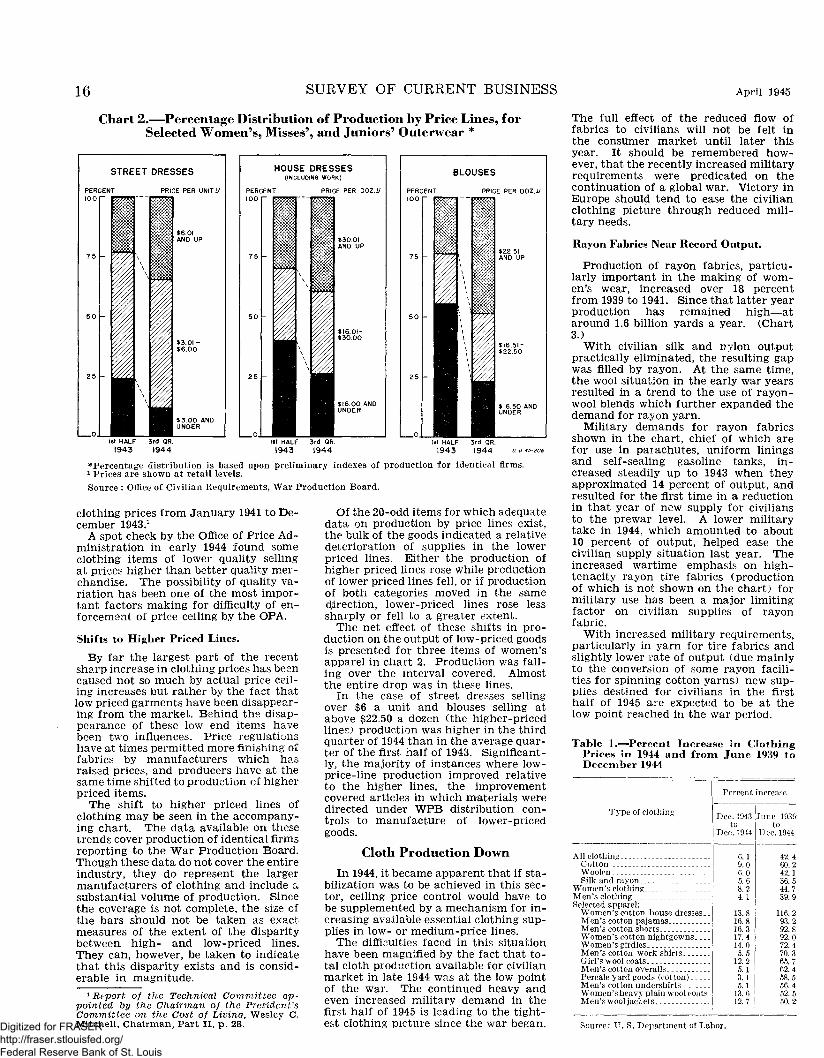
16 SURVEY OF CURRENT BUSINESS April 1945
Chart 2.—Percentage Distribution of Production by Price Lines, forSelected Women's, Misses', and Juniors' Outerwear *
STREET
PERCENT
100
7 5
5 0
25
0.
HIlIi\
I•u
DRESSES
PRICE PER UNlTiy
ill1•1i
$6.01AND UP
$3.01-$6.00
$3.00 ANDUNDER
1st HALF1943
3rd QR.1944
1st HALF1943
3rd QR.1944
*Percentage distribution is based upon preliminary indexes of production for identical firms.1 Prices are shown at retail levels.Source : Office of Civilian Requirements, War Production Board.
clothing prices from January 1941 to De-cember 1943 /•
A spot check by the Office of Price Ad-ministration in early 1944 found someclothing items of lower quality sellingat prices higher than better quality mer-chandise. The possibility of quality va-riation has been one of the most impor-tant factors making for difficulty of en-forcement of price ceiling by the OPA.
Shifts to Higher Priced Lines.
By far the largest part of the recentsharp increase in clothing prices has beencaused not so much by actual price ceil-ing increases but rather by the fact thatlow priced garments have been disappear-ing from the market. Behind the disap-pearance of these low end items havebeen two influences. Price regulationshave at times permitted more finishing offabrics by manufacturers which hasraised prices, and producers have at thesame time shifted to production of higherpriced items.
The shift to higher priced lines ofclothing may be seen in the accompany-ing chart. The data available on thesetrends cover production of identical firmsreporting to the War Production Board.Though these data do not cover the entireindustry, they do represent the largermanufacturers of clothing and include c*substantial volume of production. Sincethe coverage is not complete, the size ofthe bars should not be taken as exactmeasures of the extent of the disparitybetween high- and low-priced lines.They can, however, be taken to indicatethat this disparity exists and is consid-erable in magnitude.
1 Report of the Technical Comviittee ap-pointed by the Chairman of the President'sCommittee on the Cost of Living, Wesley C.Mitchell, Chairman, Part II, p. 28.
Of the 20-odd items for which adequatedata on production by price lines exist,the bulk of the goods indicated a relativedeterioration of supplies in the lowerpriced lines. Either the production ofhigher priced lines rose while productionof lower priced lines fell, or if productionof both categories moved in the samedirection, lower-priced lines rose lesssharply or fell to a greater extent.
The net effect of these shifts in pro-duction on the output of low-priced goodsis presented for three items of women'sapparel in chart 2. Production was fall-ing over the interval covered. Almostthe entire drop was in these lines.
In the case of street dresses sellingover $6 a unit and blouses selling atabove $22.50 a dozen (the higher-pricedlines) production was higher in the thirdquarter of 1944 than in the average quar-ter of the first half of 1943. Significant-ly, the majority of instances where low-price-line production improved relativeto the higher lines, the improvementcovered articles in which materials weredirected under WPB distribution con-trols to manufacture of lower-pricedgoods.
Cloth Production DownIn 1944, it became apparent that if sta-
bilization was to be achieved in this sec-tor, ceiling price control would have tobe supplemented by a mechanism for in-creasing available essential clothing sup-plies in low- or medium-price lines.
The difficulties faced in this situationhave been magnified by the fact that to-tal cloth production available for civilianmarket in late 1944 was at the low pointof the war. The continued heavy andeven increased military demand in thefirst half of 1945 is leading to the tight-est clothing picture since the war began.
The full effect of the reduced flow offabrics to civilians will not be felt inthe consumer market until later thisyear. It should be remembered how-ever, that the recently increased militaryrequirements were predicated on thecontinuation of a global war. Victory inEurope should tend to ease the civilianclothing picture through reduced mili-tary needs.
Rayon Fabrics Near Record Output.
Production of rayon fabrics, particu-larly important in the making of wom-en's wear, increased over 18 percentfrom 1939 to 1941. Since that latter yearproduction has remained high—ataround 1.6 billion yards a year. (Chart3.)
With civilian silk and nylon outputpractically eliminated, the resulting gapwas filled by rayon. At the same time,the wool situation in the early war yearsresulted in a trend to the use of rayon-wool blends which further expanded thedemand for rayon yarn.
Military demands for rayon fabricsshown in the chart, chief of which arefor use in parachutes, uniform liningsand self-sealing gasoline tanks, in-creased steadily up to 1943 when theyapproximated 14 percent of output, andresulted for the first time in a reductionin that year of new supply for civiliansto the prewar level. A lower militarytake in 1944, which amounted to about10 percent of output, helped ease thecivilian supply situation last year. Theincreased wartime emphasis on high-tenacity rayon tire fabrics (productionof which is not shown on the chart) formilitary use has been a major limitingfactor on civilian supplies of rayonfabric.
With increased military requirements,particularly in yarn for tire fabrics andslightly lower rate of output (due mainlyto the conversion of some rayon facili-ties for spinning cotton yarns) new sup-plies destined for civilians in the firsthalf of 1945 are expected to be at thelow point reached in the war period.
Table 1.—Percent Increase in ClothingPrices in 1944 and from June 1939 toDecember 1944
Type of clothing
A11 clothingCottonWoolenSilk and rayon
Women's clothingMen's clothing...Selected apparel:
Women's cotton house dresses..Men's cotton pajamasMen's cotton shortsWomen's cotton nightgownsWomen's girdlesMen's cotton work shirtsGirl's wool coatsMen's cotton overallsPercale yard goods (cotton)Men's cotton undershirtsWomen's heavy plain wool coats-Men's wool jackets
Percent increase
Dec. 1943 June 1939to
Dec. 1944
6.19.06.05.68.24.1
13.816.816.317.414.05.5
12.25.13.15.1
13.612.7
toDec. 1944
42.460.242.136.544.739.9
116.293.292.892.072.470.365.762.458.556.452.550.2
Source: U. S. Department of Labor.Digitized for FRASER http://fraser.stlouisfed.org/ Federal Reserve Bank of St. Louis
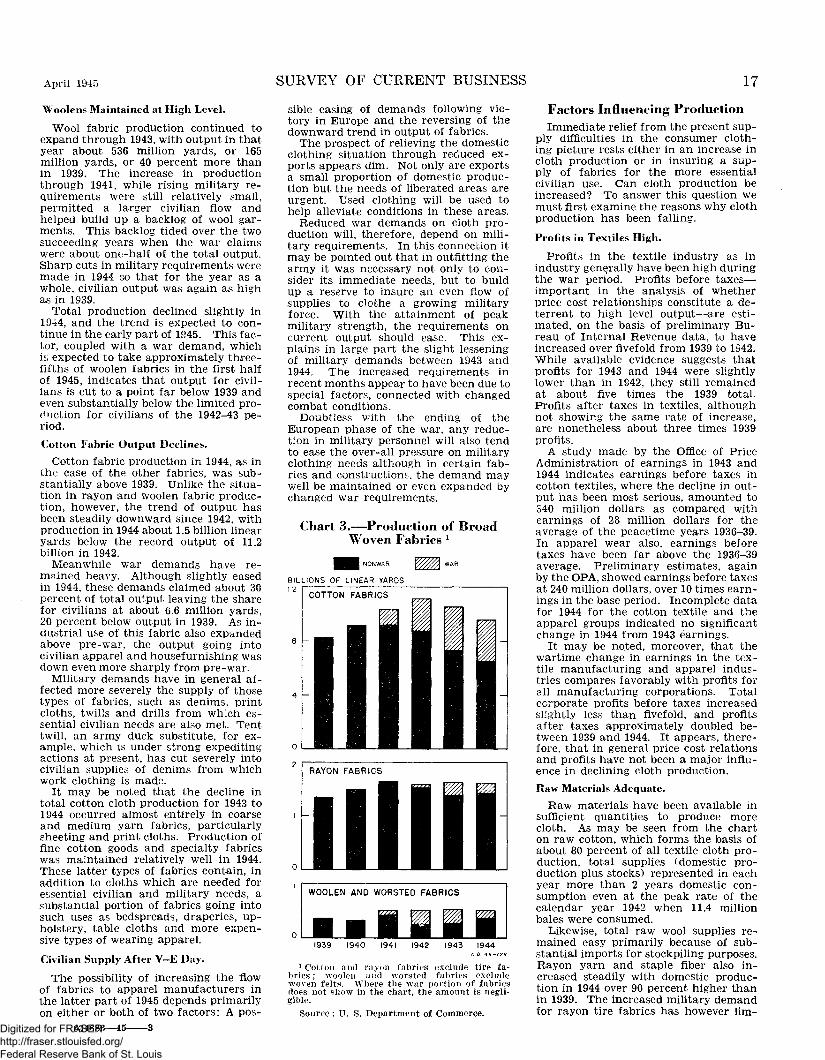
April 1945
Woolens Maintained at High Level.
Wool fabric production continued toexpand through 1943, with output in thatyear about 536 million yards, or 165million yards, or 40 percent more thanin 1939. The increase in productionthrough 1941, while rising military re-quirements were still relatively small,permitted a larger civilian flow andhelped build up a backlog of wool gar-ments. This backlog tided over the twosucceeding years when the war claimswere about one-half of the total output.Sharp cuts in military requirements weremade in 1944 so that for the year as awhole, civilian output was again as highas in 1939.
Total production declined slightly in1944, and the trend is expected to con-tinue in the early part of 1945. This fac-tor, coupled with a war demand, whichis expected to take approximately three-fifths of woolen fabrics in the first halfof 1945, indicates that output for civil-ians is cut to a point far below 1939 andeven substantially below the limited pro-duction for civilians of the 1942-43 pe-riod.
Cotton Fabric Output Declines.
Cotton fabric production in 1944, as inthe case of the other fabrics, was sub-stantially above 1939. Unlike the situa-tion in rayon and woolen fabric produc-tion, however, the trend of output hasbeen steadily downward since 1942, withproduction in 1944 about 1.5 billion linearyards below the record output of 11.2billion in 1942.
Meanwhile war demands have re-mained heavy. Although slightly easedin 1944, these demands claimed about 30percent of total output leaving the sharefor civilians at about 6.6 million yards,20 percent below output in 1939. As in-dustrial use of this fabric also expandedabove pre-war, the output going intocivilian apparel and housefurnishing wasdown even more sharply from pre-war.
Military demands have in general af-fected more severely the supply of thosetypes of fabrics, such as denims, printcloths, twills and drills from wh"ch es-sential civilian needs are also met. Tenttwill, an army duck substitute, for ex-ample, which is under strong expeditingactions at present, has cut severely intocivilian supplies of denims from whichwork clothing is made.
It may be noted that the decline intotal cotton cloth production for 1943 to1944 occurred almost entirely in coarseand medium yarn fabrics, particularlysheeting and print cloths. Production offine cotton goods and specialty fabricsv/as maintained relatively well in 1944.These latter types of fabrics contain, inaddition to cloths which are needed foressential civilian and military needs, asubstantial portion of fabrics going intosuch uses as bedspreads, draperies, up-holstery, table cloths and more expen-sive types of wearing apparel.
Civilian Supply After V—E Day.
The possibility of increasing the flowof fabrics to apparel manufacturers inthe latter part of 1945 depends primarilyon either or both of two factors: A pos-
634686—45 3
SURVEY OF CURRENT BUSINESS
sible easing of demands following vic-tory in Europe and the reversing of thedownward trend in output of fabrics.
The prospect of relieving the domesticclothing situation through reduced ex-ports appears dim. Not only are exportsa small proportion of domestic produc-tion but the needs of liberated areas areurgent. Used clothing will be used tohelp alleviate conditions in these areas.
Reduced war demands on cloth pro-duction will, therefore, depend on mili-tary requirements. In this connection itmay be pointed out that in outfitting thearmy it was necessary not only to con-sider its immediate needs, but to buildup a reserve to insure an even flow ofsupplies to clothe a growing militaryforce. With the attainment of peakmilitary strength, the requirements oncurrent output should ease. This ex-plains in large part the slight lesseningof military demands between 1943 and1944. The increased requirements inrecent months appear to have been due tospecial factors, connected with changedcombat conditions.
Doubtless with the ending of theEuropean phase of the war, any reduc-tion in military personnel will also tendto ease the over-all pressure on militaryclothing needs although in certain fab-rics and constructions, the demand maywell be maintained or even expanded by-changed war requirements.
Chart 3.-—Production of BroadWoven Fabrics x
17
Factors Influencing Production
BILLIONS OF LINEAR YARDSI 2
COTTON FABRICS
RAYON FABRICS
WOOLEN AND WORSTED FABRICS
1939 1940 1941 1942 1943 1944D.D. 45-129
1 Cotton and rayon fabrics exclude tire fa-brics ; woolen and worsted fabrics excludewoven felts. Where the war portion of fabricsdoes not show in the chart, the amount is negli-gible.
Source : U. S. Department of Commerce.
Immediate relief from the present sup-ply difficulties in the consumer cloth-ing picture rests either in an increase incloth production or in insuring a sup-ply of fabrics for the more essentialcivilian use. Can cloth production beincreased? To answer this question wemust first examine the reasons why clothproduction has been falling.
Profits in Textiles High.
Profits in the textile industry as inindustry generally have been high duringthe war period. Profits before taxes—important in the analysis of whetherprice cost relationships constitute a de-terrent to high level output—are esti-mated, on the basis of preliminary Bu-reau of Internal Revenue data, to haveincreased over fivefold from 1939 to 1942.While available evidence suggests thatprofits for 1943 and 1944 were slightlylower than in 1942, they still remainedat about five times the 1939 total.Profits after taxes in textiles, althoughnot showing the same rate of increase,are nonetheless about three times 1939profits.
A study made by the Office of PriceAdministration of earnings in 1943 and1944 indicates earnings before taxes incotton textiles, where the decline in out-put has been most serious, amounted to340 million dollars as compared withearnings of 28 million dollars for theaverage of the peacetime years 1936-39.In apparel wear also, earnings beforetaxes have been far above the 1936-39average. Preliminary estimates, againby the OPA, showed earnings before taxesat 240 million dollars, over 10 times earn-ings in the base period. Incomplete datafor 1944 for the cotton textile and theapparel groups indicated no significantchange in 1944 from 1943 earnings.
It may be noted, moreover, that thewartime change in earnings in the tex-tile manufacturing and apparel indus-tries compares favorably with profits forall manufacturing corporations. Totalcorporate profits before taxes increasedslightly less than fivefold, and profitsafter taxes approximately doubled be-tween 1939 and 1944. It appears, there-fore, that in general price cost relationsand profits have not been a major influ-ence in declining cloth production.
Raw Materials Adequate.
Raw materials have been available insufficient quantities to produce morecloth. As may be seen from the charton raw cotton, which forms the basis ofabout 80 percent of all textile cloth pro-duction, total supplies (domestic pro-duction plus stocks) represented in eachyear more than 2 years domestic con-sumption even at the peak rate of thecalendar year 1942 when 11.4 millionbales were consumed.
Likewise, total raw wool supplies re-mained easy primarily because of sub-stantial imports for stockpiling purposes.Rayon yarn and staple fiber also in-creased steadily with domestic produc-tion in 1944 over 90 percent higher thanin 1939. The increased military demandfor rayon tire fabrics has however lim-
Digitized for FRASER http://fraser.stlouisfed.org/ Federal Reserve Bank of St. Louis

18 SURVEY OF CURRENT BUSINESS April 1945
ited the supply of yarn available forcivilian use.
Facilities Available.
Facilities, too, are available for theproduction of a larger volume of cloth.Table 2 summarizes the salient factorsin this respect.
Carding and combing machines areused early in the process of turning theraw materials into cloth, straighteningthe fibers preparatory to spinning onspindles which make the yarns laterwoven into cloth on the looms.
It will be seen from table 2 that, in gen-eral, operation of carding machines pacescotton cloth production. While cards incotton mills are operating near capacityon the first and second shifts, only about50 percent of these machines in place atthe end of 1944 have been operated or as-signed for production on the third shift.Data also indicate the possibility of ex-pansion on second and third shifts inwoolen mills. Rayon capacity utilizationis most nearly complete. The facilitieslimitation in this industry is found in thecapacity to produce the basic syntheticyarn. The recent decision of the WarProduction Board to convert 50 percentof spun rayon spinning facilities to theproduction of cotton tire fabric yarn fur-ther limited the possibility of expandeduse of facilities for rayon fabrics.
While this table indicates in generalthat machinery is not a limiting factorin the production of fabrics, it also showsa considerable unevenness of rates of op-eration for the different machines. Thissuggests an unbalance in equipment inplace, resulting primarily from the shiftsin production from normal output tomilitary goods.
The persistency of this unbalancedstate of equipment has been caused by thelimitations placed on textile machineryproduction. New facilities have beenlimited largely to those involved in turn-ing out specially needed military fab-frics. The larger wartime output of tex-tile mills has been made possible by
Table 2.—Machinery and MachineryActivity in Textile Manufacturing In-dustry 1
Chart 4.—Production, Consump-tion, and Stocks of Cotton 1
MILLIONS OF RUNNING BALES
Percent active2
Type of machinery
Cotton:CardsSpinning spindlesLooms
Woolen and worsted:Loom s—w o o 1 e n and
worstedsSpinning spindles in
woolen millsWors ted sp inn ing
spindlesWorsted combs
Rayon and silk:CardsSpinning spindlesLooms
6
2
8
4
0
PRODUCTION
>
v— j * ^ CONSUMPTION
—
i
sroc
NO
' '^1-
-TE - GffCV YEARENDING JULY 31.
1 1
1 Mills producing broad woven fabrics.2 For cotton and woolen mills, end of 1944 data; rayon
and silk, end of September 1944.Sources: U. S. Department of Commerce and War
Production Board.
1939-40 1940-41 1941-42 1942-43 1943-44 1944-450. D 45 -128
1 Consumption and stocks of foreign cottonare not included. All data for 1943-44 and1944-45 are preliminary and partly estimated.
Sources : U. S. Departments of Agricultureand Commerce ; domestic consumption for1944-45 is an estimate by the latter agency.
improved operating technique, more con-tinuous operation and, only to a limiteddegree to expanded facilities.
Manpower Losses in Textiles.
The basic difficulties in textiles is,therefore, not to be found in lack ofmaterials, profit incentives, or capacity.Rather it is the declining employment, aloss which has not been offset by increas-ing the working hours of those still em-ployed in the industries. The basic datain this connection are presented intable 3.
As may be seen, textile employment ingeneral is higher than in 1939 but sub-stantially below 1942. While weeklyhours of work, which have increasedmoderately throughout the war period,have added to the use of manpower ascompared with 1939 the increase from1942 on did not sufficiently offset the de-cline in employment in the last 2 years.Since the loss in production from 1942 tothe present has been confined almost en-tirely to cotton textiles—production ofwoolens and rayon fabrics in 1944 con-tinued at approximately 1942 levels de-spite the manpower loss—attention is fo-cused on employment in cotton tex-tiles (chart 5).
The decline in employment in this in-dustry corresponds almost exactly tothat of cotton-fabric production. Thebasic factor in this decline has been thelow earnings in the industry. Among the135 manufacturing industries for whichearnings are reported by the Bureau ofLabor Statistics, only three are belowcotton textiles.
Hourly earnings in this industry in1944 averaged 63 cents per hour as com-pared with $1.02 for all manufacturing.While wages were also relatively low inpeace years, the wartime tightening ofthe labor market has particularly af-fected the lower wage industries. It will
also be noted that, relative to manufac-turing in general, textile workers havenot gained as large an increase in wages.In other words, the gap in hourly earn-ings between textiles and other manu-factures has been increased over the warperiod.
It will be noted that only one-third ofthis industry is located in the North,where labor market conditions are gen-erally tighter than in the southern sec-tor of the industry. Though rates ofseparations are lower in the North, thetight labor market makes it more diffi-cult to replace those who do leave.
In the South, where the bulk of theindustry is located, the labor market ison the whole easier. One-third of thesouthern mills are located in small townsof less than 5,000 population and three-fourths of the mills are in towns of fewerthan 25,000 population. The surround-ing farm population constitutes a poten-tial source of additional labor.
In an attempt to increase efficiency ofmanpower utilization, the industry wasput on a mandatory 48-hour work sched-ule by the War Manpower Commissionin May 1944. Since a large part of theindustry was already on such a schedule,and part of the remainder was excusedfrom compliance by authorities, the effectof the order in increasing hours workedwas slight.
Average hours worked in cotton tex-tiles at present are 42 per week, an ad-vance of about 1 hour from 1943. Thisis approximately 3 hours per week belowthe average for manufacturing generally.In some cases bottleneck departments,especially in carding, result in other de-partments being unable to maintain a48-hour schedule. The fact that thehours worked are, however, considerablybelow those in competing establishmentsis an additional deterrent to keeping theworking force in view of the premiumgained from working longer shifts else-where.
Table 3.—Selected Factors Bearing onEmployment in Textiles
Industry
All manufacturing:1939 ".19421944 v
Nondurable manufac-tures:
193919421944 v
Cotton textiles, exceptsmall wares:
193919421944 v
Rayon and silk manu-factures:
1939 . . .19421944 v
Woolens and worstedmanufactures:
19391942 _ . . .1944 v
8,19212,61713, 653
4 5815, 6215, 430
396506440
12010290
149181151
42! 945.2
37.440.343.1
36.740.842.0
40.542.0
36.440.142.2
0. 633. 853
1.019
582.723.861
.389
.540
.630
.429
.586
.690
.528
.744
.841
23. 8636. 6546. 08
21. 7829.1337.13
14.2622. 0326.48
15.7823. 6628.99
19.2129.8135. 50
p Preliminary.Source: U. S. Department of Labor.
Digitized for FRASER http://fraser.stlouisfed.org/ Federal Reserve Bank of St. Louis
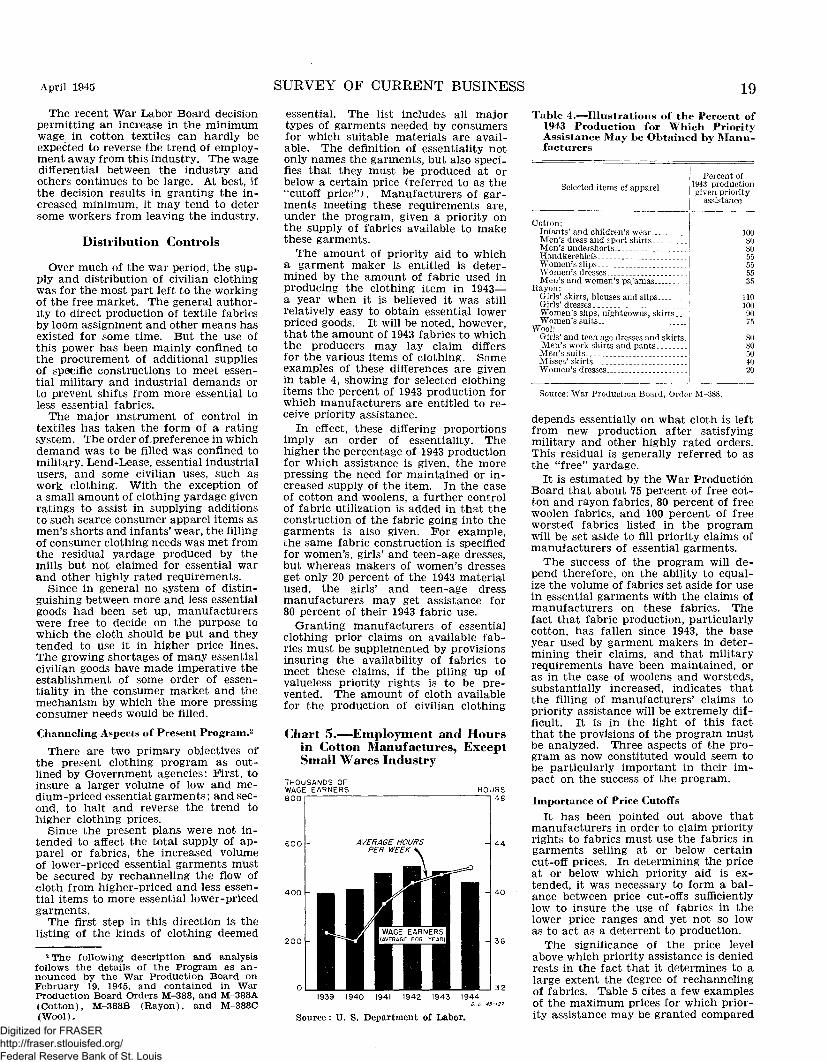
April 1945 SURVEY OF CURRENT BUSINESS 19
The recent War Labor Board decisionpermitting an increase in the minimumwage in cotton textiles can hardly beexpected to reverse the trend of employ-ment away from this industry. The wagedifferential between the industry andothers continues to be large. At best, ifthe decision results in granting the in-creased minimum, it may tend to detersome workers from leaving the industry.
Distribution Controls
Over much of the war period, the sup-ply and distribution of civilian clothingwas for the most part left to the workingof the free market. The general author-ity to direct production of textile fabricsby loom assignment and other means hasexisted for some time. But the use ofthis power has been mainly confined tothe procurement of additional suppliesof specific constructions to meet essen-tial military and industrial demands orto prevent shifts from more essential toless essential fabrics.
The major instrument of control intextiles has taken the form of a ratingsystem. The order of preference in whichdemand was to be filled was confined tomilitary, Lend-Lease, essential industrialusers, and some civilian uses, such aswork clothing. With the exception ofa small amount of clothing yardage givenratings to assist in supplying additionsto such scarce consumer apparel items asmen's shorts and infants' wear, the fillingof consumer clothing needs was met fromthe residual yardage produced by themills but not claimed for essential warand other highly rated requirements.
Since in general no system of distin-guishing between more and less essentialgoods had been set up, manufacturerswere free to decide on the purpose towhich the cloth should be put and theytended to use it in higher price lines.The growing shortages of many essentialcivilian goods have made imperative theestablishment of some order of essen-tiality in the consumer market and themechanism by which the more pressingconsumer needs would be filled.
Channeling Aspects of Present Program.2
There are two primary objectives ofthe present clothing program as out-lined by Government agencies: First, toinsure a larger volume of low and me-dium-priced essential garments; and sec-ond, to halt and reverse the trend tohigher clothing prices.
Since the present plans were not in-tended to affect the total supply of ap-parel or fabrics, the increased volumeof lower-priced essential garments mustbe secured by rechanneling the flow ofcloth from higher-priced and less essen-tial items to more essential lower-pricedgarments.
The first step in this direction is thelisting of the kinds of clothing deemed
essential. The list includes all majortypes of garments needed by consumersfor which suitable materials are avail-able. The definition of essentiality notonly names the garments, but also speci-fies that they must be produced at orbelow a certain price (referred to as the"cutoff price"). Manufacturers of gar-ments meeting these requirements are,under the program, given a priority onthe supply of fabrics available to makethese garments.
The amount of priority aid to whicha garment maker is entitled is deter-mined by the amount of fabric used inproducing the clothing item in 1943—a year when it is believed it was stillrelatively easy to obtain essential lowerpriced goods. It will be noted, however,that the amount of 1943 fabrics to whichthe producers may lay claim differsfor the various items of clothing. Someexamples of these differences are givenin table 4, showing for selected clothingitems the percent of 1943 production forwhich manufacturers are entitled to re-ceive priority assistance.
In effect, these differing proportionsimply an order of essentiality. Thehigher the percentage of 1943 productionfor which assistance is given, the morepressing the need for maintained or in-creased supply of the item. In the caseof cotton and woolens, a further controlof fabric utilization is added in that theconstruction of the fabric going into thegarments is also given. For example,the same fabric construction is specifiedfor women's, girls' and teen-age dresses,but whereas makers of women's dressesget only 20 percent of the 1943 materialused, the girls' and teen-age dressmanufacturers may get assistance for80 percent of their 1943 fabric use.
Granting manufacturers of essentialclothing prior claims on available fab-rics must be supplemented by provisionsinsuring the availability of fabrics tomeet these claims, if the piling up ofvalueless priority rights is to be pre-vented. The amount of cloth availablefor the production of civilian clothing
Chart 5.—Employment and Hoursin Cotton Manufactures, ExceptSmall Wares Industry
THOUSANDS OFWAGE EARNERS800
Table 4.—Illustrations of the Percent of1943 Production for Which PriorityAssistance May be Obtained by Manu-facturers
400 -
200 -2 The following description and analysis
follows the details of the Program as an-nounced by the War Production Board onFebruary 19, 1945, and contained in WarProduction Board Orders M-388, and M-388A(Cotton), M-388B (Rayon), and M-388C(Wool).
- 40
- 36
Selected items of apparel
Cotton:Infants' and children's wearMen's dress and sport shirtsMen's undershorts _Handkerchiefs . .Women's slipsWomen's dressesMen's and women's pajamas .
Rayon:Girls' skirts, blouses and slipsGirls' dresses-_Wromen's slips, nightgowns, skirts.Women's suits
Wool:Girls' and teen age dresses and skirts.Men's work shirts and pants _Men's suits-._Misses'skirts _. _ .Women's dresses
Percent of1943 productiongiven priority
assistance
100808055555535
1101009075
8080504020
321939 1940 1941 1942 1943 1944
D. O. •
Source: U. S. Department of Labor.
Source: War Production Board, Order M-388.
depends essentially on what cloth is leftfrom new production after satisfyingmilitary and other highly rated orders.This residual is generally referred to asthe "free" yardage.
It is estimated by the War ProductionBoard that about 75 percent of free cot-ton and rayon fabrics, 80 percent of freewoolen fabrics, and 100 percent of freeworsted fabrics listed in the programwill be set aside to fill priority claims ofmanufacturers of essential garments.
The success of the program will de-pend therefore, on the ability to equal-ize the volume of fabrics set aside for usein essential garments with the claims ofmanufacturers on these fabrics. Thefact that fabric production, particularlycotton, has fallen since 1943, the baseyear used by garment makers in deter-mining their claims, and that militaryrequirements have been maintained, oras in the case of woolens and worsteds,substantially increased, indicates thatthe filling of manufacturers' claims topriority assistance will be extremely dif-ficult. It is in the light of this factthat the provisions of the program mustbe analyzed. Three aspects of the pro-gram as now constituted would seem tobe particularly important in their im-pact on the success of the program.
Importance of Price CutoffsIt has been pointed out above that
manufacturers in order to claim priorityrights to fabrics must use the fabrics ingarments selling at or below certaincut-off prices. In determining the priceat or below which priority aid is ex-tended, it was necessary to form a bal-ance between price cut-offs sufficientlylow to insure the use of fabrics in thelower price ranges and yet not so lowas to act as a deterrent to production.
The significance of the price levelabove which priority assistance is deniedrests in the fact that it determines to alarge extent the degree of rechannelingof fabrics. Table 5 cites a few examplesof the maximum prices for which prior-ity assistance may be granted compared
Digitized for FRASER http://fraser.stlouisfed.org/ Federal Reserve Bank of St. Louis
20 SURVEY OF CURRENT BUSINESS April 1945
Table 5.—Program Price Cut-offs andAverage Prices Paid by Consumers,First Quarter 1944
[Dollars]
Apparel item Retail pricecut-offs
Men's wool suitsWomen's rayon slips.Girls' rayon slipsCi iris' cotton blouses_Men's business shirts
50. 00-55. 003. 25- 3. 501. 67- 2. 002. 20- 2. 303. 30- 3. 40
Averageprices paid
37. 502.201.501.802. 50
Source: For retail price cut-offs, XT. S. Department ofCommerce estimates based on prices contained in WPBOrder M-388; for average prices paid, the Office of CivilianRequirements, Second Survey of Consumer Requirements.
with the average prices paid by con-sumers for similar types of garments inthe first quarter of 1944. Examinationof these price cutoffs reveals that insofaras the cutoff prices are above the averagethey do, in general, permit assistance toproduction of medium as well as lowprice lines.
Another important section of the pro-gram concerns the level at which thesupply of fabrics for essential garmentsis set aside. In the case of woolens andcotton colored yarn fabrics, the mill pro-ducing the cloth must provide that thestated portion of yardage not allocatedfor more essential use is reserved foressential clothing use. In the case ofother cotton fabrics and rayon cloth, theset aside provisions apply to the freeyardage in the hands of the intermedi-ate processor (convertor), who takes theunfinished cloth made at the mill andhas it finished (bleached, printed, dyed,etc.) and made ready for sale to thegarment makers.
By having the "set aside" provisionsapply only to the convertor, the dangeris that the mills may produce fabricsunsuitable for low and medium price es-sential garments, in which case scarcefabrics could continue to be used in lessessential clothing.
The War Production Board has takencognizance of the possibility of unsuit-able fabrics being produced under thepresent system and has made clear thatin this case it has the power to orderdirectly the production of cloth requiredfor more essential clothing.
One final consideration may be noted.The program still permits a small butsignificant amount of cloth to be soldfor use in garments other than specifiedin the order. This was felt to be neces-sary in order to prevent too great arigidity in production in view of pos-sible and justifiable miscalculations.
The use of this free cloth will affectthe distribution pattern of clothing pro-duction. In general, it would seemprobable that this fabric will tend toflow to the producers of higher-pricedgoods or goods not on the essential list.The absence of specific controls on theproduction of less essential items ofclothing, however, may tend to makemore difficult the enforcement of theprovisions of the plan.
Despite these possible weaknesses inthe channeling aspects of the program,it appears that a substantial forwardstep has been taken in the direction of
insuring the use of scarce fabrics inmore essential clothing. The mecha-nism as now constituted seems, more-over, to be sufficiently flexible to pro-vide for rapid adjustment—throughchanges in the price cut-offs and the "setaside" percentages—to insure the suc-cessful combatting of the wartime trendsin clothing production.
Price Provisions of the Program.
Complementing the channeling as-pects of the program are price provi-sions which aim at reducing the pricepaid by the consumer for clothing.
The Office of Price Administration inDecember 1944 revised its regulations onthe finishing of cotton and rayon clothwith the objective of eliminating incen-tives to "over finish" cloth, a factorwhich has been important in increasingprices in recent years. This step is sup-plemented in the present plan by limita-tions on jobber mark-ups, limitations onthe extent of trimming permitted to theportion of total costs represented bytrimming in the base period, and otherlimitations on amount of cloth and work-manship. While these requirements willbuttress quality and price controls, theproblem of enforcement remains formi-dable.
The major feature of the new pricingregulations, the Maximum AveragePrice (MAP) plan 3 requires that garmentmanufacturers must plan production ofdifferent priced garments in such a man-ner that the average price realized is nohigher than the average in the base pe-riod. This provision will have the effectof reducing prices to consumers.
Other recently introduced price regu-lations will likewise make possible sav-ings to consumers, particularly the re-quirement that cotton garments havethe price ceiling under which it is pro-duced stated on it, and the reduction ofmargins below present levels.
General SummaryIt is clear that over the whole war pe-
riod civilian clothing problems have cen-tered in the rising prices for apparel andshortages in particular lines rather thanin any general insufficiency of apparel.The difficulties which did develop haveincreased over the war years—a trendwhich was accentuated by declining clothproduction in the last 2 years.
The Government program recently an-nounced involves the setting up of amechanism by which supplies of essen-tial low and medium priced garmentsmay be protected. In view of the factthat supplies will probably continueshort relative to demand for some time,even though the war in Europe ends inthe near future, the clothing programcan be a substantial aid to consumers inthis interval of tight supplies. It shouldcheck price advances for essential gar-ments and should insure an increasedsupply of these items of apparel.
3 At the time of going to press, the detailsof this plan had not yet been announced.The above discussion is based on the outlinesof the program as announced by the Officeof Price Administration.
Industrial Concentrationof Employment
{Continued from p. 14)
during the latter year, the data for 1943 areprobably under-corrected. In all cases thecorrected figures have been used in preparingcharts, in compiling secondary tables, andfor reference purposes in the text.
The industry comparisons are based on twospecial tabulations of the employer returnsto the Bureau of Old-Age and Survivors In-surance. The first tabulation for 1933 wasadjusted on the basis of the 1939 tabulationsby industry and size for changes occurringduring that year, and were used as 1939 fig-ures. A detailed tabulation of the multi-unit concerns for 1939 was helpful in estab-lishing bench mark figures for that year.
A similar tabulation was available showingin detail the number of firms, employment,and taxable wages for the third quarter of1943. Except in manufacturing, however,material was not available on the number ofmultiunit concerns. These multiunit con-cerns—firms with 50 or more workers Oper-ating in 2 or more industries or counties—accounted for roughly 20 percent of thetotal number of firms with 50 or more em-ployees. The industry distribution of singleunit concerns was used as a basis for allo-cating the multiunit concerns to the variousindustry groups. In this connection it issignificant that such a procedure resultedin almost precisely the same number offirms being assigned to manufacturing as wasindicated by the actual tabulation of multi-unit manufacturing concerns.
In view of the large number of people em-ployed by the multiunit concerns, no attemptwas made to distribute employment for theseconcerns by industry. Rather, employmentestimates of the Bureau of Labor Statisticswere used to determine the total number ofpeople employed in each broad industrygroup. From these industry totals was sub-tracted employment for single unit concernswith less than 50 employees for which defin-itive data were available. The residual wasascumed to be employment in the largerconcerns.
The shortcoming of such a procedure liesin the classification of employment by theBureau of Labor Statistics on an establish-ment basis and by the Bureau of Old-Ageand Survivors Insurance on a firm or or-ganization basis. Thus, small firms withless than 50 employees had their employ-ment classified in the dominant industryof the firm even though they were engaged inmore than one of the six industry groups.
Employment in large firms, on the otherhand, was allocated to the industry in whichit properly belonged. In view of the largeshare of the employment accounted for bythe large firms and the fact that small con-cerns are less likely than their larger com-petitors to be engaged in numerous lines ofactivity, the resultant employment figuresare believed to be largely on an industrybasis. In part, moreover, the industry over-lapping of employment in small firms tendsto be offsetting.
The necessity of classifying employmenton an establishment basis, however, un-doubtedly resulted in some understatementof the concentration of control over theworking force, employment in large firms be-ing split up according to the industries inwhich the separate establishments operated.
In arriving at the number of employees ineach industry size group, the number offirms in each size class was multiplied by theaverage number of employees for firms inthat class. This average was computed fromdata provided by the Bureau of Old-Age andSurvivors Insurance and remained remark-ably stable for the period considered. Intables 1, 2, and 3, the data on employmentwere taken directly from the yearly employertabulations of the Bureau of Old-Age andSurvivors Insurance.
Digitized for FRASER http://fraser.stlouisfed.org/ Federal Reserve Bank of St. Louis

April 1945 SURVEY OF CURRENT BUSINESS S-l
Monthly Business StatisticsThe data here are a coDtinuation of the statistics published in the 1942 Supplement to the SURVEY OF CURRENT BUSINESS. That
volume contains monthly data for the years 1938 to 1941, and monthly averages for earlier years back to 1913 insofar as available; italso provides a description of each series and references to sources of monthly figures prior to 1938. Series added or revised since publication of the 1942 Supplement are indicated by an asterisk (*) and a dagger (f), respectively, the accompanying footnote indicating wherehistorical data and a descriptive note may be found. The terms "unadjusted" and "adjusted" used to designate index numbers referto adjustment of monthly figures for seasonal variation.
Data subsequent to February for selected series will be found in the Weekly Supplement to the Survey.
Unless otherwise stated, statistics through 1941and descriptive notes may be found in the1942 Supplement to the Survey
1945
Febru-ary
1944
Febru-ary March April May June July August Sep-
temberOcto-ber
Novem-ber
Decem-ber
1945
Janu-ary
BUSINESS INDEXES
INCOME PAYMENTS f
Indexes, adjusted:Total income payments 1935-39=100.
Salaries and wages do . . .Total nonagricultural income do. -.
Total mil. of dol.Salaries and wages:
TotaH do.....Commodity-producing industries do
Public assistance and other relief H d o —Dividends and interest doEntrepreneurial income and net rents and roy-
alties mil. of dol.Other ircome payments doTotal nonagricultural income d o —
FARM MARKETINGS AND INCOME
Farm marketings, volume:*Indexes, unadjusted:
Total farm marketings 1935-30=100..Crops doLivestock and products do
Indexes, adjusted:Total farm marketings do . . .
Crops do.Livestock and products do.
Cash farm income, total, including Government pay-ments* mil. of dol.
Income from marketings* do . . .¥ndexes of cash income from marketings:!
Crops and livestock, combined index:Unadjusted. 1935-39=100.Adjusted do . . .
Crops do . . .Livestock and products do . . .
Dairy products do . . .Meat animals do . . .Poultry and eggs .do . . .
PRODUCTION INDEXES
indust r ia l Production—Federal Reserve Index
Unadjusted, combined index!.. . 19" 5-39=100..Manufactures! _.. do
Durable manufacturest - doIron and steelt doLumber and products! do
Furniture! doLumber! do
Machinery! doNonferrous metals and products! do
Fabricating*.. doSmelting and refining*.. do
Stone, clay, and glass products! doCement doClay products* - doGlass containers! do
Transportation equipment! doAutomobiles! ___do_...
Nondurable manufactures!.. doAlcoholic beverages! doChemicals! do
Industrial chemicals* doLeather and products! do
Leather tanning* doShoes do
245. 1269.8239. 6
12,739
9, 5233, £62
4S0
2,187459
11,679
113105118
144150139
1,3911,343
202.0310.0408. 0245. 0207. 0259. 0285. 0
P 2 4 9v 344
202v 114v 143
v 99M34
158
> 115
v 701P 2 3 6P 171
160P 3 1 9v 3fe'7v 120
v 120
232.4261.1228.7
12, 206
9,1804,044
79459
2,137351
11,118
12187
147
150127167
1,4391,343
202.0276.0271.5279.0201.0333. 5286.5
24025936621212215010745828528029916167
125205746238173115360406114113114
231.9258.8228.7
12,979
9,1384,009
791,161
2,186415
11,852
12783
160
156143165
1,5281,433
215.5274.0276.5272.0199.5322,5283.5
23825736321412414911045228728329716368
126216734233171128344405112106116
231.1258.3228.4
12, 582
9,1453,995
78811
2,127421
11,496
12374
161
146133156
1,4801,402
211.0270.0282.0262.0209.5306.0252.0
237255361213125142116445292293289163
74122227730232169127325408116116116
232.1259.1229.2
12, 387
9, 2234,008
78494
2,175417
11,242
13380
173
154139165
1,5461,452
218.5276.0284.0271.0219.0308.0278.0
236252357210127142119437279282273165
79122225726226168127323410112110114
233.9261.7231.1
13, 573
9,3444,051
781,554
2,189408
12, 396
12780
163
141116100
1, 5581, 504
226. 5275.0283.0270.0213.5316.0260.5
23625235420413314412744226326825216990
125228716228169143316411114111117
233.2263.0232.3
12, 928
9,2844,045
78914
2,241411
11,681
131114145
135117150
1,6491, 602
241.0252.0264.0244.0207.0266.5260.5
23224834820213014312343524324324416594
124213704223167151310408103107100
234.0263.1232.3
12, 586
9, 3044,056
78486
2,300418
11,269
J38131143
133105154
1,7411,690
254. 5261.0272.0253. 5202.0288.5265.5
235251349203135146129434245252226167100125213707229171198310408111107114
232.5262.0231. 9
13, 670
9,3754,039
781,317
2,474426
12,178
159180143
129109144
2,0071,954
294.0243. 5258.5233.5200.0240.0287.5
234249343202128139123427238252205164100120204695226173159307400121118122
235. 5263. 4233.6
13, 684
9,5414,066
79829
2,801434
11,877
189238153
142142142
2,4602,427
365.5262.5308.0232.5197. 5235. 5298.5
234250
••346206125143117428233246200167102122218704229173168309395115112117
237.5264.7235.3
13, 253
9,5084,010
79509
2,716441
11, 583
164178154
150155148
2,2562,188
329.5267.0298.0246.5191.5265.0308.5
23224834120112014110942223425219116395
121210699228173159308394118116119
239.0266 9236. 9
14, 405
9, 6534, 002
801,827
2,396449
13,082
136131139
137127144
1,7471. 697
255. 5263. 5295. 0242. 5192.0255. 0313.0
23024834219811314297
43122924718615982
120202
'709r 235
171146313396113114113
'241 .9' 268. 6' 238. 7
• 13,357
' 9,516' 3, 954
80'936
' 2, 369456
12,124
' 131126
' 135
' 144147
'1421,6581,571
237. 0278 0327. 0246. 0196.0267. 0290. 0
' 230'247
342' 197' 113'142
' 99'430
240262
'18716071
'116196
'705'235' 171
195' 315' 396' 113
112' 114
p Preliminary r Revised.TFormerly designated "Direct and other relief."§The total includes data for distributive and service industries and government not shown separately.*New series. For a description of the indexes of the volume of farm marketings and figures for 1929-42, see pp. 23-32 of the April 1943 Survey; indexes through 1942 were computed
by the Department of Commerce in cooperation with the Department of Agriculture; later data are from the latter agency. Data for 1913-41 for the dollar figures on cash farm incomeare shown on p. 22 of the May 1943 Survey but the annual totals have been revised beginning 1940; revised monthly averages based on the new totals are as follows (millions of dollars):Cash farm income, total including Government payments—1940, 759; 1941, 979; 1942,1,339; 1943, 1,660; income from marketings—1940, 695; 1941, 930; 1942, 1,281; 1943, 1,604; the monthlyfigures have not as yet been adjusted to the revised totals. Data beginning 1939 for the new series under industrial production are shown on p. 18 of the December 1943 issue.
!Revised series. Data on income payments revised beginning January 1939; for figures for 1939-41, see p. 16 of the April 1944 Survey and for annual totals beginning 1942, p. 22 ofFebruary 1945 issue; complete revisions are available on request. The indexes of cash income from farm marketings have been completely revised; data beginning 1913 are shownon p. 28 of the May 1943 Survey. For revisions for the indicated series on industrial production, see table 12 on pp. 18-20 of the December 1943 issue.
Digitized for FRASER http://fraser.stlouisfed.org/ Federal Reserve Bank of St. Louis
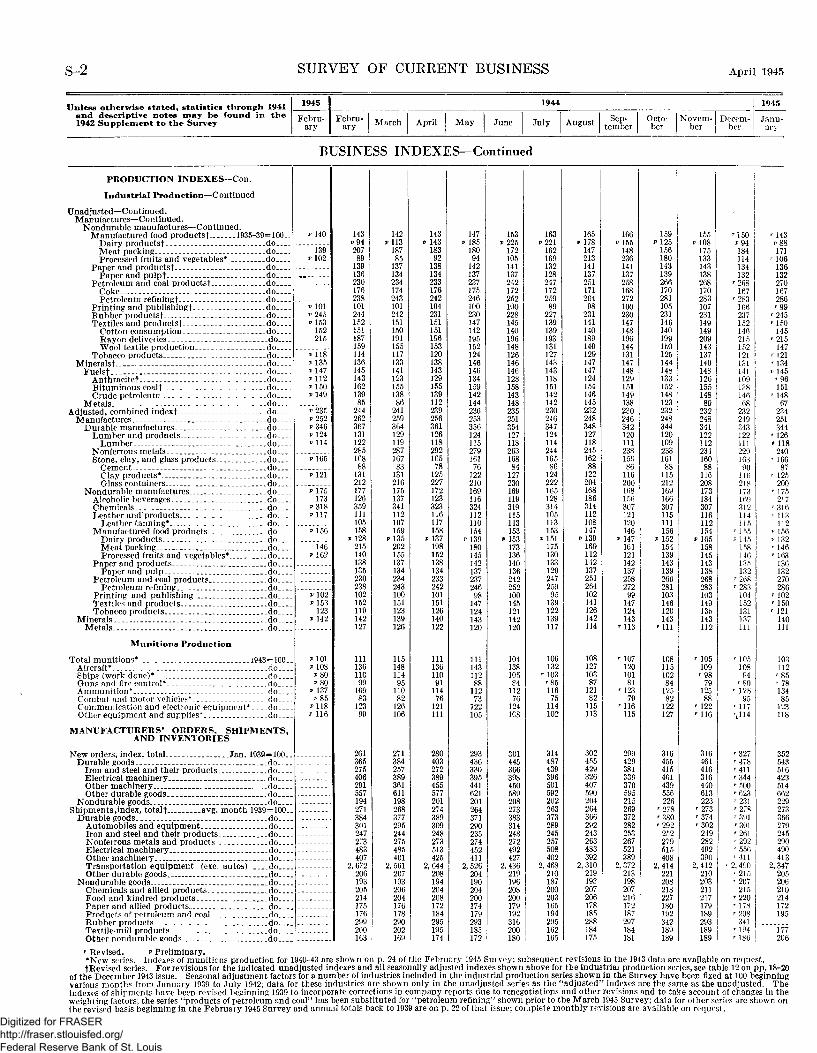
S-2 SURVEY OF CURRENT BUSINESS April 1945
Unless otherwise stated, statistics through 1941and descriptive notes may he found in the1942 Supplement to the Survey
1945
Febru-ary
Febru-ary March April
1944
May June July August Sep-tember
Octo-ber
Novem-ber
Decem-ber
1945
Janu-ary
BUSINESS INDEXES—Continued
PRODUCTION INDEXES—Con.
Industrial Production—Continued
Unadjusted—Continued.Manufactures—Continued.
Nondurable manufactures—Continued.Manufactured food products! 1935-39=100..
Dairy products! do.. .Meat packing do__.Processed fruits and vegetables* do
Paper and products! do.-.Paper and pulpt do.-_
Petroleum and coal products! do.._Coke do._.Petroleum refining! do._ _
Printing and publishing! do.. .Rubber products! do.. .Textiles and products! do.. .
Cotton consumption do.. .Eayon deliveries do_._Wool textile production do
Tobacco products do. . .Minerals! do.. .
Fuels! do. . .Anthracite! do.._Bituminous coal! do.. .Crude petroleum do_._
Metals do.. .Adjusted, combined index! do___
Manufactures do.. .Durable manufactures do.. .
Lumber and products do._.Lumber do.. .
Nonferrous metals do.. .Stone, clay, and glass products do._.
Cement do.__Clay products*-. do.. .Glass containers do__.
Nondurable manufactures do.. .Alcoholic beverages do.. .C hemieals do. _.Leather and'products do.. .
Leather tanning* do___Manufactured food products do...
Dairy products do._.Meat packing do...Processed fruits and vegetables*.- .do. . .
Paper and products do-_.Paper and pulp do...
Petroleum and coal products do__.Petroleum refining do...
Printing and publishing do...Textiles and products do...Tobacco products do...
Minerals do...Metals do...
Munitions Production
Total munitions* . 1943=100Aircraft* do__Ships (work done)* do..Guns and fire control* do...Ammunition* do..Combat and motor vehicles* do__Communication and electronic equipment* doOther equipment and supplies* do.
MANUFACTURERS' ORDERS, SHIPMENTS,AND INVENTORIES
New orders, index, total Jan. 1939=100..Durable goods do
Iron and steel and their products doElectrical machinery doOther machinery doOther durable goods do
Nondurable goods doShipments,index, total! avg. month 1939=100.
Durable goods do_._Automobiles and equipment do._.Iron and steel and their products do__.Nonferrous metals and products do.__Electrical machinery do__.Other machinery do. . .Transportation equipment (exc. autos) do__.Other durable goods do.._
Nondurable goods doChemicals and allied products. do-._Food and kindred products .doPaper and allied products do___Products of petroleum and coal do_._Rubber products doTextile-mill products doOther nondurable goods do
"140
139P 1 0 2
P 1 0 1P 2 4 5P 1 5 3
152215
P ! 1 8P135
P 1 5 0P 1 4 9
v 235P252
P124p 114
165
\1h173
P 1 5 6
~"~146
P 1 0 2P 1 5 3
123*142
P 1 0 8P 8 0P 8 0
116
143P94207891391362301762381012441521511871591141361451431621398524426236713112228516888131212177126359111105158128215140138135230238102152119142127
11113611C991098312399
261365275406291557194271384301247273483407,672206193205214175176299200163
142P113187851371342341742431012421511501911551171331411231551388624125936412911928716783131216175137341112107159
P135
202155137134234243100151123139126
1151481149511082126106
271384257389361611198268377295244275485401
2,561207193206204176178290202169
1439 1431839213813423317624210423115115119615312013814312915513911223925636112611829216578125227172123323116117158
P137
198152138134233242101151126140122
1111361109111476121111
280403272389455577201274389309248273513425
2,644208194204208172184295195174
147»1851809414213723717524610023014714219515212414614613415914214423625335612411527916176122210169116324112110154
P13918014514213723724698147124143120
1111431128811273122105
293436330395441621201264371290235274452411
2,526204190204200174179293185172
j
153P225
17210514113724217225210022814514019614812614614612815814314823525135412711826316884127230169119319115113153
9 153173136140136242252100145121142120
10413810584112761241C8
301445366398450589208273383314248272492427
2,436219196208200179192316200180
163P221
16216913212824717225989227 .13913919313112714314311815114214223024634712411424416586124222165128314105113153
P15117513013312924725995139122139117
106132
' 103'8511675114102
314487439396501592202263373289245257508402
2,468210187200203165194295162165
165»1781472131411372511712649823114114018914012914714712415414614523224834812711824516288122204168186314112108147
9 139169112142137251264102141126142114
1081271038712182115113
302455429326407590204264366292243263483392
2,310219193207206178185288184175
166P!55
14823614113725816827210023014714819614413114714812915114913823024634212011123815986116200168156307121120146
9 14716112114213725827299147124143
' 113
' 10712010181
'12379
'116115
299429381339370595215269372282253267521389
2,372
213198207216172187297184181
1599 12515618014313926617028110523114614019915012514414813315214812323224834412010923316188115212169166307115111156
9 152154139143139266281103146120143
'111
1081151028412582122127
316455415401439556226
'278'380'292252279515408
2,414221208218227180192342189189
1559 1081751331431382681702831072311491492091431371401481261551488923224834112211223416088116208173184307116112154
P165158145143138268283103149135143112
' 105109'987912588
'122' 116
316461416316440613223
'273'374'302
249282492390
2,412
210203211217179189293189189
1
'150P94184114134132
' 268167
'2831062371521462151521211811411091381466823224934312211122916390116218173169312114115
' 1 55P 145158146135132
'268'283104152131137111
'10510894
' 80' 128
95r 117rL114
r 327'478'411' 344'500' 623' 231'27*' 391'301'261'292
'556'411
' 2, 490'215'207215
'220'178' 208341
'1P4'186
r Revised. 9 Preliminary.•New series. Indexes of munitions production for 1940-43 are shown on p. 24 of the February 1945 Survey; subsequent revisions in the 1943 data are available on request.tRevised series. For revisions for the indicated unadjusted indexes and all seasonally adjusted indexes shown above for the industrial production series, see table 12 on pp. 18-20
weighting factors; the series "products of petroleum and coal" has been substituted for "petroleum refining" shown prior to the March 1945 Survey; data for other series are shown onthe revised basis beginning in the February 1945 Survey and annual totals back to 1939 are on p. 22 of that issue; complete monthly revisions are available on request.
Digitized for FRASER http://fraser.stlouisfed.org/ Federal Reserve Bank of St. Louis
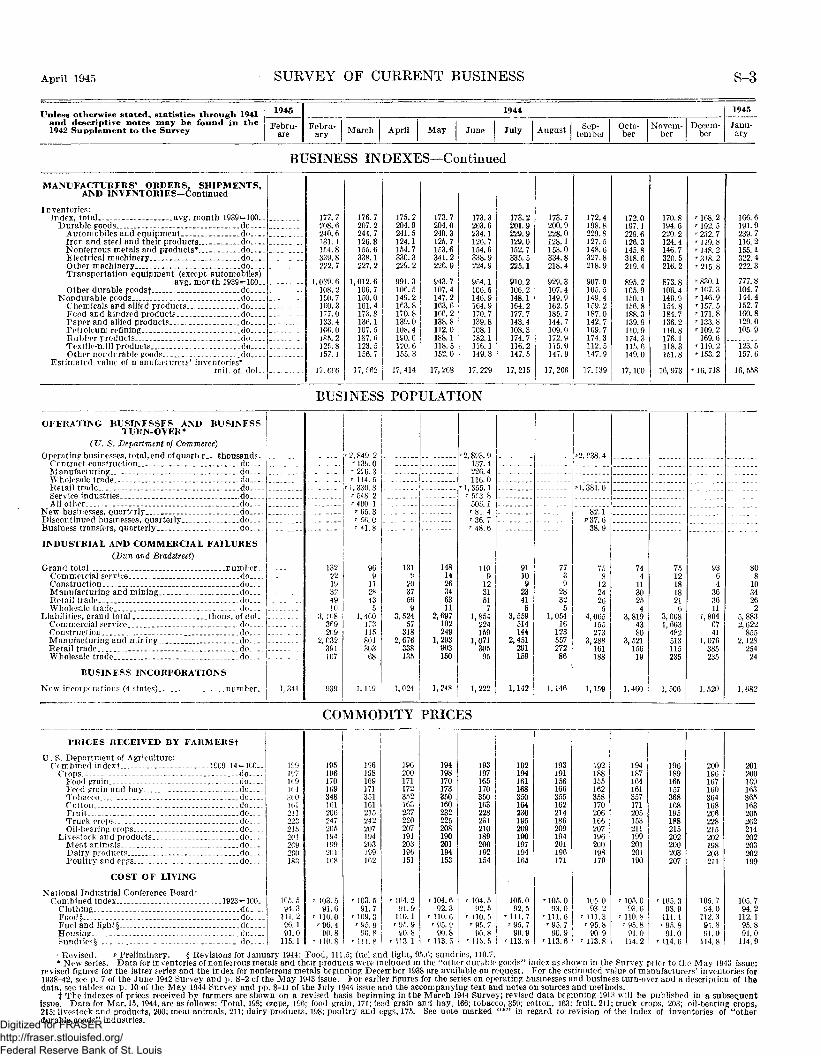
April 1945 SURVEY OF CURRENT BUSINESS S-3
Unless otherwise stated, statistics through 1941and descriptive notes may be found in the1942 Supplement to the Survey
1945
Febru-are
1944
Febru-ary- March April May June July August Sep-
temberOcto-ber
Novem-ber
Decem-ber
1945
Janu-ary
BUSINESS INDEXES—Continued
MANUFACTURERS' ORDERS, SHIPMENTS,AND INVENTORIES-Continued
Inventories:Index, total avg. month 1939 = 100..
Durable goods doAutomobiles and equipment doIron and steel and their products doNonferrous metals and products* doElectrical machinery. doOther machinery doTransportation equipment (except automobiles)
avg. month 1939=100..Other durable goodsf do
Nondurable goods doChemicals ard allied products doFood and kindred products . doPaper and allied products doPetroleum refining . do..-.Rubber products doTextile-mill products doOther nordiTable goods. do
Estimated value of iraBufectureis' inventories*mil. of. dol_.
177.7208.6240. 6131.115.4.8339.8222.7
1,039.6108.21C0. 7If 0.3177.0133. 4106.0185.2125.8157.]
7. ere
176.7207.2244.7126.8155.6338.1227.2
1,012.6106. 7150.0161.4173.8136.1107.5187. 6123.5156.7
!7,f62
175. 2204.9241.5124.1154. 7330.3229.2
991.3106. 5149. 2163.8170.8139.0108.4190.6120.6155.3
17,414
173.7204.0240.3125.7153.6341.2226.9
943.7107.4147.2163.6166.2138.8112.0188.1118.5152.0
173.3203.6234.1126.7154.6338.9224.9
954.1106.5146.9164.9170.7139.8108.1182.1116.1149.3
17,268 17,229
173.2201.9229.9129.0152.7335.5225.1
910.2106.2148.1164.2177.7143.4108.3174.7116.2147.5
17, 215
173.7200.9228.0128.1153.0334.8218.4
929.3107.4149.9162.5185. 7144.7109. 0172.9115.0147.9
17,266
172.4198.8229.8127.5148.6327.8218.9
907.0105. 5149.4159.2187.0142.7109.7174.3112. 5147.9
17,139
172.0197.1229.6126.3145.8318.6219.4
895.2105.9150.1156.8188.3139. 9110.9174.3115. 6149.0
17,100
170. 8194.6220.2124.4146.7320.5216.2
873.8106. 4149.9154. 8184.7136.2110. 8176.1118.3151.8
16, 973
' 168. 2T192. 5r 232. 7••119.8' 148. 2' 318. 2'215.8
' 830. 1' 107. 3' 146.9T157. 5'171.8' 133.8r 109. 2
169.6'119.2' 153. 2
• 16, 718
166.6191.9239.7116.2155.1322.4222.3
104.7144.4152.7160. 8129.0105.9
123.5157. 6
16, 558
BUSINESS POPULATION
OPERATING BUSINESSES AND BUSINESSTURN-OVER*
(17. <S. Department of Commerce)
Operating businesses, total, end of quart* r..-thousands..Contract construction doM anufact uringWholesale tradeEetail tradeService industriesAll other
New businesses quarterlyDiscontinued businesses, quarterlyBusiness transfers, quarterly _ _
INDUSTRIAL AND COMMERCIAL(Dun and Bradstreet)
Grand totalCommercial serviceConstructionManufacturing and mining _ .Eetail tradeWholesale trade
Liabilities, grand total __ .Commercial serviceConstruction . _ . . .Manufacturing and miningRetail tradeWholesale trade
dododo _dododod o . - . .do .
FAILURES
numberdodod o -dodo
thous. of doLdodododo
_ - do _
B U S I N E S S INCORPORATIONS
New incorporations (4 states) . _ _ number 1, 341
1322219324910
3, 1083f.92(9
2,032391107
939
' 2 849 2r 139 0T 216 3T 114 5
' 1,330 8' 548 2' 490 1r 65 3' f.0. 0' 41 8
969
1128435
1, 4C0173115801303
68
1,119
131V
2037569
3, 52457
3182,676
338135
1,024
1481426346311
2,697102249
1,293903150
1,248
r2,893 9137. 4226.4116 0
'1,355.1r 553 g
505 1r 81 4>• 36. 7T 48 6
1109
123151
71,854
224159
1,07130595
1,222
91109
2341
83,559
514144
2,451291159
1,142
7739
28325
1,05416
12355727286
1, 146
v2, £38. 4
PI, 381.0
82 IP 3 7 . 6
38.9
758
1224265
4,065155273
3,288161188
1,159
744
1130254
3,8194380
3,52115619
1,460
75121818216
3,0081 663
482513115235
1,506
9364
363611
1,8046741
1,076385235
1,520
808
1034262
5, 8832 622
8552,128
25424
1,682
COMMODITY PRICES
PRICES RECEIVED BY FARMERS!
U . S . Depar tment of Agriculture:Combined indexf 1600-14 = 100.
Crops d o . - .Food grain do._ .Feed grain and hay d o . . .Tobacco do_._Cotton d o _. _Fruit d o . . .Truck crops do_. .Oil-bearing crops do.. _
Livestock and products do.._Meat animals do. - .Dairy products d o . . .Poul t ry and eggs do-_.
C O S T O F LIVING
National Industrial Conference Board:Combined index 1923 = 100._
Clothing doF o o d § - . doFuel and light § doHousing doFun dries § .. . do
199197169KA•SCO1612112232152012C92C0183
105. 594.3111. 286.191.0115.1
1951961701693481612062472051941992011(8
' 103.591.6
•110.0' 9 6 . 4
90.8r no. 8
1S6198169171351161215242207194203199162
' 103.591.7
r 109.3' 95. 990.8
< 111. 8
196200171172352163237220207191203196151
- 104.291.9
110.1' 95.9
90.8' 113.1
194198170173350160232225208190201194153
104.692.3
110.695. 990.8
113.5
193197165170350163228231210189200192154
' 104. 592.5
' 110.5r 95. 7
90. 8
' m.5
192194161168350164230195209190197194165
105.092.5
r 111.7'95.790.9
r 113.6
193191156166355162214186209194201196171
' 105.093.0
' 111.6' 95. 790.9
' 113.6
192188155162358170206166207196200198179
105. 093.2
r 111.3' 95.890 9
r 113.8
194187164161357171205153211199201201190
' 105. 093. 6
' 110.8' 95.891. 0114.2
196189165157368168195188215202200203207
r 105. 393.9111.1' 95. 891.0
' 114.6
200196167160364168206228215202198203211
105.794. 0
112.391891.0
114.8
201200169163365163205262214202203202199
105.794.2
112.195.891.0
114.9
' Revised. v Preliminary. § Revisions for January 1944: Food, 111.5; fuel and light, 95.6; sundries, 110.7.* New series. Data for inventories of nonferrous metals and their products were included in the "other durable goods" index as shown in the Survey prior to the May 1943 issue;
revised figures for the latter series and the index for nonferrous metals beginning December 1938 are available on request. For the estimated value of manufacturers' inventories for1938-42, see p. 7 of the June 1942 Survey and p. S-2 of the May 1943 issue. For earlier figures for the series on operating businesses and business turn-over and a description of thedata, see tables on p. 10 of the May 1944 Survey and pp. 8-11 of the July 1944 issue and the accompanying text and notes on sources and methods.
t The indexes of prices received by farmers are shown on a revised basis beginning in the March 1944 Survey; revised data beginning 1913 will be published in a subsequentissue. Data for Mar. 15,1944, are as follows: Total, 198; crops, 196; food grain, 171; feed grain and hay, 166; tobacco, 359; cotton, 163; fruit, 211; truck crops, 203; oil-bearing crops,215; livestock and products, 200; meat animals, 211; dairy products, 198; poultry and eggs, 175. See note marked "*" in regard to revision of the index of inventories of "otherdurable goods" industries.Digitized for FRASER
http://fraser.stlouisfed.org/ Federal Reserve Bank of St. Louis

S-4 SURVEY OF CURRENT BUSINESS April 1945
Unless otherwise stated, statistics through 1941and descriptive notes may be found in the1942 Supplement to the Survey
1945
Febru-ary
1944
Febru-ary March April M a y June July August Sep-
temberOcto-ber
Novem-ber
Decem-ber
1945
Janu-ary
COMMODITY PRICES—Continued
COST OF LIVING-Continued
U. S. Department of Labor:Combined index _ ._ .1935-39=100..
Clothing _ doFood _ .doFuel, electricity, and ice doHousefurnishings doRent. _ doMiscellaneous. do
RETAIL PRICES
U. S. Department of Commerce:All commodities, index* 1935-39=100..
U.S. Department of Labor indexes:Anthracite 1923-25=100..Bituminous coal doFood, combined index.. 1935-39=100..
Cereals and bakery products* doDairy products* doFruits and vegetables*.. doMeats* do
Fairchild's index:Combined index Dec. 31,1930=100..
Apparel:Infants' doMen's doWomen's. _ do
Home furnishings. doPiece goods. _ _ __ do
WHOLESALE PRICES
U. S. Department of Labor indexes:Combined index (889 series) 1926=100..
Economic classes:Manufactured products doRaw materials doSemimanufactured articles do
Farm products doGrains doLivestock and poultry . do
Commodities other than farm products doFoods do
Cereal products doDairy products doFruits and vegetables doMeats do
Commodities other than farm products and foods1926=100..
Building materials _ doBrick and tile doCement doLumber „ doPaint and paint materials do
Chemicals and allied productsf- - doChemicals _ doDrugs and Pharmaceuticals! doFertilizer materials doOils and fats do
Fuel and lighting materials doElectricity doGas doPetroleum products do
Hides and leather products doHides and skins doLeather _ _ .doShoes do
Housefurnishing goods _ doFurnishings doFurniture do
Metals and metal products doIron and steel doMetals, nonferrous doPlumbing and heating equipment do
Textile products _. doClothing ._ d o . . .Cotton goods. doHosiery and underwear _ doRayon doWoolen and worsted goods do
Miscellaneous . do . . .Automobile tires and tubes doPaper and pulp do
Wholesale prices, actual. (See respective commodities.
PURCHASING POWER OF THE DOLLAR
As measured b y -Wholesale prices 1935-39=100.Cost of living do_._Retail food prices do___Prices received by farmers! do
126.8143.3136.5110.0143.80)123.2
139.6
105.0136. 5108.7133. 5168. 9130.7
113.4
108.2105. 4113.5115.6112.2
p 105. 2
P I O I . 5115.695. 0
127.0129.8131.8
v 100. 2104.794.9
110.8118.1106. 5
v 99. 2117. 0110.599.0
153.9106.494. 995. 8
106.981.9
102. 083.3
64.3117.6115.4101.3126.3104. 5J 07. 5101. 5
v 104. 298.085.992 499. 7
107.4119.9
71. 530.2
112.794.673.0
108.0
76. £78.973.253. 5
123.8135.2134.5110.3128.7108.1118.7
135.0
102.4103.8134.5108.1133.5163.0130.5
113.4
108.2105.3113.7115.6112.2
103.6
100.4112.893.4
122.5129.3123.399.3
104.595.1
110.7120.7106. 0
98.0113.6100.193.6
148.4103.995. 096.3
106.481.4
102.083. 160. 177.264.0
116.9111.0101.3126.4104.2107.1101. 4103.797.185.891.897.7
107.0113.470.530.3
112.593.473.0
106.6
77.6
74.254.6
123.8136.7134.1109.9129.0108.1119.1
135.1
99.9103.8134.1108.0133.6162.9130.6
113.4
108.2105.3113.7115.6112.2
103.8
100.5113.493.7
123.6129. 5125.699.3
104.695.1
110.5123.3106.0
98.1114.2100.393.6
150.7104.495.096.3
106.481.4
102.083.059.076.764.0
116.9111.2101.3126.3104.3107.2101.4103.797.185.891.897.8
107.0113.670.530.3
112.593.573.0
107.2
77.580.874.554.3
124.6137.1134.6109.9132.9108.1120.9
136.3
99.9104.0134.6108.0133.6168.8130.0
113.4
108.2105.3113.7115.6112.2
103.9
100.8113. 293.6
123. 2129.6123.699.6
104.995.2
110.2126.5106.2
98.4115.2100.393.9
153.4104.495.596.3
112.081.4
102.083.059.977.164.0
116.9111.2101.3126.3104.3107.2101.4103.797.185.891.897.8
107.0113.970.530.3
112.593.573.0
107.2
77.480.374.254.3
125.1137.4135.5109.8135.0108.1121.3
137.0
99.3104.3135.5108.1133.5172.8130.3
113.4
108.2105. 3113.7115.6112.2
104.0
100.9113.093.7
122.9129.7122.699.7
105.095.0
110.3126.8106.6
98.5115.7100.596.4
154.0104.795.896.3
112.081.4
102.083.259.078.464.0
117.0111.9101.3126.3104.3107.2101.4103.797.185.892.497.8
107.0113.970.530.3
112.593.573.0
107.2
77.480.073.7
! 54.8
125.4138.0135.7109. 6138.4108.1121.7
137.5
98.6104.4135.7108.4133.5174.0129.8
113.4
108.2105.3113.7115.6112.2
104.3
100.9114.293.8
125.0127.2123.099.6
106.594.7
110.3137.7106.1
98.5115.9100.696.4
154.0105.795.396.2
112.079.9
102.083.359.379.364.0
116.4108.4101.3126.3104.3107.2101.4103 797.185.892.497.8
107.0113.970.630.3
112.593.573.0
107.2
77.179.773.655.1
126.1138.3137.4109.7138.7108.2122.0
138.2
98.5104.4137.4108.6133.6176.9129. 3
113.4
108.2105.3113.7115.6112.2
104.1
100.9113.693.9
124.1125. 2123.499.6
105.894.3
110.3129.9105.9
98.5115.9100.796.4
154. 2105.595.596.2
112.081.1
102.083.259.57S.964.0
116.2106.8101.3126.3104.3107.2101.4103.797.185.792.498.0
107.0114.070.630.3
112.993.673.0
107.2
77.379.372.755.4
126.4139.4137.7109.8139.3108.2122.3
138.6
98.5104.6137.7108.5133.6175. 7129.0
113.4
108. 2105.3113.7115.6112.2
103.9
100.9112.794.1
122.6122.5125. 499.7
104.894.3
110. 5122.8105.9
98.6116.0100.796.4
154.4105.595.596.2
112.081.2
102.083.259.076.063.9
116.0105.7101.3126.3104.4107.4101.4103.897.185.892.498.4
107.0115.970.630.3
112.993.673.0
107.2
77.479.172.555.1
126.5141.4137.0109.8140.7108.2122.4
138.9
98.5104.6137.0108.6133.6169.9129.0
113.4
108.2105.3113.7115.6112.2
1Q4.0
100.9112.894.7
122.7121.7127.699.7
104.294.4
110.7115.9106.0
98.6116.0101.596.9
154.0105.594.996.0
106. 981.2
102.083.060.376.863.8
116.0106.1101.3126.3104.4107.4101.4103.897.285.892.499.2
107.0118.770.830.3
112.993.673.0
107.2
77.479.172.955.4
126.5141.9136. 4109.8141.40)122.8
138.8
98.6104.7136.4108.6133. 6162.9129.4
113.4
108. 2105. 3113. 6115.6112.2
104.1
101. 0113.294.8
123.4125.1127.199.8
104.294.7
110.7112.7106.0
116.3104.897.5
153.8106.095.096.0
106.981.8
102.082.959.676.063.8
116.2107.3101.3126.3104.4107.4101.4103.797.185.892.499.4
107.4118.871.530.3
112.993.673.0
107.2
77.379.173.254.8
126.6142.1136.5109.9141.70)122.9
139.0
104.7136.5108.6133. 6160.7129.7
113.4
108.2105.3113.6115.6112.2
104.4
101.1113.894.8
124.4124.8127.099.9
105.194.7
110.7113.7106.1
98.8116.4105.097.7
153.8106.394.895.5
106. 981.8
102.083.160.177.363.8
116. 2107.1101.3126.3104. 4107.4101.5103.797.185.892.499.4
107.4118.871.530.2
112.994.073.0
107.2
77.179.073.254.3
127.0142.8137. 4109.4143.0108.3123.1
139.6
98.7104.8137.4108. 6133. 5164.2129.9
113.4
108. 2105. 4113.5115.6115.6
104.7
101.1114.694.8
125.5127.5126.9100. 0105. 594. 7
110.7116.2106. 2
98.9116.4105. 397.5
153.8106. 394.895. 6
106.981.8
102.083.159. 974.663. 8
117.4114.0101.3126. 3104.4107. 4101.5103.897.285.892.499.5
107. 4119.271.530.2
112.994.273.0
107.3
76.878.772.753.2
127.1143.0137.3109.7143.60)123.1
139.7
98.7104.8137.3108.7133. 5168.9130.2
113.4
10S.2105.4113.5115.6112.2
v 104. 9
p 101.3115.194.9
126.2129. 3131.1
p 100.1104. 794.7
110.S114.4106. 4
•p 9 9 . 1
116.8110. 497.4
153. S106.394. ft95. fr
106. {•81. {
102. (83. [
75. 764. 3
117.."114.8101.3126.?104. c107. r101. "
P 104. (97.785.1"92.499. C
107.4119.7
71..'30.1
112.'9 4 /73. '
107.1
76.78.72.53^
v Pre l iminary . r Revised.1 December 1944 index based on rents in 20 large cities, assuming no change in cities not surveyed; rents not collected for other months .• N e w ser ies For a description of the D e p a r t m e n t of Commerce index of retail prices of all commodit ies , see p . 28 of the Augus t 1943 Survey; minor revisions have been made in
t he figures publ ished prior to t h e Februaryl945 Survey; 1939-43 revisions are available on request . D a t a beginning 1923 for the indexes of retail prices of t he food subgroups are avail-able on request ; the combined index for food, which is the same as the index under cost of living above, includes other food groups not shown separately.
f Revised series. T h e indexes of wholesale prices of chemicals and allied products and drugs and Pharmaceuticals have been revised beginning October 1941 owing to a changein t he me thod of comput ing t he ne t tax applicable to t he quoted price of undena tu red e thyl alcohol and a reduct ion in the weight assigned to this commodi ty ; revised figuresfor 1941-43 will be publ i shed later; the revision has not been incorporated in the all-commodities index, which would be affected only fractionally, or in t he indexes for manufacturedproducts , commodit ies other t h a n farm products , and commodit ies other t h a n farm products and foods. T h e index of purchas ing power of the dollar based on prices received b yfarmers has been shown on a revised basis beginning in the April 1944 Survey.Digitized for FRASER
http://fraser.stlouisfed.org/ Federal Reserve Bank of St. Louis
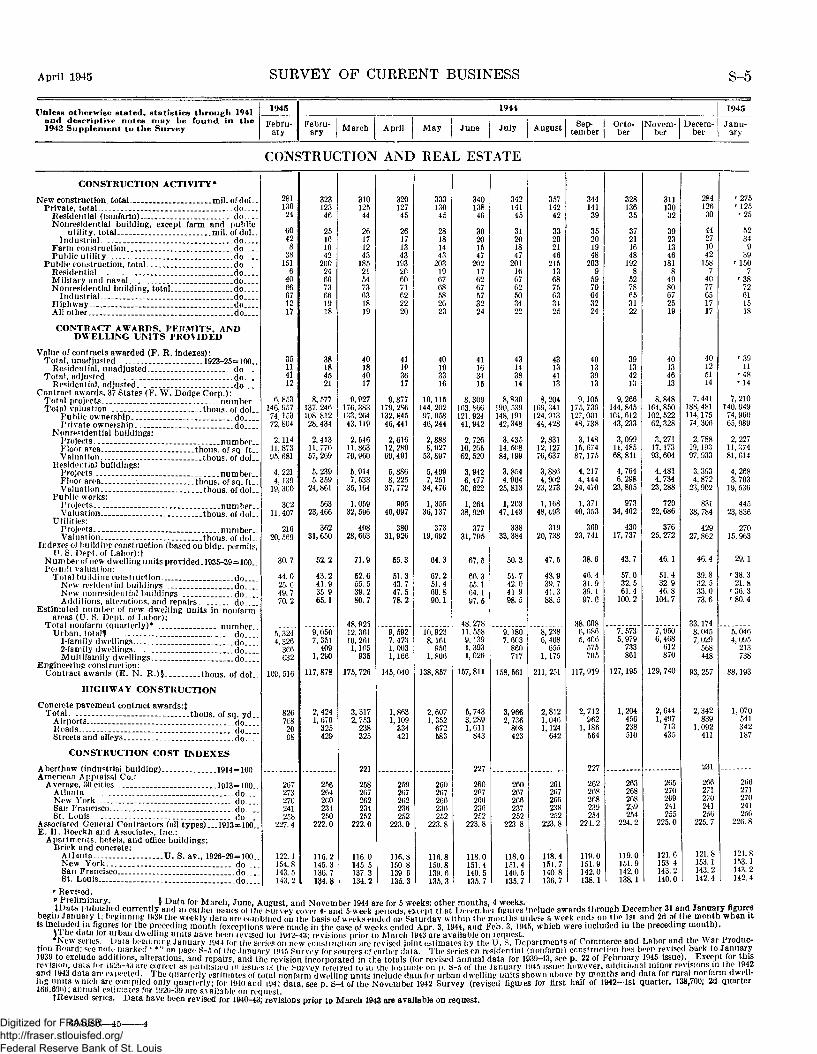
April 1945 SURVEY OF CURRENT BUSINESS S-5
Utiless otherwise stated, statistics through 1941and descriptive notes may be found in the1942 Supplement to the Survey
1945
Febru-ary
1944
Febru-ary March April May June July August Sep-
tem berOto-ber
Novem-ber
Decem-ber
1945
Janu-ary
CONSTRUCTION AND REAL ESTATE
CONSTRUCTION ACTIVITY*
New construction total mil ofdolPrivate, total do
Residential (nonfarm) _ . . do _Nonresidential building, except farm and public
utility, total. mil. ofdolIndustrial do
Farm construction doPublic utility . _ do _
Public construction, total doResidential. . . . do _Military and naval _ _ doNomesidential building, total do
Industrial doHighway _ _ . _ _ doAll other do
CONTRACT AWARDS, PKRM1TS, ANDDWELLING UNITS PROVIDED
Value of contracts awarded (F. R. indexes):Total, unadjusted 1923-25=100..
Residential, unadjusted _ doTotal, adjusted do
Residential, adjusted doContract awards, 37 States (F. W. Dodge Corp.):
Total projects numberTotal valuation thous. oi do!
Public ownership doPrivate ownership. do
Nonresidential buildings:Projects .number..Floor area _. thous. of sq. ft..Valuation thous. of doL.
Residential buildings:Projects _ numberFloor area... ._. thous. of sq. ft..Valuation thous. of dol__
Public works:Projects _ . . .number. .Valuation _ thous. ofdol
Utilities:Projects numberValuation thous of do!
Indexes ol building construction (based on bldg. nerrnitsU.S. Dept.of Labor):t
Number of new dwelling units provided. 1935-39=100..Permit valuation:
Total building construction doNew residential buildings doNew nonresidential buildings doAdditions, alterations, and repairs do
Estimated number of new dwelling units in nonfarmareas (U. 8. Dept. of Labor):
Urban, totali _ _ do1-family dwellings do2-family dwellings doMuiiifamily dwellings do
Engineering construction:Contract awards (E. N. R.)§ thous. ofdol
HIGHWAY CONSTRUCTION
Concrete pavement contract awards:tTotal thous of so yd
Airports ' doRoads doStreets and alleys do
CONSTRUCTION COST INDEXES
Aberthaw (industrial building) 1914 = 100American Appraisal Co.:
Average, 30 cities 1913—100Atlanta . doNew York . doSan Francisco _ doSt. Louis . do
Associated General Contractors (all types)___1913»100__E. 11. Roeckh and Associates, Inc.:
Apartments, hotels, and office buildings:Brick and concrete:
Atlanta U. S. av 1926-29—100New York. . d oSan Francisco doSt. Louis do
28113024
GO428
38151
64066671217
35114112
6,853146, 95774,15372, 804
2,11411, 87395, 681
4,2214,139
19, 3C0
30211, 407
21620, 569
30.7
44.025.649.770.2
5,3244,326
366632
1C0, 516
8267C82098
267273270241258
227.4
122.1154.8143 5143,2
32312346
25161042
200246673661918
38184521
8, 677137,246108,81228, 434
2,41311,77057, 269
6,2395.359
24,861
56323,466
36231,650
62.2
43.241.935.965.1
9,0507.351
4091,290
117,878
2,4241,670
325429
256264260234250
222.0
116.2145 3136 7134.8
31012544
26171243
185215473631819
40184017
9.P27176.383133. 26443,119
2,54611,86379,960
6,9147.533
35, 164
1, 05932, 596
40828, 663
71.9
52.655.539.280.7
4S 92512,36110,2611,165
935
175, 726
3,3172, 753
238325
221
258267262234252
222.0
116.0145 5137 3134.2
32012745
26171343
193206071622220
41IP3617
9,877179,2S6132,84546,441
2,61612,28969,491
5,8868,225
37, 772
P9540,097
38031, 926
65.3
51.343.747.578.2
9, 5927. 4231,0031,166
145, 040
1,8631,109
334421
259267202236252
223.0
116.8150 8139 6135.3
33313045
28181443
203196768582623
40193316
10,115144,20297. 95846,244
2,8888,027
53, 897
5,4997, 251
34,476
1,35536,137
37319,692
64.3
62.251.460.890.1
10,9238, 161
9561,806
138,857
2,6071,352
672583
260267266230252
223.8
116.8150 813f) 6135*. 3
34013846
30201547
202176267573224
41163416
8,309163,866121, 92441, 942
2,72610, 20562, 520
3,9426,477
30, 622
1,26438,929
37731, 795
67.5
66.355.164.197.5
48, 27811,5589, 1391.3931,026
157, 811
5,7433.2891,611
843
227
26026726(5236252
223.8
118.0151 4140 5135.7
34214145
31201847
201166762503422
43143814
8,830190, 539148, 19142,348
3,43514.50884,199
3, 8544.964
25, 813
1,20347,143
33833, 384
50.3
51.742.041.998.5
9.1807. 603
860717
158, 561
3,9662, 736
808423
260267266237252
223 8
118.0161 4140 5135.7
35714242
33202146
215136875633425
43134113
8,204169,341124.91344, 428
2,83112, 12776, 637
3, 8864,902
23, 273
1,16848, b93
31920, 738
47.5
48.939.741.388.5
8,2386,408
6551,175
211, 251
2,8121.0461,124
642
261267266238252
223.8
118.4151.7140 8136.7
34414139
35201948
2039
5979643224
40133913
9,105175, 739127, 00148, 738
3,14815, 67487,175
4,2174,444
24, 4/0
1,37140, 353
36923, 741
38.6
46.431.939. 197.6
38. 6086, 6865,406
575705
117, 919
2,712962
1,186564
227
262268268239254
224.2
119.0151.9142.0138.1
32813635
37211648
1928
5278653122
39134213
9,266144,845101,61243, 233
3,09911,48568, 841
4,7646.298
23, 805
97334,462
43017,737
43.7
57.032.561.4
100.2
7, 5735,979
733861
127,195
1,204456238510
263208268239254
224.2
119.0151.9142.0138.1
31113032
39231346
1818
4980672519
40134613
8,848164,850102, 52262,328
3, 27117.17393, 604
4,4814, 734
23, 288
72022,686
37625, 272
46.1
51.432.946.8
104.7
7,9506,468
612870
129, 740
2,6441,497
713435
265270269241255
225.0
121.6153.4143.2140.0
28412630
44271042
1587
4077651717
40125114
7,441188, 481114,17574, 306
2,78819,19397, 933
3,3934,872
23,902
83138, 784
42927, 862
46.4
39.832.533.073. 6
33,1748,0457,029
568448
93, 257
2,342839
1,092411
231
266271270241256
225.7
121.8153.1143.2142.4
••275'125' 2 5
5234
939
'1507
' 3 872611518
'3911
' 4 8' 1 4
7,210140, 94974, 96065, 989
2,22711,37481,614
4,2683,703
19, 536
44523,836
27015,963
29.1
' 38 .321.8
' 36 .3'80 .4
5,0464,095
213738
88,193
1,070541342187
266271270241256
226.8
121.8153.1143.2142.4
' Revised.v Preliminary § Data for March, June, August, and November 1944 are for 5 weeks; other months, 4 weeks. « m ™JData published currently and in eaiiicr isbues ol the buivey cover 4- and 5 week peiiods, except that l>erem»>ei fijiuies include awards through December 31 and January figures
begin January 1; beginning 1939 the weekly data are combined on the basis of weeks ended on Saturday within the months unless a week ends on I ho 1st and 2d of the month when itis included in figures for the preceding month (exceptions were made in the case of weeks ended Apr. 3, 1944, and Feb. 3, 1945, which were iucluded in the preceding month).
J 1 he data lor urban dwelling units have been ievised loi 1942-43; revisions prior to March 1943 are available on lequest.• £ c ' w / e r i o s - b a l a beginning January 1944 for the series on new construction are revised joint estimates by the U. S. Departments of Commerce and Labor and the War Produc-
tion Board; see note marked ' *" on page 8-5 of the January 1945 Survey for sources of earlier data. The series en residential (nonfnrm) construction hns been revised back to January1939 to exclude additions, alterations, and repairs, and the revision incorporated in the totals (for revised annual data for 1939-43, see p. 22 of February 1945 issue). Except for thisrevision, data lor 1929-4,5 are correci as putilisneu in issues oi the Purvey referred to iii the iooinote on p. 6-5 of the January 1945 issue: however, additional minor revisions in the 1942and 1943 data are expected. The quarterly estimates of total nonfarm dwelling units include data for urban dwelling units shown above by months and data for rural nonfarm dwell-ing units wnich are compiled only quarterly; for 1940 and i94J data, see p. S-4 of the November 1942 Survey (revised figures for first half of 1942—1st quarter, 138,700; 2d quarter166,60<0; annual estimates for 1920-39 are available on request.
fRevised series. Data have been revised for 1940-43; revisions prior to March 1943 are available on request.
634686—45-Digitized for FRASER http://fraser.stlouisfed.org/ Federal Reserve Bank of St. Louis
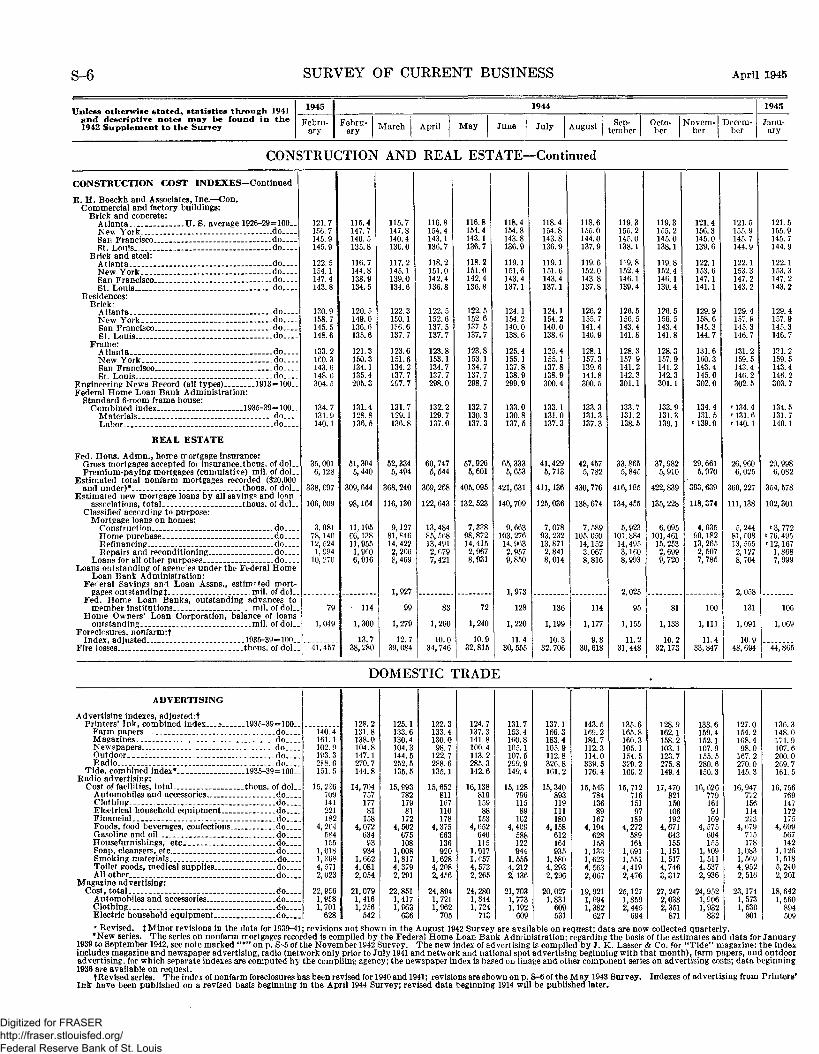
S-6 SURVEY OF CURRENT BUSINESS April 1945
Unless otherwise s ta ted , stat ist ics through 1941and descriptive notes may be found in t h e1942 Supplement to the Survey
1945
Febru-ary
1944
Febru-ary March April May June July August Sep-
temberOcto-ber
Novem-ber
Decem-ber
1945
Janu-ary
CONSTRUCTION AND REAL ESTATE—Continued
CONSTRUCTION COST INDEXES—Continued
E. H. Boeckh and Associates, Inc.—Con.Commercial and factory buildings:
Brick and concrete:Atlanta U. S. average 1926-29=100..New York - - - doSan Francisco do _pt Loir's - - - do
Brick and steel:Atlanta - doNew York - doSan Francisco do. _St Louis - - do
Residences:Brick:
Atlanta doNew York do
St Louis do .-Frame:
Atlanta - doNew York . doSan Francisco. . doSt Louis do __
Engineering News Record (all types) 1913=100..Federal Home Loan Bank Administration:
Standard 6-room frame house:Combined index 1935-39=100
Materials - - doLabor _ _ _ _ _ do____
REAL ESTATE
Fed. Hons. Admn., home mortgage insurance:Gross mortgages accepted for insurance.thous. of dol_.Premium-paying mortgages (cumulative) mil. of dol_.
Estimated total nonfarm mortgages recorded ($20,000and under)* thous. of del
Estimated new mortgage loans by all savings and loanassociations total thous of dol
Classified according to purpose:Mortgage loans on homes:
Construction doHome purchase - __ - doRefinancing doRepairs and reconditioning _ _ do
Loans for all other purposes doLoans outstanding of agences under the Federal Home
Loan Bank Administration:Federal Savings and Loan Assns., estimpted mort-
gages outstanding^ mil. of dolFed. Home Loan Banks, outstanding advances to
member institutions . - . mil. ofdoLHome Owners' Loan Corporation, balance of loans
outstanding _ mil. of dol.Foreclosures, nonfarm :f
Index, adjusted 1935-39=100.Fire losses tbous. of dol
121.7156. 7145.9145.9
122.5154.1147 A143.8
130.9158.7145.5148.6
133.2160.3143.6148.6304.5
134.7131.9140.1
35,0016,128
338, 697
106,009
3,08178,14012,5241,864
10, 270
79
1,049
41,457
115.4147.7140.5135.8
116.7144.8138.9134.5
120.5149.0136. 6135.6
121.3150.3134.1135.4295.3
131.4128.8136.5
51,3045,440
309,644
98,164
11,19566,13811,9551, 9606,916
114
1,300
13.738,280
115.7147.8140.4136.0
117.2145.1139.0134.6
122.3150.11?6.6137.7
123.6151.6134.2137.7297.7
131.7129.1136.8
52,334
5,494
368,240
116,130
9,12781,84614,4222, 2668,469
1,927
99
1,279
12.739, 084
116.8154.4143.1136.7
118.2151.0142.4136.8
122.5152.6137.5137.7
123.8153.1134.7137.7298.0
132.2129.7137.0
60,7476,544
369,268
122,643
13,48485, 56813,4912,6797,421
83
1,260
10.034,746
116.8154.4143.1136.7
118.2151.0142.4136.8
122.5152.6137.5137.7
123.8153.1134.7137.7298.7
132.7130.3137.3
57,9265,601
405,095
132,523
7,33898,87214,4152,9678,931
72
1,240
10.932,815
118.4154.8143.8136.9
119.1151.6143.4137.1
124.1154. 2140.0138.6
125.4155.1137.8138.9299.9
133.0130.8137.5
65, 3335,653
421, 631
140,709
9,663103, 27614,9632,9579,850
1,973
128
1,220
11.430, 555
118.4154.8143.8136.9
119.1151.6143.4137.1
124.1154.2140.0138.6
125.4155.1137.8138.9300.4
133.1131.0137.3
41,4295,713
411,136
125, 036
7,07893, 23213, 8712,8418,014
136
1,199
10.332, 706
118.6155.0144.0137.9
119.6152.0143.8137.8
126.2155.7141.4140.9
128.1157.3139.6141.8300. 5
133.3131.3137.3
42,4575,782
430,776
138,674
7,589105,05014,1523,0678,816
114
1,177
9.830,618
119.3155.2145.0138.1
119.8152.4146.1139.4
126.5156.5143.4141.8
128.3157.9141.2142.3301.1
133.7131.2138.5
33,8655,845
416,185
134,455
5,923101,88414,4953,1608,993
2 025
95
1,155
11.231,448
119.3155.2145.0138.1
119.8152.4146.1139.4
126.5156.5143.4141.8
128.3157.9141.2142.3301.1
133.9131.3139.1
37,9825,910
422, 839
135, 228
6,095101,46115,2532,6999,720
81
1,133
10.232,173
121.4156.3145.0139.6
122.1153.6147.1141.1
129.9158.6145.3144.7
131.6160.3143.4145.0302.0
134.4131. 5
* 139.9
29,6615,970
393,639
118,374
4,63590,18213,2652,5077,785
100
1,111
11.433,847
121.5155.9145.7144.9
122.1153.3147.2143.2
129.4157. 9145.3146.7
131.2159.5143.4146. 2302.5
r 134.4'131.6r 140. 1
26, 9606,025
360, 227
111, 138
5,24481, £0813, 5552,1278,704
2,058
131
1,091
10.948, 694
121.5155.9145.7144.9
122.1153.3147.2143.2
129.4157.9145.3146.7
131.2159. 5143.4146.2303.7
134.5131.7140.1
29, 9986,082
354, 578
102, 301
r 3, 772' 76, 495* 12,167
1,8687,999
106
1,066
44,S6t
DOMESTIC TRADE
ADVERTISING
Advertising indexes, adjusted:tPrinters' Ink, combined index.. .* .1935-39=100..
Farm papers doMagazines doNewspapers- . .doOutdoor ^ doRadio do __
Tide, combined index*.. „__ 1935-39=100..Radio advertising:
Cost of facilities, total _thous. of dol._Automobiles and accessories.._ doClothing .doElectrical household equipment. . . . doFinancial . . . . d oFoods, food beverages, confections .doGasoline and oil doHousefurnishings, etc doSoap, cleansers, etc ;doSmoking materials doToilet goods, medical supplies doAll other . do
Magazine advertising:Cost, total do
Automobiles and accessories doClothing __ doElectric household equipment do
140.4161.1102.9193.3288. 6151. 5
15, 226709141221182
4,2f4584155
1,0181, 3684,5712,023
22,9561,9581,701628
128.2131.8138.0104.8147.1270.7144.8
14, 70475717781158
4,07263493934
1,6624,0812,054
21,0791,4161, 256542
125.1133.6130.4104.3144.5252. 5135.5
15,99378217981172
4,502675108
1,0081,8174,3792,291
22,8511,4171,963636
122.3133.4130.098.7122.7288.6135.1
15,652811167110178
4,375663136920
1,6284,2082,456
24,8941,7211,962705
124.7137.3141.8100.4113.2285. 3142.6
16,13881915988153
4,652640115
1,0171, C574,5732,265
24,2801,8441,724713
131.7153.4160.8105.1107.5299.9149.4
15,12879611589162
4,409588122944
1, 5554,2122,136
21,7031,7731,192609
137.1166.3183.4105.9112.8326.8161.2
15,340893119111180
4,158612164935
1,5804,2932,296
20,0271,831609531
143.5169.2184.7112.3114.0339.5176.4
15,54378413689167
4,194628158
1,1331,6234,5632,067
19,9211,6941,382627
135.6165.8160.3105.1154.5329.2166.2
15,71271615197189
4,272589161
1,0911,5514,4192,476
25,1271,8592,445
128.9162.1158.2103.1123.7275.8149.4
17, 470821150106192
4,671643155
1,1511,5174,7463,317
27, 2472,0382,351871
133.6159.4152.1107.9155.5280.6150.3
16, 62677916191169
4,575604155
1,1091,5114,5372,936
24,9521,9061,932832
127.0154.2168.498.0
167.2270.0145.3
16,947772156114213
4,679715178
1,0831,5694,9522,516
23,1741,5731,530
801f Revised. J Minor revisions in the data for 1939-41; revisions not shown in the August 1942 Survey are available on request; data are now collected quarterly.*New series. The series on nonfarm mortgages recorded is compiled by the Federal Home Loan Bank Administration; regarding the basis of the estimates and data for January
1939 to September 1942, see note marked "*" on p. S-5 of the November 1942 Survey. The new index of advertising is compiled by J. K. Lasser & Co. for "Tide" magazine; the indexincludes magazine and newspaper advertising, radio (network only prior to July 1941 and network and national spot advertising beginning with that month), farm papers, and outdooradvertising, for which separate indexes are computed by the compiling agency; the newspaper index is based on linage and other component series on advertising costs; data beginning1936 are available on request.
fRe vised series. The index of nonfarm foreclosures has been revised for 1940 and 1941; revisions are shown on p. S-6 of the May 1943 Survey. Indexes of advertising from Printers'Ink have been published on a revised basis beginning in the April 1944 Survey; revised data beginning 1914 will be published later.
Digitized for FRASER http://fraser.stlouisfed.org/ Federal Reserve Bank of St. Louis

April 1945 SURVEY OF CURRENT BUSINESS S-7
Unless otherwise stated, statistics through 1941and descriptive notes may be found in the1942 Supplement to the Survey
1945
Febru-ary
1944
Febru-ary March April May June July August Sep-
temberOcto-ber
Novem-ber
Decem-ber
1945
Janu-ary
DOMESTIC TRADE—Continued
ADVERTI SING—Continued
Magazine advertising—Continued.Cost—Continued.
Financial thous. of doL.Foods, food beverages, confections. _ doGasoline and oil— doHousefurnishings, etc - -- doSoap, cleansers, etc.— . . . doOffice furnishings and supplies doSmoking materials _ doToilet goods, medical supplies .doAll other. . _ do
Linage, total ___thous. of lines..Newspaper advertising:
Linage, total (62 cities) doC l a s s i f i e d - . . , _ _ d oDisplay, total _ do
Automotive _ doFinancial doGeneral doRetail do
GOODS IN WAREHOUSES
Space occupied in public-merchandise warehouses §percent of total..
POSTAL BUSINESS
Air mail, pound-mile performance millionsMoney orders:
Domestic, issued (50 cities):Number _ thousandsValue „_ thous ofdol
Domestic, paid (50 cities):Number , thousands..Value thous of dol
CONSUMER EXPENDITURES
Estimated expenditures for goods and services:*Total -mil. ofdol-
Goods doServices (including gifts) do
Indexes:Unadjusted, total 1935 39—100
Goods doServices (including gifts) do
Adjusted, total doGoods doServices (including gifts) do
RETAIL TRADE
All retail stores:!Estimated sales, total mil. of dol..
Durable goods stores doAutomotive group do
Motor vehicles doParts and accessories _. do
Building materials and hardware do..- .Building materials doFarm implements . doHardware do
Homefumishings group doFurniture and housefurnishings doHousehold appliance and radio do
Jewelry stores __ doNondurable goods stores . do
Apparel group doMen's clothing and furnishings. doWomen's apparel and accessories doFamily and other apparel doShoes... _ _ do
Drug stores -- doEating and drinking places doFood group - - - do
Grocery and combination _ doOther food do
Filling stations __ doGeneral merchandise group _ do
Department, including mailorder doGeneral, including general merchandise with
food.. mil. of doL.Other general merchandise and dry goods
mil. of dol. .Variety - - - - - do
Other retail stores doFeed and farm supply doFuel and ice --- - do -Liquors doOther .do.—
4363,452
345656676393688
4,2797,7443,916
95, 80422, 73573,0701,6071,366
17,41152,687
86.6
6,001128,977
13.566189, 330
5,16869020814563
2441502568
17814137-60
4,478484100244
6773
216746
1,4681,093
375190763486
96
80101611162140118192
4193,420
329547675320774
3. 8557,5273,354
99, 93723, 77576,162
1, 6561,320
18.97354, 212
86.2
6,587
6,102112,171
14,536185,538
4,75362818212855
2221352562
1621253861
4,125406
86204
5759
202670
1,3681,047
321187690423
96
7398
602187133105176
4523,597
408805687357836
3,9307,7633,537
117,75126, 37791,374
2,0401,638
21, 76965, 927
86.7
7,339
8.088182, 796
19, 792329,082
22, 44014, 7787,662
152. 7157.9143.6162.7174.5142.0
5,58177422216062
2721603677
1911504289
4,807574117297
7783
225743
1,4931,138
355207859552
108
87112707222150123212
4813,581
5451,061
804426969
4,2198,4173,709
116.47127,16889,303
3,0261,587
21,71362,978
86.1
7,009
5,938110, 676
15,596238,989
5,48711123417263
2961713986
1951563952
4,710567128256
79104217749
1,4941,138
356201834507
112
94121648217122107203
4763,619
5931,154
697440959
4,0867,9733,456
117, 77627, 85489, 922
3,5271,327
22,16462,904
86.6
8,078
6,639111, 672
13,715171,884
5,856914286214
723331934199
2261844170
4,941560128256
7996
233774
1,5791,197
382231884543
120
102119681226118109227
4173,153
498985722313830
3,8637,3482,993
112,63125, 92986, 702
3, 2561,497
21.06260,887
87.4
8,379
5,481112,130
13,318175,852
24,04516, 3277,718
163.6174.4144. 6162. 5172.7144.5
5,71089227319578
340205
4294
2091684270
4,817508130216
7290
230769
1,6121,229
382235819494
116
96114644196117112219
3653,088
528485558254794
3, 6587,3263,277
97.13024,13972, 9912,9231.758
18, 23450, 076
87.5
8,672
5,297110, 964
11,915161, 568
5, 51384825817880
340217
3786
1891494061
4,665421
931886179
235778
1.6611,267
394232735416
118
90111604181101116206
2812,822
493585551301667
3,5846,9353,541
105.89225, 88380,009
2,7861.222
17,88158,120
87.9
5,532126, 553
12.964179, 272
5,71783824717077
3141923388
2081654370
4,878487102240
7075
237818
1,6411,248
393227833508
116
94115635176116123220
4753,324
4881,145
598526901
4. 1198,5533,992
112, 59226, 00986, nS3
2, 2831,278
19. 87063,151
86.4
5.383120,021
13,195185,190
24.49916, 7417,758
166.7178.8145.4168. 2180.6146.5
5,98183022915673
3121923188
2141714375
5,1506051352918594
241812
1,6871,284
403224940593
121
105122642181107125229
4973,855
4231,417
750379
1, 0504.7448,8734,088
129,17727, 390
101, 7873,2431,588
25, 59971,357
86.4
5,783129, 732
13,639194, 334
6,13589824416777
336211
3392
2361884882
5, 2376371543029190
246840
1,6041,209
394225
1,011651
120
110130675188116128243
4413,691
3851,059
641456
1,0014,5888,0193,772
128,24325,317
102,9263,2191,560
25,16372,984
87.3
5,879129,781
14,281200,810
6,214876228151
77307187
2990
24019249
1015,338
68017330810099
239805
1,5821,193
389220
1,116744
121
117135695195117131253
3793,293
2791,051
487436973
3,9778, 3953,212
121, 75124,05897, 6931,9491,534
20, 63173, 578
••87.2
6,639144, 872
14,120197, 557
v 26,646v 18, 839
v 7,807
P ! 8 1 3v 201. 2v 146. 3P 170. 4v 183. 8v 146.8
7,4451,004
223142
8128615826
103282226
56213
6,441946267406146126328844
1,7991,356
443223
1.464929
143
168224836174144179339
4222,865
183599444326771
2,9337,1373,572
97,92724,09073,8371,8682,004
17,12452,841
86.3
7,166153,951
15,141208, 793
' 5,462r 742r229
163' 6 62681692574
' 1 8 21443962
r 4, 720r 509
110' 2 4 9
' 7 179
228' 8 0 2
' 1, 5391,162
378207
'773-•488
101
84100
' 6 6 1170170122
'199
v Preliminary. f Revised. § See note marked " § " on p. S-6 of the April 1943 Survey in regard to enlargement of the reporting sample in August 1942.*New series. The series on consumer expenditures, originally published on a monthly basis in the October 1942 Survey (pp. 8-14), are now compiled quarterly only (data are
quarterly totals) and have been adjusted to accord with the annual totals shown as a component of the gross national product series (see p. 5 of the February 1945 Survey for 1941-44dollar totals and p. 13, table 10, of the April 1944 issue for 1939-40 totals); the quarterly data are shown on the revised basis beginning in the February 1945 issue; quarterly data begin-ning 1939 are available on request.
fRevised seri.and indexes—all iand feed and farn ,,..., , ._, o , —. t, „ x. x .... ^ ^ .indexes only—automotive group, 1942-43; apparel group, November and December 1942: jewelry stores, November and December 1942 and November 1943. Revised 1941-43 datafor drug stores are shown on p. 16 of the November 1944 Survey. The unpublished revisions listed and January-May 1043 revisions for other series, also unpublished, are availableon request. Revised figures for 1929, 1933, and 1935-42, except as indicated above, are available on pp. 7 and 11-14 of the November 1943 Survey.Digitized for FRASER
http://fraser.stlouisfed.org/ Federal Reserve Bank of St. Louis

S-8 SURVEY OF CURRENT BUSINESS April 1945
Unless otherwise stated, statistics through 1941and descriptive notes may be found in the1942 Supplement to the Survey
1945
Febru-ary
1944
Febru-ary March April May June July August Sep-
temberOcto-ber
Novem-ber
Decem-ber
1945
Janu-ary
DOMESTIC TRADE—Continued
RETAIL TRADE—Continued
All retail stores—Continued.Indexes of sales:!
Unadjusted, combined index _1935-39=100.Durable poods stores do. . ,Nondurable poods stores do. . .
Adjusted, combined index _ doIndex eliminating price changes do.
Durable goods stores _ do.Automotive _ do.Puilding materials and hardware do.Bomefurnishings _ do.Jewelry do.
Nondurable goods stores doApparel doDrug doEating and drinking places _ doFood doFilling stations doGeneral merchandise. _ doOther retail stores -do
Estimated inventories, total* mil. of dol_.Durable goods stores* .doNondurable goods stores*. . . do
Chain stores and mail-order houses:Sales, estimated, total* do
Automotive parts and accessories* doBuilding materials*.. _ .doFurniture and housefurnishings* doApparel group* _ do
Men's wear* doWomen's wear* doShoes* do
Drug* doEating and drinking* doGrocery and combination* doGeneral merchandise group* do
Department, dry goods, and general merchan-dise* . mil. of dol_.
Mail-order (catalog sales)* doVariety* do
Indexes of sales:Unadjusted, combined index* 1935-39=100..Adjusted, combined index* do
Automotive parts and accessories* •_ doBuilding materials* doFurniture and housefurnisbings* doApparel group* do
Men's wear* doWomen's wear* doShoes* _ . do . . . .
Drug* _, doEating and drinking* doGrocery and combination* doGeneral merchandise group* . . . do
Department, dry goods, and general merchan-dise* 1935-39=100..
Mail-order* doVariety* _ d o . . .
Department stores:Accounts receivable:
Instalment accounts! 1941 average=100_Open accounts! _ d o . . .
Ratio of collections to accounts receivable:Instalment accounts! percent.Open accounts! d o . . .
Sales, unadjusted, total U. S.f ...1935-39=100.At Ian taf doBoston! d o . . .Chicagot . . . doCleveland! doDallas! d o . . .Kansas Cityt doMinneapolisf doNew Vorkf doPhiladelphia! d o . . .Richmond! do.St. Louis! _ d o . . .San Francisco d o . . .
Sales, adjusted, total U. S.t d o . . .Atlanta! doBoston! d o . . .Chicago! doCleveland! _ d o . . .Dallas!. _ d o . . .Kansas City! d o . . .Minneapolis! doNew York! - d o . . .Philadelphia! L d o . . .Richmond! doSt. Louis! d o . . .San Francisco d o . . .
1415087
161.6184.1146.2179.2134.1273.0If 5. 4382.6204. 8179.618P.177.0187.3
2°5.117^.6165.2
4084
3061
171235130162163239
v If 4144137
*149lfl1872121227416'2C0204284
. *2462C8166
*189251236256
153.681.6
177.0172.8129.798.148.2
144.7143.4327.8197.1220. 6181.2305. 5ISO. 6110.0105.7224.56,2331,7744,459
1,0481831101211666285139350257
1244284
146.2105.5121.6155.6115.0227.3160.7323.1168. 1177.1178.3167.8163.5
175.5140.2155.2
4172
'3061142194115131133200160122115
'1231591531175225148162166241203176138
' l f>6209194209
168.093.4192.3177.6133.1105. 053.3141.9146.8460. 7201.3226. 6192.5301.4194.7106.3172.1233. 96,3811,8204,561
1,246193612
1792896405742381322
1595997
162. 2170.4117.7152.8119.3229. 1204.9316.8152.6191.2176. 4169.8172.8
183.8158.4162.0
4079
3665170219144l.r916722718214013916220318519718522516217318324/193159158173212195218
171.9100 0195. 3169. 9126. 2100. 556.2144.3144.9264.0192.5204.7188.0301.5190.898.6161.5216.56,3431,8744,469
1,252214113
1852791525341
386328
17441105
167.4163. 4119.5159.4120.0212.6171.2296.6151. 1182.1175.2169.3160.2
170.8124.0161.7
3879
3163172228161166172228182159137159193183192172222is:1T166232181157140162199173201
179.4113.6200. 9175. 5129.6106.363.8145.6148. 5285. 7198.0211.8192.82rJ6. 2169.9103.3168. 4218.36.3611,9104,451
1,296244514
1782690485543397340
18742103
172.41T9.9127.4150 6iro. 3217.2190.9301.4145.8182 7•184.2178.7168.7
188. 6116.1165.5
3682
3364178228162170122819416014216121019720;l«233164167181228192158150168211197216
177.7111.6199.3175.0129.0106.059.7151.2153.8275. 1197. 5201.0195.3259.12C3.2104.8163. 5218.76,3141,8694,445
1,2662749131652580465442400320
1753999
169.7168.1126.7166.6133.0199.9169.0272.2144. 1184.7189.2182.1161.7
179.1114.3159.1
3478
31631631991441C0157203177151132143183170193175237151163166245192151142159203189210
169. 5108.5189.4178.7130.8109.657.7163. 5156.0310.2201.2216.8192.9294.6203.3101.2173.4225.36,1661,8494,317
1,2142752121341670386542405297
16231
159.9172.2140.5190.7132.4213.5162.6283.817071F6. 7188.6182.6165.2
184.3126-3155.6
3267
3061142197110139140194168130100117151154185192263160187191266212165149170214208223
172.7101.1196. 1178. 5130.1102.554.3144.5151.4321. 1203.3233.2193. 5291.7204.798.1176.6223.56, 5211,9064,615
1,2392646131431680355543387332
17450
162.2175.8127.3149.4114.1235. 5187.1329.4165. 1186.5187.5183. 4178.5
194.0158.5164.0
3270
346415721811815115922019115411012317617820218'245154180182250204173151158213207221
185. 3106.9210.8177.4129.3103.553.3138.7164.5347.3201.5212.9199.3304.8204.5100.7172.6218.86, 6021.9094,693
1,338264814180269445£643404370
19760105
176.4172.7141.8146.3127.4223.6196 2326.4132.8187.61F2.7179.6173.1
182.7163.3161.8
3381
356419625'170185191265220184158173231212226183247156168180241200162149170214192217
189.7111.6215.1183.6133.9107.456.5143.2171.0345. 4208.4218.7207.3320.2208.1105.4178.6230.76, 7791,9144,805
1,3922754171863296425844399404
21568113
187.1178.0153.4159. 7134.0226.82(0. 4324.0141.71P0. 1177.9186. 5177.3
192.2135. 6175.7
3590
3965
209273184197204272226179173190248221238194260165192190252215158152168224215228
197.3113.1224.7191.5139. 5107. 653.7
147.0175.6345. 3218.9245.8209.5336.1212.1108.51C0. 2246.06,6651,8694.796
1,404304818
1933298465742
383429
22876
116
192.8182.6173 6163.9139.7242.2200.03"0. 7177.0190.4180.9179.4188.1
210.6157.2169.6
40102
3967
248315207231244314263218207231294268299210269177201203264244189164183251235253
227.1128.5259.3187.9136.4105.048.9
148.8176.3327.0214.9240.5218.0328.1215.4112.3176.3234.25,8691,6274,242
1,726313921
'260' 4 3131
647846
444560
2f660
1£4
225.7177. 3156.1178.1141. 022P.71<7.1300.1
177.7If 5. 4174.0183.6168.9
191.0123. 3157.8
46128
3661
3204183C02 r5303421339269270305369333373If32£8174180If 0263208175155171208207233
» Preliminary. ' Revised. § Minor revisions in the figures prior to November 1941 are available on request.* New series. Data for 1929, 1933, and 1935-42 for the new chain store series are available on pp. 15 to 17, table? 2. 3, and 4. o<" the February 1P44 Survey except for subsequent
revisions 8? follow?: The totals and furniture and bouse furnishirgs (dollar figures and indexes') have been revised back to January 1940 and the indexes for all series in the generalmerchandise group, except mail-order, back to January 1942: indexes for the apparel group and women'*: wear Tor Novemler and December WA2; the latter revisions and revisionsbeginning December 1943 fnr other series are in the February 1945 Survey; earlier revisions for the series listed and January-March 1943 revisions for other series, which have not beenpublished, are also available on request. Data beginning 1939 for the newr estimates of retail inventories will be published later.
!Revised series. See note marked '*!" on p. S-7 regarding revision of the indexes of retail ^aies and the source of earlier data. The indexes of department store sales for the UnitedStates and the indicated districts have been revised for all years: the revision? reflect primarily enlargement of the samples, adjustment of indexes to 1929 and 1939 census data, wherenecessary, and a recalculation of seasonal factors; in addition, all series have been computed on a 1935-39 base. The Boston index is a new series from the Board of Governors of theFederal Reserve System. Revised data beginning 1919 or 1923 for three series are published as follows* United States, Decerrher 1944 Survey, p. 17; Dallas, February 1944, p. 20;Richmond, June 1944, p. 22. Complete data for other districts will be published later; indexes for Atlanta have been shown on the revised basis beginning in the February 1944 Sur-vey and for other districts beginning in the June 1944 issue (further revisions in July 1943 index for New York—unadjusted, 92; adjusted, 137).Digitized for FRASER
http://fraser.stlouisfed.org/ Federal Reserve Bank of St. Louis
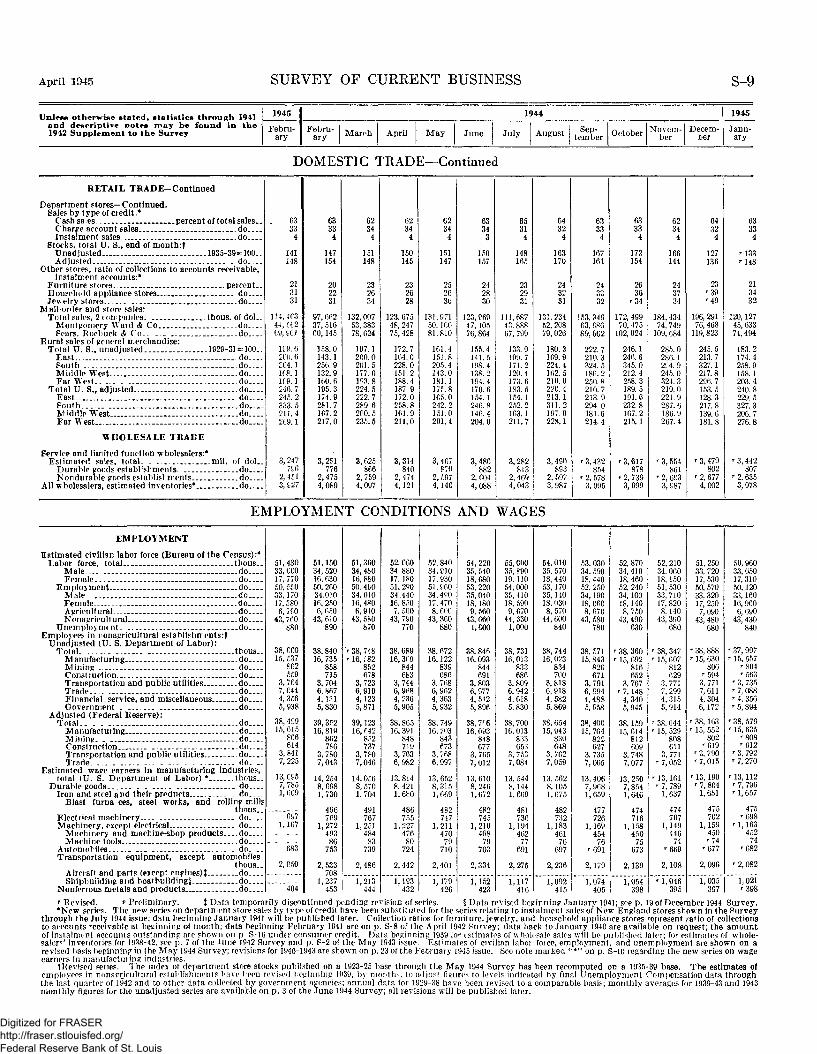
April 1945 SURVEY OF CURRENT BUSINESS S-9
Unless otherwise stated, statistics through 1941and descriptive notes may be found in the1942 Supplement to the Survey
1945
Febru-ary
1944
Febru-ary March April M a y June July August Sep-
tember October Novem-ber
Decem-ber
1945
Janu-ary
DOMESTIC TRADE—Continued
RETAIL TRADE—Continued
Department stores—Continued.Sales by type of ciedit.*
Cashsa es percent of total sales-Charge account sales doInstalment sales do
Stocks, total U. S., end of month:fUnadjusted 1935-39 -100..Adjusted do
Other stores, ratio of collections to accounts receivable,instalment accounts:*
Furniture stores percent..Household appliance stores doJewelry stores do
Mail-order and store pales:Total sales, 2 companies thous. of dol_.
Montgomery Ward & Co doFears, Roebuck & Co.. do
Eural sales of general merchandise:Total U. S., unadjusted ._ 1929-31 = 100.
East _ _ __.do_._.South doMiddle West— do_._Far West do.._
Total U. S., adjusted. _ do.._East _ do.._Fouth _do...Middle West do . . .Far West—. do__.
WHOLESALE TRADE
Service and limited function wholesalers:*Estimated sales, total. . mil. of dol_
Durable goods establ'srments doNondurable goods establishments do
All wholesalers, estimated inventories* do. . .
6333
4
141148
213131
114,46344, It269, £01
K9. 62C0. 6£6111(8.11£9. 1246. 7
£23. 5211.4269.1
3,24776
2, 4£13, £27
147154
202231
97,66237,51660,145
158.0143.1250. 9132.9Hi0.fi195.3174.9281.7167.2217.0
3,251776
2, 4754,089
62344
151148
232634
132,00753, 38378, 624
197.1200.0261.5177.61P3.8224.5222.7289.6200.5235.5
3, 625866
2,7594,097
62344
150145
232628
123,67548,24775,428
172.7164.0228.0151.2188.4187 9172.0258.8161.9211.0
3,314840
2,4744,121
62344
151147
252630
131,97150,J6081,810
161.4151.8205.4143.0181.1175.8165.0242.2151.0201.4
3,467870
2,5974,146
63343
150157
242830
123,66947, 10576, 864
155.4141.5198. 4138.2194.4170.6154. 1246. 8146.4204.0
3, 486882
2, 6044,088
65314
148165
232931
111,68743. 88867,799
133.9109.7171.2120.4173. 6183. 5154. 1252.2163.1211.7
3,282813
2,4694,043
64324
163170
243231
131,23452, 20879,026
180.3169.9224.4162. 5210.0220. 4213.1311.2197.0228.1
3,490893
2, 5<)73, 987
63334
167161
243332
153,34963,68689,662
222.7210. 3324. 5186. 2250.8210.7213.9294.0181.6214.4
r 3, 432854
r 2, 5783,995
63334
172154
2636
'34
172, 49970, 475102, 024
246.124(5. 6345.0212.4258. 3189.5191.6232.8167. 2215.1
r 3, 617878
r 2, 7393,999
62344
166144
243734
184, 43474, 749109, 684
285.0286.1214. 9245.0324.3219.0221.9287.6186.9267.4
' 3, 554861
' 2, 6£33, £87
64324
127136
23'39'49
196, 29176, 468119,823
245.5213.7327.1217.8296. 7153.5128.3217.8139.6181.8
' 3,479802
' 2, 6774,002
6333
'148
213432
120,12745, 63374, 494
183.2174.4258. 9158.1203. 4240.8229.5327.3206.7276.8
r 3, 442807
r 2, 6353,978
EMPLOYMENT CONDITIONS AND WAGES
EMPLOYMENT
Estimated civilian labor force (Bureau of the Census):*Labor force, total thous_.
Male doFemale - do
Employment _ doMale doFemale doAgricultural _ doNonagrieultural do
Unemployment - doEmployees in nonagrieultural establishments:!
Unadjusted (U. S. Department of Labor):Total. trous_.
Manufacturing. _ _ doMining doConstruction doTransportation and public utilities doTrade. . doFinancial, service, and miscellaneous doGovernment . _ do
Adjusted (Federal Reserve):Total do
Manufacturing doMining. _ doConstruction _ doTransportation and public utilities doTrade do
Estimated W8ge earners in manufacturing industries,total (U. S. Depanment of Labor) •__ thous_.
Durable goods . . . . . . . doIron and steel and their products do
Blast furna ces, steel works, and rolling millsthnus_.
Electrical machinery doMachinery, except electrical do
Machinery and machine-shop products doMachine tools do
Automobiles - do. . .Transportation equipment, except automobiles
thous..Aircraft and parts (except engines)! doShipbuilding and boatbuilding§ do
Nonferrous metals and products— do
51, 43033, 66017, 77050, 5£033,17017, S80
6, 7S043, 760
38, CCO15, 537
862559
3,7647, 6444,3565,938
38,4£915,615
£66614
3,8417,225
13, CP57,7851,669
6971,167
683
2,050
404
51,15034,52016,63050,26034.01016, 2506, 650
43,610890
38, 84016, 735
858715
3,7046,8674,1315,830
39, 35216,819
862786
3,7807,043
14, 2548, 6881,730
496769
1,27249386753
2,533708
1,237453
51,36034,48016,88050.49034,01016,4806,910
43, 580870
' 38, 748• 16, ,r82
852678
3,7236,9194, 1235,871
39,12316,642
852737
3,7807,046
14, 0568, 5701,704
491767
1,25148483739
2,486
1,213444
52, 06034,88017, 18051,29034.44016, 8507, 500
43, 790770
38. 68916, 3f)9
844683
3,7446,9^84,2365,905
38,86516, 391
848719
3, 7636,982
13,8148,4211,680
486755
1,22747680724
52. 84034.91017,93051.96034, 49017,4708, GOO
43, 360880
38,67216,122
839686
3, 7686, 9624,3635,932
38, 74916,203
843673
3, 7f>86,997
13, 6528,3151,669
482747
1,21147079710
2,442 2,401
1,193 1,179432 I 426 I
54, 22035, 54018,68053, 22035,04018, 1809, 560
43, 6601.C00
38, 84616,093
844691
3, 8036,9774,5-125,896
38, 76616, 093
848677
3, 7657,012
13,6108, 2461,672
482745
1,210468
79703
2,334
1,152423
55,00035, 89019. 11054, 00035,41018. 5909, 670
44,3301,000
38,73116,013
833686
3, 8096,9424, 6185,830
38, 70016,013
833653
3,7537,084
13, 5448,1441,669
481736
1,194462
77691
2,275
1,117416
54,01035, 57018, 44053, 17035,14018.0308,570
44, 600840
88, 74416,023
834700
3,8186,9184,5825,809
38, 65415,943
830648
3, 7627,059
13, 5628,1051,675
482732
1,183461
76697
2,236
1,092415
53. 03034. 59018,44052. 25034,19018, 0608,670
43, 580780
38, 57115,843
826671
3,7916, 9944,4885,958
38, 40015, 764
822627
3,7357,065
13, 4067, 9681,659
477726
1,169454
76' 6 9 1
2,179
1,074405
52, 87034, 41018, 46052. 24034, 10018, 1408, 750
43, 490630
' 38, 360* 15, 692
816652
3,767r 7,148
4,3405,945
38.15915,614
812609
3,7487,077
13, 2507,8541,646
474716
1,158450
75673
2,139
1,054398
52,21034,06018,15051, 53033,71017,8208.140
43, 3S0680
r 38, 347T15, 607
812629
3,7717,2994,3155,914
r 38,044r 15, 529
808611
3,771' 7, 052
r 13, 161r 7, 789
1,637
474707
1,149446
74r 669
2,108
r 1,046395
51, 25033, 72017, 53050, 57033, 32017, 250
7,09043, 480
680
r 38, 888r 15, 630
806r 594
3,7717,6114,3046,172
r 38,163r 15, 552
802••619
r 3, 790r 7, 015
r 13, 190r 7, 804
1,651
475702
1,159450r 74
'677
2,096
1,035397
50, 96033, 65017, 31050,12033,16016, 9606,690
43, 430840
• 37, 997• 15, 557
'804r 563
r 3, 735r 7, 088' 4, 356r 5, 894
' 38, 579-15, 635
' 8 0 8r612
r 3, 792' 7, 270
r 13,112r 7, 796r 1,657
475••698
' 1,163452
74' 6 8 2
»• 2, 082
1,021'398
f Revised . *> P re l imina ry . % Da t a temporar i ly d iscont inued pend ing revision of series. § D a t a revised beginning J a n u a r y 1941; see p . 19 of December 1944 Survey .• N e w series. T h e now series on depa r tmen t store sales by type of credit have been subs t i tu ted for the series relating to ins ta lment sales of New England stores shown in the Purvey
through the Ju ly 1944 issue; da ta beginning J a n u a r y 1941 will be published later. Collection ratios for furniture, jewelry, and household appl iance stores represent ratio of collectionsto accounts receivable at beginning of rnor.th; data beginning Februa ry 1941 are on p . S-8 of the April 1942 Survey; da ta back to J a n u a r y 1940 are available on request; the a m o u n tof ins ta lment accounts ou t s t and ing are shown on p S-16 under consumer credit . D a t a beginning 1939 for es t imates of wholesale sales will be. publ ished later; for est imates of whole-salers ' inventories for 1938-42. see p . 7 of the June 1942 Survey and p. S-2 of the M a y 1943 i^sue. Es t imates of civilian labor force, employment , and unemployment are shown on arevised basis beginning in the M a y 1944 Survey; revisions for 1940-1943 are shown on p . 23 of the Feb rua ry 1945 issue. See note m a r k e d " * " on p . S-10 regarding the new series on wageearners in manufac tur ing industr ies .
tRevised series. T h e index of d e p a r t m e n t store stocks published on a 1923-25 base through the M a y 1944 Survey has been recomputed on a 1935-39 base. T h e est imates ofemployees in nonagricul tural es tabl i shments have been revised beginning 1939, by m o n t h - , to adjust figures to levels indicated by final Unemploymen t Compensat ion da ta throughthe last qua r t e r of 1942 and to other da t a collected b y government agencies; annua l da t a for 1929-38 have been revised to a comparable basis; m o n t h l y averages for 1939-43 a n d 1943m o n t h l y figures for t he unad jus ted series are available on p . 3 of t h e J u n e 1944 Survey; all revisions will be publ i shed later .
Digitized for FRASER http://fraser.stlouisfed.org/ Federal Reserve Bank of St. Louis

S-10 SURVEY OF CURRENT BUSINESS April 1945
Unless otherwise stated, statistics through 1941and descriptive notes may be found in the1942 Supplement to the Survey
1945
Febru-ary
1944
Febru-ary March April May June July August Sep-
temberOcto-ber
Novem-ber
Decem-ber
1945
Janu-ary
EMPLOYMENT CONDITIONS AND WAGES—Continued
EMPLOYMENT—Continued
Estimated wage earners In mfg. industries—Continued. *Durable goods—Continued.
Lumber and timber basic products .— thous—Sawmills do
Furniture and finished lumber products doFurniture do
Stone, clay, and glass products— doNondurable goods.. do
Textile-mill products and other fiber manufacturesthous—
Cotton manufactures, except small wares.-.doSilk and rayon goods -doWoolen and worsted manufactures (except dyeing
and finishing) thous—Apparel and other finished textile products.-.do
Men's clothing doWomen's clothing _ _do
Leather and leather products doBoots and shoes -do
Food and kindred products doBaking. __.doCanning and preserving doSlaughtering and meat packing. . —do
Tobacco manufactures doPaper and allied products do
Paper and pulp ._ doPrinting, publishing, and allied industries do
Newspapers and periodicals doPrinting, book and job _ do
Chemicals and allied products -doChemicals. .1 do
Products of petroleum and coal _ doPetroleum refining _ .do
Rubber products doRubber tires and inner tubes do
Wage earners, all manufacturing, unadjusted (U. S.Department of Labor)f 1939=100-
Durable goods doIron and steel and their products do
Blast furnaces, steel works, and rolling mills1939=100-
Electrical machinery _ doMachinery, except electrical do
Machinery and machine-shop products doMachine toolsj _ do
Automobiles doTransportation equipment, except automobiles
1939=100-Aircraft and parts (excluding engines) • . . - d oShipbuilding and boatbuilding§ do
Nonferrous metals and products doLumber and timber basic products.- . do
Sawmills doFurniture and finished lumber products do
Furniture — doStone, clay, and glass products . . . do
Nondurable goods __ doTextile-mill products and other fiber manufactures
1939=100..Cotton manufactures, except small wares —doSilk and rayon goods doWoolen and worsted manufactures (except dyeing
and finishing) 1939 = 100-Apparel and other finished textile products.._do
Men's clothing doWomen's clothing _ _do
Leather and leather products doBoots and shoes do
Food and kindred products doBaking . . . doCanning and preserving doSlaughtering and meat packing _._do
Tobacco manufactures - doPaper and allied products do
Paper and pulp ——doPrinting, publishing, and allied industries do
Newspapers and periodicals* doPrinting, book and job* do
Chemicals and allied products . .doChemicals do.
Products of petroleum and coal do.Petroleum refining -do.
Rubber products. -do.Rubber tires and inner tubes do.
Wage earners, all mfg., adjusted (Fed. Res.)t doDurable goods —^—do-Nondurable goods do.
451
"339'
3255,310
1,075
310
82310
329
133
~196~
159.9215. 6168.3
268.8220.8
169.7
1,291. 7
176.3107.3
103.2
110.7115.9
94.0
105.8
89.3
"117.T
88.0116.7
100.2
221.4
~ 1 2 6 . 1
161.9
160. 4216.1116.5
484235358166346
5,556
1,16346194
159909218229317176
1,0132589416887
3201483381101376551211278420494
174.0240.9174.5
127.6296.9240.6243.7234.2187.3
1,596.11, 785. 41, 786. 2
197.6115.281.7109.3104.1117.9121.3
101.7116.378.3
106. 5115.199.584.291.480.7118.6111.869.9139.693.5120.6108.0103. 092.6108.4227 4174.5119.7115.3168. 6173.8174.6241.5121.9
482234354164343
5,486
1,15145593
158906217231318176
1,002257901628331814833611013562412012785202
171.6237.3171.9
126.4295.9236. 7239.2227.1183.7
1,566.5
1, 752. 4193.5114.781.2
107.9103.1116.8119.8
100.6115.077.5
105.8114.799.284.991.780.8
117.3111.567.0
134.089.5
119.9107.3102.492.9
106.7216.6172.5120.1116.2167. 2172.9172.1237.7120.4
475232347159339
5,393
1,12844591
155879214221315175
1,0022551001568331414633211013360112012886197
168.6233.2169.4
125. 0291. 5232.2235.1219.4180.1
1,538. 3
1, 722. 5188.3113.180.4
105.8100.1115.6117.7
'98.b112.576.3
103.9111.397.981.590.980.3
117.2110.574.1
129.689.4
118.3106. 2101.292.9
104.9208.6172.7121.0117.9162.8169.3169.4233.4118.9
474233342156335
5,337
1,11043890
152862213213312174
1,00525410015582
3111453291101315921201308719590
166. 7230.3168.3
124.0288.4229.2232.1216.0176.5
1,512.7
., 703. 2185.7112.980.7
104.397.9
114.2116.5
97.1110.674.8
102.0109.297.378.689.979.7
117.6110.174.3
128.388.3
117.1105.4100. 292.7
103. 6205. 4172.5122.7120.0161.2166. 5167.7230.3118.3
476235345158338
5, 364
1,10443690
151867214217313175
1,038257111158'833111463301101325841201328919389
166.1228.4168.7
124. 0287.7229.0231.3214.4174.6
1,470. 7
1. 664. 2184.5113.381.7
105. 399.0
115.0117.1
96.6110.074.7
101.4109.897.879.790.380.2
121.5111.682.2
130.989.4
117.0106. 2100.793.1
104.6202.7171.8124.2121.8159.2164.8166.7228. 2118.3
480238346157337
5,400
1,08843489
146838208205312174
1,12025817715983
31114633311013558411913491192
165. 3225. 5168. 3
123.8284.0225. 9228.4210. 2171.8
1,433.4
1,612.7181.4114.282.5
105.398.3
114.7117.9
95.1109. 673.9
97.8106.195.275. 590.079.8
131.1112.0131.8131.788.6
117.2106.4101.592.5
106.9202. 5170.9126.6124.3158. 8165.6165.2225.3117.9
484240348157335
5,457
1,083431
145858211215312174
1,16325922015682
3101473311101335891181359119391
165.6224. 5168.9
124.1282.4223.9227.7207.4173.2
1,408.8
, 577.1180.9115.183.4
106.093.8
114.2119.1
94.7108.974.1
'97.0108.796.379.089.979.7
136.1112.0163.4129.788.2
116.8106.8101. 092.9
105. 5204.5170.0127.2125.5159.5168. 5164.1224.1116.8
471234339153329
5,438
1, 076
428
146856208216309172
1,17025624415182
3041453251091305931171339119292
163.6220.7167.3
122.7280.4221.2224.3206.5171.8
1,373.2
1,551.4176.8112.181.1
103.496.3
112.2118.7
94.1108.073.7
97.7108.495.279.688.978.9
137.0110.8181.8125.088.0
114.7105. 799.292.1
103.2205.6168.1126.1124.6159.0170.6162.6220.4117.0
462227337153325
5,396
1,072424
146861208219308171
1,11326218014883
3061443311101336011161329019292
161.7217.5166.0
121.9276.3219.2222.3204.0167.4
1,347.8
1, 522. 5173.6109.878.9
102.895.8
110.9117.8
93.7107.173.6
97.8109.095.380.588.878.5130 3113.3133.9122 789.2115.1104.7100.892.9105.520S. 7166. 6125.0123.6158. 5170.6161.0217.3116.6
459226338153327
5,372
1,081429
147854206218310172
1,07426513414984
3081453331111356071151329019293
' 160. 7' 215.7165.2
122.0272.9217.5220.2202.2
' 166. 3
1,327.8
1,510.2172.1109.278.5
103.195.9
111.4117.3
94.5108.374.4
98.4108.194.180.189.479.0
125. 7114.899.9
123.790.1
116.0105.5101.493.3
106.4210.6165.5125.1124.0159.1171.4
' 160. 3'215.6116.7
452221340153330
5,386
1,092434
148851205217312173
1,054265114155853121473351111366211161339119493
' 161.0'216.1166.5
122.2271.1219.2222.2
' 202. 8r 168. 3
1,320. 7
1,494. 0173.1107.676.6
103.696.3
112.3117.6
95.5109. 575.0
99.4107.893.579.889.879.5
123.3114.884.6
129.090.7
117.4107.1102.393.8
107.2215. 4166.0125.3124.7160.3171.7
' 160. 7'216.1
117.0
' Revised. § Data revised beginning January 1941; for revisions for 1941-43, see p. 19 of the December 1944 Survey.JFor data for December 1941-July 1942 see note marked " j " on p. S-10 of the November 1943 Survey.• For data for December 1941-February 1943, see note at bottom of p. S-35 of the May 1944 Survey; data temporarily discontinued pending revision of series.•New series. Data beginning 1939 for the new series on wage earners in manufacturing industries will be shown in a later issue; data for the individual industries shown in the
Survey beginning with the December 1942 issue, except those for shipbuilding (see note marked "§"), are comparable with figures published currently; the figures for all manufacturing,durable goods, nondurable goods, and the industry groups are shown on a revised basis beginning in the March 1945 issue and are not comparable with data in earlier issues.
fRevised series. The indexes of wage-earner employment and of wage-earner pay rolls (p. S-12) in manufacturing industries have been completely revised; for 1939-41 data for theIndividual industries, except newspapers and periodicals and printing, book and job, and 1939-40 data for all manufacturing, durable goods, nondurable goods, and the industrygroups, see pp. 23-24 of the December 1942 Survey (the 1941 data for shipbuilding published in that issue have been revised; see note marked "§"); for 1941 data for the totals and theindustry groups, see p. 28, table 3, of the March 1943 issue. Data beginning 1942 for the totals and the industry groups have recently been revised to aijust the indexes to levelsindicated by final 1942 and preliminary 1943 data from the Bureau of Employment Security of the Federal Security Agency; data beginning January 1944 were revised in the March1945 Survey; 1942-43 revisions will be published later. The seasonally adjusted employment indexes are shown on a revised basis beginning in the March 1945 Survey; the adjustedindexes are available only for the totals shown.
Digitized for FRASER http://fraser.stlouisfed.org/ Federal Reserve Bank of St. Louis
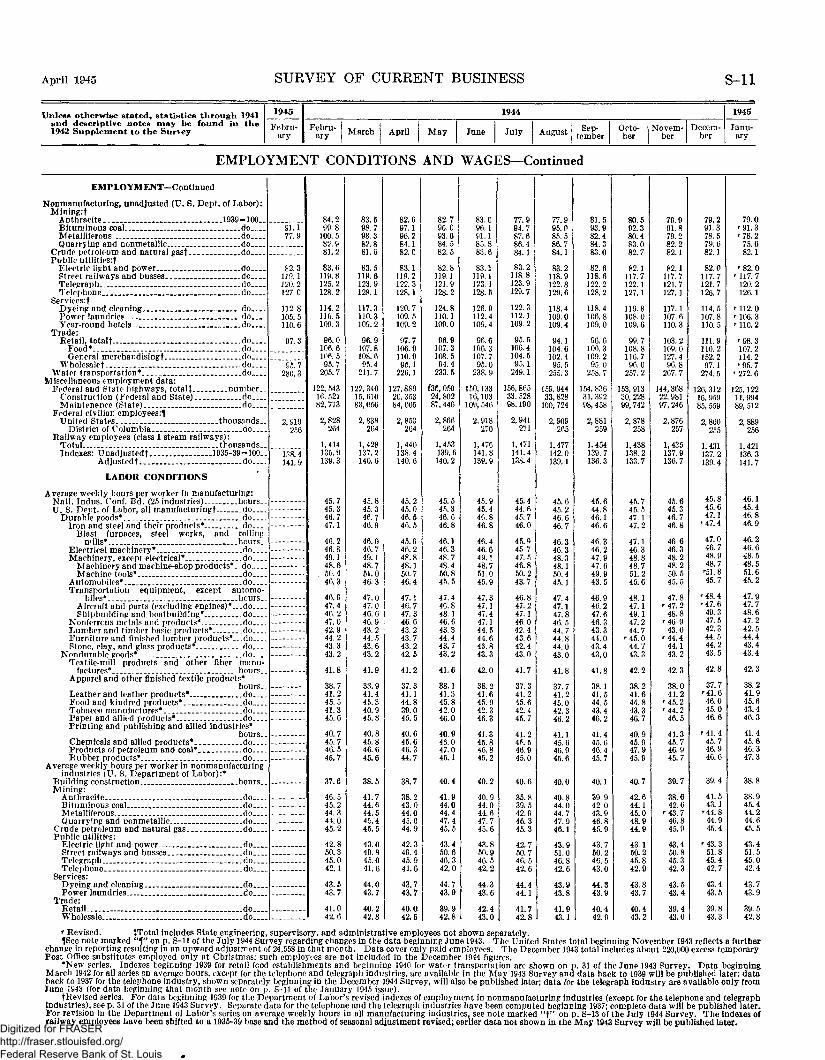
April 1945 SURVEY OF CURRENT BUSINESS S-ll
Unless otherwise stated, statistics through 1941and descriptive notes may be found in the1942 Supplement to the Survey
1945
Febru-ary
1944
Febru-ary March April May June July August Sep-
temberOcto-ber
Novem-ber
Decem-ber
1945
Janu-ary
EMPLOYMENT CONDITIONS AND WAGES—Continued
EMPLOYMENT-Cont inued
Nonmanufacturing, unadjusted (U. 8. Dept. of Labor):Mining:!
Anthracite 1939 «= 100Bituminous coal do _Metalliferous doQuarrying and nonmetallic do
Crude petroleum and natural gas! -- - do_ .Public utilities:!
Electric light and power — doStreet railways and busses doTelegraph doTelephone _ _ > do_
Services:!Dyeing and cleaning _ do _Power laundries _ _ doYear-round hotels _ do
Trade:Retail, total! do
Food* » __ doGeneral merchandising! do
Wholesale! doWater transportation* __ _ _ _ _ _ _ do
Miscellaneous employment data:Federal and State highways, totalj number. .
Construction (Federal and State) doMaintenance (State) do
Federal civilian employees.-^United States thousands
District of Columbia do. _Railway employees (class I steam railways):
Total thousandsIndexes: Unadjusted! _ 1935-39=100..
Adjusted! _ do
LABOR CONDITIONS
Average weekly hours per worker in manufacturing:Natl Indus Conf Bd. (25 industries) hoursU S. Dept. of Labor, all manufacturing! . do
Durable goods* doIron and steel and their products* do
Blast furnaces, steel works, and rollingmills*. _ _ hours..
Electrical machinery* « doMachinery, except electrical* _ _ do. _
Machinery and machine-shop products*, doMachine tools* _ do
Automobiles* _ do. „Transportation equipment, except automo-
biles* _ . _ _ _ hours.Aircraft and parts (excluding engines)*.-.doShipbuilding and boatbuilding* do
Nonferrcus metals and products* do. _Lumber and timber basic products* doFurniture and finished lumber products*...doStone, clay, and glass products* do
Nondurable goods* doTextile-mill products and other fiber manu-
factures* hoursApparel and other finished textile products*
hours..
Food and kindred products* doTobacco manufactures* _ doPaper and allied products* doPrinting and publishing and allied industries*
hoursChemicals and allied products* _ doProducts of petroleum and coal* _ doRubber products* do
Average weekly hours per worker in nonmanufacturingindustries (U. S. Department of Labor):*
Building construction hoursMining:
Anthracite doBituminous coal » doMetalliferous doQuarrying and nonmetallic do
Crude petroleum and natural gas doPublic utilities:
Electric licht and power ._ do .Street railways and busses _ doTelegraph doTelephone do
Services:Dyeing and cleaning doPower laundries do
Trade:Retail doWholesale do
91.177.9
82.3119.1120 2127.0
112. 8105 5110.6
97.3
Q5 7280 3
2,919256
138 4141.9
84.299.8
LOO. 582.981,2
83.6119.8125.2128.2
114.2110.5109.3
96.0106.6106. 595.7
205.7
122, 54316, 52182, 773
2,828264
1,414135.9139.3
45.745.346.747.1
46.246.849.148.650.446.3
46.947.446,247.042.944.243.343.2
41.8
38.741.245 541.345.6
40.745.746.545.7
37.6
46.545.244.344.045.2
42.850.345.042.1
43.543.7
41.042.6
83.598.798.382.881.6
83.5119.6123.9128.1
117.3110.3109.2
96.9107.8108.695.4
211.7
122,34015,61083,056
2,838264
1,428137.2140.6
45.845.346.746.9
46.046.749.148.751.046.3
47.047.046.646.943.244.543.643.2
41.9
38.941.445 340.945.8
40.845.846.645.6
38.5
41.744.644.545.445.5
43.049.845.041.6
44.043.7
40.242.8
82.697.196.284.182.0
83.1119.2122.3128.1
120.7109. 5109.2
97.7106.9110.995.1
226.1
127,88920, 35384, COS
2,853264
1,440138.4140.6
45.245.046.546.5
45.946.248.848.150.746.4
47.146.747.346.643.243.743.242.5
41.2
37.341.144 839.045.5
40.645.646.344 7
38.7
38.243.044.045.644.9
42. 349.445.941.6
43.743.7
40.042.5
82.796.093.684.582.5
82.8119.1121.9128.2
124.8110.1109.0
96.9107.3108.594.4
233.5
l"36,05024, 80287,446
2,866264
1,453139.6140.2
45.545.346.646.8
46.146.348.748.450.845.5
47.446.848.146.643.344.443.743.2
41.6
38.141.345 842 046.0
40.946 047.045 1
40.4
41 944.044.447.445.5
43.450.646.342.0
44.743.9
39.942.8
83.096.191.185. 883.6
83.1119.1123. 1128.5
126.9112.4109.4
96.6106.3107.795.0
238.9
150,13316,103
109,546
2.9J8270
1,476141.8139.9
45.945.446.846.8
46.446.649.148.751.045.9
47.347.147.447.144.544.643.843.3
42.0
38.241.645 942.346.3
41.345 846.845 2
40.2
40 944.044 647.745.6
43.850.946.542.2
44.343.6
42.443.0
77.994 787.686 484.1
83.2118.8123.9129.7
122.3112.1109.2
95.5106.4104.595.1
249.1
156,86533. 52898,190
2,941271
1,471141.4138.4
45.444.645.746.0
45.945.747.546.850.243.7
46.847.247.146.042.443.642.443.0
41.7
37.341.245 642.445.7
41.24>R. 546.945 0
40.6
35.839.542 946.345.3
42.750.746.542.6
44.444.1
41.742.8
77.995.085.586 784.1
83.2118.9122 8129.6
118.4109.0109.4
94.1104.6102.495 5
255.3
159.94433,828
100,724
2,909265
1,477142.0139.1
45 645.246.646 7
46.346 348.348.150 445.1
47.447.147 846.544 744.844 043 0
41 8
37.741.245 042 346.2
41.145 646.945 6
40.0
40 844 044 747 946.1
43.951.046.842.6
43.943.8
41.943.1
81 593.982.484 383.0
82.6118.6122 2128.2
118.4106.8109.0
96.6106.3109.295 0
258.7
154,83631, 39298, 458
2,881259
1.454139.7136.3
45 644.846.146.6
46.346.247.947.649.943.5
46.946.247.646.343 344.043.443 0
41.8
38.141.544 543.446.2
41.445 646.445 7
40.1
39 942 043 946 845.9
43.750.246.543.0
44.343.9
40.442.9
80 592.380.483 082.7
82.1117.7122 1127.1
119.8108.0109.6
99.7108.8116.796 0
257.2
153, 91330, 22899,742
2,878258
1,438138.2133. 7
45.745.547.147.2
47.146.348.848.751.245.6
48.147.149.147.244.7
'45.044.743.3
42.2
38.241.644 843.346.7
40.945 947.945 9
40.7
42 644.145 048.944.9
43.150.245.842.9
43.843.7
40.443.2
79 991 879.282.282.1
82.1117.7121.7127.1
117.1107.6110.3
103.2109.0127.496.8
267.7
144,36822, 98197, 246
2,876257
1,435137.9136.7
45 645.346.746.8
46 646.348.248.250.545.5
47.8'47.2
48.8'46 9
43.0'44.4
44.143.2
42.3
38.041.2
r 45 2'44.2
46.5
41.345.746.945 7
39.7
38 642.6
'43.746.845.9
43.450.845.342.3
43.543.4
39.443.0
79,291.378.579.682.1
82.0117.7121 7126.7
114.5107.8110.5
111.9110.2152.297 1
274 5
126, 31216, 95985,559
2,860255
1 431137 2139.4
45.845.647.1
'47.4
47.046.748.948.7
'51.845.7
'48.4'47.6
49.347.542.344.544.243.5
42.8
37.7'41.646.045.046.6
'41.445.746.946.6
39.4
41.543.1
'44.844.945.4
'43.351.845.442.7
43.443.5
39.843.3
79.0'91.3'78.2
75.682.1
'82.0' 117. 7
120.2126.1
' 112. 0' 106. 3' 110.2
'98.3107.2114.2r 95 7
'272 6
125,12211, 99489 512
2 889256
1 421136 3141.7
46.145.446.846.9
46.246.648.548.551.645.2
47.947.748.647.242.544.443.443.4
42.3
38.241.945.643.446.3
41.445.646.347.3
38.8
38.945.444.244.645.5
43.451.545.042.4
43.743.9
39.542.8
' Revised. {Total includes State engineering, supervisory, and administrative employees not shown separately.ISee note marked " ? " on p. S-ll of the July 1944 Survey regarding changes in the data beginning June 1943. The United States total beginning November 1943 reflects a further
change in reporting resulting in an upward adjustment of 24,558 in that month. Data cover only paid employees. The December 1943 total includes about 220,000 excess temporaryPost Office substitutes employed only at Christmas; such employees are not included in the December 1944 figures.
•New series. Indexes beginning 1939 for retail food establishments and beginning 1940 for water transportation are shown on p. 31 of the June 1943 Survey. Data beginningMarch 1942 for all series on average hours, except for the telephone and telegraph industries, are available in the May 1943 Survey and data back to 1939 will be published later; databack to 1937 for the telephone industry, shown separately beginning in the December 1944 Survey, will also be published later; data for the telegraph industry are available only fromJune 1943 (for data beginning that month see note on p. S-ll of the January 1945 issue).
!Revised series. For data beginning 1939 for the Department of Labor's revised indexes of employment in nonmanufacturing industries (except for the telephone and telegraphindustries), see p. 31 of the June 1943 Survey. Separate data for the telephone and the telegraph industries have been computed beginning 1937; complete data will be published later.For revision in the Department of Labor's series on average weekly hours in all manufacturing industries, see note marked " ! " on p. S-13 of the July 1944 Survey. The indexes ofrailway employees have been shifted to a 1935-39 base and the method of seasonal adjustment revised; earlier data not shown in the May 1943 Survey will be published later.
Digitized for FRASER http://fraser.stlouisfed.org/ Federal Reserve Bank of St. Louis

S-12 SURVEY OF CURRENT BUSINESS April 1945
Unless otherwise s ta ted, statistics through T941and descriptive notes may he found in the1942 Supplement to the Survey
1945
Febru-ary
1944
Febru-ary March April M a y June July August Sep-
temberOcto-ber
Novem-ber
Decem-ber
1945
Janu-ary
EMPLOYMENT CONDITIONS AND WAGES—Continued
LABOR CONDITIONS—Continued
Industrial disputes (strikes and lockouts):Strikes beginning in month:§
Strikes number . .Workers involved thousands. .
Man-days idle during month doU. S. Employment Service placement activities:
Nonagricultural placementst thousands. .Unemployment compensation (Social Security Board):
Continued claims© thousands. .Benefit payments:
Beneficiaries, weekly average doAmount of payments . . . t hous . of dol...
Labor turn-over in manufacturing establishments:^Accession rate monthly rate per 100 employees..Separation rate, total do
Discharges doLay-offs.. . ._ doQuits doMilitary doMiscellaneous _ do
PAY R O L L S
Wage-earner pay rolls all manufacturing, unadjusted(V. S. Depar tment of Labor)t 1939=100..
Durable goods doIron and steel and their products do
Blast furnaces, steel works, and rolling mills1939=100..
Electrical machinery doMachinery, except electrical do
Machinery and machine-shop products doMachine toolst do
Automobiles doTransportation equipment, except automobiles
1939 = 100..Aircraft and parts (excluding engines)*? doShipbuilding and boatbuildingA do
Nonfcrrous metals and products _. doLumber and timber basic products. do
Sawmills.. doFurniture and finished lumber products do
Furniture doStone, clay, and gla^s products do
Nondurable goods. doTextile-mill products and other fiber manufactures
1939 = 100..Cotton manufactures, exc. small wares doSilk and rayon goods doWoolen and worsted manufactures (except dyeing
and finishing) 1939 = 100..Apparel and other finished textile products.-do
Men's clothing . .doWomen's clothing _ .do
Leather and leather products doBoots and shoes do
Food and kindred products doBaking doCanning and preserving doSlaughtering and meat packing do
Tobacco manufactures doPaper and allied products do
Paper and pulp doPrinting, publishing, and allied industries do
Newspapers and periodicals* doPrinting, book and job*. do
Chemicals and allied products. . . doChemicals do
Products o<" petroleum and coal doPetroleum refining do
Rubber products .do"Rubber tires and inner tubes do
Nonmanufacturing, unadjusted (U. S. Dept . of Labor):Mining:t
Anthracite 1939 = 100..Bituminou« coal doMetalliferous, _ doQuarrying and nonmetallic do
Crude petroleum and natural gasf doPublic utilities:!
Electric light and power doStreet railways and busses doTelegraph. doTelephone _ _ do
Services:tDyeing and cleaning doPower laundries doYear-round hotels do
Trade:Retail, totalf do
Food* doGeneral merchandising! do
Wholesale! doWater transportation* do
310109412
910
511
1006,435
r340r 146
H59
745
565104
6,156
5.466.52.64.76
4.56.49.07
344.7487.3321.2
225. 2524.2449.2447-4405.0347.8
1.213.9S, 381.1S, 629. 6
370. 9202. 9146.1191.3184.1191.0205.3
174.1202.2138.8
199.4196. 8163.2148.3] 54. 2137.8188.1161.1133. 0226. 6154.7190. 0176.3134.6113.0147.0389.0296. 1201.4192. 2295. 7295.6
190.2231.0157.0139.7126. 9
112.3166.7172.6152.5
165.3154. 4152. 7
121.4133.0128.3132.7472.6
360115415
778
r592
1127,351
5.767. 33.65.87
5.00.73.08
341.3481.6316.5
222. 2524. 7443.4441.1400. 5342.1
3.171.9
3, 599. 2362. 9204.0146.7191.5183.4191.5204.1
173.7202. 2138.2
199.6200.2167.3152.9155.8139.0185. 7163.0126. 8212.3146. 5190.5176.4135. 1114. 1146. 5372.1294.1203. 9195. 7297. 0299.3
157.8225. 0155. 5144.9125.7
112.5164 9171.5151.6
173.7155.2153.6
122.6134 5131.2133.4490.5
435155580
477
835,471
5.536.78.59.584.90.64.07
335. 0474.8310.9
221.2513. 2434.4429.2383. 6330.5
3,152. 7
3,621.1351.7205.8149.1186.0175.7189. 4198.2
169.8201.3134.7
192.5181.0158.2132. 0154.9138.3185.1159. 9141.2206.3142. 7187.6175.1133.5113.8144.435S.8295. 0206.4199.6281.3280.0
142.3214.2152.5150.0129.5
112.9164.9173.4152.1
179.9155.7154.5
124 3134.4134. 6134.0524.6
mo290
1,400833
514
876,771
<} 397.08.63.m
5.27.60.08
334.3470.9310.9
221.1512.2428.8426.1381.3324.4
3,127. 3
3, 645. 0347.9208.4152.1187.7175.73S9.8200.7
171.0202.4136.1
192.9182.8166.4128.1156.1139.8191.6163.8143.2216.9152. 8188.8177.2134.9116.1144.8358. 7296. 5212.4205. 2283.3283.0
155.8215.5148. 5157. 4127.9
112.9168.5176.1153. 5
194.2161.3155.3
124.2135.2132.4133.4552.6
500155
973
423
785,225
7.1.7.55.4
.5
334. 6469.0313.3
224.5518.9434.1429.1383.8325.3
3, 028.8
3, 497. 7349.0215. 8159. 3190. 8177.9191.9203.2
172.3204.7135. 8
194.8186.4166.5134.8158.6142.8197.6166.8156.7217. 5157.4191.2179.8137.3117.1149.5355. 1296. 5215.5207.5281.4278.5
151.8217.9145. 7162.2131.1
114.8170.4177.9153.2
195.7163.6157.2
127.4139. 6136.6135. 4571.7
470145680
1,093
397
664,348
6.36.6.7.5
5.0
326.8453. 8308.5
224.9505.2414. 7408.6370. 6308.8
2, 930. 9
3, 386. 5336.6206.4151. 5187.1173.9186. 2202.6
168.3206. 6130.7
181. 3175.6154.6125. 6155.8139.8209.2168.0242.8219.6157.0189.4178.6137.9117.1151.9355. 2297.6222.8215.6279. 7280.9
130.6194.4135. 1160. 7136.5
114.6170.3179.3156.8
187.3165. 1157.4
128.3142.4136.7135 9585.6
485190935
1,259
407
72
6.37.8.7.56.2
330.3458.1311.5
222.7507. 2417.5415.1369. 2313.7
2,933.1
3, 379.1338.1220.6164.8194.8181.0191.2205.2
168.1203.7133.7
181.1187.4160.0139.6156.0140.2213.1167.5306.2210.7157.5190.6180 6137.8118.4149.4356. 6295. 1220.5214.0287.9294.3
145.8215.6136.6165.3132.7
115 4171.5177.9156.6
178.6159.8158.8
126.8141.7132.7136.3585.2
390185660
,172
348
63t, 246
6.17.6.6.6
6.1
.3
329.1453.3314.3
226.7512.1414.3410.3366.8305.9
2, 883. 7
3, 399. 3331.7209.8154. 3189. 6175.0188.4207.5
169.0204. 4132.8
185.1195.6166.3148.4158.5143.1212.8168.7336.4200.3163. 0189.8180.0138.9119.6151.5360. 8292.8220.8213.3291.4300.8
150.1207.8130.8158.2135.4
115.6108. 9177.9159.4
185. 5159. 5159.0
128.0139.2138.9136.4602.6
440220690
1,127
370
644,350
6.06.4.6.55.0
330.3455.6313.2
225.3503.7417.4415.5372.6307.8
2, 916.1
3,468. 7332.2212.8156.5193.1178.5192.1207.8
170.4203.5138.5
188.0196.9169.6147.4158.0142.7207.4171 4262.3200.2165 7192.9182.6139.5119.3153.7364.5288.6224.4219.7290.2297.5
159.8210.2130.7163. 7129.6
114.3168. 3174.915S.0
188.0161.3161.9
132.0141.6147.1140.4599.0
375200710
1,034
6.16.0.6.5
4.6
. 3
' 327. 3' 450.3
221.9498.7409.0408.4363.2
'307.6
2, 905. 9
3,497.8326.9199.3143.8190.7177.2189.5207.0
172.22068139.4
189.4192.3169.2141 1157.4141.9203.8174. 5188.7211.4172.7194.0182.0142.2120.8156.8366. 2289.2219.2214.2289.9298.2
137.7197.7125.0153.8130.9
114.2170.1172.1156.9
181.9160. 7164.6
134.2141.9155.9140.0651.9
28085
380
833
453
755,194
4.9'6 .7
.6
.5' 4 . 3
.3
' 3 3 1 . 8«• 455. 8
316.7
225.5504. 3422.0419.4
' 381 .0' 3 1 2 . 6
2, 893. 7
3,435. 6336.2193.7138. 3194. 0179.8192.2210.5
176.6212.3142.3
194.9191.8164.5143. 5160. 8145.7205.0176.5162. 9227.6177.8197.6186.0144.1121.5159.6377.8291.1220.4214.9303. 6316.1
148.8199.8127.7144.3131.7
' 114.6173.5174.0158.6
176.6162.3169.5
146.8145.0190.7142.3672.9
r Revised . © S m a l l revisions have been made in the da ta for 1940-43; these are available on request .§Pre l iminary revisions for J a n u a r y 1944: Workers involved, 113,000; man-days idle, 710,000.d* Rates beginning J a n u a r y 1943 refer to all employees ra ther than to wage earners only and are therefore no t str ict ly comparable wi th earlieit See note marked " J " on p . S-10. A D a t a revised beginning J a n u a r y 1941; for revisions for 1941-43 see p . 19 of the December 1944 Survey.*New series. D a t a beginning 1939 for the indexes of pay rolls for the newspapers and periodicals and pr in t ing , book and job . industr ies wil
1 Data computed to tenths only beginning June.
•lier data. 1 Index is being revised.
.ginning 1939 for the indexes of pay rolls for the newspapers and periodicals ana printing, boon and job. industries will be shown in a later issue. Indexes ofpay rolls beginning 1939 for retail food establishments and beginning 1940 for water transportation are shown on p. 31 of the June 1943 Survey.
t Revised series. The series on placements by the U. S. Employment Service has been revised beginning in the August 1943 Survey to exclude agricultural placements which arenow made only in cooperation with the Department of Agriculture extension service; comparable earlier data are available on request. For information regarding the revised indexesof wage-earner pay rolls (or weekly wages) in manufacturing industries, see note maiked"t" on p.S-10. For revised data beginning iy39for the indeiesof payrolls in nonmanufactur-ing industries, see p. 31 of the June 1943 Survey (data lor the telephone and telegraph industries have subsequently been revised; revised data beginning 1937 will be shown later).Digitized for FRASER
http://fraser.stlouisfed.org/ Federal Reserve Bank of St. Louis

April 1945 SURVEY OF CURRENT BUSINESS S-13
Unless otherwise stated, statistics through 1941and descriptive notes may be found in the1942 Supplement to the Survey
1945
Febru-ary
1944
Febru-ary March April M a y June July August Sep-
temberOcto-ber
Novem-ber
Decem-ber
1945
Janu-ary
EMPLOYMENT CONDITIONS AND WAGES—Continued
WAGES
Factory average weekly earnings:Natl. Ind. Con. Bd. (25 industries) dollars.U. S. Dept. of Labor, all manufacturing! do \
Durable goods! do IIron and steel and their products! do |
Blast furnaces, steelworks, and rollingmills!.. dollars..
Electrical machinery! doMachinery, except electrical!.. _ ..do
Machinery and machine-shop products!--doMachine tools do
Automobiles! doTransportation equipment, except automo-
biles! __ dollars..Aircraft and parts (excluding engines).__doShipbuilding and boatbuilding do
Nonferrous metals and products! doLumber and timber basic products! do
Sawmills doFurniture and finished lumber products!_do
Furnituret do . . . .Stone, clay, and glass products! do
Nondurable goods! do ITextile-mill products and other fiber
manufactures! dollars..Cotton manufacturers, except small wares!
dollars..Silk and rayon goods! doWoolen and worsted manufactures
(except dyeing and finishing)! dollars..A pparel and other finished textile products!
dollars..Men's clothing! doWomen's clothing! do
Leather and leather products!.. _.do |Boots and shoes do I
Food and kindred products! __do jBaking do L . . -Canning and preserving! __do jSlaughtering and meat packing.. .do j
Tobacco manufactures! _.doPaper and allied products!... do
Paper and pulp do_._.Printing, publishing, and allied industries!
dollars..Newspapers and periodicals* doPrinting, book and job* do
Chpinicals and allied products! doChemicals ..do
Products of petroleum and coal! doPetroleum refining do
Rubber products! doRubber tires and inner tubes do
Factory average hourly earnings:Natl. Ind. Con. Bd. (25 industries) doU. S. Dept. of Labor, all manufacturing! do . . .
Durable goods! doIron and steel and their products! do |
Blast furnaces, steel works, and rolling mills! doElectrical machinery! doMachinery, except electrical! do
Machinery and machine-shop products!.doMachine tools _ do
Automobiles! ....doTransportation equipment, except automo-
biles! dollars..Aircraft and parts (excluding engines)...doShipbuilding and boatbuilding do
Nonferrous metals and products! doLumber and timber basic products! do
Sawmills do jFurniture and finished lumber products!..do |
Furniture doStone, clay, and glass products! do
Nondurable goods! doTextile-mill products and other fiber
manufactures! dollars..Cotton manufactures, except small
wares! dollars..Silk and rayon goods! doWoolen and worsted manufactures
(except dyeing and finishing)! dollars..Apparel and other finished textile products!
dollars..Men's clothing!.., doWomen's clothing§ .do
Leather and leather products! doBoots and shoes. do
48.1545.4751.4050.30
53.1147.0654.3552.9955.8558.13
58.4353.9360.8348.8833.0331.9434.9735.8938.0036.32
24.9828.29
35.05
30.1130.9836.9332.0630.13
' 38.0836.9130.7544.7628.0037.8441.19
42.4946.7840.6042.7450.5753.8657. 2548.9557. 21
1.0481.0031.1001.0691.1501.0051.1071. 0891.1071.257
1.2471.1381.3171.040.770.756.792.812.879.842
.686
.831
48.4145.6451.5450.18
52.7447.1854.5453.2856.9758.37
58.7353.7061.4648.9633.3032.2635.4736.2938.4636.56
28.88
25.2628.53
35.32
30.7231.7737.8332.3630.4338.0437.4230.5643.5627. 7538.2041. 50
42.8247.0641.1842.9951.0754.2457.6249.5358.38
1.0531.0061.1031.0701.1481.0101.1101.0921.1161.261
1.2511.1431. 3191.044.771.757.797.816.882.846
.690
.605
.672
.833
.789
.802
.969
.782
.747
48.0945.5551.6750.07
53.1246.8454.4052.5356.54
"• 58. 56
59.4153.5562.8948.6534.0533.1435. 2335.9338.4536.16
28.85
25.7528.27
34.79
28.7030.4634.1632. 4830.3937.8737.0030.7643.7027.0038.0941.59
42.9347.0741.3543.0151.2054.3657.8348.1255. 63
1.0571.0131.1101.0771.1581.0141.1151.0951.1141. 262
1.2611.1481.3301.045
.788
. 7 7 5
. 8 0 5.827.891. 8 5 0
.701
.623.686
.837
.770
.800
.927
.790
. 7J">4
48.4646.0251.8950.41
53.4347.2854.3753.1857.08
' 57.68
59.8754.1064.0248.8334.5433.5936.0436.7238.9837.03
29.51
26. 3329.13
35.50
29.4532.2834.3933.0230. 9539.0838.0631.2746.4129.3438.7742.49
43.8448.2942.0943.9151.4265.1458.2748.9857.11
1.0621.0171.1121.0771.1601.0211.1161.0991.1221.266
1.2641.1581.3321.047.798.788.812.834.893.858
.710
.634
.697
.842
.772
.817
.918
.800
.766
49.3046.2452.1450.65
54.3247.8855.0653.7057.7758.48
59.6654.6162.8049.3335.5634.7236. 2636.7139.1937.30
29.87
26.7629.07
36.04
29.9532.2935.8933.3531. 4339.0938.2130.8445.7329.8239.1742.83
44.3748.4542.9743.8651.6555.3057.9849. 3056.78
1.0691.0171.113L.0811.170L.0261.1221.1031.1311.275
1.2621.1591.3241.049
.799
.792
.813
.833
.894
.861
.712
.637
.691
.845
.784
.821
.946
.802
.767
48.8645.4351.0750.01
54.5847.2253.3351.8556.8056.43
59.2954.4362.6948.3433.7432.7335.3935.9438.1237.05
29.64
27.1228.33
35.35
29.2830.8635.4633.0130.9938.5238.4229.7545.8730.0438.7242.42
44.1248.6542.7044.0052.1556. 2759.0849.1757.01
1.0721.0181.1161.0861.1891.0321.1231.1051.1311.291
1. 2671.1551.3311.051
.796
.788
.812
.832
.899
.862
.710
.639
.693
.840
.785
.811
.963
.801
.765
48.9845.8851.8450.25
53.8047.7654.1552.9457.3356.90
60.3654. 7363.9648.6935. 7835. 2136. 5837.1539.3337.15
29.74
26.9028.92
34.95
30.4431.6537. 7733.1631.1837.9538.3130.2744.6930.2739.1042.67
44.4348.8842.6743.7951.9055.2758.0050. 2458.62
1.0701.0161.1121. 0751.1631.0321.1211.1001.1381.261
1.2721.1611.3391.047.801.793.816.835.895.864
.711
.637
.689
.841
.807.823.999.806.771
49.4246.2452.1851.27
55.4348.5554.4753.1057.1855.98
60.8054.3165.2348.9934. 8233.9136.5136.8339.5237.66
30.10
27.2628.89
35.51
31.7432.9339.8234.0232.1537.6738.9329.9843.9831.4339.6543.07
45.6049.9244.2644.0852.2255.7058.2450.9959.33
1.0801.0321.1321.1011.1981.0511.1361.1161.1441. 287
1. 2971.1771.3701.058.803.795.829.847.910.876
.721
.646
.700
;849
.832
.8461.035.820.788
49.3946.9453.1851.48
55.4648.4255.4854.3758.9557.85
62.5355. 3967.6949.9936.1135. 2937.4837.8140.8237.97
30.49
27.3730.20
35.96
31.8333.5439.1234.0632.2938.3938. 5831.6744.6831. 5340. 2644.24
45.0649.2143.9343.9451.9956.9960.3750.9258.54
1.0791.0311.1291.0911.1761.0461.1371.1161.1501.270
1.3011.1771.3791.059.807.798.833.849.912.878
.723
.647
.706
.849
.832
.8571.027.819
49.42' 46.85r 53.04r 50. 98
54.5548.5454.7253.8458.05
' 58.23
'63.04' 55.64' 68.68' 49.6634.0032.66
r 36. 9737.5140.1037.87
r 30. 54
27.4930.04
36.00
31.3433.9537.67
' 33.70'31.87r 38.8638.8630.4946.81
r 32.4940.1143.73
r 45. 5649. 63
' 44.52' 43.7052.4855. 6158.6650.5958.30
1.0791.035
' 1.136' 1.0891.1701.0491.1341.1161.1501.280
'1.318' 1. 178r 1.4071.058.791.776.833.853.910
.722
.646
.707
.849
.824
.8641.001r .819.787
49.8247.45
r 53. 68r 51. 85
55.33r 49.43' 56. 0554.76
r 60. 81' 58. 41
' 63. 29' 56. 45' 68.17' 50. 8333. 6232.26
' 37. 4838.00
* 40. 35' 38. 41
30.98
27.9130.41
36. 63
31.35r 33. 2538.45
r 34. 2732. 55
' 39. 7939.2431.1048.16
' 33. 2040.4043. 96
r 45. 8449. 85
' 44. 75r 44. 0652. 6455. 9558. 5052. 6361. 71
1.0851. 040
' 1. 1391.0951. 179
r 1.0591. 1461.124
r 1. 1 731. 279
r 1. 309' 1. 187r 1.384r 1.069
.794
.779
.842
.862
.914
.883
.725
.648
.708
.852
.831r. 8611.017.824.794
50.8047.5253. 5551. 65
55.0449.7655.8854.9260.2159.38
62.7357.3566.2550.8033.6532.3437.5738.3439.8038.65
30.80
27.8129.81
36.81
32. 4334.0840. 3534. 7533.1239. 5038. 5131.7346.9931.9640. 2543.55
46.0349. 4245. 1444. 3353. 3155. 597.704.51
04. 29
.099047146101191068151132172314
308.203
1. 3711.077
.791
.773
.846
.868
.917
.890
728
. 653
.710
.857
.849
. 8651.054.829. 799
' Revised.+ Sample changed in November 1942; data are not strictly comparable with figures prior to that month§ Sample changed in July 1942; data are not strictly comparable with figures prior to that month. .* New series. Data beginning 1932 for the newspapers and periodicals and printing, book and job, industries will be published later; see November 1943 Survey for data beginning
August 1942.! Revised series. The indicated series on average weekly and hourly earnings have been shown on a revised basis beginning in the March 1943 Survey and data are not compa-
rable with figures shown in earlier issues (see note marked " f on p. S-13 of the July 1944 Survey); there were no revisions in the data for industries which do not carry a referenceto this note. Data prior to 1942 for all revised series will be published later.
Digitized for FRASER http://fraser.stlouisfed.org/ Federal Reserve Bank of St. Louis

S-14 SURVEY OF CURRENT BUSINESS April 1945
Unless otherwise stated, statistics through 1941and descriptive notes may be found in the1942 Supplement to the Survey
1945
Febru-ary
1944
Febru-ary March April May June July August Sep-
temberOcto-ber
Novem-ber
Decem-ber
1945
Janu-ary
EMPLOYMENT CONDITIONS AND WAGES—Continued
WAGES—Continued
Factory average hourly earnings—Continued.U. S." Dept. of Labor, all mfg.t—Continued.
Nondurable goods—Continued.Food and kindred products! dollars
Baking. .. ._ doCanning and preserving! doSlaughtering and meat packing do
Tobacco manufactures! doPaper and allied products! do !
Paper and pulp doPrinting, publishing, and allied industries! do ',_.._
Newspapers and periodicals*. doPrinting, book and job* do. _
Chemicals and allied products! doChemicals. . do
Products of petroleum and coal! doPetroleum refining . _ . do
Rubber products! doRubbpr tires and inner tubes do
Nonmanufacturing industries, average hourly earnings(IT. S. Department of Labor):*
Building construction dollars..Mining:
.Anthracite doBituminous coal doMetalliferous doQuarrying and nonmetallic do
Crude petroleum and natural gas doPublic utilities:
Electric light and power doStreet railways and busses . . . . doTelegraph doTelephone . do
Services:Dyeing and cleaning doPower laundries __. . . . . _. do
Trade:Retail . . d oWholesale _ do
Miscellaneous wage data:Construction wage rates (E. N. R.):,
Common labor dol. per hr.Skilled labor _ _ do
Farm wages without board (quarterly)0dol. per month..
Railway wages (average, class I)© dol. per hr__Road-building wages, common labor:
United States average „ _do_ .
PUBLIC ASSISTANCE
Total public assistance mil. of dol..Old-age assistance, and aid to dependent children and
the blind, total mil. of dol
General relief do
0. 8911.64
.74
v 72v 59
0.838.822.766.909.678.829.869
1.0441.216.970. 935
1.0871.1591.2331. 0721. 240
1.297
1. 2451.179.992.828
1.143
1. 091.916.793.898
.705
.597
.676
.967
.8691.62
. 966
.65
79
71578
0.839.829. 759.903.679.834.871
1.0491. 226.973.938
1. 0941.1631. 2351.0861. 256
1.296
1.1621.174.999.833
1.121
1.092. 922.796.904
.70S
.601
.711
.966
,8701.62
.944
.64
79
7157
8
0.845.830.779.918.691.837.875
1.0591. 232.983.944
1.0971.1741.2471.0751. 234
1.297
1.1661.1821.012.848
1.168
1.110. 928.800. 908
.722
.606
.690
.984
.8741.63
81.15. 950
.68
78
7157
8
0. 854.839. 777.934.698.842.879
1.0721.248.994.954
1.1011.1741.2421.0871.257
1.310
1.1591.1751.005.849
1.131
1. 094.928.807.907
.725
. 620
.697
.979
.8741.63
.943
.68
78
71
7
0. 851.841.770.924.706.845.884
1.0751.2481.001
.9581.1011.1811.2481.0921. 254
1.300
1.1441.1821.009. 857
1.138
1.097. 933.804.900
. 724
.617
.701
. 986
.8771.64
.. 939
.76
78
7157
0.845.839.743.921.709.847.886
1. 0721.253.997. 966
1.1141.1991. 2651.0941.256
1.302
1.1941.1991.010.871
1.187
1.118. 935.805.903
.722
.621
.732
.989
.8821.64
89.54.947
.77
78
7158
0.844.839. 765.. 922.715.847.884
1.0801.2581.001
.9611.1061.1791.2451.1021.264
1.323
1.1791.1901.003.861
1.130
1.102.939.802.902
.719
.626
.730
.981
.8821.64
.938
.79
78
7158
0.847.850.764.921.724.858.891
1.1011. 2651.030
. 9661.1191.2021. 2681.1171.273
1. 339
1.1871.2131.016
.8711.172
1.120.942.812.921
.736
.637
.736
.994
.8831.64
.955
.80
78
71587
0.857.849.790.930.728.862.901
1.1021.2621.037
.9571.1171.1901. 2571.1081.263
1.342
1.1971.1911.015' . 8 8 11.156
1.127.945.809.928
.745
.641
.7411.008
.8861.64
86 80.952
.79
79
71587
0. 859.855.773.933
' . 735.863.899
M.1041.2681.037
.9561.1211.1861.2531.1071.258
1.349
1.1561.173
r 1.015.871
1.146
' 1.116
.809
.930
.747
.641
.736
.996
.8861.64
.959
.78
79
587
0. 866'. 8.54.786
r. 933.738.867.904
1. 1081. 268
r 1.042. 964
1. 1251. 1841. 2621.1291. 293
r 1.359
1.1S7r l.OL'O
. SS ?i. n.2
r i . : I*.)
7 V.).(.44
. 72*I.0U2
l.c.l
.74
80
' . '9
FINANCE
BANKING
Agricultural loans outstanding of agencies supervisedby the Farm Credit Administration:
Total, excl. joint-stock land banks mil. of dol._Farm mortgage loans, total do
Federal land banks doLand Bank Commissioner do
Loans to cooperatives, total doBanks for cooperatives, including central bank
mil. of dol._Agr. Marketing Act revolving fund do
Short term credit, total . . . doFederal intermediate credit bankscf doProduction credit associations doRegional agricultural credit corporations...doEmergency crop loans doDrought relief loans do
Joint-stock land banks, in liquidation doBank debits, total (141 centers)! . d o . . .
New York City doOutside New York City dol_._
Federal Reserve banks, condition, end of month:Assets, total mil. of dol_.
Reserve bank credit outstanding, total doBills discounted doUnited States securities do
Reserves, total doGold certificates do
2, 0391,4301,109
321218
2152
39;30
20910
10637
163, 79529, 06534, 730
40, 43420,158
32119,43918, 61018, 346
2,3551,7061, 315
391227
2214
42232
21524
11239
364,06127, 59236, 469
33, 44812, 092
3411,63219, 86619,536
2, 3191,6731, 290
383202
1973
44434
23322
11639
369, 05629, 64439, 412
33, 80812, 571
6312,11519,73619,423
2,2891,6511,274
378175
1713
46236
24921
11939
360, 24125, 29734, 944
34, 87013, 800
11813,22019, 54619, 265
2.2601, 6301, 258
372155
1523
47536
26021
11939
260, 75724,70836,049
35, 54214, 759
23714, 25119, 36219,097
2,2431,6141,245
369146
1433
48235
26921
11939
276,19233, 56342,629
36,13215, 272
1314,90119,28719.010
2,2141,5911,228
363143
1403
48135
26920
11838
266, 06228, 47437, 588
35,81515, 325
3714,91519,10418,823
2,1721,5671,211
357135
1323
46932
26320
11638
262, 49726,16536,332
36, 67816, 201
9515,80619,02818,759
2,1241,5441,194
351135
1323
44530
24619
11238
263, 62526,86036, 765
37, 49217,113
4916,65318,91518, 647
2,1051, 5181,175
343176
1723
41228
22118
107382
66, 89128, 55838,336
38, 70018, 325
34517,64718, 80218, 552
2,0791,4901,155
336207
2033
38228
19815
10437
270, 39730,01640, 381
39,85419,357
47318,388
s1
2, 0581, 4671,137
330217
2133
37531
19212
10237
183,16837, 67845, 490
40, 26919,745
8018.846
18,77018,528 i
18,18.444
v Preliminary. r Revised. 0 Weighted averages for 1942-43 revised as follows: 1942, $55.91; 1943, $72.51.© Wage increases which became effective December 1943 (retroactive to February or April 1943) and January 1944 are not fully reflected in the figures until March 1944. The
figures do not include accruals of back pay.fRates as of March 1: Construction—common labor, 0.895; skilled labor, $1.64. cf Excludes loans to other Farm Credit Administration agencies.* New series. Data on hourly earnings beginning August 1942 for the newspapers and periodicals and printing, book and job, industries and beginning March 1942 for the non-
manufacturing industries, except the telephone and telegraph industries, are available, respectively, in the November 1943 and May 1943 issues; figures beginning 1937 for the tele-phone industry, which are shown on a revised basis beginning in the December 1944 issue, and data back to 1939 for other series, except the telegraph industry, will be publishedlater; data for the telegraph industry are available only from June 1943 (for data beginning that month see p. S-14 of the January 1945 issue).
!Revised series. See note marked " f on p. S-13 in regard to the series on hourly earnings in manufacturing industries. Bank debits have been revised beginning Aiay 19̂ 2 toinclude additional banks in the 141 centers; see p. S-15 of the September 1943 Survey for revised figures beginning that month and note marked " ! " en p. b-15 oi the Ju.y l .=44 burveyfor monthly averages for 1942 on the new basis.
Digitized for FRASER http://fraser.stlouisfed.org/ Federal Reserve Bank of St. Louis

April 1945 SURVEY OF CURRENT BUSINESS S-15
Unless otherwise stated, statistics through 1941and descriptive notes may be found in the1942 Supplement to the Survey
1945
Febru-ary
1944
Febru-ary March April May June July August Sep-
temberOcto-ber
November
Decem-ber
1945
Janu-ary
FINANCE—Continued
BANKING—Continued
Federal Reserve banks, condition, end of month—Con.Liabilities, total mil. of doL.
Deposits, total d o _ _Member bank reserve balances do
Excess reserves (estimated) doFederal Reserve notes in circulation do
Reserve ratio percent. .Federal Reserve reporting member banks, condition
Wednesday nearest end of month:Deposits:
Demand, adjusted mil. of dol_.Demand, except interbank:
Individuals, partnerships, and corporations, doStates and political subdivisions do iUnited States Government do
Time, except interbank, total doIndividuals, partnerships, and corporations doStates and political subdivisions do
Interbank, domestic doInvestments, total do
XJ. S. Government direct obligations, total—.doBills doCertificates »_doBonds doNotes d o . . .
Obligations guaranteed by U. S. Government, doOther securities do
Loans, total doCommercial, industrial, and agricultural!--, doTo brokers and dealers in securities doOther loans for purchasing or carrying securities
mil. of dcL.Beal estate loans doLoans to banks doOther loans do
Money and interest rates:^Bank rates to customers:
New York City percent._7 other northern and eastern cities. do11 southern and western cities do_ .
Discount rate (N. Y. F . R. Bank) • doFederal land bank loansd* doFederal intermediate credit bank loans doOpen market rates, New York City:
Prevailing rate:Acceptances, prime, bankers', 90 days doCommercial paper, prime, 4-6 months doTime loans, 90 days (N. Y. S. E.) do
Average rate:Call loans, renewal (N. Y. S. E.) doIL S. Treasury bills, 3-mo do
Average yield, U. S. Treasury notes, 3-5 yrs.:Taxable* do
Savings deposits, New York State savings banks:Amount due depositors mil. of dol . .
U. S. Postal Savings:Balance to credit of depositors doBalance on deposit in banks do
40,43416,27014,228
£4922,162
48.4
37,018
37, 3471,539
10,5238, 0527,833
1258,915
46, 86743, 5552,1409, 994
22,2159,2C6
3572,955
11,6346, 2511,737
1,2451,044
711,286
1.004.001.50
.44
.751.25
1.22
7,215
CONSUMER SHORT-TERM CREDIT
Total consumer short-term debt, end of month*. .do v 5,314Instalment debt, total* do_ _ p 1,957
Sale debt, total* do . . . . *> 740Automobile dealers* . do p 186Department stores and mail-order houses*
mil. of doLFurniture stores* d o . . .Household appliance stores* do___Jewelry stores* do_._All other* d o . . .
Cash loan debt, total* d o . . .Commercial banks, debt* d o . . .Credit unions:
Debt* do.._Loans made . . d o . . .
Industrial banking companies:Debt d o . . .Loans made do__.
Personal finance companies:Debt do * 372Loans made do v 56
Insured repair and modernization debt*. . .do p 120Miscellaneous debt* do v 86
Charge account sale debt* do * 1,432Single-payment loans, debt* do \ * 1,189Service debt* do. __j p 736
Index of total consumer short-term debt, end of month:* \Adjusted 1935-39= 100.J 84
v 161v 240v 11p 55^87
P 1.217p 356
r 114v 16
v 169v 29
33,44814, 38312,3111,162
17,31662.7
32, 327
32, 6091,706
12,0306,4036, 213
1318,483
41, 75537,1593,8489,04318,5415, 7271, 7392,857
11, 5356,3941,667
1, 0611,089102
1, 222
33, 80814, 47811,889
51217, 55961.6
32, 660
32, 6491,782
10, 2356,4876,306
1238,036
40, 99437, 4343,2478,91018,0267,251653
2,90711,0186, 3051,482
8801, 081
551,215
1.004.001.50
.44
.691.25
1.00
.375
1.32
6,2581, 867
9
4,8741,846707167
147236215185
1,139303
11718
16129
3566011884
1,2181,113697
2.102.753.121.004.001. 50
.44
.691.25
1.00.375
1.36
6,322
1,906
5,0571, 864696167
144231195283
1,168316
12126
16438
11286
1.3761.115' 702
80
34,87015, 09012,684
77317,96959.1
34, 649
34, 3572,0057,1966,6226,445
1297,95440,41836, 9722,7738,96818,1057,126641
2,80510, 2566,0351,253
6291,074
621,203
35, 54215,29913,046
71118, 53257.2
36, 208
36,1842, 0544, 9346, 7536, 575
1308,14639, 90736,4132, 2998, 88618,1347, 094616
2,87810,0815, 8461,192
36,13215,38612, 8661. 30618,89956.3
33,008
33,1701,76512,5896,8106,643
1198,796
42, 87239,2882,94210, 34118,7437, 2C2C/29
2,95512,1646,0272, 032
589 1,6161, 073 1,073
55 531,326 | 1,363
!.23
1.004.001.50
.44
.691.25
1.00. 375
1.36
6,383
1,9479
5,0371,847690171
142229184882
1,157319
118
16
16430
3636110885
1,3461. 139' 705
1.004.001.50
.44
L25
1.00.375
1.35
6,464
1,994
5,1481,859700181
141235164582
1, If9325
11820
16535
3627210485
1,3901,189710
81
2.553.181.004. CO1.50
.751.25
1.00
.375
1.34
6,5702,034
9
5,2091,882707192
138237154481
1, 175335
11922
169
3657510285 |
1,370 !
1,241 i716 |
I82
35, 81515, 02212,8551,18819,12755.9
33, 597
33, 6501,77713,6026,9626,798
1198, 691
45, 43041, 8753,881
11, 05719, 4357, 502613
2,94211,4876,0151,446
1,5471,071
871,321
1.004.001.50
.44
.751.25
1.00
.375
1.31
6,6232,084
8
5,1481,889706204
132234144379
1,183339
11919
17033
3677310385
1,2871, 250' 722 1
82 i
36,67815, 20613, 072
84619, 73554.5
35,097
35,1111,75611,1007,1206,952
1228,515
44, 63541, 0753,077
11, 05719, 5377,404600
2, 96011,0655,9841,393
1,2551,071
541,308
1.004.001.50
.44
.751.25
1.00
.375
1.30
6,709
2,140
5,1921, 896709210
132233134279
1,187343
11820
172
35
3637010685
1,330r 1, 239'727
83
37, 49215, 50813, 5481, 035
20, 21552.9
35,435
35,4991,7629,2217,2997,131122
8,69143,69340,1402,47310,75719, 5697,341584
2,96910, 9806, 0761,523
9571,062
321,330
3.141. 004.001.50
.44
.751.25
1.00
.375
1.31
6,810
2,198
5,2721,912720210
138236134380
1,192342
11819
17233
3646711185
1,402r 1, 231
r 727
83 !
38,70016,01714,148
99020,79251.1
37, 587
37,8081,9545,8047,6027, 436
1209,105
42, 54339, 0571,774
10, 24719, 7627,274
5992,88711,3716, 2471,806
8511,060
811,326
1. GO4. 001.50
.44
. 751.25
1.00
.275
1.35
6,8972,257
8
5, 4121,937743210
148244134484
1,194344
11718
17234
3616811585
1,516r 1, 231'728
84
39,85416, 42714, 7281,17921,39149.6
38,539
38,8232,0395,7577, 6117,450116
9.68843,42839,9201.76810; 38420, 3507,418594
2,91411, 6656,2742,118
8361,061
641,312
1.004.001.50
.44
.751.25
1.00. 375
1.34
6,978
2, 305
5, 5951,973773208
162253134889
A, 200345
11618
40, 26916,41114,3731,77321,73149.0
34,667
35,2191,73513,8707, 7417,584112
9,97547, 25743, 7082,864
10,09021,4539, 301
6152,934
12, 6306,4151,969
1,7701,054
1071,315
1.932.61
P 2. 621.004.001.50
.44
.75
.75
1.00.375
1. 35
7,116
r 2, 3428
r 5, 790r 2,083
r836200
184269
13r 7 0
r 101r 1,247
357
11923
17234
36577
11785
1,6641, 231
727
17537
388106
'12088
1,7581,220' 729
39, 92916,16513,884
98221, 748
49.2
36,076
36, 2511,859
12, 3147,8607, 697
1178,856
47,13943, 657
2, 5539, 971
21, 9379,196
6002,882
12,1076, 3501,869
1,4621,049
721,305
87
1.004.001.50
.44
.751.25
1.00
.375
1.31
7,2042,401
8
v 5, 475v 2,008
778
v 172v 249
p 12P 6 1v 92
p 1,230358
v 11616
r 172' 3 3
378
p 119P 8 7
p 1,528p 1,206
733
85
JSce note marked "*" .'Revised . " Preliminary. §Includes open market paper. fFor bond yields see p . S-19. . . . .. . . .• A rate of 0.50 became effective October 30, 1942, on advances to member banks secured by Government obligations maturing or callable in 1 year or less,d* The temporary rate of 3H percent established by legislation for instalments maturing after July 1,1935, expired July 1,1944; effective that date the banks voluntarily reduced
their rates to 4 percent on all loans in the United States, some of which bore a contract rate as high as 6 percent. .
' ar figures and^ , . — ~ _ , - _ r- debt (series now
sale debt and automotive dealers, 1941; charge account sale debt, De-represents insured F H A loans), 1934-September 1943; credit union data, 1941-Septemb
Digitized for FRASER http://fraser.stlouisfed.org/ Federal Reserve Bank of St. Louis
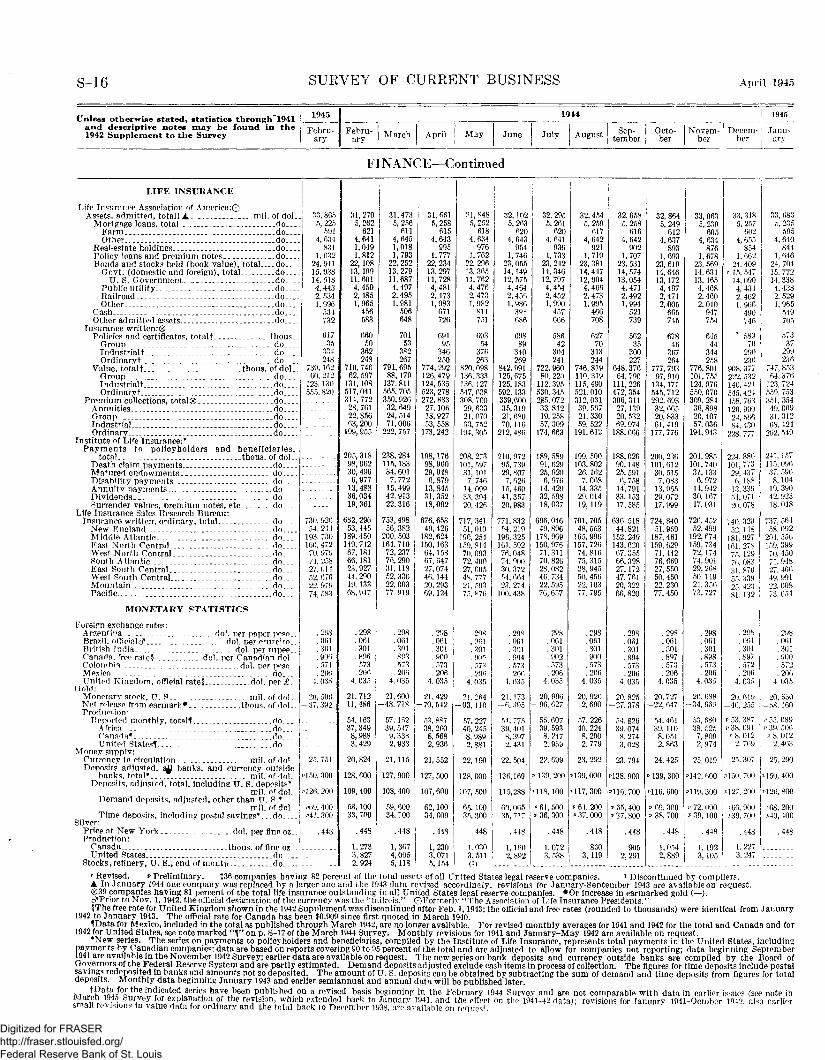
S-16 SURVEY OF CURRENT BUSINESS April 1945
Unless otherwise stated, statistics through" 1941and descriptive notes may be found in the1942 Supplement to the Survey
1945
Febru-ary
1944
Febru-ary March April May June July August Sep-
temberOcto-ber
Novem-ber
Decem-ber
1945
Janu-ary
FINANCE—Continued
LIFE INSURANCE
Life Insurance Association of America:©Assets, admitted, totalt A - mil. of dol_
Mortgage loans, total do . . .Farm do . . .Other do . . .
Real-estate holdings do . . .Policy loans and premium notes do . . .Bonds and stocks held (book value), total do . . .
Govt. (domestic and foreign), total do . . .U. S. Government. do. .
Public utility do . . .Railroad do. _Other do . . .
Cash do . . .Other admitted assets do . . .
Insurance written:®Policies and certificates, totalf thous.
Group do . . .Industrial t do . . .Ordinaryt do
Value, totalt thous. of doLGroup doIndustrial! doOrdinaryt .. do
Premium collections, total® doAnnuities doGroup doIndustrial doOrdinary do
Institute of Life Insurance:*Payments to policyholders and beneficiaries,
total. thous. of doL.Death claim payments doMatured endowments doDisability payments doAnnuit.v payments doDividends doSurrender values, premium notes, etc do
Life Insurance Sales Research Bureau:Insurance written, ordinary, total do ..
New England _ _ . . . . .. -do .Middle Atlantic do . . . .East North Central do . . . .West North Central-_. doSouth Atlantic do ..East South Central . . doWest South Central do. . .Mountain.._ _ _ _ _ _ _ _.. _ doPacific do . . .
MONETARY STATISTICS
Foreign exchange rates:Argentina dol. per paper peso..Brazil, officialc? . . . . . . dol. per cruzeiro..British India . . . . .dol. per rupee..Canada, free rate? dol. per Canadian dolColombia dol. per pesoMexico . . . . . . . _ d o . . .United Kingdom, official rate . dol. per £
Gold:Monetary stork, IT. R__ . mil. of dol.Net release from earmark* __ thous. of dol.Production-
Reported monthly, to tall doAfrica ... d o . . .Canada*.. . doUnited Statesi d o . . . .
Money supply:Currency in circulation .. mil. of do!Deposits adjusted, all banks, and currency outside
banks, total* . mil. of dol.Deposits, adjusted, total, including U. S. deposits*
mil. of dol.Demand deposits, adjusted, other than TT. S.*
mil. of dolTime deposits, including postal savines* do
Silver:Price at New York dol. per fine oz_.Productfon:
Canada thous. of fine ozUnited States . . . do
Stocks, refinery, U. S., end of month do
33, 8655, 225
5914, 634
8311, 632
24,91115,93814, 5184,4432, 5341, 996
534732
61735
334248
739,16260,212
123, 130555, 820
730, 92654, 244
193, 730160, 472
70, 97974, 25827,01452, 67622, 97074, 583
. 298
. 061
. 301
. 906
. 571
. 2064. 035
20, 506-37 ,392
25, 751
'150, 300
•'126, 200
i>69, 400HI, 300
.448
31,2705,262
6214,6411,0491,812
22,10813,19911,6014,4592,4851,965
456583
50362248
710. 74662, 597
131,108517,041314, 772
28, 76122, 85663, 200
199,955
205, 31898,96230,4966,97713,48836,03419,361
682, 29653, 445189,450149,74267,18166,18123,92744. 29019, 13368,947
.061
.301
.896
. 573
.2064.035
21,71211,486
54, 16337, 3498,988
3,429
20,824
128, 000
109, 40058,10033, 700
.448
1, 2733,8272,924
31,473 !5,256611
4,6451,0181,793
22, 25213,27911,6874,4972,4951,981506648
70153
382267
791,69588,179137,811565.705350,92632, 64924, 51471,006
222, 757
238, 284115,18334, 6017,77215,49942, 91322, 316
753,49856, 382
200,503164. 71072, 23776,29031,11852, 33622, 00377 919
.298
.061
.3018P3. 573. 206
4.035
21,600-48.718
57.15239, 5479,333
2,933
21,115
127,900
108, 40059,60034,100
.448
1, 3674,0055,118
31, fifil5, 258615
4,643995
1,77722, 23413, 29711, 7284,4812,4731,983671726
69195346250
774,292126,479124, 535523, 278272, 83327,10618,92753, 558173,242
198,17698, 96029,0486,87913,84531, 35218,092
676,65349, 426182,624150,16364,15867, 64727,07446,14420, 29369,124
. 298 298
.061 .061
. 301 . 301
.900
. 573
.2064.035 j 4.035
21,429 ! 21 264-70 ,542 1-93,110
31,8485, 252
6184, 634
9761,762
22. 29613,36511,7624,4762,4731,982
mi751
69354
376263
820, 098136,333136, 127547, 638308, 760
29, 63321.07063, 752
194,305
208, 273101,59731,101
7,74614,09933, 30420, 426
717,34151, 019190,254159,81470, 09372. 40027, 60548, 77721. 5037." 876
53,88738, 2C08, 568
2,936
21, 552
127, 500
107, 60062,10034, 600
. 448
1,2303,0715,154
57,22740, 2458.9892,881
22,160
128, 000
107,500
65, 10035, 300
.448
1.0303. 5110)
32, 1025,263620
4,643954
1,74623, 05514,14912, 5754,4642,4561, 986
39*686
69889
340269
842, 991125, 675125,183592,133339,60035, 31921,68070, 116
212,486
210,97295, 73929, 8077,«2615,46041,35720,983
771,832M , 219
196, 325161,59276, 04874, 90030, 372M, 66423, 274100,438
. 298
.061
.301904.573.206
4. 035
21,173—6.395
54,77539, 4018,3972,431
22,504.
136,169
115,288
32, 2955, 261620
4,641936
1, 73323, 24214, 34612,7974, 4542,4521,990457666
58642
304241
722, 96080, 220112,395530, 3452.85, 07233,8-1219, 25857, 309
174, 663
189, 58991,62925, 9206, 97614 42932, 59818, 037
696, 04649, 896178, 969150, 97671,31170, 82628, 08246, 73422, 59576,657
.298
.061
.301
.902
.573
.2064.035
20, 996—96, 627
55, 60739. 5938,2472, 959
22, G99
139. 200
60, 06535,717
1,1 R02, 892
I
32, 4545, 259617
4,642921
1,71923, 38114, 44712, 9044, 4662,4731, 995466708
62770
313244
746,819110,319115, 490521. 010312,03139, 56721, 33059. 522191,612
199, 500103, 80226, 1627, 06814, 33529, 01419,119
701, 70548, 553165,996157, 72674, 81675, 31528, 94550. 45622, 10377, 795
.298
.061
.301900. 573.206
4.035
20, 9262,690
57, 22640. 2248,290
2,779
23, 292
139,000
117, 30061,36,
1.3
500300
448
072538
P 64,
3
200 1000
448
830119
32,6585,258616
4.642902
1,70723.53114, 57413,0544,4712,4921,994521739
56235
300227
648, 37664, 796111,226472,354306, 31127,13920.53269, 974188, 666
188,02690,14825, 5916, 75814, 79133,15317, 585
636, 51844,821
152,249143,620
67, 35566, 39827,17247, 76120,32266,820
.298
.061
.301
.894
. 573
. 2064.035
20.825- 2 7 , 378
54.82639, 0748,2743,028
23,794
P138, 900
P116, 700
p 65, 400p 37, 800
9052,291
32, 8645, 249
6124, 637
8931, 693
23,61914, 64613,172
4, 4972,4712, 005
665745
67846
367264
777, 79397, 910
134,171545, 712292, 693
32, 66520, 83361,419
177, 776
200, 236101,612
30, 5157,083
13, 95529, 07217, 999
724,84051. 959
187,461159, 62971,41276, 66927, 55050, 45022, 23077, 450
. 298
.061
.301
.807
. 573
.2064. 035
20, 727-22 , 647
54, 46139, 110
8, 051
2, 863
24, 425
139, 300
'116, 600
p 69,300
p 38, 700
.448
1,0542,889
33, 0635, 239
6054,634
8761,678
23, 56914,63113,1654,4682.4602,010
947754
64544
344258
776. 801101, 75."124, 976550, 070309, 284
36, 89820,40757, 036
194, 943
201,985101,74031,133
6, 97214,94230, 16717, 031
726, 45252,499
192, 674159,73472,17474, 90129,20850.11921, 35673,727
. 298
.061
.301
.898
. 573
. 2064. 035
20,688- 3 4 , 669
53, 68038, 525
7,809
2,974
25, 019
=142, 600
"119,300p 72, 000* 3 9 , 100
.448
1,192 |3,105
33, 3185,257
6024, 655
8541, 662
24, 409r 15, 547
14,0904,4342, 4621, 966
490746
* 58970
290230
908, 377222, 532140, 421545, 424458, 763120, 990
24, 56684. 430
228, 777
224, 886101, 773
29, 4376,188
13, 33954, 07120, 078
740, 32952,148
181,927161, 278
75. 12976, 08331.87055, 33925. 42381, 132
.298
. 061
.301
.897
.572
. 2064. 035
20. 619-46, 255
>53, 387' 38, 091'• 8, 012
2, 769
33, 6835, 235
5954, 640
8441,646
24, 70415, 77214, 3384, 4382,5291, 965
549705
57337
299236
747, 85364, 376
123, 724559, 753351,354
49, 06931,31268, 424
202, 549
241, 157115,09637, 596
8,10419, 39042, 92318,048
737. 56458, 092
204, 556159,399
70, 45071,94827, 46649, 99122, 60873, 054
.298
.061
. 301
. 900
. 2064. 035
20, 550-58 ,160
1 55, 089' 39. 506p 8, 012
2, 463
25, 307 25, 290
'150. 700 1*450,400
'127,200 ; P 1 2 6 , 8 0 0
*66,900 ! P68, 200700 P40, 400
.448
1,2273,247
.448
r Revised. p Preliminary. 136 companies having 82 percent of the total assets of all United States legal reserve companies. i Discontinued by compilers.A In January 1944 one company was replaced by a larger one and the 1943 data revised accordingly; revisions for January-September 1943 are available on request.®39 companies having 81 percent of the total life insurance outstanding in all United States legal reserve companies. • Or increase in earmarked gold (—).cfPrior to Nov. 1, 1942, the official designation of the currency was the "milreis." ©Formerly "The Association of Life Insurance Presidents."§The free rate for United Kingdom shown in the 1942 Supplement was discontinued after Feb. 1,1943; the official and free rates (rounded to thousands) were identical from Jauuary
1942 to January 1943. The official rate for Canada has been $0,909 since first quoted in March 1940.IData for Mexico, included in the total as published through March 1942, are no longer available. For revised monthly averages for 1941 and 1942 for the total and Canada and for
1942 for United States, see note marked ' T ' on p. S-17 of the March 1944 Survey. Monthly revisions for 1941 and January-May 1942 are available on request.•New series. The series on payments to policyholders and beneficiaries, compiled by the Institute of Life Insurance, represents total payments in the United States, including
payments by Canadian companies: data are based on reports covering 90 to 95 percent of the total and are adjusted to allow for companies not reporting; data beginning September1941 are available in the November 1942 Survey; earlier data are available on request. The new series on bank deposits and currency outside banks are compiled by the Board ofGovernors of the Federal Reserve System and are partly estimated. Demand deposits adjusted exclude cash items in process of collection. The figures for time deposits include postalsavings redeposited m banks and amounts not so deposited. The amount of U. S. deposits can be obtained by subtracting the sum of demand and time deposits from figures for totaldeposits. Monthly data beginning January 1943 and earlier semiannual and annual data will be published later.A/r tpa ta for the indicated series have been published on a revised basis beginning in the February 1944 Survey and are not comparable with data in earlier issues (see note in~ 19.4? Purvey for explanation of the revision, which extended back to January 1941, and the effect on the 1941-42 data); revisions for Januarv 1941-October 194?. also carliprsmall revision? m value data for ordinary and the total back to December 1938, are available on request
Digitized for FRASER http://fraser.stlouisfed.org/ Federal Reserve Bank of St. Louis

April 1945 SURVEY OF CURRENT BUSINESS S-17
Unless otherwise stated, statistics through 1941and descriptive notes may be found in the1942 Supplement to the Survey
1945
Febru-ary
1944
Febru-ary March April May June July August Sep-
temberOcto-ber
Novem-ber
Decem-ber
1945
Janu-ary
FINANCE—Continued
PROFITS AND DIVIDENDS (QUARTERLY)*
Industrial corporations (Federal Reserve):Net profits, total (629 cos.) mil. ofdoL.
Iron and steel (47 cos.) doMachinery (69 cos.) doAutomobiles (15 cos.) doOther transportation equip. (68 cos.) doNonferrous metals and prod. (77 cos.) doOther durable goods (75 cos.) doFoods, beverages and tobacco (49 cos.) doOil producing and refining (45 cos.) doIndustrial chemicals (30 cos.) doOther nondurable goods (80 cos.) doMiscellaneous services (74 cos.)._ do
Profits and dividends (152 cos.):*Net profits doDividends:
Preferred doCommon -_-do
Electric utilities, class A and B, net income (FederalReserve)* mil. of doL
Railways, class I, net income (I. C. C.) do___Telephones, net operating income (Federal Communi-
cations Commission) mil. of dol_
FLBLIC FINANCE (FEDERAL)
U.S . war program, cumulative totals from June 1940:*Program mil. of dol. -Cash expenditures do
U. S. Savings bonds:*Amount outstanding doSales, series E, F, and G doRedemptions do
Debt, gross, end of month® doInterest bearing:
Public issues doSpecial issues§ do.__
Nonin terest bearing do.. _Obligations fully guaranteed by U. S. Gov't:
Total amount outstanding (unmatured) doExpenditures and receipts:
Treasuiy expenditures, total doWar activities! doTransfers to trust accountsf doInterest on debt doAll othert do
Treasury receipts, total doReceipts, net do
Customs doInternal revenue, total do
Income taxes ___doSocial security taxes do
Net expenditures of Government corporations andcredit agencies* mil. of dol__
Government corporations and credit agencies:^Assets, except interagency, total do
Loans and preferred stock, total doLoans to financial institutions (incl. preferred
stock) mil. of dol..Loans to railroads doHome and housing mortgage loans doFarm mortgage and other agricultural loans-doAll other do
TJ. S. obligations, direct and guaranteed doBusiness property doProperty held for sale doAll other assets do
Liabilities, other than interagency, total doBonds, notes, and debentures:
Guaranteed by the TJ. S doOther do
Other liabilities, including reserves doPrivately owned interests doTJ. S. Government interests ." do
Reconstruction Finance Corporation, loans outstanding,end of month, totalf mil. of dol..
Banks and trust cos., incl. receivers doOther financial institutions doRailroads, including receivers - d o . .Loans to business enterprises, except to aid in national
defense mil. of doL.National defense.. - do_._Other loans and authorizations do. _.
389, 524259, GOO
41,698848323
233,707
214,72417,1301,853
1,114
7,4606,948
4891
3733,9873,767
233,8152, 922
341
313
9,849307196276
258,387
657
452474052
i 5829204049423639
222
20142
135145.0
58.9
341, 308168,566
31,5152,782
185183,107
168,54113,168
1, 398
4,227
7,8627,518
556
2832,7542,503
352,4641,747
373
331
29, 7917,863
721419
1,7912,7702,1622,0991,6587, 753
10,41810, 504
4,2261,3224,956
43518,853
8,851407224385
407,072
724
341,330176,515
31,974709268
184, 715
169,84213, 5071,367
2,258
8, 5257, 726
7449343
6,5766,573
426, 3535,911
69
2,002
30, 2637,809
682416
1,7732,7612,1772,0901,6777,829
10, 8588,550
2,2741,3264,950
43321, 280
9,051390224383
387,295
722
341, 757184,008
32,497739237
184,967
169,71513,6971,554
2,258
7,8597,346
40117355
3,1193,087
392,9352,475
39
87
31.0837,743
652409
1,7542,7082,2202,1611,6717,985
11,5249,164
2,2741,3025,589
43521, 484
9,174379221375
377,449
713
341,605191,926
32,987751279
186,366
170, 75314,1221,492
1,529
8,2927,879
2652
3343,2562,950
383,0242,167
337
148
31,1537,656
632406
1,7322,6532,2331,7501,6858,042
12,0208,722
1,6721,4275,623
43521,996
9,330372222372
7,627702
464464055
22149
123168.4 I
58.2
343,514199,883
34, 6061,842
248201, 003
185,25014, 287
1,460
1,516
8, 6257, 567
40747271
6,2496,247
2S5,7345,241
75
31,6667, 621
674405
1, 7C62, 5912,2441,7011,7028,392
12,2509, 364
1,7661,4136,185
44321,858
9,428357222372
347,749
694
392, 377207, 238
36, 5382,125
227208, 574
192,15614, 961
1,456
1,468
8,1107,201
45186
3722,2122,163
281,^851,247
56
193
31,0977,504
667405
1,6812, 5322, 2191,5783.7428, 4969,7768, 663
1,5711,2295, 863444
21f9f0
9,473351218371
347,807693
392, 453215, 035
36,884602279
209,802
192,82715, 4611,514
1,475
8,1197, 571
5777415
2,8592, 568
232, 7021,552319
254
32, 6807,370
631387
1,6432,4742,2351, 5923,7479,22010, 7619,131
1,5711,2006,360444
23,114
9,607342209354
337,977692
478463756
150
236
20137
111173.3
58.3
392, 479222,140
37, 323692283
209,496
191, 87315, 9761,645
1,480
7,9306,998
22581329
5,9275,926
255,7495,174
65
—35
31,9597,405
606388
1,6363,4071,3681,603
15, 7763,0504,1269,167
1, 5651,2046,398498
21;771
9,711338208353
338,089690 I
391,096229, 586
37, 645695401
210, 244
192, 43816,1701,636
1,480
8, 0247,479
47133365
2,0542,001
291, 8801, 240
60
390,389236,682
38,3081,023382
215,005
194,19216,5832 4,230
1,470
7,8287,401
1856353
2, 5062,240
272,3001, 501293
— 71
545561
15328244367533752
281
23178
130164.8
390,506244,516
40, 3612,386365
230, 630
212, 56516,3261, 739
1,470
8,4167,503
22560332
5,4185,416
294, 9454,347
63
164
32,028
621343
1,568
9,704335208343
328,104681
9,846330207340
318,265
'674
3,3851,3111,630
16,2752,9933,9017,127
1,5371,3954,196
50423, 857
9,865322205312
318, 329
665
390,350252,036
41,1401,074
341232,408
213,98416,688
1,736
1,496
8,2027,551
69191390
3,5873,556
363,0422,422
48
- 2 1
9,867314204287
288,370
664r Revised. §Special issues to government agencies and trust funds. <g)Figures are on the basis of Daily Treasury Statements (unrevised).1 Partly estimated. 2 November data include prepayments on securities dated Dec. 1,1944, respectively, sold in the Fourth and Sixth War Loan drives.•In addition to data shown above, quarterly estimates of profits of all corporations are published in special tables in the Survey as follows: 1940-43 and the first quarter of 1944,
p. 6 of the July 1944 issue of the Survey; 1939, June 1943 issue, p. 25; the latter includes also on p. 24, annual data back to 1929 and, on p. 28, a description of the data; it should benoted that these estimates are in line with profits compiled from income tax returns and thus include reserves not allowable as deductions in computing taxes.
JFor 1941 revisions see p. S-17 of the November 1942 issue. Data for the agricultural adjustment program, shown separately through the February 1944 issue, and unemploymentrelief, shown separately through the July 1944 issue, are included in the "all other" item. Debt retirements, which have been comparatively small, are excluded.
^Beginning September 1944 data are reported quarterly and for some items (notably farm mortgage and other agricultural loans, all other loans, business property, property heldfor sale, all other assets) are not comparable with earlier data owing to changes in Treasury Department regulations governing reports from the agencies and to shifts between classi-fications.
*New series. For data beginning 1929 for profits and dividends of 152 companies, see p. 21, table 10, of the April 1942 Survey. Data for net income after taxes of class A and Belectric utilities have been substituted for data for 28 companies; they include affiliated nonelectric operations and cover 95 percent of all electric power operations. Data beginning1939 are available on request. Data beginning July 1940 for the series on the war program are shown on p. 29 of the June 1943 issue; a comparatively small amount of intercompanyduplication in the figures for R. F. C. and its subsidiaries has been eliminated beginning October 1943; see footnote marked "*" on p. S-18 of the April 1944 issue. The series on warsavings bonds is from the Treasury Department; amounts outstanding are at current redemption values except series G which is stated at par; this item and redemptions cover allsavings bonds series, including pre-war issues; sales represent funds received during the month from sales of series E, F, and G, the series issued since April 1941 (for sales beginningMay 1941, see p. S-16 of the October 1942 Survey). The series on expenditures of Government corporations and credit agencies includes net transactions on account of redemptionsof their obligations and other net expenditures by the Reconstruction Finance Corporation, the Commodity Credit Corporation, and other lending agencies; transactions of theseagencies are not included in Treasury direct budget expenditures and receipts shown above; since October 1941 funds for these agencies are provided by the Treasury.
tRevised series: see note in the December 1943 Survey regarding changes in the classifications; the figures include payments unallocated, pending advices, at end of month.Digitized for FRASER http://fraser.stlouisfed.org/ Federal Reserve Bank of St. Louis

S-18 SURVEY OF CURRENT BUSINESS April 1945
Unlessand1942
otherwise stated, statisticsdescriptive notes may beSupplement to the Survey
throughfound in
1941t h e
1945
Febru-ary
Febru-ary M , irch April M ay June July
194411 August Sep-
temberOcto-ber
Novem-ber
December
I 1945
Janu-ary
FINANCE—Continued
SECURITIES ISSUED
Securities and Exchange Commission:! jEstimated gross proceeds, total mil. of doL.j
By types of security: !Bonds, notes, and debentures, total do
Corporate doPreferred stock doCommon stock do
By types of issuers:Corporate, total do
Industrial doPublic utility doRail doOther (real estate and financial) do
Non-corporate, total® doU. S. Government doState and municipal . . .do
New corporate security issues:Estimated net proceeds, total . . do
Proposed uses of proceeds:New money, total do
Plant and equipment doWorking capital do
Retirement of debt and stock doFunded debt doOther debt _doPreferred stock do
Other purposes doProposed uses by major groups:§
Industrial, total net proceeds . . .doNew money doRetirement of debt and stock do
Public utility, total net proceeds doNew money doRetirement of debt and stock do
Railroad, total net proceeds doNew money .doRetirement of debt and stock do
Commercial and Financial Chronicle:Securities issued, by type of security, total (new
capital and refunding) thous. of dol..New capital, total do j
Domestic, total do iCorporate . doFederal agencies doMunicipal, State, etc do
Foreign doRefunding, total do
Domestic, total. doCorporate doFederal agencies doMunicipal, State, etc do
Foreign doDomestic issues for productive uses (Moody's):
Total mil. of doL_ -Corporate do j -Municipal, State, etc *___do I-
Bond Buyer: IState and municipal issues: I
Permanent (long term) thous. of doL. j -Temporary (short term) do !_
1,093
1,080202
2152761
10918
878
1612
182160
5171
279
16600
601081296
244, 58041, 93641, 93626,9258,6706,341
0202, 645162, 645136, 33217, 950
8, 36340,000
SECURITY M A R K E T S
B r o k e r s ' Ba lances (N. Y. S. E. m e m b e r s car ry ingmargin accounts)^
Customers' debit balances (net) mil. of doL.Cash on hand and in banks doMoney borrowed doCustomers' free credit balances do
1,120
BondsPrices:
Average price of all listed bonds (N. Y. S. E.) .dollars. _Domestic doForeign do
Standard and Poor's Corporation:Industrial, utilities, and rails:
High grade (15 bonds) dol. per $100 bond_.Medium and lower grade:
Composite (50 bonds). . . doIndustrials (10 bonds). doPublic utilities (20 bonds) doRailroads (20 bonds) do
Defaulted (15 bonds) do. . . . IDomestic municipals (15 bonds)t do
U. S. Treasury bonds (taxable)t do |
730540
102. 58103. 1579.22
121. 9
117.6121. 9116. 5114.368.1
138.7101.8
8,541
8, 53389
52
97563190
8.4448,381
62
95
491831373241
219,88773, 42173,42162,616
010, 805
0146,466146, 46696,14624, 52525, 795
0
937
166326
20330
142293
73470925
199
3216
150129
3181
281414
1406
13429290
210, 24258, 04558,04545, 456
012,589
0 !152,196 I119,74377.535 !30,055 I12,15332, 454
30219
34,49169, 027
2564,
291712
740852
650370
100. 21101. 0373.39
120.4
113.6119.3115.8105.758.1
135.8100.1
820
630380
100. 32101.1174.45
120.5
113.7119.8115.9105.360.1
136.0100.3
916
804439616
1551222804
76173917
150
53242894551
383
118496628028000
234, 72979,99479. 99473, 464
06,530
0154, 735149, 235107. 63631, 46010,1405, 500
63
16, 93352,845
780
1,069
1,04512515
148875821
920751160
146
23176
12311535
85196558058 I220
1418,587••54,091>54, 091! 32.616! '605j 20,871
•'364,495r355,345184,091»• 32, 270,138,9841 9,150
33276
166,13820, 292
600390
100.31101. 1074.62
120.7
114.4121.0116.6105.559.0
135.8100.3
550400
100. 62101. 4175.29
120.9
114.7121.5116.0106.558.9
135.6100.2
12,109
12,097151
39
16360244534
11,94611,914
31
160
238
15135103
1813
1
581740240
2345
441
238, 98263,48142,48115, 3734,125
22,98321,000
175,501170, 251
78, 75483,0258,4715,250
199
10
37,39145,354
887196619424
100. 53101. 2676.32
120.9
114.5121.5115.9106.261.2
135.5100.2
2,353
2,3121522020
1921125921
C)2,1612,125
36
188
603624
122109
0136
109347058
55221210
274, 42070, 42568, 92557, 328
011, 5971,500
203, 995203, 795153, 917
27, 45522, 423
200
53458
32, 695122, 700
940
660420
100. 71101. 4075.50
121.3
114.7121.1116.3106.861.3
136.1100.2
897
882214
122
2296826
1350
668602
65
226
572433
166147
(°)193
66382726
(•)24
13419
115
331,720145,073145, 073105, 573
039, 500
0186,647186, 647140, 60820,31525, 724
0
935538
56, 7335,100
940
630410
100. 74101.4176.04
121.2
114.8120.9116.2107.357.3
136.5100.4
1,148
1,085375
549
43888
153191
6710692
18
429
271710
396357
138
5
851075
1495
139189
10179
478, 27141, 87441, 87429, 208
012, 666
0436, 397436. 397400, 71730, 0105,670
0
301713
23, 44128,199
940
640420
100. 61101. 29
75. 55
121.2
114.5120.1116.5107.055.5
136.2100.4
1,538
1,489686
3910
735191505
372
803695108
722
1239
114592566
224
7
18611373
4988
484382
35
898, 654177, 599177, 599130, 618
046, 981
0721, 055714. 055610, 53542, 37061,1507,000
561640
112,14968, 661
950
670430
100. 71101.3876.11
121.1
115.5119.9116.9109.659.1
135. 5100.3
1,441
1,410315
1813
34731
26253
11,0951,023
71
340
241113
316207
(a)109
00291612
2594
25552
448
479, 67039, 27039, 27022, 81610, 0906,364
0440, 401440, 401335, 89439, 42565, 082
0
17116
97, 4317,700
940
640430
100. 92101.6076.15
120.9
115.9119.9116.8111.161.7
135.2100.3
14, 732
14,685107
245
15418108342
14, 57914, 544
34
152
544
509696011
18125
100
10820
82
193, 29638, 23138, 23118, 681
019, 550
0155,065155,065114,10426, 71514, 246
0
25
48, 28819, 366
1, 583
1, 531229
3715
2818466
12110
1, 3021, 074
113
275
351421
210
190
822854650
65119
0119
633,2171 142,943135, 90042, 741
1, 505r 98, 697
0' 490,274• 490,274272, 280195, 460
T 22, 5340
1172790
115,726119, 334
1,041209726472
101. 35101.9776.33
1,090
730530
101,91102. 5177.27
121.4
116.9120.7116.8113.265.8
135.5100.3
121.6
117.3121.2117.0113.7
^68 .6' 136. 6
101. 0
Revised.« Less than $500,000.<g>Includes for certain months small amounts for nonprofit agencies not shown separately§Smail amounts for "other corporate", not shown separately, are included in the total net proceeds, all corporate issues, above.^Complete reports are now collected semianmially; except for June and December, data are estimates based on reports for a smaller number of firms.fRevised series. For an explanation of changes in the data on security issues compiled by the Securities and Exchange Commission and revised 1941 monthly averages for selected
series, see p. S-18 of the April 1943 Survey; there have also been unpublished revisions in the January-July 1943 and January-May 1942 figures and in the July-December 1942 figuresfor U. S. Government and the totals that include this item (July-December 1942 figures for other items are correct in the August 1943 Survey); all revisions are available onrequest. The price index for domestic municipals is converted from yields to maturity, assuming a 4 percent coupon with 20 years to maturity; revised data beginning February 1942are on p. S-19 of the April 1943 Survey; earlier data will be shown in a later issue. Revised data beginning November 1941 for the price series for U. S. Treasury bonds are shownon p. 20 of the September 1944 issue.
Digitized for FRASER http://fraser.stlouisfed.org/ Federal Reserve Bank of St. Louis

April 1945 SURVEY OF CURRENT BUSINESS S-19
Unless otherwise s ta ted, stat ist ics th rough 1941and descriptive notes may be found i n the1942 Supplement to the Survey
1945
Febru-ary
1944
Febru-ary March April May June July August Sep-
temberOcto-ber
Novem-ber
Decem-ber
1945
Janu-ary
FINANCE—Continued
SECURITY MARKETS-Continued
Bonds—Continued
Sales (Securities and Exchange Commission):Total on all registered exchanges:
Market value __thous. of doL.Face value do
On New York Stock Exchange:Market value doFace value do
Exclusive of stopped sales (N. Y. S. E.), facevalue, total thous. of dol..
U. S. Government doOther than U. S. Government, total-..do
Domestic..- .doForeign do
Value, issues listed on N. Y. S. E.:Face value, all issues mil. of doL.
Domestic doForeign do
Market value, all issues doDomestic doForeign do
Yields:Bond Buyer:
Domestic municipals (20 cities) percent..Moody's:
Domestic corporate doBy ratings:
Aaa doAa doA doBaa do
By groups:Industrials doPublic utilities doRailroads do
Standard and Poor's Corporation:Domestic municipals (15 bonds) do
U. S. Treasury bonds:Partially tax-exemptf --doTaxable! do.._.
Stocks
Cash dividend payments and rates, Moody's:Total annual payments at current rates (600 com-
panies) mil. of doL.Number of shares, adjusted- millions..Dividend rate per share (weighted average) (600 com-
panies) dollars^.Banks (21 cos.) doIndustrials (492 cos.) doInsurance (21 cos.) . doPublic utilities (30 cos.) doRailroads (36 cos.) do
Dividend payments, by industry groups:*Total dividend payments.. mil. of doL.
Manufacturing doMinings _.doTrade doFinance doRailroads doHeat, light, and power doCommunications doMiscellaneous do. __
Prices:Average price of all listed shares (N. Y. S. E.)
Dec. 31,1924=1OO_.Dow-Jones & Co. (65 stocks) __dol. per share
Industrials (30 stocks). doPublic utilities (15 stocks) doRailroads (20 stocks) do
New York Times (50 stocks) doIndustrials (25 stocks) do.Railroads (25 stocks) do
Standard and Poor's Corporation:Combined index (402 stocks) 1935-39=100..
Industrials (354 stocks).__ doCapital goods (116 stocks) doConsumer's goods (191 stocks) do
Public utilities (28 stocks) doRailroads (20 stocks) _do
Other issues:Banks, N. Y. C. (19 stocks) doFire and marine insurance (18 stocks) do
Sales (Securities and Exchange Commission):Total on all registered exhanges:
Market value thous. of doL. 1Shares sold thousands.. |
On New York Stock Exchange: 1Market value thous. of dol._ 1Shares sold. thousands..
Exclusive of odd lot and stopped sales (N. Y. ITimes) thousands..
156,187226, 548
143,104201,689
191,747395
191.352177,92213,430
111,995109, 329
2, 667114,882112,769
2.113
2.93
2.652.732.943.41
2.692.953.16
1.752.38
851. 69941.47
1.972.821.912.571.802.63
139.761.6
1.07.6
24.0
35.0.1
2.5
77.858.64
157.1327.9050.39
110. 96183. 3038.63
113.0115. 2103.6121.096.8
125. 3
113. 3124.6
,259,44260, 376
,040,41141,887
32,613
228, 798428, 754
215,113411,040
354, 781292
354,489347,657
6,832
96, 63293, 7872,845
96,83894, 7502,088
1.65
3.10
2.742.833.103.72
2.832.983.49
1.85
1.932.49
1, 752. 58941.47
1.862.811.792.671.812.29
' 138. 4' 59. 9
' . 97.3
' 26 46.7
'32.9.1
'4.2
64.148.56
135. 9722.8037.5994.10
159.3528.86
94.495.886.698.986.996.1
98.5112.1
668,97331,409
564, 77522, 509
17,101
i
185, 281307,972
169.339286,625
260, 533472
260,061249,255
10,806
95,40992, 5752,834
95, 71393,6042,110
1.65
3.09
2.742.823.103.70
2.832.973.48
1.84
1.912.48
1, 761. 55941.47
1.872.811.792.541.812.40
r 361. 7' 224.2
' 22. 1' 23. 0r 22 4
14.2'31.8'"14.4' 9 . 6
65.349.99
139. 0723. 6039.2897.02
163. 8730.18
96.698.288.1
102. 388.498.7
100.7113.9
980,39946, 916
831, 57534, 932
27,643
144,881221,137
133,606206, 364
191,157400
190, 757180, 68010,077
95,01392,1812,832
95,30593,1922,114
1.69
3.08
2.742.823.093.68
2.832.973.45
1.85
1.942.48
1, 763. 92941.47
1.872.811.802.541.812.40
' 307. 4' 131.4
' 4 . 1' 16.4' 45. 7
17.2M0. 2
46.4' 6 . 0
64.349.26
137.1922.7239.0096.06
162. 2729.86
95.196.586.5
100.987.397.3
113.6
562,81626,370
472,16419, 682
13,847
166, 046234, 544
153,442218, 886
213, 749915
212, 834204,161
8,673
93, 27290,4422,830
93,84991,7192,130
1.65
3.06
2.732.813.073.63
2.812.973.41
1.86
1.942.49
1,818. 36941.47
1.922.811.882.541.802.42
'118.4' 66.9
1.0' 4 . 1
' 11.01.4
' 31.2' . 2
' 2 . 6
67.449. 85
139. 2222.7439. 3696. 95
164.0429.88
97.299.087.8
103.687.899.3
100.7113.3
686, 23729, 409
578,18321, 633
17, 228
184,358296,029
169,220267,881
243,784436
243,348231, 087
12, 261
95, 72992,9292,799
96, 23594,0992,137
1.64
3.05
2.732.813.073.59
2.792 963.'40
1.87
1.912.49
1,818.13941.47
1.932.811.882.541.802.42
' 460. 7' 264. 6'43.4' 25. 7' 30. 8' 37. 3'32.7
14. 5' 11.7
70.251. 85
145. 4623.4740.58
101. 46171. 8831.04
101.5103.992.7
110.289.6
100.8
103.9112.3
1,159.17959,069
997,80545,854
37, 713
170,406258, 532
158,655243, 004
193, 748503
193. 245182, 523
10, 722
101, 55998, 8562,703
102, 285100, 244
2,041
1.59
3.04
2.722.803.053.57
2.792.953.37
1.84
1.892.49
1, 817. 90941. 47
1.932.811.882.541.802.42
' 350. 5' 144. 3
' 3 . 9'17.6'78.5' 14.8'37.7
46.5' 7 . 2
69.253.03
148. 3723.9641.85
103. 34173. 5931.73
104.3106.796.1
113.191.3
105.3
106.7116.9
1,055,96353, 995
898, 47840, 055
28, 220
115,386164, 549
104,051149,718
137,613331
137, 282130,104
7,178
101, 58198, 8812,700
102. 329100|276
2,053
1.59
3.02
2.712.793.043.55
2.792.943.34
1.82
1.902.48
1,819.87941.47
1.932.811.882.541.802.42
' 133. 7'61.4
' 1.23.8
' 25. 97.9
'31.4.1
' 2 . 0
69.852.60
146. 7224.7441.12
102. 25173. 4231.09
102.7104.794.3
111.792.1
102. 5
106.2116.4
735, 30238, 820
610, 47727, 530
20, 753
100, 214143, 273
90,966131, 764
132, 211461
131, 750124,941
6,809
101, 39998, 7042,694
102, 01799, 9812,036
1.66
3.03
2.722.793.053.56
2.792.943.35
1.83
1.932.47
1, 822.01941. 47
1.942.821.882.541.802.42
' 379. 6' 239. 2'20.8'25.7'24.2
11.9'31.9'14.0'11.9
69.551.81
145. 2024.6739.75
100. 60171. 2429.97
100.7102.692.6
110.791.498.7
105.0115.5
623,09428, 275
518, 52120, 284
15, 946
141, 242197, 373
130, 747185, 232
166, 619247
166, 372160, 202
6,170
101, 08898, 4002,688
101, 80199, 7562,046
1.64
3.02
2.722.813.013.55
2.792.963.32
1.87
1.932.48
1, 833. 24941.47
1.952.821.892.541. 802.55
' 300. 4' 127. 5
4.7' 17.2' 48. 5' 12.8'38.1
46.5' 5 . 1
69.753.15
147. 6825.6141. 52
103. 03174. 7231.33
103.5105. 695.6
113.292.7
103.4
107. 3117.7
749,41133, 554
617,18723, 480
17, 534
139,318208,588
129,013196,075
196,864365
196,499189,948
6,551
100, 45097,7652,685
101, 37899, 3332,044
1.63
3.02
2.722.803.013.53
2.772.983.29
1.88
1.902.48
1,860.07941.47
1.982.821.922.541.802.56
' 129. 2' 70. 9' 2 . 9' 5. 4
'12.92.9
'31.9
70.353.11
146.8825.4542.11
102. 71173. 5231.89
102.7104.694.5
112.092.1
104.9
109.4118.0
742, 74631,371
617,30722,139
18,019
194,057308, 571
183, 545293,799
266, 532349
266,183257, 840
8, 343
111,116108,438
2,678112,621110, 577
2,044
1.62
2.702.762.983.49
2.742.963.25
1.87
1.872.48
237, 830411,818
223,579384,803
341,960788
341,172332, 366
8,806
111,885109, 219
2,667114,020111.959
2,060
1.53
2.97
2.692.762.983.46
2.732.973.23
1.81
1.812.44
843. 45941.47
1.962.821.902.571.802.56
' 794.8'451.4' 68. 5' 45. 8' 72.0'59.5'52.7' 16. 1'28.8
72.655.32
150. 3525.8046.34
106. 45177.3835.52
104.7106.496.0
113.492.4
113.9
114.6117.8
1,843. 52941.47
1.962.821.902.571.802.57
' 297. 1'98 .2
1.8'20.5'74.4
16.6'35.9' 45. 9' 3 . 8
73.857.11
153.9526. 5348.87
107. 79179.0736.51
108. 4110.499.4
116.393.8
120.7
114.4120.8
1,154,134 1,472,62451,026 69,879
977,806 1,238,351~~ — ' 51,20838,418
31,260 38, 995
Revised.*New series. Data for 1941 and 1942 for dividend payments are shown on p. 20 of the February 1944 issue. Revised data for January 1944 are as follows: Total, 285.1; manufac-
m Treasury bonds consists of all issues not due or callable for 15 years; revised dataturing, 92.7; mining, 1.4; trade, 17.3; finance, 74.0; heat, light, and power, 34.0; and miscellaneous, 3.2.
tRevised series. The revised yield series above and the price series on p. S-18 for long-tenhrough December 1943 are shown on p. 20 of the September 1944 issue.
Digitized for FRASER http://fraser.stlouisfed.org/ Federal Reserve Bank of St. Louis

S-20 SURVEY OF CURRENT BUSINESS April 1945̂
Unless otherwise stated, statistics through 1941and descriptive notes may be found in the1942 Supplement to the Survey
1945
Febru-ary
1944 1945
Febru-ary March April May June July August Sep-
temberOcto-ber
Novem-1 Decem-ber I ber
Janu-ary
FINANCE—Continued
SECURITY MARKETS—Continued
Stocks—Continued
Shares listed, N. Y. S. E.:Market value, all listed shares mil. of dol_.Number of shares listed millions..
Yields:Common stocks (200), Moody's percent..
Banks (15 stocks) -doIndustrials (125 stocks) doInsurance (10 stocks) doPublic utilities (25 stocks) doEailroads (25 stocks) do.. _.
Preferred stocks, high-grade (15stocks)f Standard andPoor's Corporation percent..
59, 680'1.418
4.33.34.23.45.0.5. y
48,494 49,422 48,6701,492 ! 1,492 j 1 4 9 4
4.83.74.64.05.56. 7
4.06
4.83.84.63.75.56.9
4.04
670494
4.93.84.63.85.67.0
501964493
4.83.64.73.75.46.7
4.03 4.04
53,0681,493
4.63.54,43.75.26.6
3.98
52,4881,497
4.73.64.53.75.36.6
3.94
53,0771,499
4.73.54.53.75.26.7
3.96
52,9301,481
4.73.54.53.75.36.7
3.95
53,0871,481
4.73.54.53.65. 37.0
3.95
53, 5921,483
4.83.34.63.65.36.8
3.92
00.5321,492
4.63.34.53.75.26.1
3.S7
56, 5861, 4S6
4.63.34.43.65.26. 3
FOREIGN TRADE
INDEXES
Exports of U. S. merchandise: jQuantity 1923-25=100.. LValue do jUnit value do ;.
Imports for consumption:Quantity do..Value do..Unit value do.
235
103
VALUE
Exports, including reexports, total! thous. of do!.Lend -lease* do_...
Canada§ do . . .Latin American Republics§ do . . .
Argentina§ do___Brazil§ do . . .Chile§ do___Cuba§ do . . .Mexico§ do . . .
Exports of U. S. merchandiset doGeneral imports, totalt do.__
Canada§ do . . .Latin American Republics§ do . . .
Argentina§ _do_._Brazil§ do . . .Chile§ do . . .Cuba§ do . . .Mexico§ do
Imports for consumption} do . . .
885, 756660, 336
876,961321,178
327,287
270289107
1159583
1,107,040'900, 432117,99368, 7451,945
10, 4714,748
14,56217, 426
1,098,204r 313, 206106,084119,52613,51318,17715,71227, 26917,423
303,919
292309106
13211285
1,196,966951,445120,67599, 688
2,66129, 028
5, 20513,30121,481
1,187,293358, 715106,225162, 69516,60240,36412,73134,17522,913
357, 428
296318107
13111185
1,226,108986, 717123,17082, 5162,084
17, 3272,295
14.95624, 804
1.216,289359, 364124, 797142, 09511,06713, 98313,01151,01522, 275
355. 526
348379109
13611786
1,455,3971,193,139
132, 22385, 5892,680
14,0884, 529
11,38724,884
1,446,084385, 9SS120,818157,17913,39133, 65111,98039. 58118, 040
372, 210
305339HI
11810186
1,295,3361,035,397
131, 54195. 8702,338
14. 9515,206
16, 02225, 638
1.286,840330,280102, 952128, 360
11,94221,23413, 95233,10215, 359
322,061
290320110
1069086
1,197,188636, 478130,19782, 003
1,83914, 9494,656
13, 44219, 537
1,190,137293,184
90, 873126, 79318,41522, 810
7, 74533,01013,435
288, 696
276320116
11193
1,187,725927, 576133,13897, 832
1,67726, 7124,016
13,39723, 763
1,180,515302, 445121, 281131,315
17, 54524,44918,17927,57914,479
297,417
276319116
1048784
1,192,680953, 923116, 505
80, 7523, 242
13,9013, 353
11,74521, 639
1,186,502280. 365
99, 342101,05815,28221,65211,08824, 81513, 541
278, 503
259304117
122103
1,140,008893, 084
269316117
216248115
121 j10184 I
12410484
1,184,849901, 990
1,134,722327,187
933, 752683, 487
901,407649, 672
1,176,439321,922
925, 208336,082
894, 465'331.973
330, 278 323,779 332,721 -353,21
TRANSPORTATION AND COMMUNICATIONS
TRAN SFORTATION
Commodi ty and Passenger
Unadjusted indexes:*Combined index, all typesf 1935-39=100.
Excluding local transit linesf do.. .Commodity f do.. .Passengerf do.. .
Excluding local transit lines do...By types of transportation:
Air, combined index do...Commodity do. .Passenger do...
Intercity motor bus and truck, combined index1935-39 = 100.
For-hire truck do...Motor bus do
Local transit linest do |Oil and gas pipe lines}- do !Railroads, combined index... do !
Commodity , do !Passenger do I
Waterborne (domestic), commodityt do.. .Adjusted indexes:*
Combined index, all typest--- do.. .Excluding local transit linest do.. .
Commodity do.. .Passengerf do.. .
Excluding local transit lines .do. . .By type of transportation:
Air, combined index do...Commodity do...Passenger .do__.
Intercity motor bus and truck, combined index1935-39=100.
For-hire truck _ doMotor bus do.
219225206260361
442641311
22020725717724024822641740
225232212265376
457641334
230214279
220226207265366
464674326
22521226818124624722441942
226233212272386
470674336
235218287
222228206276389
488662373
22019929018124424822344162
228235211281405
483662365
226203301
226233212272383
544731421
22320229218023925222942883
229237214279400
537731409
229206300
231237212288418
594791464
23520932118124925422746584
228235212281401
576791434
229207306
226234208287426
613797492
22619133817224625122346783
224230208111394
599797469
221195308
232241216286424
670884529
24121133917225025622946188
225232211272384
646884489
231211300
225238214260409
674874542
23621630317926125022544787
223r228'206111389
650874502
225206288
229236216272379
696910556
236223283183
' 26024822641787
222229206276
'391
687910=539
'228r209290
'225'231'211'275373
679917522
'235226275184
' 277241
'21841472
223'229' 206279394
696917
'549
'234'218286
213'217' 195272
' 378
647£06475
216'203'286' 185' 275229204
'424'46
216'221'200267
'373
679906528
'219'203'271 '
213216196266358
670948487
22421325718928222620340247
219223203269367
707948-547
237224
'Revised. t See note marked "*".* New series. For data beginning 1929 for the transportation indexes, see pp. 26 and 27, table 5, of the May 1943 Survey (small scattered revisions have been made in the data,
beginning 1940 for the series marked " t ' \ as published in the Survey prior to the December 1943 issue; revisions are available on request). See p. 22 of the February 1945 Survey forannual totals on lend-lease exports for 1941-44; monthly data prior to December 1943 will be shown later.
t For revised data for 1941 and 1942, see p. 22. table 4, of the June 1944 Survey.§ Revised security regulations now permit publication of data for Latin American Republics, Canada, and Mexico on a 6-month delayed basis; publication of totals for the selected
countries formerly shown in the Survey has therefore beenfresumed beginning in the August 1944 issue; revised figures for 1941 and data for January 1942 to May 1943 will be published!ater. Other country and commodity data formerly included in the Survey may be published only on a 12-month delayed basis.Digitized for FRASER
http://fraser.stlouisfed.org/ Federal Reserve Bank of St. Louis

April, 1945 SURVEY OF CURRENT BUSINESS S-21
Unless otherwise stated, statistics through 1941and descriptive notes may be found in the1942 Supplement to the Survey
1945
Febru-ary
1944
Febru-ary March April May June July August Sep-
temberOcto-ber
Novem-ber
Decem-ber
1945
Janu-ary
TRANSPORTATION AND COMMUNICATIONS—Continued
TR AN SPORTATION—Continued
Commodity and Passenger—Continued
Adjusted indexes*—Continued.By type of transportation—Continued.
Local transit lines 1935-39=100..Oil and gas pipe lines _ doRailroads do
Commodity doPassenger ...do
Waterborne (domestic), commodity— do
Express Operations
Operating revenue thous. of dol..Operating income do
Local Transit Lines
Fares, average, cash rate cents..Passengers carried § _ _..thousands..Operating revenuesf thous. of doL.
Class I Steam Railways
Freight carloadings (Fed. Reserve indexes):Combined index, unadjusted 1935-39=100..
Coal . .do. . . .Coke ..doForest products . doGrains and grain products do.. .Livestock doMerchandise, 1. c. 1 doOre .do. . .Miscellaneous .do
Combined index, adjusted! doCoal!-- do.. .Coket do...Forest products . d o . . .Grains and grain products! d o . . .Livestock! do.._Merchandise, 1. c. 1 _doOre! . d o . . .Miscellaneous! - d o . . .
Freight carloadings (A. A. R.):^Total cars__, . thousands.
Coal d o . . .Coke d o . . .Forest products d o . . .Grains and grain products d o . . .Livestock . . . d o . . .Merchandise, 1. c. l._ d o . . .Ore . - _. . .do__.Miscellaneous. . . . d o . , .
Freight-car surplus and shortage, daily average:•Car surplus thousands_Car shortage d o . . .
Financial operations:Operating revenues, total thous. of doL
Freight — d o . . .Passenger d o . . .
Operating expenses . d o . - .Taxes. joint facility and equip, rents© _do . . .Net railway operating income©—_ . d o . . .Net in comet d o . . .Operating results:
Freight carried 1 mile mil. of tons.Revenue per ton-mile cents.Passengers carried 1 mile millions.
Financial operations, adjusted:!Operating revenues, total ..mil. of dol.
Freight d o . . .Passenger . d o . . .
Railway expenses _ doNet railway operating income. . . d o . . .Net income __ d o . . .
Operations on scheduled air lines:Miles flown . thous. of miles.Express carried . . thous . of lb .Passengers carried number .Passenger-miles flown thous. of miles.
Hotels:Average sale per occupied room _ dollars-Rooms occupied percent of total-Restaurant sales index 1929=100.
Foreign travel:U. S. citizens, arrivals number .U. S. citizens, departures ._.do-._Emigrants - d o . . .Immigrants - d o . . .Passports issuedcf d o . . .
7.8115,221,355
130139188128117976442
14213913917813311912166
168152
3,05067159
16016754
39546
1,499
1316
712, 806536,821125, 857499, 643131,84073,163
88173
14, 819
173226253230428
69
19, 28270
7.8004199,288104, 398
133'148
1911401451086448
138'142'148
18014614813567
193147
' 3,154'724
61174208
61405
55' 1,466
157
735, 305551, 442135, 881492,094155,992'87,214r 46,038
63,101.930
7,275
774.5575.7145.9671.4103.165.9
8,5084,079
254,199125,089
3.84QQoo
165
7,6805,178
3022,251
11, 587
179239252228439
68
20,168249
7.80041,307,703112, 238
1321401871411251036751
14214014018514113613167
174149
3,135684
5917618258
42255
1,499
192
797,029596,953147, 759527, 433177,09292,50453,653
66,960.953
7,823
781.6577.5149.9690.191.553.4
9,5054,776
293, 523142,834
3.7768OO
167
9,6365,346
4532,1259,772
17824125622946065
19, 88873
7.80041,262,124110,450
1351411861411081076816814413814119014112312067
' 195146
4,0698507421719475537214
1,910
230)
759,534561,093146, 583509,004162, 85687, 67448,033
64,450.9317,973
780.1574.0152.1688.791.453.9
9,9024,323
318,560155, 412
4.0988184
10,2055,253
3142,3702,309
17924425823245167
20,78379
7.81431,297,900114,290
1411471881461131066728114513814719014012811867195144
3,4467115918116060422318
1,534
241
804,056600,069150,076526,767178,78398, 50559,020
68,376.9347,979
778.8573.3152.2687.791.262.6
11,2364,536
369,649181,038
3.6988178
12,2066,749844
2,2098,396
18225725322844765
20,61378
7. 81431,252,900110,940
1441481911541371006629114713914819414813512467187143
3,4457106018318055410328
1,520
261
799, 475585,128159, 584518, 467181,18799,82261, 337
65, 695.9488,405
153.7700.7108.170.6
11, 6745,331
389,017193, 289
198
11, 7107,925735
2,39110,195
18025624922543463
20, 22275
7.81431,228,600109, 500
1471431881571721026630215114314319415614412466189150
4,3618387223629569505412
1,934
17
593, 829162,198525,057185, 348
57, 362
66, 754.9508,706
803.5601.5149.2705.997.659.0
12, 7705,756
441, 712211, 704
82193
16, 4988,283487
2,49915, 855
17926024722542168
20,83874
7.81431,216,000109,190
1461461781621411156828115114214618515513112168188149
3,5807105720320364427324
1,593
123
836,183617,348162,070538,489196, 329101, 36660, 346
68,454.958
781.3579. 5145.0710.371.029.7
13, 5556,730
476,808227,351
3.7789214
16, 2978,221619
3,19910, 094
241216434'70
21,69275
7.81981,231,800109,007
15014718114814215170
27615813914718213712611467
184146
4,42886269222241100534379
2,022
104
799,229591,104152,971521, 264188,83889,12655, 545
65,065.9678,067
789.9581.4154.0709.880.140.1
13,5706,149
464,536225,472
4.1689194
16,6118,307458
3,26112,163
182'26524221743371
22,092123
7. 81981,312,500114,836
1481431781401471846923715613714318213314712066153143
3,59969557173208104435272
1,654
818, 737612,020146,369539,157182, 23497,34659,822
67, 679.6597,790
791.2584.7150.0709.581.743.3
14,5966,763
497,664239,022
4.0490
194
15,1368,091
7163,246
10, 694
184••274
239213439
73
22,82675
7.81151,275,000
111, 457
1441431811351471707013815514114318113815013568153149
3,3666655616320493424176
1,585
11
5
780,672585,432140 288524, 450164, 64491,57963,506
63,203983
7,468
788.5587.2147.1697.291.353.5
13,9426,202
455,726217,388
4.0788
192
14,8147,016
4583,402
10,302
••180r 268'232
208'416
' 6 9
26, 953
7.81151,333,343119,633
128127175120126124654114213712716613513412868133151
3, 699755671812198849958
1,833
143
756,858555, 810146, 412555, 775131,49969, 58441, 474
61,107971
7,908
780.3586.2144.1711.369.0
'29.8
13, 651' 6. 449414, 992204, 513
3.9683174
15, 5238,101490
2,79413,111
27023020754777
23,18371
7.81151,316,500115, 270
132141185128128115634014314314117614212812066161157
3, 002661561501766338345
1,467
149
751,337558, 874139, 243530, 232148, 08873, 01639, 048
766. 4566. 9145. 3673. 293.254.4
14, 2906,850
430, 233209, 239
3.9790174
13, 434r Revised. 1 Less than 500. o*Includes passports to American seamen. ^jData for April, July, September and December 1944 are for 5 weeks; other months, 4 weeks.§Data cover 186 companies; for 1943 data for 188 companies comparable with 1941 and 1942 figures on p . S-21 of the April 1943 Survey see p . S-22 of the April 1944 Survey.JRevised data for January 1944, 47,691. Other revisions for 1942-43 are shown in notes on p . S-21 of the November 1944 and subsequent issues of the Survey.!The indicated seasonally adjusted series for freight carloadings have been shown on a revised basis beginning in the October 1943 Survey, and for financial operations of railroads
beginning in the June 1944 issue (see those issues for periods affected); all revisions are available on request. Beginning in April 1944 Survey, revenue data for local transit lines coveralf common carrier bus lines except long-distance interstate motor carriers; revised monthly average for 1942, 86,667; 1941, 66,695; 1941-42 monthly data available on request.
* New series. For data beginning 1929 for the transportation indexes, see pp. 26 and 27 of the May 1943 Survey (small scattered revisions have been made in the indexes for localtransit lines, oil and gas pipe lines and waterborne transportation, beginning 1940 as published in the Survey prior to the December 1943 issue; revisions are available on request).
• Data for freight-car surplus and shortage are daily averages for weeks ended within the month. Comparable data for January-September 1943 for surpluses, shown only for thelast week of the month prior to the December 1944 issue of the Survey, and for the new series on shortages are shown on p. S-21 of the December 1944 Survey.
© Revisions for January 1944: Taxes, joint facility and equipment rents, $151,661,000; net railway operating income, $84,998,000.Digitized for FRASER http://fraser.stlouisfed.org/ Federal Reserve Bank of St. Louis

S-22 SURVEY OF CURRENT BUSINESS April 1945
Unless otherwise stated, statistics through 1941and descriptive notes may be found in the1942 Supplement to the Survey
1945
Febru-ary
1944
Febru-ary March April May June July August Sep-
temberOcto-ber
Novem-ber
Decem-ber
1945
Janu-ary
TRANSPORTATION AND COMMUNICATIONS—Continued
TRANSPORTATION—Continued
Travel—Continued
National parks, visitors number..Pullman Co.:
Revenue passenger-miles ___ _. .thousands..Passenger revenues. _ thous. of dol..
COMMUNICATION S
Telephone carriers:^Operating revenues _ thous. of dol._
Station revenues . -doTolls, message- do
Operating expenses doNet operating income doPhones in service, end of month. . . .thousands..
Telegraph and cable carriers:§Operating revenues, total thous. of doL.
Telegraph carriers, total doWestern Union Telegraph Co., revenues from
cable operations thous. of dol_.Cable carriers -do
Operating expenses doNet operating revenues _ .doNet income trans, to earned surplus _do
Radiotelegraph carriers, operating revenues .do
22,! 20,101
2,242,58712,415
156,23886,97656,970100,56519,07424,067
16,04414, 742
1,0421,30211,9372,235785
1,251
26,363
2,570,78013,828
161,80789,00160,775104,09520.09324.094
17, 65516, 111
1,1251,54512,7972,9811,1221,295
35,809
2,475,17313,381
158,69187,84758,578101,61519,40024,085
16, 76415,350
1,0361,41412,5152,413769
1,201
50,990
2,301,96412,992
162, 26088,74161,054104,58419, 42724,147
17, 54316,016
1,0281,52713,5442,097733
1,346
90, 304
2,344,94913, 291
161, 29788, 47360, 313103, 39919, 37124,161
17,07215,654
9511,41813,0791,913699
1,376
192, 694
2,321,04712,893
159, 38586, 43060, 313105, 02118, 96424,183
16, 42915,091
9381,337
13, 407965530
1,386
174, 076
2,339,03613, 247
164,16987, 70963, 852105, 61719, 97224, 231
17, 20215,805
9351.397
13, 3651,940830
1,397
114, 622
2,406,23713,403
161, 35287, 65460. 920104. 97319, 35624, 264
16. 51515,163
9411,352
13, 0931,515714
1,368
69, 816
2,414,80813,672
166, 85790, 40563,110105, 48520, 66324, 303
16, 943i5,668
1,0411, 27413,0332,029848
1, 552
34, 705
2,249,62712, 790
165, 24489,91662,179105,08119, 98724, 340
16,21814, 876
1,0121,34112,8661, 4831, 6911,657
21, 230
2,240,87512,909
171,04491,08866, 396117,03623,34824, 382
17, 76716,190
1,0851, 57713,1042,4381,3631,766
20,075
2,282,40713,445
17,12015,651
9641,46912,9172,2651,0141,675
CHEMICALS AND ALLIED PRODUCTS
CHEMICALS*
Ammonia, synthetic anhydrous (100% NHs):Production ..short tons.Stocks, end of month _do
Calcium carbide (100% CaC3):Production _ _do._.Stocks, end of month do . . .
Carbon dioxide, liquid, gas, and solid (100% C0s):OProduction thous. of lb.Stocks, end of month. _ do . . .
Chlorine:Production short tons.Stocks. end of month _ -do . . .
Hydrochloric acid (100% HC1):Production -do_-.Stocks, end of month _ do . . .
Hydrogen, production mil. of cu. ft.Nitric acid (100% HN0»):
Production short tons.Stocks, end of month- ._ _ do.-.,
Oxygen, production mil. of cu. ft.Phosphoric acid(50% H3PO4):
Production short tons.Stocks, end of month- do . . .
Soda ash, ammonia-soda process (98-100% NaaCOs):Production, crude short tons.Stocks, finished light and dense, end of month..-do.-_
Sodium hydroxide (100% NaOH):^1
Production doStocks ,end of month do
Sodium silicate: •Production short tons.Stocks, end of month. ._ do . . .
Sodium sulfate, Glauber's salt and crude salt cake1
Production short tons.Stocks, end of month do . . .
Sulfur:Production -long tons.Stocks, end of month -do
Sulfuric acid (100% H2SO4):Production short tons.Stocks, end of month _ d o . . .
Acetic acid: JProduction-.. thous. of lb .Stocks, end of month do.._
Acetic anhydride:Production -do . . .Stocks, end of month- _ .do . - .
Acetylene:Production -thous. of cu. ft.Stocks, end of month do.._
Acetyl salicylic acid (aspirin):Production. thous. of lb.Stocks, end of month d o . . .
44, 7566,766
92,0665,978
33,6713,110
40,0676,825
51,12814, 285
331,95293,748
146, 2551 65,229
42,9634,559
65,02124, 847
60,68711, 708
101,3758,398
r 29,1252,9421,899
38,1537,9611,482
61,887•• 12,455
363,87529,639
147,38851,353
43, 2422,884
68,79427,108
70, 31816, 546
108,5246,572
' 29,9752,4282,090
36, 5097,5341,637
65,484r 15,030
399,75827, 210
158,974'45,900
43,1912,834
69, 32429, 605
70,24123, 488
106,8357.942
' 29,607r 3,133
2,061
38,1616,8871,552
' 58, 754r 12,885
385,08534,049
157,08950,477
42, 3083,766
67, 48129, 707
83, 48722, 570
109, 4159,053
r 31, 4512, 5752,068
38,9687,0471,556
r 60, 526' 14, 647
393,82332, 209
158, 286' 46,869
40, 0712,488
63,04329, 643
86, 67615, 997
104,6416, 414
' 31,1702,5331,879
39,2756,5551,490
r 56, 743r 15, 636
371, 75435,959
152,106r 45, 713
42, 9273,614
64,13128, 484
90, 06011, 202
106, 6576,028
32, 3253,1261,998
38,9746,7951, 505
r 58, 529r 15,067
373, 92141, 737
159,40350, 646
44, 9313, 579
65, 68530, 043
90,6979,005
104, 0744,812
31,5192,9022,102
38, 4716,1891,582
52, 255' 14, 438
368, 83336, 445
156, 66351, 761
45, 2922, 764
62,59131,078
84,9639,437
102,1905,023
32,1313,1622,085
39,3495, 9051,568
52, 039«" 14, 360
365, 36238, 260
152,147r 49, 821
49,1134,802
67, 80731, 706
76,1349,108
103, 5174,966
34, 4543,2612,075
41,9555, 7951,551
52, 48712,892
379, 47237,113
153, 9291 59, 226
49, 7215, 0G4
65, 80632, 705
65, 2259,397
101,9995,059
35,1063, 5902,114
42, 5716,2491,530
' 54, 62611,684
374, 45339, 725
155,2191 57, 479
50, 8336,120
63, 71330, 382
58, 7478,940
107,0656,500
T 34,346' 3, 751
2,086
41,3287,3801,497
r 58, 237'12 ,973
368. 58858,161
•166,0291 63,932
49, 8637,409
103,9538,127
35,1553,004
40, 8767,027
51,26413, 378
365,71876, 658
161,1001 64, 204
806,078265,002
62, 52971,430
186,5684,302,437
737,107292,719
27,1749,514
38,7209,922
463,72611,333
764815
65,17872,930
229,7994,251,744
760,848278,088
31, 00910, 472
41,68610,245
483, 54511,114
881
69,89577,698
271,9034,244,827
743, 807287,962
27, 92010,324
41,96311,534
469,49013,170
676 I596
70, 41877,421
278,7514,200,031
765,922266,448
28,66310, 731
41,64812, 026
463,20011, 790
819961
66,62579, 800
280, 5454,168,394
722,000232, 213
26, 3039,156
40,04810, 867
452,46510,955
7441,012 1
63, 62983, 976
305,0644,154,349
742, 526218,811
' 25, 2547, 621
39,113
456,34711, 323
691972
68, 52679, 931
306,1464,161,012
767,413202, 785
26, 5317,594
41, 36111, 746
453, 64011, 386
738916
65,18577, 693
293, 9634,140,976
744, 944204, 393
25, 3318,513
40, 83812, 295
438, 82911,397
786929
67,83878,905
312,0604,110,395
814, 871213,457
27, 5729,281
42,08412,083
482, 40811,615
834819
68,10983, 735
293, 5")14,089,622
820, 958216, 230
29.99911, 235
42, 32712, 380
450,1659,966
774910
67, 49087,283
280,5804,100,320
853,254253, 479
27,9419,113
43,90012,108
450,991r 9, 910
846980
275, 7224,034,453
853, 930262,681
29, 52612,410
1,114
r Revised. J Not comparable with earlier data, see note marked " d V ©Revised; not comparpble with data shown in the Survey prior to the March 1945 issue.cfProduction figures represent total production of liquid material, including quantities evaporated to solid caustic. Stock figures represent stocks of liquid sodium hydroxide
only prior to October 1944 (comparable figure for October, 46,839); beginning that month they include stocks of both liquid and solid sodium hydroxide,• Data are being revised; the new data will be shown in a later issue§ Beginning 1943 data have been compiled on the basis of a new accounting system; available comparaDle data for 1942 are shown in footnotes in the September 1943 to April
1944 Surveys; 1942 data on the old basis, comparable with figures for earlier years, are available in the March and April 1943 issues.H Data for 3 companies operating outside of United States, included in original reports for 1943 to date are excluded to have all figures cover the same companies.* The new monthly series for sulfur are compiled by the Bureau of Mines and cover total production and producers' stocks of native sulfur (Texas and Louisiana have been the
only producing States since 1942 and the production figures are therefore comparable with the quarterly figures formerly shown). The new series for acetic acid, acetic anhydride,acetyl salicylic acid, creosote oil, cresylic acid, ethyl acetate, naphthalene and phthalic anhydride are compiled by the Tariff Commission; the other new chemical series are compiledby the Bureau of the Census. The monthly data for a number of the chemicals are reported quarterly only. For further information on these data, see note marked "*" on p. S-22of the November 1944 Survey; a more detailed description of the individual series and earlier data will be published later.
t Includes synthetic acetic acid and acetic acid produced by direct process from wood and from calcium acetate; statistics of recovered acetic acid are confidential and are notincluded.
Digitized for FRASER http://fraser.stlouisfed.org/ Federal Reserve Bank of St. Louis

1945 SURVEY OF CURRENT BUSINESS S-23
Unless otherwise stated, statistics through 1941and descriptive notes may be found in the1942 Supplement to the Survey
1945
Febru-ary
1944
Febru-ary- March April May June July August Sep-
tember October Novem-ber
Decem-ber
1945
Janu-ary
CHEMICALS AND ALLIED PRODUCTS—Continued
CHEMICA LS—Continued
Creosote oil:*Production ___thous. of gal-Stocks, end of month do . . .
Cresylic acid, refined:*Production _._ thous. of lb.Stocks, end of month.. . do . . .
Ethyl acetate (85%):*Production do . . .Stocks, end of month.. do . . .
•Glycerin, refined (100% basis):*High gravity and yellow distilled:
Consumption. do._.Production do . . .Stocks, end of month do . . .
Chemically pure:Consumption do . . .Production do._.Stock:, end of month do . . .
Methanoi:§Natural:
Production (crude, 80%) thous. of gal-Stocks (crude, 80%). end of month* do . . .
Synthetic (100%):Production.. _• do . . .Stocks, end of month* do . . .
Naphthalene, refined (79° C and over) :*Production thous. of lb.Stocks, end of month do . . .
Phthalic anhydride:*Production do . . .Stocks, end of month do . . .
Explosives, shipments. do . . .Rosin, gum:
Price, wholesale " H " (Sav.) bulk dol. per 100 lb_Receipts, net, 3 ports _.bbl. (500 lb.)_Stocks, 3 ports, end of month... do . . .
Turpentine, gum, spirits of:Price, wholesale (Savannah)f dol. per gal.Receipts, net, 3 ports bbl. (50 gal.).Stocks, 3 ports, end of month. do . . .
FERTILIZERS
Consumption, Southern States thous. of short tons..Price, wholesale, nitrate of soda, crude, f. o. b. cars, port
warehouses • dol. per 100 lb_.Potash deliveries short tons.-Superphosphate (bulk):f
Production . .doStocks, end of month . . .do
OILS, FATS AND BYPRODUCTS
Animal, including fish oil:Animal fats:|
Consumption, factory thous. of lb._Production doStocks, end of month do
Greases :jConsumption, factory doProduction... doStocks, end of month do
Fish oils:*Consumption, factory doProduction _ doStocks, end of month... . do
Vegetable oils, total:tConsumption, crude, factory mill, of lb._Production, crude doStocks, end of month:
Crude . .doRefined— do
Coconut or copra oil:Consumption, factory:t
Crude. thous. of lb__Refined do
Production:Crude t- do . . . .Refined do.._.
Stocks, end of monthtCrude.. doRefined , do
•Cottonseed:Consumption (crush) thous. of short tons..Receipts at mills doStocks at mills, end of month do
7,2148,719
36,053
7,0487,077
34,179
279287
5,8273, 743
34, 543
5.81
.81
1,078
1. 650
135, 378205,830390,736
62, 85445, 42599, 249
33,4581,791
183,062
370377
833411
12, 5665,681
14,0805,348
109, 6252,278
436156
1,067
14,47025, 681
3,7482,108
9,0164,729
5,8027,344
35,212
5,7099,766
4.0, 537
347233
5,4195,208
7,7692,783
9,6761,736
36,509
4.333.957
108,083
.77776
91,366
<• 1,166
1.65073, 693
692, 367954,414
134,029401, 403585,301
54,44063,481
109,999
16, 5842,006
195, 257
356
937495
21,4187,625
14,3817, 524
114,1993,348
332'72
14,61827, 241
3,7372,366
10,1766,030
6,3828,137
36,836
7,3709,079
43,942
363257
6,2705,939
8,1802,910
10, 3451,983
36, 282
4.733,927
92,878
.77358
86,473
1,225
1.65075, 727
664,538860, 606
142, 628346, 406740,435
58, 48757, 781
127, 707
14, 793767
183,271
361375
959522
19,6007,326
8,5877,063
122, 5343,260
26848
450
14, 43228,478
3,3432,155
7,6765,323
6,0797,636
37,948
6,7238,015
44,243
341310
6,3207,128
7,5792,604
10, 6081,780
35,461
4.686,151
79,813
.772,052
83, 597
694
1.65056.140
617,144776,990
122,161323, 984799,371
63,34357,073
135, 940
15,894705
170, 213
310304
952533
17, 3837,523
9,4616,960
116,9963,530
18624
13,99928,307
3,7822,016
8,2145, 397
5,8617,694
38,475
6,9228,281
44, 549
364312
6,6946,768
7,0771,786
10, 7142,404
38,158
4.927,919
78, 313
.777, 211
85, 536
376
1.65037,398
685,990839,121
129,998349, 799867,192
60, 43863,383
154, 656
16,3711,615
160, 227
314286
857527
17,1486,123
13, 4705,830
114,0993,392
13425
179
13, 72626, 361
3,2572,230
8,7726,571
7,45238, 588
6,5797,173
44,497
341331
6,5636,834
7,2951,357
2,90938, 564
5.6210, 32661,165
4,14782, 867
144
1.65081, 359
620,957872,025
113, 703308,435903, 454
58,03459,138168,949
15,89612,928156, 067
271270
845493
13,6335,369
17, 6525,334
119,2693,536
7434140
11, 76224,043
3, 5535,859
7,7716,135
6,2406,713
37, 590
6.3755; 501
42,411
315286
5,8385,496
6,3511,454
10,6442,954
37,645
5.529,876
57,190
.763,696
76,973
96
1.65065, 743
567,891874, 797
107,053263,085876,121
57, 43952,164
185,421
16, 28223,622
169, 906
237273
808427
13,2565,164
8,2674,755
113,0503,366
5534
119
12, 44318,880
3,4322,720
9,0746,766
7,6118,730
38,517
7, 0859,823
42,874
319240
4,8492,344
6,1231,972
10,6003,244
39,916
5.4810, 40653, 202
.793,745
77,131
147
1.65071,981
-•601.487'861J334
150, 650254, 417810,479
71,68552, 293
167,454
16,97624,857
176,846
283269
779359
19,0646,712
0)6,451
100,0133,293
100163182
11, 05513, 584
3.3692,242
7,7675,222
6,8148,745
38, 598
7,4707,785
40, 0.26
334201
5,4351,926
5,9791,815
10,6113,154
38,921
5.499,345
48, 609
.792,798
68, 675
295
1.65067, 511
r529, 229r 870, 437
139,595193, 700697,159
60, 44043,921
159, 946
18,98132, 688
196, 646
287311
791316
15,6136,654
0)5,953
103, 2972,457
354908735
M,C8112, 696
3, 4242,023
9, 6835.721
6,7929, 262
39, 443
8,8158,779
37, 423
382264
5,6711,851
5,9071,462
10, 7923,782
38,042
5.717,881
43, 512
.792,324
68, 222
254
1.65061, 296
«• 604, 519-•875,992
152,060204, 820598, 309
63,98745. 240
147, 824
24, 70052. 995
222, 733
341361
784294
15, 7946, 506
8, 3926,740
101. 2752,996
5231,3211, 534
13,48410,931
3,2791,095
10, 2664,873
6,23610,83440, 515
9,0847, 684
36,605
361260
6,3632,388
6,3942,535
10,4262,835
36,276
5.817, 755
36,657
.792,236
67, 320
477
1.65070,630
-•604,673-"879,452
137, 546268,802542,129
65, 46252, 410
136,001
28, 88625, 843
236, 552
378413
787305
15, 2536,268
11.8076,008
94,1522,714
615934
1, 852
14, 23410,712
3,0771,694
9,8526, 241
5,9827,587
39, 348
7,5488, 800
37, 237
r350-•272
5, 8512,382
6,2172,091
10,7791,749
32,863
5.816, 346
31,900
.791,929
66,759
551
1. 65079, 916
r 599,861r 887,921
118,906259,130538,508
59, 59849, 777
123, 245
30,53914,696
228, 228
371371
812353
14, 2765,827
13,0325,676
98,4122,640
528361
1,676
12, 5739,695
2, 6761,472
9,0276,873
6,4977,77438,005
7,7128,00836,089
317278
6, 4553,166
5,3812,099
10, 3201,51234,124
5.81
.79
1,189
1.650
672,881929, 575
135,755243,439467,490
73,17950, 275111,169
31,3477,293
214,442
396412
815397
14, 5378,756
18,7208,394
102,4962,372
576244
1,345
* Revised. 1 Data included in "total vegetable oils" but not available for publication separately. § See note marked " § " on p. S-23 of the November 1944 Survey.• Price of crude sodium nitrate in 100-pound bags, f. 0. b. cars, Atlantic, Gulf, and Pacific port warehouses. This series has been substituted beginning 1935 for the series shown
in the 1942 Supplement; figures for August 1937 to December 1941 are the same as published in the Supplement; for data for 1935-36 and all months of 1937, see note marked " • " o n p.S-23 of the May 1943 Survey. Prices are quoted per ton and have been converted to price per bag.
JData for the indicated series on oils and fats revised for 1941; revisions for fish oils are shown in note marked"!" on p. S-22 of the April 1943 Survey; revisions for all other serieswere minor and are available on request. Data for 1942 also revised; revisions are available upon request.
*New series. For information regarding the new chemical series see note marked "*" on p. S-22 of this issue and the November 1944 issue.tRevised series. The turpentine price shown beginning with the April 1943 Survey is the bulk price; data shown in earlier issues represent price for turpentine in barrels and
NOTE FOR ASPHALT ROOFING, P. s-34.—Available data comparable with figures on p. S-34: Smooth-surfaced roll roofing and cap sheet—1943, Sept., 1,607; Oct., 1,680; Nov., 1641;Dec, 1656; 1945, Jan., 1,517; mineral-surfaced roll roofing and cap sheet—1943, Sept., 1,417; Oct., 1,528; Nov., 1,407; Dec, 1,330; 1945, Jan., 1,298; shingles—1943, Sept., 1,648; Oct., 1,766;Nov., 1,568; Dec, 1,396; 1945, Jan., 1,345. For data through September 1943 for an earlier series, see the November 1944 Survey and earlier issues (smooth-surfaced and mineral-surfacedroll roofing and cap sheet are shown as ready roofing and grit-surfaced, respectively, in the earlier series).Digitized for FRASER
http://fraser.stlouisfed.org/ Federal Reserve Bank of St. Louis

S-24 SURVEY OF CURRENT BUSINESS April 1945
Unless otherwise stated, statistics through 1941and descriptive notes may be found in the1942 Supplement to the Survey
1945
Febru-ary
1944
Febru-ary March April May June July August Sep-
temberOcto-ber
Novem-ber
Decem-ber
1945
Janu-ary
CHEMICALS AND ALLIED PRODUCTS—Continued
OILS, FATS, AND BYPRODUCTS—Continued
Cottonseed cake and meal:Production short tons..Stocks at mills, end of month d o —
Cottonseed oil, crude:Production __thous. of lb_.Stocks, end of month _ _._do—
Cottonseed oil, refined:Consumption, factory t d o —
In oleomargarine d o —Price, wholesale, summer, yellow, prime (N. Y.)
dol. per lb_.Production thous. of lb_.Stocks, end of month d o —
Flaxseed:Duluth:
Receipts.. thous. of bu_.Shipments d o —Stocks d o —
Minneapolis:Receipts d o —Shipments d o —Stocks do . . . .
Oil mills:{Consumption doStocks, end of month d o —
Price, wholesale, No. 1 (Minneapolis) dol. per bu_.Production (crop estimate) thous. of bu..
Linseed cake and meal:Shipments from Minneapolis thous. of lb_.
Linseed oil:Consumption, factory t d o —Price, wholesale (N. Y.) dol. per lb_.Production! thous. of lb_.Shipments from Minneapolis d o —Stocks at factory, end of month do_...
Soybeans:Consumption! thous. of bu_.Production (crop estimate) d o —Stocks, end of month d o —
Soybean oil:Consumption, refined! thous. of lb_.Production:
Crudet do . . . .Refined do
Stocks, end of month:Crude d o —Refined}: do . . . .
Oleomargarine:Consumption (tax-paid withdrawals) § doPrice, wholesale, standard* uncolored (Chicago)
dol. per l'b_.Productions thous. of lb..
Shortenings and compounds:Production - d o —Stocks, end of montht d o —Vegetable price, wholesale, tierces (Chi.).dol. per lb_.
PAINT SALES
Calcimines, plastic and cold-water paints:Calcimines-- thous. of doL.Plastic paints d o —Cold-water paints.-
In dry form--__f do—In paste form .o r interior use do___
Paint, varnish, lacquer, and fillers, total doClassified, total do . . .
Industrial do.._Trade d o . . .
Unclassified d o . . .
201,76794, 327
137,246157,802
104,081
.143131,046324, 250
()13
358
6957
1,324
2,1922,770
3.11
17,760
37,401(2)
42, 48916,260
239,754
13,709
37, 309
81,840
119,997104,199
86, 64749, 607
.165
131,87250, 346
.165
51.47746,49422,42924,0654,983
156, 507' 69,414
107, 555139,917
90,67219, 080
.140114,292341,191
18018
2,088
1822,771
4,66612, 7553.05
50, 760
45, 985.151
88, 20726, 820
305, 217
14, 749
38,119
83,127
123,88895, 780
133,418101,155
41,831
.16557, 363
118,32154, 742.165
10241
161434
45, 65541, 23320, 23620, 9974,422
128,01063,830
86,639113,470
86, 35418,991
.140105, 250361,285
252243
2,097
942267
2,102
5,09811, 0063.05
55, 500
51,994.151
98, 03738,160
340, 397
15, 266
35, 203
88, 041
129,867106,350
146,654112, 478
41,316
.16557,858
111,32056, 855.165
11338
185462
53, 65148, 58122,57026,0115,070
58,121
61, 26690, 969
90,48515, 497
.14078,619
353,927
1951,950
807129
1,610
4,1228,8253.05
47,160
44,906.151
79,18229, 460
361, 382
13, 227
30,958
81,435
112,85798,822
151,091129,077
35,157
.16544, 755
103,16461, 477
.165
10442
196502
51,06446,14620,85825,2884,918
62, 71749,345
43,43665,050
100,09213,728
.14066,363333,162
121805
1,266
614123
3,8709,1503.05
47,880
49, 575.151
74,13724, 360
308,077
12,506
27, 429
93, 620
107, 944107, 265
144, 287138, 226
31,844
.16544, 459
112,56965, 361.165
11948
233590
57, 26451, 63022,49729,1335,634
33,87737, 741
22, 54840,627
91, 70511,482
.14243, 871
294, 678
207567905
990152646
4,4967,0763.05
54,120
48,952.151
87, 72929, 400
335, 902
11,082
23, 712
86, 525
96. 298.95, 050
129. 373140, 714
26, 989
.16540,189
100,08959, 755.165
12437
252538
58,97052, 96423, 61729, 3486,006
25, 21327, 776
17, 96430,186
75, 74610, 911
.14325,138
241, 270
143466583
944147551
5,1235,9643.05
45? 600
45, 566.151
98, 64539, 960
320, 267
11,153
19, 250
72, 852
96,37988,179
134,000131,117
28,121
.16534, 720
93, 74563, 921
.165
43
216398
51, 70446,87821, 30525, 5734,825
44,33430, 353
29, 76229, 589
85, 29113, 755
.14330, 720183,448
271606249
2,540494582
4,5405,5413.10
44, 640
51, 379.151
87, 78345,180322,952
11,261
11, 260
97,856
97, 220108,807
106,858126,923
34,353
.16537, 665
130,29262, 331
.165
58
215459
58,71252, 93524, 94527, 9905,777
158,01460, 523
105, 40264,957
73, 59819,629
.14358,351164,802
805572496
4,409533
1,647
3,6616,2953.10
44, 640
49, 447.151
70,19234.800310,686
9,399
5, 214
90,827
82,86291,561
91. 502105, 252
.16551, 083
117.84156,802
.165
9541
196378
52,11046,74121,66125,0805,369
239, 58669,977
159,09794, 089
95,39324,116
.143111,825182, 570
1,393444
1,443
3,519290
2,651
3,3277,4563.10
42, 000
49, 431.153
' 63, 37029, 640
303,378
9,043
31, 748
89, 277
79,44986,197
78, 00772,845
56,496
.16557,182
122,18950,485.165
8544
174329
53.57148, 07123, 60124,4715,500
284,20173,674
190, 543125,483
105, 76623,318
.143146, 507220,122
5841,311715
999254
2,8427,6453.11
39, 240
47, 585.155
54, 27324, 960274,832
11,713
48, 785
89, 259
101,18982, 572
81,88251,068
53, 830
.16555, 272
133,02647, 627
.165
9339
137311
48,15243, 36521,37821, 9874,787
244,41777,085
164,171139, 528
83, 50222, 348
.143145, 640270, 767
65343436
44353
2, 494
2, 3646,8253.12
[ 23, 527
30, 540
47, 548.155
44,12622, 500263, 917
11.0971192, 86347,429
73,917
95, 85686,104
71, 26747, 592
52,407
.16552,424
111,34943,108
.165
264,55984,326
179,201159,993
105, 36126,331
.143150,878313,968
1322
371
13787
1,871
2,3064,8003.12
28,440
45,180(2)43,29120,340
252, 36fr
12,717
47, 765
78, 256
111,09891, 791
77, 80748, 229
59,430
.16559, 330
132,18648,688
.165
9038
126372
53, 66048, 26223,058-25,2045,398
ELECTRIC POWER AND GAS
ELECTRIC POWER
Production, totals - mil. of kw.-hr..By source:
Fuel ___doWater power .- ...do
By type of producer:Privately and municipally owned utilities doOther producers do
Sales to ultimate customers, total (Edison ElectricInstitute) mil. of kw.-hr..
Residential or domestic doRural (distinct rural rates) doCommercial and industrial:
Small light and power 1 doLarge light and powers do
Street and highway lighting _ _._doOther public authorities doRailways and railroads doInterdepartmental do
Revenue from sales to ultimate customers (EdisonElectric Institute) thous. of doL.
18,026
12,1135, 913
15, 5692,457
18, 806
13,1635,642
16,0032,802
16,6132,781
194
2,4719,420
204826638
80
277,657
19, 775
12, 7607,016
16,7023,073
16, 7672,688
172
2,4629,652
186853668
85
275,337
18,613
11,3197,294
15, 7522,861
16,2962,592
255
2,4139,319
16786360284
270,205
19,066
11, 8037,263
16,1492,917
16,2322,472
2,3499,522
155800583
83
267,136
18, 780
12,4856,295
16,0092,771
16, 2302,422
371
2,4539,509
14568956180
268,601
18,981
12,9945,988
16, 0142,968
16,0452,403
304
2,4749,395
149680565
76
265, 765
19, 766
13,9885,778
16, 5823,184
16,6542,401
432
2,5209,764
160736567
73
271,444
18, 702
13, 3035,400
15,8322,870
16,2382,483
358
2,5269,345
17472755273
270, 233
19,226
13,4535,773
16,3182,908
16,4602,547
373
2,5029,401
19377559376
270,931
19,153
13,4545,699
16, 2652,889
16,4772,685
242
2,5479,315
207791
273, 362
19,830
13, 6246,206
16, 8003,031
16, 9442,896
224
2,6429,481
220696 I708
78
279,633 I
• 20,28Q
• 13,822' 6, 457
17,384' 2, 895
r Revised. ° Less than 500 bushels. i December 1 estimate. 2 No quotation. ^Unpublished revisions for January-May 1943 are available on request.J Revisions have been made in the data for 1941 and 1942 for the indicated series on oils and oil-seeds- revisions are available on request.§ For July 1941-June 1942 revisions, see February 1943 Survey, p. S-23; minor revisions, July-December 1942, are available on request.c?1 For 1943 revisions for total electric power production sec p. S-24 of the January 1945 issue; January-October 1943 revisions for the detail are available on request. A small amount
o f electricity produced by electric railways and electrified steam railroads, included through December 1944, is excluded thereafter.Digitized for FRASER http://fraser.stlouisfed.org/ Federal Reserve Bank of St. Louis
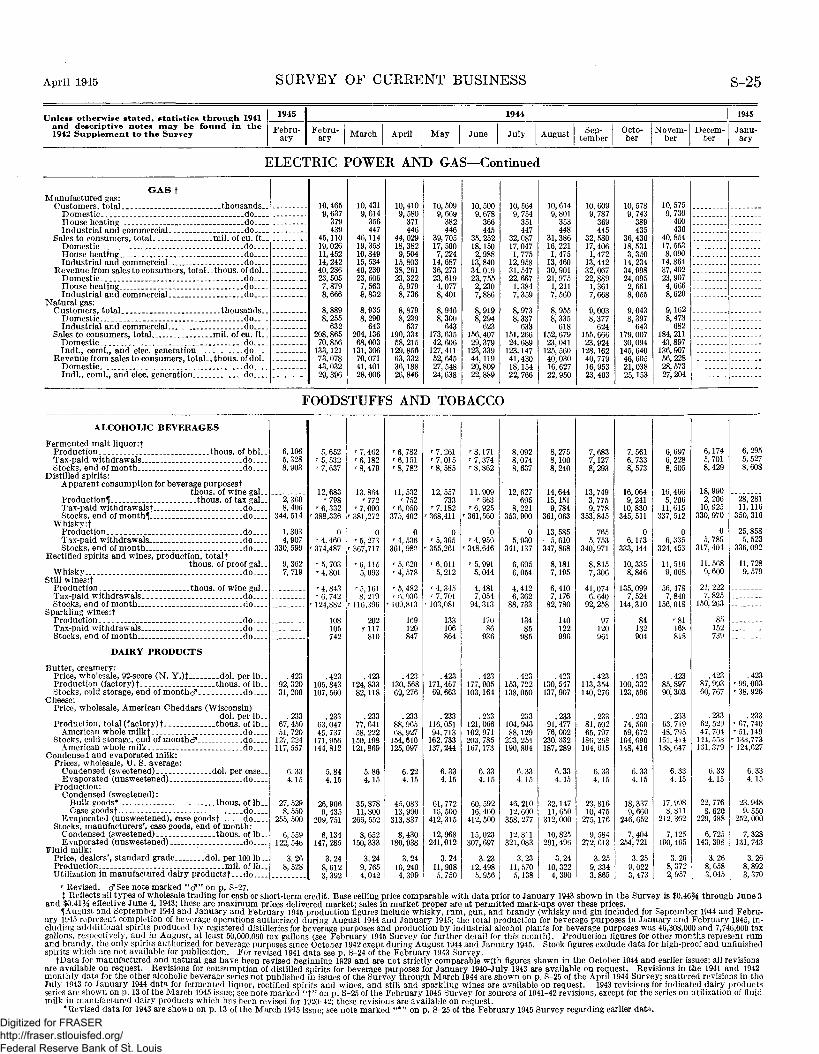
April 1945 SURVEY OF CURRENT BUSINESS S-25
and descriptive notes may be found in the1942 Supplement to the Survey
1945
Febru-ary
1944
Febru-ary March April May June July August Sep-
temberOcto-
berNovem-
berDecem-
ber
1945
Janu-ary
ELECTRIC POWER AND GAS—Continued
GASfManufactured gas:
Customers, total ._.thousands._Domestic doHouse heating doIndustrial and commercial do.___
Sales to consumers, total mil. of cu. ft_.Domestic doHouse heating doIndustrial and commercial. do
Revenue from sales to consumers, total..thous. of dol_.Domestic doHouse heating doIndustrial and commercial do
Natural gas:Customers, total _. .thousands..
Domestic doIndustrial and commercial do
Sales to consumers, total ...mil. of cu. ft_.Domestic doIndl., coml., and elec. generation do
Revenue from sales to consumers, total-.thous. of dol..Domestic doIndl., coml., and elec. generation do
10, 4659,637379439
45,11019,02611,45214, 24240, 28623, 5057,879
8,8898, 255632
208, 86570, 856133,12173,07843,03229, 396
I
10,4319,614356447
46,11419, 35810, 84915, 53440, 23023,6067,5638,832
8,9358,290643
204,13668, 003131,30670,07141,40128,006
10,4109,580371446
44,02918,3829,50415,80338, 26123, 3225,9798,736
8,8798,239637
190, 33458, 215129,85663, 33236,18826,846
10, 5099,669382446
39, 70517, 5007,22414,68736, 27323, 6194,0778,401
8,9468,300643
173, 63542, 606127,41152,64527, 54824, 638
10, 5009,678366445
35, 25218,1502,98813,84034.01923,7552,2307,886
8,9198,294623
156, 40729, 379123,33944,11920,80922,889
10, 5649,754
351447
32, 08717,0471,775
12,95831, 54722,6671,3847,359
8,9738,337
633151,26624,689
123,14741,43018,15422, 766
10,6149, 801
353448
31, 386. 16, 221
1,47513, 46030,90121,975
1,2117,560
8,9558,335
618152, 67923,041
125, 56040,03016, 62722,950
10, 6099,787
369445
32, 58017, 4061,472
13,44232, 06722,889
1,3617,668
9,0038,377
624155, 66623,924
128,16240,77916,95323,403
10, 5789,743389435
36, 43018, 5313,35014, 23434,99824, 0952,6618,055
9,0438,397643
179,00730,094145, 64046, 60521,03825,153
10, 5759,736
400430
40,85417, 5538,090
14,86437,40223, 9074,6668,620
9,1628,478
682184, 21143,897
136,90756, 22828,57327,204
FOODSTUFFS AND TOBACCO
ALCOHOLIC BEVERAGES
Fermented malt liquor:|Production thous. of bbl_Tax-paid withdrawals do . . .Stocks, end of month do . . .
Distilled spirits:Apparent consumption for beverage purposes!
thous. of wine gal.Productionf._ ..thous. of tax gal.Tax-paid withdrawals! do . . .Stocks, end of months. do . . .
Whisky :fProduction do . . .Tax-paid withdrawals do . . .Stocks, end of month do . . .
Rectified spirits and wines, production, total!thous. of proof gal.
Whisky do . . .Still wines:f
Production thous. of wine gaLTax-paid withdrawals do . . .Stocks, end of month __ do. . .
Sparkling wines:fProduction do . . .Tax-paid withdrawals do . . .Stocks, end of month do__.
DAIRY PRODUCTS
Butter, creamery:Price, wholesale, 92-score (N. Y.)t dol. per lb._Production (factory)! thous. of lb_.Stocks, cold storage, end of monthc" do
Cheese:Price, wholesale, American Cheddars (Wisconsin)
dol. per lb_.Production, total (factory)! thous. of lb._
American whole milkf doStocks, cold storage, end of monthcf do
American whole milk doCondensed and evaporated milk:
Prices, wholesale, U. S. average:Condensed (sweetened) dol. per case..Evaporated (unsweetened) do
Production:Condensed (sweetened):
Bulk goods* thous. of lb._Case goodsf do
Evaporated (unsweetened), case goodsf doStocks, manufacturers', case goods, end of month:
Condensed (sweetened). thous. of lb . .Evaporated (unsweetened) do
Fluid milk:Price, dealers', standard grade. dol. per 100 lb._Production mil. of lb._Utilization in manufactured dairy products!---do
6,1065,328
2,3608,406
344, 514
1,3034, 907
330, 599
9,3627,719
.42392, 32031, 200
.23367, 45051, 720
127, 224117, 557
6.334.15
27, 5298,550
255, 500
6, 559122, 546
3.268,528
5, 652' 5, 532' 7,637
12,683'798
' 6,332r 388,336
0' 4. 460
' 374,487
' 5. 703' 4,801
' 4, 843r 6,742
' 124,882
108105742
.423105, 843107, 560
.23363, 04745, 737
171, 956144, 812
5.844.15
26,9069,435
209,751
6,134147, 285
3.248,6123,392
'• 7.462'"6,182'• 8,479
13.864'772
'• 7,090' 381,272
0r 5, 273
' 367,717
'•6,1155,093
' 5, 1618,219
' 116,396
202r 117
810
.423124, 83382,118
.23377, 64158, 222
150,198121,869
5.864.15
35,87811,800
266, 552
8,652150, 333
3.249,7654,042
' 6, 782'6,151' 8, 782
11,532' 752
' 6,050375, 402
0' 4,536
361, 980
' 5,620' 4, 578
' 5, 482' 6, 936
'-109,813
169120847
.423130, 56869, 276
.23388, 96568, 927
154,610125,097
6.224.15
45,08313,990
313,837
8,430180, 938
3.2410, 2404,399
' 7, 261'7,015' 8,585
12, 557733
' 7,182368,411
0' 5, 365355,261
f 6,0115,212
' 4, 345'7,701103,081
133106864
.423171, 46769, 663
.233116,051
94, 713162, 733137,244
6.334.15
61,77216, 500
412,315
12,968241,012
3.2411,9085.750
'8,171r 7, 374' 8, 862
11.909'663
' 6, 925361,560
0' 4,950348,646
' 5,9915,044
4,4817, 054
94, 313
17086
936
.423177,905103,164
.233121, 066102, 971203, 785167,173
6.334.15
60, 59216, 400
412, 500
15,023307,697
3.2312, 4985,956
8,0928,0748,637
12,627695
8,221353,900
05,930
341,137
6,6956,054
4,4126,362
88, 733
13485
985
.423153, 722138, 050
233104,94688,129
223. 254190,804
6.334.15
46, 21012, 600
358, 277
12,811321, 083
3.2311, 5705,138
8,2758,1008,240
14,64415,1519,784
361,063
13, 585• 5,610347, 868
8,1817,195
6,4107,176
82, 780
140122996
.423130, 547137,907
.23391,47776, 002
230, 332187,289
6.334.15
32,14711,650
312,000
10, 825291, 496
3.2410, 3224,390
7,6837,1278,293
13, 7493,7759,778
353,845
7655,753
340,971
8,8157,306
41,0746,640
92, 258
97120961
.423113, 354140,276
.23381, 50265, 797
186,208164,615
6.334.15
23,81610,475
275,176
9,584272, 613
3.259,3343,865
7,5616,7338,573
16, 0649,241
10, 830345, 511
06,113
333,144
10, 3358,846
135, 0997,524
144, 310
84132904
.423100, 332123, 596
.23374, 56059,672
164, 690148,416
6.334.15
18,3379,660
246, 652
7,404254, 721
3.259,0223,473
6,6976,2288,505
16, 4665,206
11,615337, 512
06, 335
324, 453
11,5169,668
56, 4787,840
156, 018
'81168818
.42385, 89790, 303
.23363,71948, 795
151,414138, 647
6.334.15
17, 9988,811
212, 362
7,125190, 465
3.268,372
6,1745,7018,429
18, 9902,206
10, 925330, 970
05,789
317, 404
11,5689,600
21, 2227,825
150, 263
85152739
.42387, 99360, 767
.23362, 52947, 704
144, 553131,379
6.334.15
22, 7768,620
229, 488
6,725143, 308
3.268,6583,045
6,2955,5278,608
28, 28111,116
350, 316
25,8585,523
336,092
11, 7289,579
.423' 99,003r 38, 926
.233' 67, 740'51,149
' 133,773' 124,627
6.334.15
23, 9489,550
252, 000
7,328131, 743
3.268,8923,370
r Revised. d*See note marked "cf" on p. S-27.t Reflects all types of wholesale trading for cash or short-term credit. Base ceiling price comparable with data prior to January 1943 shown in the Survey is $0.4654 through June 3
and $0.41% effective June 4, 1943; these are maximum prices delivered market; sales in market proper are at permitted mark-ups over these prices.1 August and September 1944 and January and February 1945 production figures include whisky, rum, gun, and brandy (whisky and gin included for September 1944 and Febru.
ary 1945 represent completion of beverage operations authorized during August 1944 and January 1945; the total production for beverage purposes in January and February 1945, in-cluding addditional spirits produced by registered distilleries for beverage purposes and production by industrial alcohol plants for beverage purposes was 46,308,000 and 7,746,000 taxgallons, respectively, and in August, at least 50,000,000 tax gallons (see February 1945 Survey for further detail for this month). Production figures for other months represent rumand brandy, the only spirits authorized for beverage purposes since October 1942 exept during August 1944 and January 1945. Stock figures exclude data for high-proof and unfinishedspirits which are not available for publication. For revised 1941 data see p. S-24 of the February 1943 Survey.
fData for manufactured and natural gas have been revised beginning 1929 and are not strictly comparable with figures shown in the October 1944 and earlier issues; all revisionsare available on request. Revisions for consumption of distilled spirits for beverage purposes for January 1940-July 1943 are available on request. Revisions in the 1941 and 1942monthly data for the other alcoholic beverage series not published in issues of the Survey through March 1944 are shown on p S25 of the April 1944 Survey; scattered revisions in the
se p e; sec note marked i on p. S25 of the February 1945 Survey for somilk in manufactured dairy products which has been revised for 1920-42; these revisions are available on request.
* Revised data for 1943 are shown on p. 13 of the March 1945 issue; see note marked "*" on p. S-25 of the February 1945 Survey regarding earlier data.
Digitized for FRASER http://fraser.stlouisfed.org/ Federal Reserve Bank of St. Louis
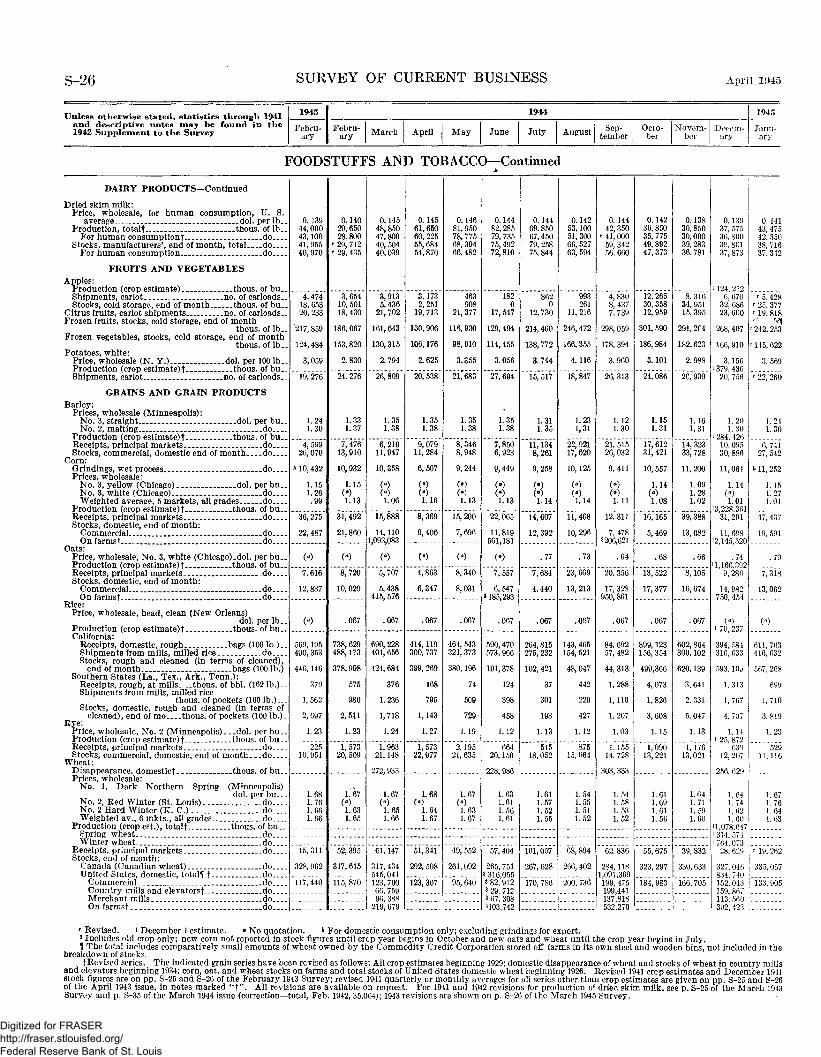
S-26 SURVEY OF CURRENT BUSINESS April 1945
Unless otherwise stated, statistics through 1941and descriptive notes may be found in the1942 Supplement to the Survey
1945
Febru-ary
1944
Febru-ary March April May June July August Sep-
temberOcto-ber
Novem-ber
Decem-ary
1945
Janu-ary
FOODSTUFFS AND TOBACCO—Continued
DAIRY PRODUCTS—Continued
Dried skim milk:Price, wholesale, for human consumption, U. S.
average ___ .dol. per lb_.Production, totalt thous. of lb_.
For human consumption!-. . doStocks, manufacturers', end of month, total do
For human consumption do
FRUITS AND VEGETABLESApples:
Production (crop estimate) . . .thous. of bu_.Shipments, carlot no. of carloads..Stocks, cold storage, end of month thous. of bu_.
Citrus fruits, carlot shipments no. of carloads..Frozen fruits, stocks, cold storage, end of month
tbous. of lb_.Frozen vegetables, stocks, cold storage, end of month
thous. of lb..Potatoes, white:
Price, wholesale (N. Y.) dol. per 1001b..Production (crop estimated thous. of bu_.Shipments, carlot __.no. of carloads..
GRAINS AND GRAIN PRODUCTSBarley:
Prices, wholesale (Minneapolis):No. 3, straight _ _ dol. per bu_.No. 2, malting _ do
Production (crop estimate)! thous. of bu..Receipts, principal markets.. doStocks, commercial, domestic end of month do
Corn:Grindings, wet process _ doPrices, wholesale:
No. 3, yellow (Chicago) _ dol. perbu. .No. 3, white (Chicago) do . . . .Weighted average, 5 markets, all grades _do
Production (crop estimate)! thous. of bu_.Receipts, principal markets _ doStocks, domestic, end of month:
Commercial . doOnfarmsf do
Oats:Price, wholesale, No. 3, white (Chicago) _dol. per bu_.Production (crop estimate)! thous. of bu..Receipts, principal markets doStocks, domestic, end of month:
Commercial.. ..doOn farms!-- _ do
Rice:Price, wholesale, head, clean (New Orleans)
dol. per lb. .Production (crop estimate)! thous. of bu_.California:
Receipts, domestic, rough bags (1001b.)..Shipments from mills, milled rice doStocks, rough and cleaned (in terms of cleaned),
end of month .bags (100 lb.).Southern States (La., Tex., Ark., Tenn.):
Receipts, rough, at mills..-.thous. of bbl. (1621b.)..Shipments from mills, milled rice
thous. of pockets (100 lb.)---Stocks, domestic, rough and cleaned (in terms of
cleaned), end of mo thous. of pockets (100 lb.)_Rye:
Price, wholesale, No. 2 (Minneapolis)...dol. per bu..Production (crop estimate)! thous. of bu. .Receipts, principal markets .doStocks, commercial, domestic, end of month do
Wheat:Disappearance, domestic! thous. of bu..Prices, wholesale:
No. 1, Dark Northern Spring (Minneapolis)dol. per bu__.
No. 2, Red Winter (St. Louis) .do . . . .No. 2 Hard Winter (K. C.) do . . . .Weighted av., 6 mkts., all grades. do
Production (crop est.), total!.._ thous. of bu__Spring wheat doWinter wheat .do
Receipts, principal markets doStocks, end of month:
Canada (Canadian wheat) _ doUnited States, domestic, totals ! - . . .do
Commercial doCountry mills and elevators! doMerchant mills doO n farms! do
0.13944,00043,10041,95540,970
4,47418, 65320, 233
'217, 859
124,484
3,059
"19,276
1.241.30
4,59926,070
* 10,432
1.151.26
36,275
22,487
(a)
"7,~616"
12, 837
(a)
569,195490, 353
446,146
379
1,562
2,697
1.23
22510,951
1.681.761.661.66
15, 311
328, 962
Ii7~446
0.14029,65028,80029, 71229. 435
3,65410, 50118,430
186, 067
153,820
2.830
24. 276
1.331.37
7,47613,910
10,932
1.15(°)1.13
31,492
21,860
C)
~~8~726'
10, 029
.067
738, 629488,173
378,998
575
980
2,511
1.23
1,57320, 509
1.65
52, 395
317, 615
115,870
0.14548,85047, 80040, 50440, 039
3,9135.436
21, 702
161, 643
130,315
2.794
1.351.38
6,21011,947
10, 358
1.06
157888"
14,1101,093,083
5,707
5, 438415, 576
.067
690, 228401, 656
424, 684
376
1,236
1,718
1.24
1,96321,148
272, 933
1.67()1.651.66
61,147
317, 434545,041123, 70066, 75996, 388
! 219,679
0.14561,65060, 22555,68454,870
3.1732,251
19, 713
130,906
106,176
2.625
20, 538
1.351.38
9,07911, 284
6,507
81.168,369
9,406
C)4,863
6,347
.067
414,119300, 737
399, 269
168
795
1,143
1.27
1,57322,977
1.68))1.641.67
51, 341
292, 508
123, 307
0.14681,95078, 77568, 39466,482
463908
21, 377
116,930
98,910
3.355
21, 683
1.351.38
8,3468,948
9,244
1.1315, 200
7,696
C)8,340
8,031
.067
464, 543321, 373
380,196
74
509
729
1.19
2,19521, 635
1.67()1.631.67
49, 552
261, 092
95, 640
0.14482,28579, 73575,49272,810
1820
17, 517
129,494
114,455
3.056
27,694
1.351.38
7,8506,923
9,449
()1.13
22,065
11,819561,181
7557
6,5473185,293
.067
590,470573,966
191,378
124
458
1.12
66420,150
228, 986
1.631.611.561.61
57, 404
265, 7513 316,0553 82,9123 29, 7123 67, 3083103,742
0.14469,85067,45079, 25875, 844
8620
12,730
214,460
138,772
3.744
15, 517
1.311.35
11,1348,261
9,258
C)(•)1.14
14,607
12,392
.77
77684
4,440
.067
264,815275, 232
102,421
37
301
193
1.13
51518,052
1.611.571.521.55
101,057
267, 628
170, 786
0.14253,10051, 30066, 52763, 594
993261
11,216
246,472
166,355
4.116
18, 847
1.231,31
22, 92117,620
10,125
()C)1.14
11, 468
10, 296
.73
23,669
13, 213
.067
143, 465154, 521
48,047
442
220
427
1.12
87515, 664
1.541.551.511.52
68, 894
266, 402
200, 736
0. 14442, 350• 41,00059, 34256. 660
4,8308,4377,739
298, 059
178, 394
3.960
26, 313
1.121.30
21,51526,032
9,411
()C)1.11
12,311
7,4783206,621
.64
20, 356
17, 328950,861
.067
84, 69257, 482
44, 313
1,288
1,110
1,207
1.03
1,15514, 728
303,333
1.541.581.531.52
62, 836
284,1181,091,369199, 475199,441137,818532,270
0.14236, 85035, 77549, 89247,373
12, 26530, 35812, 959
301, 590
186,984
3.101
24,086
1.151.31
17, 61231,421
10, 557
1.14
1.08
16,165
5,469
13,522
17, 377
.067
899,123156, 354
499,366
4,073
1,826
3,608
1.15
1,09013, 221
1.611.691.611.56
55, 675
323, 297
184, €
0.13830,85030,00039, 28336,781
8,31634, 95115, 395
291, 2C4
182,623
2.988
20, 939
1.161.31
14,32333, 728
11, 200
1.091.281.02
39, 388
13,682
8,105
16, 674
.067
602,864300,102
620,139
3,641
2,331
5,047
1.13
1,17613,021
1.641.711.591.60
39, 832
330,633
166, 705
0.13937, 57536, 80039, 80137, 873
6, 67032, 68623, 600
268, 407
166,910
3.156379,43620, 756
1.201.30
284. 42610, 095
30, 886
11,064
1.14(a)
1.013,228,36131,291
11,698'2,145,520
1,166,3929,280
14,982750, 454
(a)
70, 237
394, 584316, 633
593, 10J
1,313
1,767
4,707
1. 141 25, 87263()12, 207
256, 629
1.641.741.621. 60
1,078,647
0. 14143, 47542, 35038, 71637, 342
r 5, 428r 25, 377' 19, 818
-- -m242,253
145, 622
3. 569
^227266
1.241.30
6,74127, 542
& 11, 252
1.151.271.01
47, 437
19, 591
.79
"77318
13,062
611,763416, 632
567, 268
699
1,710
3,819
1.23
52911,116
1.671.761.641.63
1314,57464, 07328, 629 T 19, 262
327,046 I 335,057834,740152,043 ! 133,905159,867 !113,560 i392,423 ••
r Revised. 1 December 1 estimate. « No quotation. * For domestic consumption only; excluding grindings for export.3 Includes old crop only; new corn not reported in stock figures until crop year begins in October and new oats and wheat until the crop year begins in July.1 The total includes comparatively small amounts of wheat owned by the Commodity Credit Corporation stored off farms in its own steel and wooden bins, not included in the
breakdown of stocks.!Revised series. The indicated grain series have been revised as follows: All crop estimates beginning 1929; domestic disappearance of wheat and stocks of wheat in country mills
and elevators beginning 1934; corn,, oat, and wheat stocks on farms and total stocks of United States domestic wheat beginning 1926. Revised 1941 crop estimates and December 1941stock figures are on pp. S-25 and S-26 of the February 1943 Survey; revised 1941 quarterly or monthly averages for all series other than crop estimates are given on pp. S-25 and S-2of the April 1943 issue, in notes marked " ! ' \ All revisions are available on request. For 1941 and 1942 revisions for production of dried skim milk, see p. S-25 of the March 194Survey and p. S-35 of the March 1944 issue (correction—total, Feb. 1942, 35,064); 1943 revisions are shown on p. S-26 of the March 1945 Survey.
-261943
Digitized for FRASER http://fraser.stlouisfed.org/ Federal Reserve Bank of St. Louis
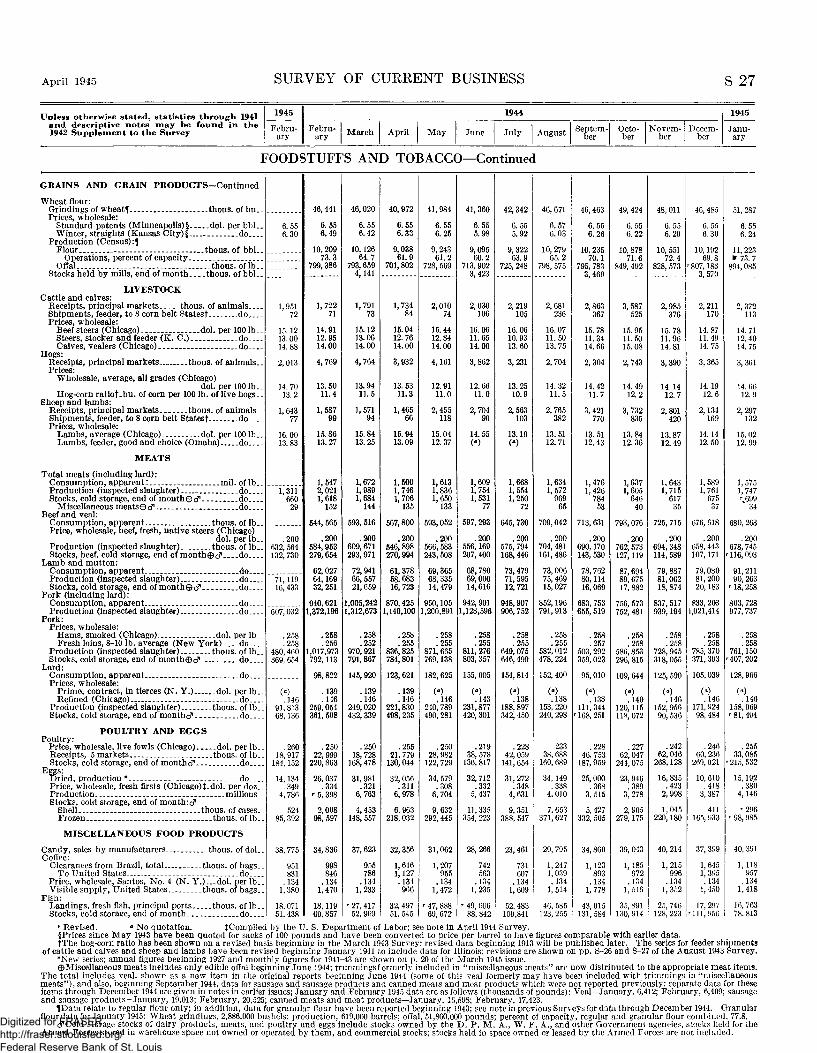
April 1945 SURVEY OF CURRENT BUSINESS S-27
Unless otherwise stated, statistics through 1941and descriptive notes may be found in the1942 Supplement to the Survey
1945
Febru-ary
1944
Febru-ary- March April May June July August Septem-
berOcto-ber
Novem-ber
Decem-ber
1945
Janu-ary
FOODSTUFFS AND TOBACCO—Continued
GRAINS AND GRAIN PRODUCTS—Continued
Wheat flour:Grindings of wheats thous. of bu.Prices, wholesale:
Standard patents (Minneapolis)! dol. per bbl_.Winter, straights (Kansas City)§ do.. . .
Production (Census) :̂Flour .__ thous. of bbl..
Operations, percent of capacityOffal thous. of lb.
Stocks held by mills, end of month thous. of bbl..
LIVESTOCKCattle and calves:
Receipts, principal markets thous. of animalsShipments, feeder, to 8 corn belt Statesf ..doPrices, wholesale:
Beef steers (Chicago) dol. per 1001b..Steers, stocker and feeder (K. C.) . .doCalves, vealers (Chicago) do
Receipts, principal markets thous. of animals..Prices:
Wholesale, average, all grades (Chicago)dol. per 1001b..
Hog-corn ratiof-bu. of corn per 100 lb. of live hogs..Sheep and lambs:
Receipts, principal markets thous. of animals..Shipments, feeder, to 8 corn belt Statesf doPrices, wholesale:
Lambs, average (Chicago)- dol. per 1001b..Lambs, feeder, good and choice (Omaha) do
MEATS
Total meats (including lard):Consumption, apparent: mil. of lb_.Production (inspected slaughter) .doStocks, cold storage, end of month©^ do
Miscellaneous meats©^ - doBeef and veal:
Consumption, apparent thous. of lb..Price, wholesale, beef, fresh, native steers (Chicago)
dol. per lb..Production (inspected slaughter).. .thous. of lb..Stocks, beef, cold storage, end of month©cf do
Lamb and mutton:Consumption, apparent. doProduction (inspected slaughter) doStocks, cold storage, end of month©cf do
Pork (including lard):Consumption, apparent doProduction (inspected slaughter) .do
Pork:Prices, wholesale:
Hams, smoked (Chicago) ..dol. per lb.Fresh loins, 8-10 lb. average (New York) do . . .
Production (inspected slaughter) thous. of lb..Stocks, cold storage, end of month©^. do . . .
Lard:Consumption, apparent do . . .Prices, wholesale:
Prime, contract, in tierces (N. Y.) dol. per lb.Refmed (Chicago) do . . .
Production (inspected slaughter) thous. of lb.Stocks, cold storage, end of month cf1. .do- . .
POULTRY AND EGGSPoultry:
Price, wholesale, live fowls (Chicago) .dol. per lb.Receipts, 5 markets thous. of lb.Stocks, cold storage, end of monthcf .do . . .
Eggs:Dried, production * do . . .Price, wholesale, fresh firsts (Chicago) X- dol. per doz.Production .millions.Stocks, cold storage, end of m o n t h s
Shell _..thous. of cases.Frozen thous. of lb.
MISCELLANEOUS FOOD PRODUCTS
Candy, sales by manufacturers thous. of dol..Coffee:
Clearances from Brazil, total thous. of bags..To United States do
Price, wholesale, Santos, No. 4 (N. Y,)...dol. per lb . .Visible supply, United States. . . . thous. of bags..
Fish:Landings, fresh fish, principal ports thous. of lb . .Stocks, cold storage, end of month. do
6.556.30
1,95172
15.1213.0014.88
2,013
14.7013.2
1,64377
16.0013.83
1,311660
29
.200632, 564132,730
71,11916,433
607,032
.258
.258480,460369, 654
(a)
.14691,81368,136
.26018,917
184,152
14,134.349
4,786
52485, 392
38, 775
951831
.1341,380
46,441
6.556.49
10,20973.3
1,72271
14.9112.9514.00
4,769
13.5011.4
1,587
15.8613.27
1,5472,0211,618
152
544, 565
.200584,953279,654
62,02764,16932,251
940,6211,372,196
.258
.2561,017,973792,113
98,822
.139
.146259,054361, 508
.25022,999
220,863
26,037.334
r 5, 398
2,00898, 597
34,836
846.134
1,470
18,071 18,11951, 438 69, 857
46,020
6.556.42
10,12664.7
793, 6594,141
1,79173
15.1213.0614.00
4,764
13.9411.5
1,57194
15.8413.25
1,6721,9891,684
144
593, 516
.200609,671293,971
72,94166, 55721,659
1,005,2421,312,673
.258
.252970, 921791,867
145, 920
.139
.146249,020432, 339
.25018, 728
168,478
31,981.321
6,763
4,453148, 557
37,623
955786
.1341,233
--27,41752, 969
40, 972
6.556.33
9,03861.9
701,802
1,73484
15.0412.7614.00
3,932
13.5311.3
1,46566
15.9413.09
1,5001,7461,706
135
567,800
.200546,898270,994
61,37858,68316, 723
870,4251,140,100
.258
.255836,825784,801
123, 621
.139
.146221,830498, 235
.25521, 779
130,044
32, 056.311
6,978
6,963218,032
32, 356
1,6161,127.134966
32, 49751, 545
41,984
6.556.25
9,24361.2
728, 569
2,01074
15.4412.8414.00
4,161
12.9111.0
2,455118
15.0412.37
1,6131,8361,650
133
593,052
.200566, 583243,508
69,36568,33514,479
950,1051,200,891
.258
.255871,665769,138
182, 625
(°).146
240,789490,281
.25028,982
122, 729
34, 579.308
6,704
9,632292,445
31,062
1,207955
.1341,472
' 47, 88869, 672
41,360
6.555.98
9,09560.2
713,9023,423
2,030106
16.0611.6514.00
3,862
12.6611.0
2,70490
14.55
1,6091,7541,531
77
597,293
.200556,169207,400
68,78069,00014,616
942, 9011,128,596
.258
.255811, 276803, 357
155,005
().143
231,877420, 301
.21938, 578130, 817
32, 712.3325,437
11,335354, 223
28, 266
742563.1341,235
' 49, 60688,842
2,219105
16.0610.9313.60
3,231
13.2510.9
2,563103
13.19
1,6681,5541,250
72
645,730
.200575, 794168,446
73,47971, 59512, 721
948,907906, 752
.258
.255649,075646, 499
154, 814
C).138
188,897342, 450
.22842, 059141, 654
31, 272.3484,631
9,351388, 547
23,461
731607.1341,609
52, 483109,841
2,681236
16.0711.5013.75
2,704
14.3211.5
2,765382
13.5112.71
1,6341,57296965
709,042
.200704, 481161,486
73,00675, 46915,027
852,196791,913
.258
.255582, 012478, 224
152, 400
().138
153, 220240, 298
23338, 688160, 689
34,149.3384,010
7,653371,627
29, 795
1,2471,039.1341,514
46, 585123,255
46, 463
6.556.26
10, 23570.1
795, 7833,469
367
15.7811.3414.66
2,304
14.4211.7
3,421770
13.5112.43
1,4761,42678453
713, 631
.200690,170143, 530
78, 76280,11416, 069
683, 753655, 519
.258
.257503, 292359, 023
95, 010
C).138
111,344168,251
.22846, 753187,959
25,000.3683,515
5,427332, 505
34,860
1,123893.1341,778
43, 015131, 584
3, 587525
15.9511.5015.08
2,743
14.4912.2
3,732835
13.8412.36
1,6371,60564640
793,076
.200762, 573127,119
87, 69489, 67517, 882
756, 573752, 481
.258
.258586,853296,815
109, 644
().140
120,115118,072
.22762, 047244,075
23,946.3893,278
2, 905279,175
39, 043
1,185972.1341, 516
35, 891130,914
2,985376
15.7811.9614.81
3,390
14.1412.7
2,801420
13.8712.49
1,6431,715
61735
725,715
.200694,348114, 589
79,88781,06218,874
837, 517939,194
.258
.258728, 945318,055
125, 590
( ).146
152,95690, 536
.24262,046
268,128
16,835.423
2,998
1,045220,180
40, 214
1,215996
.1341,352
25, 746128,223
51, 287
6.556.24
11, 223* 73. 7
894,085
2,211170
14.8711.4914.75
3,365
14.1912.6
2,134169
14.1412.50
1,5891,761
67537
676, 618
.200658, 443107,171
79,08081,20020,183
833, 2681,021,414
.258
.258785, 370371, 393
105,039
C).146
171,92498,484
.24660, 236
269,021
10,610.418
3,387
411165, 933
37, 399
1,6451, 395.134
1,450
17,297 16,763111, 956 78, 813
2,372113
14.7112. 4014.75
3,361
14. 6612.9
2,297132
15.0212.99
1,5751,747rw699
34
680, 263
.200678, 745116,093
91,21190,263
r 18, 258
803,728977,737
.258
.258761,150
•407,202
128,966
(a)
.146158,069' 81, 494
.25533, 085
215,532
15,192.380
4,146
' 296r 98,985
40, 391
1,118957
.1341,418
' Revised. a No quotation. ^Compiled by the U. S. Department of Labor; see note in April 1944 Survey.§Prices since May 1943 have been quoted for sacks of 100 pounds and have been converted to price per barrel to have figures comparable with earlier data.fThe hog-eorn ratio has been shown on a revised basis beginning in the March 1943 Survey; revised data beginning 1913 will be published later. The series for feeder shipments
of cattle and calves and sheep and lambs have been revised beginning January 1941 to include data for Illinois; revisions are shown on pp. S-26 and S-27 of the August 1943 Survey.•New series; annual figures beginning 1927 and monthly figures for 1941-43 are shown on p. 20 of the March 1945 issue.©Miscellaneous meats includes only edible offal beginning June 1944; trimmings formerly included in "miscellaneous meats" are now distributed to the appropriate meat items.
The total includes veal, shown as a new item in the original reports beginning June 1944 (some of this veal formerly may have been included with trimmings in "miscellaneousmeats"), and also, beginning September 1944, data for sausage and sausage products and canned meats and meat products which were not reported previously; separate data for theseitems through December 1944 are given in notes in earlier issues; January and February 1945 data are as follows (thousands of pounds): Veal—January, 6,412; February, 6,409; sausageand sausage products—January, 19,013; February, 20,525; canned meats and meat products—January, 16,598; February, 17,423.
^Data relate to regular flour only; in addition, data for granular flour have been reported beginning 1943; see note in previous Surveys for data through December 1944. Granularflour data for January 1945: Wheat grindings, 2,886,000 bushels; production, 619,000 barrels; offal, 51,860,000 pounds; percent of capacity, regular and granular flour combined, 77.8.
cf Cold storage stocks of dairy products, meats, and poultry and eggs include stocks owned by the D. P. M. A., W. F. A., and other Government agencies, stocks held for theArmed Forces stored in warehouse space not owned or operated by them, and commercial stocks; stocks held in space owned or leased by the Armed Forces are not included.
Digitized for FRASER http://fraser.stlouisfed.org/ Federal Reserve Bank of St. Louis

S-28 SURVEY OF CURRENT BUSINESS April 1945
Unless otherwise stated, statistics through 1941and descriptive notes may be found in the1942 Supplement to the Survey
1945
Febru-ary
1944
Febru-ary March April May June July August Sep-
tember October
1945
Novem- Decem- Janu-ber ber i ary
FOODSTUFFS AND TOBACCO—Continued
MISCELLANEOUS FOOD PRODUCTS—Con.
Sugar:Cuban stocks, raw, end of month §
thous. of Span. tons...United States, deliveries and supply (raw value):*
Deliveries, total short tons - -For domestic consumption doFor export ---do
Production, domestic, and receipts:Entries from off-shore areas, total -do
From Cuba doFrom Puerto Rico and Hawaii— -doOther do
Production, domestic cane and beet doStocks, raw and refined do
Price, refined, granulated, New York:Retail dol. pe r lb . .Wholesale do
Leaf:TOBACCO
Production (crop estimate) mil. of lb..Stocks, dealers and manufacturers, total, end of
quarter.. _ .mil. of lb _.Domestic:
Cigar leaf.. doFire-cured and dark air-cured doFlue-cured and light air-cured -doMiscellaneous domestic. do
Foreign grown:Cigar leaf . -doCigarette tobacco do
Manufactured products:Consumption (tax-paid withdrawals):
Small cigarettes millions..Large cigars thousandsMfd. tobacco and snuff thous. of lb
Prices, wholesale (list price, composite):Cigarettes, f. o. b., destination dol. per 1,000..
Production, manufactured tobacco, total.-thous. of lb . .Fine-cut chewing do.Plug . do_Scrap, chewing do.Smoking do.Snuff -..do.Twist
1,386
496, 818473, 23923, 579
392,680340, 75238, 69813, 230
16, 673388, 62925,089
6,006
1, 580
•502,088•454.73147,357
342,127219,148107, 857' 15,12217, 441
1,436,889
.066,055
17,425388,95521, 339
6.00622, 288
3194,8594,1198,8453,649
2,480
586, 629549, 67136,958
439, 292301,821137, 216
25513, 455
1,294,536
.055
3,052
370275
2,3172
2859
19,956419,29122,002
6.00622, 922
3405,4954,1968,3803,923
588
3,097
524,064494,78829,276
493,084389,108103,936
409,087
1,336,492
.066
.055
3,164
588, 968544,40844,560
673, 458465,193207,1371,1284,001
1,347,503
.066
.055
18,778362, 40320,036
6.00620,903
3114,7063,6828,3523,338514
21,065399. 99223,968
6.00624,862
3655,2174,32310, 7203,675561
2,945
686. 001654,59231, 409
638,100418,773219, 206
1217,702
1,287,717
.066
.055
2,702
360253
1,9912
2768
21,166384,17123, 350
6.00623,848
3715,4064,5089,8353,199531
2,666
760, 031743, 81516, 216
437, 600270,188159,8217, 5914,377
972, 577
.066
.055
20, 278352,13121, 338
6.00622, 853
2884,6834,18710, 0923,122480 •
2,392
748, 282737, 66510, 617
489, 798273,140208,8087,85010,003
715, 572
.066
.055
22, 305418,20526,971
6.00627,978
3745,4965,04713, 2903,207564
2,181
662,419653, 5688,851
378, 550282, 04488, 3868,12049, 873464, 564
.066
.054
2,731
323231
2,0852
2465
20, 021391, 49225, 335
6.00626, 364
3494,8904,40712, 9443,231543
1,913
649, 792640,7069,086
455, 075376,11072,1726,793
391, 506642,165
.064
.054
19. 771411, 89428, 793
6.00630, 637
3485,3655,01515, 4913,809610
1,027
592, 731580,18612, 545
417,485353, 65657,0366,793
605, 5151,054,005
20, 554446, 32530,729
6.00632,168
3705,6874,72016, 9733,850
566
1,127
615, 732589, 50726, 225
462, 960357, 39687, 54818,016
325, 7391,226,474
(a)
.054
i 1, 835
3,046
298225
2, 4362
1,130
599,417559, 159' 40, 258
471, 258439, 05527, 6784,52553,617
1,147,957
(O.054
17, 826395, 49920,017
6.00627,039 I.
341 !4,776 |4,207 I13,934 i3,281 I.499 !
20, 077379, 42027, 519
6.006
LEATHER AND PRODUCTS
HIDES AND SKINS
Livestock slaughter (Federally inspected):Calves thous. of animals..Cattle doHogs doSheep and lambs do
Prices, wholesale (Chicago):Hides, packers', heavy, native steers dol. per lb_.Calfskins, packers', 8 to 15 lb . do
LEATHERProduction:
Calf and kip thous of skinsCattle hide .._ . . . thous. of hidesGoat and kid thous. of skins..Sheep and lamb.. ._. .^ . d o
Prices, wholesale:Sole, oak, bends (Boston)f dol. per lbChrome, calf, B grade, black, composite.dol. per sq. ft_
Stocks of cattle hides and leather, end of month:Total thous. of equiv. hides
Leather, in process and finished . doHides, raw. do
LEATHER MANUFACTURES
Boots and shoes:tProduction, total ~. thous of pairs
Athletic— doAll fabric (satin, canvas, etc.) - doPart fabric and part leather doHigh and low cut, leather, total do
Government shoes.. _ . . . . doCivilian shoes:
Boys' arid youths' doInfants' doMisses'and children's doMen's doWomen's. do
Slippers and moccasins for housewear doAll other footwear do
4421,1493,2671, 5C0
.155
.218
9252,3982,094
.440
.529
12, 0697,0645,005
4411,0437,3801,501
.155
.218
829r 2,057r 2,929
4,997
.440
.529
10, 6676,2864,381
38,047173
5,996840
26,4403,755
1, 6152,1982,7565,994
10,1234,045
552
5651,0577,1651.538
.155
.218
9262,2083,3234,867
.440
.529
10, 9546,3034,651
42, 212206
7,059940
28, 9623,924
1,5082,4783,3876,516
11,1494,475
570
555939
6,2901,378
.155
.218
8652,0832,6764,527
.440
.529
10,7086,3444,364
36, 854203
6,2251,093
24, 6353,564
1,3682,2002,9885,3049,2114,179
518
541989
6,6431,694
.155
.218
9522,2153,1324,564
.440
.529
10, 6746,4174,257
39,648198
7,0661,459
25,9034,189
1,3542,3043,0245,4999,5324,383
640
5941,0036,0951,823
.155
.218
9982,2333,1584,322
.440
.529
10,4136.3904,023
40, 682222
7,1841,355
26,8524,307
1,4052,4193,0625,7959,8634,542
528
6341,0794,7951,898
.155
.218
8022,0202,7113,765
.440
.529
10, 6686,7173,951
31, 774174
4,732995
21,6873,697
1,0512,0252,5624,4637,8883,870
316
7561,3394,1451,924
.155
.218
1,0292,2402,9014,807
.440
.529
10,8576,7904,067
41, 464217
6,0731,257
27, 4354,738
1,2602,6663,1535,373
10, 2456,162
320
7531,3103,5212,003
.155
.218
9402,1982, 7354,328
.440
.529
10, 9126,9114,001
38, 786209
5,0611,047
26, 2624,474
1,3232,4832,9745,0789,9305,936
271
9201,4514.2232,238
.155
.218
1,0062,2082,9004,520
.440
.529
11,1496,9334,216
40, 760256
4,604873
27, 8614,815
1, 3362,7283,1635,421
10, 3986,899
266
8741,3365,2582,013
.155
.218
9482,2742,7944,529
.440
.529
11,4097,0194,390
39, 507240
4,386762
26, 8294,671
1 3352,6762,9835,3469,8186,936
353
6691,2755, 6631,934
. 155
.218
8792,1582,465
r 4, 117
.440
.529
11, 6437,0504,593
35, 758227
4,483612
25,0004,385
1,1572,4182,8625,0429,1295,079
363
5601,2845 2992,073
. 155
.218
r 957r 2, 395
2.5434,427
440.529
r 11,978r 7,057r 4, 921
r Revised. i December 1 estimate. ° Not available.§ For data for December 1941-July 1942, see note marked " § " on p. S-28 of the November 1943 Survey.JData for June to December 1943 were revised in the August 1944 Survey; revisions for January-May 1943 are available on request.*The new series on sugar are compiled by the U. S. Department of Agriculture and replace the series on meltings and stocks at 8 ports shown in the Survey through the July
1944 issue; data are compiled from reports by cane sugar refiners, beet sugar processors, importers of direct consumption sugar, and continental cane sugar mills. Data representboth raw and refined sugar in terms of raw sugar. Data beginning 1934 will be published later.
t Revised series. The price series for sole oak leather is shown on a revised basis beginning with the October 1942 Survey; revisions beginning July 1933 are available on request.
Digitized for FRASER http://fraser.stlouisfed.org/ Federal Reserve Bank of St. Louis

April 1945 SURVEY OF CURRENT BUSINESS S-29
Unlessand1942
otherwise stated, statisticsdescriptive notes may beSupplement to the Survey
throughfound in
1941t h e
1945
Febru-ary
Febru-ary
LUMBER
March
AND
1944
April May June July
MANUFACTURES
August Sep- Itembcr
Octo-ber
Novem-ber
Decem-ber
1945
Janu-ary
LUMBER—ALL TYPES
National Lumber Manufacturers Assn.:!Production, total _mil. bd. ft-
Hardwoods do.-_Softwoods _do_-_
Shipments, total do . . .Hardwoods do..-Softwoods do . . .
Stocks, gross, end of month, total do . . .Hardwoods _ .do . . .Softwoods -do. . .
PLYWOOD AND VENEER
Hardwood plywood, production:*Cold press thous. of sq. ft,, measured by glue line-Hot press _ do . . .
Hardwood veneer:*Production thous. of sq.ft., surface area.Shipments and consumption in own plants do . . .Stocks, end of month .do . . .
Softwood plywood:*Production thous. of sq. ft., $£" equivalent.Shipments . . . d o . . .Stocks, end of month. do . . .
FLOORING
Maple, beech, and birch:Orders, new M bd. ft.Orders, unfilled, end of month do . . .Production do . . .Shipments.. . . . d o . . .Stocks, end of month do . . .
Oak:Orders, new _ do . . .Orders, unfilled, end of month .do . . .Production . do . . .Shipments do . . .Stocks, end of month _ do._.
SOFTWOODS
Douglas fir, prices, wholesale:Dimension, No. 1, common, 2 x 4—16
dol. per M bd. ft.Flooring, B and better, F. G., 1 x 4, R. L do . . .
Southern pine:Orders, new! —mil. bd. ft.Orders, unfilled, end of month!... doPrices, wholesale, composite:
Boards, No. 2 common, 1" x 6" and 8"fdol. per M bd. ft.
Flooring, B and better, F. G., 1 x 4f . . . do - - .Production! mil. bd. ft.Shipmentsf . .doStocks, end of month! do
Western pine:Orders, newf.. _ doOrders, unfilled, end of month! doPrice, wholesale, Ponderosa, boards, No. 3 common,
1" x 8" dol. per M bd. ft..Production! mil. bd. ft..Shipments! doStocks, end of monthf do
West coast woods:Orders, newf doOrders, unfilled, end of monthf doProduction! doShipments! _ .doStocks, end of month .do
Redwood, California:Orders, new M bd. ft..Orders, unfilled, end of month doProduction doShipments . .doStocks, end of month do
FURNITURE
All districts, plant operations percent of normal..Grand Rapids district:
Orders:Canceled percent of new orders..New no. of days' production..Unfilled, end of month.. . do
Plant operations -percent of normal..Shipments no. of days' production..
3,6758,5503,1002,8752,900
16, 38238, 24815,65615, 9574,696
33.81044.100
952
()585593
1,180
346362
34.73305368852
614993596614432
36, 49794,15531,05733, 03768, 566
' 2,413'544
' 1,869' 2,594'651
' 1,943' 4,075' 1,039' 3,036
155, 26777,855
763, 928762, 799515, 224
121,735118,02334,187
4,9009,0003,3503,4002,950
20,16229, 47714,02214,0847,334
33.81044.100
••6561,073
37. 63653.699
' 6 3 1'639
1,333
'429' 4 3 1
34.60' 318'405' 8 6 1
'7501,073'719'698
491
40, 063158, 09434, 61634, 22266, 558
60
' 2, 659'590
' 2,069' 2, 835'626
' 2, 209' 3, 932' 1,012' 2,920
169, 21081,568
839, 480847, 519516,806
136, 783137, 66932, 776
8,8503,5003,8002,650
13,65827, 26316,47915,8736,902
33.81044.100
'7471,111
39. 23454. 313'686'7091,310
'493'461
34.60'397'464'794
'8251,083'762'814460
47, 202166, 70740, 36536, 63670, 687
58
' 2, 654'571
' 2,083' 2, 756'631
' 2,125' 3, 845'961
' 2,884
149, 45568,540
746,102754,003513, 291
124,168125, 50630, 215
3,3608,8003,2603,5002,350
13, 23423, 94013,90514,8165,991
33.81044.100
'6391,047
41. 39455. 233'670'7031,277
'526'515
34.66'443'473'764
'7941,134'753'735485
32, 442161, 20837, 65336,85468, 759
58
' 2, 972'589
' 2, 383' 2, 911'687
' 2, 224' 3, 732'884
' 2, 848
157,06170,438
785,759789,832525,483
126, 798128,15730,131
3,2507,7004,0003,3003,050
16,28221,87616,43817,4914,938
34. 79044.100
'654
41. 39455. 233'737'7551,259
'564'529
34.91'612'552'824
'5851,073'788'678414
28, 724151,44741, 39039, 30168,128
56
' 2, 730'591
' 2,139' 2, 869'602
' 2, 267' 3, 794'881
' 2,913
153,63671,625
817,392805,604542,463
129,821132,16727,367
3,6507,3503,9503,9503,150
13,01019,42415,11615,4624,736
34. 79044.100
••749970
41.17255. 233'704'7251,238
'568'514
34.77'646'583
'6731,057'561'718440
38,162146, 60740,18137,81866,682
57
' 2, 740'652
' 2,088' 2,668'562
' 2,106' 3,880'958
' 2,922
144, 27666,828
766, 521774,719568,019
98, 76294, 76730,804
3,5507,8253,6503,0503,725
19, 39725,68713, 36113,1344,963
34. 79044.100
'712
41.17255. 233'702'7461,194
'524'502
34.70'612'538
'5461,006'567'594439
19, 305111,51832,48536, 21162, 216
54
' 3,107'735
' 2, 372' 2, 893'567
' 2,326' 4,051' 1,090' 2, 961
167,18480, 604
844,009850,483589,154
133,616132, 27430, 910
3,8257,8004,0753,0754,500
27,10732,19615, 94218, 2814,075
34.79044.100
'734887
41.17255. 233'742'7831,153
'578'468
34.64'685'613
' 1,033
'7841,075'704'692449
38, 51099, 79341,16138, 20259, 043
58
' 2,682'581
' 2,101' 2, 575'536
' 2,039' 4,185' 1,125' 3,060
154, 29268,671
758, 512778, 558592,612
124,989126,60630,487
2,7257,0753,7753,7754,750
17.63537| 16915, 79016,4644,095
34.30044.100
'634873
41.17255.480'654'6481,159
557504
34.52'573'521
' 1, 085
'6401,070'652'654482
34,653101,12139, 09234, 90162, 521
57
' 2, 686'598
' 2,088' 2, 617'571
' 2,046' 4, 241' 1,143' 3,098
153,16371,533
785,800808,669601,127
127,368126, 71731,351
3,9C06,5003,7754,3754,325
17,64436,84317,13517,9703,791
33.81044.100
'664876
'6611,164
496475
34.71'556'526
' 1,115
'604983
'652'656478
31, 20877,85140, 74735,34863, 521
58
' 2,429'544
' 1,885' 2, 455'558
' 1, 897' 4,177' 1,105' 3, 072
147, 50571, 762
762,116786,856603,668
127,192127,37131, 080
4,6757,3003,3754,0503,650
17,10036, 55417, 54717, 3893,949
33.81044.100
'545
41.172(2)'644'6121,196
417420
34.62'413472
1,057
'602926
'633'624475
26, 33070, 47837, 26533,04966,123
56
25
' 2,170'484
' 1, 686' 2, 267'490
' 1, 777' 4, 031r 1, 030' 3, 001
r 138,915' 65,652
'667,067'707,387'598,447
112, 028114, 774' 28, 268
3,6506,9253,3753,6503,325
15,13536, 92115, 41814, 7164,456
33. 81044.100
'668
41.172(2)'559'5681,187
378
34.61'367428997
'529884
'589'600470
29, 63170,18629, 56228, 87174, 311
53
2,133'3741,759' 2,373'522
'1,851' 4,037' 1,082' 2, 955
157,88179, 720
828,874869,833598,138
126,886123,96530,952
4,6257,9253,5253,6502,900
16, 75537,82316, 63015, 9055,197
33. 81044.100
676
)650649
1,188
394383
34.42306388915
735982638623495
53, 79590, 79734,53533, 51272,074
54
425845017
' Revised.*New series. The plywood and veneer series are from the Bureau of the Census and are practically complete. Data beginning September 1941 for softwood plywood are shown
on p. 16 of the September 1944 Survey; data beginning August 1942 and September 1942, respectively, for hardwood plywood and veneer are published on p. 14 of the November 1944issue.
t Revised series. Data for the indicated lumber series as published in the 1942 Supplement and in the statistical section of the monthly Survey prior to the present issue have beenrevised as follows: Total lumber stocks, total softwood stocks, and Southern pine stocks and unfilled orders beginning 1929; hardwood stocks, beginning 1937; Western pine new orders,unfilled orders and stocks beginning 1942; West Coast woods new orders, production, and shipments beginning 1938, and all other series beginning 1941. The revisions reflect largelyadjustment of the monthly series to 1941-43 annual data collected by the Bureau of the Census. Revisions through 1939 for total lumber stocks and total softwood and hardwoodstocks and through 1941 for other series are available in a special table on pp. 27 and 28 of the March 1943 Survey except that 798,000,000 should be added to the published stock figuresfor total lumber, total softwoods and Southern pine, and 111,000,000 to Southern pine unfilled orders (these additions are to carry back a revision to include data for concentrationyards); all revisions are available on request. The Census for 1942 and 1943 included many mills in the Eastern States not previously canvassed; this affects the comparability ofcurrent statistics with those for years prior to 1942 for Southern pine and for total lumber, total softwoods, and total hardwoods. U. S. Forest Service estimates of total lumber pro-duction for 1939-41, based on census data adjusted for incomplete coverage, and census total for 1942 are shown in the table on p. 22 of the February 1945 issue (revisions for 1943 and1944 totals in that table, 34,289 and 32,554, respectively. The revised price series for Southern pine each represents a composite of 9 series; for comparable data beginning August 1942see note at bottom of p. S-35 of the June 1944 issue.
Digitized for FRASER http://fraser.stlouisfed.org/ Federal Reserve Bank of St. Louis

S-30 SURVEY OF CURRENT BUSINESS April 1945
Unless otherwise stated, statistics through 1941and descriptive notes may be found in the1942 Supplement to the Survey
1945
Febru-ary
1944
Febru-ary March April May June July August Sep-
temberOcto-ber
Novem-ber
Decem-ber
1945
Janu-ary
METALS AND MANUFACTURES
5,0482,8832,1654,1731,4452,728
6,9830
30, 88926, 4454,444
791,395
97,15383, 74278, 788
4,911
23.5024.1724. 004,945
1,447
112,726170,35054, 55055, 01411,272
210, 18239, 121157,17625, 267
r 7, 204'89
. 026934.00. 021018. 75
1, 569
1, 8371,809
70
2,4171, 1743, 029
477
4, 940451506743199843109118259237348
.0358
97.362.3200. 3
r Revised. 1 Beginning 1943 data cover virtually the entire industry. ©Designated ''tin plate" prior to the July 1944 Survey but included terneplate.(^Beginning July 1944 the coverage of the industry is virtually complete,; the coverage was about 97-98 percent for September 1942-June 1944 and 93 percent prior thereto.§ Beginning; January 1945, percent of capacity is calculated on annual capacity as of Jan. 1, 1945, of 95,501.4*0 tons of open-hearth, Bessemer, and electric steel ingots and steel for
castings; clatn for July-December 1944 are based on capacity as of July 1, 1944 (94,050,750 tons) and earlier 1944 data on capacity as of Jan. 1, 1944 (93,648,490 tons).X Of the 99 manufacturers on the reporting list for Jan.l, 1942, 30 have discontinued shipments or these products for the duration of the war.• Beginning 1944 data represent net shipments (total shipments less shipments to members of the industry for further conversion) instead of net production for sale outside the
industry, as formerly. For 1912 data, except for April, see the October 1942 and July 1943 Surveys; for April data see note at bottom of p. S-31 in the September 1943 issue.* New series. For a description of the series on scrap iron and steel and pig iron consumption and stocks and 1939-40 data, see note marked "*" on p. S-29 of the November 1942
Survey; later data are available on p. S 30 of the April 1942 and subsequent issues. The new series on pig iron production is from the American Iron and Steel Institute and is approxi-mately comparable with data from the Iron Age in the 1942 Supplement (data in the Supplement are in short tons instead of long tons as indicated); see p. S-30 of the May 1943 Surveyfor further information on this series and data for 1941-42. The new pig iron price, f.'o. b. Neville Island, replaces the Pittsburgh price, delivered, shown in the Survey prior to theApril 1943 issue. For data beginning January 1942 on aluminum production see p. 24, table 6, of the June 1944 Survey. Data for aluminum fabricated products cover total shipmentsof castings, forgings, sheet, strip, plate, rods, bar, and other shapes, and are available beginning January 1942; data for gray iron castings are based on reports of foundries accountingfor about 98 percent of the total tonnage of the gray iron castings industry for January-November 1943 and 93 percent thereafter. Both series are from the War Production Board.
IRON AND STEELIron and Steel Scrap
Consumption, total* thons. of short tonsHome scrap*.Purchased scrap*
Stocks, consumers', end of monthHome scrap*Purchased scrap*
Iron OreLake Superior district:
Consumption by furnaces
dodo
total* dododo
thous. of lonsr tonsShipments from upper lake ports doStocks, end of month, total do
At furnacesOn Lake Erie docks
Pig Iron and Iron MCastings, gray iron, shipments*-Castings, malleable:tf1
Orders, new, netProductionShipments _. _
Pig iron:Consumption* . .Prices, wholesale:
Basic (valley furnace)Composite . . _
do.- do -
anufacturesshort tons
. . dodo
. . . do .
thous. of short tons
dol. per long ton. _ _ do
Foundry, No 2 Neville Islap^* ^ n
Production* thous. of short tonsStocks (consumers' and suppliers'), end of month*
t.hnns nf short. tnn<3Boilers, range, galvanized:
Orders, new, netOrders, unfilled, end of monthProduction ._ _.ShipmentsStocks, end of month
number of boilersdo
. dododo
Steel, Crude and SemimanufacturedCastings, steel, commercial:
Orders, new, total, net--- short tons-.Railway specialties fin
Production, totalRailwav specialties _
Steel ingots and steel for castingsProduction
Percent of capacity§-..Prices, wholesale:
Composite, finished steel
do. . do
thous. of short tons
dnT. DPT l hSteel billets, rerolling (Pittsburgh). ..dol. per long ton.Structural steel (Pittsburgh) . _ dol. ner lbSteel scrap (Chicago) dnl ner lnnsr ton
U. S. Steel Corporation, shipments of finished steelproducts. thous. of short tons
Steel, Manufactured ProductsBarrels and drums, steel, heavy types:^
Orders, unfilled, end of month _ thousandsProductionShipmentsStocks, end of month
Boilers, steel, new orders :AreaQuantity
. dododo
- thous. of sq.ft.-nnmhfirPorcelain enameled products, shipmentsX thous. of dol__
Spring washers, shipments doSteel products, production for sale:*
Total thnns nf «shnrt. tonsMerchant barsPipe and tubePlates- . . . _RailsSheets.-. ._Strip—Cold rolled
Hot rolledStructural shapes, heavy
. dodo
. . do-do
. . _ dodododn
Tip plate and terneplate© doWire and wire products dn
NONFERROUS METALS
Aluminum:Price, wholesale, scrap casting*Production:*
Primary -Secondarv recovery
Aluminum fabricated products,
AND PRODUCTS
3(N. Y.)-dol. perlb..
mil. of lbdo
shipments* -do
6,3710
24, 57720, 815
3, 761
79, 91378, 38575, 220
24.0024.7124. 504,563
6,65891
.027134. 00.021018.75
1, 562
7, 2511,6841, 698
51
1, 1391,0262,743
419
.0375
91.3
4,9442,8382,1065,5801,6133,967
7,2070
28,91024,3574,553
764,369
79,35274, 81273, 231
4,996
23.5024.1724.005,083
1,658
78,82578, 98280.51688,57320,867
173, 59227, 244
161,35927, 488
7,18897
.026534.00.021018.75
1,756
4,532'1,8541,862
52
1,005662
2,722376
5,208530483
1.07421675486
116337194349
.0462
148.8'47.4206.7
5,4063,0892,3175,4351,5983,837
7,6590
21, 33317, 6583,675
828,648
90,03881, 48081,215
5,378
23.5024.1724.005,434
1,650
83, 35976, 64982, 06685, 69217, 241
162,57536, 202
174,62630, 760
7,82099
.026534.00.021018.75
1,875
3,1791,9071,917
44
779703
3,046408
5,616554515
1,164226831
96133357223379
.0445
160.459.3
232.2
5,1852,9762,2095,3101,5603,780
7,2735,288
17, 89214, 9852,907
757,880
88,16969,82069, 360
5,161
23.5024.1724.005,243
1,636
62, 82867, 59374, 36571, 88419, 722
175,05344,140
155, 77827,822
7.58S99
.026534.00.021018.75
1, 757
3,3831,6101,610
41
853602
2,754350
5,211508496
1,07319776889
115319216347
.0425
155.660.9
'218.3
5,2452,9882,2575,3691,6073,762
7,55812,11421, 47418, 3563,117
790, 674
92, 28570, 55572, 279
5,218
23. 5024.1724.005,343
1,658
69, 56068,10666,10769,04716, 782
176,99337,807
161, 78329,974
7,69797
.026534.00.021018.75
1, 777
3, 4321,5391,531
49
1,155849
2,664379
5,313533521
1,042220790
97115318231369
.0425
152.959.9
r 221. 2
4,9952,8642,1315,3761,6133,763
7,11211,97526, 65523, 2893,366
763, 459
103,69270, 99371, 758
4,960
23.5024.1724.005.057
1,663
57, 96666, 27254, 90359,80011,885
181, 81628,147
157, 44430, 309
7,22994
.026534.00.021018.75
1,738
3,7671,5091, 518
40
1,608839
2,868382
5,164512504
1,01019276897
119298256363
.0425
132.855.9
187.9
4,9542.8642,0905,3431,5923,751
7,37212,90932,06928, 2373,832
689, 744
106, 62661, 32061,704
5,062
23.5024.1724.005,157
1,649
61,09969,63259,41657, 73913, 562
169,92119, 248
131,94024, 756
7,49394
.026534.00.021018.75
1,755
3,6491,4391,427
51
1,122728
2,870319
5,08249850696920176388
117300246337
.0425
135.1r 53.5199.6
5,0772,9312,1465,4441,6703,774
7,34212, 28837, 24332, 7274,516
778, 205
71,30774, 29770,172
5,159
23.5024.1724.005,210
1, 639
68, 00980, 69658,15456, 94514, 771
171, 30929,921
154,91131, 864
7,49394
.026534.00.021018.75
1,743
5,2761,6111,619
43
1,6491,0703, 152
361
5,159510518858195839
95121298238377
.0420
123.355.9
223.6
5,0082,8902,1185,3701,7153,655
6,95011, 32941, 94336,6845,259
744,954
49, 50274, 62872,821
4,893
23.5024.1724.004,988
1,617
51, 28876, 43254, 58955, 55213, 808
129, 84714,371
144,45827, 660
7,23094
.026534.00.021018.69
1,734
6,6661,3941,390
47
831757
3, 060347
5,157497510936214828
97121311204360
.0362
94.947.0
211.2
5,2463, 0992,1475,0801, 6353,445
7,32010, 59545. 34339, 5465,797
780, 453
76, 53680, 50576,882
5,108
23.5024.1724.005,200
1,590
74, 08583, 63769, 38966, 88016. 317
146,11616, 173
150, 71928, 949
7,61696
. 026534.00.021016.90
1,775
6,8241, 5751,565
57
904692
3,302383
5,184471501957214841
98127306205369
.0327
96.843.4
199.2
5,0702,9992,0714,7911,5283, 263
6,8834,672
44, 72239,2495,473
760,383
48,14979, 62977, 528
4,887
23.5024.1724.004,904
1,536
71,16391,61663, 02263,18416, 253
120, 66720, 937
146,41126,939
7,27494
.026534.00.021017.00
1,744
6,7421,6591, 665
52
914699
3,155414
5,161499512900204833100121312202354
.0317
88.948.0
' 208. 2
5, 0252,8842,1414,4251,4532,972
7,0900
37, 82432, 883
4, 941
741, 534
69, 97276,18776, 831
4, 959
23. 5024.1724. 004, 999
1, 492
76, 249112.638
52, 08956, 60611, 736
138, cm30, 259
144,16225, 680
7,-36193
. 026534. 00.021018. 69
1, 768
6, 7471,5841,594
41
925538
2,818464
4, 965474503819209802103113302234342
1
.0312
93.7M6.3165.1
Digitized for FRASER http://fraser.stlouisfed.org/ Federal Reserve Bank of St. Louis
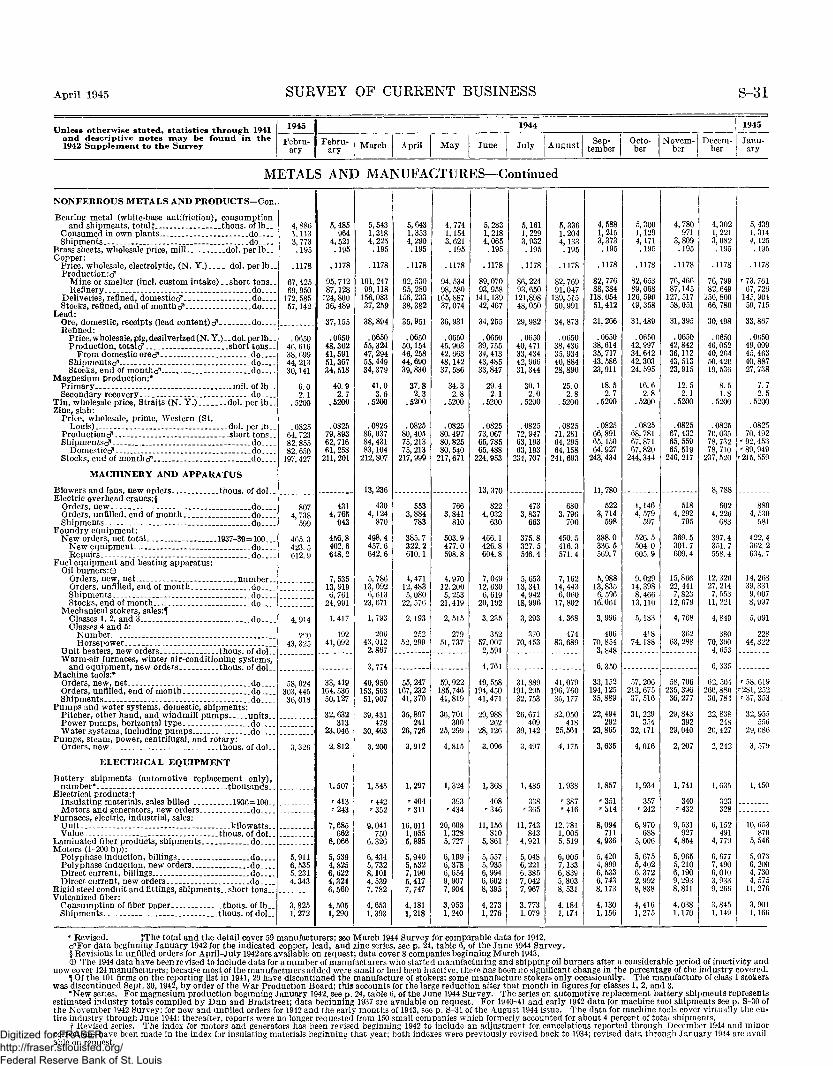
April 1945 SURVEY OF CURRENT BUSINESS S-31
Unless otherwise stated, statistics through 1941and descriptive notes may be found in the1942 Supplement to the Survey
1945
Febru-ary
1944
Febru-ary March April May June July August Sep-
temberOcto-ber
Novem-ber
Decem-ber
1945
Janu-ary
METALS AND MANUFACTURES—Continued
NONFERROUS METALS AND PRODUCTS-Con.
Bearing metal (white-base antifriction), consumptionand shipments, totalf thous. of lb_.
Consumed in own plants doShipments - do
Brass sheets, wholesale price, mill dol. per lb._Copper:
Price, wholesale, electrolytic, (N. Y.) dol. per lb.Production:^
Mine or smelter (incl. custom intake)__short tons..Refinery .do
Deliveries, refined, domesticcf _ . . .doStocks, refined, end of monthcf do
Lead:Ore, domestic, receipts (lead content) cf doRefined:
Price, wholesale, pig, desilverized(N.Y.)--dol. per lb_.Production, totalcf. . . . .short tons..
From domestic ore<f doShipmentscf— doStocks, end of monthcf do
Magnesium production:*Primary mil. of lb_.Secondary recovery. do
Tin, wholesale price, Straits (N. Y.)__ dol. per lb..Zinc, slab:
Price, wholesale, prime, Western (St.Louis) _ -dol. per lb..
Productioncf .short tons..Shipmpntscf . . .do
Domesticcf-- doStocks, end of monthcf do
MACHINERY AND APPARATUS
Blowers and fans, new orders ..thous. of dol..Electric overhead cranes: §
Orders, new doOrders, unfilled, end of month doShipments do
Foundry equipment:New orders, net total 1937-39=100...
New equipment. .doRepairs do
Fuel equipment and heating apparatus:Oil burners:©
Orders, new, net number..Orders, unfilled, end of month doShipments doStocks, end of month „ _do
Mechanical stokers, sales:^Classes 1, 2, and 3 . . . do . . .Classes 4 and 5:
NumberHorsepower. _ __
Unit heaters, new orders thous. of dol..Warm-air furnaces, winter air-conditioning systems,
and equipment, new orders thous. of dol_.Machine tools:*
Orders, new, net doOrders, unfilled, end of month doShipments do
Pumps and water systems, domestic, shipments:Pitcher, other hand, and windmill pumps units..Power pumps, horizontal t ype . . . doWater systems, including pumps. . . do
Pumps, steam, power, centrifugal, and rotary:Orders, new thous. of dol_.
ELECTRICAL EQUIPMENT
Battery shipments (automotive replacement only),number* thousands..
Electrical products :fInsulating materials, sales billed 1936=100..Motors and generators, new orders. do
Furnaces, electric, industrial, sales:Unit ..kilowatts..Value ._ thous. of dol..
Laminated fiber products, shipments doMotors (1-200 hp):
Polyphase induction, billings doPolyphase induction, new orders doDirect current, billings.. doDirect current, new orders do
Rigid steel conduit and fittings, shipments..short tons..Vulcanized fiber:
Consumption of fiber paper -thous. of lb._Shipments thous. of doL.
4,8861,1133,773.195
.1178
67, 42569, 950172. 58557,142
.065046, 61638, 69944, 21330,141
6.02.1
.5200
.082564, 72382, 85582, 650197, 427
8074,738
465. 3423.5612.9
4,914
22043, 325
58,024303,44536,018
3,326
5,9116,5355,2314,343
3,8251,272
5,485964
4,521.195
.1178
95, 71287,128
124,80036,489
37,155
.065048,30241,59151,36734,518
40.92.7
.5200
. 082579,89362,71661, 258211,201
4314,765943
456.8402.6648.2
7,53513, 9196,761
24,991
1,417
19241, 092
33, 419164, 53650,127
32, 632313
23,046
2,812
1.507
"•413' 243
7,685662
6,066
5,5394,8256,6224,3246,560
4,5051,290
5, 5431,3184, 225.195
. 1178
101, 24799,118156,08337,259
38,894
.065055, 32447,29455,44934, 379
41.03.6
.5200
.082586,03784,43183,104212,807
13, 236
4304,124870
498.4457.6642.6
5,78613,0926,613
23, 671
1, 793
20643, 0122,867
3, 774
40,950153, 56351,907
39, 431478
30,463
3,206
1,545
••442"352
9,041750
6,326
6,4345,7328,1014,5397,782
4,6531,393
5,6431,3534,290.195
.1178
92, 53095,280156,23338,382
35,951
.065050,15446, 25844,69039,830
37.82.3
.5200
.082580,40575, 21375,213217,999
5533,884
783
385.7322.2610.1
4,47112, 483.5, 080
22, 576
2,193
25252,299
55, 247167, 23241,370
35,897241
26, 726
3,912
1,297
' 404'311
16,0111,0555,895
5,9405,5327,1905,4177,747
4,1811,218
4,7741,1543,621.195
.1178
94, 53498,580165,88737,074
36,931
.065045, 90342, 66348,14237, 586
34.32.8
.5200
.082580, 49780,82580, 540
217,671
7663,841
810
503.9477.0598.8
4,97012,200
5, 25321,419
2,515
27951, 737
59,922185,74641,819
36, 701300
25, 299
4,815
1,324
393••434
20, 6081,3285,727
6,1996,3786,6549,9077,904
3,9531,240
5,2831,2184,065.195
.1178
89, 07093,958141,13942,467
34,255
. 065039, 75534, 41343,48533, 847
29.42.1
.5200
.082573,06765, 78565, 488
224, 953
13, 370
8224,032630
466.1426.8604.8
7,04912,6306,619
20,192
3,235
35257, 0072,591
4,761
49, 558194, 45041,471
29, 988262
28,126
3,096
1,368
408'346
11,156810
5,861
5,5575,9356,9946,6028,395
4,2731,276
5,1611,2293,932.195
. 1178
86,22493, 650121,89848,050
29,982
.065040,47133, 43442, 96631, 344
30.12.0
.5200
.082572, 94763,19363,193
234, 707
4733,837
663
375.8327.5546.4
5,65313, 3414,942
18, 996
3,293
37070, 453
31, 889191,29532, 753
26,671409
30,142
3,497
1,485
338••365
11, 743843
4,921
5,0486,2216,3857,0427,967
3, 7731,079
5,3361,2044,133.195
.1178
82, 76991,047139,51550,991
34, 873
.065038, 43635, 93440, 88428, 890
25.02.8
.5200
.082571, 28164, 29564,158
241,693
6803.796
700
450.5416.3571. 4
7,16214,4436,060
17,802
4,368
474
41,079196, 76035,177
32,050418
25,561
4,175
1,938
r387••416
12, 7811,0055,519
6,0057,1336.8395,8038,531
4,1841,174
4,5881,2153,373.195
.1178
82, 77688, 384118,05451,412
31, 266
.065038,61435, 71743,58623,911
18.52.7
.5200
.082566,89165,15064,927243, 434
11, 780
5223,714598
388.0336.5569.7
5,98813,8356,59616,061
3,996
40670, 8543,848
6,350
33,152194,12535,889
22,494292
23, 865
3,635
1,857
'351'314
8,094711
4,936
5,4204,8996,5336,7438.173
4,1301,156
5,3001,1294,171.195
.1178
82, 65389, 068126. 59049, 358
31, 489
.065042, 99734, 64242, 30324, 595
16.62.8
.5200
.082568, 78167, 87167, 820244,344
1,1464,579597
526.5504.0605.9
9,02914,3988,46613,110
5,183
41874,188
57, 206213, 67537, 516
31, 229354
32,171
4, 016
1,934
357••242
6,970688
5,006
5,6755,4026,3722,9928,838
4,4161,275
4,780971
3,809.195
.1178
76,46687,145127, 51758,051
31,395
.065042, 84236,11243, 51323,915
12.52.1
.5200
.082567, 43265, 55965,519246, 217
5184,292795
369.5301.7609.4
15,86622, 4417,82312, 679
4,768
36263, 288
58, 706235, 39636, 277
29, 843392
29, 040
2,207
1,741
340'432
9, 531927
4,854
5,9655,2106,1909,2938,811
4,0381,170
4,3021,2213,082.195
.1178
76, 79982,649156,80066, 780
30,498
.065046,05240, 26450, 42019, 536
8.51.8
.5200
.082570, 03578, 73278, 710237, 520
8,788
6024, 226683
397.4351. 7558.4
12, 32627, 2147, 55311, 221
4,849
38070, 3904, 653
6, 335
62, 504260, 88036, 784
22, 838248
20, 427
2,242
1, 635
323328
6,152491
4,779
6,6777,4906,0103,9339, 266
3,8451,149
5,4391,3144,125.195
.1178
' 73, 76167, 726145, 90459, 715
33,867
.065049, 09945,46340,88727, 738
7.72.5
.5200
.082570, 492' 92,453' 89,949215,559
8894, 530581
422.4362. 2634.7
14, 26839,3319, 0078, 997
5,091
22844, 322
r 58, 619281,252r 37, 353
32, 955556
29, 086
3, 579
1,450
10, 653870
5,546
5, 0736, 2004,7304,57511,276
3,9011,166
r Revised. JThe total and the detail coyer 59 manufacturers; see March 1944 Survey for comparable data for 1942.d*For data beginning January 1942 for the indicated copper, lead, and zinc series, see p. 24, table 6, of the June 1944 Survey.§ Revisions in unfilled orders for April-July 1942 are available on request; data cover 8 companies beginning March 1943.© The 1944 data have been revised to include data for a number of manufacturers who started manufacturing and shipping oil burners after a considerable period, of inactivity and
now cover 124 manufacturers; because most of the manufacturers added were small or had been inactive, there has been no significant change in the percentage of the industry covered.1 Of the 101 firms on the reporting list in 1941, 20 have discontinued the manufacture of stokers: some manufacture stokers only occasionally. The manufacture of class 1 stokers
was discontinued Sept. 30,1942, by order of the War Production Board; this accounts for the large reduction after that month in figures for classes 1, 2, and 3.*New series. For magnesium production beginning January 1942, see p. 24, table 6, of the June 1944 Survey. The series on automotive replacement battery shipments represents
estimated industry totals compiled by Dun and Bradstreet; data beginning 1937 are available on request. For 1940-41 and early 1942 data for machine tool shipments see p. S-30 ofthe November 1942 Survey; for new and unfilled orders for 1942 and the early months of 1943, see p. S-31 of the August 1944 issue. The data for machine tools cover virtually the en-tire industry through June 1944; thereafter, reports were no longer requested from 150 small companies which formerly accounted for about 4 percent of total shipments,
f Revised series. The index for motors and generators has been revised beginning 1942 to include an adjustment for. cancelations reported through December 1944 and minorcorrections have been made in the index for insulating materials beginning that year; both indexes were previously revised back to 1934; revised data through January 1944 are available on request.
Digitized for FRASER http://fraser.stlouisfed.org/ Federal Reserve Bank of St. Louis
S-32 SURVEY OF CURRENT BUSINESS April 1945
Unless otherwise stated, statistics through 1941and descriptive notes may be found in the1942 Supplement to the Survey
1945
Febru-ary
1944
Febru-ary March April May June July August Sep-
temberOcto-ber
Novem-ber
Decem-ber
1945
Janu-ary
PAPER AND PRINTING
WOOD PULPProduction^
Total, all grades.._ short tons.Bleached sulphate _ doUnbleached sulphate do. . .Bleached sulphite.._ . . .do . . .Unbleached sulphite. do.. .Soda do.._Groundwood do.. .
Stocks, end of month:!Total, all grades _ -do...
Bleached sulphate do.. .Unbleached sulphate do.. .Bleached sulphite.. .do. . .Unbleached sulphite do. . .Soda _ .do. . .Groundwood- , .do. . .
PAPER AND PAPER PRODUCTS
All paper and paperboard mills (U. S. Bureau of theCensus) :*
Paper and paperboard production, total_.short tons..Paper _ .doPaperboard do
Paper, excl. building paper, newsprint, and paperboard(American Paper and Pulp Association):!
Orders, new. . short tons..Production _ __ ..doShipments do
Fine paper:Orders, new. doOrders, unfilled, end of month -doProduction doShipments doStocks, end of month do
Printing paper:Orders, new doOrders, unfilled, end of month doProduction _._ .doShipments doStocks, end of month .do
Wrapping paper:Orders, new. . . .doOrders, unfilled, end of month.- doProduction doShipments.. . doStocks, end of month _ do
Book paper, coated:Orders, new.. percent of stand, capacity..Production -doShipments _ -do
Book paper, uncoated:Orders, new doPrice, wholesale. " B " grade, English finish, white,
f. o. b. mill.. dol. per 100 lb__Production percent of stand, capacity..Shipments do. .
Newsprint:Canada:
Production short tonsShipments from mills do. .Stocks, at mills, end of month do..
United States:Consumption by publishers. do. .Price, rolls (N. Y.) dol. per short ton_.Production short tons..Shipments from mills doStocks, end of month:
At mills doAt publishers doIn transit to publishers .do
Paperboard (National Paperboard Association):%Orders, new doOrders, unfilled, end of month doProduction... do
Percent of capacityWaste paper, consumption and stocks:§
Consum pt ion short tons..Stocks at mills, end of month do
Paper products:Shipping containers, corrugated and solid fiber, ship-
ments* ._.mil. sq. ft. surface area..Folding paper boxes, value:*
New orders... _ 1936=100.Shipments _ do...
739, 69867,609
283, 948122,164
65, 42933, 749
124, 597
72,0905,2129,094
11, 8278,4993,598
31, 090
1,324,431639,446684,985
PRINTING
Book publication, total no. of editions..New books _. do.New editions do.
53.055.657.9
83.2
7.3079.880.7
239, 661217,220111, 668
175,06258.00
58, 22859,095
6,751259,14753, 740
620,084558, 285603,191
95
353, 704163, 918
3,813
281.0250.6
39234646
733, 89159, 964291,239117,462' 72,184r 34, 875126, 484
r 75, 3254,6667,833
r 14, 363r 10,401' 3,175r 33,132
1,379,638668,657710,981
558,442544, 233663,609
80,217140,39577, 29176,97446, 723
170,216143, 328169,853170,07757,647
217, 362201,738212,048212,44067,881
57.058.658.6
82.0
7.3082.683.1
240,005227, 387111,074
182,48758.0053,85254,033
10, 063292, 28945, 559
650,711621,875614,340
96
369, 978112,633
4,011
259.7251.4
545436109
784,05865, 7S6299, 649133, 29276, 62535, 708137, 922
78, 3744,7389,19014,8229,7212,45535, 794
1,483,085722, 973760,112
585, 763582, 739588, 385
86,972148,00788,02489,07846,885
179,222135,311173,957177,09152, 239
225, 567197, 595227,079229, 82866, 585
52.161.557.4
84.3
7.3080.781.3
252,092232,012131,154
201,70858.0061,20161,471
9,793278,20237,182
649, 058607, 537659, 555
95
403, 646112, 520
4,305
275.8271.6
496392104
750,63361,070290,633121, 50471, 71733, 233134,402
81, 8795,2657,75114, 5009,2452,06641,013
1,402,095659,976742,119
517,178530,222536,878
82,387148,18178,02081,21144,010
168, 918143,171166,017166,64952,533
199, 526199,886199,825203, 62163, 584
56.055.357.5
82.2
7.3080.181.1
236, 353256, 543110, 964
201,13658.0054,63656,103
8,326268, 64846,933
634, 593601,880626,877
96
375, 794122, 534
3,872
247.6248.4
721588133
808,98364,365319,009131,43575,92535,530139,677
91, 0525,0849,79416,1139,1831,925
46,347
1,484,667705, 821778,846
537,293569,074569,060
73,020137, 28782, 85680,35744,823
171,750140,808173, 587174,99051,208
211,055189,349221,429214,76767,002
51.352.354.4
77.5
7.3078.178.4
262,467276,05497,377
197,42758.0060,90962,319
6,916275,80950,636
695, 585599,322697, 674
411,870122, 779
4,078
258.4262.4
61052486
795,84066, 617323,855129,16573,12435, 306125, 599
88, 2043,9669,75114,13110,1262,02746,158
1,460,686688, 817771,869
i>47, 065553, 709571,676
79, 322136,94679, 70984,11540,664
158, 537128,593165,886167, 29748,600
217,062188, 679219,158225, 92162, 486
51.957.056.5
73.7
7.3079.580.0
246,864268,21376,028
191,07758.0061,10660, 648
7,374300,07046,388
635, 256544,454673,808
389,217129,777
241.2260.3
538432106
743,90469, 222308,015117, 37663,14130, 591112,241
82, 2815,350
12,8499,2462,216
41,560
1,325,711619, 392706,319
496,210493,254490,505
76,591148,93369,94169,71645,098
141,524126,368144,083143,74349,490
207,172203,499198,265192,60268,127
48.846.247.6
70.1
7.3071.171.5
244,406249,97970,455
174,86658.0059,87559, 946
7,303325, 36544, 336
645,895570,626608,458
85
344,457157,290
3,756
201.2228.4
562462100
833, 43369,071
34i; 152138, 40473, 32936, 500125, 443
72.5614,04010,70412, 3788,5361,886
32,075
,518,922717,452801,470
564, 593580,177577, 933
78, 329140, 60685, 95983,91245, 794
182,929144, 979176,434172, 54553, 495
223, 689195,112228, 416229,86764,142
53.355.753.6
80.4
7.3081.379.7
262, 695274, 70658, 444
182, 43258.00
60, 63161,217
6,717342,12246, 642
683,881549.114708, 973
96
406,115164, 211
4,316
256.4267.6
461397
775, 53064,872316,288127, 01768,16734, 211119, 011
66,6434,73410,16211,7178,9712,12226, 344
1,421,869677, 538744, 331
533,103542,887549,797
86,106139,16481, 93183,84042,955
158, 566138, 797164, 909167, 53851,036
217,972194,127210, 897212,31262,077
57.253.455.7
78.8
7.3080.782.8
244, 209252,92849, 725
189,61258.00
61, 52961,069
7,177345,04951,997
605, 367482, 896654,104
93
378, 499174, 556
4,105
223.3261.1
656544112
844, 28873, 484
339, 840137, 24772, 59437, 356134,858
64, 7805,2768,71711,9898,5292,468
24, 351
,501,175715,058786,117
569, 426578, 547574, 494
96, 399151,86387, 43289, 03942,817
172, 243139,394172, 531172,15253, 291
224,199202,175226,251219, 70870, 288
52.756.557.7
80.3
7.3080.380.2
258, 301262,99845,028
218,13758.00
61, 99462, 5376,634
332, 39346, 575
704, 746486, 882680, 288
95
398, 559186, 949
4,271
261.2276.1
49142863
819, 37672,190
327, 587130,48171, 72036, 523135, 584
66, 5525,3068,69012, 5059,2251,94525,002
1,464,762699, 872764, 890
532, 728564,717579, 259
78, 501141, 589r 85,97087,73341,080
172, 949131, 521172, 273179,35653, 006
204, 708184, 809218,007218, 59569,648
53.661.756.3
7.3084.283.0
256, 762259, 40942,381
211, 57258.00
62, 54661,697
7,483325,11249, 256
651, 974484,811672, 212
95
487,039187,697
4,078
266.0271.7
669555114
734, 98765, 811
276, 294122, 26467, 36735,188128, 253
66,8444,16210, 64512, 3608,1692,336
25, 580
1,328,965• 655, 550• 673,415
553. 901526,181541, 238
90, 636138,448r 80,89072, 45536, 030
178, 981140, 516161,505171,16952, 576
208, 279
199,136206, 36466, 679
52.254.250.6
81.6
7.3078.377.7
230, 78056, 571
205, 95258.00
61,16961, 295
7,357296, 78445, 496
801,70770, 006
303, 375134,18274, 908
r 36, 984136,861
r 75, 9557,211
r 9,471' 12, 99810, 015' 2, 85429, 718
1,443,310• 696,984• 746,326
579, 302554, 518564, 730
90, 221159,949
79, 76979, 23240, 571
175, 519147, 760166, 678178, 575
50, 679
234, 761222, 826220, 325213, 318
76, 508
56.752.457.4
7.3076.3
232,11089, 227
185,19358.00
60,38160,120
7,618272, 897
50,160
610, 859 733, 751471, 289 565, 064596, 214 652, 913
85 91
353,103186, 383
393,004164, 576
3,858 4,231
281.0 ! 322.4257.2 i 272.5
65155299
487398
89
••Revised. f For revisions for 1942 and the early months of 1943, see note for paperboard at bottom of p. S-35 of the July 1944 Survey.§Computed by carrying forward March 1943 figures on the basis of percentage changes in data for 59 identical companies reporting to the National Paperboard Association.tRevised series. Revised wood pulp production data beginning 1940 and sulphite stocks for all months of 1943 are shown on page 20 of December 1944 Survey; revised 1942 stock
figures for all series are on pp. 30 and S-31 of tbe June 1943 issue. The data exclude defibrated, exploded, and asplund fiber. The paper series from the American Paper and PulpAssociation have been revised to cover industry totals and are not comparable with data shown in the Survey prior to the August 1944 issue; earlier data will be published later.
•New series. The new paper series from the Bureau of the Census cover production of all mills including producers of building paper and building boards; for comparable 1942monthly averages and data for the early months of 1943, see p. S-32 of the August 1944 issue. For data beginning 1934 for shipping containers and a description of the series, see p.20 of the September 1944 Survey. The indexes for folding paper boxes are from the Folding Paper Box Association, based on reports of members accounting for around 50 percent ofthe industry totals; earlier data will be published later.
Digitized for FRASER http://fraser.stlouisfed.org/ Federal Reserve Bank of St. Louis
April 1945 SURVEY OF CURRENT BUSINESS S-33
Unlessand1942
otherwise stated,descriptive notesSupplement to th
statisticsmay be
e Survey
throughfound in
1941t h e
1945
Febru-ary
Febru-ary March April M a y
PETROLEUM AND COAL
1944
June July August
PRODUCTS
Sep-tember
Octo-ber
Novem-ber
Decem-ber
1945
Janu-ary
COALAnthracite:
Prices, composite, chestnut:Retail dol. per short ton.Wholesale . do_-_
Production thous. of short tons.Stocks, end of month:
In producers' storage yards do.._In selected retail dealers' yards.No. of days' supply-
Bituminous:Industrial consumption and retail deliveries, total
thous. of short tons.Industrial consumption, total. do.-_
Beehive coke ovens do-._Byproduct coke ovens do . . .Cement mills. do.._Coal-gas retorts do . . .Electric power utilities _ . . d o . . .Railways (class I)___ do . . .Steel and rolling mills do.__Other industrial do . . .
Retail deliveries do . . .Other consumption, coal mine fuel do__.Prices, composite:
Retail (36 cities) dol. per short ton.Wholesale:
Mine run do---Prepared sizes.. do
Production! thous. of short tons.Stocks, industrial and retail dealers, end of month,
total _.thous. of short tons.Industrial, total do . . .
Byproduct coke ovens _.do.._Cement mills do . . .Coal-gas retorts do . . .Electric power utilities do . . .Railways (class I) do.."Steel and rolling mills do.._Other industrial do . . .
Retail dealers, total .do . . .
COKE
Price, beehive, Connellsville (furnace)dol. per short ton..
Production:Beehive thous. of short tons..Byproduct __.doPetroleum coke. . . do
Stocks, end of month:Byproduct plants, total do
At furnace plants _ _ doAt merchant plants do
Petroleum coke _ ..do
1.110
1,701
PETROLEUM AND PRODUCTS
Crude petroleum:Consumption (runs to stills) f_ thous. of bblPrice (Kansas-Okla.) at wells dol. per bblProduction! thous. of bbl._Refinery operations . . .pet . of capacityStocks, end of month:
Refinablein U. S.f thous. of bbl . .At refineries.. doAt tank farms and in pipe lines doOn leases! do
Heavy in California doWells completed! number
Refined petroleum products:Gas and fuel oils:
Consumption:Electric power plants! thous. of bbl . .Railways (class I) do
Price, fuel oil (Pennsylvania)— dol. per galProduction:
Gas oil and distillate fuel oil thous. of bbl. .Residual fuel oil do
Stocks, end of month:Gas oil and distillate fuel oil _..do-.Residual fuel oil do
Motor fuel:Prices, gasoline:
Wholesale, refinery (Okla.) dol. per gal. .Wholesale, tank wagon (N. Y.) do . . .Retail, service stations, 50 cities do
Production, total!.- thous. of bblStraight run gasoline do . . .Cracked gasoline doIIIINatural gasoline and allied products!! do._
Used at refineries! do iRetail distribution § mil. ofgal"!
14.0011. 4304,418
52, 54538, 248
7017, 21G
245133
6,21210, 749
94312, 04914, 297
214
10.35
5.2375,513
46, 900
45, 77742, 6475,610
448190
12, 91610,192
66612, 6253,130
7.000
4495,060
779584195
.066
.059
.161
.146
14.38 |11.7235,879
25410
53,00440, 347
1,0117,583
268140
6,69011, 484
99312,17812, 657
255
10.22
r 5. 2385.461
52,817
52, 72047,1696,383
479229
13, 9159,584
76515, 814
5, 551
7.000
644' 5, 326
138
713561152166
126,9931.110
128,90192
241, 71847,933
180,41713, 3686,553
912
1,9157,976.066
18, 45436,493
33, 56145,070
.060
.161
.14656, 28819,857
7,7654,6241,787
14.0411.481
5, 576
318
54,41741,7091,0468,124
264142
6,53912,0431,020
12, 53112, 708
253
10. 22
' 5.2405.497
54,880
51,83546,8846, 281
465208
13, 9969, 893
76515, 2764,951
7.000
667r 5, 656
144
'622513
'109173
137, 9021.110
136, 75291
236, 53048, 911
174,41513, 2046,7661,056
1,4918, 574
.066
19,86339, 738
29, 92645,427
.060
.161
.14660,14521,14831, 905
8,2505,3772,010
14.0411. 5275,202
33411
47,41137, 753
9627,925
254133
5,63211,204
87910, 7649,658
231
10.24
r 5. 2465.503
• 49, 510
50, 51346, 8745,930
475193
14, 80210, 250
75814, 4663,639
7.000
614' 5, 545
137
685535
' 149166
132, 3301.110
133, 59391
234, 69451, 625
169, 57413, 4956,473
953
1,4908,095
.066
19, 60437,281
30,15244,137
.060
.161
.14658, 38421,18530,4928,0285,0121,979
13.9611.5745,848
35315
44, 26036, 746
1,0068,134
293126
5,84710,834
8299,6777, 514
257
10. 27
'5.2425.508
• 53, 930
55, 29350, 5915,892
472205
15,71311, 737
76115,8114,702
7.000
644' 5, 691
145
r756569
•"186141
139, 5371.110
141, 29392
235,17650,407
171,46713, 3026,2541.033
1,5167,956.066
21, 21538,026
32,48444,682
.060
.161
.14661,19122,35231, 5108,4775,1982,235
' Revised; revised January 1944 figure for wholesale price of coal, mine run, $5 233§ See note marked " § " on p . S-33 of the March 1945 Survey. For revisions for 194
13.8511.4355,623
34815
43,07235, 295
9587,778
311112
6,16710, 230
7788, 9617,777
248
10.28
5. 2395. 510
52, 712
59, 68054, 2596,152
491206
16, 45713,329
78516,8395,421
7.000
614' 5, 437
135
'784554
'231127
139,9371.110
137,25195
229, 63150,190
166,22713,2146,1181,177
1,6407, 579.066
20,02837,902
35, 24246, 649
.060
.161
.14661,71922, 51031, 9598,3875.4292,305
13.8411.4194,962
37818
43,17135, 254
9447,967
316117
6,41410, 248
7808,4687,917
228
10.29
5.2385.512
' 48, 986
61,41355, 5375,711
508216
16, 96513, 797
81117, 5295,876
7.000
6055,627
158
921589332130
143, 4341.110
141, 28796
223, 50348,895
160,93813, 6706,1861,098
1,5305,496.066
21,31638,332
38, 33550, 589
.060
.161
.14663,48022, 74833,0628,7676,1652,163
13.8411.4195,623
41322
46,58536,958
8967,978
358115
7,04610, 445
8319,2899, 627
252
10.31
5,2395.514
' 54,177
63,90958,2335,928
537239
17, 50514,633
77518, 6165,676
7.000
5745,633
158
986596390116
143,0471.110
145, 29695
223,90150,150
160,16213,5896,2911,200
1,5057,970.066
20, 59337, 291
40, 71253, 506
.059
.161
.14664,06422, 65533,7698,7926,0842,264
13.8411.4195,443
44220
45,71035, 967
8057,606
336121
6,65710,095
8079,5409,743
233
10.31
5.2375.509
r 50, 480
64,90559,1506, 174
550250
17, 77314, 773
79118,8395,755
7.000
5165,377
155
995565430116
140,4531.110
142,98995
222,86848,919
160,21613,7336,4691,357
1,6507,750.066
19,11037, 903
43,68757,849
.059
.161
.14663,67423,82732. 2838,6485,7992,223
13.8511.4195, 603
46222
49, 51639, 003
8227,985
364128
6,75410, 940
8b711,14310, 513
235
10.31
5. 2375.509
r 51,813
65, 07459, 256
6, 397592243
17, 96214, 691
79618, 5755,818
7.000
5275,635
181
1,040586454137
143, 7201.110
146, 93894
223. 50050, 323
159,44713, 7306,4871,194
1,7468,284
.066
21, 69739, 322
47, 35257,420
.059
.161
.14665, 51424,42133, 1909.090b', 0202, 194
13.8611.4245,088
49225
49, 68439,644
7597,748360129
6,82410,714
90812,20210,040
229
10.32
5.2375. 516
• 50,819
64,02058,3306,737582261
17,67114,427
78317,8695,690
7.000
' 5,471164
1,198688509162
140,0451.110
142,40494
222, 75949,039159, 58214,1386,4821,154
1,8258,314.066
18,87039,370
45, 58455, 643
.059
.161
.146' 64,84224,01933,0559,0246,109' 2,155
13.8611. 4304,570
44519
55,18641, 813
6327,984352138
7,06611, 7581,02212,86113, 373
204
10.33
5.2375.516
• 45, 774
57, 20452, 4706,112538243
16, 30512, 918
70115, 6534,734
7.000
4195,603172
1,149655494187
145,1251.110
145, 28295
220, 66348, 576158,18114,1056,1071,099
2,0128,863
19, 05841, 278
38, 33350, 383
.059
.161
.146' 65,80024, 08134, 020' 9,1976,0082,041
13.8711. 430'4,195
32211
• 59, 082• 42, 780
714r 7, 934
296145
r 7,119• 12, 014' 1, 08013, 47816, 302
239
10.33
5.2375. 513
52, 200
• 49,465• 46,127' 5, 695
494214
• 14,098'11,312
'66513, 6493,337
7.000
4575,576
181
913609304174
145,0711.110
147,18693
221, 73749, 620157, 80814, 3096,0261,022
' 2,1488,488.066
20, 55641,862
31,69544, 347
.059
.161
.14666, 66224, 26734, 2629,8436,380
Digitized for FRASER http://fraser.stlouisfed.org/ Federal Reserve Bank of St. Louis

S-34 SURVEY OF CURRENT BUSINESS April 1945-
Unlessand1942
otherwise stated, statisticsdescriptive notes may beSupplement to the Survey
throughfound in
1941t h e
1945
Febru-ary
Febru-ary Meirch April May June
1944
July August Sep-tember
Octo-ber
Novem-ber
Decem-ber
1945
Janu-ary
PETROLEUM AND COAL PRODUCTS—Continued
PETROLEUM AND PRODUCTS-Continued
Refined petroleum products—Continued.Motor fuel—Continued.
Stocks, gasoline, end of month:Finished gasoline, total thous. of bbl_.
At refineries doUnfinished gasoline _ -doNatural gasoline. . . . . -do
Kerosene:Price, wholesale, water white, 47°, refinery (Penn-
sylvania) dol. per gal-Production thous. of bbl._Stocks, refinery, end of month do
Lubricants:Price, wholesale, cylinder, refinery (Pennsylvania)
dol. per gal..Production thous. of bbl_.Stocks, refinery, end of month _ do
Asphalt:Production short tons.-Stocks, refinery, end of month. _ do
Wax:Production -thous. of lb._Stocks, refinery, end of month -do
Asphalt prepared roofing, shipments:!Total thous. of squares._
Smooth-surfaced roll roofing and cap sheet-.-doMineral-surfaced roll roofing and cap sheet.__doShingles, all types do
.074
.160
3,7991, 573
9951,231
72,90952,92511,8434,245
.0736,4134,382
.1603,1587,942
398, 200717,900
65,80080,080
4, 3511,7241,3251,302
75, 27552, 51311,8254.242
.0746,9604,078
.1603,4888,011
455,400795,300
79,80084, 560
4,5261,7191,3931,414
76, 63851, 83011,7354,213
.0746,4894,142
.1603,2738,068
455, 500852, 200
76,440
94,080
3,9281,3681,1601,400
74,51949,04712,1934,436
.0746,7104,969
.1603,3377,771
598,900889, 500
65, 52093,800
4,1341,3371,1961,602
70,24645,46811,7384,477
.0746,2465,949
.1603,4537,590
690,700844,600
60,48091, 5C0
3,9761,1971, 1571,622
68, 92143,63911, 5814,425
.0746,2776,665
.1603,3647,426
711,600735, 600
63, 56093,800
3,6241,1331,0351,457
66, 54241, 75211, 9244,211
.0746, 3587,583
.1603,3567,169
800, 200590,000
64,12096, 040
4,2161,3181,2001,699
64, 914
12, 0724,141
.0746,3397r985
.1603, 4587, 364
750, 400495,100
62,16094, 920
4,0041,0991, 1941,711
65, 88642,14512, 3884,160
.0746,5157,847
.1603,6727,452
677, 600465, 800
67, 48096, 880
4,1921,1731,2211,797
68,10743, 52712,4674, 334
.0746,5056,977
.1603, 5877,562
553. 600534,400
63,56094,920
4,1161, 2951,2151,606
73, 62248, 21713, 208r 4, 451
.0746,4615,765
.1603,5817, 815
481,100626, 200
67, 20093, 800
3, 6621, 456943
1,263
STONE, CLAY, AND GLASS PRODUCTS
ABRASIVE PRODUCTS
Coated abrasive paper and cloth, shipments reams.-
PORTLAND CEMENT
Production.-. thous. of bbl_.Percent of capacity
Shipments thous. of bbL.Stocks, finished, end of month .doStocks, clinker, end of month do
CLAY PRODUCTS
Brick, unglazed:Price, wholesale, common, composite, f. o. b. plant
dol. per thous._Production* ___thous. of standard brick..Shipments* ...doStocks end of month*— __ ...do
GLASS PRODUCTS
Glass containers:fProduction thous. of gross.
Percent of capacityShipments, total thous. of gross.
Narrow neck, food do. . .Wide mouth, food doPressure and nonpressure do.. .Beer bottles .do. . .Liquor ware .do. . .Medicine and toilet . . .do . - .General purpose .doMilk bottles _ -do...Home canning.. .do. . .
Stocks, end of month - do.. .Other glassware, machine-made:
Tumblers:Production thous. of doz.Shipments -do...Stocks _ __ do___
Table, kitchen, and householdware, shipmentsthous. of doz.
Plate glass, polished, production^ thous. of sq. ft.Window glass, productiond" thous. of boxes.
Percent of capacity d"
GYPSUM AND PRODUCTS
Gypsum, production:Crude short tons...Calcined do
Gypsum products sold or used:Uncalcined doCalcined:
For building uses:Base-coat plasters ~ doKeene's cement . . . ..doAll other building plasters doLath thous. of sq. ft_.Tile doWallboarde do
Industrial plasters.. short tons..
132,4
5,37129
4,57422,1646,029
15. 321
7,304
7,366572
2,041502904823
1,65352126585
5,359
7,363
129,751
5,68629
5,05525,0736,603
13. 840133,891129, 821429, 315
7,771115.97,538546
2,137497712631
1,801692243278
4,426
4,7284,1716,793
1,522
7,980
134, 908
6,13929
6,22524,9956,567
13.879139, 300142, 458424, 546
8,842122.18,325623
2,285628844749
1,777781255384
4,779
5,8625,7566,990
2,164
8,702
919,692629,470
246,712
121,7782,43952,046160,1763,292
431,68444,433
144,198
6,46332
7,37324,0806,687
13. 939139,288] 51,128408, 096
8,582127.98, 393
5462,236720935725
1,837735211448
4,793
5,5124,8547,603
2,0058,079
142, 604
7,18135
8,78422, 4556,378
14. 008155, 065181, 649379,011
127.18,766
5522,415679982785
1,806915239394
4,710
5,9125,8517,600
2,3119,391
123, 538
7,90640
9,35021,0086,172
14. 095157,35717S, 104355, 727
128.58,431
5942,106679
1,061695
2,008728251309
4,947
4,6795, 2547,063
2,0149,265
980,401593,985
260,867
142, 655932
65, 282152, 7483,553
361,41847, 566
114,484
8,51641
9,28320, 2335, 577
14.159157, 870177,815335, 347
8,075120.47,784624
1,909657871738
1,785708251241
5,082
5,1205,4346,752
2,3018,246
128, 464
9,00344
10, 75818, 4825,287
14.109176, 585198, 845312,176
8,692120.08,514809
2,179611811891
1,963700271278
5, 097
7,0276, 5917,077
3,2029,746
117, 325
8,73944
10,12117,1445, 096
14.586164,682183, 078293, 6J 6
7,737115.47, 522894
1,873497661904
1,640642251159
5,164
b,5616,2907,148
2,8209,046
917, 395
588, 878
248,199
140, 7753, 671
r 54,289165, 0304.105
338, 52753, 571
128, 272
9,19445
10, 26316, 0494,862
14.830185, 573206, 368272, 569
8,601123.38,187
7742,287536749947
1,90869724741
5,394
5,8605,0247,286
3,3539,105
122,485
8,30442
7,38016,9934,856
r 15. 059174,069183, 506261,743
7,967118.87,787529
2,310508874908
1,73265224232
5,346
4,6974,4817,376
3,2717,619
122, 517
7,38736
4,59519, 8635,329
15. 055r 151,426
134.374277,884
7,667114.37,390
4762,246
457'919
8661,545
58626629
5,097
4, 6574, 6067, 385
2,9017,013
936, 423552, 394
308, 302
115, 5073,379
48, 491146,133
3,929364. 575
54, 947
r Revised. ^According to the compilers, data represent approximately the entire industry. ^Collection of data temporarily discontinued.©Includes laminated board reported as component board; this is a new product not produced prior to September 1942.fRevised series. See note marked "f" on p. S-34 of the July 1944 Survey regarding changes in data on glass containers and comparable figures for 1940-42; beginning January 1945
data are compiled by War Production Board. Data on asphalt prepared roofing cover all known manufacturers of these products and are total direct shipments (domestic and ex-port); shipments to other manufacturers of the same products are not included; for comparable data for September 1943-January 1944, see note at bottom of p. S-23.
•New series. Data are compiled by the Bureau of the Census and cover all known manufacturers; data beginning September 1942 are shown on p . 24 of the February 1945 issue.
Digitized for FRASER http://fraser.stlouisfed.org/ Federal Reserve Bank of St. Louis

April 1945 SURVEY OF CURRENT BUSINESS S-35
Unless otherwise stated, statistics through 1941and descriptive notes may be found in the1942 Supplement to the Survey
1945
Febru-ary
1944
Febru-ary March April May June July August Septem-
ber October Novem-ber
Decem-ber
1945
Janu-ary
TEXTILE PRODUCTS
CLOTHINGHosiery:
Production thous. of dozen pairs.Shipments _ do . . .Stocks, end of month.. __ do . . .
COTTON
Cotton (exclusive of linters):Consumption. bales..Prices received by farmersf. dol. per lb._Prices, wholesale, middling l5/W, average, 10 markets
dol. per lb._Production:
Ginnings§ thous. of running balesCrop estimate, equivalent 500-lb. bales
thous. of bales..Stocks, domestic cotton in the United States, end of
month :tWarehouses thous. of bales.Mills do
Cotton linters:Consumption doProduction doStocks, end of month _ do
COTTON MANUFACTURES
Cotton cloth:Cotton broad woven goods over 12 in. in width, pro-
duction, quarterly* mil. of linear yardsPrices, wholesale:
Mill margins ..cents per lb.._Denims, 28-ineh dol. per yd.Print cloth, 64 x 56c? do . . . .Sheeting unbleached, 4 x 4© do
Spindle activity:Active spindles .. .thousands,.Active spindle hours, total. .mil. of hr. . .
Average per spindle in place hours..Operations percent of capacity..
Cotton yarn, wholesale prices:Southern, 22/1, cones, carded, white, for knitting (mill)t
dol. per lb_.Southern, 40s, single, carded (mill) do
RAYONConsumption:
Yarn ..mil. of lb_.Staple fiber do
Prices, wholesale:Yarn, viscose, 150 denier, first quality, minimum
filament dol. per lb_.Staple fiber, viscose, 1H denier do
Stocks, producers', end of month:Yarn mil. oflb..Staple fiber . . . do . . . .
WOOL
781, 559.200
.216
2 11,805
3 12,195
12,3592,232
119128464
21.33.209.092.114
22, 2248,925
386122.2
.451
.568
45.712.8
.550
.250
6.63.2
12,20212,14417,453
811,062.199
11, 4682,292
107100845
19.98.192.087.108
22, 5139,659
414123.2
.414
.515
43.313.6
.550
.240
7.52.1
13, 45813,59017,197
903,538.200
.211
i 11,129
i 11,429
10,8402,233
11682
797
2,539
19.72.193.087.108
22, 57010,637
456123.9
.414
.515
45.614.9
.550
.240
8.11.7
11,65011, 76116,961
775,617.202
.210
10,2052,165
11156
19.78.199.087.108
22, 4129,316
400124.9
.414
.515
43.211.3
.550
.250
7.81.8
Consumption (scoured basis):KApparelclass thous.oflb 46,908 59,315Carpet class . . . do 3,016 4,315
Machinery activity (weekly average):JLooms:
Woolen and worsted:•Broad .thous. of active hours 2,647 2,613Narrow do 64 62
Carpet and rug:#
Broad do 61 58Narrow do 38 37
Spinning spindles:Woolen do 125,512 123,552Worsted do 114,099 114,101
Worsted combs - .do 206 208Prices, wholesale:
Kaw, territory, 64s, 70s, 80s, fine, scoured*..dol. per lb._ 1.190 1.190 1.190Raw, bright fleece, 56s, greasy* do .545 .545 .545Australian (Sydney), 64-70s, scoured, in bond
(Boston) dol. per lb._ .750 .765 .765Women's dress goods, French serge, 54" (at mill)
dol. per y d . . 1.559 1.559 1.559Worsted yarn, ^2 ' s , crossbred stock (Boston)
dol. per l b . . 1.900 1.800 1.800Stocks, scoured basis, end of quarter:f
Total _ . . . thous .of lb 279,263Wool finer than 40s, total .do 231,537
D o m e s t i c . _ _ do 115,225Foreign .do 116,312 |._
Wool 40s and below and carpet _ .do I 47,726 L_ !r Revised. 1 Total ginnings of 1943 crop. 2 Total ginnings of 1944 crop. §Total ginnings to end of month indicated.cf Production of 64 x 60 for which prices through June 1943 were shown in the Survey has been discontinued. ©Price of 56 x 56 sheeting.JFor revised figures for cotton stocks for August 1941-March 1942, see p. S-34 of the May 1943 Survey. The total stocks of American cotton in the United States on July 31
1944, including stocks on farms and in transit, were 10,626,000 bales, and stocks of foreign cotton in the United States were 118,000 bales.IData for March, June, September, and December 1944 are for 5 weeks; other months, 4 weeks.• Data exclude carpet and rug looms operating on blankets and cotton fabrics and, through October 1943, woolen and worsted looms operating entirely on cotton yarns (no separate
data for the latter have been collected since October 1943); for weekly averages for 1942 and 1943, including such looms, see note marked " • " on p. S-35 of the May 1944 Survey.
46,9283,824
2,56360
5436
121,302111,032
202
1.190.545
.765
1.559
1.800
12, 76312,65716,942
832,812.198
.210
9,5152,054
12340
661
19.81.199.087.108
22, 38510, 058
431119.0
.414
.515
45.414.6
.550
.250
8.32.5
46,8924,008
2,51263
5337
120,333111, 253
207
1.190.545
.765
1. 559
1.800
12,12611,97416,970
805,823.202
.215
8,7881,931
12221
545
2,418
19.28.199.087.108
22, 3809,711
417118.5
.414
.515
44.014.3
.550
.250
•8.82.6
51,8904,435
2,38163
5035
113,128103,880
195
1.190.545
.765
1.559
339,369287,276164,283122,99352,093
10,0529,982
17,040
723,402.203
.216
48
8,2211,820
13323
454
19.81.206.092.108
22, 2918,603
369115.4
.414
.515
41.313.6
.550
.250
3.0
38,7522,916
2,08054
29
99, 78089,154
172
1.190.545
.765
1.559
1.900
12,76712,96616,840
841, 490.202
.214
576
7,8721,662
12529
357
20.35.209.092.108
22,2419,952
428116.3
.414
.515
44.814.4
.550
.250
9.33.2
42,3963,516
2,32763
5034
115,25695,724
191
1.190.545
.765
1.559
1.900
11, 46611, 76416, 542
793. 086.210
.214
3,985
9,7031,672
121100328
r 2, 294
21.30.209.092.114
22, 2809,381
404122.3
.451
.568
44.813.0
.550
.250
8.83.0
52,1703,795
2,322594531
110,238100. 396
188
1.190
.545
.765
1.559
1.900373, 666314, 824189, 277125, 54758. 842
11, 69712,11816,122
i, 379.213
.216
;,282
11,9261,927
126152342
21.12.209.092.114
22, 2289,487
410117.4
.451
.568
47.814.6
.550
.250
8.42.7
45,7523,700
2,42663
5035
117,659103,819
196
1. 190
.545
. 765
1.559
1.900
11,97712,60315, 496
836, 541.208
.214
10, 274
13,1222,162
122180373
21.31.209.092.114
22, 2579,707
420120.6
.451
.568
48.313.9
.550
.250
8.62.7
• 45, 2884,192
' 2, 288' 6 2
50'36
114,096101, 520
191
1.190.545
.765
1.559
1.900
10, 43210, 901
• 14,672
760, 740.209
.216
10, 538
13,3432,269
120156414
!,318
21.41.209.092.114
22,2208,763
379118.5
.451
.568
49.013.6
.550
.250
6.12.7
54, 3654,695
2,30863
4432
110, 62899, 059
189
1.190.545
.754
1.559
1.900
361, 595304, 219171,617132, 60257, 376
12,36112,38914,645
849, 945.202
.217
11,118
12, 9412,244
129170440
21. 32.209.092.114
22, 2619,956
431119.7
.451
.568
'47.8'14.4
.550
.250
' 8 . 4' 3 . 1
1.190.545
.750
1,559
1.900
wuummufe uj, ..vjifeui <JA ^uwu i , vu. A±IVJIC vAJLiAjii, iui uauo I\JI xAish uan ui ±tr±o »cc p. o~ou ui nw ^u^utiL iv-tt ourvey; earner uaia win ue tsnowii later, i n e new wool prices are com-piled by the Department of Agriculture; they replace similar, but not identical, series formerly shown in the Survey, compiled from the Boston Commercial Bulletin which discon-tinued quotations after 1943; earlier data are shown on p. 24 of the February 1945 Survey.
Digitized for FRASER http://fraser.stlouisfed.org/ Federal Reserve Bank of St. Louis

S-36 SUKVEY OF CURRENT BUSINESS April 1945
Unlessand1942
otherwise stated, statisticsdescriptive notes may beSupplement to the Survey
throujfound
-h 1941in the
1945
Febru-ary
1944
Febru-ary March April May June July
TEXTILE PRODUCTS—Continued
j AugustI
Sep-tember
Octo-ber
Novem-ber
Decem-ber
1945
Janu-ary
WOOL MANUFACTURES |I
Woolen and worsted woven goods (except woven felts):*!Production, quarterly, total. __thous. of linear yards. J
Apparel fabrics do 'Men's wear do j _._.Women's and children's wear do jGeneral use and other fabrics do !
Blankets do—— IOther nonapparel fabrics do j
MISCELLANEOUS PRODUCTS
4,423Fur, sales by dealers thous. of dol_.Pyroxylin-coated textiles (cotton fabrics):
Orders, unfilled, end of month thous. lin. yd__Pyroxylin spread thous. of lt> jShipments, billed -thous. linear yd I
6,079
11,8164,4565,545
I139,744119,21960,92846, 26312,02818, 9871,538
5,190
12,1565,2776,328
3,822
12,5164,8665,735
2,381
12, 7734,8285, 5] 7
135,£89 i i I 125.064113,28156, 67543,87912,72720, 4401,868
3,016
12, 9874,9005,111
2, 620
13,0273,9154,591
I' 103. 24850,194
1,796
12,4784,2325,145
• 39,962, 092
' 19,307r 2, EG9
1,606
12,5944,1185,117
12, 7394, 9395,904
' 2,842
14,266r 4,479r 5,517
128, 349105,81850, 67041,15114,07720,1792,272
T 6,070
15.1184,1265,079
TRANSPORTATION EQUIPMENT
MOTOR VEHICLES
Trucks and tractors, production, total*.. number.Civilian doMilitary do_._
Light: Military.--. - - . . . . - do. . .Medium:
Civilian..., _ do. . .Military do.._
Heavy:Civilian. . .do. . .Military do.._
RAILWAY EQUIPMENT
American Eailway Car Institute:Shipments:
Freight cars, total number.Domestic -do
Passenger cars, total -doDomestic . do—
Association of American Railroads:Freight cars, end of month:
Number owned thousands.Undergoing or awaiting classified repairs..-do...
Percent of total on lineOrders, unfilled cars.
Equipment manufacturers do. . .Railroad shops do. . .
Locomotives, steam, end of month:Undergoing or awaiting classified repairs.number.
Percent of total on line..Orders unfilled .number-
Equipment manufacturers doRailroad shops--. - . . .do . . .
INDUSTRIAL ELECTRIC TRUCKS ANDTRACTORS
Shipments, total number.Domestic do...Exports do...
64, 56914,09150,47820, 641
10,5903,378
3,34026,162
4,1373,211
2020
1,76951
3.035,03128,0806,951
2,3315.91389246
42038535
55, 6712,766
52, 90521,095
1,7989,940
96821,870
5,3612,092
445445
1,75243
2.531,84420,66911,175
2,1275.426421846
56, 3E94,628
51, 73121, 081
3,3178, 303
1,31122, 347
7,9621,999166166
1, 753432.5
35, 58124, 24111,340
2,0925.3243204
36039
49445044
55,7198,151
47, 56819, 481
6,2456,649
1,90621, 438
7,3167131616
1,75448
2.843, 32132, 67710, 644
2,1675.522819137
442
23
56, 9209, 298
47, 62219,338
7,3107,007
1,98821,277
7,0341,501
00
1,75353
3.142, 24432, 8599,385
2,1825.520316835
42137546
61,18611,92649, 26020, 830
9,3196, 625
2,60721,805
6,0901,698
00
1,75451
3.041,23633,1668,070
2,1205.417914633
36732146
61,54011,24350, 29720, 269
8,5826,031
2,66123,997
6,1512,197
00
1,75554
3.137, 98530, 9557,030
2,1905.517213933
30727136
68, 54512,51156, 03423,441
10, 2485, 746
2,20326,847
4,8372,662
00
1,75652
3.034,06428,0705,994
2,1945.615011832
431413
18
65,04212, 27752, 7652i,367
10.0346j 300
2,24325,098
4,1302,807
00
1,75851
3.030,15325, 2854,868
2,1875.51249628
36134120
64,12913, 07551,05418, 534
9, 4326,144
3,64326, 376
4,7413,517
00
1, 75950
2.928, 38523, 8854,500
2,254
1027725
443415
28
69, 01314, 67754,33619, 765
10,1536,503
4,52428,068
4,5953,244
55
1,76251
2.928,91025,1543,756
2,3005.8906525
33630333
70, 68215, 65355, 02920,433
9, 5655,326
6,08829,270
4,3953,089
1212
1,76451
3.034,41729, 6754,742
2,1615.5664125
420393
27
CANADIAN STATISTICS
Physical volume of business, adjusted:Combined indext 1935-39=100...
Industrial production, combined indexf doConstruction f . . .doElectric power doManufacturing! do
Forestry! doMining! do
Distribution, combined index!. .doAgricultural marketings, adjusted:!
Combined index doGrain — . . .doLivestock... do
Commodity prices:Cost of living doWholesale prices 1926=100..
Railways:Carloadings .thous. of cars..Revenue freight carried 1 mile mil. of tons..Passengers carried 1 mile mil. of passengers..
118. 6102.9
241.6279.5113.5153.8304.5124.6255.5163.1
237.2257.3149.9
118.9102.7
2805,024
448
247.8282.7201.8154.7300.5125.3262.6175.4
220.3244.2116.4
119.0103.0
3125,534
506
239.5270.0140.2153.1291.3115.3247.5176.2
305.5352.7100.7
119.1102.9
2845,342
544
241.8272.3109.2165.0297.3119.3238.8178.6
217.6238.8125.3
119.2102.5
3185,769
535
238.8266.8111.8160.2292.2121.1225.5180.8
270.4307.8108.3
119.0102.5
3155,457
638
232.2262.198.8
154.8287.6112.8225.4170.3
361.7420.6106.0
119.0102.5
2975,640
714
233.1263. 591.6
156.4291.5121.9214.5170.1
101.794.8132.0
118.9102.3
3175,520
702
231.0260.4104.1153.4284.5116.4205.5170.3
81.576.9101.6
118.8102.3
3175,563591
228.0259.7113.4152.4285. 8128.5208.9162.4
110.7111.1108.9
118.6102.4
3305, 815532
227.9255.492.7
148.5284.7124.6191.7171.1
133.4135.0126.7
118.9102. 4
3275,597487
233.0256.0122.6144.7283.7126.1189.3185.5
167.7168.9162.5
118.5102.5
272
r Revised.fRevised series. The revision of the Canadian index of physical volume of business is due mainly to changes in the weighting and in the list of components, so as to present a
picture of the expansion in industries engaged in war production. Revised data were first shown on p. S-36 of the December 1942 Survey; subsequently the construction index wasfurther revised in the March 1943 Survey and the mining index was revised in the April 1944 issue. The revisions affected principally indexes for the period beginning January1940; the agricultural marketings index and the distribution index were revised back to 1919 and minor revisions were also made in data prior to 1940 for other series. All series areavailable on request.
*New series. The new series on woolen and worsted goods are compiled by the Bureau of the Census from reports of manufacturers who account for 98 percent or more of totalproduction; the statistics include estimates for a few manufacturers from whom reports were not received; yardage is reported on an equivalent 54-inch linear yard except blanketswhich are on a 72-inch linear yard. Data on trucks and tractors are from the War Production Board and cover the entire industry. Jeeps, military ambulances, and wheel drivepersonnel carriers are included but not half-tracks, full-tracks, or armored cars. Light trucks are defined as those up to 9,000 pounds gross weight, mediums, 9,000 up to 16,000 pounds,and heavy, 16,000 pounds and over. There were some differences in the definitions employed in collecting these statistics and the trucks statistics formerly shown in the Survey; itshould also be noted that the latter were "factory sales." Earlier data for all new series will be published later.
U. S . G O V E R N M E N T P R I N T I N G O F F I C E : 1 9 4 5
Digitized for FRASER http://fraser.stlouisfed.org/ Federal Reserve Bank of St. Louis

INDEX TO MONTHLY BUSINESS STATISTICS, Pages S1-S36
CLASSIFICATION OF SECTIONS
Monthly business statistics:Business indexesBusiness populationCommodity pricesConstruction and real estateDomestic tradeEmployment conditions and wagesFinance . .Foreign tradeTransportation and communications.Statistics on individual industries
Chemicals and allied productsElectric power and gasFoodstuffs and tobaccoLeather and productsLumber and manufacturesMetals and manufactures:
Iron and steel-._Nonferrous metals and products-Machinery and apparatus
Paper and printingPetroleum and coal productsStone, clay, and glass productsTextile products.Transportation equipment
Canadian statistics
PageS - lS -3S-3S - 5S - 6S-9
S-14S-20S-20
S-22S-24S-25S-28S-29
S-30S~30S-31S-32S-33S-34S-3 5S-36S-36
CLASSIFICATION BY INDIVIDUAL SERIES
Pages marked SAbrasive paper and cloth (coated) . 34A c i d s . . . . . . 22, 23Advertising 6, 7Agricultural income, marketings 1Agricultural wages, loans - 14Air mail end air-line operations -_ 7, 21Aircraft - 2, 9,10,11,12,13Alcohol, methyl 23Alcoholic beverages 1, 2, 25Aluminum 30Animal fats, greases __ 23,24Anthracite _ 2,4,11,12,14,33Apparel, wearing. 3,4, 6, 7, 8, 10,11,12,13, 35Asphalt. _ _- 34Automobiles 1, 2, 3, 6, 7, 9,10,11,12,13,17Banking 14, 15Barley 26Bearing rnetM 31Beef and veal 27Beverages, alcoholic 1, 2, 25Bituminous coal 2,4,11, 12, 14,33Boilers 30Bonds, issues, prices, sales, yields 18, 19Book publication 32Brass and copper products 31Brick _ 4,34Brokers' loans 15, 18Building contracts awarded - 5Building costs 5,6Building construction (see Construction).Building materials, prices, retail trade 4, 7,8Businesses operating and business turn-over __ 3Butter - 25Canadian statistics 16, 36Candy 27Capital flotations 18
For productive uses 18Canoadings 22Cattle and calves 27Cement > 1,2,4,34Cereal and bakery products 4Chain-store sales 8Cheese 25Chemicals... 1, 2, 3, 4, 10, 11,12, 13,14, 17, 22, 23, 24Cigars and cigarettes 28Civil-service employees. 11Clay products (see also Stone, clay, etc.) 1, 2, 34Clothing 3,4,6, 7,8, 10, 11, 12, 13,35Coal 2,4, 11, 12, 14,33Coffee.CokeCommercial and industrial failures.Construction:
New construction, dollar value...Contracts awardedCosts,
272,33
3
55
5,6Highway 5,11Wage rates, earnings, hours 11,13, 14
Qpnsumer credit 15Consumer expenditures 7Copper 31Copra or coconut oil 23Corn _ 26Cost-of-Hving index 3,4Cotton, raw. anc. manufactures^ ̂ J2Uj4,.10^12,13,35Cottonseed, cake and meal, oil. ..' -._'.- 23, 24Crops. _ _- 1,23,24,25,26Currency in circulation 16Dairy products 1,2,3,4,25,26Debits, bank 14Debt, short-term, consumer 15
Pages marked SDebt, United States Government _ 17Department stores, sales, stocks, collections. _ 8, 9Deposits, bank „ 15, 16Disputes, industrial 12Dividend payments and rates 1,19Earnings, weekly and hourly. 13, 14Eggs and chickens 1, 3, 4, 27Electrical equipment 2,3,6,31Electric power production, sales, revenues- 24Employment estimated 9, 10Employment indexes:
Factory, by industries 10Nonmanufacturing industries 11
Employment, security operations 12Emigration and immigration - 21Engineering construction 5Exchange rates, foreign 16Expenditures, United States Government 17Explosives 23Exports _ 20Factory, employment, pay rolls, hours, wages. 9,
10,11,12,13,14Failures, industrial and commercial 3Fairchild's retail price index 4Farm wages 14Farm prices, index 3, 4Fats and oils 4,23,24Federal Government, finance 17Federal Reserve banks, condition of 14, 15Federal Reserve reporting member banks 15Fertilizers 4,23Fire losses 6Fish oils and fish _ 2\ 27Flaxseed._ ___ 24Flooring 29Flour, wheat 27Food products _. 2
3, 4, 6, 7, 10, 11,12,13,14, 17. 25. 26, 27, 28Footwear.. 2,4,7,8,10,12,13,28Foreclosures, real estate 6Foundry equipment 31Freight cars (equipment) 36Freight carloadtnys, cars, indexes 21Freight-car surplus 21Fruits and vegetables 2,3,4,26Fuel equipment and heating apparatus 31Fuels. 2.3,4.33Furniture 1,4,10, 11, 12, 13, 29Gas, customers, sales, revenues 25Gas and fuel oils 33Gasoline. ._ . 33, 34Glass and glassware (see also Stone, clay, etc.). 1, 2, 34Glycerine 23Gold . 16Goods in warehouses 7Grains 3, 26Gypsum 34Hides and skins. 4, 28Highways 5, 11Ho«s _ 27Home-loan banks, loans outstanding 6Home mortgages 6Hosiery. 4,35Hotels. . . 11,12,21Hours per week 11Housefurnishings 4, 6, 7, 8Housing. __ _ 3,4.5Immigration and emigration 21Imports. 20Income payments 1Income-tax receipts 17Incorporations, business, new 3Industrial production indexes 1, 2Instalment loans 15Instalment soles, department stores 8Insurance life 16Interest and money rates 15Inventories, manufacturers* and trade ._ 3,8Iron and steel, crude, manufacture*! 2,
3,4,9, 10,11, 12, 13,17,30Kerosene 34Labor force. 9Labor disputes, turn-over . 12Lamb and mutton 27Lard 27Lead __ 31Leather 1,2,4,10,11,12,13,28Linseed oil, cake, and meal ___. 24Livestock 1,3,27Loans, renl-estate, agricultural, bank, brokers*
Osee also Consumer credit). 6, 14,15. 17Locomotives 36Looms, woolen, activity 35Lubricants - 34Lumber 1, 2, 4,10,11,12,13, 29Machine activity, cotton, wool 35Machine tools 9,10,11, 12,13.31Machinery 1, 2, 3, 9, 10, 11, 12. 13, 17, 31Magazine advertising 6,7Manufacturers* orders, shipments, inventories. 2. 3Manufacturing production indexes 1,2Meats and meat packing.. 1, 2, 3, 4. 10, 12. 13, 14. 27Metals 1, 2, 3, 4, 9,10,11,12,13,17, 30, 31Methanol 23Milk. 25. 26Minerals _ 2, 9,11, 12, 14Money supply 16Motor fuel 33.34Motor vehicles 7, 36
Pages marked SMotors, electrical 31Munitions production 2Newspaper advertising 6, 7Newsprint 32New York Stock Exchange 18,19, 20Oats 26Oils and fats 4, 23, 24Oleomargarine 24Operating businesses and business turn-over.. 3Orders, new, manufacturers' 2Paint and paint materials ._ 4,24Paper and pulp 2,3,4,10,11,12,13,14,32Paper products 32Passports issued 21Pay roll*, manufacturing and nonmanufactur-
ing industries 12Petroleum and products 2,
3, 4,10,11,12,13,14,17,33, 34Pig iron _ 30Plywood and veneer 29Porcelain enameled products 30Pork 27Postal business 7Postal savings . . 15Poultry and eggs 1,3,27Prices (see also Individual commodities):
Retail indexes . 4Wholesale indexes __ 4
Printing 2, 10, 11, 12,13,14, 32Profits, corporation 17Public assistance ._ 14Public utilities... 4, 5, 11, 12,14,17,18,19, 20Pullman Company * 22Pumps 31Purchasing power of the dollar 4Radio advertising . 6Railways, operations, equipment, financial sta-
tistics, employment, wages 11,12, 14,17,18, 19,20,21,22.36
Railways, street (see Street railways, etc.).Rayon ._ 2,4, 10,12,13,35Receipts, United States Government 17Reconstruction Finance Corporation, loans 17Rents (housing), index 3,4Retail trade:
All retail stores, sales 7,8Chain stores 8Department stores 8,9Mail order _ 7,8,9Rural, general merchandise 9
Rice 26Roofing, asphalt 34Rubber products... 2,3,4,10, 11,12,13,14Savings deposits 15Sheep and lambs 27Shipbuilding 2, 9,10,11,12,13Shipments, manufacturers' 2Shoes... - . 1,4, 7, 8,10,12,13, 28Shortenings 24Silver 16SVins __ 28Slaughtering and meat packing.. 2,10,12,13,14, 27Soybeans and soybean oil 24Spindle activity, cotton, wool 35Steel and iron (see Iron and steel).Steel, scrap 30Stocks, department stores (see also Manufac-
turers' inventories) 9Stocks, issues, prices, sales, yields. 19, 20Stone, clay, and glass products. 1, 2,10,11,12,13, 34Street railways end busses 11,12,14Sugar.. 28Sulphur 22Sulfuric acid 22Superphosphate . 23Telephone, telegraph, cable, and radio-tele-
graph carriers 11,12,14.17,22Textiles 2,3,4.10,11,12,13,35,36Tile 34Tin 31Tobacco 2,10, 11, 12,13,14,28Tools, machine 9,10,11,12,13,31Trade, retail and wholesale 7, 8, 9, 11,12, 14Transit lines, local 20, 21Transportation, commodity and passenger 20, 21Transportation equipment 1,
2,3,9,10,11, 12,13,17,36Travel 21,22Trucks and tractors 36Unemployment 9United States Government bonds. 17,18,19United States Government, finance 17United States Steel Corporation 30Utilities 4, 5, 9, 11, 12, 14,17,18,19, 20Variety stores. . . 7, 8Vegetable oils 23Vegetables and fruits 2,3,4,26Wages, factory and miscellaneous 13, 14War program, production and expenditures 2, 17War Savings Bonds 17Warehouses, spac^ occupied 7Water transportation, employment, pay rolls. 11,12Wheat and wheat flour 26,27Wholesale price indexes 4Wholesale trade 9Wood pulp _ 4,32Wool and wool manufactures. 2,4,10,12,13,35,36Zinc - 31Digitized for FRASER
http://fraser.stlouisfed.org/ Federal Reserve Bank of St. Louis

$6.00per year
ForeignCommerce
SiKtLY
Foreign Commerce Weekly containsfeature articles on timely subjects of particular interestto the foreign trader. Regular departments includenews items by countries and commodities with sec-tions devoted to foreign exchange, finance, tariffsand trade controls, wartime commodity controls,commercial-law notes, book reviews.
A sample copy will be sent upon request to theBureau of Foreign and Domestic Commerce
Washington 25, D. C.
£6,00 per year, from the Superintendent of Document*, Government Printing Office, Washington.
Digitized for FRASER http://fraser.stlouisfed.org/ Federal Reserve Bank of St. Louis


