Embed Size (px)
Citation preview

Scattering of Neutrons: Basics
Jill TrewhellaUniversity of Sydney

The conceptual experiment and theory is the same for X-rays and neutrons.
The differences are the physics of the interactions of X-rays (electro-magnetic radiation) versus neutrons (neutral particle) with matter.

Fundamentals
Neutrons have zero charge and negligible electric dipole and therefore interact with matter via nuclear forcesNuclear forces are very short range (a few fermis, where 1 fermi = 10-15 m) and the sizes of nuclei are typically 100,000 smaller than the distances between them.Neutrons can therefore travel long distances in material without being scattered or absorbed, i.e. they are and highly penetrating (to depths of 0.1-0.01 m). Example: attenuation of low energy neutrons by Al is ~1%/mm compared to >99%/mm for x-rays

Neutrons are particles that have properties of plane waves
They have amplitude and phase

They can be scattered elastically or inelastically
Inelastic scattering changes both direction and magnitude of the neutron wave vector
Elastic scattering changes direction but not the magnitude of the wave vector

Coherent scattering is “in phase” and thus can contribute to small-angle scattering. Incoherent scattering is isotropic and in a small-angle scattering experiment and thus contributes to the background signal and degrades signal to noise.
Coherent scattering essentially describes the scattering of a single neutron from all the nuclei in a sample
Incoherent scattering involves correlations between the position of an atom at time 0 and the same atom at time t
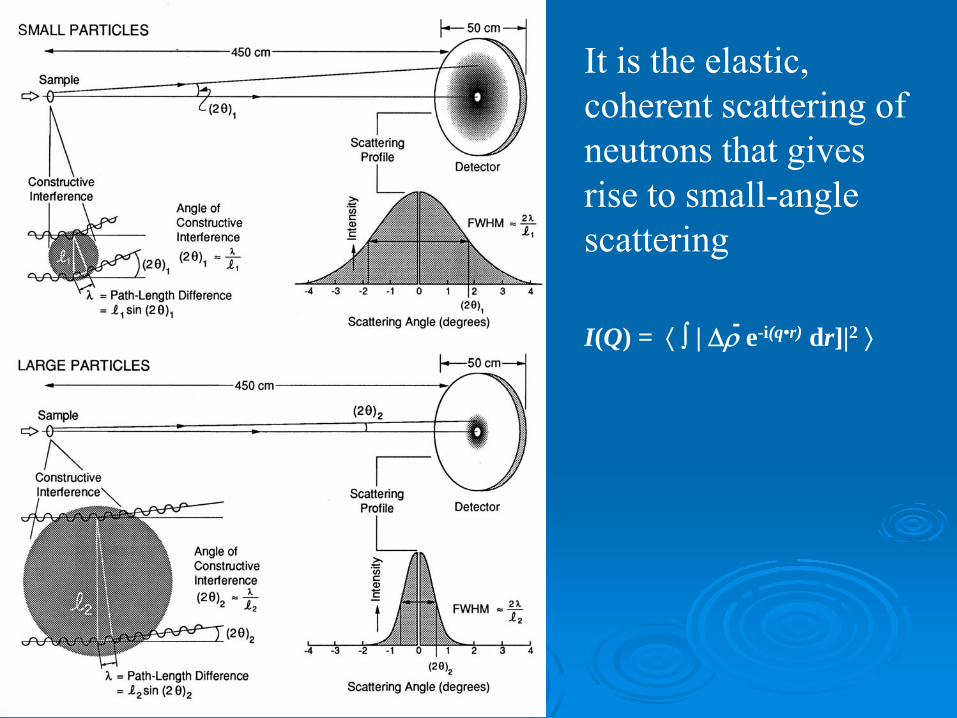
It is the elastic, coherent scattering of neutrons that gives rise to small-angle scattering
I(Q) = ⟨ ∫ | Δρ e-i(q•r) dr]|2 ⟩-

The neutron scattering power of an atom is given as b in units of length
Circular wave scattered by nucleus at the origin is:
(-b/r)eikr
b is the scattering length of the nucleus and measures the strength of the neutron-nucleus interaction. The scattering cross section
σ = 4πb2..as if b were the radius of the nucleus as seen by the neutron.

For some nuclei, b depends upon the energy of the incident neutrons because compound nuclei with energies close to those of excited nuclear states are formed during the scattering process.This resonance phenomenon gives rise to imaginary components of b. The real part of b gives rise to scattering, the imaginary part to absorption.b has to be determined experimentally for each nucleus and cannot be calculated reliably from fundamental constants.

Neutron scattering lengths for isotopes of the same element can have very different neutron scattering properties
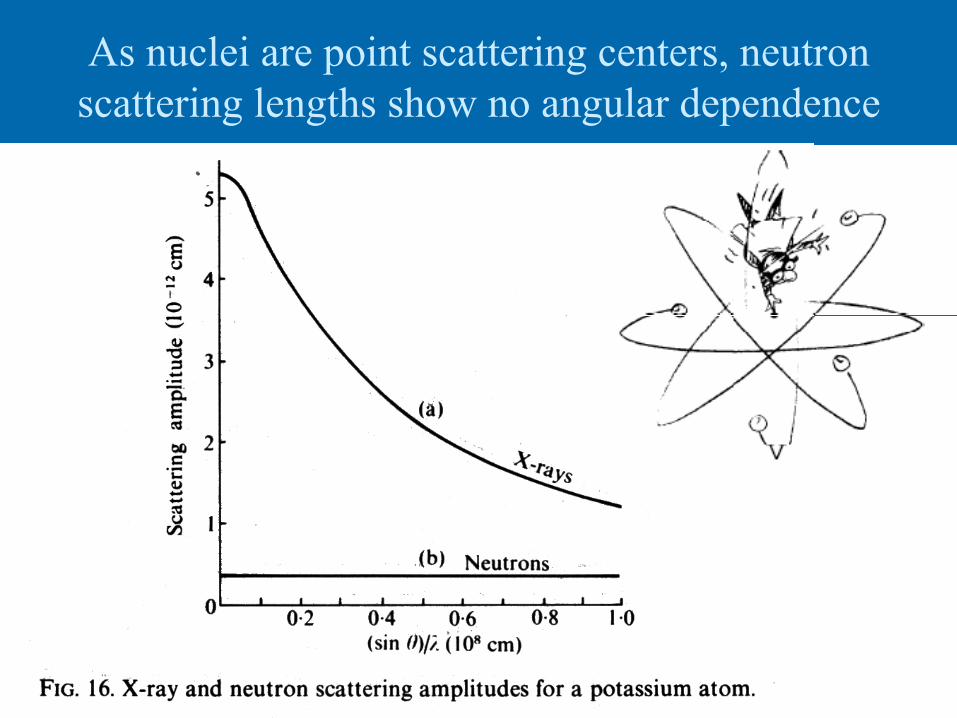
As nuclei are point scattering centers, neutron scattering lengths show no angular dependence

At very short wavelengths and low Q, the X-ray coherent scattering cross-section of an atom with Z electrons is 4π(Zr0)2, where r0 = e2/mec2 = 0.28 x 10⁻¹² cm.
Atom Nucleus (10-12 cm) fx-ray for θ = 0 in electrons (and in units of 10-12 cm)a
Hydrogen 1H -0.3742 1.000 (0.28)
Deuterium 2H 0.6671 1.000 (0.28)
Carbon 12C 0.6651 6.000 (1.69)
Nitrogen 14N 0.940 7.000 (1.97)Oxygen 16O 0.5804 8.000 (2.25)
Phosphorous 31P 0.517 15.000 (4.23)
Sulfur Mostly 32S 0.2847 16.000 (4.5)
b values for nuclei typically found in bio-molecules

I(Q) = ⟨ ∫ | Δρ e-i(q•r) dr]|2 ⟩
where Δρ=ρparticle - ρsolvent.
As average scattering length density ρ is simply the average of the sum of the scattering lengths (b)/unit volume
Because H (1H) and D (2H) have different signs, by manipulating the H/D ratio in a molecule and/or its solvent one can vary the contrast Δρ.
_ _ _
_
_
_
Solvent matching (i.e. matching the scattering density of a molecule with the solvent) facilitates study of on component by rendering another “invisible.”
Planning a neutron scattering experiment
Choose your data collection strategy (solvent matching or full contrast variation?)Determine how much sample is neededDecide which subunit to labelWhat deuteration level is needed in the labeling subunitSee MULCh*
http://www.mmb/usyd.edu.au/NCVWeb/
*MULCh, Whitten et al, J. Appl. Cryst. 2008 41, 222-226

MULChModULes for the analysis of neutron Contrast variation data
Contrast, computes neutron contrasts of the components of a complexRg, analyses the contrast dependence of the radius of gyration to yield information relating to the size and disposition of the labelled and unlabeled components in a complexCompost, decomposes the contrast variation data into composite scattering functions containing information on the shape of the labeled and unlabeled components and their dispositions
Solvent matching
Best used when you are interested in the shape of one component in a complex, possibly how it changes upon ligand binding or complex formation. Requires enough of the component to be solvent matched to complete a contrast variation series to determine required %D2O (~4 x 200-300 μL, ~5 mg/ml).Requires 200-300 μL of the labeled complex at 5-10mg/ml.

Solvent Match Point Determination

Measure data at the %D2O determined to be the solvent match point for the component that you wish to make disappear
C
r (Å)
neutron datax-ray data
0 20 40 60 80 100 120 140 1600
10
20
30
A
Q (Å-1)0.00 0.05 0.10 0.15 0.20 0.25
10-210-1100101102103104105106
x-ray dataneutron data
B x-ray dataneutron data
Ln I(
Q)
Q2 (1/Å2)0.000 0.001 0.0027
8
9
10
Comoletti et al. (2007)Structure 15, 693-705

~180Ǻ
~130Ǻ ~150Ǻ
Post-synapse
Pre-synapse
Neuroligins
β-Neurexin~70Ǻ

Deuterated calmoduln (DCaM) complexed with the MA protein from HIV-1 measured in 41% D2O. Only the DCaM contributes to the scattering and we can distinguish between a fully extended, collapsed or partially collapsed CaM conformation
Solvent Matching Experiment

Contrast variationTo determine the shapes and dispositions of labeled and unlabelled components in a complexRequires ≥ 5 x 200-300μL (= 1 – 1.5mL) of your labeled complex at ≥ 5 mg/ml .Deuteration level in labeled protein depends upon its size.
Smaller components require higher levels of deuteration to be distinguished.Ideally would like to be able to take data at the solvent match points for the labeled and unlabeled components

The host Ca2+ receptor calmodulin binds the multifunctional MA protein from HIV-1 and unfolds its N-terminal domain in the presence of Ca2+;
removal of Ca2+ results in dissociation and refolding of MA
Taylor et al., Biophys. J.103, 1-9, 2012
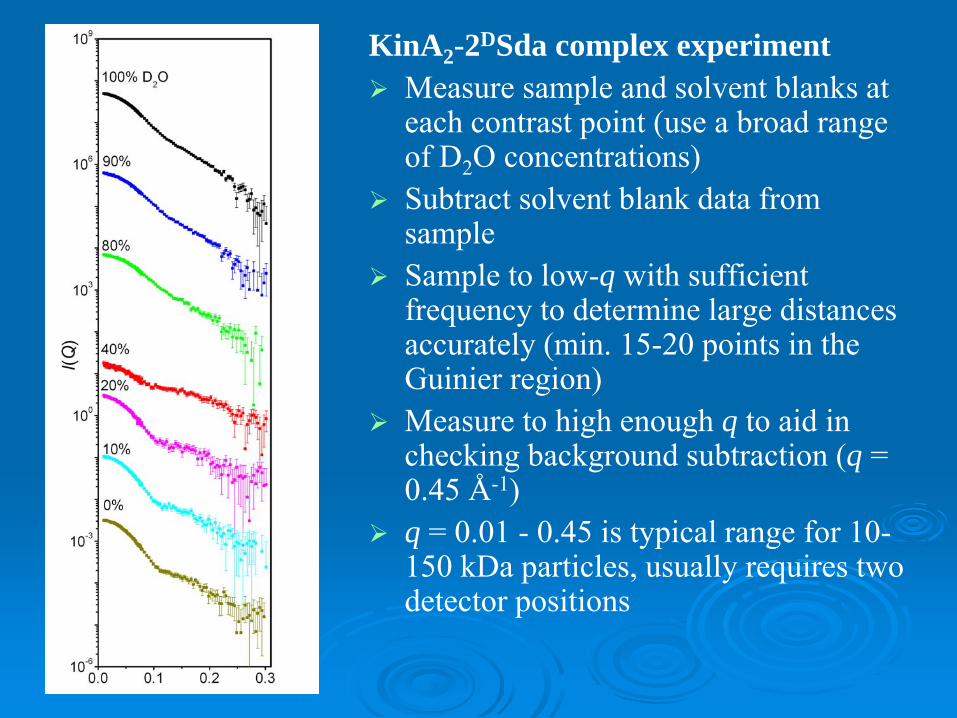
KinA2-2DSda complex experimentMeasure sample and solvent blanks at each contrast point (use a broad range of D2O concentrations)Subtract solvent blank data from sampleSample to low-q with sufficient frequency to determine large distances accurately (min. 15-20 points in the Guinier region) Measure to high enough q to aid in checking background subtraction (q = 0.45 Å-1)q = 0.01 - 0.45 is typical range for 10-150 kDa particles, usually requires two detector positions
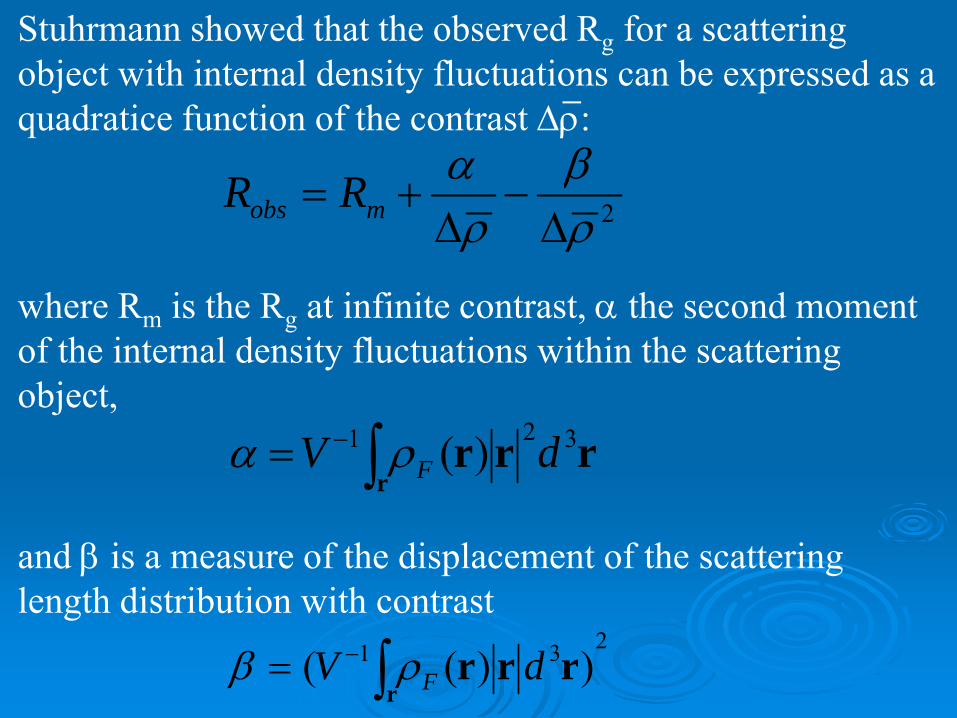
Stuhrmann showed that the observed Rg for a scattering object with internal density fluctuations can be expressed as a quadratice function of the contrast Δρ:
where Rm is the Rg at infinite contrast, α the second moment of the internal density fluctuations within the scattering object,
and β is a measure of the displacement of the scattering length distribution with contrast
2ρβ
ρα
Δ−
Δ+= mobs RR
231 ))(( ∫−=r
rrr dV Fρβ
rrrr
321 )( dV F∫−= ρα
_

zero α implies a homogeneous scattering particlepositive α implies the higher scattering density is on average more toward the outside of the particlenegative α places the higher scattering density is on average more toward the inside of the particle
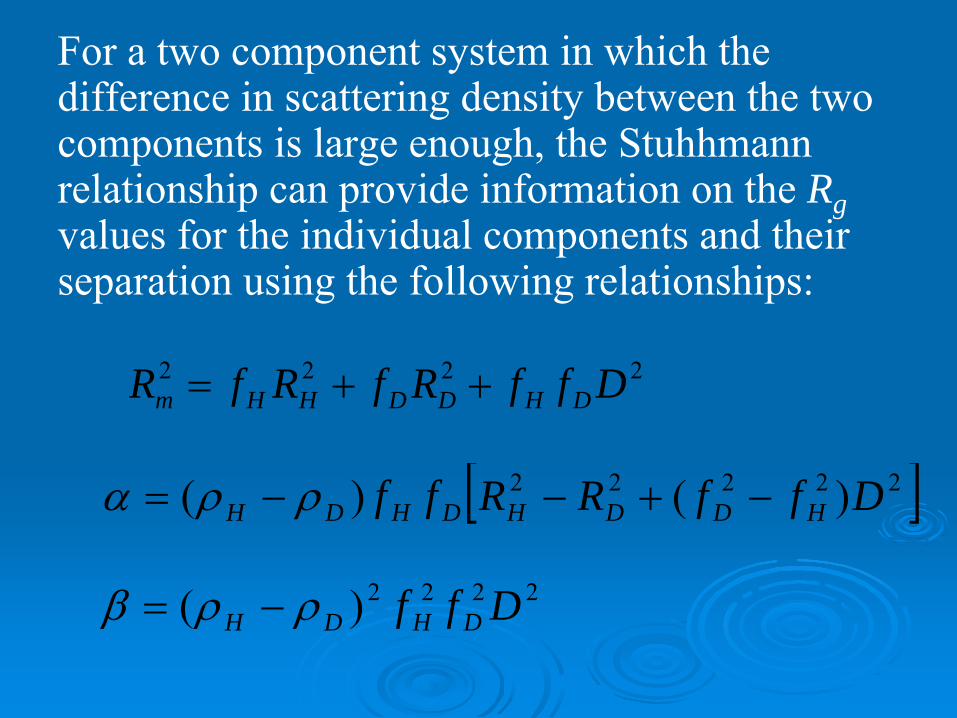
For a two component system in which the difference in scattering density between the two components is large enough, the Stuhhmann relationship can provide information on the Rgvalues for the individual components and their separation using the following relationships:
2222 DffRfRfR DHDDHHm ++=
[ ]22222 )()( DffRRff HDDHDHDH −+−−= ρρα
2222)( Dff DHDH ρρβ −=
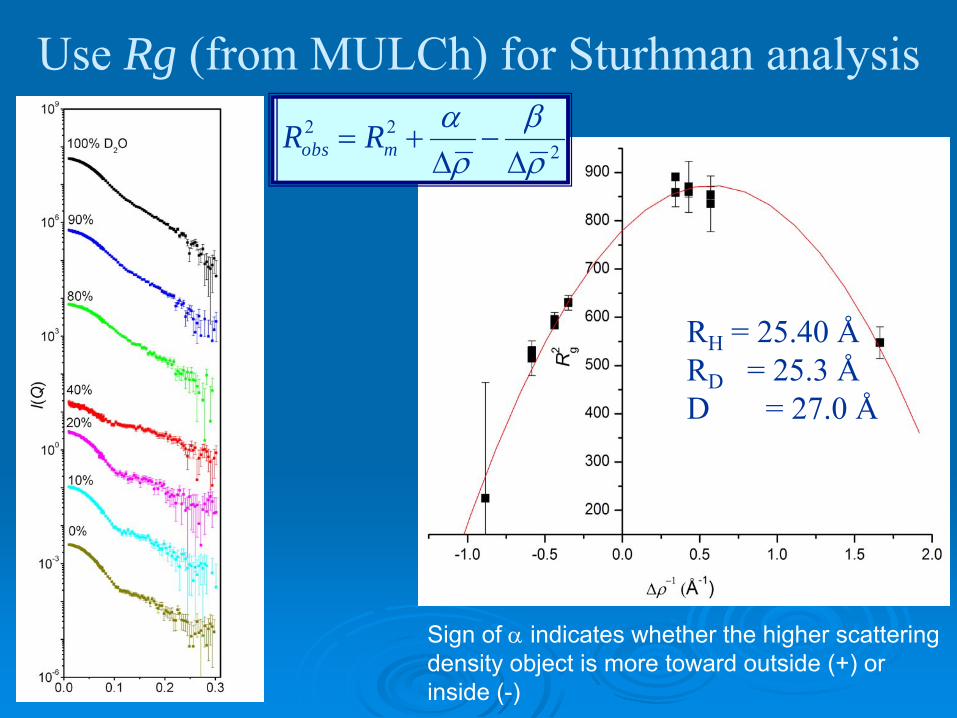
Use Rg (from MULCh) for Sturhman analysis
222
ρβ
ρα
Δ−
Δ+= mobs RR
RH = 25.40 ÅRD = 25.3 ÅD = 27.0 Å
Sign of α indicates whether the higher scattering density object is more toward outside (+) or inside (-)
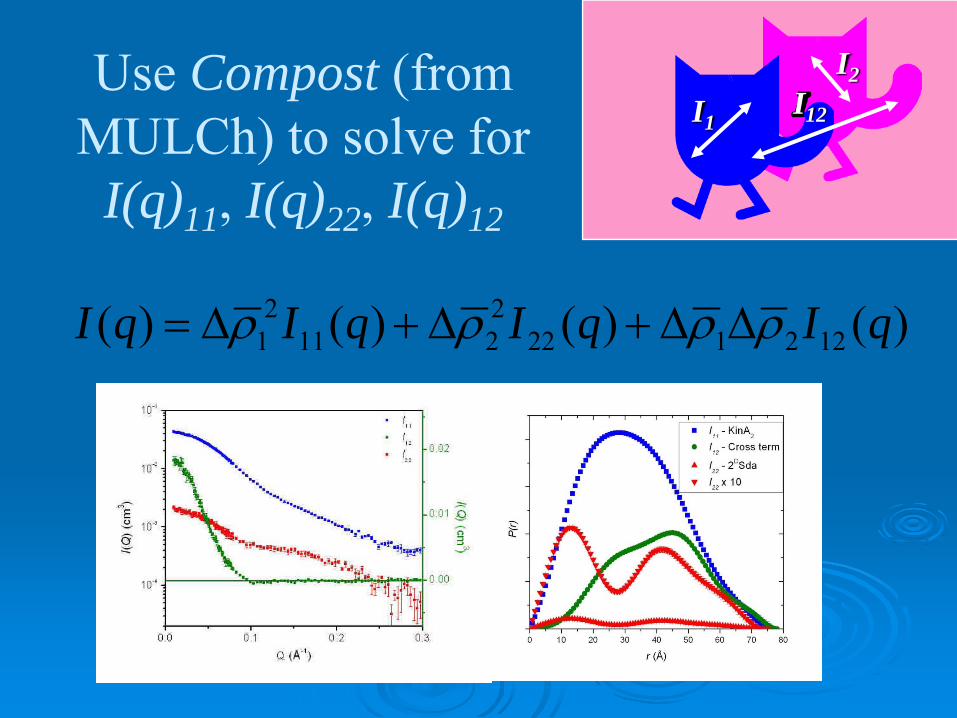
Use Compost (from MULCh) to solve for
I(q)11, I(q)22, I(q)12
I1I12
I2
)()()()( 1221222211
21 qIqIqIqI ρρρρ ΔΔ+Δ+Δ=

Each experimental scattering profile of a contrast series can be approximated by:
ΔρH(D) (= ρH(D)protein - ρsolvent ) is the mean contrast of the H and D components, IDP, IHP their scattering profiles, and Icrs is the cross term that contains information about their relative positions. The contrast terms can be calculated from the chemical composition, so one can solve for ID, IH, and IHD.
)()()()( 22 QIQIQIQI HDDHDDHH ρρρρ ΔΔ+Δ+Δ=_ _
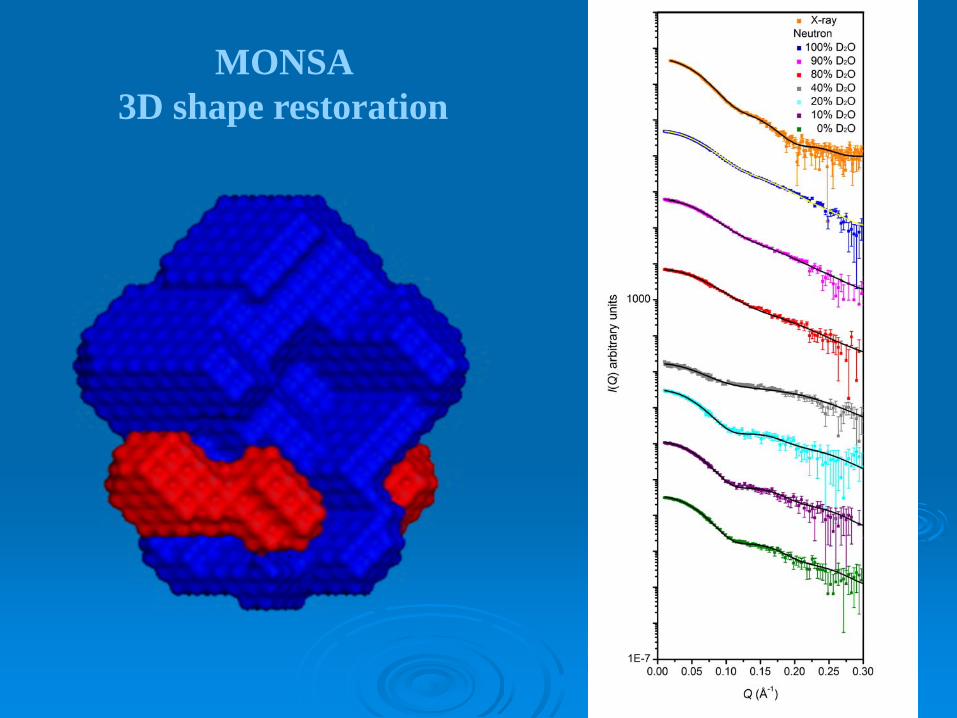
MONSA 3D shape restoration

Use SASREF7 to do rigid body refinement of the components against the scattering data (if you
have pdb files for components)
χ2 = 1.27
χ2 = 0.97
χ2 = 0.63
χ2 = 0.56
χ2 = 0.76
χ2 = 0.92
χ2 = 1.12
χ2 = 0.95
χ2
Whitten et al. (2007) J. Mol. Biol. 368, 407-420

B
Jacques et al, J. Mol. Biol. 384, 422, 2008Whitten et al., J. Mol. Biol. 368, 407, 2007
Bacterial histidine kinase (KinA) and its protein inhibitors (Sda and KipI): Neutrons reveal inhibitors bind at the base of the dimerisation domain that
connects to the sensor domains.
Sda Kip I
Sensor domains
Sensor domains
Kin A Kin A

Contrast variation in biomolecules can take advantage of the fortuitous fact that the major bio-molecular constituents of have mean scattering length densities that are distinct and lie between the values for pure D2O and pure H2OM
ean
scat
terin
g le
ngth
den
sity
(1010
cm2 )
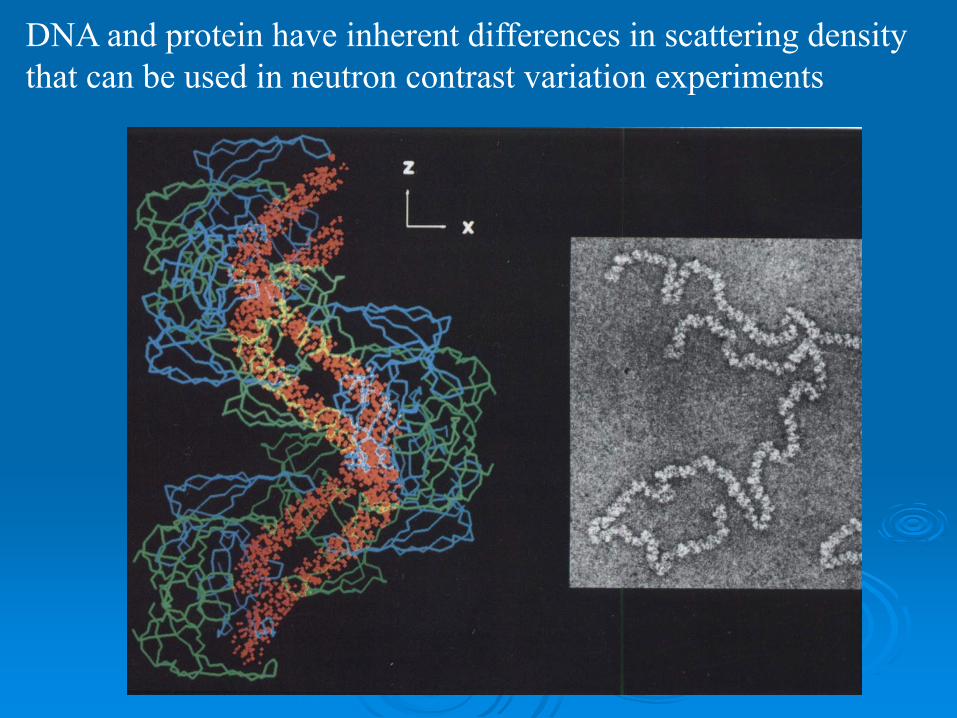
DNA and protein have inherent differences in scattering density that can be used in neutron contrast variation experiments

Neutron scattering sample cellsHelma quartz cells (high precision path-length, suprasil) – need lots of them! Banjo-style (280 μL per 1 mm path length) or rectangular (170 μL per 1 mm path length) cells can be usedPath lengths are only good to 1%, so good idea to measure sample and solvent background in the same cell if practical, but experiment logistics may prohibit that, so calibrate cells? High incoherent scattering for 1H means you always want ≤ 1mm 1H2O in the neutron beam to avoid multiple scattering

NeutronsNon-ionizing radiationPenetratingWavelength and energies available that are suitable for probing structures with dimensions 1-1000s ÅCoherent scattering lengths that vary randomly with atomic weight and large isotope effect for hydrogen –contrast variationLarge incoherent scattering cross-section for 1H is a source of noise in small-angle scatteringInteract weakly with matter and are difficult to produce and detect – therefore should only be used when they provide information that cannot be otherwise obtained.

Jacques & Trewhella(2010) “Small-angle Scattering for Structural Biology; Expanding the Frontier While Avoiding the Pitfalls,” Protein Science 19, 642-657
also: Jacques, Guss, Svergun and Trewhella (2012) Acta D in press Publication guidelines for structural modelling of small-angle scattering data from biomolecules in solution

Sample qualityHigh sample quality is required for SAS experiments. As such the authors must demonstrate as clearly as possible that any sample is of sufficient quality to yield meaningful results in a SAS experiment.
Data acquisition and reductionDetails on the execution of the SAS experiment must be provided.
Presentation of the scattering dataIn order for a reader to be able to assess the quality of a SAS experiment, it is necessary that the data be presented in a clear, well described manner.
ModellingWhere the experimenter is looking to support a three-dimensional model, any modelling must be justified and described thoroughly.
Publication guidelines - commentary
Jacques et al. (2012) Acta Cryst. D64, 620.

Publication guidelines - IUCrActa Crystallographica – notes for authors
11.3. Small-angle scattering data
Guidelines for articles reporting structural modelling of small angle scattering may be found at
http://journals.iucr.org/services/sas/.
For articles that present experimental SAS data, the deposition of an ASCII file representing the background-corrected scattering profile(s) with errors is recommended.
draft requirements for presenting biological macromolecule small-angle scattering data
It is not the intention of this document to define a quality requirement for SAS experiments that would be acceptable for publication. Rather, the purpose is to outline the way in which SAS experiments should be presented in order to enable the reader to independently assess the quality of any interpretations made by the authors.

Publication guidelines – Sample Qualityhttp://journals.iucr.org/services/sas/
Sample qualityHigh sample quality is required for SAS experiments. As such the authors must demonstrate as clearly as possible that any sample is of sufficient quality to yield meaningful results in a SAS experiment.
Essential• A complete description of the sample must be made available; including sequences for proteins and
polynucleotides (including purification tags), modifications and cofactors.• Sample purification procedure must be reported, along with an estimate of the final purity and how
this was estimated.• Solvent blank composition (including pH for aqueous systems) must be reported.• For SANS contrast variation experiments, a statement describing the level of deuteration in
biomolecules and their solvents and how it was determined is required.• Sample concentration(s) and method(s) of determination must be reported, including extinction
coefficients when 280 nm absorbance measurements are used.
Preferable• A SAS-independent assessment of monodispersity (DLS and/or aggregate-free gel filtration and/or
MALLS) gives the reader confidence in the results and should be reported for globular proteins where available.
• A statement describing how the solvent blank was obtained (e.g. dialysis, column flow through) should be made.
Publication guidelines – Data Acquisitionhttp://journals.iucr.org/services/sas/
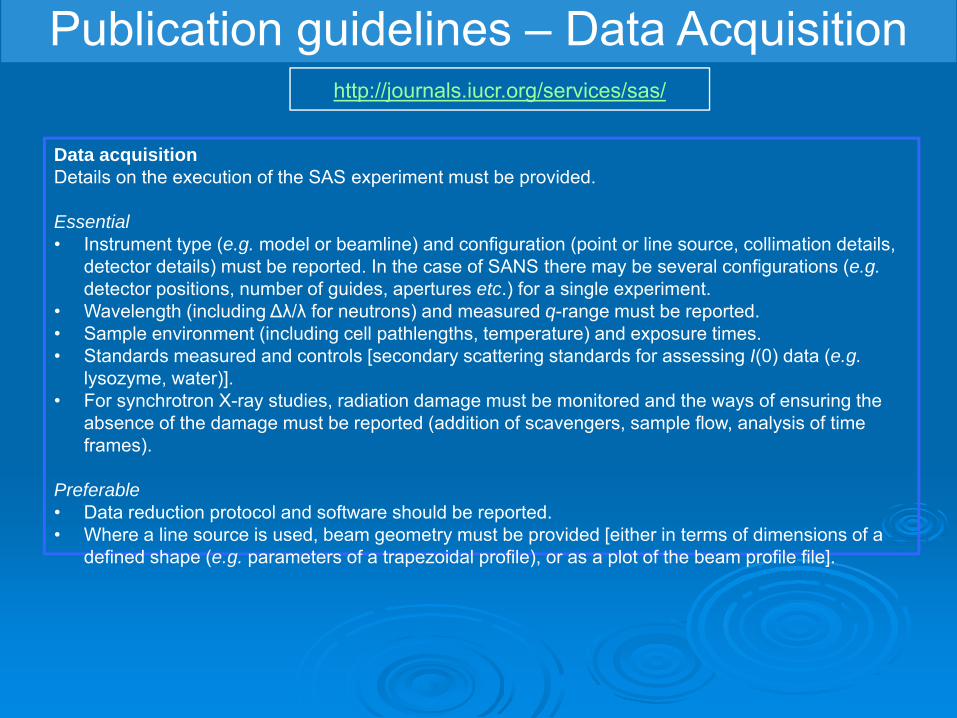
Data acquisitionDetails on the execution of the SAS experiment must be provided.
Essential• Instrument type (e.g. model or beamline) and configuration (point or line source, collimation details,
detector details) must be reported. In the case of SANS there may be several configurations (e.g.detector positions, number of guides, apertures etc.) for a single experiment.
• Wavelength (including ∆λ/λ for neutrons) and measured q-range must be reported.• Sample environment (including cell pathlengths, temperature) and exposure times.• Standards measured and controls [secondary scattering standards for assessing I(0) data (e.g.
lysozyme, water)].• For synchrotron X-ray studies, radiation damage must be monitored and the ways of ensuring the
absence of the damage must be reported (addition of scavengers, sample flow, analysis of time frames).
Preferable• Data reduction protocol and software should be reported.• Where a line source is used, beam geometry must be provided [either in terms of dimensions of a
defined shape (e.g. parameters of a trapezoidal profile), or as a plot of the beam profile file].

Publication guidelines – Exp Validationhttp://journals.iucr.org/services/sas/
Experimental validationIn order for a reader to be able to assess the quality of a SAS experiment, it is necessary that the data be presented in a clear, well described manner.
Essential• Where possible, scattering profiles [I(q) versus q] and P(r) profiles [P(r) versus r] should be reported in the bulk
manuscript. If space is restricted, plots may be reported in supplementary materials. I(q) plots should be presented either as linear X–log Y or log X–log Y axes. The linear X–linear Y representation should be avoided. Where possible, data should be placed on an absolute scale; however, multiple curves may be offset on the same plot for clarity, provided that this is explained in the figure caption.
• For structural characterisation of isotropic samples, Guinier plots must be shown. The Guinier range should be given explicitly and the linear fitting should be displayed in the range not exceeding qRg = 1.3. Gunier plots may be included as stand-alone figures, insets to I(q) versus q plots, or reported in the supplementary materials.
• The plots containing experimental data must show propagated errors (usually based on counting statistics).• If the presented data are desmeared (to correct for beam geometry or polychromaticity), this fact must be reported as
well as the method for desmearing.• Molecular weight estimates using either I(0) or the molecular volume determined by Porod invariant must be reported,
including uncertainties in the parameters used in the determination. • The data must be recorded at multiple solute concentrations to eliminate the possibility of concentration-dependent
oligomerisation or interparticle interference. • For contrast variation experiments (both SAXS and SANS) the nature and number of contrast points should be
reported. The plot of normalized ±√I(0) versus solvent density particle matching point must be presented.
Preferable• Theoretical contrasts and molecular weights for globular samples should be reported along with the method of
calculation.• Extrapolation to infinite dilution is desirable to avoid interference effects. Where no change in Rg or I(0)/C is observed
with increasing concentration (C), this fact should be reported.• For the contrast variation experiments, Stuhrmann plots of Rg
2 versus the reciprocal of contrast are desirable. Extracted component scattering functions (including cross-term) are desirable.

Publication guidelines – Modellinghttp://journals.iucr.org/services/sas/
ModellingWhere the experimenter is looking to support a three-dimensional model, any modelling must be justified and described thoroughly.
Essential• All software used for modelling [including generating P(r) profiles] must be reported.• χ2 values and a plot of the model fit to the experimental I(q) versus q must be shown for at least the
best model.• Analysis of the ambiguity of the reconstruction (averaging or clustering) must be done. • For rigid-body modelling, a description of how the starting models were obtained (e.g. crystal structure
of a domain, homology model etc.) as well as any connectivity or distance constraints and how they were chosen.
• Any modelling assumptions (e.g. symmetry) must be stated.
Preferable• If multiple modelling protocols were utilized, all χ2’s and fits to the data should be shown (in the
supplementary materials if necessary).• Any additional experimental evidence supporting modelling assumptions and therefore enabling
modelling restraints should be reported.


![Whole Genome Shatqun updates) C] EMBL (Cantiq release) C] EMBL (Coding Sequences) C] Genome Reviews C] EMBL ID/ Accession Mapping C] EMBL MGA Nucleotide sequence databases - subsections](https://img.pdfslide.us/doc/110x75/5ccc4c0c88c993de558c2477/whole-genome-shatqun-updates-c-embl-cantiq-release-c-embl-coding-sequences.jpg)