Embed Size (px)
Citation preview
Report Compiled by: Business Intelligence, North Yorkshire and Humber Commissioning Support Unit
Report Checked by: SR CCG Chief Operating Officer
Report Date: 15th February 2013
Scarborough & Ryedale CCG
Core Performance DashboardFebruary 2013
Page 1 of 11
Page
3
Domain 1: Preventing people from dying prematurely 4
Domain 2: Enhancing quality of life for people with long term conditions 4
Domain 3: Helping people recover from episodes of ill health or injury 5
Domain 4: Ensuring that people have a positive experience of care 5
Domain 5: Providing a safe environment and protecting from harm 6
Exception Report for National Quality and Performance Indicators 7
Activity Trends 8
Key Financial Metrics 9
Financial Overview CCG Level 10
11
CONTENTS
Summary assessment
Performance and Quality Indicators
Financial Performance
QIPP
Page 2 of 11
Qu
ality
Perf
orm
an
ce
Fin
an
ce
QIP
P
Tra
nsit
ion
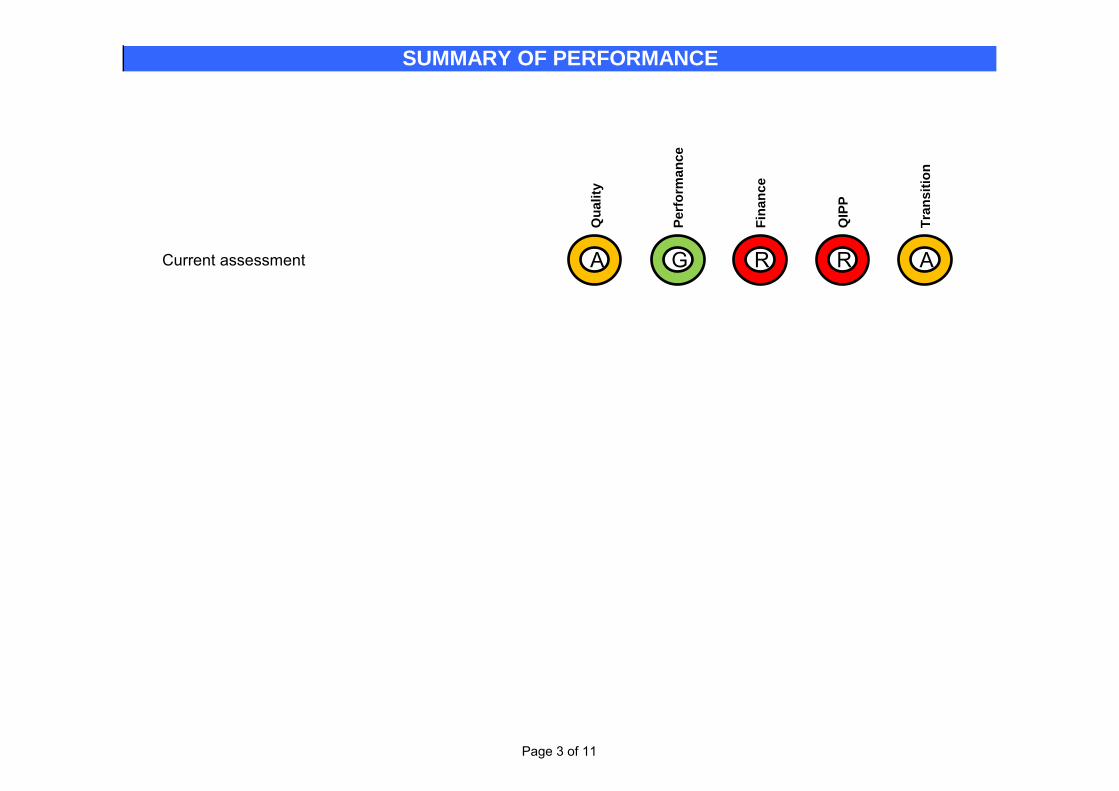
Current assessment A G R R A
SUMMARY OF PERFORMANCE
Page 3 of 11
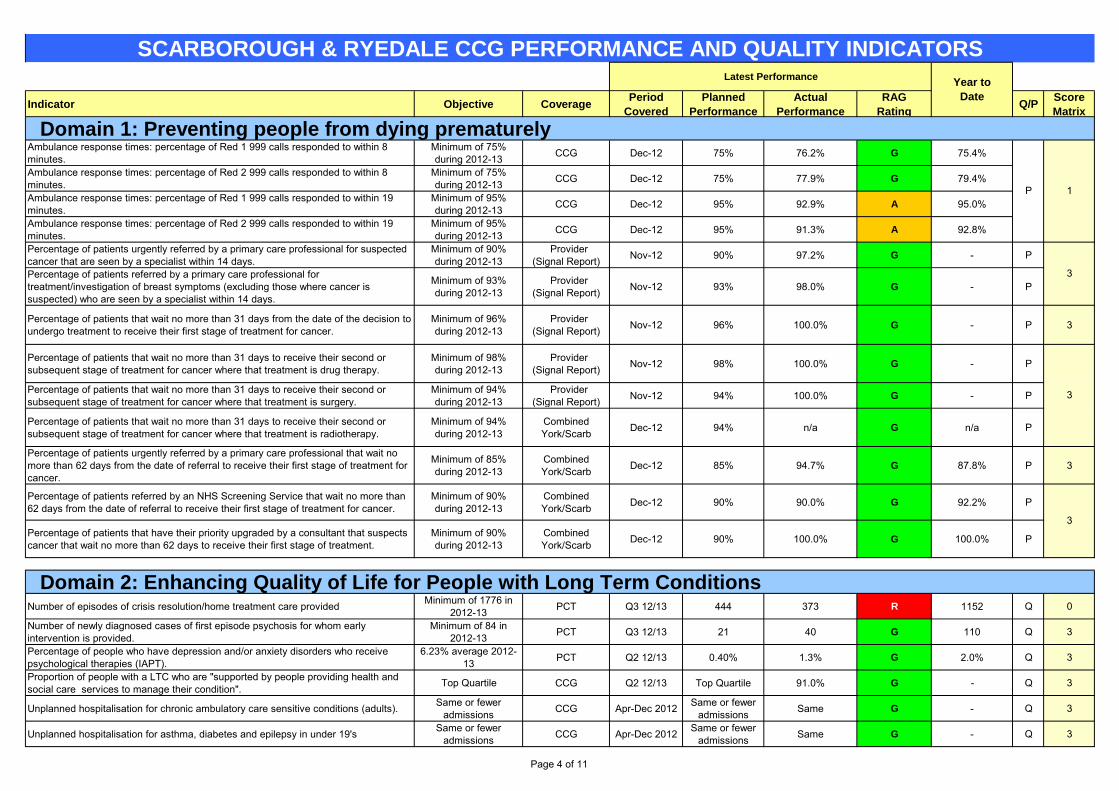
SCARBOROUGH & RYEDALE CCG PERFORMANCE AND QUALITY INDICATORSSCR Latest Performance
Indicator Objective CoveragePeriod
Covered
Planned
Performance
Actual
Performance
RAG
RatingQ/P
Score
Matrix
Domain 1: Preventing people from dying prematurelyAmbulance response times: percentage of Red 1 999 calls responded to within 8
minutes.
Minimum of 75%
during 2012-13CCG Dec-12 75% 76.2% G 75.4%
Ambulance response times: percentage of Red 2 999 calls responded to within 8
minutes.
Minimum of 75%
during 2012-13CCG Dec-12 75% 77.9% G 79.4%
Ambulance response times: percentage of Red 1 999 calls responded to within 19
minutes.
Minimum of 95%
during 2012-13CCG Dec-12 95% 92.9% A 95.0%
Ambulance response times: percentage of Red 2 999 calls responded to within 19
minutes.
Minimum of 95%
during 2012-13CCG Dec-12 95% 91.3% A 92.8%
Percentage of patients urgently referred by a primary care professional for suspected
cancer that are seen by a specialist within 14 days.
Minimum of 90%
during 2012-13
Provider
(Signal Report)Nov-12 90% 97.2% G - P
Percentage of patients referred by a primary care professional for
treatment/investigation of breast symptoms (excluding those where cancer is
suspected) who are seen by a specialist within 14 days.
Minimum of 93%
during 2012-13
Provider
(Signal Report)Nov-12 93% 98.0% G - P
Percentage of patients that wait no more than 31 days from the date of the decision to
undergo treatment to receive their first stage of treatment for cancer.
Minimum of 96%
during 2012-13
Provider
(Signal Report)Nov-12 96% 100.0% G - P 3
Percentage of patients that wait no more than 31 days to receive their second or
subsequent stage of treatment for cancer where that treatment is drug therapy.
Minimum of 98%
during 2012-13
Provider
(Signal Report)Nov-12 98% 100.0% G - P
Percentage of patients that wait no more than 31 days to receive their second or
subsequent stage of treatment for cancer where that treatment is surgery.
Minimum of 94%
during 2012-13
Provider
(Signal Report)Nov-12 94% 100.0% G - P
Percentage of patients that wait no more than 31 days to receive their second or
subsequent stage of treatment for cancer where that treatment is radiotherapy.
Minimum of 94%
during 2012-13
Combined
York/ScarbDec-12 94% n/a G n/a P
Percentage of patients urgently referred by a primary care professional that wait no
more than 62 days from the date of referral to receive their first stage of treatment for
cancer.
Minimum of 85%
during 2012-13
Combined
York/ScarbDec-12 85% 94.7% G 87.8% P 3
Percentage of patients referred by an NHS Screening Service that wait no more than
62 days from the date of referral to receive their first stage of treatment for cancer.
Minimum of 90%
during 2012-13
Combined
York/ScarbDec-12 90% 90.0% G 92.2% P
Percentage of patients that have their priority upgraded by a consultant that suspects
cancer that wait no more than 62 days to receive their first stage of treatment.
Minimum of 90%
during 2012-13
Combined
York/ScarbDec-12 90% 100.0% G 100.0% P
Domain 2: Enhancing Quality of Life for People with Long Term ConditionsNumber of episodes of crisis resolution/home treatment care provided
Minimum of 1776 in
2012-13PCT Q3 12/13 444 373 R 1152 Q 0
Number of newly diagnosed cases of first episode psychosis for whom early
intervention is provided.
Minimum of 84 in
2012-13PCT Q3 12/13 21 40 G 110 Q 3
Percentage of people who have depression and/or anxiety disorders who receive
psychological therapies (IAPT).
6.23% average 2012-
13PCT Q2 12/13 0.40% 1.3% G 2.0% Q 3
Proportion of people with a LTC who are "supported by people providing health and
social care services to manage their condition".Top Quartile CCG Q2 12/13 Top Quartile 91.0% G - Q 3
Unplanned hospitalisation for chronic ambulatory care sensitive conditions (adults).Same or fewer
admissionsCCG Apr-Dec 2012
Same or fewer
admissionsSame G - Q 3
Unplanned hospitalisation for asthma, diabetes and epilepsy in under 19'sSame or fewer
admissionsCCG Apr-Dec 2012
Same or fewer
admissionsSame G - Q 3
P 1
Year to
Date
3
3
3
Page 4 of 11
SCARBOROUGH & RYEDALE CCG PERFORMANCE AND QUALITY INDICATORSSCR Latest Performance
Indicator Objective CoveragePeriod
Covered
Planned
Performance
Actual
Performance
RAG
RatingQ/P
Score
Matrix
Year to
Date
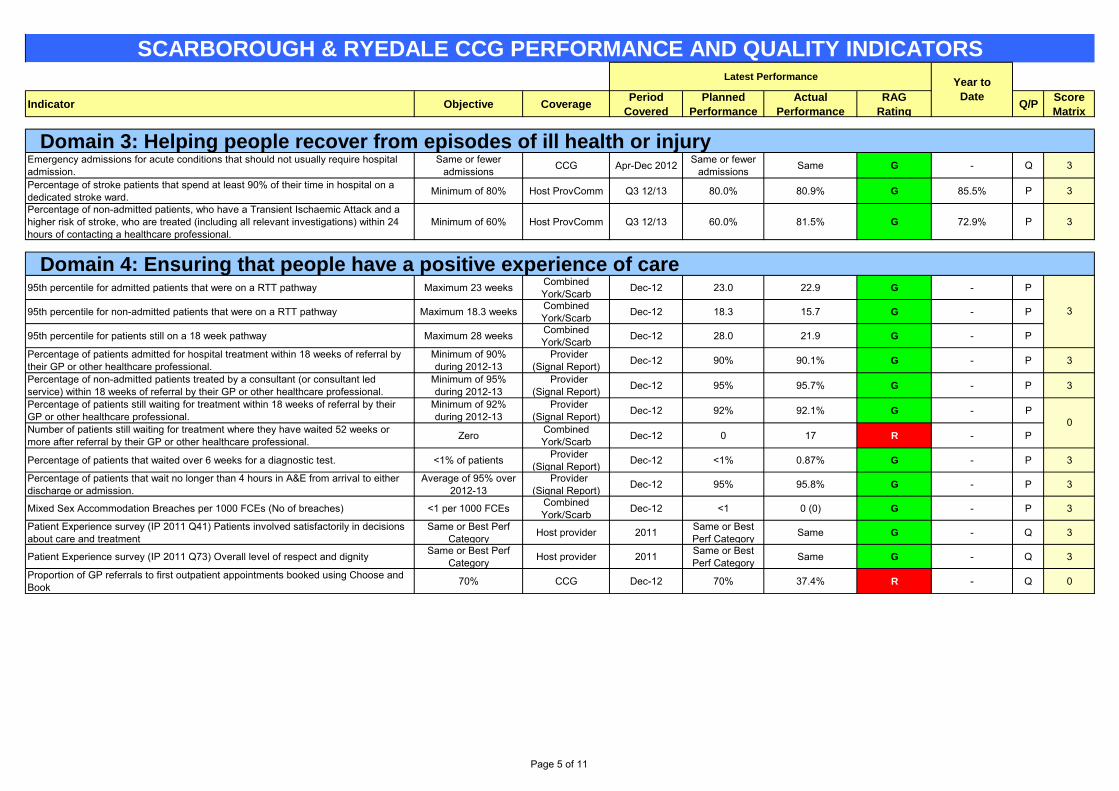
Domain 3: Helping people recover from episodes of ill health or injuryEmergency admissions for acute conditions that should not usually require hospital
admission.
Same or fewer
admissionsCCG Apr-Dec 2012
Same or fewer
admissionsSame G - Q 3
Percentage of stroke patients that spend at least 90% of their time in hospital on a
dedicated stroke ward.Minimum of 80% Host ProvComm Q3 12/13 80.0% 80.9% G 85.5% P 3
Percentage of non-admitted patients, who have a Transient Ischaemic Attack and a
higher risk of stroke, who are treated (including all relevant investigations) within 24
hours of contacting a healthcare professional.
Minimum of 60% Host ProvComm Q3 12/13 60.0% 81.5% G 72.9% P 3
Domain 4: Ensuring that people have a positive experience of care95th percentile for admitted patients that were on a RTT pathway Maximum 23 weeks
Combined
York/ScarbDec-12 23.0 22.9 G - P
95th percentile for non-admitted patients that were on a RTT pathway Maximum 18.3 weeksCombined
York/ScarbDec-12 18.3 15.7 G - P
95th percentile for patients still on a 18 week pathway Maximum 28 weeksCombined
York/ScarbDec-12 28.0 21.9 G - P
Percentage of patients admitted for hospital treatment within 18 weeks of referral by
their GP or other healthcare professional.
Minimum of 90%
during 2012-13
Provider
(Signal Report)Dec-12 90% 90.1% G - P 3
Percentage of non-admitted patients treated by a consultant (or consultant led
service) within 18 weeks of referral by their GP or other healthcare professional.
Minimum of 95%
during 2012-13
Provider
(Signal Report)Dec-12 95% 95.7% G - P 3
Percentage of patients still waiting for treatment within 18 weeks of referral by their
GP or other healthcare professional.
Minimum of 92%
during 2012-13
Provider
(Signal Report)Dec-12 92% 92.1% G - P
Number of patients still waiting for treatment where they have waited 52 weeks or
more after referral by their GP or other healthcare professional.Zero
Combined
York/ScarbDec-12 0 17 R - P
Percentage of patients that waited over 6 weeks for a diagnostic test. <1% of patients Provider
(Signal Report)Dec-12 <1% 0.87% G - P 3
Percentage of patients that wait no longer than 4 hours in A&E from arrival to either
discharge or admission.
Average of 95% over
2012-13
Provider
(Signal Report)Dec-12 95% 95.8% G - P 3
Mixed Sex Accommodation Breaches per 1000 FCEs (No of breaches) <1 per 1000 FCEsCombined
York/ScarbDec-12 <1 0 (0) G - P 3
Patient Experience survey (IP 2011 Q41) Patients involved satisfactorily in decisions
about care and treatment
Same or Best Perf
CategoryHost provider 2011
Same or Best
Perf CategorySame G - Q 3
Patient Experience survey (IP 2011 Q73) Overall level of respect and dignitySame or Best Perf
CategoryHost provider 2011
Same or Best
Perf CategorySame G - Q 3
Proportion of GP referrals to first outpatient appointments booked using Choose and
Book70% CCG Dec-12 70% 37.4% R - Q 0
3
0
Page 5 of 11
SCARBOROUGH & RYEDALE CCG PERFORMANCE AND QUALITY INDICATORSSCR Latest Performance
Indicator Objective CoveragePeriod
Covered
Planned
Performance
Actual
Performance
RAG
RatingQ/P
Score
Matrix
Year to
Date
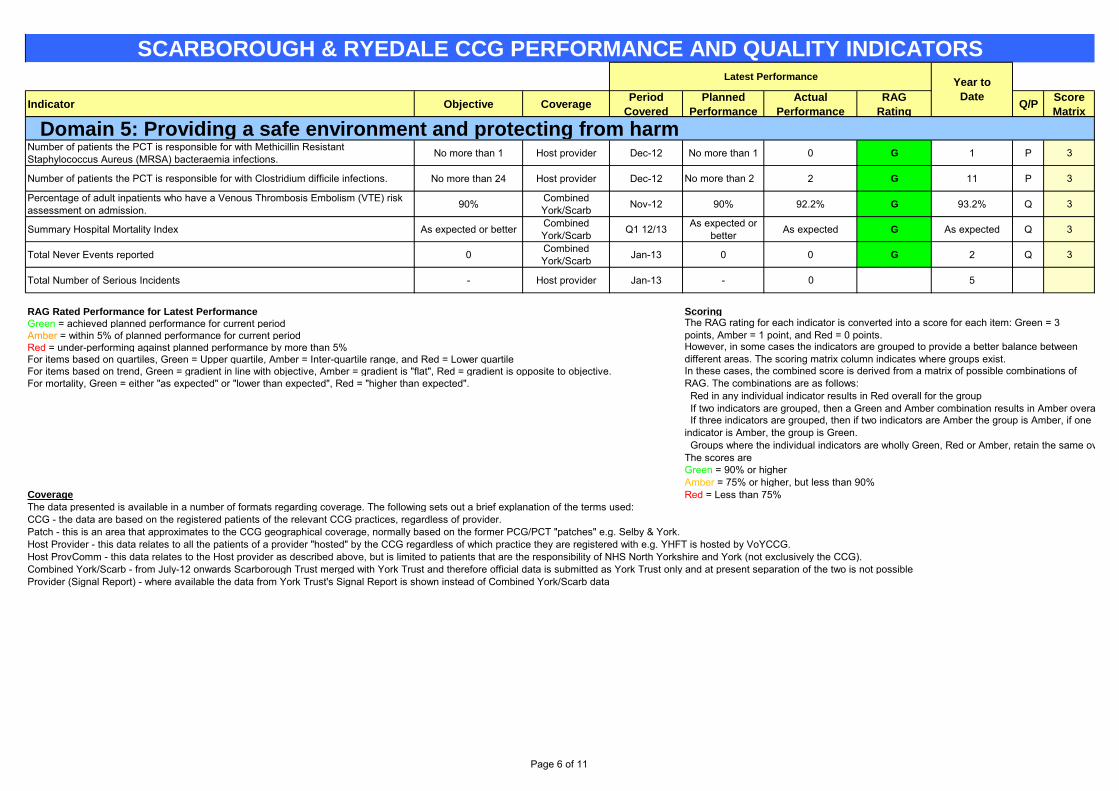
Domain 5: Providing a safe environment and protecting from harmNumber of patients the PCT is responsible for with Methicillin Resistant
Staphylococcus Aureus (MRSA) bacteraemia infections.No more than 1 Host provider Dec-12 No more than 1 0 G 1 P 3
Number of patients the PCT is responsible for with Clostridium difficile infections. No more than 24 Host provider Dec-12 No more than 2 2 G 11 P 3
Percentage of adult inpatients who have a Venous Thrombosis Embolism (VTE) risk
assessment on admission.90%
Combined
York/ScarbNov-12 90% 92.2% G 93.2% Q 3
Summary Hospital Mortality Index As expected or betterCombined
York/ScarbQ1 12/13
As expected or
betterAs expected G As expected Q 3
Total Never Events reported 0Combined
York/ScarbJan-13 0 0 G 2 Q 3
Total Number of Serious Incidents - Host provider Jan-13 - 0 5
RAG Rated Performance for Latest Performance Scoring
Green = achieved planned performance for current period
Amber = within 5% of planned performance for current period
Red = under-performing against planned performance by more than 5%
For items based on quartiles, Green = Upper quartile, Amber = Inter-quartile range, and Red = Lower quartile
For items based on trend, Green = gradient in line with objective, Amber = gradient is "flat", Red = gradient is opposite to objective.
For mortality, Green = either "as expected" or "lower than expected", Red = "higher than expected".
Red in any individual indicator results in Red overall for the group
If two indicators are grouped, then a Green and Amber combination results in Amber overall.
Groups where the individual indicators are wholly Green, Red or Amber, retain the same overall RAG.
The scores are
Green = 90% or higher
Amber = 75% or higher, but less than 90%
Coverage Red = Less than 75%
The data presented is available in a number of formats regarding coverage. The following sets out a brief explanation of the terms used:
CCG - the data are based on the registered patients of the relevant CCG practices, regardless of provider.
Patch - this is an area that approximates to the CCG geographical coverage, normally based on the former PCG/PCT "patches" e.g. Selby & York.
Host Provider - this data relates to all the patients of a provider "hosted" by the CCG regardless of which practice they are registered with e.g. YHFT is hosted by VoYCCG.
Host ProvComm - this data relates to the Host provider as described above, but is limited to patients that are the responsibility of NHS North Yorkshire and York (not exclusively the CCG).
Combined York/Scarb - from July-12 onwards Scarborough Trust merged with York Trust and therefore official data is submitted as York Trust only and at present separation of the two is not possible
Provider (Signal Report) - where available the data from York Trust's Signal Report is shown instead of Combined York/Scarb data
In these cases, the combined score is derived from a matrix of possible combinations of
RAG. The combinations are as follows:
If three indicators are grouped, then if two indicators are Amber the group is Amber, if one
indicator is Amber, the group is Green.
However, in some cases the indicators are grouped to provide a better balance between
different areas. The scoring matrix column indicates where groups exist.
The RAG rating for each indicator is converted into a score for each item: Green = 3
points, Amber = 1 point, and Red = 0 points.
Page 6 of 11
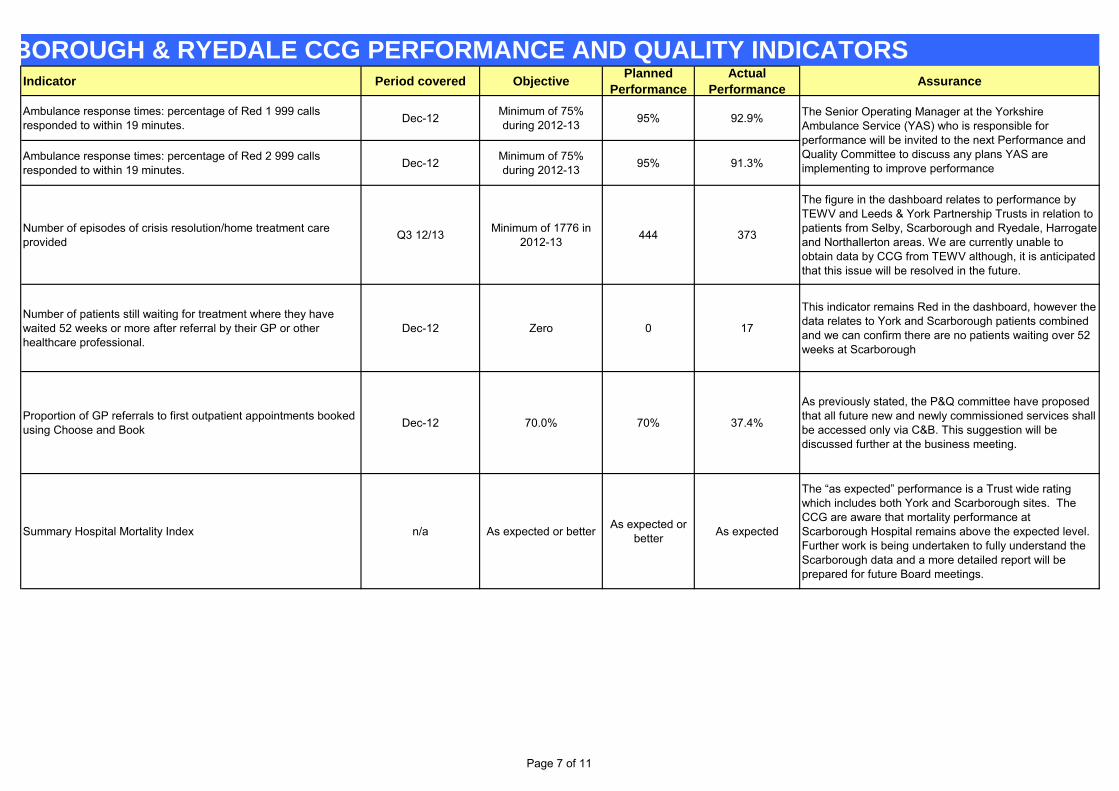
Indicator Period covered ObjectivePlanned
Performance
Actual
PerformanceAssurance
Ambulance response times: percentage of Red 1 999 calls
responded to within 19 minutes.Dec-12
Minimum of 75%
during 2012-1395% 92.9%
Ambulance response times: percentage of Red 2 999 calls
responded to within 19 minutes.Dec-12
Minimum of 75%
during 2012-1395% 91.3%
Number of episodes of crisis resolution/home treatment care
providedQ3 12/13
Minimum of 1776 in
2012-13444 373
The figure in the dashboard relates to performance by
TEWV and Leeds & York Partnership Trusts in relation to
patients from Selby, Scarborough and Ryedale, Harrogate
and Northallerton areas. We are currently unable to
obtain data by CCG from TEWV although, it is anticipated
that this issue will be resolved in the future.
Number of patients still waiting for treatment where they have
waited 52 weeks or more after referral by their GP or other
healthcare professional.
Dec-12 Zero 0 17
This indicator remains Red in the dashboard, however the
data relates to York and Scarborough patients combined
and we can confirm there are no patients waiting over 52
weeks at Scarborough
Proportion of GP referrals to first outpatient appointments booked
using Choose and BookDec-12 70.0% 70% 37.4%
As previously stated, the P&Q committee have proposed
that all future new and newly commissioned services shall
be accessed only via C&B. This suggestion will be
discussed further at the business meeting.
Summary Hospital Mortality Index n/a As expected or betterAs expected or
betterAs expected
The “as expected” performance is a Trust wide rating
which includes both York and Scarborough sites. The
CCG are aware that mortality performance at
Scarborough Hospital remains above the expected level.
Further work is being undertaken to fully understand the
Scarborough data and a more detailed report will be
prepared for future Board meetings.
SCARBOROUGH & RYEDALE CCG PERFORMANCE AND QUALITY INDICATORS
The Senior Operating Manager at the Yorkshire
Ambulance Service (YAS) who is responsible for
performance will be invited to the next Performance and
Quality Committee to discuss any plans YAS are
implementing to improve performance
Page 7 of 11
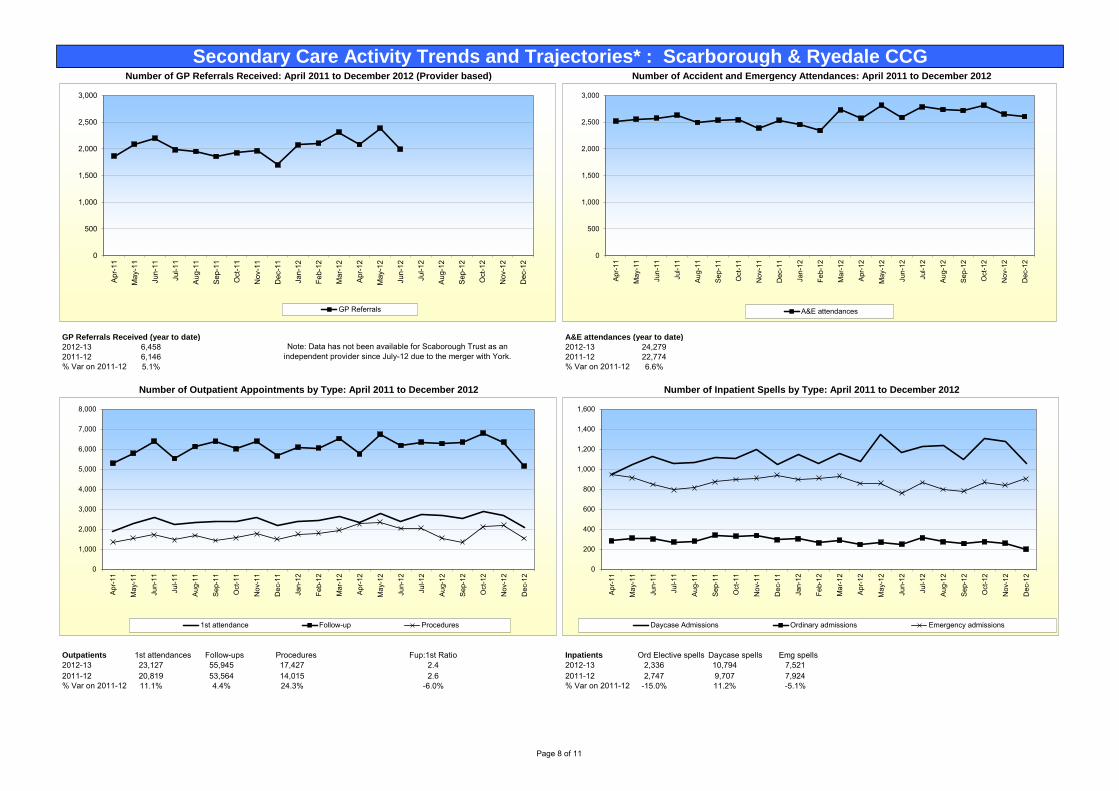
GP Referrals Received (year to date) A&E attendances (year to date)
2012-13 6,458 2012-13 24,279
2011-12 6,146 2011-12 22,774
% Var on 2011-12 5.1% % Var on 2011-12 6.6%
Outpatients 1st attendances Follow-ups Procedures Non face to face Fup:1st Ratio Inpatients Ord Elective spells Daycase spells Emg spells
2012-13 23,127 55,945 17,427 2.4 2012-13 2,336 10,794 7,521
2011-12 20,819 53,564 14,015 2.6 2011-12 2,747 9,707 7,924
% Var on 2011-12 11.1% 4.4% 24.3% -6.0% % Var on 2011-12 -15.0% 11.2% -5.1%
Secondary Care Activity Trends and Trajectories* : Scarborough & Ryedale CCGNumber of GP Referrals Received: April 2011 to December 2012 (Provider based) Number of Accident and Emergency Attendances: April 2011 to December 2012
Number of Outpatient Appointments by Type: April 2011 to December 2012 Number of Inpatient Spells by Type: April 2011 to December 2012
Note: Data has not been available for Scaborough Trust as an
independent provider since July-12 due to the merger with York.
0
500
1,000
1,500
2,000
2,500
3,000
Apr-
11
Ma
y-1
1
Jun-1
1
Jul-
11
Aug-1
1
Sep-1
1
Oct-
11
Nov-1
1
Dec-1
1
Jan-1
2
Feb-1
2
Ma
r-12
Apr-
12
Ma
y-1
2
Jun-1
2
Jul-
12
Aug-1
2
Sep-1
2
Oct-
12
Nov-1
2
Dec-1
2
GP Referrals
0
500
1,000
1,500
2,000
2,500
3,000
Ap
r-11
Ma
y-1
1
Jun
-11
Jul-
11
Au
g-1
1
Se
p-1
1
Oct-
11
No
v-1
1
De
c-1
1
Jan
-12
Fe
b-1
2
Ma
r-1
2
Ap
r-12
Ma
y-1
2
Jun
-12
Jul-
12
Au
g-1
2
Se
p-1
2
Oct-
12
No
v-1
2
De
c-1
2
A&E attendances
0
1,000
2,000
3,000
4,000
5,000
6,000
7,000
8,000
Ap
r-11
Ma
y-1
1
Jun
-11
Jul-
11
Au
g-1
1
Se
p-1
1
Oct-
11
No
v-1
1
De
c-1
1
Jan
-12
Fe
b-1
2
Ma
r-1
2
Ap
r-12
Ma
y-1
2
Jun
-12
Jul-
12
Au
g-1
2
Se
p-1
2
Oct-
12
No
v-1
2
De
c-1
2
1st attendance Follow-up Procedures
0
200
400
600
800
1,000
1,200
1,400
1,600
Ap
r-11
Ma
y-1
1
Jun
-11
Jul-
11
Au
g-1
1
Se
p-1
1
Oct-
11
No
v-1
1
De
c-1
1
Jan
-12
Fe
b-1
2
Ma
r-1
2
Ap
r-12
Ma
y-1
2
Jun
-12
Jul-
12
Au
g-1
2
Se
p-1
2
Oct-
12
No
v-1
2
De
c-1
2
Daycase Admissions Ordinary admissions Emergency admissions
Page 8 of 11
Duty Target YE Projection Var Directorate Plan Actual Variance
£m £m £m %
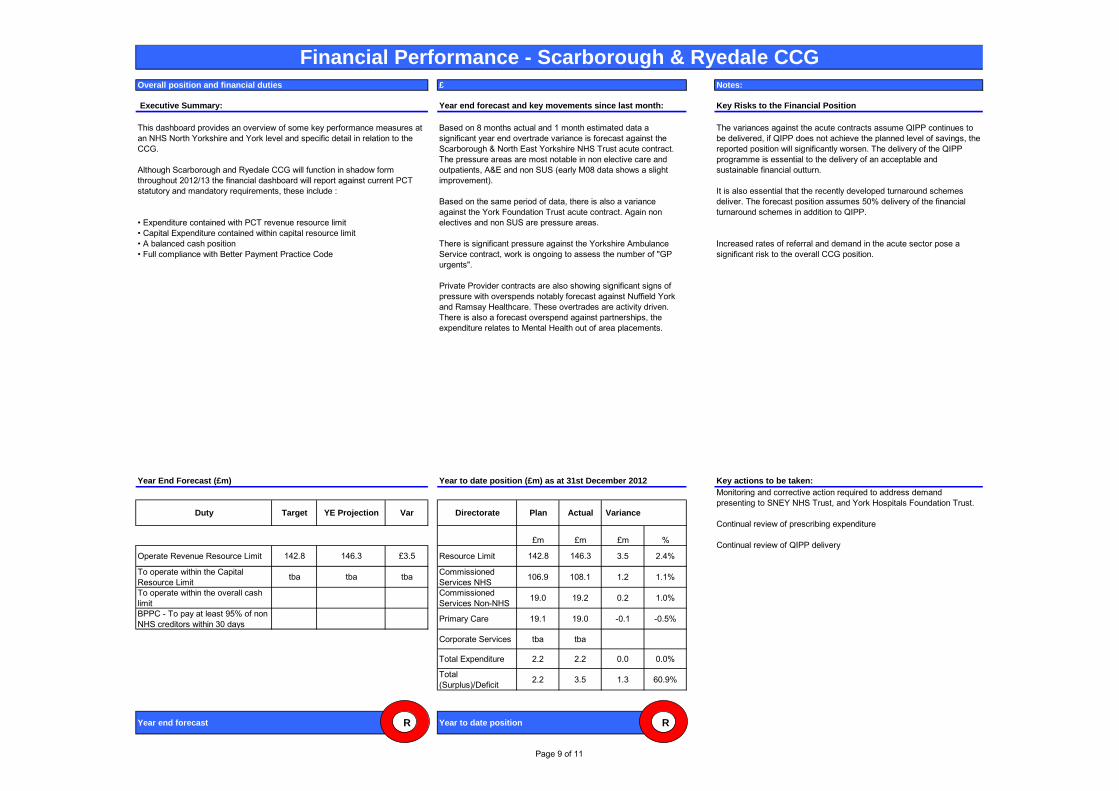
Operate Revenue Resource Limit 142.8 146.3 £3.5 Resource Limit 142.8 146.3 3.5 2.4%
To operate within the Capital
Resource Limittba tba tba
Commissioned
Services NHS106.9 108.1 1.2 1.1%
To operate within the overall cash
limit
Commissioned
Services Non-NHS19.0 19.2 0.2 1.0%
BPPC - To pay at least 95% of non
NHS creditors within 30 days Primary Care 19.1 19.0 -0.1 -0.5%
Corporate Services tba tba
Total Expenditure 2.2 2.2 0.0 0.0%
Total
(Surplus)/Deficit2.2 3.5 1.3 60.9%
Year end forecast R Year to date position R
Year End Forecast (£m) Year to date position (£m) as at 31st December 2012 Key actions to be taken:
Monitoring and corrective action required to address demand
presenting to SNEY NHS Trust, and York Hospitals Foundation Trust.
Continual review of prescribing expenditure
Continual review of QIPP delivery
Based on 8 months actual and 1 month estimated data a
significant year end overtrade variance is forecast against the
Scarborough & North East Yorkshire NHS Trust acute contract.
The pressure areas are most notable in non elective care and
outpatients, A&E and non SUS (early M08 data shows a slight
improvement).
Based on the same period of data, there is also a variance
against the York Foundation Trust acute contract. Again non
electives and non SUS are pressure areas.
There is significant pressure against the Yorkshire Ambulance
Service contract, work is ongoing to assess the number of "GP
urgents".
Private Provider contracts are also showing significant signs of
pressure with overspends notably forecast against Nuffield York
and Ramsay Healthcare. These overtrades are activity driven.
There is also a forecast overspend against partnerships, the
expenditure relates to Mental Health out of area placements.
This dashboard provides an overview of some key performance measures at
an NHS North Yorkshire and York level and specific detail in relation to the
CCG.
Although Scarborough and Ryedale CCG will function in shadow form
throughout 2012/13 the financial dashboard will report against current PCT
statutory and mandatory requirements, these include :
• Expenditure contained with PCT revenue resource limit
• Capital Expenditure contained within capital resource limit
• A balanced cash position
• Full compliance with Better Payment Practice Code
The variances against the acute contracts assume QIPP continues to
be delivered, if QIPP does not achieve the planned level of savings, the
reported position will significantly worsen. The delivery of the QIPP
programme is essential to the delivery of an acceptable and
sustainable financial outturn.
It is also essential that the recently developed turnaround schemes
deliver. The forecast position assumes 50% delivery of the financial
turnaround schemes in addition to QIPP.
Increased rates of referral and demand in the acute sector pose a
significant risk to the overall CCG position.
Financial Performance - Scarborough & Ryedale CCGOverall position and financial duties £ Notes:
Executive Summary: Year end forecast and key movements since last month: Key Risks to the Financial Position
Page 9 of 11
Month 8
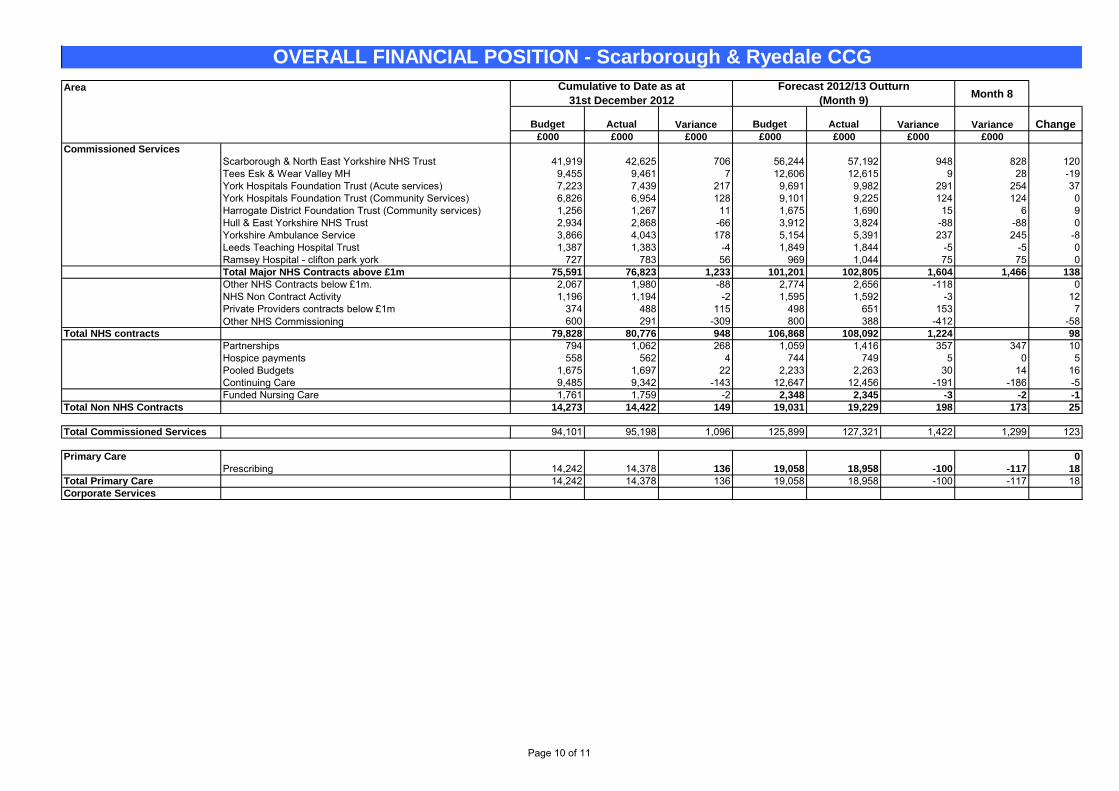
Budget Actual Variance Budget Actual Variance Variance Change£000 £000 £000 £000 £000 £000 £000
Commissioned Services
Scarborough & North East Yorkshire NHS Trust 41,919 42,625 706 56,244 57,192 948 828 120
Tees Esk & Wear Valley MH 9,455 9,461 7 12,606 12,615 9 28 -19
York Hospitals Foundation Trust (Acute services) 7,223 7,439 217 9,691 9,982 291 254 37
York Hospitals Foundation Trust (Community Services) 6,826 6,954 128 9,101 9,225 124 124 0
Harrogate District Foundation Trust (Community services) 1,256 1,267 11 1,675 1,690 15 6 9
Hull & East Yorkshire NHS Trust 2,934 2,868 -66 3,912 3,824 -88 -88 0
Yorkshire Ambulance Service 3,866 4,043 178 5,154 5,391 237 245 -8
Leeds Teaching Hospital Trust 1,387 1,383 -4 1,849 1,844 -5 -5 0
Ramsey Hospital - clifton park york 727 783 56 969 1,044 75 75 0
Total Major NHS Contracts above £1m 75,591 76,823 1,233 101,201 102,805 1,604 1,466 138
Other NHS Contracts below £1m. 2,067 1,980 -88 2,774 2,656 -118 0
NHS Non Contract Activity 1,196 1,194 -2 1,595 1,592 -3 12
Private Providers contracts below £1m 374 488 115 498 651 153 7
Other NHS Commissioning 600 291 -309 800 388 -412 -58
Total NHS contracts 79,828 80,776 948 106,868 108,092 1,224 98
Partnerships 794 1,062 268 1,059 1,416 357 347 10
Hospice payments 558 562 4 744 749 5 0 5
Pooled Budgets 1,675 1,697 22 2,233 2,263 30 14 16
Continuing Care 9,485 9,342 -143 12,647 12,456 -191 -186 -5
Funded Nursing Care 1,761 1,759 -2 2,348 2,345 -3 -2 -1
Total Non NHS Contracts 14,273 14,422 149 19,031 19,229 198 173 25
Total Commissioned Services 94,101 95,198 1,096 125,899 127,321 1,422 1,299 123
Primary Care 0
Prescribing 14,242 14,378 136 19,058 18,958 -100 -117 18
Total Primary Care 14,242 14,378 136 19,058 18,958 -100 -117 18
Corporate Services
Area Cumulative to Date as at
31st December 2012
Forecast 2012/13 Outturn
(Month 9)
OVERALL FINANCIAL POSITION - Scarborough & Ryedale CCG
Page 10 of 11
Planned
savings
(£000)
Actual
Savings
(£000)
Variance
(£000)Variance %
Planned
savings
(£000)
Actual
Savings
(£000)
Variance
(£000)Variance %
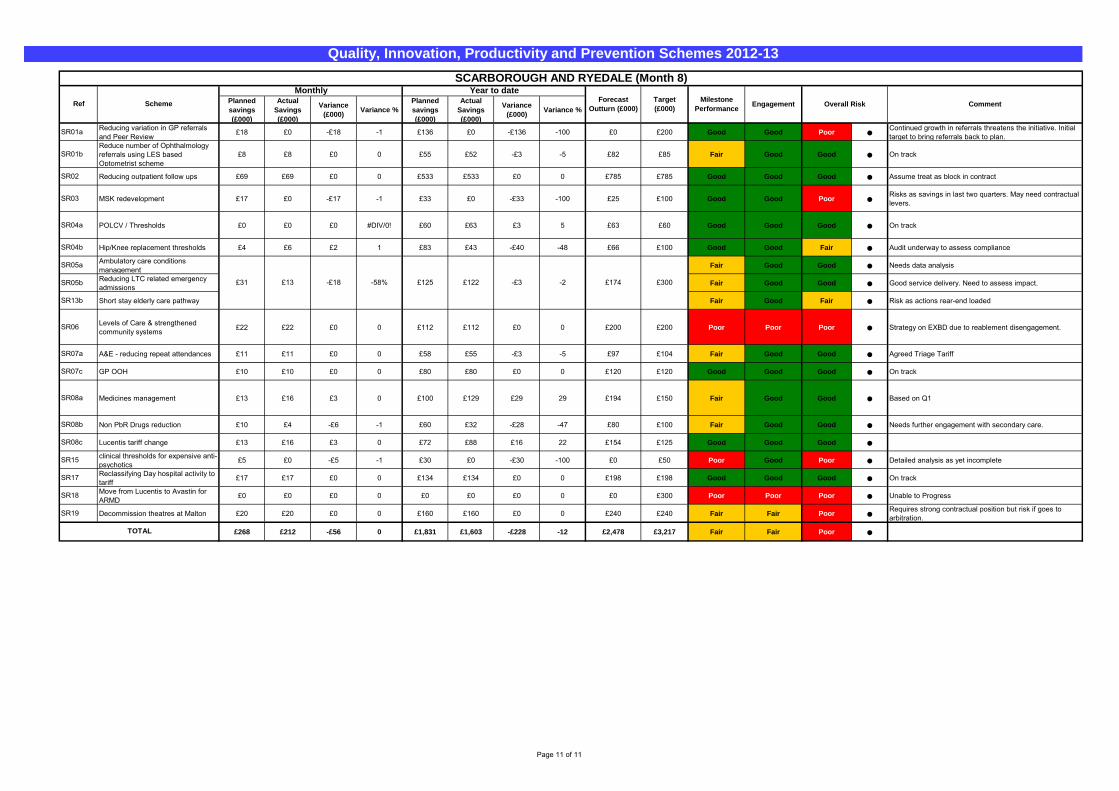
SR01aReducing variation in GP referrals
and Peer Review£18 £0 -£18 -1 £136 £0 -£136 -100 £0 £200 Good Good Poor ●
Continued growth in referrals threatens the initiative. Initial
target to bring referrals back to plan.
SR01b
Reduce number of Ophthalmology
referrals using LES based
Optometrist scheme
£8 £8 £0 0 £55 £52 -£3 -5 £82 £85 Fair Good Good ● On track
SR02 Reducing outpatient follow ups £69 £69 £0 0 £533 £533 £0 0 £785 £785 Good Good Good ● Assume treat as block in contract
SR03 MSK redevelopment £17 £0 -£17 -1 £33 £0 -£33 -100 £25 £100 Good Good Poor ●Risks as savings in last two quarters. May need contractual
levers.
SR04a POLCV / Thresholds £0 £0 £0 #DIV/0! £60 £63 £3 5 £63 £60 Good Good Good ● On track
SR04b Hip/Knee replacement thresholds £4 £6 £2 1 £83 £43 -£40 -48 £66 £100 Good Good Fair ● Audit underway to assess compliance
SR05aAmbulatory care conditions
managementFair Good Good ● Needs data analysis
SR05bReducing LTC related emergency
admissionsFair Good Good ● Good service delivery. Need to assess impact.
SR13b Short stay elderly care pathway Fair Good Fair ● Risk as actions rear-end loaded
SR06Levels of Care & strengthened
community systems£22 £22 £0 0 £112 £112 £0 0 £200 £200 Poor Poor Poor ● Strategy on EXBD due to reablement disengagement.
SR07a A&E - reducing repeat attendances £11 £11 £0 0 £58 £55 -£3 -5 £97 £104 Fair Good Good ● Agreed Triage Tariff
SR07c GP OOH £10 £10 £0 0 £80 £80 £0 0 £120 £120 Good Good Good ● On track
SR08a Medicines management £13 £16 £3 0 £100 £129 £29 29 £194 £150 Fair Good Good ● Based on Q1
SR08b Non PbR Drugs reduction £10 £4 -£6 -1 £60 £32 -£28 -47 £80 £100 Fair Good Good ● Needs further engagement with secondary care.
SR08c Lucentis tariff change £13 £16 £3 0 £72 £88 £16 22 £154 £125 Good Good Good ●
SR15clinical thresholds for expensive anti-
psychotics£5 £0 -£5 -1 £30 £0 -£30 -100 £0 £50 Poor Good Poor ● Detailed analysis as yet incomplete
SR17Reclassifying Day hospital activity to
tariff£17 £17 £0 0 £134 £134 £0 0 £198 £198 Good Good Good ● On track
SR18Move from Lucentis to Avastin for
ARMD£0 £0 £0 0 £0 £0 £0 0 £0 £300 Poor Poor Poor ● Unable to Progress
SR19 Decommission theatres at Malton £20 £20 £0 0 £160 £160 £0 0 £240 £240 Fair Fair Poor ●Requires strong contractual position but risk if goes to
arbitration.
£268 £212 -£56 0 £1,831 £1,603 -£228 -12 £2,478 £3,217 Fair Fair Poor ●
Quality, Innovation, Productivity and Prevention Schemes 2012-13
SCARBOROUGH AND RYEDALE (Month 8)
Ref Scheme
Monthly Year to dateForecast
Outturn (£000)
Target
(£000)
Milestone
PerformanceEngagement Overall Risk Comment
£300£31 £13 -£18 -58% £125
TOTAL
£122 -£3 -2 £174
Page 11 of 11