Embed Size (px)
Citation preview
curr
ent
US$
mill
ion
s
Health
HIV/AIDS
Nutrition
4000
1995 1998 2001 2004
1600
080
0012
000
0
2007
Scaling Up NutritionWhat Will It Cost?
Susan HortonMeera Shekar
Christine McDonaldAjay Mahal
Jana Krystene Brooks
D I R E C T I O N S I N D E V E L O P M E N T
Human Development
Pub
lic D
iscl
osur
e A
utho
rized
Pub
lic D
iscl
osur
e A
utho
rized
Pub
lic D
iscl
osur
e A
utho
rized
Pub
lic D
iscl
osur
e A
utho
rized


Scaling Up Nutrition

Scaling Up NutritionWhat Will It Cost?
Susan HortonMeera ShekarChristine McDonald Ajay MahalJana Krystene Brooks
© 2010 The International Bank for Reconstruction and Development / The World Bank
1818 H Street NWWashington DC 20433Telephone: 202-473-1000Internet: www.worldbank.orgE-mail: [email protected]
All rights reserved
1 2 3 4 13 12 11 10
This volume is a product of the staff of the International Bank for Reconstruction andDevelopment / The World Bank. The findings, interpretations, and conclusions expressed in thisvolume do not necessarily reflect the views of the Executive Directors of The World Bank or thegovernments they represent.
The World Bank does not guarantee the accuracy of the data included in this work. The bound-aries, colors, denominations, and other information shown on any map in this work do not implyany judgement on the part of The World Bank concerning the legal status of any territory or theendorsement or acceptance of such boundaries.
Rights and Permissions
The material in this publication is copyrighted. Copying and/or transmitting portions or all of thiswork without permission may be a violation of applicable law. The International Bank forReconstruction and Development / The World Bank encourages dissemination of its work and willnormally grant permission to reproduce portions of the work promptly.
For permission to photocopy or reprint any part of this work, please send a request with completeinformation to the Copyright Clearance Center Inc., 222 Rosewood Drive, Danvers, MA 01923,USA; telephone: 978-750-8400; fax: 978-750-4470; Internet: www.copyright.com.
All other queries on rights and licenses, including subsidiary rights, should be addressed to theOffice of the Publisher, The World Bank, 1818 H Street NW, Washington, DC 20433, USA; fax:202-522-2422; e-mail: [email protected].
ISBN: 978-0-8213-8077-2eISBN: 978-0-8213-8078-9DOI: 10.1596/978-0-8213-8077-2
Library of Congress Cataloging-in-Publication Data has been requested.
Cover Design: Naylor Design.

v
Foreword ixAcknowledgments xiAbout the Authors xiiiAbbreviations xvGlossary xviiExecutive Summary xix
Chapter 1 Introduction: Why Scale Up? 1Why Scale Up Now? 1The Objectives of This Report 2
Chapter 2 Methodology: Estimating the Costs 5The Scope of These Estimates 5A Methodology Based on Experience 9A Program of Proven Interventions 12Some Assumptions about Coverage 13Some Assumptions about Delivery
of Services 20
Contents
Chapter 3 What Will It Cost and What Are the Potential Benefits? 25Estimated Costs 25Supportive Policies and Programs:
Conditional Cash Transfers 34Links with Health Systems Strengthening 36Expected Outcomes 36Uncertainties and Sensitivity Analyses 40Financing Options 40
Chapter 4 Phasing the Scale-Up 47A Phased Approach for the Scale-Up 47Conclusions and Next Steps: Starting
the Scale-Up 51
Appendix A Meeting Participants 57
Appendix B Rationale for Selected Nutrition Interventions and Comparisons with the 2008 Lancet Undernutrition Series 61
Appendix C Estimation of the Target Populations in the 36 Countries with the Highest Burden of Undernutrition 65Pregnant Women 66Mothers of Young Children 67Pregnant Women in Areas with a Severe Shortage
of Iodized Salt 68Children 7–60 Months of Age 69Malnourished Children 0–60 Months of Age 69Entire Population 71
Appendix D Program Costs for Complementary and Therapeutic Feeding Interventions 73Treatment of Severe Acute Malnutrition 73Treatment and Prevention of Moderate
Malnutrition 76Costing Strategy 79
vi Contents
References 87
Index 93
FiguresES.1 A Two-Step Process for Scaling Up Direct
Nutrition Interventions xxv2.1 Target Population Currently Covered by Nutrition
Interventions and Planned Additional Coverage 193.1 Estimated Additional Costs for Scaling Up Nutrition
Interventions to Full Coverage in the 36 Countries with the Highest Burden of Undernutrition 33
3.2 Current Spending and Additional Financing Needed to Scale Up Nutrition Interventions to Full Coverage in the 36 Countries with the Highest Burden of Undernutrition 35
4.1 A Two-Step Process for Scaling Up Direct Nutrition Interventions 48
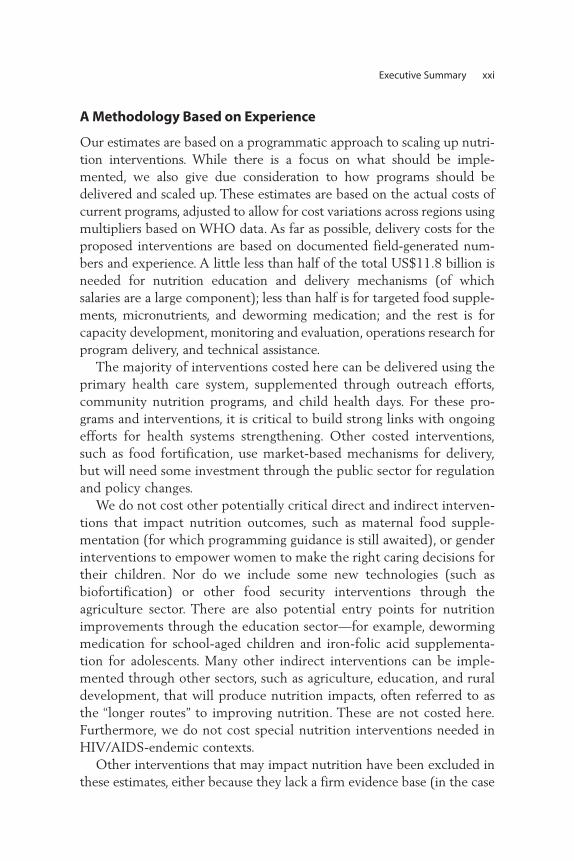
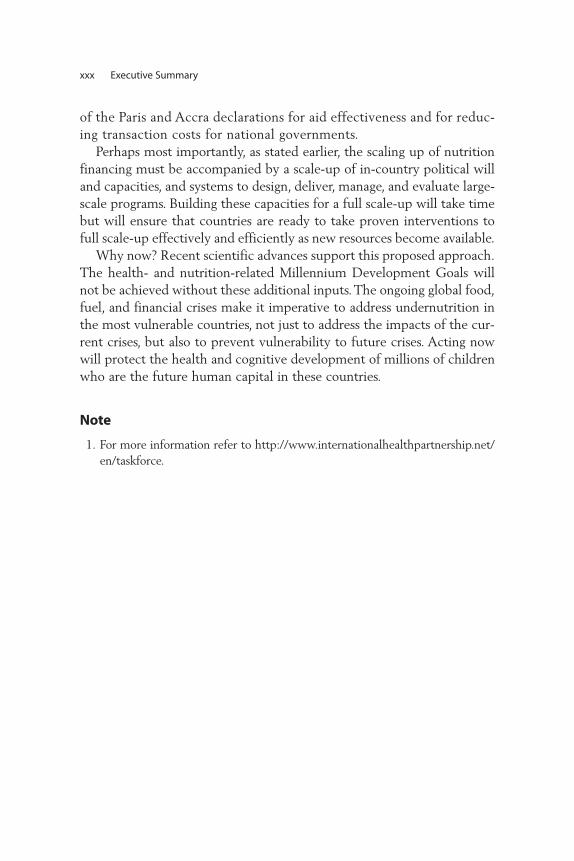
4.2 Official Development Assistance Commitments for Health, HIV/AIDS, and Nutrition, 1995–2007 50
4.3 Official Development Assistance Commitments for Nutrition and Emergency Food Aid, 1995–2007 51
4.4 Share of Total Official Development Assistance for Health Commitments, by Selected Donors, 1998–2000 52
4.5 Share of Total Official Development Assistance for Health Commitments, by Selected Donors, 2005–07 53
Map2.1 The 36 Countries with the Highest Burden of
Undernutrition and 32 Smaller High-Burden Countries with Rates of Child Stunting or Underweight Greater Than 20 Percent 7
Tables2.1 The 36 Countries with 90 Percent of the
Global Burden of Stunting and an Additional 32 High-Burden Countries with Underweight or Stunting Rates Greater Than 20 Percent 6
Contents vii
2.2 Regional Cost Multipliers and Countries Covered 112.3 Nutrition Interventions, Target Populations, and
Delivery Platforms Used to Estimate Financing Needs 14
2.4 Some Delivery Platforms Used in Programmatic Settings for Nutrition Interventions 17
2.5 Populations in Selected Demographic Groups in the 36 Countries with the Highest Burden of Undernutrition, by Region 18
2.6 Estimated Unit Costs for Nutrition Interventions 213.1 Estimated Annual Financing Needs for Scaling Up
Nutrition Interventions to Full Coverage of Target Populations in the 36 Countries with the Highest Burden of Undernutrition, by Region 26
3.2 Estimated Benefits from Scaling Up Nutrition Interventions 38
3.3 Effects of Changing Five Assumptions about the Costs of Scaling Up Nutrition Interventions 41
B.1 Interventions Included/Excluded in This Costing Exercise 62
B.2 Proposed Interventions and Rationale for Inclusion/Exclusion 64
D.1 Cost per Case of Severe Acute Malnutrition Treated 80D.2 Cost per Child 6–18 Months of Age Receiving
Preventive Feeding for Moderate Malnutrition 84
viii Contents
ix
They stand as a silent rebuke to us: millions of young children around theworld who are sick, dying, wasted, or stunted by inadequate nutrition.Even in times of abundance, they wait at the end of the line for theirshare. Now, as food, fuel, and financial crises continue to spread hardshipacross rich and poor nations alike, they are the most vulnerable.
Action against malnutrition is needed more than ever. An additionalUS$10.3 billion a year is required from public resources to successfullymount an attack against undernutrition on a worldwide scale. This wouldbenefit more than 360 million children in the 36 countries with thehighest burden of undernutrition—home to 90 percent of the stuntedchildren worldwide—and prevent more than 1.1 million child deaths.Since early childhood offers a special window of opportunity to improvenutrition, the bulk of the investment needs to be targeted betweenpre-pregnancy and two years of age.
This report offers suggestions on how to raise these resources. It is aninvestment we must make. It will yield high returns in the form of thriv-ing children, healthier families, and more productive workers. This invest-ment is essential to make progress on the nutrition and child mortalityMDGs and to protect critical human capital in developing economies.The human and financial costs of further neglect will be high.
Foreword
This call for greater investment in nutrition comes at a time whenglobal efforts to strengthen health systems provide a unique opportunityto scale up integrated packages of health and nutrition interventions, withcommon delivery platforms, and lower costs.
The report has benefited from the expertise of many internationalagencies, nongovernmental organizations, and research institutions. Thecooperation of so many practitioners is evidence of a growing recognitionof the need to invest in nutrition interventions, and a growing consensusabout how to deliver effective programs.
Graeme WheelerManaging DirectorWorld Bank
x Foreword
xi
Many people contributed to a first review of the concept note in September2008: Alan Berg and Sara Hommel (Brookings Institute); Ian Darnton-Hill(Renewed Efforts Against Childhood Hunger [REACH]/UNICEF); LauraBirx, Frances Davidson, and Emily Wainwright (USAID); and DarrenDorkin, Sundararajan Gopalan, Pablo Gottret, Nkosinathi Mbuya, andMary Eming Young (World Bank). Peter Berman (World Bank) chaired thismeeting.
Ellen Piwoz (Bill and Melinda Gates Foundation), Ian Darnton-Hill(REACH/UNICEF), Emily Wainwright (USAID), and Juan Pablo Pena-Rosas (WHO) provided input that facilitated agreement on the interven-tions to be costed during a side-meeting at the UNICEF InnocentiResearch Centre (IRC) in September 2008.
Others provided helpful comments and input on various drafts:Tahmeed Ahmed (International Centre for Diarrhoeal Disease Research, Bangladesh); Kathryn Dewey (University of California–Davis);Stéphane Doyon, Laurent Gadot, Buddhima Lokuge, and Kevin Phelan(Médecins Sans Frontières); Denise Coitinho and Ian Darnton-Hill(REACH/UNICEF); Tanya Khara and Werner Schultink (UNICEF); andGeir Sølve Sande Lie and Ajay Tandon (World Bank).
Acknowledgments
Harold Alderman (World Bank), Jere Behrman (University ofPennsylvania), Peter Berman (World Bank), Ruth Levine (Center for GlobalDevelopment), and Ellen Piwoz (Bill and Melinda Gates Foundation) peer-reviewed the concept note and final draft of the report.
Rakesh Nangia (World Bank) chaired the final decision meeting in May2009, and the following people participated in the final review meeting:Kathleen Kurz and A. Elizabeth Sommerfelt (AED); Kavita Sethuraman(FANTA-2 AED); Maryanne Anderson (USAID Basics III); Asma Lateefand Eric Munoz (Bread for the World); Alan Berg (Brookings Institute,Wolfensohn Center); David Pelletier and students (Cornell University);Keith Bezanson and Zahra Popatia (consultants for Global Alliance forImproved Nutrition); Marie Ruel (International Food Policy ResearchInstitute); Marcia Griffiths (Manoff Group); Stéphane Doyon and LaurentGadot (Médecins Sans Frontières); Chessa Lutter (Pan-American HealthOrganization/WHO); Patricia Daniels (USAID Africa Bureau, Office ofSustainable Development); Denise Coitinho (REACH); Martin Bloemand Catherine Feeney (World Food Programme); Francesco Branca andJuan Pablo Pena-Rosas (WHO); Richard Bumgarner and Paul Isenman(consultants, World Bank); and Alemayehu Ambel, Yoonyoung Cho, SadiaAfroze Chowdhury, Vaibhav Gupta, and Elodie Montetagaud (WorldBank). All provided valuable guidance and inputs, without which thiswork would not have been possible.
Communications Development, Inc. edited the final paper.
xii Acknowledgments
xiii
Susan Horton is the Centre for International Governance Innovationchair in Global Health Economics and associate provost, graduate studies,at the Balsillie School of International Affairs, University of Waterloo.Susan has written widely on nutrition, health, and labor markets in devel-oping countries, and has served as a consultant to the World Bank, AsianDevelopment Bank, UNICEF, and WHO, among others. Her proposedsolution for using micronutrient supplements ranked as the top solutionat the 2008 Copenhagen Consensus.
Meera Shekar is the lead health and nutrition specialist at the WorldBank. She is recognized globally as a policy and technical expert in nutrition and health. She guides the World Bank’s work on nutri-tion and was the lead author for the flagship report “RepositioningNutrition as Central to Development,” among others. She has exten-sive expertise and strong interests in policy and program develop-ment, partnership management, monitoring information systems, andprogram evaluation.
Christine McDonald received a Master of Science degree in food policyand applied nutrition from Tufts University and is currently a doctoralstudent in nutritional epidemiology at the Harvard School of Public
About the Authors
Health. Her research interests include child undernutrition, micronutri-ent deficiencies, and infectious disease.
Ajay Mahal is an associate professor of international health economics atthe Harvard School of Public Health. His main areas of research interestare the financing of health interventions, the economic implications ofdisease, and the relationship between economics and human rights, pri-marily in developing country settings.
Jana Krystene Brooks received a Master of Public Health degree from theGeorge Washington University and is currently a consultant to the WorldBank. Her public health interests include developing culturally integra-tive interventions and health communication strategies to positivelyinfluence individual- and population-level behavior change.
xiv About the Authors
xv
AFR Africa Region (of the World Bank)BF breastfeedingBMGF Bill and Melinda Gates FoundationCCTs conditional cash transfersCDC U.S. Centers for Disease Control and PreventionCGD Center for Global DevelopmentCMAM community-based management of acute malnutritionCTC community-based therapeutic careDALY disability-adjusted life yearDCPP Disease Control Priorities ProjectDHS demographic and health surveysEAP East Asia and Pacific Region (of the World Bank)ECA Europe and Central Asia Region (of the World Bank)EDTA ethylenediaminetetraacetic acid GAM global acute malnutritionGDP gross domestic product HAZ height-for-age z scoreICDDR,B International Centre for Diarrhoeal Disease
Research, BangladeshIFA iron-folic acid
Abbreviations
ILSI International Life Sciences InstituteIMR infant mortality rate INGO international nongovernmental organizationLAC Latin America and the Caribbean Region
(of the World Bank)LNS lipid-based nutrient supplementMBB marginal budgeting for bottlenecksMDG Millennium Development GoalMENA Middle East and North Africa Region
(of the World Bank)MGRS Multicentre Growth Reference Study MMS maternal micronutrient supplementMSF Médecins Sans Frontières NCHS U.S. National Center for Health Statistics NMR neonatal mortality rate ODA official development assistanceOECD Organisation for Economic Co-operation
and DevelopmentORT oral rehydration therapyREACH Renewed Efforts Against Childhood HungerRUF ready-to-use foodRUTF ready-to-use therapeutic food SAM severe acute malnutrition SAR South Asia Region (of the World Bank)UN United Nations UNHCR United Nations High Commissioner for RefugeesUNICEF United Nations Children’s FundUSAID United States Agency for International
DevelopmentUSI universal salt iodizationWAZ weight-for-age z scoreWB World BankWFP World Food Programme WHZ weight-for-height z scoreWHO World Health Organization WHO CHOICE World Health Organization—Choosing
Interventions That Are Cost Effective
xvi Abbreviations
xvii
Glossary
Community-basedmanagement ofacute malnutrition
The management of acute malnutrition through(a) in-patient care for children with severe acutemalnutrition with medical complications andinfants under six months of age with visible signsof severe acute malnutrition; (b) out-patient carefor children with severe acute malnutrition with-out medical complications; and (c) communityoutreach.
Community nutrition program
A community-based program intended to preventgrowth-faltering, control morbidity, and improvesurvival of children by promoting breastfeeding,providing education and counseling on optimalfeeding practices, preventing diarrheal disease, and monitoring and promoting growth (Mason et al., 2006).
Global acute malnutrition (wasting)
Weight-for-height of –2 z scores or more belowthe median of the World Health Organization’schild growth standards (includes moderate wast-ing and severe wasting, i.e. moderate acute malnu-trition and severe acute malnutrition).
xviii Glossary
Low birth weight Birth weight less than 2,500 g.
Malnutrition A broad term commonly used as an alternative toundernutrition, but technically it includes bothundernutrition and overnutrition.
Moderate malnutrition (underweight)
Weight-for-age between –2 and –3 z scores below the median of the WHO child growth standards.
Multiple micronutrient powders
Sachets containing a blend of vitamins and miner-als in powder form, which can be added to foodsat home. They are intended to prevent and treatmicronutrient deficiencies.
Ready-to-use therapeutic foods
High-energy, fortified, ready-to-eat foods suitablefor the treatment of children with severe acutemalnutrition.
Severe acute malnutrition (severe wasting)
Weight-for-height of –3 z scores or more below the median of the WHO child growth standards.
Stunting Height-for-age of –2 z scores or more below themedian of the WHO child growth standards.
Undernutrition Defined as the outcome of insufficient food intakeand repeated infectious diseases. It includes beingunderweight for one’s age, too short for one’s age(stunted), dangerously thin for one’s height(wasted), and deficient in vitamins and minerals(micronutrient malnutrition).
Underweight Weight-for-age of –2 z scores or more below themedian of the WHO child growth standards.
xix
Undernutrition imposes a staggering cost worldwide, both in human andeconomic terms. It is responsible for the deaths of more than 3.5 millionchildren each year (more than one-third of all deaths among childrenunder five) and the loss of billions of dollars in forgone productivity andavoidable health care spending. Individuals lose more than 10 percent oflifetime earnings, and many countries lose at least 2–3 percent of theirgross domestic product to undernutrition. The current economic crisisand its potential impact on the poor make investing in child nutritionmore urgent than ever to protect and strengthen human capital in themost vulnerable developing countries.
What resources are needed to fight undernutrition? This report offersa preliminary answer by estimating the cost of scaling up a minimal pack-age of 13 proven nutrition interventions from current coverage levels tofull coverage of the target populations in the 36 countries with the high-est burden of undernutrition. These countries account for 90 percent ofall children whose growth has been stunted by inadequate nutrition.Adding another 32 smaller high-burden countries with levels of stuntingand/or underweight exceeding 20 percent would increase these cost esti-mates by 6 percent.
Executive Summary
A Program of Proven Interventions
The 13 direct nutrition interventions selected for this costing exercisehave demonstrated effectiveness in many countries by reducing childmortality, improving nutrition outcomes, and protecting human capital.The interventions fall into three broad groups:
• Behavior change interventions that include promotion of breastfeed-ing, appropriate complementary feeding practices (but excluding pro-vision of food), and proper hygiene, specifically handwashing. It isassumed that the majority of these services are delivered one-on-oneat the community level through platforms such as community nutritionprograms (Mason et al. 2006).
• Micronutrient and deworming interventions that provide a range ofsupplements for children under the age of five (periodic vitamin Asupplements, therapeutic zinc supplements to manage diarrhea, mul-tiple micronutrient powders, and deworming drugs); for pregnantwomen (iron-folic acid supplements, as well as iodized oil capsuleswhere iodized salt is not available); and for the general population(iron fortification of staple foods and salt iodization).
• Complementary and therapeutic feeding interventions that pro-vide micronutrient-fortified and/or -enhanced complementaryfoods for the prevention and treatment of moderate malnutritionamong children 6–23 months of age, and community-based man-agement of severe acute malnutrition among children under fiveyears of age.
Most of these interventions need to be implemented in partnershipwith the health sector and will complement the efforts at health sys-tems strengthening that are currently underway in many countries.Further, these selected interventions represent a modified package ofthe interventions listed in the 2008 Lancet undernutrition series. Somenew interventions have been added based on emerging evidence sincethe Lancet series was published. Other interventions have been deferredfor now because there are no clear protocols for the interventions, dataon compliance and delivery mechanisms are unclear, no cost data existto estimate scaling-up costs, or because capacities for scaling up are stillto be developed. As these interventions are added, additional benefitscan be expected.
xx Executive Summary
A Methodology Based on Experience
Our estimates are based on a programmatic approach to scaling up nutri-tion interventions. While there is a focus on what should be imple-mented, we also give due consideration to how programs should bedelivered and scaled up. These estimates are based on the actual costs ofcurrent programs, adjusted to allow for cost variations across regions usingmultipliers based on WHO data. As far as possible, delivery costs for theproposed interventions are based on documented field-generated num-bers and experience. A little less than half of the total US$11.8 billion isneeded for nutrition education and delivery mechanisms (of whichsalaries are a large component); less than half is for targeted food supple-ments, micronutrients, and deworming medication; and the rest is forcapacity development, monitoring and evaluation, operations research forprogram delivery, and technical assistance.
The majority of interventions costed here can be delivered using theprimary health care system, supplemented through outreach efforts,community nutrition programs, and child health days. For these pro-grams and interventions, it is critical to build strong links with ongoingefforts for health systems strengthening. Other costed interventions,such as food fortification, use market-based mechanisms for delivery,but will need some investment through the public sector for regulationand policy changes.
We do not cost other potentially critical direct and indirect interven-tions that impact nutrition outcomes, such as maternal food supple-mentation (for which programming guidance is still awaited), or genderinterventions to empower women to make the right caring decisions fortheir children. Nor do we include some new technologies (such as biofortification) or other food security interventions through the agriculture sector. There are also potential entry points for nutritionimprovements through the education sector—for example, dewormingmedication for school-aged children and iron-folic acid supplementa-tion for adolescents. Many other indirect interventions can be imple-mented through other sectors, such as agriculture, education, and ruraldevelopment, that will produce nutrition impacts, often referred to asthe “longer routes” to improving nutrition. These are not costed here.Furthermore, we do not cost special nutrition interventions needed inHIV/AIDS-endemic contexts.
Other interventions that may impact nutrition have been excluded inthese estimates, either because they lack a firm evidence base (in the case
Executive Summary xxi
of interventions still being debated or not yet tested), because the deliv-ery mechanisms are unclear, or because they may be financed throughother sectors (for example cross-cutting issues such as indoor air pollu-tion, or programs to provide bed nets) or through health systems strength-ening efforts. Although conditional cash transfers can be used to supportnutrition improvement, we have included the supply-side costs of theseprograms, but have not included the cost of the actual cash transfers in ourestimates, because they often aim to address multiple objectives. However,in situations where conditional cash transfers are instituted, incorporatingcomponents that strengthen the demand for nutrition services is highlydesirable.
Adding all of these interventions to move to a full scale-up will put anadditional burden on fragile country capacities for program delivery, andwill likely take time, but will also greatly enhance expected impacts. Thefinancing needs for scaling up these additional direct and indirect inter-ventions should be estimated in follow-up work.
Some Assumptions about Coverage and Delivery
The financing needs estimated here are based on increasing coveragefrom current levels to 100 percent of the target populations (excepttreatment of severe acute malnutrition for which 80 percent is consid-ered the currently feasible maximum). We recognize that in practicethese investments are, at best, likely to reach only 90 percent of the tar-get populations, because it is difficult and expensive to reach the last10 percent of households. However, we also believe that stronger linkswith health systems strengthening efforts will allow for greater coveragethan previously feasible. Furthermore, in line with the Paris and Accradeclarations, all interventions delivered through the health system areexpected to be able to ride on and complement the efforts at strength-ening health systems currently underway in many countries. This approachshould achieve higher coverage.
Estimated Resource Needs
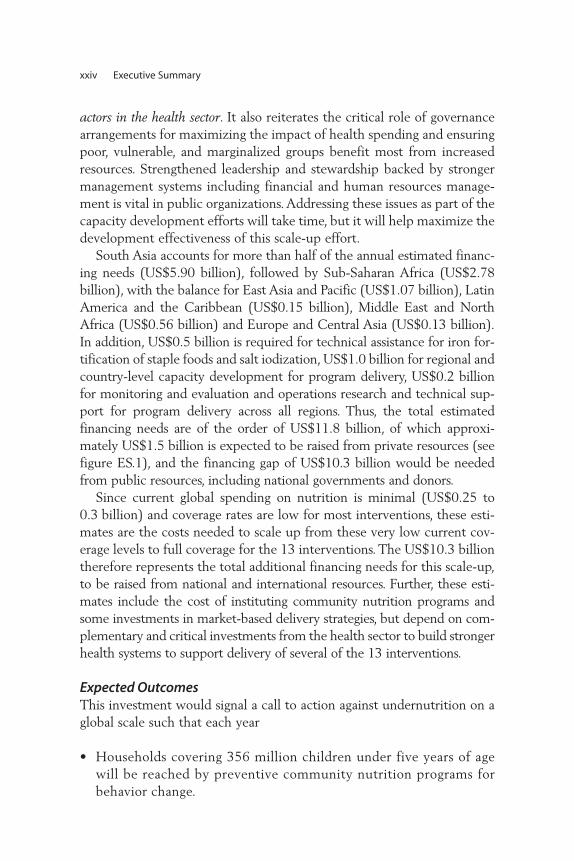
We estimate the total financing needs to scale up the selected interven-tions to be US$11.8 billion per annum, of which US$1.5 billion isexpected to be borne by private household resources. This leaves a totalfinancing gap of US$10.3 billion to be raised from public resources (both
xxii Executive Summary
national and global) to support the scale-up. We propose that the scale-up process occurs in two steps:
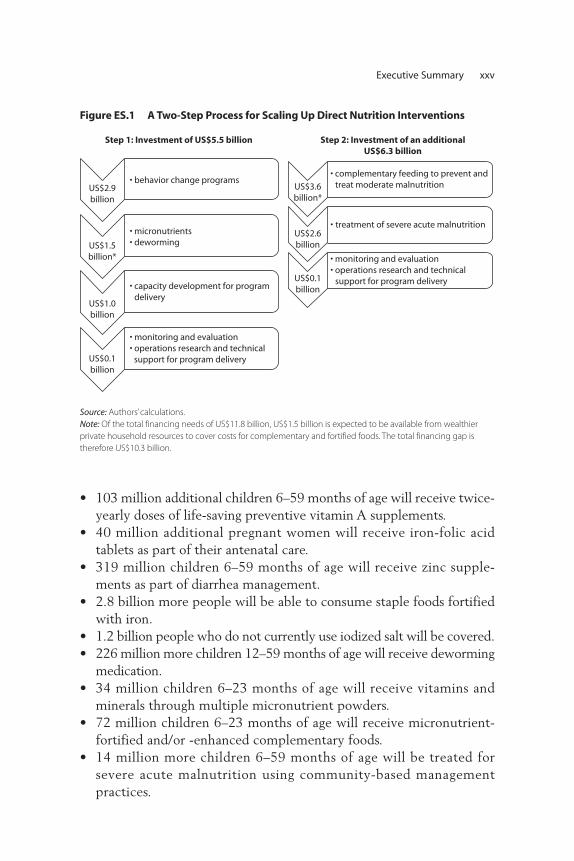
• Step 1, which will distribute slightly less than half of the total annual investment (US$5.5 billion), comprises US$1.5 billion for micronutri-ents and deworming (US$5 per child), US$2.9 billion for behaviorchange interventions (US$7.50 per child), and an additional US$1.0 bil-lion to build capacities to start the scale-up of more complex and target-ed food-based programs for delivering these services, starting with areasthat have especially high rates of undernutrition. US$0.1 billion is addedfor rigorous monitoring and evaluation of large-scale programs and oper-ations research for delivery strategies, and for technical support.
• Step 2, in which the remaining US$6.3 billion will be spent, will scale-up complementary and therapeutic feeding programs after capacitiesto deliver these interventions in resource-poor settings are built up inthe previous step. The largest single cost item in this step is comple-mentary food to prevent and treat moderate malnutrition among chil-dren under two years of age (US$40–80 per child; US$3.6 billion peryear). The most resource-intensive intervention per child treated(US$200 per episode per child; US$2.6 billion per year) is treatmentof severe acute malnutrition. Prevention is preferable to treatment;however, the human and economic costs involved make addressingcurrent levels of severe acute malnutrition imperative to save lives. Aswith step 1, an additional US$0.1 billion will be needed for steppingup rigorous monitoring and evaluation of large-scale programs and op-erations research for delivery strategies.
This two-step process is neither meant to be a straightjacket, nor to besuggestive of a linear “one-size-fits-all” approach to scaling-up. Country sit-uations are diverse and they need to follow diverse paths. Those withstronger implementation capacities are likely to proceed to the second stepfaster than countries where capacities and political will lag behind.However, in countries where program delivery capacities are constrained,an explicit investment in capacity development is a prerequisite to theproposed scale-up. This is one of the key recommendations from the HighLevel Taskforce on Innovative International Financing for Health Systemsto strengthen the capacity of governments to secure better performance andinvestment from private, faith-based, community, NGO and other non-state
Executive Summary xxiii
actors in the health sector. It also reiterates the critical role of governancearrangements for maximizing the impact of health spending and ensuringpoor, vulnerable, and marginalized groups benefit most from increasedresources. Strengthened leadership and stewardship backed by strongermanagement systems including financial and human resources manage-ment is vital in public organizations. Addressing these issues as part of thecapacity development efforts will take time, but it will help maximize thedevelopment effectiveness of this scale-up effort.
South Asia accounts for more than half of the annual estimated financ-ing needs (US$5.90 billion), followed by Sub-Saharan Africa (US$2.78 billion), with the balance for East Asia and Pacific (US$1.07 billion), LatinAmerica and the Caribbean (US$0.15 billion), Middle East and NorthAfrica (US$0.56 billion) and Europe and Central Asia (US$0.13 billion).In addition, US$0.5 billion is required for technical assistance for iron for-tification of staple foods and salt iodization, US$1.0 billion for regional andcountry-level capacity development for program delivery, US$0.2 billionfor monitoring and evaluation and operations research and technical sup-port for program delivery across all regions. Thus, the total estimatedfinancing needs are of the order of US$11.8 billion, of which approxi-mately US$1.5 billion is expected to be raised from private resources (seefigure ES.1), and the financing gap of US$10.3 billion would be neededfrom public resources, including national governments and donors.
Since current global spending on nutrition is minimal (US$0.25 to0.3 billion) and coverage rates are low for most interventions, these esti-mates are the costs needed to scale up from these very low current cov-erage levels to full coverage for the 13 interventions. The US$10.3 billiontherefore represents the total additional financing needs for this scale-up,to be raised from national and international resources. Further, these esti-mates include the cost of instituting community nutrition programs andsome investments in market-based delivery strategies, but depend on com-plementary and critical investments from the health sector to build strongerhealth systems to support delivery of several of the 13 interventions.
Expected OutcomesThis investment would signal a call to action against undernutrition on aglobal scale such that each year
• Households covering 356 million children under five years of agewill be reached by preventive community nutrition programs forbehavior change.
xxiv Executive Summary
Executive Summary xxv
• 103 million additional children 6–59 months of age will receive twice-yearly doses of life-saving preventive vitamin A supplements.
• 40 million additional pregnant women will receive iron-folic acidtablets as part of their antenatal care.
• 319 million children 6–59 months of age will receive zinc supple-ments as part of diarrhea management.
• 2.8 billion more people will be able to consume staple foods fortifiedwith iron.
• 1.2 billion people who do not currently use iodized salt will be covered.• 226 million more children 12–59 months of age will receive deworming
medication.• 34 million children 6–23 months of age will receive vitamins and
minerals through multiple micronutrient powders.• 72 million children 6–23 months of age will receive micronutrient-
fortified and/or -enhanced complementary foods.• 14 million more children 6–59 months of age will be treated for
severe acute malnutrition using community-based managementpractices.
US$2.9billion
• behavior change programs
US$1.5billion*
• micronutrients• deworming
US$1.0billion
• capacity development for program delivery
US$0.1billion
• monitoring and evaluation• operations research and technical support for program delivery
Step 1: Investment of US$5.5 billion
US$3.6billion*
• complementary feeding to prevent and treat moderate malnutrition
US$2.6billion
• treatment of severe acute malnutrition
US$0.1billion
• monitoring and evaluation• operations research and technical support for program delivery
Step 2: Investment of an additionalUS$6.3 billion
Figure ES.1 A Two-Step Process for Scaling Up Direct Nutrition Interventions
Source: Authors’ calculations.
Note: Of the total financing needs of US$11.8 billion, US$1.5 billion is expected to be available from wealthier
private household resources to cover costs for complementary and fortified foods. The total financing gap is
therefore US$10.3 billion.
Scaling up of this select group of nutrition interventions is expected tohave huge payoffs every year by reducing child mortality and morbidity,promoting child growth and development, improving the health of moth-ers, and preserving human capital. Through this action
• More than 1.1 million of the estimated 8 million deaths among chil-dren under the age of five in the 36 countries would be prevented.
• An estimated 30 million disability-adjusted life-years (DALYs) wouldbe saved.
• 30 million fewer children under the age five would be stunted (about150 million children under five years of age are currently stunted),representing a 20 percent reduction.
• Severe acute malnutrition would be halved from the current preva-lence of 19 million; an estimated 138,000 of the current 276,000 annual deaths would be averted by preventive measures, and a further50,000 would be averted by treatment of severe acute malnutrition.
• The drop in mortality of 1.1 million child deaths per year wouldachieve one-fifth of the desired progress toward Millennium Develop-ment Goal (MDG) 4, which aims to decrease child mortality by two-thirds (i.e., by 6 million deaths per year).
• The decreases in stunting and wasting would potentially reduce thenumber of underweight children by one-fifth to one-third andhence substantially assist with progress toward reaching MDG 1c,which aims to halve the number of underweight children.
Although we have not yet quantified the precise impact of this scale-up on human capital, the evidence base for these benefits is strong. Forexample, we know that boys in Guatemala who participated in a nutri-tion program before the age of three grew up to have wages that were46 percent higher than controls. The effects of iron and iodine fortifica-tion alone outweigh the cost of scaling up the delivery of all micronutri-ents and behavior change interventions. Thus, in addition to the reducedmortality and nutritional benefits listed above, we also expect significantproductivity benefits, particularly because these investments includecommunity-based preventative programs to reduce relapse rates andprevent the irreversible effects of early undernutrition. Further work isneeded to estimate more precisely the overall gross domestic productimpact of this package of interventions.
As detailed programming guidance becomes available for new interven-tions, and as in-country capacities and delivery systems are built to scale-up
xxvi Executive Summary
these additional interventions, these impacts will be further multiplied.Links with social safety nets and food security programs, and with healthsystems strengthening will add to the expected impacts. Therefore, theseestimates err on the conservative side.
Financing
Although US$11.8 billion annually is a large investment, there are at leastfour potential financing sources: private resources within households,national governments, private sector corporations, and innovative financ-ing options being explored by international partners such as the HighLevel Taskforce on Innovative Financing for Health Systems.1 All sourceshave compelling reasons and resources to contribute to the financing gapof US$10.3 billion. Follow-on work is needed to identify the opportuni-ties for financing the proposed scale-up.
Households are accustomed to bearing most of the recurrent costsof market-based strategies, such as salt iodization (estimated atUS$400 million) and food fortification from private resources. Datafrom many countries show that undernutrition rates are surprisinglyhigh even among the wealthiest populations. For example, in India,Bangladesh, and Ethiopia, respectively 20, 30, and 37 percent of childrenunder the age of five in the highest-income quintiles are underweight(World Bank 2007). If appropriate complementary foods are deliveredthrough market-based strategies, US$0.9 billion (or almost one quarterof the estimated US$3.6 billion required for complementary foods) canbe directly covered by private household resources, thereby reducing theburden on public resources. An additional US$0.6 billion for fortifica-tion of staple foods with iron, and for salt iodization, can be borne bywealthier households, such that approximately US$1.5 billion of theproposed US$11.8 billion annually can come from wealthier privatehousehold resources.
Developing country governments already contribute substantialamounts to nutrition programs. India, for example, allocated nearlyUS$1.3 billion for its Integrated Child Development Services programin 2007–08. Other developing countries are also making such alloca-tions. If current government funds were reallocated to more effectiveevidence-based strategies, they could meet some of the financing needsfor scaling up.
As private corporations become more innovative and competitive in thefood sector, they have good reason to invest in better and more nutritious
Executive Summary xxvii
products with greater sales potential. Private foundations and philanthro-pies such as the Bill and Melinda Gates Foundation and the Children’sInvestment Fund are also emerging as a significant financing source fornutrition.
International emergency food aid, estimated at US$2 billion in 2007by the Development Assistance Committee of the Organisation forEconomic Co-operation and Development (OECD), is an importantpotential financial source for improving child nutrition. Efforts to use in-kind food aid to prevent and treat moderate malnutrition have been suc-cessful in several settings, including Haiti and Niger. Food aid is beingused as part of safety net programs in a number of countries, includingEthiopia. However, to have a greater impact on nutrition outcomes, aidresources need to be nutritionally appropriate, specifically targeted toyoung children and mothers, and accompanied by other preventive serv-ices such as nutrition education, behavior change interventions, andhygiene promotion. This is not the case at the moment.
Industrialized country governments could respond to the suggestion ofputting 0.7 percent of their domestic stimulus packages into internationalassistance, and additional innovative financing sources could be identified.The High Level Taskforce on Innovative International Financing for HealthSystems is exploring new options. The Taskforce specifically aims to raiseadditional resources for the health-related MDGs, including MDG 1c(hunger and undernutrition). Its challenge states, “More and betterresources are needed if the health-related MDGs are to be reached in 2015.The aim is to raise additional resources that are provided to countries in aneffective way and linked to results.” It also recommends that the allocationof funds in countries be made more efficient by filling gaps in costed andagreed-upon national strategies.
Last, although OECD data show that current aid flows for nutritionare very small, several bilateral partners (Canada, Denmark, France,Ireland, Japan, Norway, Spain, the United Kingdom) and others includingthe European Commission have either developed new nutrition strategiesor position papers on food security, or seem poised to do so. This repre-sents a much-needed potential resource for nutrition financing in thehighest burden countries. The recent G8 announcement on an additionalUS$20 billion over three years for food security programs (G8 Summit,2009) and the possibility that Canada will take this agenda further in thecoming G8 summit in 2010 by moving forward “from food security tonutrition security,” offers yet another opportunity for financing the nutri-tion scale-up.
xxviii Executive Summary
All of these sources represent new and potentially viable opportunitiesfor nutrition financing—but more work is needed to explore these financ-ing sources. The challenge is to raise and provide these resources in sucha way that they complement, rather than compete with investments inhealth systems strengthening, food security, social safety nets, andHIV/AIDS programs. The challenge is also to make sure these resourcesare consolidated and programmed to fill gaps in carefully developed andarticulated country strategies, rather than as one-off investments. This isessential for development effectiveness.
Next Steps
Current investments in nutrition are miniscule given the magnitude ofthe problem. The case for greater investment in nutrition interventions isstrong, both ethically and economically. Now is the time to act. Theseinterventions are proven to be cost-effective, have broad public healthimpacts, and contribute to global public good. Public provision ofmicronutrients to vulnerable groups is less costly than spending publicfunds to treat the consequences of micronutrient deficiencies. Public sub-sidy of deworming drugs has broad public health benefits and is a globalpublic good. Logically, the cost of complementary feeding interventionsshould largely be the responsibility of individual households, except innutrition emergencies and for the poorest households. While there is ahumanitarian responsibility for public spending to treat severe acute mal-nutrition, the economic and social savings gained from preventing thesecases are better.
Of course, seeking additional funds to increase nutrition interven-tions is especially difficult in a severe international economic reces-sion. The cost of not intervening, however, is much higher: thebenefits from iron fortification of staples and salt iodization alone areestimated at US$7.2 billion per year. Of the total US$10.3 billionneeded per year from public resources for the proposed scale-up,nearly US$4.4 billion is for micronutrient and deworming interven-tions and community-based nutrition interventions that can be scaledup fairly rapidly, either with existing capacities and systems or withsome modest investments in capacity-building. Further, because manyof the nutrition interventions costed here are delivered through thehealth system, a close link and complementarity with these efforts iscritical. This is suggested for pragmatic reasons (wherein the nutritioninterventions ride on strengthened health systems), and in the spirit
Executive Summary xxix
of the Paris and Accra declarations for aid effectiveness and for reduc-ing transaction costs for national governments.
Perhaps most importantly, as stated earlier, the scaling up of nutritionfinancing must be accompanied by a scale-up of in-country political willand capacities, and systems to design, deliver, manage, and evaluate large-scale programs. Building these capacities for a full scale-up will take timebut will ensure that countries are ready to take proven interventions tofull scale-up effectively and efficiently as new resources become available.
Why now? Recent scientific advances support this proposed approach.The health- and nutrition-related Millennium Development Goals willnot be achieved without these additional inputs. The ongoing global food,fuel, and financial crises make it imperative to address undernutrition inthe most vulnerable countries, not just to address the impacts of the cur-rent crises, but also to prevent vulnerability to future crises. Acting nowwill protect the health and cognitive development of millions of childrenwho are the future human capital in these countries.
Note
1. For more information refer to http://www.internationalhealthpartnership.net/en/taskforce.
xxx Executive Summary
1
Why Scale Up Now?
Undernutrition, already one of the world’s most serious health problems,is likely to worsen as the global economy tightens its belt in the after-math of the most severe downturn since the Great Depression. A recentWorld Bank report shows that the current crises have added an additional44 million to the ranks of the undernourished (Zaman 2008). Moreover,if the crisis continues as expected, global trade will decline by 2.1 percentin 2009 (Baffes et al. 2009)—a further blow to export-dependentdeveloping countries. Even a 1 percent decline in developing countrygrowth rates could trap an additional 20 million people in poverty(World Bank 2008a).
The economic costs of undernutrition are substantial: productivitylosses to individuals are estimated at more than 10 percent of lifetime earn-ings, and losses to gross domestic product may be as high as 2–3 percent(World Bank 2006). The human costs of undernutrition are tragic, fallinghardest on the most vulnerable in the developing world: nearly one-thirdof children are underweight or stunted, more than 30 percent of the totalpopulation suffers from deficiencies of one or more micronutrients, and35 percent of all child deaths are attributable to undernutrition (Black etal. 2008). It is the largest single contributor to child mortality worldwide.
C H A P T E R 1
Introduction: Why Scale Up?
Unless policies and priorities are changed, the scale of the problem willprevent many countries from achieving the Millennium DevelopmentGoals. The risks are greatest in Sub-Saharan Africa, where malnutrition isincreasing, and in South Asia, where the number of undernourished ishighest and the prevalence is decreasing only slowly (World Bank 2006).
There is a growing recognition of the need to invest in nutrition pro-grams, just as the nutrition community is reaching a consensus aboutwhich programs are most effective. Investment now will accelerate thepace of reduction in malnutrition and hence help to achieve theMillennium Development Goals of halving child hunger and reducingchild mortality by two-thirds. It will also reduce the impact of the ongo-ing crises, especially on the most vulnerable. How much investment isneeded remains an unanswered question of fundamental importance.
The recent Lancet undernutrition series (Black et al. 2008), the earlierWorld Bank report Repositioning Nutrition (World Bank 2006), and recentpublications on the treatment of severe acute malnutrition (Ashworth2006) list several known interventions that could potentially improveglobal nutrition and health outcomes if implemented at a national scalein the countries that bear the highest burden of undernutrition (Leroyet al. 2007). Nonetheless, while we know a lot about what to do, we knowless about how to deliver these interventions through large-scale pro-grams and what resources are needed to launch a worldwide assault onmalnutrition in the highest-burden countries (Shekar et al. 2008). Theselessons can only be learned through experience when additional financ-ing is available to scale up nutrition programming and when impacts oflarge scale programs and alternative delivery mechanisms are rigorouslyand systematically documented.
The Objectives of This Report
This report estimates the costs and financial resources necessary to scaleup delivery of a package of 13 proven nutrition interventions from currentcoverage to 100 percent of the target populations in 36 countries thatcarry 90 percent of the burden of stunting. We also estimate the costs forcovering an additional 32 smaller countries that have high underweight orstunting rates. These estimates represent the cost of going to full scale forthese interventions from the current (low) coverage levels (see figures 2.1and 3.2). We recognize, however, that full coverage will take time, sincebuilding developing country capacities for full coverage is a slow process.
2 Scaling Up Nutrition
These estimates will contribute toward the Global Action Plan forscaling up nutrition programming—a collaborative multipartner effortthat is evolving. The Global Action Plan will highlight the urgency andthe rationale for investing in nutrition, the kinds of evidence-basedactions that can be implemented in real-life programmatic settings, thehigh-burden countries where these actions are needed, and the initialfinancing needs for a scale-up. The Global Action Plan is being developedthrough an inclusive process that will create a movement, generatechampions, and ensure a consistent message across partners. The initialestimates contained in this paper are an integral building block of theGlobal Action Plan to provide a considered response to the question:“How much will it cost to scale up proven nutrition interventions?”
Introduction: Why Scale Up? 3

5
The Scope of These Estimates
Our estimates focus on the costs of scaling up nutrition programs in the36 countries identified by the 2008 Lancet series on maternal and childundernutrition (Black et al. 2008). These 36 countries are home to thevast majority (90 percent) of moderately or severely stunted childrenworldwide. While we limit the cost estimations to these 36 countries, werecognize and fully support the need for programmatic action in manymore countries. Further, we include additional cost estimates for scalingup these interventions to include the 32 smaller countries where 20 percent or more of all children under the age of five are stunted orunderweight (mainly in Sub-Saharan Africa). These 32 countries wereidentified in Repositioning Nutrition (World Bank 2006), but were notincluded in the country list put forth by the 2008 Lancet undernutritionseries. Our estimates show that this expansion of coverage would increasethe target population by 6 percent and hence raise overall costs by a comparable amount. Both groups of countries are listed in table 2.1 anddisplayed in map 2.1.
The cost of different delivery platforms is calculated separately toallow for increased flexibility in applying these estimates to differentsettings. To the extent possible, these estimates are accompanied by
Methodology: Estimating the Costs
C H A P T E R 2
6 Scaling Up Nutrition
Table 2.1 The 36 Countries with 90 Percent of the Global Burden of Stunting andan Additional 32 High-Burden Countries with Underweight or Stunting RatesGreater Than 20 Percent
36 countries identified in Lancet that carry 90% of the stunting burden for which financing needs are estimated
32 smaller countries with rates of child stuntingand/or underweight >20% that could be added to these estimates at an additional cost of 6%
Afghanistan Albania
Angola Bhutan
Bangladesh Bolivia
Burkina Faso Botswana
Burundi Central African Republic
Cambodia Comoros
Cameroon Congo, Republic of
Congo, Democratic Republic of Ecuador
Côte d’Ivoire Equatorial Guinea
Egypt, Arab Republic of Eritrea
Ethiopia Djibouti
Ghana Gambia, The
Guatemala Guinea
India Guinea-Bissau
Indonesia Haiti
Iraq Honduras
Kenya Lesotho
Madagascar Liberia
Malawi Maldives
Mali Mauritania
Mozambique Mongolia
Myanmar Namibia
Nepal Rwanda
Niger São Tomé and Príncipe
Nigeria Sierra Leone
Pakistan Somalia
Peru Sri Lanka
Philippines Swaziland
South Africa Tajikistan
Sudan Timor-Leste
Tanzania Togo
Turkey Zimbabwe
Uganda
Vietnam
Yemen, Republic of
Zambia
Sources: For column 1, Black et al. 2008; for column 2, World Bank 2006.
Note: If the countries in column 2 were added to those in column 1, population coverage and financing needs
would increase by approximately 6 percent. Column 1 is similar to the 42 countries covered in a costing exercise
for child mortality, which account for 90 percent of child deaths (Bryce et al. 2005); the 42 countries include the
36 here, excluding Burundi, Guatemala, and Peru, but including Brazil, Chad, China, Guinea, the Islamic Republic
of Iran, Mexico, Rwanda, Sierra Leone, and Somalia. As interventions are scaled up in these countries, even
stronger links will need to be forged with health systems strengthening efforts.
Map 2.1 The 36 Countries with the Highest Burden of Undernutrition and 32 Smaller High-Burden Countries with Rates of Child Stuntingor Underweight Greater Than 20 Percent
Sources: 36 countries (Black et al. 2008); 32 countries (World Bank 2006).
7
estimates of the cost of inaction (benefits forgone by pursuing a “businessas usual” scenario) based on a review of the literature. Cost-effectivenessestimates (or the cost of a given health outcome) of known interventionsare also documented.
The current exercise does not directly estimate the full social resourcerequirements of the proposed scale-up effort. Instead, the emphasis is onestimating the costs in financial or budgetary terms (i.e., it does not try tocapture the opportunity costs of time of households in accessing services)to estimate the financing needs. Estimating the full resource requirementsfor these interventions could be the subject of future work. Furthermore,this exercise does not estimate the cost of reaching the MillenniumDevelopment Goal on hunger and undernutrition (1c), since progresstoward this goal is measured primarily by the underweight and food secu-rity indicators rather than stunting and micronutrient deficiencies.
The majority of interventions costed here can be delivered using threemain delivery platforms—primary health care, market-based mechanisms,and community nutrition programs. The primary health care systemincludes antenatal and delivery care, neonatal programs and extensionefforts such as child health days. To deliver these interventions successfully,it is critical to build strong links with ongoing efforts for health systemsstrengthening. We do not cost the needs for health systems strengtheninghere since it is covered through other complementary health sector invest-ments and since it is the major focus of the High Level Taskforce onInnovative Financing for Health Systems. Other interventions such as foodfortification use market-based mechanisms for delivery, but will needsome investments through the public sector for regulation and policychanges. A third critical delivery platform for nutrition is communitynutrition programs. We include here costs for the market-based mecha-nisms and for community nutrition programs, because these costs are notcovered by other sectors or programs (see table 2.3 for details).
We do not cost other potentially critical direct and indirect interven-tions that impact nutrition outcomes, such as maternal food supplemen-tation (for which programming guidance is still awaited), or genderinterventions to empower women to make the right caring decisions fortheir children. Nor do we include some new technologies (such as bio-fortification) or other food security interventions through the agricul-ture sector. There are also potential entry points for nutritionimprovements through the education sector—for example, provision ofdeworming medication for school-aged children and iron-folic acid sup-plementation for adolescents through schools. Additionally, there are
8 Scaling Up Nutrition
many other indirect interventions that can be implemented throughother sectors such as agriculture, education, and rural development thatwill produce nutrition impacts, often referred to as the “longer routes” toimproving nutrition. These are not costed here. Furthermore, we do notcost special nutrition interventions needed in HIV/AIDS-endemic con-texts, albeit they are critical.
Other interventions that may impact nutrition have been excluded inthese estimates, either because they lack a firm evidence base (in the caseof interventions still being debated or not yet tested), because the deliverymechanisms are unclear, or because they may be financed through othersectors (for example, cross-cutting issues such as indoor air pollution, orprograms to provide bed nets or maternal cord-clamping). Although con-ditional cash transfers can be used to support nutrition improvement, wehave covered the supply-side costs of these programs, but have notincluded the cost of the actual cash transfers in our estimates, since theyoften aim to address multiple objectives. However, in situations whereconditional cash transfers are instituted, incorporating components whichstrengthen the demand for nutrition services is highly desirable.
A full list of the interventions that are costed here and a comparisonwith the Lancet series interventions list are included in appendix B.Adding all of these interventions to move to a full scale-up will put anadditional burden on fragile country capacities for program delivery andwill take time, but will also greatly enhance expected impacts. The costsand financing needs for scaling up these additional direct and indirectinterventions should be estimated in follow-on work.
A Methodology Based on Experience
Two principal methodologies have been used to estimate the costs ofhealth interventions: the “ingredients approach” and the “program experi-ence approach.” In the “ingredients approach,” the selected activities areoutlined, bundled into appropriate delivery packages (for example, num-ber of visits to a health center), and then estimates of costs are con-structed using unit costs of specific activities such as clinic visits,outpatient visits, and hospital days from a comprehensive source (such asthe WHO CHOICE database at http://www.int/choice/costs/en). Thiswas one of the costing approaches used by the High Level Taskforce onInnovative Financing for Health Systems.
Bryce et al. (2005) provided an estimate based on the ingredientsapproach for the package of child survival interventions proposed in the
Methodology: Estimating the Costs 9
2003 Lancet series (Jones et al. 2003). They estimate the cost of savingsix million child lives per year using 23 interventions, of which four(breastfeeding, zinc supplements, complementary feeding, and vitaminA supplements) are nutrition interventions. Their methodology isexplained in detail in World Health Organization (2005) and coveredthe 42 countries, which, at the time, accounted for 90 percent of deathsamong children under five years of age. Their estimates suggested a needfor US$5.1 billion in additional funding to provide universal coverage(99 percent, except for breastfeeding which was 90 percent) in the 42 countries. This translates to US$1.23 per capita in these countries,and the estimated cost per life saved was US$887.
An alternative methodology is called the “program experience”approach such as the one used for the Marginal Budgeting for Bottlenecks(MBB) approach referred to by the High Level Taskforce on InnovativeFinancing for Health Systems. In this approach, estimates of per unitcosts are taken from actual programs operating in countries, carefullyanalyzing the context in which the estimates are derived (for instance,whether the costs come from stand-alone programs, components ofprimary health services, or one of a small group of interventions in anoutreach program). The services are then packaged into appropriatedelivery mechanisms and the total cost of the basket of services is cal-culated. The program experience approach tends to yield somewhathigher costs than the ingredients approach. The ingredients methodassumes that programs are running in an efficient manner, while theprogram experience method takes the median of actual field experi-ence, where there may be inefficiencies.
Renewed Efforts Against Childhood Hunger, or REACH (2008), usesthe program experience approach to estimate nutrition program costs.Their estimate for a dozen interventions (five direct nutrition interven-tions, five interventions to improve diarrhea/parasite control, plus twomeasures directed at household food security) is US$36 per year perchild under five years of age, excluding the conditional cash transfersneeded to increase household food security. When full program costs areincluded, this estimate increases to US$47 per year per child (i.e., whenfortification costs, which benefit the whole population, are attributedonly to children under five years of age). With conditional cash transfersincluded, the costs rise to US$47–104 per child under five years of age(“direct costs”) and US$75–217 (“full program costs”).
This report uses the “program experience” method to estimate the costof expanding the nutrition interventions considered here. This method
10 Scaling Up Nutrition
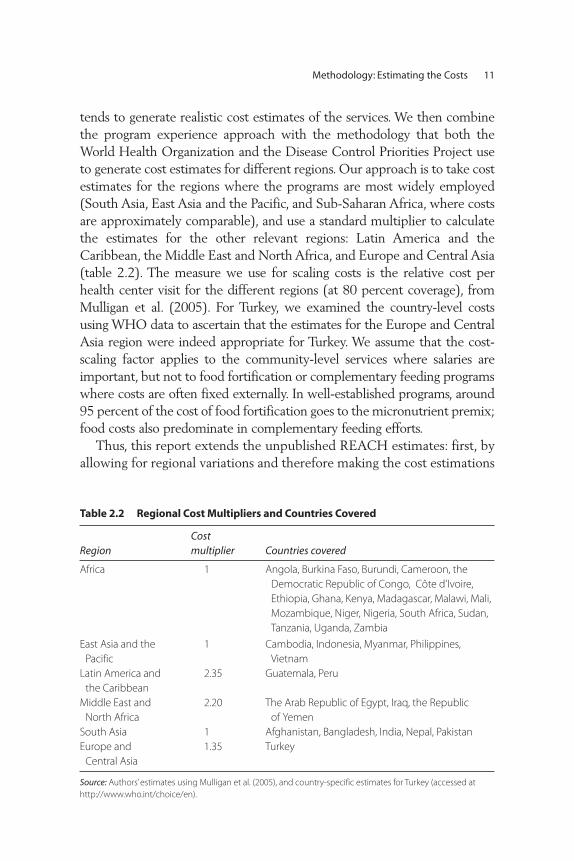
tends to generate realistic cost estimates of the services. We then combinethe program experience approach with the methodology that both theWorld Health Organization and the Disease Control Priorities Project useto generate cost estimates for different regions. Our approach is to take costestimates for the regions where the programs are most widely employed(South Asia, East Asia and the Pacific, and Sub-Saharan Africa, where costsare approximately comparable), and use a standard multiplier to calculatethe estimates for the other relevant regions: Latin America and theCaribbean, the Middle East and North Africa, and Europe and Central Asia(table 2.2). The measure we use for scaling costs is the relative cost perhealth center visit for the different regions (at 80 percent coverage), fromMulligan et al. (2005). For Turkey, we examined the country-level costsusing WHO data to ascertain that the estimates for the Europe and CentralAsia region were indeed appropriate for Turkey. We assume that the cost-scaling factor applies to the community-level services where salaries areimportant, but not to food fortification or complementary feeding programswhere costs are often fixed externally. In well-established programs, around95 percent of the cost of food fortification goes to the micronutrient premix;food costs also predominate in complementary feeding efforts.
Thus, this report extends the unpublished REACH estimates: first, byallowing for regional variations and therefore making the cost estimations
Methodology: Estimating the Costs 11
Table 2.2 Regional Cost Multipliers and Countries Covered
RegionCost multiplier Countries covered
Africa 1 Angola, Burkina Faso, Burundi, Cameroon, the
Democratic Republic of Congo, Côte d’Ivoire,
Ethiopia, Ghana, Kenya, Madagascar, Malawi, Mali,
Mozambique, Niger, Nigeria, South Africa, Sudan,
Tanzania, Uganda, Zambia
East Asia and the
Pacific
1 Cambodia, Indonesia, Myanmar, Philippines,
Vietnam
Latin America and
the Caribbean
2.35 Guatemala, Peru
Middle East and
North Africa
2.20 The Arab Republic of Egypt, Iraq, the Republic
of Yemen
South Asia 1 Afghanistan, Bangladesh, India, Nepal, Pakistan
Europe and
Central Asia
1.35 Turkey
Source: Authors’ estimates using Mulligan et al. (2005), and country-specific estimates for Turkey (accessed at
http://www.who.int/choice/en).
more rigorous; second, by using demographic data for individual countries(whereas REACH uses a representative country approach); third, becausethe costing of the interventions for moderate and severe malnutrition ismuch more detailed, by incorporating the latest information from afast-growing area of the literature; fourth, by estimating the additionalfinancing needs for some of the smaller high-burden countries(beyond the Lancet list of 36 countries); fifth, by adding sensitivityanalyses to provide a range of costs under different assumptions tomitigate the uncertainty inherent in cost projections; and last, byadding additional resources for rigorous monitoring and evaluation forlarge-scale investments, for operational research for program delivery,and for technical assistance.
A Program of Proven Interventions
We estimated the costs for scaling up 13 interventions that fall into3 broad groups:
• Behavior change interventions that include promotion of breast-feeding, appropriate complementary feeding practices (but excludingprovision of food), and proper hygiene, specifically handwashing. It isassumed that the majority of these services are delivered one-on-oneat the community level through delivery platforms such as commu-nity nutrition programs (Mason et al., 2006).
• Micronutrient and deworming interventions that provide a range ofsupplements for children under the age of five (periodic vitamin Asupplements, therapeutic zinc supplements for the management ofdiarrhea, multiple micronutrient powders, and deworming drugs); forpregnant women (iron-folic acid supplements, as well as iodized oilcapsules where iodized salt is not available); and for the general pop-ulation (iron fortification of staple foods and salt iodization).
• Complementary and therapeutic feeding interventions that consistof provision of vitamin- and mineral-fortified and/or -enhanced com-plementary foods for the prevention and treatment of moderate mal-nutrition among children 6–23 months of age, amounting toapproximately 50 percent of the age group in Sub-Saharan Africa,80 percent in South Asia, and 10 percent in the other regions, and
12 Scaling Up Nutrition
community-based management of severe acute malnutrition amongchildren under five years of age.
This set of interventions, described in table 2.3, was agreed upon withpartners in a side meeting organized at the UNICEF Innocenti ResearchCentre in September 2008 (appendix A), although the detailed imple-mentation issues were subsequently elaborated on. The rationale forselection of these interventions is available in appendix B. Furthermore,because the costs of nutrition programs depend extensively on the systems through which they are delivered, attention to the deliverymechanisms in different settings is essential. In general, the appropriate-ness and cost of the delivery system in a given country (or region) variesdepending on the type of intervention and available infrastructure andcapacities. Therefore, while potential delivery platforms are outlined intable 2.3, these are expected to be implemented differently in diversecountry settings and contexts. Table 2.4 groups the interventions togetherinto “packages” for initial costing. All of the above are assumptions forcosting purposes. None is meant to be prescriptive, or to convey a “one-size-fits-all” approach to country programming. We also recognize thatachieving these high coverage levels for a full scale-up will requireincreased country capacities that need time to build up. Furthermore, inline with the Paris and Accra declarations, all interventions deliveredthrough the health system are expected to be able to ride on the effortsat strengthening health systems currently underway in many countries. Tothat effect, these resources will need to be programmed in ways that arecomplementary rather than duplicative or competitive.
Some Assumptions about Coverage
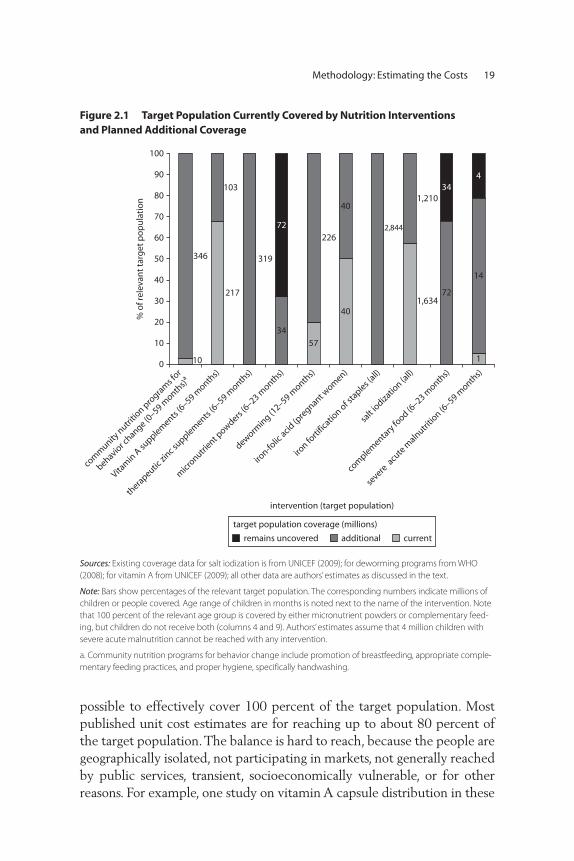
As a first step in calculating costs, we must estimate the number of indi-viduals in the appropriate target populations (as defined in the third col-umn of table 2.3). Scaling up to full coverage of the population in the36 countries with the highest burden of undernutrition would potentiallyreach some 2.8 billion people, of which 356 million are children underfive years of age (table 2.5). That is a dramatic expansion over currentcoverage, as illustrated in figure 2.1. See appendix C for a more detailedexplanation of the population estimates and country-specific data.
We make some assumptions about the feasible coverage of the popu-lation in order to make the costing exercise tractable. First, it is rarely
Methodology: Estimating the Costs 13
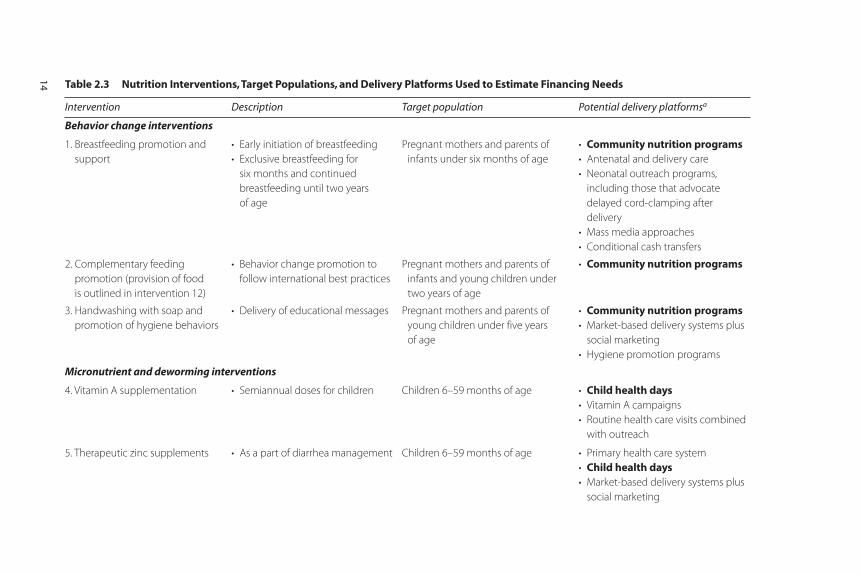
Table 2.3 Nutrition Interventions, Target Populations, and Delivery Platforms Used to Estimate Financing Needs
Intervention Description Target population Potential delivery platformsa
Behavior change interventions
1. Breastfeeding promotion and
support
• Early initiation of breastfeeding
• Exclusive breastfeeding for
six months and continued
breastfeeding until two years
of age
Pregnant mothers and parents of
infants under six months of age
• Community nutrition programs• Antenatal and delivery care
• Neonatal outreach programs,
including those that advocate
delayed cord-clamping after
delivery
• Mass media approaches
• Conditional cash transfers
2. Complementary feeding
promotion (provision of food
is outlined in intervention 12)
• Behavior change promotion to
follow international best practices
Pregnant mothers and parents of
infants and young children under
two years of age
• Community nutrition programs
3. Handwashing with soap and
promotion of hygiene behaviors
• Delivery of educational messages Pregnant mothers and parents of
young children under five years
of age
• Community nutrition programs• Market-based delivery systems plus
social marketing
• Hygiene promotion programs
Micronutrient and deworming interventions
4. Vitamin A supplementation • Semiannual doses for children Children 6–59 months of age • Child health days• Vitamin A campaigns
• Routine health care visits combined
with outreach
5. Therapeutic zinc supplements • As a part of diarrhea management Children 6–59 months of age • Primary health care system
• Child health days• Market-based delivery systems plus
social marketing
14
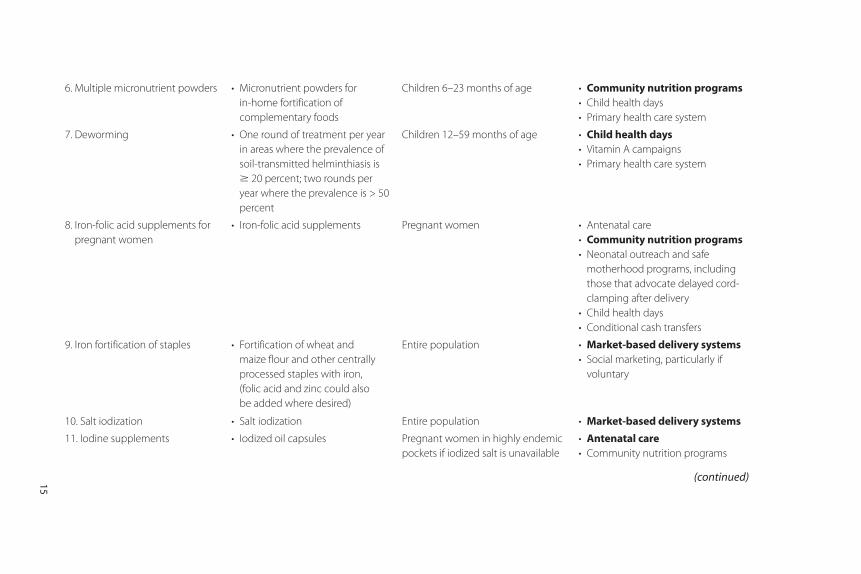
15
6. Multiple micronutrient powders • Micronutrient powders for
in-home fortification of
complementary foods
Children 6–23 months of age • Community nutrition programs• Child health days
• Primary health care system
7. Deworming • One round of treatment per year
in areas where the prevalence of
soil-transmitted helminthiasis is
� 20 percent; two rounds per
year where the prevalence is > 50
percent
Children 12–59 months of age • Child health days• Vitamin A campaigns
• Primary health care system
8. Iron-folic acid supplements for
pregnant women
• Iron-folic acid supplements Pregnant women • Antenatal care
• Community nutrition programs• Neonatal outreach and safe
motherhood programs, including
those that advocate delayed cord-
clamping after delivery
• Child health days
• Conditional cash transfers
9. Iron fortification of staples • Fortification of wheat and
maize flour and other centrally
processed staples with iron,
(folic acid and zinc could also
be added where desired)
Entire population • Market-based delivery systems• Social marketing, particularly if
voluntary
10. Salt iodization • Salt iodization Entire population • Market-based delivery systems
11. Iodine supplements • Iodized oil capsules Pregnant women in highly endemic
pockets if iodized salt is unavailable
• Antenatal care• Community nutrition programs
(continued)
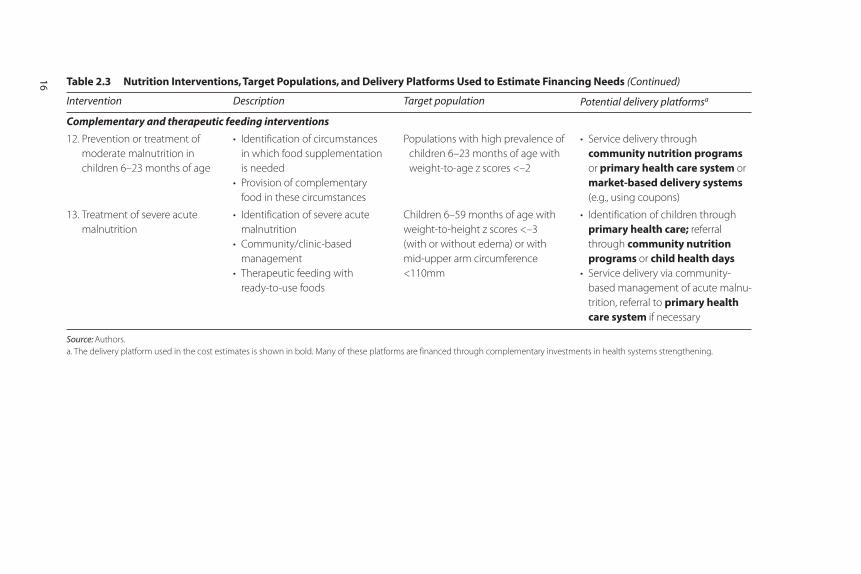
Table 2.3 Nutrition Interventions, Target Populations, and Delivery Platforms Used to Estimate Financing Needs (Continued)
Intervention Description Target population Potential delivery platformsa
Complementary and therapeutic feeding interventions
12. Prevention or treatment of
moderate malnutrition in
children 6–23 months of age
• Identification of circumstances
in which food supplementation
is needed
• Provision of complementary
food in these circumstances
Populations with high prevalence of
children 6–23 months of age with
weight-to-age z scores <–2
• Service delivery through
community nutrition programsor primary health care system or
market-based delivery systems(e.g., using coupons)
13. Treatment of severe acute
malnutrition
• Identification of severe acute
malnutrition
• Community/clinic-based
management
• Therapeutic feeding with
ready-to-use foods
Children 6–59 months of age with
weight-to-height z scores <–3
(with or without edema) or with
mid-upper arm circumference
<110mm
• Identification of children through
primary health care; referral
through community nutritionprograms or child health days
• Service delivery via community-
based management of acute malnu-
trition, referral to primary healthcare system if necessary
Source: Authors.
a. The delivery platform used in the cost estimates is shown in bold. Many of these platforms are financed through complementary investments in health systems strengthening.
16
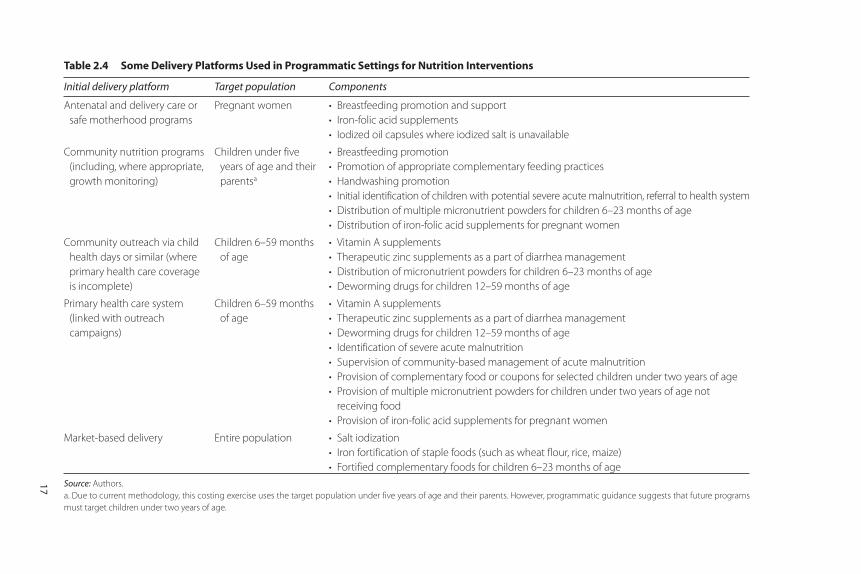
Table 2.4 Some Delivery Platforms Used in Programmatic Settings for Nutrition Interventions
Initial delivery platform Target population Components
Antenatal and delivery care or
safe motherhood programs
Pregnant women • Breastfeeding promotion and support
• Iron-folic acid supplements
• Iodized oil capsules where iodized salt is unavailable
Community nutrition programs
(including, where appropriate,
growth monitoring)
Children under five
years of age and their
parentsa
• Breastfeeding promotion
• Promotion of appropriate complementary feeding practices
• Handwashing promotion
• Initial identification of children with potential severe acute malnutrition, referral to health system
• Distribution of multiple micronutrient powders for children 6–23 months of age
• Distribution of iron-folic acid supplements for pregnant women
Community outreach via child
health days or similar (where
primary health care coverage
is incomplete)
Children 6–59 months
of age
• Vitamin A supplements
• Therapeutic zinc supplements as a part of diarrhea management
• Distribution of micronutrient powders for children 6–23 months of age
• Deworming drugs for children 12–59 months of age
Primary health care system
(linked with outreach
campaigns)
Children 6–59 months
of age
• Vitamin A supplements
• Therapeutic zinc supplements as a part of diarrhea management
• Deworming drugs for children 12–59 months of age
• Identification of severe acute malnutrition
• Supervision of community-based management of acute malnutrition
• Provision of complementary food or coupons for selected children under two years of age
• Provision of multiple micronutrient powders for children under two years of age not
receiving food
• Provision of iron-folic acid supplements for pregnant women
Market-based delivery Entire population • Salt iodization
• Iron fortification of staple foods (such as wheat flour, rice, maize)
• Fortified complementary foods for children 6–23 months of age
Source: Authors.
a. Due to current methodology, this costing exercise uses the target population under five years of age and their parents. However, programmatic guidance suggests that future programs
must target children under two years of age.
17
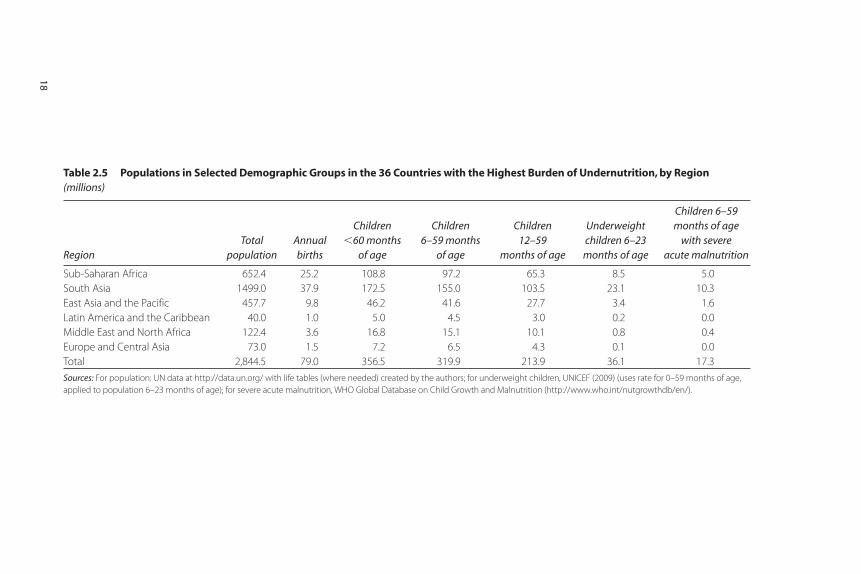
Table 2.5 Populations in Selected Demographic Groups in the 36 Countries with the Highest Burden of Undernutrition, by Region (millions)
RegionTotal
populationAnnualbirths
Children �60 months
of age
Children 6–59 months
of age
Children 12–59
months of age
Underweight children 6–23
months of age
Children 6–59 months of age
with severe acute malnutrition
Sub-Saharan Africa 652.4 25.2 108.8 97.2 65.3 8.5 5.0
South Asia 1499.0 37.9 172.5 155.0 103.5 23.1 10.3
East Asia and the Pacific 457.7 9.8 46.2 41.6 27.7 3.4 1.6
Latin America and the Caribbean 40.0 1.0 5.0 4.5 3.0 0.2 0.0
Middle East and North Africa 122.4 3.6 16.8 15.1 10.1 0.8 0.4
Europe and Central Asia 73.0 1.5 7.2 6.5 4.3 0.1 0.0
Total 2,844.5 79.0 356.5 319.9 213.9 36.1 17.3
Sources: For population: UN data at http://data.un.org/ with life tables (where needed) created by the authors; for underweight children, UNICEF (2009) (uses rate for 0–59 months of age,
applied to population 6–23 months of age); for severe acute malnutrition, WHO Global Database on Child Growth and Malnutrition (http://www.who.int/nutgrowthdb/en/).
18
Methodology: Estimating the Costs 19
Figure 2.1 Target Population Currently Covered by Nutrition Interventions and Planned Additional Coverage
217
10
57
1,634
346
103
319
226
40
40
2,844
1,210
34
72
72
34
14
1
4
0
10
20
30
40
50
60
70
80
90
100
com
munity
nutri
tion p
rogra
ms f
or
behavior c
hange (0–59 m
onths)a
Vitam
in A
supplem
ents (6
–59 month
s)
thera
peutic zi
nc supplem
ents (6
–59 month
s)
micr
onutrient p
owders (6
–23 month
s)
dewormin
g (12–59 m
onths)
iron-fo
lic acid
(pre
gnant wom
en)
iron fo
rtific
ation of s
taples (
all)
salt
iodiza
tion (a
ll)
com
plementa
ry fo
od (6–23 m
onths)
severe
acu
te m
alnutri
tion (6
–59 month
s)
% o
f rel
evan
t ta
rget
po
pu
lati
on
currentadditionalremains uncovered
target population coverage (millions)
intervention (target population)
Sources: Existing coverage data for salt iodization is from UNICEF (2009); for deworming programs from WHO
(2008); for vitamin A from UNICEF (2009); all other data are authors’ estimates as discussed in the text.
Note: Bars show percentages of the relevant target population. The corresponding numbers indicate millions of
children or people covered. Age range of children in months is noted next to the name of the intervention. Note
that 100 percent of the relevant age group is covered by either micronutrient powders or complementary feed-
ing, but children do not receive both (columns 4 and 9). Authors’ estimates assume that 4 million children with
severe acute malnutrition cannot be reached with any intervention.
a. Community nutrition programs for behavior change include promotion of breastfeeding, appropriate comple-
mentary feeding practices, and proper hygiene, specifically handwashing.
possible to effectively cover 100 percent of the target population. Mostpublished unit cost estimates are for reaching up to about 80 percent ofthe target population. The balance is hard to reach, because the people aregeographically isolated, not participating in markets, not generally reachedby public services, transient, socioeconomically vulnerable, or for otherreasons. For example, one study on vitamin A capsule distribution in these
hard-to-reach households hired community workers to identify thosehouseholds in 12 rural districts in Bangladesh that were not covered bythe existing distribution system. They made house-to-house visits to reg-ister children and conducted follow-up visits. It cost about three times asmuch to reach these children as it did to reach those who were not hardto reach, although the authors hoped that with experience this additionalcost might decrease (Micronutrient Initiative 2007). Assuming that onecan cover about 80 percent of the target population at a constant marginalcost, it is likely that the cost to reach the next 10 percent might double.
Mulligan et al. (2005) provide information on the cost of health cen-ter visits by coverage levels which corroborates this estimate. They esti-mate that for Sub-Saharan Africa, the average cost increases by30 percent to achieve 90 percent rather than 80 percent coverage, whichimplies that the marginal cost of the increased coverage above 80 percentis almost four times that of getting to 80 percent coverage. (They alsoprovide estimates of the difference between average costs at 70 percentand 80 percent coverage, where the difference is much smaller.) Similarly,the World Health Organization’s CHOICE project has increasing mar-ginal costs as coverage increases, albeit at a less sharp rate (accessed athttp://www.who.int/choice/en).
We, therefore, cost out coverage for 100 percent of the target popu-lation, but recognize that effective coverage is unlikely to exceed90 percent for most interventions (and we are effectively allowing for theincreased unit cost of increasing coverage above 80 percent).Community-based management of severe acute malnutrition is theexception, and coverage is estimated at 80 percent, since no field pro-grams currently have exceeded this coverage rate. Furthermore, we pro-pose a phased approach to scaling up these interventions since thecapacities and mechanisms to deliver these interventions are extremelylimited in most of the high-burden countries. We also allow for specificresources and time to build these capacities before scaling-up to the nextphase of interventions.
Some Assumptions about Delivery of Services
We recognize that unit costs will vary across regions, largely because ofdifferences in the cost of delivering services. Our estimates of unit costsfor each type of intervention are derived from experience in South Asia,East Asia and the Pacific, and Africa (table 2.6). Costs for the other threeregions (Latin America and the Caribbean, Middle East and North Africa,
20 Scaling Up Nutrition
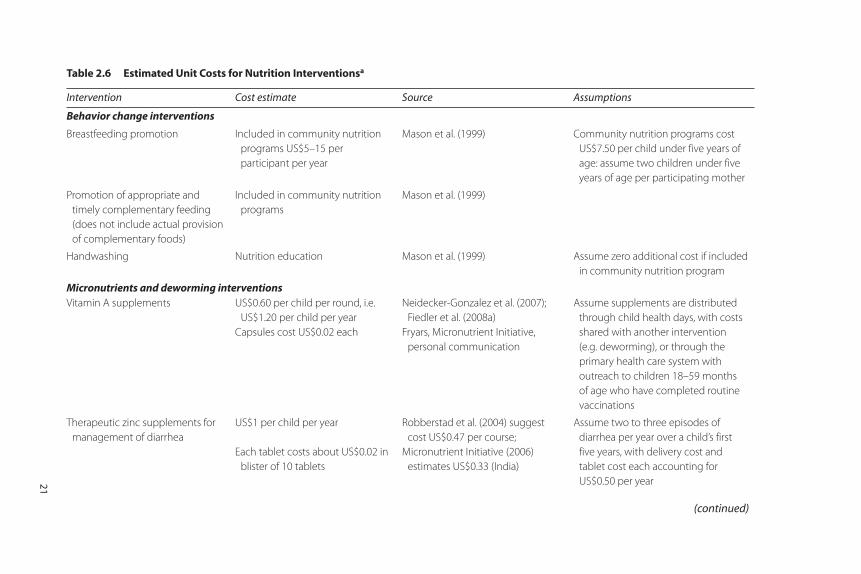
Table 2.6 Estimated Unit Costs for Nutrition Interventionsa
Intervention Cost estimate Source Assumptions
Behavior change interventions
Breastfeeding promotion Included in community nutrition
programs US$5–15 per
participant per year
Mason et al. (1999) Community nutrition programs cost
US$7.50 per child under five years of
age: assume two children under five
years of age per participating mother
Promotion of appropriate and
timely complementary feeding
(does not include actual provision
of complementary foods)
Included in community nutrition
programs
Mason et al. (1999)
Handwashing Nutrition education Mason et al. (1999) Assume zero additional cost if included
in community nutrition program
Micronutrients and deworming interventionsVitamin A supplements US$0.60 per child per round, i.e.
US$1.20 per child per year
Capsules cost US$0.02 each
Neidecker-Gonzalez et al. (2007);
Fiedler et al. (2008a)
Fryars, Micronutrient Initiative,
personal communication
Assume supplements are distributed
through child health days, with costs
shared with another intervention
(e.g. deworming), or through the
primary health care system with
outreach to children 18–59 months
of age who have completed routine
vaccinations
Therapeutic zinc supplements for
management of diarrhea
US$1 per child per year
Each tablet costs about US$0.02 in
blister of 10 tablets
Robberstad et al. (2004) suggest
cost US$0.47 per course;
Micronutrient Initiative (2006)
estimates US$0.33 (India)
Assume two to three episodes of
diarrhea per year over a child’s first
five years, with delivery cost and
tablet cost each accounting for
US$0.50 per year21
(continued)
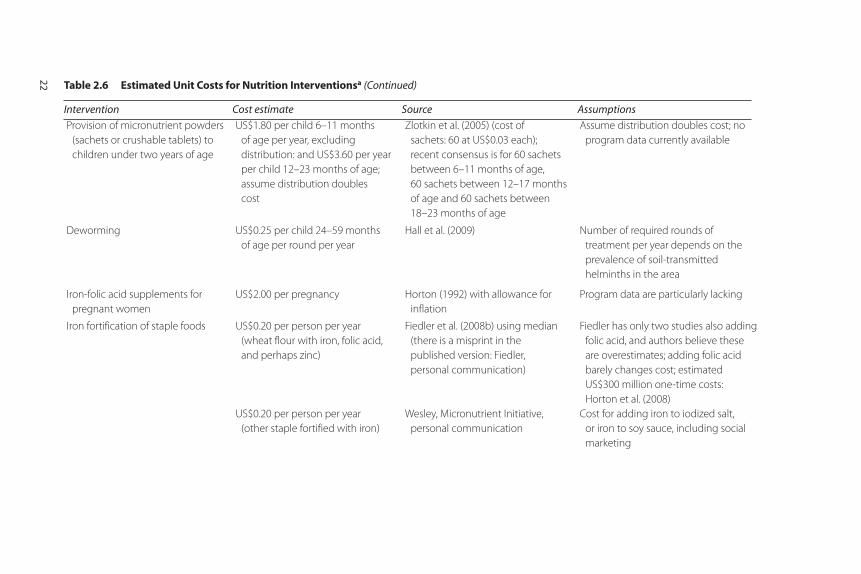
Provision of micronutrient powders
(sachets or crushable tablets) to
children under two years of age
US$1.80 per child 6–11 months
of age per year, excluding
distribution: and US$3.60 per year
per child 12–23 months of age;
assume distribution doubles
cost
Zlotkin et al. (2005) (cost of
sachets: 60 at US$0.03 each);
recent consensus is for 60 sachets
between 6–11 months of age,
60 sachets between 12–17 months
of age and 60 sachets between
18–23 months of age
Assume distribution doubles cost; no
program data currently available
Deworming US$0.25 per child 24–59 months
of age per round per year
Hall et al. (2009) Number of required rounds of
treatment per year depends on the
prevalence of soil-transmitted
helminths in the area
Iron-folic acid supplements for
pregnant women
US$2.00 per pregnancy Horton (1992) with allowance for
inflation
Program data are particularly lacking
Iron fortification of staple foods US$0.20 per person per year
(wheat flour with iron, folic acid,
and perhaps zinc)
US$0.20 per person per year
(other staple fortified with iron)
Fiedler et al. (2008b) using median
(there is a misprint in the
published version: Fiedler,
personal communication)
Wesley, Micronutrient Initiative,
personal communication
Fiedler has only two studies also adding
folic acid, and authors believe these
are overestimates; adding folic acid
barely changes cost; estimated
US$300 million one-time costs:
Horton et al. (2008)
Cost for adding iron to iodized salt,
or iron to soy sauce, including social
marketing
22 Table 2.6 Estimated Unit Costs for Nutrition Interventionsa (Continued)
Intervention Cost estimate Source Assumptions
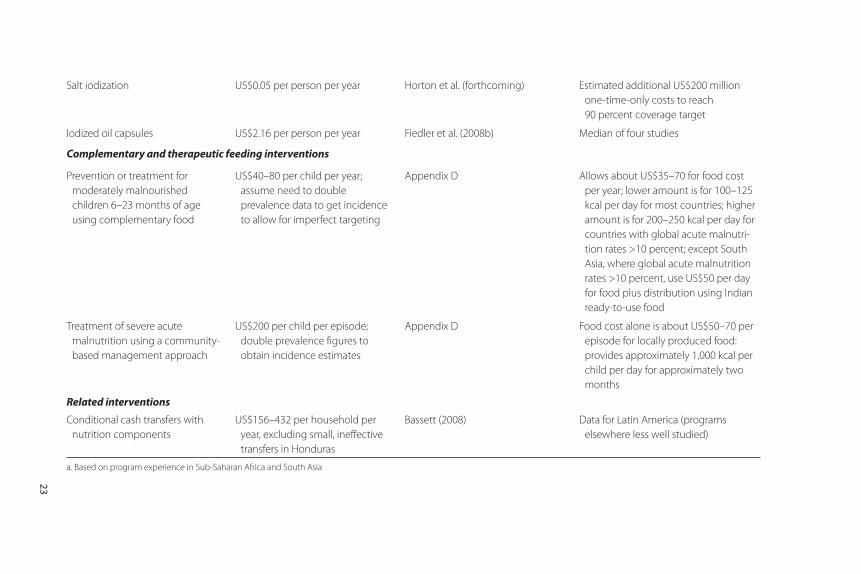
23
Salt iodization US$0.05 per person per year Horton et al. (forthcoming) Estimated additional US$200 million
one-time-only costs to reach
90 percent coverage target
Iodized oil capsules US$2.16 per person per year Fiedler et al. (2008b) Median of four studies
Complementary and therapeutic feeding interventions
Prevention or treatment for
moderately malnourished
children 6–23 months of age
using complementary food
US$40–80 per child per year;
assume need to double
prevalence data to get incidence
to allow for imperfect targeting
Appendix D Allows about US$35–70 for food cost
per year; lower amount is for 100–125
kcal per day for most countries; higher
amount is for 200–250 kcal per day for
countries with global acute malnutri-
tion rates >10 percent; except South
Asia, where global acute malnutrition
rates >10 percent, use US$50 per day
for food plus distribution using Indian
ready-to-use food
Treatment of severe acute
malnutrition using a community-
based management approach
US$200 per child per episode;
double prevalence figures to
obtain incidence estimates
Appendix D Food cost alone is about US$50–70 per
episode for locally produced food:
provides approximately 1,000 kcal per
child per day for approximately two
months
Related interventions
Conditional cash transfers with
nutrition components
US$156–432 per household per
year, excluding small, ineffective
transfers in Honduras
Bassett (2008) Data for Latin America (programs
elsewhere less well studied)
a. Based on program experience in Sub-Saharan Africa and South Asia
24 Scaling Up Nutrition
and Europe and Central Asia) are increased by the multipliers presentedin table 2.2. We include delivery costs in the unit costs and provide infor-mation separately on the costs of the capsules, micronutrient powders,and other inputs. Typically, delivery costs account for the majority ofexpenditures for interventions targeting individuals through public provi-sion of services, but a considerably lower proportion for fortification,which is delivered using markets. A large proportion of the delivery costsfor fortification are borne by the private sector and passed on to con-sumers, families, and communities.
For micronutrient interventions, we estimate that the delivery costsaccount for about one-third of the overall cost (96 percent for vitaminA supplements, 90 percent for iron-folic acid supplements, 20 percentfor therapeutic zinc supplements, 50 percent for multiple micronutrientpowders, and less than 5 percent for iron fortification and salt iodization).For community nutrition programs for behavior change, virtually all costsincluded are for nutrition education. For complementary feeding (the areawith the least developed delivery systems and capacities for implementa-tion) estimated delivery costs are 12 percent of the total (probably anunderestimate; further research is needed), and for community-basedmanagement of acute malnutrition, 70 percent of the cost is for inputsother than food (Laurent Gadot, Médecins Sans Frontières, personal com-munication). Overall, a little less than half of the total US$11.8 billionestimate is for delivery mechanisms and nutrition education, less thanhalf is for targeted food supplements, micronutrients, and dewormingmedication, and the rest is for capacity development, monitoring andevaluation, operations research, and technical assistance.
25
Estimated Costs
Table 3.1 summarizes our estimates of the additional annual investmentsrequired for the proposed scaling up of nutrition interventions:
For behavior change interventions ….……………………US$2.9 billion
• Community nutrition programs: Additional investment allows forUS$15 per household for community health or nutrition volunteersor similar workers (potentially linked to the primary health caresystem or similar national structures) to facilitate community organi-zation; educate households about breastfeeding, complementary feed-ing, and handwashing; and to distribute micronutrient powders andperhaps iron-folic acid supplements. They would also refer cases offaltering growth and severe acute malnutrition to the formal healthsystem. We assume that, on average, households have two childrenunder five years of age, such that the cost per child is US$7.50 (house-holds likely need the most intensive education for their first child).Although these community workers may use growth monitoring, theirfocus is on community organization and on nutrition education andgrowth promotion, rather than on growth monitoring specifically.
C H A P T E R 3
What Will It Cost and What Are the Potential Benefits?
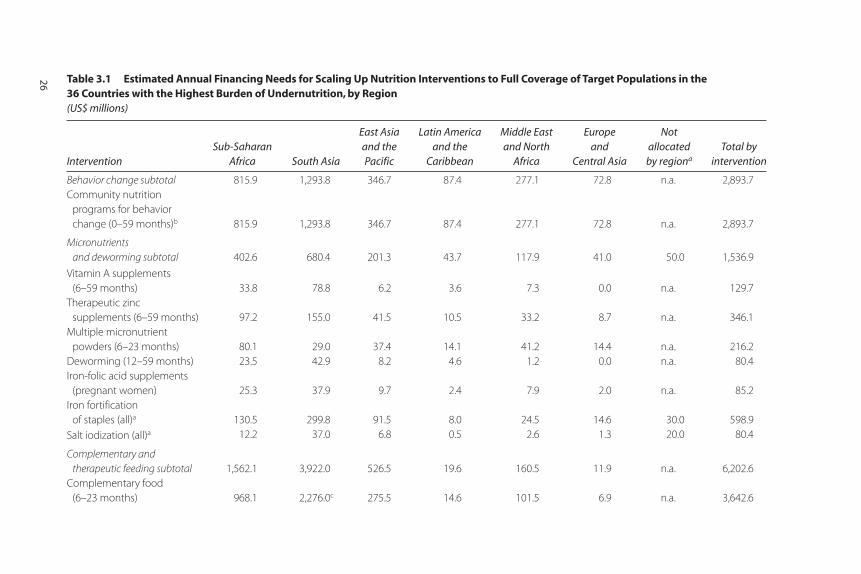
Table 3.1 Estimated Annual Financing Needs for Scaling Up Nutrition Interventions to Full Coverage of Target Populations in the 36 Countries with the Highest Burden of Undernutrition, by Region (US$ millions)
InterventionSub-Saharan
Africa South Asia
East Asia and the Pacific
Latin America and the
Caribbean
Middle East and North
Africa
Europe and
Central Asia
Not allocated by regiona
Total by intervention
Behavior change subtotal 815.9 1,293.8 346.7 87.4 277.1 72.8 n.a. 2,893.7
Community nutrition
programs for behavior
change (0–59 months)b 815.9 1,293.8 346.7 87.4 277.1 72.8 n.a. 2,893.7
Micronutrients
and deworming subtotal 402.6 680.4 201.3 43.7 117.9 41.0 50.0 1,536.9
Vitamin A supplements
(6–59 months) 33.8 78.8 6.2 3.6 7.3 0.0 n.a. 129.7
Therapeutic zinc
supplements (6–59 months) 97.2 155.0 41.5 10.5 33.2 8.7 n.a. 346.1
Multiple micronutrient
powders (6–23 months) 80.1 29.0 37.4 14.1 41.2 14.4 n.a. 216.2
Deworming (12–59 months) 23.5 42.9 8.2 4.6 1.2 0.0 n.a. 80.4
Iron-folic acid supplements
(pregnant women) 25.3 37.9 9.7 2.4 7.9 2.0 n.a. 85.2
Iron fortification
of staples (all)a 130.5 299.8 91.5 8.0 24.5 14.6 30.0 598.9
Salt iodization (all)a 12.2 37.0 6.8 0.5 2.6 1.3 20.0 80.4
Complementary and
therapeutic feeding subtotal 1,562.1 3,922.0 526.5 19.6 160.5 11.9 n.a. 6,202.6
Complementary food
(6–23 months) 968.1 2,276.0c 275.5 14.6 101.5 6.9 n.a. 3,642.6
26
Community-based
management of severe
acute malnutrition
(6–59 months) 594.0 1,646.0 251.0 5.0 59.0 5.0 n.a. 2,560.0
Capacity development
for program delivery n.a. n.a. n.a. n.a. n.a. n.a. 1,000.0 1,000.0
Monitoring and evaluation,
and operations research
for program delivery n.a. n.a. n.a. n.a. n.a. n.a. 200.0 200.0
Total 2,780.6 5,896.2 1,074.5 150.7 555.5 125.7 1,250.0 11,833.2d
Source: Authors’ calculations, using data in figure 2.1 and tables 2.2, 2.5, and 2.6.
a. In addition to the resources required in individual countries, an additional US$50 million per year is estimated to be required for technical assistance, initial subsidy for fortificant, and social
marketing for iron fortification and salt iodization combined; US$1.0 billion for capacity development for program delivery, US$200 million for monitoring and evaluation, and operations
research, and technical assistance.
b. Includes delivery of three behavior change interventions — breastfeeding promotion, promotion of complementary feeding, and hygiene behaviors.
c. In South Asia, costing is based on Indian ready-to-use food, which uses locally available foods and is less expensive than the lipid-based nutritional supplementary foods for which cost esti-
mates have been constructed in other regions. Nutritional benefits of Indian ready-to-use food are not quite as high as those for lipid-based supplements. Switching to those supplements in
South Asia would add another US$1.5 billion to total costs.
d. Of the total US$11.8 billion, we estimate that approximately US$1.5 billion can be financed from private resources. Therefore, the financing requirement from public resources is US$10.3 billion.
n.a. = not applicable.
27
28 Scaling Up Nutrition
Current coverage is low and largely restricted to five countries:Bangladesh, Ethiopia, India, Madagascar, and Uganda. Burkina Faso,Ghana, and Guatemala are also beginning programs. No cost or coverage data are available for countries to estimate current spend-ing, other than Madagascar where current spending is approxi-mately US$8 million. Additional annual cost = US$2.9 billion.
For micronutrient and deworming interventions ………..US$1.5 billion
• Vitamin A supplementation: Additional investment allows forUS$1.20 per child 6–59 months of age per year to scale up coveragewith vitamin A capsules. Currently 68 percent of children aged 6–59months of age are covered in 32 of the 36 countries (calculated fromUNICEF [2009]). Four countries are excluded from the calculation:South Africa, Peru, Iraq, and Turkey; per capita income or infant mor-tality rates make Iraq and Turkey ineligible for donated capsules, andno program is planned. Peru has targeted distribution only, and SouthAfrica recently switched from targeted to more broadly based distri-bution. We assume no increased funding is required for either country.Additional annual cost = US$130 million.
• Therapeutic zinc supplementation for management of diarrhea:Additional investment allows for US$1 per child per year for chil-dren 6–59 months of age for two to three courses of therapeutic zincsulfate to reduce diarrhea-related mortality and morbidity, based onnegligible current coverage. Cost studies of actual programs arerequired to refine this figure, as the first at-scale programs begin.Additional annual cost = US$346 million.
• Multiple micronutrient powders: Additional investment allowsUS$3.60 per child 6–23 months of age per 60-day course of micronu-trients, which has been shown to be an efficacious approach formicronutrient status (Dewey et al. forthcoming; Zlotkin et al. 2005).Current consensus is that children receive this once between 6 and11 months of age, once between 12 and 17 months of age, and oncebetween 18 and 23 months of age. The multiple micronutrient pow-ders would be given to children who are not receiving targeted com-plementary food supplements for moderate or severe malnutrition. Asmodeled, about one-third of children receive micronutrient powders,and two-thirds receive complementary or therapeutic feeding. Weassume current coverage is negligible. Note that multiple micronutrient
What Will It Cost and What Are the Potential Benefits? 29
powders are not yet included in the World Health Organization’s recommendations. Additional annual cost = US$216 million.
• Deworming: The estimated cost per child 12–59 months of age isUS$0.25 per round of treatment per year (Hall et al. 2009; note thatHall et al.’s estimates are for children 24–59 months of age. There are nocost estimates currently available for the 12–24 month age group, whichrequires syrups that are more costly both to purchase and to deliver).Deworming is a highly relevant intervention given its close associationwith micronutrient status and child growth. The benefit:cost ratio isapproximately 6:1 (Horton et al. 2008). The World Health Organiza-tion recommends one round of treatment per year in areas where theprevalence of any soil-transmitted helminths is equal or greater than20 percent, and two rounds of treatment per year in areas where theprevalence exceeds 50 percent. Given the range of national prevalencerates, our estimate assumes an average of 1.5 rounds of treatment peryear in Africa and South Asia. Since all countries included here in theEast Asia and Pacific and Latin America and Caribbean regions havereported prevalence rates greater than 50 percent, two rounds of treat-ment were assumed to be necessary in these areas. Yemen is the onlycountry in the Middle East and North Africa where the prevalence isgreater than 20 percent; therefore, the estimate for the Middle Eastand North Africa assumes that one round of treatment is necessary forchildren in Yemen and no treatment is required in all other countries.No national program is included for Turkey, although dewormingmight be appropriate in selected regions. Currently, 20 percent of preschool children in the 36 countries are covered. Additional annualcost = US$80 million.
• Iron-folic acid supplementation during pregnancy: Additional invest-ment allows for US$2.00 per pregnancy for women to be protectedwith iron and folic acid. We assume that current coverage is similar tothe median cost of coverage with antenatal care (four visits) in 25 ofthe 26 countries for which these data are available (51 percent: WHO2008). The unit cost and coverage data are very weak. Follow-onresearch for these estimates and alternative delivery mechanismswould be valuable. Additional annual cost = US$85 million.
• Iron fortification of staples and other foods: Additional invest-ment allows for US$0.20 per person per year to fortify a staple food.
Fortification of wheat or maize flour with iron is only likely to reachabout half of the population in the 36 countries, based on present con-sumption and milling patterns. This estimated cost of US$0.20 percapita will allow some additional fortification of other vehicles (e.g.,soy sauce or adding iron to iodized salt) to reach those not consumingwheat or maize flour. This assumes that current coverage is negligiblein the 36 countries considered. Our estimate also allows US$30 mil-lion per year for 10 years for technical assistance, social marketing, andinitial premix subsidy to initiate large-scale fortification through theprivate sector. Additional annual cost = US$599 million.
• Universal salt iodization: Additional investment allows for US$0.05 perperson per year to iodize salt (this is the additional amount needed:currently 58 percent of households already have access to iodized saltin the 36 countries considered (calculated from UNICEF [2009]).The estimate also allows US$20 million per year for 10 years fortechnical assistance, social marketing, and initial premix subsidy tocomplete salt iodization through the private sector Additional annualcost = US$80 million.
For complementary feeding and targeted therapeutic feeding..................................................................................US$6.2 billion
• Provision of complementary food for the prevention and treatment ofmoderate malnutrition: Additional investment is the cost of allocatingabout US$0.11 per child per day (including distribution/deliverycosts) averaged over the year, for a small amount of micronutrient for-tified and/or enhanced complementary food to enrich the nutrientdensity of complementary food for selected children 6–23 months ofage, in countries or regions where global acute malnutrition (i.e.weight-for-height z score < –2) is less than 10 percent. In countries orregions where global acute malnutrition exceeds 10 percent, outsideof South Asia, US$0.22 per child per day is allocated to double theamount of fortified and/or enhanced complementary food. In SouthAsia, US$0.14 per child per day is allocated to use Indian ready-to-usefood (for further explanation, see appendix D). In countries wherethis intervention is adopted, it would have to build upon an existingmechanism (such as community-based programs that may or may notuse growth monitoring and health promotion) or some other appro-priate mechanism for identifying underweight children.
30 Scaling Up Nutrition
The cost estimations are based on targeted provision of complementaryfoods. The proportion of the population proposed to be covered istwice the rate of moderate malnutrition (weight-to-age z score < –2).Coverage rates are therefore about 80 percent of the age group inSouth Asia, 50 percent of the age group in Africa and East Asia andPacific regions, and about 10 percent of the age group in other regions.Children 6–23 months of age not receiving targeted complementaryfood are assumed to receive micronutrient powders (see above).
Targeting might be geographic (for all children in selected regions oremergency “hot spots”) or include the provision of coupons to at-riskhouseholds to purchase complementary food commercially (a highlyconditional cash transfer) or could use other appropriate deliverymechanisms through community-based programs or market-baseddelivery systems. If targeting is done for individual children (e.g., usinggrowth monitoring), then costs could be significantly higher. Currentcoverage with micronutrient-fortified and/or -enhanced complemen-tary foods is negligible. Additional annual cost = US$3.6 billion.
• Community-based management of severe acute malnutrition: This isan expensive intervention, which costs US$200 per child treated.The prevalence of severe acute malnutrition is 4.8 percent across the36 countries in the 6–59 months age group (implying an incidence of9.6 percent, using the incidence: prevalence ratio of 2:1). We assumethat if all the other interventions are funded, that prevalence of severeacute malnutrition will fall to 50 percent of present levels (Isanaka etal. 2009, reporting on the effect of an intensive complementary feedingprogram). Unlike other interventions (where we aim for 100 percentcoverage) we aim for 80 percent coverage, since there are no existingprograms at scale achieving higher coverage, and we cost the inter-vention accordingly. Current coverage is approximately one millionchildren (Stephane Doyon, Médecins Sans Frontières, personal com-munication). Additional annual cost =US$2.6 billion.
For capacity development, M&E and technical assistance …...…...............................................................US$1.2 billion
• Capacity development for program delivery: Country capacities toimplement even the basic interventions are weak, and for the morecomplex interventions, implementation and stewardship capacities
What Will It Cost and What Are the Potential Benefits? 31
are even weaker (see, for example, the recent United Nations[2009]). While it is not possible to estimate exactly what it will costto build these capacities, recognizing the magnitude of this task andthe centrality of capacity development for the delivery of all theinterventions, we allocate US$1 billion for this effort across allregions. In doing so, we assume that the capacity development forhealth-related interventions will be closely aligned with the ongoingefforts at health systems strengthening. Additional annual cost =US$1.0 billion.
• Monitoring and evaluation, and operations research and technicalassistance for program delivery: We allocate US$200 million for mon-itoring and evaluation of large-scale programs (starting with US$100million in step 1, and adding another US$100 million in step 2 as moreprograms are scaled up). The focus of the research effort costed herewill be on evaluation of large-scale programs, and on “delivery science”so we can learn more about how to deliver services more effectivelyand efficiently. The knowledge and learning from these investmentswill represent a global public good that will benefit all regions andcountries. Additional annual cost = US$200 million.
The total cost of scaling up ………………………............US$11.8 billion
Of the US$11.8 billion annually, micronutrients (supplementation andfortification) and deworming account for about one-eighth of thetotal, community nutrition programs for one-quarter, complementaryfeeding for one-quarter, and treatment of severe acute malnutrition forone-fifth (figure 3.1). Further, US$1.5 billion of this will be financedfrom private household resources, leaving an estimated financing gapof US$10.3 billion from public resources. More analyses are neededto identify how this can be financed from national and internationalsources.
Given our estimate of the target population of 356 million childrenunder the age of five in the 36 countries, our estimates translate to anannual additional cost of US$30 per child from public resources. Thiscompares to an annual additional cost of US$36 per child estimated byREACH (2008), including delivery costs and not including costs of con-ditional cash transfers. In both cases the estimates do not include the costof fortification for the population five years of age and older. However,the assumptions here and in REACH regarding the more expensiveitems (feeding programs) are somewhat different. In particular, we
32 Scaling Up Nutrition
What Will It Cost and What Are the Potential Benefits? 33
2,894
130
346
2168085
599
80
3,643
2,560
1,000200
intervention (additional financing needs $US million)
community nutrition programs for behavior change (2894)a
therapeutic zinc supplements (346)
vitamin A supplements (130)
micronutrient powders (216)
deworming (80)
iron-folic acid during pregnancy (85)
iron fortification of staples (599)
salt iodization (80)
complementary food (3643)
severe acute malnutrition (2560)
capacity development for program delivery (1000)
monitoring and evaluation; operations researchand technical support for program delivery (200)
Figure 3.1 Estimated Additional Costs for Scaling Up Nutrition Interventions toFull Coverage in the 36 Countries with the Highest Burden of Undernutrition (US$ million)
Source: Authors’ calculations, using table 3.1.
a. Community nutrition programs for behavior change include promotion of breastfeeding, appropriate comple-
mentary feeding practices, and proper hygiene, specifically handwashing.
34 Scaling Up Nutrition
assume that as the micronutrient, deworming, behavior change, andcomplementary feeding programs are phased in, they will have a sub-stantial effect in reducing severe acute malnutrition, whereas that bene-ficial effect is not allowed for in the REACH estimates. Further, there isongoing debate on the use of ready-to-use therapeutic foods in India, forexample, which needs to be resolved before a large-scale expansion isproposed or financed.
Overall, many aspects of the proposed phasing of the scale-up willneed to be adapted to individual country contexts. Countries withhigher implementation capacities may proceed at a faster rate, while thescale-up may be slower in other countries where capacities are morelimited. Figure 3.2 illustrates how much is currently spent, by interven-tion, and the additional financing needs envisaged. It is clear that only asmall proportion of the need is currently being met and there is a verylarge financing gap.
Supportive Policies and Programs: Conditional Cash Transfers
The demand-side costs for conditional cash transfers are not included inour cost estimates, although they can be an effective complement to thesupply-side interventions costed here. The costs per household for condi-tional cash transfers are quite significant, even if the amount of the trans-fers in South Asia and Africa can be correspondingly lower than in LatinAmerica and the Caribbean. Conditional cash transfers typically need totransfer approximately 20 percent of a household’s income to have animpact (Bassett 2008). In Latin America, three of the programs revieweddemonstrated improvements in height-for-age z scores, from 0.13–0.15.In Mexico, an effect of about double this magnitude was achieved inthe younger age group (12–36 months of age). However, Mexico alsohad direct supply-side nutritional inputs (fortified milk for children4–24 months of age and a food supplement for pregnant and lactatingwomen). Conditional cash transfers imply substantial resource trans-fers, but not necessarily increased real resource expenditures (otherthan the program administration and monitoring costs).
These improvements are promising. The Progresa Program (now calledOportunidades) in Mexico provided a transfer equal to about 20 percentof household expenditure, which resulted in additional consumption of7.8 percent more calories overall, including 16.7 percent more fruits andvegetables and 30 percent more animal products in beneficiary house-holds (surveyed in Bassett [2008]).
Conditional cash transfers have successfully changed behavior inmore affluent developing countries at a cost that is feasible in thesecountries. New pilot programs in some of the 36 countries covered herecould show how the approach works in low-income developing coun-tries. If cash transfers were intended for other outcomes, it would beworthwhile to incorporate conditions that could support and enhancedemand for nutrition interventions. For example, many countries eitherhave some form of cash transfers already under way or are consideringputting such safety nets in place in response to the current crises. In such
What Will It Cost and What Are the Potential Benefits? 35
0
500
1,000
1,500
2,000
2,500
3,000
3,500
4,000
com
munity
nutri
tion p
rogra
ms f
or
behavior c
hange (0–59 m
onths)a
Vitam
in A
supplem
ents (6
–59 month
s)
thera
peutic zi
nc supplem
ents
(6–59 m
onths)
micr
onutrient p
owders (6
–23 month
s)
dewormin
g (12–59 m
onths)
iron-fo
lic acid
(pre
gnant moth
ers)
iron fo
rtific
ation of s
taples (
all)
salt
iodiza
tion (a
ll)
com
plementa
ry fo
od (6–23 m
onths)
severe
acu
te m
alnutri
tion (6
–59 month
s)
capacit
y develo
pment f
or pro
gram
deliv
ery
monito
ring and evalu
ation; o
peratio
ns rese
arch
and tech
nical s
upport fo
r pro
gram
deliv
ery
ann
ual
fin
anci
ng
nee
ds,
US$
mill
ion
intervention (target population)
current spending additional financing needs
Figure 3.2 Current Spending and Additional Financing Needed to Scale Up Nutrition Interventions to Full Coverage in the 36 Countries with the Highest Burden of Undernutrition
Source: Current coverage data for vitamin A from UNICEF (2009); for deworming from WHO (2008); and for salt
iodization from UNICEF (2009); other existing coverage data are authors’ estimates. Cost estimates use unit cost
data in table 2.6 and current and target coverage.
Note: Age range of children in months is noted next to the name of the intervention.
a. Community nutrition programs for behavior change include promotion of breastfeeding, appropriate
complementary feeding practices, and proper hygiene, specifically handwashing.
36 Scaling Up Nutrition
situations, making these transfers conditional on use of the nutritioninterventions listed here could help to combat undernutrition with min-imal additional costs.
In the lower-income countries, one way to incorporate a transfer-type approach would be to provide coupons to poor households inurban areas. Governments could ensure access for the most vulnera-ble families to micronutrient powders or fortified complementaryfoods at a nominal cost (or free), while encouraging local provision ofsuch goods on commercial terms through market-based systems towealthier households.
Links with Health Systems Strengthening
In many countries, efforts are already underway to strengthen healthsystems, with extensive support from development partners throughinitiatives such as the International Health Partnership. This includesefforts to strengthen human resources in health, to develop innovativeand lower cost service delivery strategies, and to build better healthmetrics, through initiatives such as the Health Metrics Network. Sincemany of the nutrition interventions costed here are delivered throughthe health system, a close link and complementarity with these effortsis critical. This is suggested for pragmatic reasons (wherein the nutri-tion interventions ride on and complement the strengthened healthsystems), and in the spirit of the Paris and Accra declarations for aideffectiveness and transaction costs for governments.
Expected Outcomes
What will a US$10.3 billion of public investment buy each year? The listis long:
• Households with 356 million children under five years of age will bereached by community nutrition programs for behavior change, allow-ing more mothers to learn the benefits of exclusive breastfeeding andmore families to learn about optimal complementary feeding prac-tices and appropriate hygiene practices.
• 103 million additional children 6–59 months of age will receive twice-yearly doses of life-saving vitamin A supplements.
• 40 million additional pregnant women will receive iron-folic acidtablets as part of their antenatal care.
What Will It Cost and What Are the Potential Benefits? 37
• 319 million children 6–59 months of age will receive zinc supplementsas part of diarrhea management.
• 2.8 billion more people will be able to consume staple foods fortifiedwith iron.
• 1.2 billion people who do not currently use iodized salt will be able toobtain it; pregnant women will receive iodized oil capsules untiliodized salt becomes available.
• 226 million more children 12–59 months of age will receive deworm-ing medication.
• 34 million children 6–23 months of age will receive vitamins and min-erals through multiple micronutrient powders.
• 72 million children 6–23 months of age will receive micronutrient-fortified and/or -enhanced complementary foods that are fortifiedwith vitamins and minerals; 27 percent of these will receive 40g perday, and 73 percent will receive 80g per day.
• 14 million more children 6–59 months of age will be treated for severeacute malnutrition using community-based management practices.
Many researchers have found evidence of substantial benefits fromnutrition interventions (table 2.8). Bhutta et al. (2008) provide themost detailed and recent estimates. They estimate that of the 8 millionchild deaths occurring annually in the 36 countries (80 percent of thechild deaths globally), that one-quarter, or 2 million deaths, could beaverted by the package they propose. Their package includes elementsthat could not be costed at the present time (such as neonatal vitaminA in Asia, for which WHO technical guidance is still awaited, and arange of other interventions during pregnancy for which programmaticguidance is unclear) as well as health interventions such as malariatreatment, which is costed in health intervention packages. Their pack-age does not include community-based management of acute malnutri-tion, although facility-based treatment is included. We have assumedthat of the current 276,000 child deaths annually due to severe acutemalnutrition, half are prevented by the other interventions, 80 percentof the remaining children with severe acute malnutrition receive com-munity-based treatment, and the relative risk for treated children is0.45 (Bhutta et al. 2008), reducing deaths by 188,000. Nor does theirpackage include preventive complementary feeding interventions. Acomparison between the two is included in appendix B.
Bhutta et al. (2008) estimate about 57.5 million disability-adjustedlife-years could be saved by the end of three years of implementation of
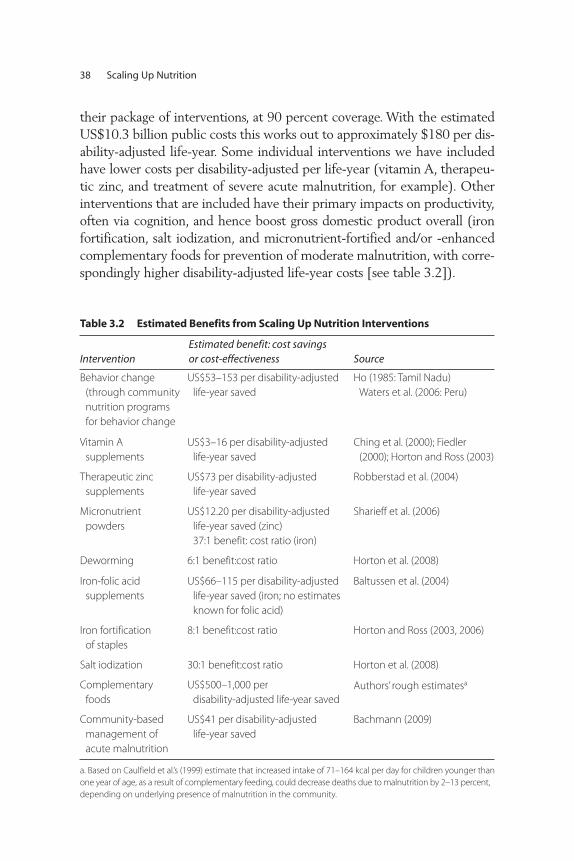
their package of interventions, at 90 percent coverage. With the estimatedUS$10.3 billion public costs this works out to approximately $180 per dis-ability-adjusted life-year. Some individual interventions we have includedhave lower costs per disability-adjusted per life-year (vitamin A, therapeu-tic zinc, and treatment of severe acute malnutrition, for example). Otherinterventions that are included have their primary impacts on productivity,often via cognition, and hence boost gross domestic product overall (ironfortification, salt iodization, and micronutrient-fortified and/or -enhancedcomplementary foods for prevention of moderate malnutrition, with corre-spondingly higher disability-adjusted life-year costs [see table 3.2]).
38 Scaling Up Nutrition
Table 3.2 Estimated Benefits from Scaling Up Nutrition Interventions
InterventionEstimated benefit: cost savings or cost-effectiveness Source
Behavior change
(through community
nutrition programs
for behavior change
US$53–153 per disability-adjusted
life-year saved
Ho (1985: Tamil Nadu)
Waters et al. (2006: Peru)
Vitamin A
supplements
US$3–16 per disability-adjusted
life-year saved
Ching et al. (2000); Fiedler
(2000); Horton and Ross (2003)
Therapeutic zinc
supplements
US$73 per disability-adjusted
life-year saved
Robberstad et al. (2004)
Micronutrient
powders
US$12.20 per disability-adjusted
life-year saved (zinc)
37:1 benefit: cost ratio (iron)
Sharieff et al. (2006)
Deworming 6:1 benefit:cost ratio Horton et al. (2008)
Iron-folic acid
supplements
US$66–115 per disability-adjusted
life-year saved (iron; no estimates
known for folic acid)
Baltussen et al. (2004)
Iron fortification
of staples
8:1 benefit:cost ratio Horton and Ross (2003, 2006)
Salt iodization 30:1 benefit:cost ratio Horton et al. (2008)
Complementary
foods
US$500–1,000 per
disability-adjusted life-year saved
Authors’ rough estimatesa
Community-based
management of
acute malnutrition
US$41 per disability-adjusted
life-year saved
Bachmann (2009)
a. Based on Caulfield et al.’s (1999) estimate that increased intake of 71–164 kcal per day for children younger than
one year of age, as a result of complementary feeding, could decrease deaths due to malnutrition by 2–13 percent,
depending on underlying presence of malnutrition in the community.
We do not attempt to make a comprehensive estimate of the ben-efits of nutrition interventions on IQ, productivity, or gross domesticproduct. However, salt iodization alone would be estimated to pro-vide US$2.4 billion in benefits (at a 30:1 benefit:cost ratio), and the iron fortification intervention would provide US$4.8 billion (at8:1). Based on the results of a longitudinal study in Guatemala(Hoddinott et al. 2008), we know that children who received fortifiedcomplementary food before they were three years of age grew up to have wages that were 46 percent higher than controls (for men).Thus, we expect productivity benefits from the substantial investmentproposed for fortified complementary food, particularly if accompa-nied by community-based programs to reduce relapse rates and pre-vent further malnutrition. Further work would be needed to estimatethe overall gross domestic product impact (allowing for overlapsbetween interventions). The effects of iron and iodine fortificationalone outweigh the cost proposed here to scale up all micronutrientand behavior change interventions (what we describe below as step 1of a scale-up process).
Bhutta et al. (2008) estimate that after 36 months of implementationthe intervention package would reduce stunting by 36 percent, althoughas much as half of this could be due to preventive zinc supplementationwhich we have not costed since there is no existing delivery mechanismfor this intervention, and since compliance is unknown. Isanaka et al.(2008) found that one intensive complementary feeding programreduced wasting by 36 percent. It seems plausible that the number ofunderweight children under five years of age might be reduced by betweenone-fifth and one-third with this package of interventions (this is theauthors’ estimate and not a scientifically estimated number). Further workon this is planned.
The estimated benefits (a one-fifth to one-third decrease in stuntingand a one-fifth decrease in mortality among children under five yearsof age) would assist substantially in achieving the MillenniumDevelopment Goals of halving the number of children underweight(Goal 1) and decreasing child mortality by two-thirds (Goal 4). Further,as in-country capacities are strengthened and detailed programmingguidance becomes available for the new interventions, these interven-tions can be added on. As this happens, and as further synergies arerealized with health systems strengthening and complementary invest-ments are made in social safety nets and food security programs, additionalbenefits will be realized.
What Will It Cost and What Are the Potential Benefits? 39
Uncertainties and Sensitivity Analyses
Estimation is an exercise of uncertainty. For our parameters, the uncer-tainty is greatest for the higher-cost interventions and least for the lower-cost ones. For example, there is plenty of information and experiencewith micronutrient and deworming interventions, which have the leastimpact on overall estimated costs and financing needs. Community nutri-tion programs vary in effectiveness (political commitment is important),and this variation has a larger potential impact on overall costs. Althoughcosts for community-based management of severe acute malnutrition arefairly well established in the field under close to ideal program deliveryconditions, these costs vary considerably in different contexts. The esti-mated number of children who would need to be treated is sensitive toassumptions about the number of cases of severe acute malnutrition thatcan be prevented by other interventions. Finally, the literature onenhanced complementary foods is least developed. The estimated costsper child used here allow only a small margin for distribution and deliv-ery costs. These costs could turn out to be much higher if, for example,the program used growth monitoring and attempted to target food onlyto selected children (rather than using a rough targeting measure, such asregional targeting, or relying on existing poverty targeting to distributefood coupons) or if there were widespread corruption and diversion ofthe food (table 3.3).
Financing Options
Our estimate of the total expenditure required for scaling up the 13 nutrition interventions in the 36 countries of interest is approximatelyUS$11.8 billion, excluding the cost of conditional cash transfers. Werethis amount to be financed out of the health budgets of the target groupof countries, the current health budget allocations of about US$54 billion(World Bank 2008b) would have to increase by nearly 18 percent. If thescale-up efforts were financed out of official development assistance(ODA), our estimated cost of nutrition interventions would call for a sub-stantial addition (17 percent) to the US$62 billion currently allocated tothe 36 countries (World Bank 2008b). To the extent that some countriesalready finance a portion of costs and may finance some additional costs,less may be required from external sources. We examine the potential foradditional funding from the four primary sources of finance for nutritioninterventions in most developing countries: government finances, privatehousehold resources, private sector corporations, and international financial
40 Scaling Up Nutrition
aid. Then we consider some strategies to close the gaps in funding likelyto remain.
Government FundsGovernment financing for nutrition programs and services is paramountbecause good nutrition is a fundamental precursor to secure the healthand development of our global and local communities. For those livingin poverty, governments perform a key regulatory role in ensuring accessto and quality of nutrition services and food. Government financing isalso crucial because good nutrition is a global public good as well as aprivate one. For example, handwashing messages help to inhibit the
What Will It Cost and What Are the Potential Benefits? 41
Table 3.3 Effects of Changing Five Assumptions about the Costs of Scaling Up Nutrition Interventions
Assumption changed Effect on costsEstimated probabilitya
Community nutrition costs
US$15 per child instead of
US$7.50 per child
Community nutrition costs US$5.8 billion,
not US$2.9 billion; overall package cost
increases from US$11.8 billion to
US$14.7 billion
Medium
Iron fortification of staples
costs twice as much
as expected
Fortification of staples costs US$1.1 billion,
not US$0.6 billion; overall package cost
increases from US$11.8 billion to
US$12.3 billion
Low
All micronutrient and
deworming unit costs are
twice as much as expected
Micronutrient plus deworming costs
US$3.2 billion, not US$1.6 billion; overall
package cost increases from
US$11.8 billion to US$13.4 billion
Low
Cost per child doubles for
enhanced complementary
food
Complementary feeding costs
US$7.2 billion, not US$3.6 billion; overall
package cost increases from
US$11.8 billion to US$15.4 billion
Medium-high
Complementary food costs
for the wealthiest 50 percent
are borne from private
resources
Complementary feeding costs decrease
from US$3.6 billion to US$2.7 billion
Medium-high
Other preventive
interventions reduce
prevalence of severe acute
malnutrition by 25 percent,
not 50 percent
Community-based management for severe
acute malnutrition costs US$4.2 billion,
not US$2.8 billion; overall package cost
increases from US$11.8 billion to
US$13.2 billion
Medium
Source: Authors’ calculations.
a. Estimated probabilities are the authors’ subjective view.
spread of disease, and deworming reduces the risk of infestation.Governments already invest substantial amounts in nutrition activities.As one example, the central and state governments in India allocatednearly US$1.3 billion in 2007–08 on nutrition programs and budgetedUS$1.7 billion in 2008–09, primarily via the Integrated ChildDevelopment Services Program (Reserve Bank of India 2009). Othercountries are making allocations as well, albeit not always for cost-effective and well-targeted programs.
If existing government expenditures could be realigned toward themost cost-effective interventions listed in this report, some of the financ-ing required to scale up nutrition interventions could come from effi-ciency gains from these reallocations. Even if it is not politically feasibleto conduct such a realignment, governments may sometimes make addi-tional finances available if a strong evidence-based argument can be made.For example, many developing-country governments have absorbed thecosts of potassium iodate for salt iodization. Many governments alreadyfund the distribution costs of deworming tablets, vitamin A supplements,and iron-folic acid supplements and may be willing to finance the pro-gram delivery costs for the proposed scale-up. Other governments haveincluded the costs for these supplies in their Medium-Term ExpenditureFrameworks. We must look to governments to seize these opportunitiesand take the necessary actions to ensure evidence-based investment ingood nutrition.
Private Household ResourcesAnother important source of domestic financing could be privateresources—households and corporations—in the target group of coun-tries. Some wealthier households may be able to pay out of pocket fornutrition interventions in the form of user fees for public services orexpenses for complementary foods, which account for a large proportionof the US$11.8 billion estimate. Demographic and Health Survey data forIndia, Bangladesh, and Ethiopia point to significant proportions of under-weight children even among households in the highest income quintiles,which presumably could afford to pay for complementary foods.
If we make the reasonable assumption that the wealthiest 50 percentwithin each country will pay for their requirements of complementary foodfor underweight children, US$0.9 billion (about a quarter) of the estimatedUS$3.6 billion cost of complementary foods can be directly raised fromhousehold resources. The additional US$0.6 billion for iron fortification ofstaple foods and for salt iodization may also be financed by wealthier
42 Scaling Up Nutrition
households, such that approximately US$1.5 billion of the proposedUS$11.8 billion can potentially come from private household resources.
Private CorporationsThere are examples of private firms absorbing part of the costs ofiodization, such as transportation and taxes (UNICEF 2008). If theseiodization costs are then passed on to the consumer via higher prices,as is the case in most countries, it is the households that bear the(small) extra burden. We can also envisage that some firms might bewilling to absorb part of the cost of behavioral change interventions.For example, a soap manufacturer might include public interest mes-sages regarding handwashing as part of its costs of doing business.However, these cost subsidies from private corporations are not includedin these estimates.
Further, as private sector corporations become more innovative in thefood sector, and as competition heats up in this sector, they have goodreason to invest in better and more nutritious products with greater salespotential. Private foundations such as the Bill and Melinda GatesFoundation and the Children’s Investment Fund are also emerging as avery significant source of new financing for nutrition.
International AidInformation on recent international aid flows related to nutrition is diffi-cult to obtain, although Morris et al. (2008) estimate aid related to “basic”nutrition of about US$0.3 billion per year in the first half of this decade(also see figures 4.2 and 4.3). Even this relatively low level is subject tothe risk of double-counting with government finances, since this aid issometimes used to support public sector nutrition programs. Aid fornutrition programs is, however, dwarfed by international emergency foodaid (including food for humanitarian purposes), which is typically inexcess of US$2 billion annually (figure 4.3). Food aid is often concen-trated in areas in need of urgent humanitarian assistance and is likely tobe driven by political considerations (Morris et al. 2008). It is unclearwhether some of the funds allocated under food aid could be reallocatedto support the resource requirements for the nutrition interventions dis-cussed above. An important line of unexplored work is to compare theeffectiveness of general food aid in improving nutrition to that of thenutritional interventions emphasized in this report.
Furthermore, as shown in figures 4.4 and 4.5, investments in “basicnutrition” from the five largest aid donors have remained small over the
What Will It Cost and What Are the Potential Benefits? 43
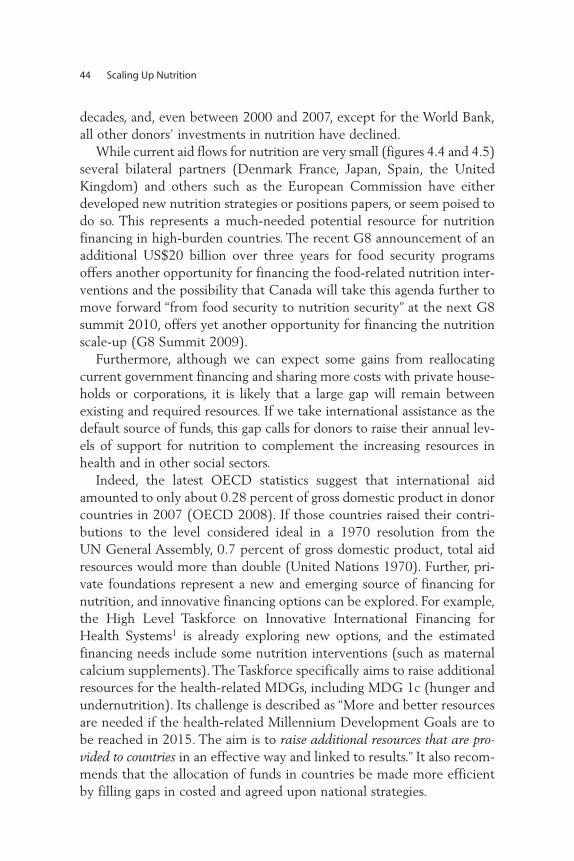
decades, and, even between 2000 and 2007, except for the World Bank,all other donors’ investments in nutrition have declined.
While current aid flows for nutrition are very small (figures 4.4 and 4.5)several bilateral partners (Denmark France, Japan, Spain, the UnitedKingdom) and others such as the European Commission have eitherdeveloped new nutrition strategies or positions papers, or seem poised todo so. This represents a much-needed potential resource for nutritionfinancing in high-burden countries. The recent G8 announcement of anadditional US$20 billion over three years for food security programsoffers another opportunity for financing the food-related nutrition inter-ventions and the possibility that Canada will take this agenda further tomove forward “from food security to nutrition security” at the next G8summit 2010, offers yet another opportunity for financing the nutritionscale-up (G8 Summit 2009).
Furthermore, although we can expect some gains from reallocatingcurrent government financing and sharing more costs with private house-holds or corporations, it is likely that a large gap will remain betweenexisting and required resources. If we take international assistance as thedefault source of funds, this gap calls for donors to raise their annual lev-els of support for nutrition to complement the increasing resources inhealth and in other social sectors.
Indeed, the latest OECD statistics suggest that international aidamounted to only about 0.28 percent of gross domestic product in donorcountries in 2007 (OECD 2008). If those countries raised their contri-butions to the level considered ideal in a 1970 resolution from the UN General Assembly, 0.7 percent of gross domestic product, total aidresources would more than double (United Nations 1970). Further, pri-vate foundations represent a new and emerging source of financing fornutrition, and innovative financing options can be explored. For example,the High Level Taskforce on Innovative International Financing forHealth Systems1 is already exploring new options, and the estimatedfinancing needs include some nutrition interventions (such as maternalcalcium supplements). The Taskforce specifically aims to raise additionalresources for the health-related MDGs, including MDG 1c (hunger andundernutrition). Its challenge is described as “More and better resourcesare needed if the health-related Millennium Development Goals are tobe reached in 2015. The aim is to raise additional resources that are pro-vided to countries in an effective way and linked to results.” It also recom-mends that the allocation of funds in countries be made more efficientby filling gaps in costed and agreed upon national strategies.
44 Scaling Up Nutrition
All of these sources represent new and potentially viable opportuni-ties for nutrition financing for countries with a high burden of under-nutrition. However, more work is needed to explore these financingoptions further. The challenge is to raise and provide these resources insuch a way that they complement rather than compete with invest-ments in health systems strengthening, food security, social safety nets,and HIV/AIDS programs. The challenge is also to make sure theseresources are consolidated and programmed such as to fill gaps in care-fully developed and articulated country strategies rather than as one-offinvestments.
Note
1. For more information refer to http://www.internationalhealthpartnership.net/en/taskforce.
What Will It Cost and What Are the Potential Benefits? 45

47
A Phased Approach for the Scale-Up
Seeking additional funds to increase nutrition interventions is especiallydifficult at a time of severe international economic recession. However,the cost of not intervening is much higher. The benefits from iron andiodine interventions alone are estimated at US$7.2 billion per year.Furthermore, of the total US$11.8 billion needed per year for a full scale-up, nearly US$4.4 billion is for micronutrient and deworming interven-tions and community-level behavior change interventions that can bescaled up fairly rapidly, either with existing capacities or with modestinvestments in capacity-building for community nutrition programs andchild health days.
The other two big-ticket items—complementary feeding interventionsand treatment for severe acute malnutrition—would benefit from furtherresearch and development before extensive scaling up. For complemen-tary feeding, more country pilots and studies of delivery strategies, capac-ities, and effectiveness are needed. The proposed new foods in South Asiahave not undergone efficacy trials, and questions remain about the dailyamounts required in countries with different nutritional profiles, as wellas cost-effective ways to deliver the intervention, build capacities, andinstitute needed effectiveness trials. It is clear that something needs to be
C H A P T E R 4
Phasing the Scale-Up
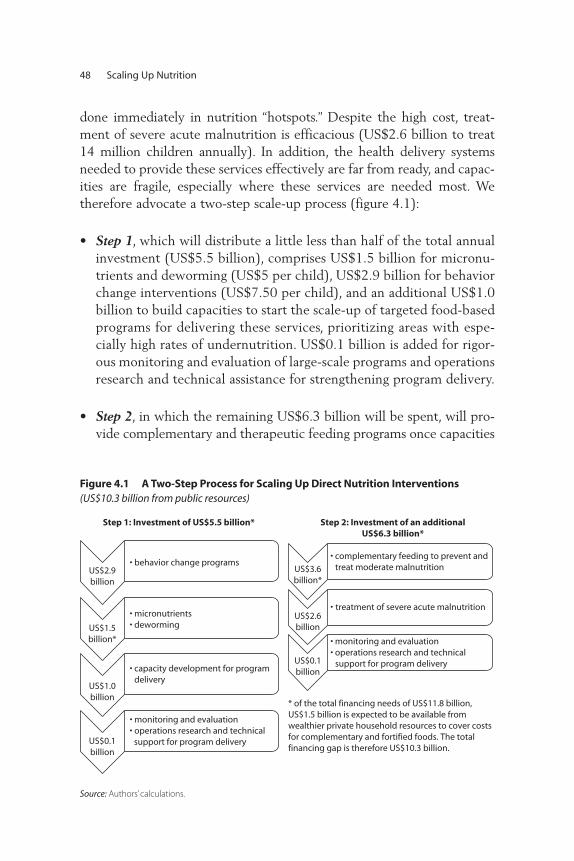
done immediately in nutrition “hotspots.” Despite the high cost, treat-ment of severe acute malnutrition is efficacious (US$2.6 billion to treat14 million children annually). In addition, the health delivery systemsneeded to provide these services effectively are far from ready, and capac-ities are fragile, especially where these services are needed most. Wetherefore advocate a two-step scale-up process (figure 4.1):
• Step 1, which will distribute a little less than half of the total annualinvestment (US$5.5 billion), comprises US$1.5 billion for micronu-trients and deworming (US$5 per child), US$2.9 billion for behaviorchange interventions (US$7.50 per child), and an additional US$1.0billion to build capacities to start the scale-up of targeted food-basedprograms for delivering these services, prioritizing areas with espe-cially high rates of undernutrition. US$0.1 billion is added for rigor-ous monitoring and evaluation of large-scale programs and operationsresearch and technical assistance for strengthening program delivery.
• Step 2, in which the remaining US$6.3 billion will be spent, will pro-vide complementary and therapeutic feeding programs once capacities
48 Scaling Up Nutrition
* of the total financing needs of US$11.8 billion,US$1.5 billion is expected to be available fromwealthier private household resources to cover costsfor complementary and fortified foods. The totalfinancing gap is therefore US$10.3 billion.
US$2.9billion
• behavior change programs
US$1.5billion*
• micronutrients• deworming
US$1.0billion
• capacity development for program delivery
US$0.1billion
• monitoring and evaluation• operations research and technical support for program delivery
Step 1: Investment of US$5.5 billion*
US$3.6billion*
• complementary feeding to prevent and treat moderate malnutrition
US$2.6billion
• treatment of severe acute malnutrition
US$0.1billion
• monitoring and evaluation• operations research and technical support for program delivery
Step 2: Investment of an additionalUS$6.3 billion*
Figure 4.1 A Two-Step Process for Scaling Up Direct Nutrition Interventions(US$10.3 billion from public resources)
Source: Authors’ calculations.
to deliver these interventions in resource-poor settings are built up inthe previous phase. The largest single cost item in this phase is for com-plementary food to prevent and treat moderate malnutrition amongchildren under two years of age (US$40–80 per child: US$3.6 billionper year). The most resource-intensive intervention per child treated(US$200 per episode per child: US$2.6 billion per year) is treatment ofsevere acute malnutrition. Prevention is preferable to treatment; how-ever the human and economic costs involved make addressing currentlevels of severe acute malnutrition imperative to save lives. As withstep 1, an additional US$0.1 billion will be needed for rigorous moni-toring and evaluation of large-scale programs and operations researchand technical assistance for strengthening program delivery.
This two-stage process is neither meant to be a straightjacket nor sug-gestive of a linear “one-size-fits-all” approach to scaling-up. Country situ-ations are diverse and they need to follow diverse paths. Those withstronger implementation capacities are likely to proceed to the secondstep faster than those where capacities and political will lag behind.However, in countries where program delivery capacities are constrained,an explicit investment in capacity development must be a prerequisite tothe proposed scale-up. This reiterates one of the key recommendationsfrom the High Level Taskforce on Innovative International Financing forHealth Systems to “strengthen the capacity of governments to secure bet-ter performance and investment from private, faith-based, community,NGO and other non-state actors in the health sector.” It also reiterates thecritical role of governance arrangements for maximizing the impact ofhealth spending and ensuring poor, vulnerable, and marginalized groupsbenefit most from increased resources. Strengthened leadership backedby stronger stewardship and management systems including financial andhuman resources management is vital in public organizations, and it takestime to build up. All of these issues will need to be addressed as part ofthe capacity development for scaling up nutrition investments to maxi-mize their development effectiveness.
South Asia accounts for more than half of the annual financing needs(US$5.90 billion), followed by Sub-Saharan Africa (US$2.78 billion),with the balance for East Asia and the Pacific (US$1.07 billion), MiddleEast and North Africa (US$0.56 billion), Latin America and the Caribbean(US$0.15 billion), and Europe and Central Asia (US$0.13 billion). Inaddition, US$50 million is required for technical assistance for ironfortification of staple foods and salt iodization, US$1.0 billion for
Phasing the Scale-Up 49
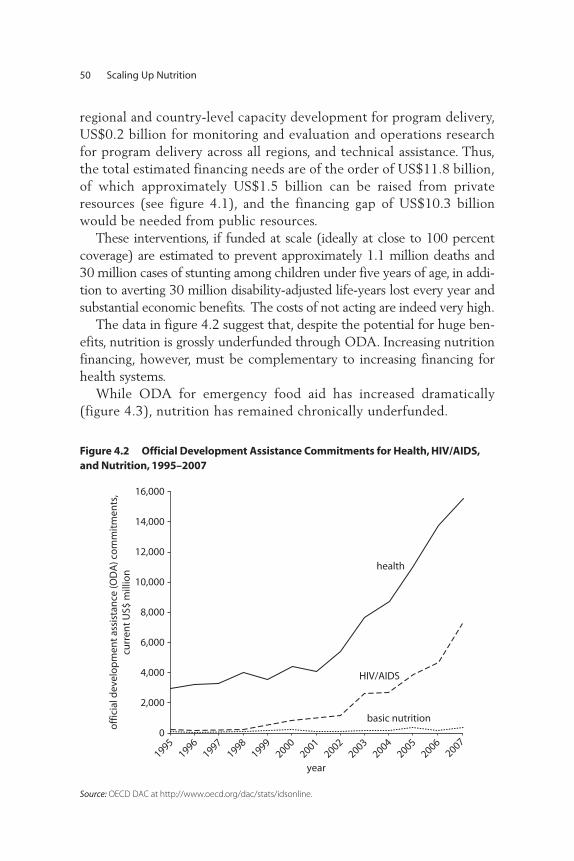
regional and country-level capacity development for program delivery,US$0.2 billion for monitoring and evaluation and operations researchfor program delivery across all regions, and technical assistance. Thus,the total estimated financing needs are of the order of US$11.8 billion,of which approximately US$1.5 billion can be raised from privateresources (see figure 4.1), and the financing gap of US$10.3 billionwould be needed from public resources.
These interventions, if funded at scale (ideally at close to 100 percentcoverage) are estimated to prevent approximately 1.1 million deaths and30 million cases of stunting among children under five years of age, in addi-tion to averting 30 million disability-adjusted life-years lost every year andsubstantial economic benefits. The costs of not acting are indeed very high.
The data in figure 4.2 suggest that, despite the potential for huge ben-efits, nutrition is grossly underfunded through ODA. Increasing nutritionfinancing, however, must be complementary to increasing financing forhealth systems.
While ODA for emergency food aid has increased dramatically(figure 4.3), nutrition has remained chronically underfunded.
50 Scaling Up Nutrition
0
2,000
4,000
6,000
8,000
10,000
12,000
14,000
16,000
19951996
19971998
19992000
20012002
20032004
20052006
2007
off
icia
l dev
elo
pm
ent
assi
stan
ce (O
DA
) co
mm
itm
ents
,cu
rren
t U
S$ m
illio
n
year
health
HIV/AIDS
basic nutrition
Figure 4.2 Official Development Assistance Commitments for Health, HIV/AIDS,and Nutrition, 1995–2007
Source: OECD DAC at http://www.oecd.org/dac/stats/idsonline.
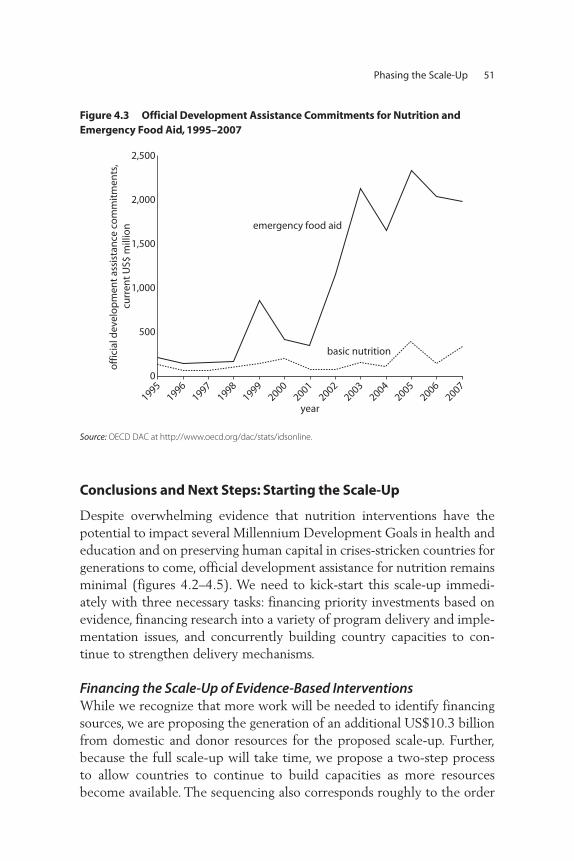
Conclusions and Next Steps: Starting the Scale-Up
Despite overwhelming evidence that nutrition interventions have thepotential to impact several Millennium Development Goals in health andeducation and on preserving human capital in crises-stricken countries forgenerations to come, official development assistance for nutrition remainsminimal (figures 4.2–4.5). We need to kick-start this scale-up immedi-ately with three necessary tasks: financing priority investments based onevidence, financing research into a variety of program delivery and imple-mentation issues, and concurrently building country capacities to con-tinue to strengthen delivery mechanisms.
Financing the Scale-Up of Evidence-Based Interventions While we recognize that more work will be needed to identify financingsources, we are proposing the generation of an additional US$10.3 billionfrom domestic and donor resources for the proposed scale-up. Further,because the full scale-up will take time, we propose a two-step processto allow countries to continue to build capacities as more resourcesbecome available. The sequencing also corresponds roughly to the order
Phasing the Scale-Up 51
basic nutrition
emergency food aid
0
500
1,000
1,500
2,000
2,500
off
icia
l dev
elo
pm
ent
assi
stan
ce c
om
mit
men
ts,
curr
ent
US$
mill
ion
19951996
19971998
19992000
20012002
20032004
20052006
2007
year
Figure 4.3 Official Development Assistance Commitments for Nutrition and Emergency Food Aid, 1995–2007
Source: OECD DAC at http://www.oecd.org/dac/stats/idsonline.
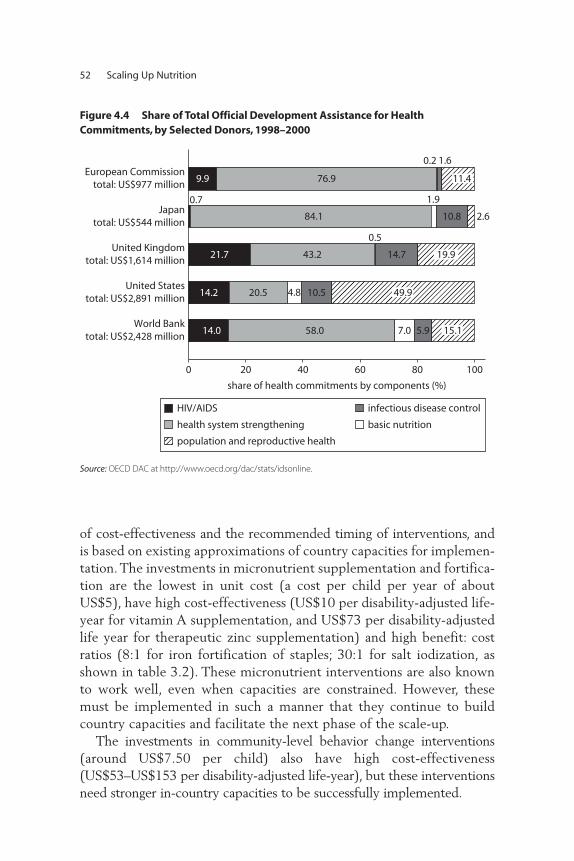
of cost-effectiveness and the recommended timing of interventions, andis based on existing approximations of country capacities for implemen-tation. The investments in micronutrient supplementation and fortifica-tion are the lowest in unit cost (a cost per child per year of aboutUS$5), have high cost-effectiveness (US$10 per disability-adjusted life-year for vitamin A supplementation, and US$73 per disability-adjustedlife year for therapeutic zinc supplementation) and high benefit: costratios (8:1 for iron fortification of staples; 30:1 for salt iodization, asshown in table 3.2). These micronutrient interventions are also knownto work well, even when capacities are constrained. However, thesemust be implemented in such a manner that they continue to buildcountry capacities and facilitate the next phase of the scale-up.
The investments in community-level behavior change interventions(around US$7.50 per child) also have high cost-effectiveness(US$53–US$153 per disability-adjusted life-year), but these interventionsneed stronger in-country capacities to be successfully implemented.
52 Scaling Up Nutrition
5.97.058.014.0
10.54.820.514.2
14.7
0.5
43.221.7
0.7
84.1
1.9
10.8
9.9
0.2
76.9
0 20 40 60 80 100
share of health commitments by components (%)
World Banktotal: US$2,428 million
United Statestotal: US$2,891 million
United Kingdomtotal: US$1,614 million
Japantotal: US$544 million
European Commissiontotal: US$977 million
11.4
1.6
2.6
19.9
15.1
49.9
HIV/AIDS
health system strengthening basic nutrition
infectious disease control
population and reproductive health
Figure 4.4 Share of Total Official Development Assistance for Health Commitments, by Selected Donors, 1998–2000
Source: OECD DAC at http://www.oecd.org/dac/stats/idsonline.
Complementary feeding for children 6–23 months of age is moreexpensive, between US$40 and US$80 per child per year. Complementaryfeeding programs have had only a modest effect on deaths. Caulfield et al.(1999) estimate 2–13 percent of child undernutrition deaths can beaverted by programs that increase intake of complementary foodsamong children 6–12 months of age by 71–164 kcal per day. We esti-mate that this would give costs per disability-adjusted life-year savedof US$500–US$1,000. However, complementary feeding has the poten-tial to have a strong impact on gross domestic product, which is notquantified here.
Furthermore, prevalence data from many countries show that under-nutrition rates are high even among wealthier households. In such cir-cumstances, some of the costs may be borne by families (especiallyamong the economically better-off populations), thereby reducing the
Phasing the Scale-Up 53
United Statestotal: US$13,249 million
United Kingdomtotal: US$4,552 million
Japantotal: US$867 million
global fundtotal: US$5,608 million
World Banktotal: US$2,675 million
European Commissiontotal: US$1,804 million
14.612.634.723.5
12.3
0.3
14.561.8
13.2
0.7
35.524.7
2.4
80.7
0.0
13.9
38.1
0.7
61.2
25.7
0.4
59.7
4.0
0 20 40 60 80 100
share of health commitments by components (%)
10.2
3.0
25.9
11.1
14.6
HIV/AIDS
health system strengthening basic nutrition
infectious disease control
population and reproductive health
Figure 4.5 Share of Total Official Development Assistance for Health Commitments, by Selected Donors, 2005–07
Source: OECD DAC at http://www.oecd.org/dac/stats/idsonline.
burden on public resources. Therefore, the total financing needs fromgovernments and donors may be somewhat less than the US$10.3 billionreflected here.
Finally, the most costly intervention per child is treatment of severeacute malnutrition, at US$200 per child treated, which has a cost perdeath averted of US$1,351, corresponding to around US$41 per disability-adjusted life-year saved (Bachmann 2009). The reason this intervention isthe last priority relates to weak national capacities and delivery systems,as well as the high cost and implementation difficulties of scaling it up. However, when the scale-up becomes tractable with enhanced capac-ities, this is a high-priority intervention to save lives.
Conditional cash transfers can provide additional demand-side supportto nutrition interventions, although we have little experience with thenutritional effects of such transfers outside Latin America. Conditionalcash transfers are not an alternative to nutrition interventions; rather theycan be complementary. Transfers set up to be social safety nets for thepoor, for example, can require the use of critical nutrition services,thereby increasing demand for them.
Directions for Further Operational ResearchWe know the most about what interventions to scale up, but we knowless about how to deliver these interventions at scale, how to build capac-ities in countries, and how to minimize costs through alternative deliverymechanisms. Continuing to building this evidence base is critical sincedelivery costs are often much higher than the costs of the interventions.Further, we know a lot more about the costs and impacts of the leastexpensive interventions while our uncertainty is greatest for the mostcostly interventions involving food and necessary capacities to deliverthese services effectively. We need stronger data on the unit costs and cov-erage of iron-folic acid supplementation for pregnant women, on thecosts of delivery of multiple micronutrient powders for children belowtwo years of age, and on the costs of delivery of deworming medicationfor the same target population of children. We need both costs and pro-grammatic guidance protocols for some interventions that the Lancetstudy (Bhutta et al. 2008) suggests are effective, including maternal cal-cium and food supplements, and zinc supplementation for children. Weknow a lot about the costs and potential benefits from food fortificationprograms, but have less data from real-life programs that link investmentswith measured health outcomes. Although we believe we have used rea-sonable, conservative estimates for these interventions, additional
54 Scaling Up Nutrition
research from programs would be very useful. Experts suggest allocatingtwo percent of program costs to research and evaluation. This suggestsabout US$100 million per year for research and evaluation in step 1 andan additional US$100 million per year in step 2, with a strong focus onresearch and evaluation on strategies to deliver known interventions,rather than on basic research.
Furthermore, research into new nutrient-dense complementary foodsis ongoing and may offer a breakthrough in improving nutrition in SouthAsia and Sub-Saharan Africa, since the approach used in Latin America(frequently milk-based) will not be feasible. Continued operational work,particularly in developing appropriate foods for South Asia, is urgentlyneeded. Research on community-based management of acute malnu-trition, particularly the development of appropriate therapeutic foods(or home-based food options) for South Asia using locally availablefoods, is also a priority, both from a political point of view and due tocost considerations.
There are areas we have not covered, where evidence or experienceis lacking. For example, food supplements for pregnant women arehighly debated, and there are no clear programming guidelines thatcould guide a scale-up; and yet, there are clearly countries where theprevalence of low birth weight and undernutrition in very young chil-dren indicates that maternal supplementation during pregnancy coupledwith other nonfood interventions may be important. Other interven-tions include bed nets to prevent malaria during pregnancy, treatment ofpregnant women with antibiotics for sexually transmitted diseases, andtreatment of pregnant women with antimicrobials or treatments forparasites. Similarly, we do not cost other potentially critical interven-tions, such as empowering women to make the right health-relateddecisions for their children or nutrition interventions for HIV-endemiccommunities. Nor do we include food security interventions throughthe agriculture sector, which may be critical in some regions, especiallySouth Asia and Africa. There are also potential entry points for nutri-tion through the education sector: for example, deworming and iron-folic acid supplementation for adolescents through schools. Theseissues, the potential delivery synergies with other sectors, and their costsneed to be addressed in future work.
Capacity DevelopmentFinally, and perhaps most importantly, the scaling up of nutrition financ-ing must be accompanied (or even preceded by) a scale-up of in-country
Phasing the Scale-Up 55

capacities and systems to design, deliver, manage, and evaluate large-scaleprograms. Building these capacities, in consonance with efforts tostrengthen health systems and health and nutrition metrics, will ensurethat countries are ready to take proven interventions to full scale effec-tively and efficiently as new resources become available. The time to actis now.
56 Scaling Up Nutrition
57
Peer Review of the Concept Note, September 2008Alan Berg (Brookings Institute, Wolfensohn Center) Peter Berman (World Bank)Laura Birx (USAID) Jana Krystene Brooks (World Bank)Ian Darnton-Hill (Renewed Efforts Against Childhood Hunger, or
REACH)Frances Davidson (USAID)Darren Dorkin (World Bank)Sundararajan Gopalan (World Bank) Pablo Gottret (World Bank)Sara Hommel (Brookings Institute) Ajay Mahal (Harvard School of Public Health/World Bank consultant)Nkosinathi Mbuya (World Bank) Christine McDonald (Harvard School of Public Health/World Bank
consultant)Meera Shekar (World Bank)Emily Wainwright (U.S. Agency for International Development)Mary Young (World Bank)
A P P E N D I X A
Meeting Participants
Meeting at the UNICEF Innocenti Research Center Regarding List of Interventions, September 2008Ian Darnton-Hill (Renewed Efforts Against Childhood Hunger,
or REACH) Juan Pablo Pena Rosas (WHO)Ellen Piwoz (Bill and Melinda Gates Foundation) Meera Shekar (World Bank)Emily Wainwright (USAID)
Peer Review of the Final Draft, May 2009Alemayehu Ambel (Independent Evaluation Group, World Bank)Maryanne Anderson (USAID Basics III) Jere Behrman (University of Pennsylvania) Alan Berg (Brookings Institute, Wolfensohn Center) Peter Berman (World Bank), Keith Bezanson (Global Alliance for Improved Nutrition consultant) Martin Bloem (World Health Organization)Francisco Branca (World Health Organization) Richard Bumgarner (World Bank consultant)Yoonyoung Cho (World Bank)Sadia Afroze Chowdhury (World Bank)Denise Coitinho (World Food Programme) Patricia Daniels (USAID, Africa Bureau, Office of Sustainable
Development)Stéphane Doyon (Médecins Sans Frontières) Catherine Feeney (World Food Programme)Laurent Gadot (Médecins Sans Frontières)Marcia Griffiths (Manoff Group)Vaibhav Gupta (World Bank)Paul Isenman (World Bank consultant)Kathleen Kurz (Academy for Educational Development)Asma Lateef (Bread for the World)Ruth Levine (Center for Global Development)Chessa Lutter (Pan-American Health Organization/World Health
Organization)Elodie Montetagaud (World Bank)Eric Munoz (Bread for the World)David Pelletier and students (Cornell University) Juan Pablo Pena-Rosas (World Health Organization)
58 Scaling Up Nutrition

Zahra Popatia (Global Alliance for Improved Nutrition consultant) Ellen Piwoz (Bill and Melinda Gates Foundation)Marie Ruel (International Food Policy Research Institute)Kavita Sethuraman (FANTA-2, Academy for Educational Development) A. Elizabeth Sommerfelt (Academy for Educational Development)
Costing Team MembersJana Krystene Brooks (World Bank) Sue Horton (Wilfrid Laurier University)Ajay Mahal (Harvard School of Public Health/World Bank consultant)Christine McDonald (Harvard School of Public Health/World Bank
consultant) Meera Shekar (World Bank)
Meeting Participants 59

61
The interventions costed in this paper represent a modified package ofthe interventions listed in the 2008 Lancet undernutrition series. Somenew interventions have been added based on emerging evidence since theseries was published, and others deferred for now, either because thereare no clear WHO protocols for the interventions or because data oncompliance and delivery mechanisms are unclear. In some cases it is notpossible to cost these interventions without exceeding the evidence, so noscaling-up costs can be estimated for now. In other cases, there are littleor no capacities for scaling up these interventions. As these are added on,additional benefits can be expected.
A P P E N D I X B
Rationale for Selected NutritionInterventions and Comparisonswith the 2008 LancetUndernutrition Series
Table B.1 Interventions Included/Excluded in This Costing Exercise
Interventions included in the current paper
Interventions listed in the Lancet nutritionseries as “sufficient evidence for implementation in all countries” Rationale for deviation from Lancet list (if any)
Behavior change interventionsBreastfeeding promotion Breastfeeding promotion No deviation
Promotion of appropriate and timely
complementary feeding (does not include
provision of complementary foods)
Behavior change communication for
improved complementary feeding
No deviation
Promotion of handwashing Promotion of handwashing/hygiene
interventions
No deviation
Micronutrients and deworming interventions
Vitamin A supplements Vitamin A supplementation or fortification Only vitamin A supplementation
Therapeutic zinc supplements for
management of diarrhea
Therapeutic zinc in management of diarrhea No deviation
Provision of micronutrient powders
(sachets or crushable tablets) to children
under two years of age
Not included Micronutrient powders added as an evidence-based
strategy to reduce anemia; international expert
meeting occurred after Lancet publication
Deworming Deworming included only under specific
situational contexts
No deviation
Iron-folic acid supplements for
pregnant women
Maternal iron-folate supplements; and
maternal multiple micronutrient (MMS)
supplements
Only iron-folate supplements are costed here for two
reasons. First, mothers will receive only one of the two
interventions, not both; second, there are no available
costs for MMS and delivery platforms for the two are
identical.
62
Iron fortification of staple foods Iron fortification recommended only in
specific situational contexts
Given the high prevalence of iron deficiency anemia
and low costs of iron fortification, a wider application
is justified.
Salt iodization Universal salt iodization No deviation
Iodized oil capsules Maternal iodine supplements No deviation
Complementary and therapeutic feeding interventionsPrevention or treatment for moderately
malnourished children 6–23 months of
age using complementary foods
Not included Added here based on recent research and
humanitarian imperative.
Treatment of severe acute malnutrition
using a community-based approach
Treatment of SAM Community management of treatment added on the
basis of new evidence from MSF.
63
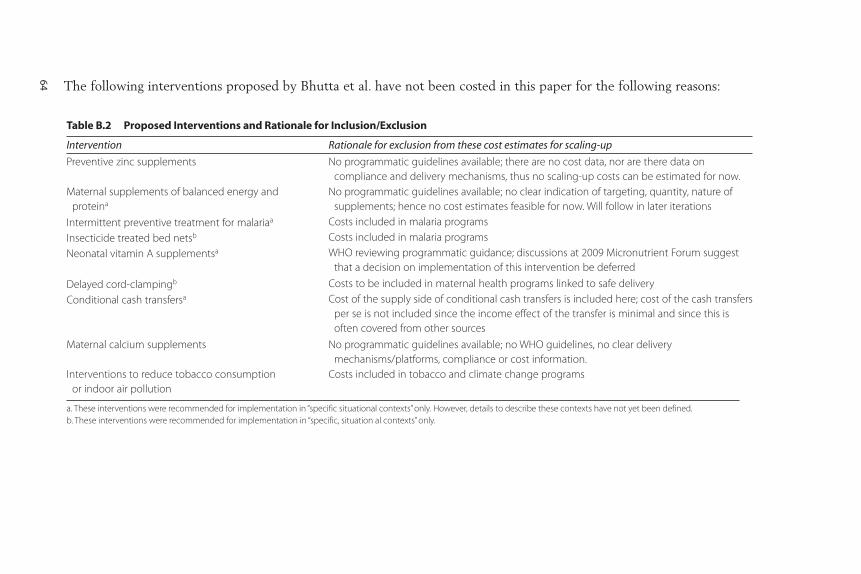
The following interventions proposed by Bhutta et al. have not been costed in this paper for the following reasons:
Table B.2 Proposed Interventions and Rationale for Inclusion/Exclusion
Intervention Rationale for exclusion from these cost estimates for scaling-up
Preventive zinc supplements No programmatic guidelines available; there are no cost data, nor are there data on
compliance and delivery mechanisms, thus no scaling-up costs can be estimated for now.
Maternal supplements of balanced energy and
proteina
No programmatic guidelines available; no clear indication of targeting, quantity, nature of
supplements; hence no cost estimates feasible for now. Will follow in later iterations
Intermittent preventive treatment for malariaa Costs included in malaria programs
Insecticide treated bed netsb Costs included in malaria programs
Neonatal vitamin A supplementsa WHO reviewing programmatic guidance; discussions at 2009 Micronutrient Forum suggest
that a decision on implementation of this intervention be deferred
Delayed cord-clampingb Costs to be included in maternal health programs linked to safe delivery
Conditional cash transfersa Cost of the supply side of conditional cash transfers is included here; cost of the cash transfers
per se is not included since the income effect of the transfer is minimal and since this is
often covered from other sources
Maternal calcium supplements No programmatic guidelines available; no WHO guidelines, no clear delivery
mechanisms/platforms, compliance or cost information.
Interventions to reduce tobacco consumption
or indoor air pollution
Costs included in tobacco and climate change programs
a. These interventions were recommended for implementation in “specific situational contexts” only. However, details to describe these contexts have not yet been defined.
b. These interventions were recommended for implementation in “specific, situation al contexts” only.
64
65
The target groups are
1. Pregnant women2. Mothers of infants under six months old3. Mothers of children under two years old4. Mothers of children under five years old5. Pregnant women in areas with a severe shortage of iodized salt6. Children 7–60 months old7. Children 0–24 months old with weight-for-age z score < –38. Children 0–24 months old with weight-for-age z score < –29. Children 0–24 months old with weight-for-height z score < –3
10. Children 0–24 months old with weight-for-height z score < –211. Children 25–60 months old with weight-for-age z score < –312. Children 25–60 months old with weight-for-age z score < –213. Children 25–60 months old with weight-for-height z score < –314. Children 25–60 months old with weight-for-height z score < –215. Entire population
A P P E N D I X C
Estimation of the TargetPopulations in the 36 Countrieswith the Highest Burden of Undernutrition
66 Scaling Up Nutrition
The methods used for estimating the size of each of these populationsand the associated data sources are discussed below.
Pregnant Women
We considered two main categories within this population: (a) pregnantwomen with live births and (b) women who end up with miscarriages orstillbirths.
Since we are interested in interventions that promote infant and childhealth, we excluded cases of induced abortion even though these can bea significant category in countries such as Ukraine for contraception orsuch as India for gender selection. For this same reason, we omitted spon-taneous abortions since most occur early in pregnancy.
The “size” of the target population can potentially take at least threedifferent meanings:
a. The total number of new pregnant women in any given year (incidence)b. The number of pregnant women observed at any given point during the
year (point prevalence) c. The total number of pregnant women months (whether new or old)
observed during a given year (another measure of prevalence)
For simplification, we used the assumption of stable populations andsteady states to estimate the target population, although that assumptionis not necessarily realistic. If the errors are not particularly large (sug-gested by some of our calculations), the methodology under the stablepopulation assumption is very simple.
Suppose b births (including stillbirths) take place on average duringeach month. In a steady state, it must be that exactly as many births aretaking place (exits) as new pregnancies are occurring (entrants). Thus,during any given year there must be 12b new pregnancies. This is the inci-dence measure.
If we assume that each pregnancy (still or live) lasts exactly ninemonths, there must be 9b pregnant women observed during each month.Any pregnant woman with a time period of greater than nine monthssince first becoming pregnant would already have given birth. Now thatb women are getting pregnant every month, the total number of womenwith nine months or less since the date of first becoming pregnant mustbe 9 times b. This is the point prevalence estimate.
Finally, how many pregnant women (new or pregnant from a previousyear) would be observed during a given year? This includes 12b new
Estimation of the Target Populations in the 36 Countries 67
pregnancies from this year plus any pregnancies carried over from the pre-ceding year as on December 31 (say). The latter number must be 9b.Thus, we observe a total of 21b pregnant women during any given year.Because the time for which we observe these women varies, it is useful toget a measure of the person-months of pregnancy that we observe.Calculating this is straightforward in steady state. Given that during eachmonth we observe exactly 9b pregnant women, there are a total of 108bperson months of pregnant women.
Data from the United Nations Population Statistics Division indicatesthe number of live births separately for rural and urban areas; and theWHO estimates of the number of stillborn children (United Nations2008; WHO 2006a). We assume that the ratio of stillborn children to livebirths is the same in both rural and urban areas (we could modify thisassumption, but the results do not change by much). Adding stillborn andlive births and dividing this total by 12 yields an estimate of b, separatelyfor rural and urban populations.
Mothers of Young Children
We can break up our indicators of the target population into an inci-dence measure, a point prevalence measure, and a person-month measure.We assume that each mother with a child age two years or younger hasexactly one child in that age category and no more. For simplicity, wedid not calculate the case of mothers with more than one child age twoyears or younger.
Starting from the number of live births (which we assumed to be insteady state), we assessed the number of a given birth cohort that is alivemonth by month during the first year. We constructed our child “monthly”life table using information on the neonatal mortality rate (NMR) and theinfant mortality rate (IMR) (WHO 2006a; World Bank 2008b). The NMRdetermines the likelihood of surviving beyond the first month. The“monthly” mortality risk is assumed to be constant from the second monthto the 12th month, at a rate determined by a residual mortality parameter,itself obtained by comparing information from the IMR and the NMR. Insteady state, the total number of children alive in any given month can bedirectly calculated by adding up the number of children of each age (fromnewborn to six months old) alive during any given month.
Using directly available UN data on the size of the populations aged0–24 months, we estimated the number of children in the 0–6 month agegroup, as well those in the 7–24 month age group. Finally, UN data on therural-urban breakup of the population under two years old was used to
68 Scaling Up Nutrition
estimate separately the number of children in each category for rural andurban areas.
The exercise outlined above yields the point prevalence estimate ofthe number of children age 0–6 months (X) and 7–24 months (Y) alivein any given month during a year. Multiplying either X or (X + Y) by 12equals the total number of person-months of mothers of children age 0–6months and 7–24 months in any given year.
It is important to note that the number derived in the preceding para-graph is different from the total (cumulative) number of mothers whohad a child that was alive and in the age group 0–6 or 7–24 months atsome point during the year. For instance, the number of mothers of chil-dren age 0–6 months who were alive at some point during the year is thenumber of children age 0–6 months on the first day of the year (X), plusnew births during the year: that is, X + 12b. Notice that the incidencemeasure is simply the number of new children during the year (or 12b).
For mothers of children age 7–24 months, the corresponding measureis (X + Y) + 6b. This is obtained by adding Y (the number of children age7–24 months at the beginning of the year) to 6b (the number of newbornchildren growing up to be at least seven months old in the year – that is,those born within the first six months) and children born in the last sixmonths of the preceding year and who are alive at the beginning of theyear. This gives X + Y + 6b.
Finally, the number of new children (our incidence measure) in the7–24 month age group during the year is X + 6b (the number of childrenborn during the first six months of the year, and who, therefore, attain anage of six months or more by the end of the year, plus the number of chil-dren born during the last six months of the preceding year and thereforefall into the 7–24 month age group during the year).
The number of children age less than five years old at any point in time(point prevalence) is published UN data. Call this W. The number of newchildren added to this group is 12b in any given year (the incidence meas-ure). The cumulative or total number of mothers observed in this cate-gory during the period of a year is W + 12b. Finally, it can be easilychecked that the number of person-months of mothers of children age0–60 months in any given year is 12W.
Pregnant Women in Areas with a Severe Shortage of Iodized Salt
The World Development Indicators database provides estimates of theproportion of households that do not consume iodized salt by country.
However, this does not highlight shortages in iodized salt use in severelyaffected areas.
If we make the (not entirely unrealistic) assumption that pregnantwomen are uniformly distributed over all households, this is also the pro-portion of women without access to iodized salt. Without further informa-tion on “areas with severe shortage of iodized salt” this proportion, whenmultiplied by the total number of pregnant women, can be taken to ourestimate of this target population.
An alternative approach would be to designate a cutoff value of theproportion of households, so as to designate specific countries as having asevere shortage (or not). We do not pursue this option.
Children 7–60 Months of Age
As before, we can break up our indicators of the target population into anincidence measure, a point prevalence measure and a person-monthmeasure. The point prevalence measure is simply the number of childrenin the 7–60 month group alive in any month. This is estimated from UNdata (that gives the number of children aged 0–60 months) after subtract-ing from it our estimates of the children in the 0–6 month age group, sep-arately for rural and urban areas (this was derived in section III). Let uscall this number Z.
To estimate the (cumulative) number of children aged 7–60 monthsalive at any stage during the year, we have to add X + 6b to Z. This is thenumber of children born in the six months preceding the year and aliveat the beginning of this year, plus the number born in the first six monthsof the year. Thus, we have in total Z + X + 6b as our cumulative preva-lence measure. The number of children-person-months in the 7–60month age group during the year is 12Z.
Note that the number of children newly added to this group, the inci-dence measure is X + 6b.
Malnourished Children 0–60 Months of Age
We calculate the number of children in two age groups (0–24 months and25–60 months) who have any of these markers of undernutrition:(a) weight-for-age z score < –3, (b) weight-for-age z score < –2,(c) weight-for-height z score < –3, and (d) weight-for-height z score < –2.
In general, these populations are not difficult to calculate.However, Demographic and Health Survey (DHS) data (accessed at
Estimation of the Target Populations in the 36 Countries 69
http://www.measuredhs.com) can be used to construct numbers for chil-dren only in the 0–6 months, 7–12 months, 13–24 months, and 0–60months age groups (for about 19 countries based on DHS surveys in thepast five years; and an additional five countries if we include DHS surveysup to 1999–2000). In its State of the World’s Children (UNICEF 2009) theUnited Nations Children’s Fund provides numbers for age categories0–60 months for all of the missing countries for the children with weight-for-age z scores < –2). It also provides weight-for-height nutritional statusof children in the 0–60 month age group for weight-for-height z scores< –2. Although UNICEF does not provide the data sources used for thispurpose on its Web site, we assume the numbers for at least the 24 coun-tries (with relatively recent DHS data) are from DHS surveys. Thisassumption is confirmed for the 24 countries, where the UNICEF esti-mates for stunting and wasting in the 0–60 month age group match one-for-one with DHS data.
For the age breakdown on child nutritional status as shown above, esti-mates of children in the age groups 0–6, 7–12, and 13–24 months, whichwere derived using the procedure of previous sections, were used toweight DHS estimates of nutritional status for children with z scores< –3, and < –2, respectively, both for weight-for-height and weight-for-age. With these data, age-weighted nutritional status indexes for the 0–24month age group were constructed separately for weight-for-height andweight-for-age. This exercise was undertaken for the 24 countries forwhich we had “acceptable” (relatively recent) DHS data.
DHS data on weight-for-height and weight-for-age for the 24 countriesin question for the 0–60 month age group, along with information on thenutritional status of the 0–24 month age group and the respective sizesof population in the 0–24 month age group and the 25–60 month agegroup, were used to calculate the nutritional status of children in the25–60 month age group. As an illustration, let W be the nutritional statis-tic of interest. Let p060 be the size of the population in the 0–60 monthage group, p024 be the size of the population in the 0–24 month age group,and p2560 be the size of the population in the 25–60 month age group. Letw060 be the nutritional indicator (as the percentage of the populationfalling below a certain threshold) for the 0–60 month age group, and w024be the indicator for the 0–24 month age group. Then, our procedure (forthe 24 countries for which DHS data were readily available) was
WW p W p
p2560060 060 024 024
2560
=−
70 Scaling Up Nutrition
Estimation of the Target Populations in the 36 Countries 71
Here W2560 is the corresponding nutritional indicator for the 25–60month age group.
Our next step was to generate estimates for the full set of 36 countries,including those for which recent DHS data were not available. For the24 countries for which we had DHS data on both moderate and severemalnutrition, we estimated logistic relationships between children ratedas severely malnourished by weight-for-height (weight-for-age) criterionin the 0–24 month age group and children rated as moderately malnour-ished by the weight-for-height (weight-for-age) criterion in the 0–60month age group, using additional dummy variables for Sub-SaharanAfrica and South Asia. We also estimated logistic relationships betweenchildren rated as severely malnourished by weight-for-height (weight-for-age) criterion in the 25–60 month age group and children rated as mod-erately malnourished by the weight-for-height (weight-for-age) criterionin the 0–60 month age group, using additional dummy variables for Sub-Saharan Africa and South Asia. We did so as well for moderately malnour-ished children in the 0–24 month and 25–60 month age groups. The fitwas excellent in all cases, with the coefficient of determination rangingfrom 0.78 to 0.95.
Because UNICEF provides numbers on moderately malnourishedchildren in the 0–60 month age group for the full set of 36 countries, weused the estimated coefficients from the logistic regression and UNICEFnumbers on moderate malnourishment in the 0–60 month age group to“predict” severe and moderate malnourishment in the missing group of12 countries. This yielded the extent of severe and moderate malnour-ishment (whether weight-for-age or weight-for-height) in the 0–24month and 25–60 month age group for all 36 countries.
Entire Population
This information is directly available from the UN Population StatisticsDivision.

73
The approach to treatment of severe acute malnutrition has changed inthe past five years, and there is ongoing research regarding moderate mal-nutrition. Since no authoritative survey of the costing literature was avail-able, the following is a short survey undertaken for the purpose of thiscosting exercise, including treatment of severe acute malnutrition andtreatment or prevention of moderate malnutrition. Finally we outline thecosting strategy utilized for this exercise.
Treatment of Severe Acute Malnutrition
The 2007 World Health Organization guidelines greatly increased thesuccess rates for treatment of severe acute malnutrition. A metaanaly-sis by Ahmed et al. (2007) compared nine studies and found whentreatment followed WHO guidelines the relative risk was 0.52 asopposed to conventional treatment. Only two of the nine studiesfound no improvement.
For children with severe acute malnutrition who have additional med-ical complications, treatment in hospital facilities is required, typically forup to two weeks. Death rates can be relatively high since these children
A P P E N D I X D
Program Costs for Complementaryand Therapeutic FeedingInterventions
have reached the most severe levels of the condition. Increased risk ofinfection due to overcrowded hospital conditions puts these children atfurther risk. Bachmann (2009) cites mortality rates of 37 percent for hos-pitals in Lusaka, Zambia, although the rates are likely to vary accordingto context.
The key innovation in treatment has been the development of community-based management of acute malnutrition. This has been madepossible by the development of ready-to-use therapeutic foods. The best-known variant is Plumpy’Nut, developed by Nutriset (France), whichhas been widely used throughout Africa. This is a nutrient-dense, micronutrient-fortified food that can be stored in sachets for up to twoyears (depending on packaging) and, unlike milk-based F100 (which wasthe previous “gold standard”), is resistant to contamination and thereforecan be used in the home. BP-100 compressed biscuits are an alternative, butthe technology makes compressed biscuits more difficult than the ready-to-use therapeutic foods to produce and package in developing countries.
Families prefer to treat children at home under supervision from thehealth care system (typically from primary health care), since alternatives(daycare feeding centers and residential centers) impose considerablecosts on the family because they require a caregiver to accompany therecovering child to the center. Because dropout rates from community-based treatment programs are lower, higher coverage rates can beachieved. The number of children who can be treated increases since thecapacity constraints in the community are much less binding than in thetreatment centers. Ahmed et al. (2007) point out that the majority ofexisting studies have been for Africa, often in an emergency or chronicfood deficit situation; the application in South Asian contexts require fur-ther research.
Bachmann (2009) estimates that the cost-effectiveness of community-based management of acute malnutrition in Zambia is US$1,351 per lifesaved (US$41 per disability-adjusted life-year), as compared with thealternative of no treatment.
Calculating the costs of community-based management of acute mal-nutrition poses several difficulties. First, successful cases have receivedexternal assistance (Ashworth (2006) provides a very useful review).Thus, experience to date includes costs of supervision from headquarterswhich might not be necessary in future operations. Second, the costs ofcases with external assistance are skewed because the imported foodsare often much more expensive than what locally produced equivalentswould be. Ashworth (2006) finds, for example, that imported ready-to-use
74 Scaling Up Nutrition
therapeutic food for a project in Malawi cost US$55 per child treated,as compared with US$22 for food produced domestically (Nutriset haslicensed production in about four African countries). Finally, costs varybetween the initiation phase of a new program (where training isrequired) and that of a more mature program. Some estimates includethe cost for the initial two-week stabilization phase in hospital for chil-dren with complicated cases, and some may not.
A more serious problem is that ideally to develop cost estimates we needboth prevalence and incidence data for severe acute malnutrition, whereaspublished data (for example in UNICEF’s State of the World’s Children) arefor prevalence only. Conceptually, the total costs should include costs fortreating all children with severe acute malnutrition at the outset of theintervention (costs are for approximately two months of treatment), pluscosts for retreating recurrent cases and new cases. The relationship betweenprevalence and incidence is likely to vary according to whether the situa-tion is a newly developing emergency, a chronic condition, or an emergencythat is stabilizing. The relationship is also likely to change if there are com-plementary and effective programs for treating moderately malnourishedchildren (or for complementary feeding for young children).
The rule of thumb currently used in the field in Africa is to double theprevalence numbers when ordering supplies on an annual basis (TanyaKhara, UNICEF; Stéphane Doyon, Médecins Sans Frontières, personalcommunications). A study of two African countries (Garenne et al.,forthcoming) found that prevalence data had to be increased by 60 per-cent to estimate incidence, noting variations depending upon whetherweight-for-height or mid-upper arm circumference was used and whichanthropometric standard was chosen (Hamill et al. 1997; WHO 2006b;Kuczmarski et al. 2000).
The UNICEF (2009) data on the prevalence of undernutrition doesnot include cases with edema, which will increase resource needs. We alsoneed to consider likely coverage. No existing program has exceeded80 percent coverage, and many fall substantially below this level.
Further research is needed, particularly in adapting the community-based model to South Asia. Ensuring large-scale availability of an accept-able ready-to-use therapeutic food requires further work. In Bangladesh,preparations utilizing pulses, such as khichri and halwa, have been usedin trials. These cost less than half of what it would cost to use F100(Ahmed, International Centre for Diarrhoeal Disease Research,Bangladesh, personal communication). However, these preparations arenot ready to use. In existing programs, households are taught to prepare
Program Costs for Complementary and Therapeutic Feeding Interventions 75
foods with their own resources rather than receiving donated food. Asimilar approach is used in India. See Ashworth (2006) for a survey ofthe efficacy and effectiveness of different approaches.
In one district in Sri Lanka in 2007, a large pilot was initially targetedat populations affected by conflict. The pilot used BP-100 (compressedbiscuits) to feed the severe acute malnourished in the community, super-vised by the routine primary health care system and implemented bycommunity outreach workers and volunteers (Emergency NutritionNetwork 2008). Sri Lanka used weight-for-height as the nutrition indica-tor, rather than mid-upper arm circumference as in Africa, which mayresult in differences in the proportion of the target population treated.
In India, although work is being done on ready-to-use food for preven-tion and treatment of moderate malnutrition, it is not intended to be usedfor treatment of severe acute malnutrition.
Treatment and Prevention of Moderate Malnutrition
There is more consensus on the treatment of severe acute malnutritionthan moderate malnutrition. To quote the report from a recent WHO/UNICEF/WFP/UNHCR consultation (Shoham and Duffield 2008):
“In contrast to severe malnutrition, programmes for the managementof MM [moderate malnutrition] in children have remained virtuallyunchanged for the past 30 years—although it seems likely that this formof malnutrition is associated with a larger proportion of nutrition-relateddeaths than severe malnutrition.”
Moderate malnutrition is particularly high for children age 6–23months, when growth is very rapid. This is the key window for interven-tion: after stunted children are two or three years old, there is minimalopportunity for catch-up growth, and the functional losses are very diffi-cult to reverse. Therefore, much of the current research focuses on spe-cialized complementary foods designed to be added to the diet inrelatively small quantities to improve its nutrient composition. Optionsfor complementary foods range from micronutrients only to supplementswith significant amounts of energy (de Pee and Bloem (2008) providehelpful categorization and nutrient content information).
Prevention and treatment of moderate malnutrition typically requirescounseling to change behavior, with or without the provision of addi-tional food, micronutrients, or both. The consensus has been that well-designed education and behavior modification programs, costing aroundUS$10 per participant, can be successful (Mason et al. 1999). Recent
76 Scaling Up Nutrition
studies of effective educational programs in Africa include Aldermanet al. (2009), Alderman (2007), and Galasso and Umapathi (2007).Programs involving food are more expensive, however. In environmentswhere food supply is a serious constraint, programs involving only coun-seling and behavior change will be less effective. In the context of emer-gencies in Africa and Sub-Sahelian countries with chronic food deficits, itseems likely that provision of food is necessary and needs to be includedin program costs. Likewise in South Asia either food or resources mayneed to be provided to the poorest households.
Dewey and Adu-Afarwuah (2008) conclude from a lengthy review ofthe literature on complementary feeding that providing complementaryfood has positive effects on growth in some countries (Ghana andMalawi), but not others (Brazil, Indonesia, and South Africa, all of whichare higher-income countries than Ghana and Malawi). They reviewedtwo studies (Bangladesh and India) where the intervention included aneducation group, an education plus food group, and a control. In bothstudies, growth outcomes were best for the group receiving food pluseducation and intermediate for the group receiving only education.
There are studies comparing the provision of fortified lipid-basedspreads and the provision of micronutrients; micronutrients alone are lesscostly than fortified spreads (Dewey et al. (forthcoming) provide a com-prehensive review). Micronutrients have significant effects on micronutri-ent status, morbidity and mortality, but no significant effect on growth (inthe absence of other supplements). In two studies in Africa (Adu-Afarwuah et al. 2007; Kuusipalo et al. 2006) micronutrients alone had nosignificant effect on growth, whereas micronutrients plus a small amountof fortified spread had a significant effect on growth. By comparison, inMexico, where energy intake is less of a constraint, there was no differencein the effect on growth by adding food (a milk-based food), and micronu-trients alone had a similar effect on micronutrient status (Neufeld,Micronutrient Initiative, personal communication).
Given these advances in scientific knowledge, there is ongoingresearch to identify appropriate complementary foods that are locallyacceptable and cost-effective. Advances in nutritional research haveshown that the traditional aid-provided foods (variants of corn-soyblend) are not optimally designed. Various agencies are reviewing theircomposition, typically for older children and adults (see recommenda-tions in Shoham and Duffield 2008; de Pee and Bloem 2008). Lipid-based complementary foods (often containing either milk or soy) showmuch promise.
Program Costs for Complementary and Therapeutic Feeding Interventions 77
Médecins Sans Frontières (MSF) has, for example, used therapeuticfoods in Niger (Plumpy’Nut, originally developed for treatment of severeacute malnutrition) for moderately malnourished children 6–60 monthsof age as a preventive intervention. That application obtained high curerates and wiped out seasonal emergence of severe malnutrition(Defourny et al. 2007; Isanaka et al. 2009). In the study by Isanaka et al.,half of the dose appropriate for a child with severe acute malnutritionwas used as a preventive measure to supplement the participating child’snormal diet.
Since ready-to-use therapeutic food was not intended for preventiveuse, Nutriset has subsequently developed an alternative supplementintended for prevention, namely Plumpy’doz. Plumpy’doz is intended tobe an adjunct to the diet; the daily ration provides about a quarter of theamount of energy of Plumpy’Nut, but with the full daily requirement ofmicronutrients. Field trials suggest that this intervention can be effective(UNICEF is currently using this product in Somalia), but efficacy and cost-effectiveness studies need to be completed. MSF’s estimates, based on fieldexperience, are that the annualized cost per child is US$50–70 includingdistribution. For programs focused in the “hungry season” in Sub-SaharanAfrica, which provide 250 kcal per child per day, the food cost was aboutUS$0.17 per day (Laurent Gadot, MSF, personal communication).
Other lipid-based nutrient supplements are being investigated (forexample, a large trial by University of California–Davis, led by KayDewey, in Burkina Faso, Ghana, and Malawi), which have the possibilityof providing the appropriate energy density of the overall diet for youngchildren, as well as improving micronutrient content. The issue is how tobalance using locally available foods (to make programs as sustainable aspossible) with adding in enough micronutrients and energy-rich foods(milk powder, peanuts, soy, or legumes, for example) to achieve an appro-priately energy and micronutrient-rich diet for children age 6–23 monthsof age. The daily cost of the lipid-based nutrient supplement, such asNutributter (15–20g, supplying around 100 kcal per day), was US$0.07,excluding transport and distribution (Dewey et al. forthcoming), andgiven declines in the U.S. dollar is now closer to US$0.10 per day (Dewey,personal communication).
In China, sachets have been developed to sprinkle onto the child’sporridge, which contain both micronutrients and foods designed toincrease the energy density of the diet. One variant of “Ying Yang Bao”contains 10g soy powder and provides 40 kcal of energy; another variantcontains 200 Kcal, and in addition to micronutrients and soy powder also
78 Scaling Up Nutrition
Program Costs for Complementary and Therapeutic Feeding Interventions 79
contains yellow bean powder. The former variant was tested in random-ized controlled trials in Gansu province for children less than two yearsof age, and the latter was used (not in such trials) to benefit earthquake-affected children in Sichuan province. The Gansu project showed sig -nificant improvements in anemia, length-for-age, weight-for-age, anddevelopment/IQ scores, compared with children receiving energy but nomicronutrients and those children receiving no intervention at all (Chen,International Life Sciences Institute, personal communication). Thesachets currently cost about US$0.14, and it is hoped that the cost canbe reduced to about US$0.10 (Chen, International Life SciencesInstitute, personal communication).
In India, the World Food Programme is helping develop a nutrient-dense complementary food that contains chickpeas, milk powder, soybeanoil, soy flour, rice flour, sugar, vitamins, and minerals, known as Indiaready-to-use-food. It would be provided at 50g per day (260 kcal) and for-tified with micronutrients similar to Plumpy’doz. It has not yet completedfield trials. The cost is expected to be around US$0.13 per day per child.
Another alternative is the provision of micronutrients in the form ofsachets or crushable tablets to improve the diet of young children. This isa lower-cost option than providing both food and micronutrients. Optionsinclude Sprinkles or MixMe (sachets) and Foodlets and Nutritabs (crush-able tablets). Yearly doses of 60 sachets of Sprinkles are recommended forchildren under two years of age (typically consumed over a two-to four-month period), and field trials show that this treatment can improve chil-dren’s micronutrient status, particularly iron and zinc, as evidenced byreduced diarrhea (Zlotkin et al. 2005). Few program data include distri-bution costs: recent cost estimates of the powders alone are US$0.03 perpackage, or US$1.80 per year, but typically the full program costs wouldbe at least double the cost of the sachets.
Costing Strategy
To calculate costs of treatment for severe acute malnutrition we take themedian unit cost figure from seven African programs (US$201 per case)and assume this covers locally produced ready-to-use therapeutic foodand the cost of hospitalization for the small proportion of cases thatrequire it (table D.1). The cost per country per year is therefore US$201times the prevalence of severe malnutrition times two. This formulaassumes that prevalence is twice incidence (this may be generous andhence also allows for cases of kwashiorkor). We assume that this is the last
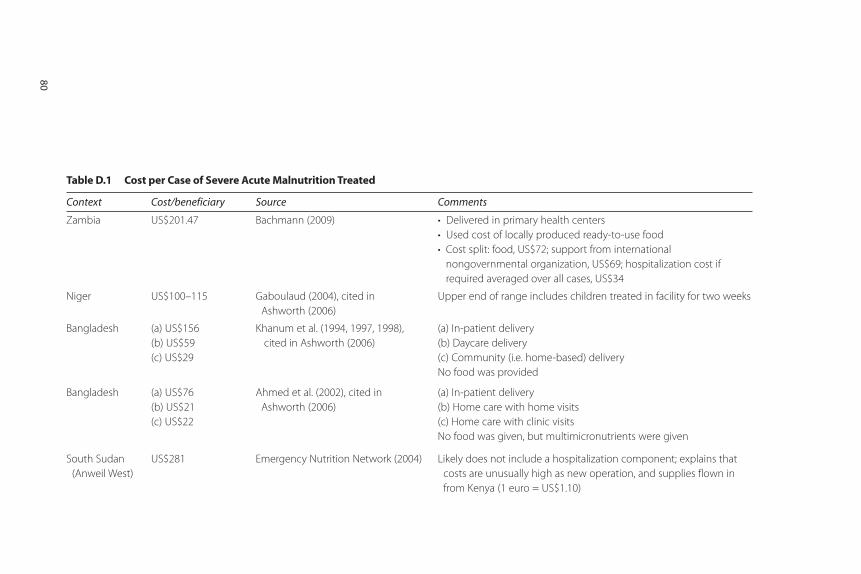
Table D.1 Cost per Case of Severe Acute Malnutrition Treated
Context Cost/beneficiary Source Comments
Zambia US$201.47 Bachmann (2009) • Delivered in primary health centers
• Used cost of locally produced ready-to-use food
• Cost split: food, US$72; support from international
nongovernmental organization, US$69; hospitalization cost if
required averaged over all cases, US$34
Niger US$100–115 Gaboulaud (2004), cited in
Ashworth (2006)
Upper end of range includes children treated in facility for two weeks
Bangladesh (a) US$156
(b) US$59
(c) US$29
Khanum et al. (1994, 1997, 1998),
cited in Ashworth (2006)
(a) In-patient delivery
(b) Daycare delivery
(c) Community (i.e. home-based) delivery
No food was provided
Bangladesh (a) US$76
(b) US$21
(c) US$22
Ahmed et al. (2002), cited in
Ashworth (2006)
(a) In-patient delivery
(b) Home care with home visits
(c) Home care with clinic visits
No food was given, but multimicronutrients were given
South Sudan
(Anweil West)
US$281 Emergency Nutrition Network (2004) Likely does not include a hospitalization component; explains that
costs are unusually high as new operation, and supplies flown in
from Kenya (1 euro = US$1.10)
80
Malawi (Dowa) US$283 Emergency Nutrition Network (2004) Likely does not include a hospitalization component; explains costs
high as the administering international nongovernmental
organization was new to country (1 euro = US$1.10)
Ethiopia US$331 Emergency Nutrition Network (2004) Likely excludes hospitalization component: well established program
(1 euro = US$1.10)
Niger US$110 Gadot, Médecins Sans Frontières,
personal communication
Includes hospitalization for 15 percent of children; also allows
12 percent for coordination, support, and investment
(1 euro = US$1.36)
Malawi (Nsanje) US$228 (< US$200 if
locally produced
food were used)
Concern (2007) Food not locally produced (food cost was US$92 per child); includes
stabilization center plus community-based management of acute
malnutrition
Source: Survey by authors.
81
intervention to be implemented and that the rate of severe acute malnu-trition falls to 50 percent of current levels as a result of the other interven-tions. There are still some questions about the feasibility of this strategy inSouth Asia: no locally available ready-to-use therapeutic food has yet beenused at scale (treatment of severe acute malnutrition in the communityuses home-prepared foods) and further operational research is required.
We assume that community-based management of acute malnutri-tion is implemented only in regions of countries where global acutemalnutrition rates exceed 5 percent (using World Health Organization,2000, where global acute malnutrition rates of 10 percent, or 5 percentwith “aggravating factors” are considered an impetus for action). Inother environments, the prevalence is likely too low to maintain effec-tive supervision. This implies that Egypt, Guatemala, Peru, SouthAfrica, and Turkey would only implement community-based manage-ment of acute malnutrition in selected regions, if at all. In those envi-ronments, we assume that treatment is facility based. We assume thatalthough the cost per child is higher in facilities, this is offset by lowercoverage rates, and hence lower impacts.
Costing out a strategy for preventing and treating moderate malnutri-tion is even more difficult. Efficacy and effectiveness trials are very prom-ising, but there have been no pilot programs costed out with the recentdevelopments in enhanced complementary foods (for example., lipid-based nutrient supplements). Unfortunately, prevention and treatment ofmoderate malnutrition is likely to be one of the bigger-ticket items in scal-ing up nutrition, so the overall cost is sensitive to the assumptions made.Further work on moderate malnutrition is urgently required to guide pro-gramming. Issues include
• How far can interventions targeted to children with moderate malnutri-tion reduce the probability that they progress to severe acute malnutri-tion (this can both help to save lives and also be cost-effective)?
• What are the estimated outcomes of enhanced complementary feed-ing, in terms of child growth, in programs as compared with more lim-ited efficacy and effectiveness trials?
• What is the most appropriate enhanced complementary food for differ-ent regions, and what is its cost and cost-effectiveness? In which environ-ments is provision of micronutrients and behavior change sufficient, andin which environments is a food-based approach required?
82 Scaling Up Nutrition
• What is the appropriate daily amount of energy required in comple-mentary food to affect weight-for-age and height-for-age status, andhow does this differ in different resource settings?
• What is the required duration of intervention (how many months?)
• Within countries, how can we determine how many households require government assistance (subsidy, coupon, targeted donation)to obtain the fortified complementary food, and which householdshave the resources to purchase this nutritionally superior product ifit is widely available?
We do not have complete answers to these questions. Nevertheless, webelieve that an emerging consensus suggests some priorities for costingpurposes, to mobilize appropriate resources for this intervention.Ongoing research will provide answers to questions regarding programdesign as resources become available. Those priorities follow:
• For now, we assume that 13 countries from the 36, where globalacute malnutrition exceeds 10 percent, are priorities for the higherlevel of daily complementary food intervention (40–50 g per day,amounting to approximately 250 kcal: data on global acute malnutri-tion for children under five from UNICEF, 2009). These includeBangladesh, Burkina Faso, the Democratic Republic of Congo,Ethiopia, India, Malawi, Mali, Nepal, Niger, Pakistan, Somalia, Sudan,and the Republic of Yemen. Within these countries, further subna-tional targeting would be necessary to identify the most vulnerableregions. WHO and UNICEF guidelines indicate that rates of globalacute malnutrition in excess of 10 percent put nutrition-relatedemergencies into the “serious” category, the criterion for implementa-tion of selective feeding programs (WHO, 2000). In the other coun-tries, the lower level of energy would be appropriate.
• We assume that micronutrient-fortified and/or-enhanced comple-mentary foods will be available in all countries commercially, suchthat all households can benefit. However, we assume that selectedhouseholds receive the enhanced complementary foods at much reduced cost (or no cost) through a system of coupons or the like. Another possibility would be blanket distribution in selected regions.At this point our focus is the costing rather than the distribution anddelivery mechanism (which is an area for further research).
Program Costs for Complementary and Therapeutic Feeding Interventions 83
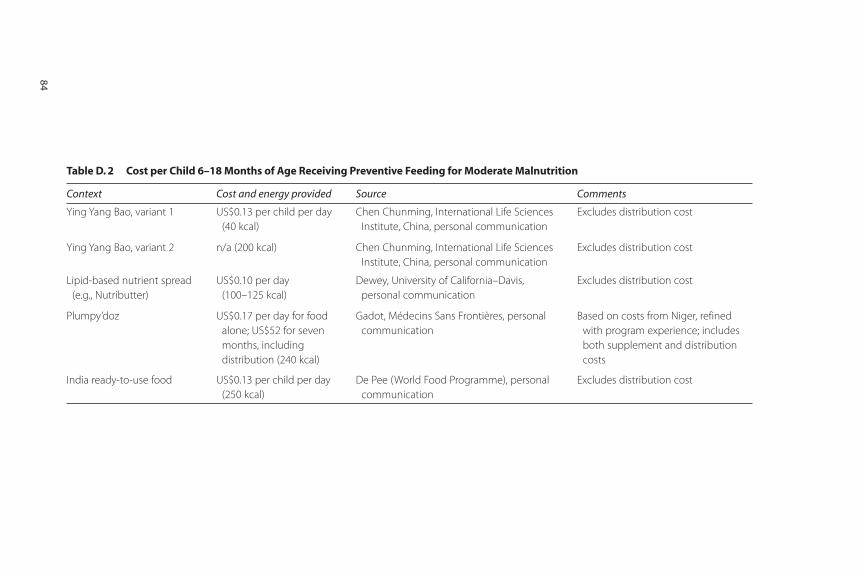
Table D. 2 Cost per Child 6–18 Months of Age Receiving Preventive Feeding for Moderate Malnutrition
Context Cost and energy provided Source Comments
Ying Yang Bao, variant 1 US$0.13 per child per day
(40 kcal)
Chen Chunming, International Life Sciences
Institute, China, personal communication
Excludes distribution cost
Ying Yang Bao, variant 2 n/a (200 kcal) Chen Chunming, International Life Sciences
Institute, China, personal communication
Excludes distribution cost
Lipid-based nutrient spread
(e.g., Nutributter)
US$0.10 per day
(100–125 kcal)
Dewey, University of California–Davis,
personal communication
Excludes distribution cost
Plumpy’doz US$0.17 per day for food
alone; US$52 for seven
months, including
distribution (240 kcal)
Gadot, Médecins Sans Frontières, personal
communication
Based on costs from Niger, refined
with program experience; includes
both supplement and distribution
costs
India ready-to-use food US$0.13 per child per day
(250 kcal)
De Pee (World Food Programme), personal
communication
Excludes distribution cost
84
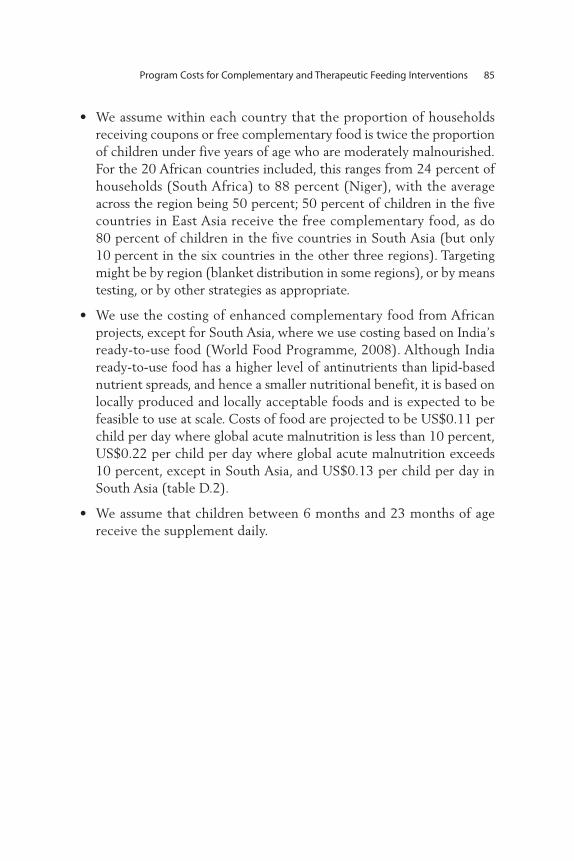
Program Costs for Complementary and Therapeutic Feeding Interventions 85
• We assume within each country that the proportion of households receiving coupons or free complementary food is twice the proportionof children under five years of age who are moderately malnourished.For the 20 African countries included, this ranges from 24 percent ofhouseholds (South Africa) to 88 percent (Niger), with the averageacross the region being 50 percent; 50 percent of children in the fivecountries in East Asia receive the free complementary food, as do80 percent of children in the five countries in South Asia (but only10 percent in the six countries in the other three regions). Targetingmight be by region (blanket distribution in some regions), or by meanstesting, or by other strategies as appropriate.
• We use the costing of enhanced complementary food from Africanprojects, except for South Asia, where we use costing based on India’sready-to-use food (World Food Programme, 2008). Although Indiaready-to-use food has a higher level of antinutrients than lipid-basednutrient spreads, and hence a smaller nutritional benefit, it is based onlocally produced and locally acceptable foods and is expected to befeasible to use at scale. Costs of food are projected to be US$0.11 perchild per day where global acute malnutrition is less than 10 percent,US$0.22 per child per day where global acute malnutrition exceeds10 percent, except in South Asia, and US$0.13 per child per day inSouth Asia (table D.2).
• We assume that children between 6 months and 23 months of agereceive the supplement daily.

87
Adu-Afarwuah, S., A. Lartey, K. H. Brown, S. Zlotkin, A. Briend, and K. G. Dewey.2007. “Randomized Comparison of Three Types of Micronutrient Supplementsfor Home Fortification of Complementary Food in Ghana: Effects on Growthand Motor Development.” American Journal of Clinical Nutrition 86: 412–20.
Ahmed, T., A. M. S. Ahmed, M. Mahfuz, K. Abdullah, A. Cravioto, and D. Sack.June 2007. “Systematic Review of Management of Childhood SevereMalnutrition.” International Centre for Diarrhoeal Disease Research, Dhaka,Bangladesh.
Alderman, H. 2007. “Improving Nutrition through Community GrowthPromotion: Longitudinal Study of the Nutrition and Early Child DevelopmentProgram in Uganda.” World Development 35 (8): 1376–89.
Alderman, H., et al. 2009. “Effectiveness of a Community-Based Intervention toImprove Nutrition in Young Children in Senegal: A Difference-in-DifferenceAnalysis.” Public Health Nutrition 12 (5): 667–73.
Ashworth, A. 2006. “Efficacy and Effectiveness of Community-Based Treatmentof Severe Malnutrition (WHO, UNICEF, and SCN Informal Consultation onCommunity-Based Management of Severe Malnutrition in Children).” Foodand Nutrition Bulletin 27 (3): S24–S48.
Bachmann, M. June 2009. “Cost Effectiveness of Community Therapeutic Carefor Children with Severe Acute Malnutrition in Lusaka, Zambia.” Cost-Effectiveness and Resource Allocation 7 (2). [doi 10.1186/1278-7547-7-2].
References
Baffes, J., D. Mitchell, E. M. Riordan, S. Streifel, H. Timmer, and W. Shaw. 2009.Global Economic Prospects: Commodities at the Crossroads. Washington, DC:World Bank.
Baltussen, R., C. Knai, and M. Sharan. 2004. “Iron Fortification and IronSupplementation Are Cost-Effective Interventions to Reduce IronDeficiency in Four Subregions of the World.” Journal of Nutrition 134:2678–84.
Bassett, L. 2008. “Can Conditional Cash Transfer Programs Play a Greater Role in Reduced Child Nutrition?” World Bank Social Protection Discussion Paper0835, World Bank, Washington, DC.
Bhutta, Z. A., et al., for the Maternal and Child Undernutrition Study Group.2008. “What Works? Interventions for Maternal and Child Undernutritionand Survival.” Lancet 371: 417–40.
Black, R. E., et al., for the Maternal and Child Undernutrition Study Group. 2008.“Maternal and Child Undernutrition: Global and Regional Exposures andHealth Consequences.” Lancet 371: 243–60.
Bryce J., R. E. Black, N. Walker, Z. A. Bhutta, J. E. Lawn, and R. W. Steketee. 2005.“Can the World Afford to Save the Lives of 6 Million Children Each Year?”Lancet 365: 2193–200.
Caulfield, L. E., A. L. Huffman, and W. G. Piwoz. 1999. “Interventions toImprove Intake of Complementary Food by Infants 6 to 12 Months of Agein Developing Countries: Impact on Growth and on the Prevalence ofMalnutrition and Potential Contribution to Child Survival.” Food andNutrition Bulletin 20: 183–200.
Ching, P., M. Birmingham, T. Goodman, R. Sutter, and B. Loevinsohn. 2000.“Childhood Mortality Impact and Costs of Integrating Vitamin A Supple -mentation into Immunization Campaigns.” American Journal of Public Health90 (10): 1526–29.
Concern Worldwide, 2007. Community-based Therapeutic Care (CTC): TheRationale for Scale-up in Malawi. Dublin: Concern Worldwide.
De Pee, S., and M. Bloem. 2008. “Current and Potential Role of SpeciallyFormulated Foods and Food Supplements for Preventing Malnutrition among6–23 Months Old and Treating Moderate Malnutrition Among 6–59 MonthsOld Children.” Draft for Technical Consultative Meeting on ModerateMalnutrition, September 30–October 3, Geneva.
Defourney, I., G. Seroux, I. Abdelkader, and G. Harczi. September 2007.“Management of Moderate Acute Malnutrition with RUTF in Niger.” FieldExchange 31: 3–5. http://www.ennonline.net/fex/31/fex31.pdf.
Dewey, K. G., and S. Adu-Afarwuah. 2008. “Systematic Review of the Efficacyand Effectiveness of Complementary Feeding Interventions in DevelopingCountries.” Maternal and Child Nutrition 4: 24–85.
88 References
Dewey, K. G., Z. Yang, and E. Boy. Forthcoming. “Systematic Review and Meta-analysis of Home Fortification of Complementary Foods.” Maternal and ChildNutrition.
Emergency Nutrition Network (ENN). November 2004. Community-BasedTherapeutic Care (CTC). ENN Special Supplement 2. http:// www.ennonline.net/fex/23/supplement23.pdf.
———. April 2008. International Workshop on the Integration of Community-BasedManagement of Acute Malnutrition. Workshop report, Washington, DC.
Fiedler, J. L. 2000. “The Nepal National Vitamin A Program: Prototype to Emulateor Donor Enclave?” Health Policy and Planning 15 (2): 145–56.
Fiedler, J. L., and T. Chuko. 2008a. “The Cost of Child Health Days: A Case Studyof the Ethiopian EOS program.” Health Policy and Planning 23: 222–33.
Fiedler, J. L., T. G. Sanghvi, and M. K. Saunders. 2008b. “A Review of theMicronutrient Intervention Cost Literature: Program Design and PolicyLessons.” International Journal of Health Planning and Management 23:373–97.
G8 Summit. 2009. “‘L’Aquila’: Joint Statement on Global Food Security.”http://www.g8italia2009.it/static/G8_Allegato/LAquila_Joint_Statement_on_Global_Food_Security%5b1%5d,0.pdf
Galasso, E., and N. Umapathi. 2007. “Improving Nutritional Status through BehavioralChange: Lessons from Madagascar.” Draft. World Bank, Washington, DC.http://econ.worldbank.org/external/default/main?pagePK=64165259&t h e S i t e P K = 4 6 9 3 7 2 & p i P K = 6 4 1 6 5 4 2 1 & m e n u P K = 6 4 1 6 6 0 9 3 &entityID=000158349_20071212132020.
Garenne, M., et al. 2009. “Incidence and Duration of Severe Wasting in TwoAfrican Populations.” Public Health Nutrition. Mar (2): 1–9.
Hall, A., S. Horton, and N. de Silva. 2009. “The Costs and Cost-Effectiveness ofMass Treatment for Intestinal Nematode Worm Infections Using DifferentTreatment Thresholds.” Public Library of Science Neglected Diseases 3 (3): e402.doi:10.1371/ journal.pntd.0000402.
Hamill, P. V., T. A. Drizd, and C. L. Johnson. 1997. “NCHS Growth Curves forChildren Birth–18 Years.” United States Vital Health Statistics 11 (165).
Ho, T. J. 1985. “Economic Issues in Assessing Nutrition Projects: Costs,Affordability and Cost-Effectiveness.” PHN Technical Note 84-14, WorldBank, Washington, DC.
Hoddinott, J., J. A. Maluccio, J. R. Behrman, R. Flores, and R. Martorell. 2008.“Effect of a Nutrition Intervention During Early Childhood on EconomicProductivity in Guatemalan Adults.” Lancet 371: 411–16.
Horton, S. 1999. “Opportunities for Investments in Nutrition in Low-IncomeAsia.” Asian Development Review 17: 246–73.
References 89
———. 1992. “Unit Costs, Cost-Effectiveness, and Financing of NutritionInterventions.” Human Development Network, Health, Nutrition, andPopulation Working Paper WPS 952, World Bank, Washington, DC.
Horton, S., H. Alderman, and J. Rivera. 2008. “Copenhagen Consensus 2008Challenge Paper: Hunger and Malnutrition.” http://www.copenhagenconsensus.com.
Horton, S., V. Mannar, and A. Wesley. Forthcoming. “Best Practices Paper:Fortification with Iron and Iodine: Copenhagen Consensus.” http://www.copenhagenconsensus.com.
Horton, S., and J. Ross. 2003. “The Economics of Iron Deficiency.” Food Policy28 (1): 51–75. See also Horton, S., and J. Ross. 2006. “Corrigendum.” FoodPolicy 32: 141–43.
Isanaka, S., et al. 2009. “Effect of Preventive Supplementation with Ready-to-Use-Therapeutic Food on the Nutritional Status, Mortality, and Morbidity ofChildren Aged 6 to 60 Months in Niger.” Journal of the American MedicalAssociation 301: 277–85.
Jones, G., R. W. Steketee, R. E. Black, Z. A. Bhutta, and S. S. Morris, for the BellagioChild Survival Study Group. 2003. “How Many Child Deaths Can WePrevent This Year?” Lancet 362: 65–71.
Kuczmarski, R. J., C. L. Ogden, and L. M. Grummer-Strawn. 2000. “CDC GrowthCharts: United States.” Advance data from vital and health statistics; No. 314.National Center for Health Statistics, Hyattsville, MD. http://www.cdc.gov/growthcharts.
Kuusipalo, H., K. Mlaeta, A. Briend, M. Manary, and P. Ashorn. 2006. “Growth andChange in Blood Haemoglobin Concentration among Underweight MalawianInfants Receiving Fortified Spreads for 12 Weeks: A Preliminary Trial.” Journalof Pediatric Gastroenterology and Nutrition 43: 525–32.
Leroy, J. L., J. P. Habicht, G. Pelto, and S. M. Bertozzi. 2007. “Current Priorities inHealth Research Funding and Lack of Impact on the Number of Child Deathsper Year.” American Journal of Public Health 97: 219–23; Erratum AmericanJournal of Public Health 97: 590.
Mason, J. B., J. Hunt, D. Parker, and U. Jonsson. 1999. “Investing in Child Nutritionin Asia.” Asian Development Review 17 (1, 2): 1–32.
Mason, J. B., S. Sanders, P. Musgrove, Soekirman, and R. Galloway. 2006.“Community Health and Nutrition Programs.” In Disease Control Priorities inDeveloping Countries (2nd Edition), ed. Dean T. Jamison, et al., 1053–74. NewYork: Oxford University Press.
Micronutrient Initiative. 2006. India Micronutrient Initiative Investment Plan,2006. Ottawa: Micronutrient Initiative.
———. 2007. Annual Report to CIDA. Ottawa: Micronutrient Initiative.
90 References
Morris, S., B. Cogill, and R. Uauy. 2008. “Effective International Action againstUndernutrition: Why Has It Proven So Difficult and What Can Be Done toAccelerate Progress?” Lancet 371: 608–21.
Mulligan, J. A., J. A. Fox-Rushby, T. Adam, B. Johns, and A. Mills. 2005. “Unit Costsof Health Care Inputs in Low and Middle Income Regions.” DCPP WorkingPaper 9. http://www.dcp2.org/file/24/wp9.pdf.
Neidecker-Gonzales, O., H. Bouis, and P. Nestel. 2007. “Estimating the GlobalCosts of Vitamin A Capsule Distribution: A Review of the Literature andDevelopment of a Country-Level Model.” Food and Nutrition Bulletin 28:307–16.
Organisation for Economic Co-operation and Development, DevelopmentAssistance Committee (OECD DAC). http://www.oecd.org/dac/stats/idsonline.
———. 2008. Press Release. April 4. http://www.oecd.org/document/8/0,3343,en_2649_34447_40381960_1_1_1_1,00.html.
Renewed Efforts Against Childhood Hunger (REACH). August 2008. “High-LevelCost Estimates for REACH-promoted Interventions.” Draft.
Reserve Bank of India. 2009. “Revenue Expenditures of States and Union Territorieswith Legislature.” Reserve Bank of India, Mumbai, India. http:// www.rbi.org.in.
Robberstad, B., T. Strand, R. E. Black, and H. Sommerfelt. 2004. “Cost-Effectivenessof Zinc as Adjunct Therapy for Acute Childhood Diarrhea in DevelopingCountries.” Bulletin of the World Health Organization 82 (7): 523–31.
Sharieff, W., S. Horton, and S. Zlotkin. 2006. “Economic Gains of a HomeFortification Program: Evaluation of ‘Sprinkles’ from a Provider’s Perspective.”Canadian Journal of Public Health 97(1): 20–23.
Shekar, M., et al. 2008. “Delivery Sciences in Nutrition.” Lancet 371: 1751.
Shoham, J., and A. Duffield. December 2008. Proceedings of the WHO-UNICEF-WFP-UNHCR Informal Consultation on the Management of ModerateMalnutrition in Under-5 Children. Draft.
United Nations. 1970. International Development Strategies for the Second UnitedNations Development Decade, UN General Assembly Resolution. A/REF/2626(XXV). http://www.un.org/Depts/dhl/resguide/gares.htm.
———. 2008. Demographic Yearbook 2006. Population Statistics Division. NewYork: United Nations.
———. 2009. “Landscape Analysis on Countries’ Readiness to Accelerate Actionin Nutrition.” Standing Committee on Nutrition (SCN) News, No. 37.http://www.unscn.org/files/Publications/scn_news/scnnews37.pdf.
United Nations Children’s Fund (UNICEF). 2008. “Sustainable Eliminationof Iodine Deficiency New York: UNICEF, Nutrition Section. http://www.unicef.org/media/files/IDD.pdf.
References 91
———. 2009. State of the World’s Children. New York: United Nations. http://www.unicef.org/sowc.
Waters, H. R., et al. 2006. “The Cost-Effectiveness of a Child Nutrition EducationProgram in Peru.” Health Policy and Planning 21 (4): 257–64.
World Bank. 2006. Repositioning Nutrition as Central to Development: A Strategyfor Large-Scale Action. Washington, DC: World Bank.
———. 2007. Country Reports on HNP and Poverty: Socio-Economic Differences inHealth, Nutrition, and Population. Washington, DC: World Bank.
———. 2008a. “G20: Global Financial Crisis: Responding Today, SecuringTomorrow.” Background Paper prepared by the World Bank Group for G20Summit on Financial Markets and the World Economy, Washington, DC:World Bank.
———. 2008b. World Development Indicators 2008. Washington, DC: World Bank.
World Food Programme (WFP). 2008. “Ten Minutes to Learn About . . . Ready-to-Use Foods (RUFs) and WFP’s Approach to Treating and PreventingMalnutrition.” Sight and Life Magazine 3 (S): 32–37.
World Health Organization (WHO). 2000. The Management of Nutrition in MajorEmergencies. Geneva: WHO.
———. 2005. “Methodology and Assumptions Used to Estimate the Cost ofScaling Up Selected Child Health Interventions.” Technical working docu-ment, Department of Child and Adolescent Health and Development andDepartment of Health System Financing, WHO, Geneva.
———. 2006a. Neonatal and Perinatal Mortality: Country, Regional and GlobalEstimates. Geneva: WHO. http://www.who.int/making_pregnancy_safer/publications/neonatal.pdf.
———. 2006b. WHO Child Growth Standards: Length/Height-for-Age, Weight-for-Age, Weight-for-Length, Weight-for-Height and Body Mass Index-for-Age:Methods and Development. Geneva: WHO. http://www.who.int/childgrowth/standards/velocity/tr3_velocity_report.pdf
———. 2008. World Health Statistics 2008. Geneva: WHO. http://www.who.int/whosis/whostat/2008/en/index.html.
Zaman, H. 2008. The Impact of Rising Food Prices on Malnutrition: A Back of theEnvelope Estimate. Washington, DC: World Bank.
Zlotkin, S. H., C. Schauer, A. Christofides, W. Sharieff, M. C. Tondeur, and S. M. Z.Hyder. 2005. “Micronutrient Sprinkles to Control Childhood Anaemia.”Public Library of Science Medicine 2 (1): e1.
92 References
93
A
Accra declaration, xxii, xxx, 13, 36acute malnutrition. See global acute
malnutrition; severe acutemalnutrition
Afghanistan, 6t, 11tAfrica. See Middle East and North Africa;
Sub-Saharan AfricaAhmed, T., 73, 74AIDS/HIV, xxi, xxix, 9, 45, 50f, 52t,
53t, 55Albania, 6tAngola, 6t, 11tArab Republic of Egypt, 6t, 11t, 82Asia. See East Asia and Pacific; Eastern
Europe and Central Asia; South Asia
B
Bachmann, M., 74Bangladesh, xxvii, 6t, 11t, 20, 28, 42, 75,
77, 80t, 83behavior change interventions
additional financing needs, 35fcapacity for program delivery, 52currently covered populations, 19f
effectiveness of, xx, 12estimated costs, 25–28, 26t,
32, 33fexpected outcomes, 36, 38tin phased scale up process, 47,
48f, 52rationale for, 62ttarget populations and delivery
platforms for, 14tunderweight, efficacy in treating,
76–77unit cost estimates, 21t, 24
Bhutan, 6tBill and Melinda Gates Foundation, 43Bolivia, 6tBotswana, 6tBP-100 compressed biscuits, 74, 76Brazil, 77Bryce, J., 9–10Burkina Faso, 6t, 11t, 28, 78, 83Burundi, 6t, 11t
C
Cambodia, 6t, 11tCameroon, 6t, 11tCanada, xxviii, 44
Index
Figures and tables are indicated by f and t, respectively.
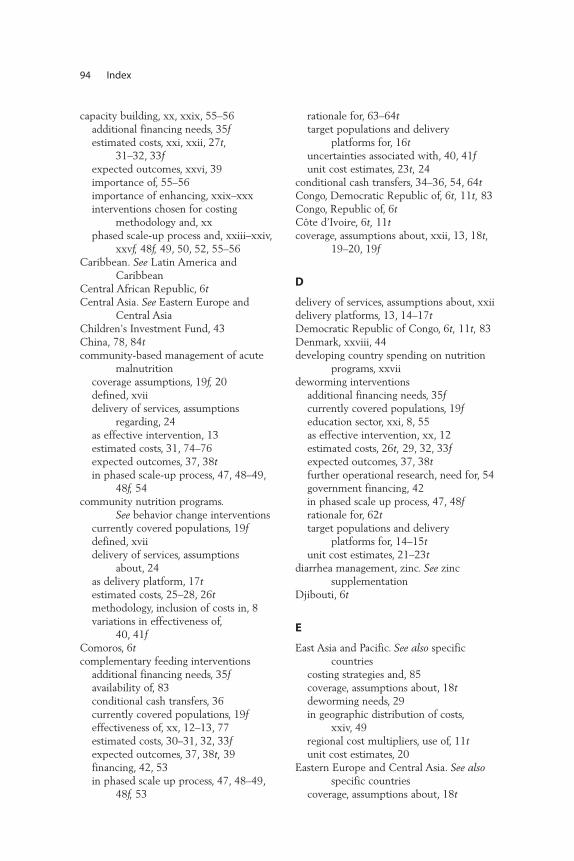
capacity building, xx, xxix, 55–56additional financing needs, 35festimated costs, xxi, xxii, 27t,
31–32, 33fexpected outcomes, xxvi, 39importance of, 55–56importance of enhancing, xxix–xxxinterventions chosen for costing
methodology and, xxphased scale-up process and, xxiii–xxiv,
xxvf, 48f, 49, 50, 52, 55–56Caribbean. See Latin America and
CaribbeanCentral African Republic, 6tCentral Asia. See Eastern Europe and
Central AsiaChildren’s Investment Fund, 43China, 78, 84tcommunity-based management of acute
malnutritioncoverage assumptions, 19f, 20defined, xviidelivery of services, assumptions
regarding, 24as effective intervention, 13estimated costs, 31, 74–76expected outcomes, 37, 38tin phased scale-up process, 47, 48–49,
48f, 54community nutrition programs.
See behavior change interventionscurrently covered populations, 19fdefined, xviidelivery of services, assumptions
about, 24as delivery platform, 17testimated costs, 25–28, 26tmethodology, inclusion of costs in, 8variations in effectiveness of,
40, 41fComoros, 6tcomplementary feeding interventions
additional financing needs, 35favailability of, 83conditional cash transfers, 36currently covered populations, 19feffectiveness of, xx, 12–13, 77estimated costs, 30–31, 32, 33fexpected outcomes, 37, 38t, 39financing, 42, 53in phased scale up process, 47, 48–49,
48f, 53
rationale for, 63–64ttarget populations and delivery
platforms for, 16tuncertainties associated with, 40, 41funit cost estimates, 23t, 24
conditional cash transfers, 34–36, 54, 64tCongo, Democratic Republic of, 6t, 11t, 83Congo, Republic of, 6tCôte d’Ivoire, 6t, 11tcoverage, assumptions about, xxii, 13, 18t,
19–20, 19f
D
delivery of services, assumptions about, xxiidelivery platforms, 13, 14–17tDemocratic Republic of Congo, 6t, 11t, 83Denmark, xxviii, 44developing country spending on nutrition
programs, xxviideworming interventions
additional financing needs, 35fcurrently covered populations, 19feducation sector, xxi, 8, 55as effective intervention, xx, 12estimated costs, 26t, 29, 32, 33fexpected outcomes, 37, 38tfurther operational research, need for, 54government financing, 42in phased scale up process, 47, 48frationale for, 62ttarget populations and delivery
platforms for, 14–15tunit cost estimates, 21–23t
diarrhea management, zinc. See zincsupplementation
Djibouti, 6t
E
East Asia and Pacific. See also specificcountries
costing strategies and, 85coverage, assumptions about, 18tdeworming needs, 29in geographic distribution of costs,
xxiv, 49regional cost multipliers, use of, 11tunit cost estimates, 20
Eastern Europe and Central Asia. See alsospecific countries
coverage, assumptions about, 18t
94 Index
in geographic distribution of costs, xxiv, 49
regional cost multipliers, use of, 11tunit cost estimates, 24
Ecuador, 6tedema, undernutrition with, 75education sector, interventions through,
xxi, 8, 55educational programs. See behavior change
interventionsEgypt, Arab Republic of, 6t, 11t, 82Equatorial Guinea, 6tEritrea, 6testimated costs, xxii–xxiv, 25–34, 49–50.
See also methodology forestimating costs
behavior change interventions, 25–28,26t, 32, 33f
capacity-building, xxi, xxii, 27t,31–32, 33f
complementary and therapeutic feeding interventions, 30–31, 32, 33f
deworming interventions, 26t, 29, 32, 33f
geographic distribution of, xxiv, 49micronutrient interventions, 26–27t,
28–30, 32, 33fpercentage of total costs by intervention,
32, 33fsevere acute malnutrition,
program costs for treatment of, 73–76, 79–82, 80–81t,83–85
uncertainties associated with, 40, 41funderweight, program costs
for treatment of, 76–79, 82–85, 84t
Ethiopia, xxvii, xxviii, 6t, 11t, 28, 42, 81t, 83
Europe, Eastern. See Eastern Europe andCentral Asia
European Commission, 44, 52t, 53texpected outcomes, xxiv–xxvii, 36–39,
38t, 47, 50
F
F-100, 74, 75financing options, xxvii–xxix, 40–45
conditional cash transfers, 34–36, 54, 64t
for further operational research, 55gap between private resources
and estimated costs, 32–34, 35f, 50
government financing, 41–42international aid flows, xxviii, 43–44,
50–53f, 51phased scale-up process, 51–54private corporate investment,
xxvii–xxviii, 43private household resources, xxvii, 32,
42–43, 53–54folic acid. See iron and folic acid
supplementation during pregnancy
Foodlets, 79fortified foods. See iron fortification;
salt iodizationFrance, xxviii, 44, 74
G
G8, xxviii, 44The Gambia, 6tgeographic distribution of costs, xxivGhana, 6t, 11t, 28, 77, 78Global Action Plan for scaling up
nutrition programs, 3global acute malnutrition (wasting)
defined, xviiprogram costs for treating, 23t, 30,
82, 85, 93government financing, 41–42Guatemala, xxvi, 6t, 11t, 28, 39, 82Guinea, 6tGuinea-Bissau, 6tGuinea, Equatorial, 6t
H
Haiti, xxviii, 6thandwashing. See behavior change
interventionshealth systems, working with, xx,
xxiii–xxiv, xxix, 8, 17t, 36High Level Taskforce on Innovative
International Financing for Health Systems, xxiii, xxvii, xxviii,8, 9, 10, 49
HIV/AIDS, xxi, xxix, 9, 45, 50f, 52t,53t, 55
Honduras, 6t, 23t
Index 95
I
income quintile and incidence ofunderweight, xxvii, 53
Indiaamount spent on nutrition programs
by, xxviias country with high
underweight/stunting rates, 6testimated costs for, 28, 34, 42income quintile and incidence of
underweight in, xxviipopulation estimates, 66regional cost multipliers, 11tsevere acute malnutrition, treatment of,
76, 83underweight, treatment of, 77, 79unit costs of interventions in,
21t, 23tIndia ready-to-use food, 23t, 27t, 30, 79,
84t, 85Indonesia, 6t, 11t, 77Integrated Child Development Services
program, India, xxvii, 42international aid flows, xxviii, 43–44,
50–53f, 51interventions used in costing scale up, xx,
2, 8–9, 12–13, 14–16t, 61, 62–64t.See also behavior changeinterventions; complementaryfeeding interventions; deworming;micronutrient interventions;therapeutic feeding interventions
iodized salt. See salt iodizationIraq, 6t, 11t, 28Ireland, xxviiiiron and folic acid supplementation during
pregnancy, xxadditional financing needs, 35festimated costs, 29, 33fexpected outcomes, xxv, 36, 38t, 47financing, 42further operational research, need for, 54methodology for estimating costs, 12,
15t, 17t, 19f, 22t, 24rationale for, 62t
iron and folic acid supplementation foradolescents, xxi, 8, 55
iron fortification, xx, xxixadditional financing needs, 35fconditional cash transfers, 36estimated costs, 29–30, 33f
expected outcomes, xxiv–xxvii, 37, 38t, 39, 47
financing, 42–43, 52methodology for estimating costs, 12,
15t, 17t, 19f, 22t, 24in phased scale-up process, 49, 52rationale for, 63tuncertainties associated with, 41f
Isanaka, S., 39, 78
J
Japan, xxviii, 44, 52f, 53f
K
Kenya, 6t, 11t
L
Lancet undernutrition series (2008), xx, 2,5, 6t, 9–10, 12, 54, 61, 62–64t
Latin America and Caribbean. See alsospecific countries
conditional cash transfers, 34coverage, assumptions about, 18tdeworming needs, 29in geographic distribution of costs,
xxiv, 49milk-based approach used in, 55regional cost multipliers, use of, 11tunit cost estimates, 20
Lesotho, 6tLiberia, 6tlipid-based supplements, 77, 78, 84tlow birth weight malnutrition, xviii, 55
M
Madagascar, 6t, 11t, 28Malawi, 6t, 11t, 75, 77, 78, 81t, 83Maldives, 6tMali, 6t, 11t, 83malnutrition
acute. See global acute malnutrition;severe acute malnutrition
low birth weight malnutrition, xviii, 55moderate. See underweightstunting as result of. See stunting
Marginal Budgeting for B95ottlenecks (MBB), 10
market-based strategies, xxvii, 8Mauritania, 6t
96 Index
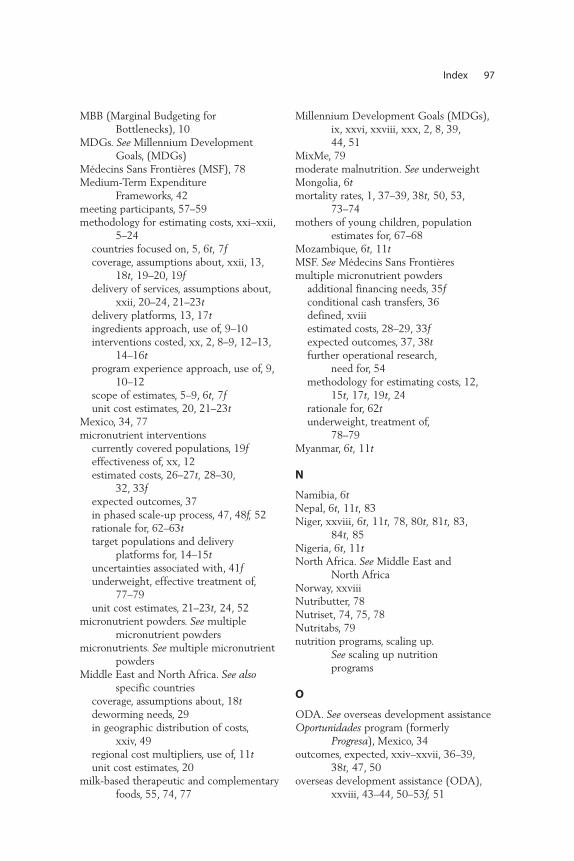
MBB (Marginal Budgeting for Bottlenecks), 10
MDGs. See Millennium DevelopmentGoals, (MDGs)
Médecins Sans Frontières (MSF), 78Medium-Term Expenditure
Frameworks, 42meeting participants, 57–59methodology for estimating costs, xxi–xxii,
5–24countries focused on, 5, 6t, 7fcoverage, assumptions about, xxii, 13,
18t, 19–20, 19fdelivery of services, assumptions about,
xxii, 20–24, 21–23tdelivery platforms, 13, 17tingredients approach, use of, 9–10interventions costed, xx, 2, 8–9, 12–13,
14–16tprogram experience approach, use of, 9,
10–12scope of estimates, 5–9, 6t, 7funit cost estimates, 20, 21–23t
Mexico, 34, 77micronutrient interventions
currently covered populations, 19feffectiveness of, xx, 12estimated costs, 26–27t, 28–30,
32, 33fexpected outcomes, 37in phased scale-up process, 47, 48f, 52rationale for, 62–63ttarget populations and delivery
platforms for, 14–15tuncertainties associated with, 41funderweight, effective treatment of,
77–79unit cost estimates, 21–23t, 24, 52
micronutrient powders. See multiplemicronutrient powders
micronutrients. See multiple micronutrientpowders
Middle East and North Africa. See alsospecific countries
coverage, assumptions about, 18tdeworming needs, 29in geographic distribution of costs,
xxiv, 49regional cost multipliers, use of, 11tunit cost estimates, 20
milk-based therapeutic and complementaryfoods, 55, 74, 77
Millennium Development Goals (MDGs),ix, xxvi, xxviii, xxx, 2, 8, 39, 44, 51
MixMe, 79moderate malnutrition. See underweightMongolia, 6tmortality rates, 1, 37–39, 38t, 50, 53,
73–74mothers of young children, population
estimates for, 67–68Mozambique, 6t, 11tMSF. See Médecins Sans Frontièresmultiple micronutrient powders
additional financing needs, 35fconditional cash transfers, 36defined, xviiiestimated costs, 28–29, 33fexpected outcomes, 37, 38tfurther operational research,
need for, 54methodology for estimating costs, 12,
15t, 17t, 19t, 24rationale for, 62tunderweight, treatment of,
78–79Myanmar, 6t, 11t
N
Namibia, 6tNepal, 6t, 11t, 83Niger, xxviii, 6t, 11t, 78, 80t, 81t, 83,
84t, 85Nigeria, 6t, 11tNorth Africa. See Middle East and
North AfricaNorway, xxviiiNutributter, 78Nutriset, 74, 75, 78Nutritabs, 79nutrition programs, scaling up.
See scaling up nutrition programs
O
ODA. See overseas development assistanceOportunidades program (formerly
Progresa), Mexico, 34outcomes, expected, xxiv–xxvii, 36–39,
38t, 47, 50overseas development assistance (ODA),
xxviii, 43–44, 50–53f, 51
Index 97
P
Pakistan, 6t, 11t, 83Paris declaration, xxii, xxx, 13, 36peer reviewers, 57–59Peru, 6t, 11t, 28, 38t, 82phased scale-up process, xxiii–xxiv,
xxvf, 47–56capacity building, importance of,
xxiii–xxiv, xxvf, 48f, 49, 50, 52, 55–56
financing of, 51–54further operational research, need for,
54–55proposed two-step scale up,
48–50, 48freasons for adopting, 47–48
Philippines, 6t, 11tPlumpy’doz, 78, 79, 84tPlumpy’Nut, 74, 78population estimates, 65–71
children7–60 months of age, 69malnourished, 0–60 months of age,
69–71coverage, assumptions about, xxii, 13,
18t, 19–20, 19fdelivery platforms and interventions
for target populations, 14–16t
entire population, 71pregnant women
in areas with iodized salt shortages,68–69
generally, 66–67pregnant women
further research requirements, 55iron/folic acid. See iron and folic
acid supplementation duringpregnancy
population estimatesin areas with iodized salt shortages,
68–69generally, 66–67
private corporate investment in nutritionprograms, xxvii–xxviii, 43
private household resources as financing option, xxvii, 32, 42–43, 53–54
Progresa program (now Oportunidades),Mexico, 34
pulses, food supplements using, 75
R
REACH. See Renewed Efforts AgainstChildhood Hunger
ready-to-use therapeutic foods, 73–85BP-100 compressed biscuits, 74, 76defined, xviiiF-100, 74, 75India ready-to-use food, 23t, 27t, 30, 79,
84t, 85lipid-based supplements, 77, 78, 84tNutributter, 78Plumpy’doz, 78, 79, 84tPlumpy’Nut, 74, 78pulses as, 75
Renewed Efforts Against ChildhoodHunger (REACH), 10, 11–12,32–34
Republic of Congo, 6tRwanda, 6t
S
salt iodization, xx, xxixadditional financing needs, 35festimated costs, 30, 34fexpected outcomes, xxiv, xxv, xxvii, 37,
38t, 39, 47financing, 42–43, 52methodology for estimating costs, 12,
15t, 17t, 19f, 22–23t, 24in phased scale-up process, 49, 52population estimates for pregnant
women in areas with iodized saltshortages, 68–69
rationale for, 63tSão Tomé and Príncipe, 6tscaling up nutrition programs, ix–x,
xix–xxx, 1–3capacity for program delivery. See
capacity buildingcosts of undernutrition and
malnutrition, xix, xxixestimated costs for. See estimated costs;
methodology for estimating costsexpected outcomes of, xxiv–xxvii,
36–39, 38t, 47, 50financing options for. See financing
optionsfurther operational research, need for,
54–55Global Action Plan for, 3glossary of terms, ix–x
98 Index
importance and urgency of problem,xix, 1–3
interventions used in costing, xx, 2, 8–9,12–13, 14–16t, 61, 62–64t. See alsospecific interventions
meeting participants and peer reviewers,57–59
as phased process. See phased scale-up process
resources and costs, importance ofdetermining, xix
schools, interventions through, xxi, 8, 55severe acute malnutrition (severe wasting)
community-based management of. See community-based managementof acute malnutrition
cumulative effects of nutrition programson, 34
currently covered populations, 19fdefined, xviiiexpected outcomes of treating,
37–38, 48phased scale-up process, treatment in,
47, 48–49, 48f, 54program costs for treatment of, 73–76,
79–82, 80–81t, 83–85therapeutic feeding to treat. See
therapeutic feeding interventionsuncertainties associated with, 40, 41f
Sierra Leone, 6tSomalia, 6t, 78, 83South Africa, 6t, 11t, 28, 77, 82, 85South Asia. See also specific countries
community-based management of acutemalnutrition in, 75–76
complementary and therapeutic feedinginterventions in, 12, 47
conditional cash transfers, 34costing strategies and, 85coverage, assumptions about, 18tfurther operational research, need for, 55in geographic distribution of costs,
xxiv, 49increasing incidence of undernutrition
in, 2population estimates for malnourished
children in, 71regional cost multipliers, use of, 11tunit cost estimates, 20
Spain, xxviii, 44Sprinkles, 79Sri Lanka, 6t, 76
stuntingcountries carrying highest burden of,
6t, 7fdefined, xviiiexpected outcomes of scaling up
treatment of, 39, 50percentage of children worldwide
suffering from, 1resources required to treat, xix
Sub-Saharan Africa. See also specificcountries
complementary and therapeutic feedinginterventions in, 12, 74, 75
conditional cash transfers, 34costing strategies and, 79, 85coverage, assumptions about, 18t, 20further operational research, need
for, 55in geographic distribution of costs,
xxiv, 49increasing incidence of malnutrition
in, 2nutrition indicator used in, 76population estimates for malnourished
children in, 71regional cost multipliers, use of, 11tunderweight, treatment of, 77, 78unit cost estimates, 20
Sudan, 6t, 11t, 80t, 83Swaziland, 6t
T
Tajikistan, 6tTanzania, 6t, 11ttarget populations. See population
estimatestherapeutic feeding interventions
additional financing needs, 35fcommunity-based. See community-based
management of acute malnutritioncurrently covered populations, 19feffectiveness of, xx, 12–13, 73–76, 78estimated costs, 30–31, 32, 33fin phased scale-up process, 47, 48–49,
48f, 54rationale for, 63–64twith ready-to-use foods. See ready-to-use
therapeutic foodstarget populations and delivery
platforms for, 16tunit cost estimates, 23t
Index 99
Timor-Leste, 6tTogo, 6tTurkey, 6t, 11t, 28, 29, 82two-step scaling up process. See phased
scale-up process
U
Uganda, 6t, 11t, 28Ukraine, 66undernutrition
defined, xviiiglobal costs of, xix, xxix, 1–2, 47percentage of children worldwide
suffering from, 1resources required to treat, xix
underweight (moderate malnutrition)complementary feeding to combat.
See complementary feedinginterventions
countries carrying highest burden of, 6t, 7f
defined, xviiiexpected outcomes of treating, 39income quintiles and, xxvii, 53program costs for treatment of, 76–79,
82–85, 84tresources required to treat, xix
UNICEF, 13, 70, 71, 75, 76, 78, 83unit cost estimates, 20, 21–23tUnited Kingdom, xxviii, 44, 52f, 53fUnited States, 52f, 53f
V
Vietnam, 6t, 11tVitamin A supplementation, xx
additional financing needs, 35festimated costs, 28, 33fexpected outcomes, xxv, 36, 38tfinancing, 42, 52methodology for estimating costs, 10,
12, 14–16t, 17t, 19–20, 19f, 21, 24rationale for, 62t, 64t
W
wasting. See global acute malnutrition;severe acute malnutrition
Wheeler, Graeme, xWHO. See World Health Organizationwomen
mothers of young children, populationestimates for, 67–68
nutritional empowerment of, 55pregnant. See pregnant women
World Bank, 52f, 53fWorld Food Programme, 79World Health Organization (WHO)
CHOICE project, 9, 20deworming recommendations, 29methodologies for estimating costs used
by, 9, 10, 11severe acute malnutrition, guidelines
for treating, 73, 83on treatment of underweight,
76
Y
Yemen, Republic of, 6t, 11t, 29, 83Ying Yang Bao, 78, 84t
Z
Zambia, 6t, 11t, 74, 80tZimbabwe, 6tzinc supplementation,
xx, xxveffectiveness of, 79estimated costs, 28, 33fexpected outcomes, 37, 38tfurther operational research,
need for, 54methodology for estimating costs,
10, 12, 14–15t, 17t, 19f,21–22t, 24
in phased scale-up process, 52rationale for, 62t, 64t
100 Index

ECO-AUDIT
Environmental Benefits Statement
The World Bank is committed to preservingendangered forests and natural resources. TheOffice of the Publisher has chosen to printScaling Up Nutrition on recycled paper with30 percent post-consumer waste, in accor-dance with the recommended standards forpaper usage set by the Green Press Initiative,a nonprofit program supporting publishers inusing fiber that is not sourced from endan-gered forests. For more information, visitwww.greenpressinitiative.org.
Saved:• 4 trees• 10 million BTUs of
total energy• 617 lbs. of CO2
equivalent of green-house gases
• 7,758 gallons of wastewater
• 250 lbs. of solid waste

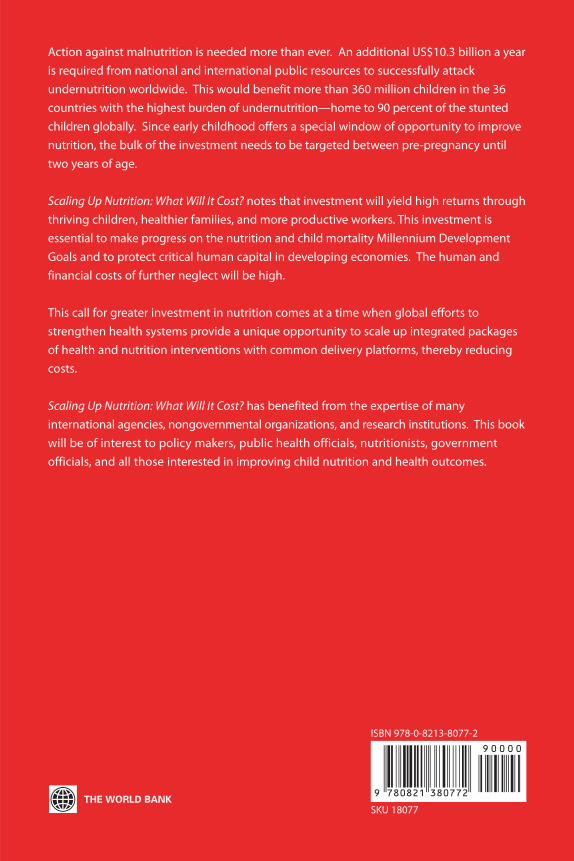
Action against malnutrition is needed more than ever. An additional US$10.3 billion a year
is required from national and international public resources to successfully attack
undernutrition worldwide. This would benefit more than 360 million children in the 36
countries with the highest burden of undernutrition—home to 90 percent of the stunted
children globally. Since early childhood offers a special window of opportunity to improve
nutrition, the bulk of the investment needs to be targeted between pre-pregnancy until
two years of age.
Scaling Up Nutrition: What Will It Cost? notes that investment will yield high returns through
thriving children, healthier families, and more productive workers. This investment is
essential to make progress on the nutrition and child mortality Millennium Development
Goals and to protect critical human capital in developing economies. The human and
financial costs of further neglect will be high.
This call for greater investment in nutrition comes at a time when global efforts to
strengthen health systems provide a unique opportunity to scale up integrated packages
of health and nutrition interventions with common delivery platforms, thereby reducing
costs.
Scaling Up Nutrition: What Will It Cost? has benefited from the expertise of many
international agencies, nongovernmental organizations, and research institutions. This book
will be of interest to policy makers, public health officials, nutritionists, government
officials, and all those interested in improving child nutrition and health outcomes.
ISBN 978-0-8213-8077-2
SKU 18077