Embed Size (px)
Citation preview
General rights Copyright and moral rights for the publications made accessible in the public portal are retained by the authors and/or other copyright owners and it is a condition of accessing publications that users recognise and abide by the legal requirements associated with these rights.
Users may download and print one copy of any publication from the public portal for the purpose of private study or research.
You may not further distribute the material or use it for any profit-making activity or commercial gain
You may freely distribute the URL identifying the publication in the public portal If you believe that this document breaches copyright please contact us providing details, and we will remove access to the work immediately and investigate your claim.
Downloaded from orbit.dtu.dk on: Mar 22, 2020
Scale Adaptive Simulation Model for the Darrieus Wind Turbine
Rogowski, K.; Hansen, Martin Otto Laver; Maronski, R.; Lichota, P.
Published in:Journal of Physics: Conference Series (Online)
Link to article, DOI:10.1088/1742-6596/753/2/022050
Publication date:2016
Document VersionPublisher's PDF, also known as Version of record
Link back to DTU Orbit
Citation (APA):Rogowski, K., Hansen, M. O. L., Maronski, R., & Lichota, P. (2016). Scale Adaptive Simulation Model for theDarrieus Wind Turbine. Journal of Physics: Conference Series (Online), 753, [022050].https://doi.org/10.1088/1742-6596/753/2/022050
This content has been downloaded from IOPscience. Please scroll down to see the full text.
Download details:
IP Address: 192.38.90.17
This content was downloaded on 08/12/2016 at 13:55
Please note that terms and conditions apply.
Scale Adaptive Simulation Model for the Darrieus Wind Turbine
View the table of contents for this issue, or go to the journal homepage for more
2016 J. Phys.: Conf. Ser. 753 022050
(http://iopscience.iop.org/1742-6596/753/2/022050)
Home Search Collections Journals About Contact us My IOPscience
You may also be interested in:
Computational investigation of flow control by means of tubercles on Darrieus wind turbine blades
K Sevinç, G Özdamar, U entürk et al.
Analysis of compressibility effects on Darrieus-Landau instability of deflagrationwave
L. He
Cavitating behaviour analysis of Darrieus-type cross flow water turbines
V Aumelas, C Pellone and T Maître
Analysis of VAWT aerodynamics and design using the Actuator Cylinder flow model
H Aa Madsen, U S Paulsen and L Vitae
Research on Darrieus-type hydraulic turbine for extra-low head hydropower utilization
A Furukawa, S Watanabe and K Okuma
Tentative Study on Performance of Darriues-Type Hydroturbine Operated in Small Open Water Channel
D Matsushita, R Moriyama, K Nakashima et al.
Aeroelastic Stability Investigations for Large-scale Vertical Axis Wind Turbines
B C Owens and D T Griffith

Scale Adaptive Simulation Model for the Darrieus Wind
Turbine
K Rogowski1, M O L Hansen
2, R Maroński
1 and P Lichota
1
1The Institute of Aeronautics and Applied Mechanics, Nowowiejska 24, 00-665
Warsaw, Warsaw University of Technology, Poland 2Department of Wind Energy, Building 403, Technical University of Denmark, DK-
2800 Lyngby Denmark
E-mail: [email protected]
Abstract. Accurate prediction of aerodynamic loads for the Darrieus wind turbine using more
or less complex aerodynamic models is still a challenge. One of the problems is the small
amount of experimental data available to validate the numerical codes. The major objective of
the present study is to examine the scale adaptive simulation (SAS) approach for performance
analysis of a one-bladed Darrieus wind turbine working at a tip speed ratio of 5 and at a blade
Reynolds number of 40 000. The three-dimensional incompressible unsteady Navier-Stokes
equations are used. Numerical results of aerodynamic loads and wake velocity profiles behind
the rotor are compared with experimental data taken from literature. The level of agreement
between CFD and experimental results is reasonable.
1. Introduction
According to the EWEA report “Wind in power: 2015 European statistics – February 2016”, wind
energy has become very popular in the EU and around the word. Research shows that not only large
wind farms are profitable, some economic studies show profitability of small wind turbines in specific
geographical areas e.g. for Iran [1], the Hawaiian Islands [2], Egypt [3] etc. An economic analysis of
the installation and use of small wind turbines for five major EU countries were made by Bortolini et
al. with positive results [4].
Small-scale wind turbines can use a horizontal axis as well as a vertical axis concept. Vertical-axis
wind turbine (VAWT) with the Darrieus concept is lift force driven and is an alternative to the
horizontal axis wind turbine (HAWT) [5]. The Darrieus wind turbine consists of two or more curved
blades, however, straight-bladed rotors or rotors with twisted blades are more common in applications
for small wind turbines [6]. VAWT can operate, by design, independently of wind direction and
therefore a yaw control system is not required. The motivation for the research of small-scale vertical-
axis wind turbine is a demand for decentralized electricity generation in urban and rural areas [7].
In the case of vertical axis wind turbines, flow around the rotor blades is very complex. During the
rotation many phenomena can occur, such as for example: dynamic deep stall, wake-blade-wake
interaction, secondary effects of tower, struts, blade shape and aspect ratio [8]. The use of rotor
consisting of a single blade seems to be a good idea to understand the basis of principles of operation
The Science of Making Torque from Wind (TORQUE 2016) IOP PublishingJournal of Physics: Conference Series 753 (2016) 022050 doi:10.1088/1742-6596/753/2/022050
Content from this work may be used under the terms of the Creative Commons Attribution 3.0 licence. Any further distributionof this work must maintain attribution to the author(s) and the title of the work, journal citation and DOI.
Published under licence by IOP Publishing Ltd 1
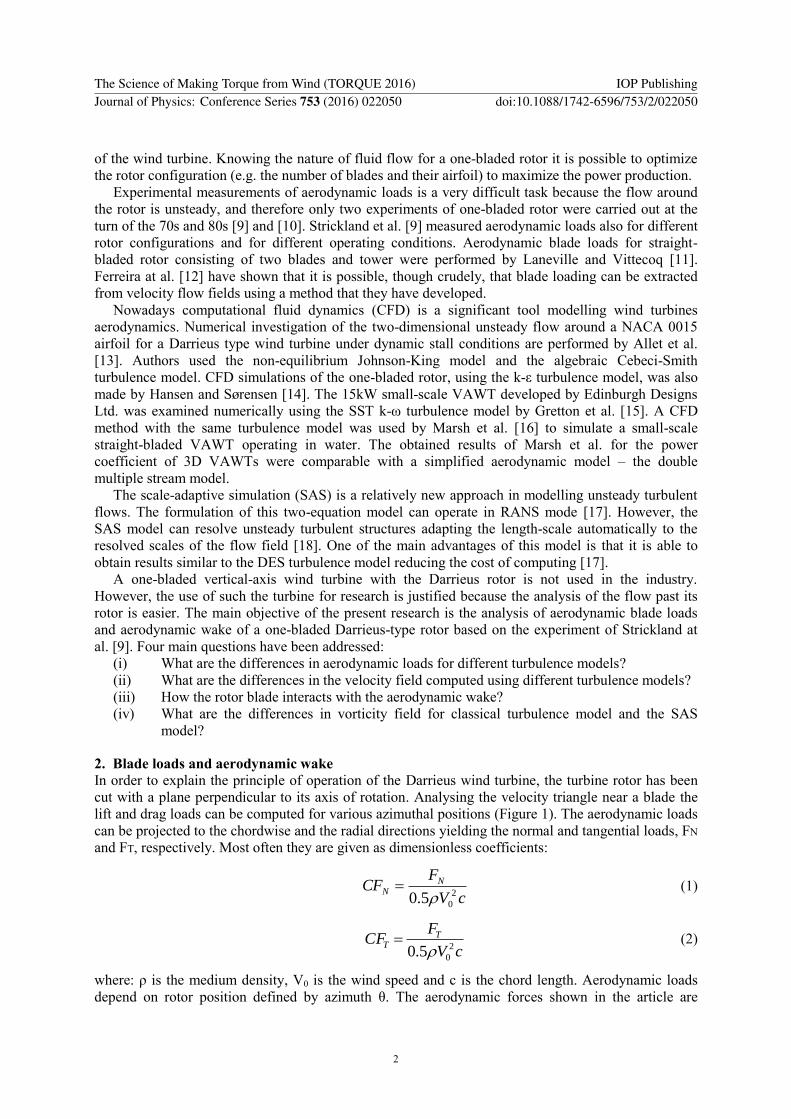
of the wind turbine. Knowing the nature of fluid flow for a one-bladed rotor it is possible to optimize
the rotor configuration (e.g. the number of blades and their airfoil) to maximize the power production.
Experimental measurements of aerodynamic loads is a very difficult task because the flow around
the rotor is unsteady, and therefore only two experiments of one-bladed rotor were carried out at the
turn of the 70s and 80s [9] and [10]. Strickland et al. [9] measured aerodynamic loads also for different
rotor configurations and for different operating conditions. Aerodynamic blade loads for straight-
bladed rotor consisting of two blades and tower were performed by Laneville and Vittecoq [11].
Ferreira at al. [12] have shown that it is possible, though crudely, that blade loading can be extracted
from velocity flow fields using a method that they have developed.
Nowadays computational fluid dynamics (CFD) is a significant tool modelling wind turbines
aerodynamics. Numerical investigation of the two-dimensional unsteady flow around a NACA 0015
airfoil for a Darrieus type wind turbine under dynamic stall conditions are performed by Allet et al.
[13]. Authors used the non-equilibrium Johnson-King model and the algebraic Cebeci-Smith
turbulence model. CFD simulations of the one-bladed rotor, using the k-ε turbulence model, was also
made by Hansen and Sørensen [14]. The 15kW small-scale VAWT developed by Edinburgh Designs
Ltd. was examined numerically using the SST k-ω turbulence model by Gretton et al. [15]. A CFD
method with the same turbulence model was used by Marsh et al. [16] to simulate a small-scale
straight-bladed VAWT operating in water. The obtained results of Marsh et al. for the power
coefficient of 3D VAWTs were comparable with a simplified aerodynamic model – the double
multiple stream model.
The scale-adaptive simulation (SAS) is a relatively new approach in modelling unsteady turbulent
flows. The formulation of this two-equation model can operate in RANS mode [17]. However, the
SAS model can resolve unsteady turbulent structures adapting the length-scale automatically to the
resolved scales of the flow field [18]. One of the main advantages of this model is that it is able to
obtain results similar to the DES turbulence model reducing the cost of computing [17].
A one-bladed vertical-axis wind turbine with the Darrieus rotor is not used in the industry.
However, the use of such the turbine for research is justified because the analysis of the flow past its
rotor is easier. The main objective of the present research is the analysis of aerodynamic blade loads
and aerodynamic wake of a one-bladed Darrieus-type rotor based on the experiment of Strickland at
al. [9]. Four main questions have been addressed:
(i) What are the differences in aerodynamic loads for different turbulence models?
(ii) What are the differences in the velocity field computed using different turbulence models?
(iii) How the rotor blade interacts with the aerodynamic wake?
(iv) What are the differences in vorticity field for classical turbulence model and the SAS
model?
2. Blade loads and aerodynamic wake
In order to explain the principle of operation of the Darrieus wind turbine, the turbine rotor has been
cut with a plane perpendicular to its axis of rotation. Analysing the velocity triangle near a blade the
lift and drag loads can be computed for various azimuthal positions (Figure 1). The aerodynamic loads
can be projected to the chordwise and the radial directions yielding the normal and tangential loads, FN
and FT, respectively. Most often they are given as dimensionless coefficients:
cV
FCF N
N 2
05.0 (1)
cV
FCF T
T 2
05.0 (2)
where: ρ is the medium density, V0 is the wind speed and c is the chord length. Aerodynamic loads
depend on rotor position defined by azimuth θ. The aerodynamic forces shown in the article are
The Science of Making Torque from Wind (TORQUE 2016) IOP PublishingJournal of Physics: Conference Series 753 (2016) 022050 doi:10.1088/1742-6596/753/2/022050
2

presented as functions of the azimuth angle where the initial position and the direction of the azimuth
have been adopted as in Figure 1.
The wake characteristics are evaluated at a distance of one rotor diameter behind the rotor to be
consistent with measurements. Figure 1 shows also the airfoil path and location of checkpoints for
velocity measurement behind the rotor.
Figure 1. Velocity vectors, forces, angles and checkpoints for wake
velocity computations.
3. Experimental data
The results from Strickland’s water channel experiments [9] at Texas Tech University are used to
validate the numerical model. A series of two-dimensional experiments were conducted in a water
towing tank for rotors with different number of straight blades operated at different conditions. The
rotor was mounted on a special carriage which could slide along a fixed rail. By selection of
appropriate towing speed and rotational velocity of the rotor the blade Reynolds number of 40 000 was
ensured. The use of water as a working fluid allowed easier measurement of aerodynamic blade forces
as functions of time and easier flow visualization around the rotor. One of the main objectives of the
experiments was to measure the aerodynamic blade loads and velocity profiles behind the rotor.
Aerodynamic blade loads were measured by strain gages. The signal generated by the Wheatstone
bridge was amplified and sent via slip rings to an eight channel recorder and oscilloscope [9]. Velocity
profiles were measured by velocity transducer placed behind the rotor. Measures were repeated many
times for thirteen check points at various spanwise locations as depicted in Figure 1. Due to limited
space in this article the description of the experiment is very short and more information can be found
in the report [9].
In this paper validation of numerical results is done using the experimental results taken from [9]
for a one-bladed rotor operating at a tip speed ratio of 5.
4. CFD model of the Darrieus rotor
4.1. Rotor configuration and operating conditions
Numerical analyses of the 2D VAWT are performed for the same conditions as in the experiment [9].
A straight-bladed rotor using one blade only with a NACA 0012 airfoil and a diameter of 1.22m
The Science of Making Torque from Wind (TORQUE 2016) IOP PublishingJournal of Physics: Conference Series 753 (2016) 022050 doi:10.1088/1742-6596/753/2/022050
3
rotating at an angular velocity of 0.75rad/sec is simulated. This corresponds to a blade Reynolds
number of 40 000 and a tip speed ratio of 5 for an undisturbed water velocity of 0.091m/sec. The
solidity of the rotor, defined as a ratio of the airfoil chord to the rotor radius, is 0.15 for the chord of
0.0914m.
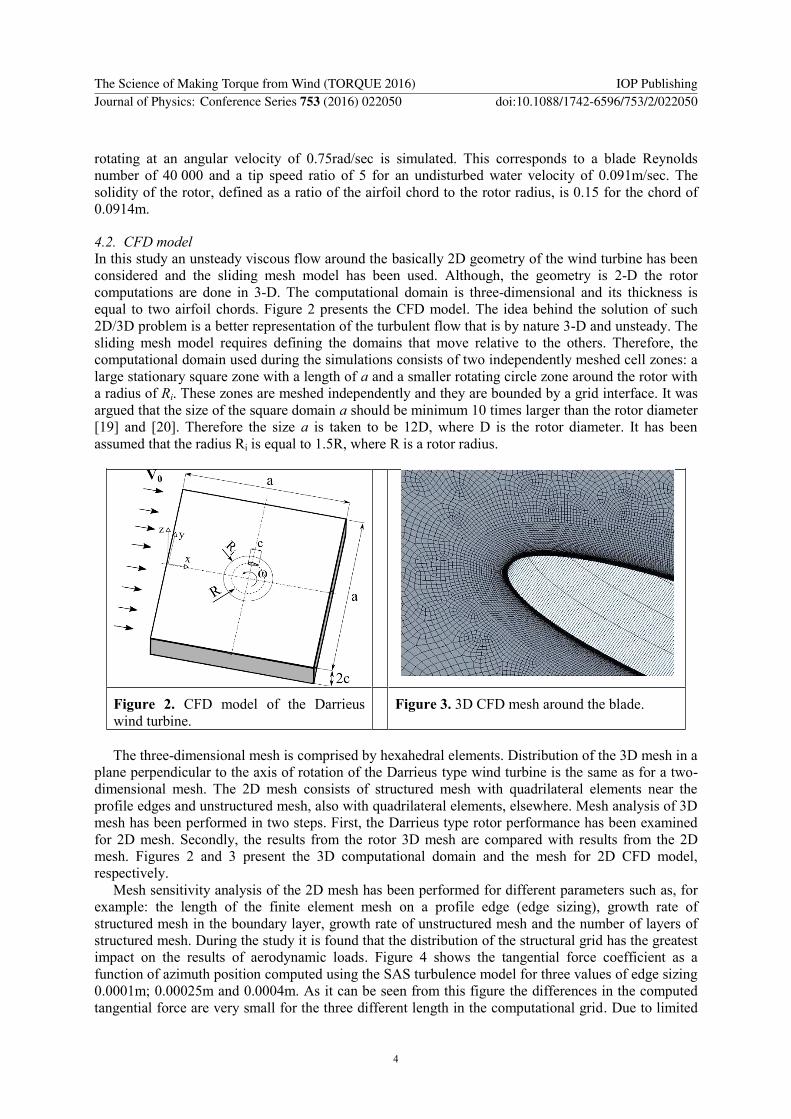
4.2. CFD model
In this study an unsteady viscous flow around the basically 2D geometry of the wind turbine has been
considered and the sliding mesh model has been used. Although, the geometry is 2-D the rotor
computations are done in 3-D. The computational domain is three-dimensional and its thickness is
equal to two airfoil chords. Figure 2 presents the CFD model. The idea behind the solution of such
2D/3D problem is a better representation of the turbulent flow that is by nature 3-D and unsteady. The
sliding mesh model requires defining the domains that move relative to the others. Therefore, the
computational domain used during the simulations consists of two independently meshed cell zones: a
large stationary square zone with a length of a and a smaller rotating circle zone around the rotor with
a radius of Ri. These zones are meshed independently and they are bounded by a grid interface. It was
argued that the size of the square domain a should be minimum 10 times larger than the rotor diameter
[19] and [20]. Therefore the size a is taken to be 12D, where D is the rotor diameter. It has been
assumed that the radius Ri is equal to 1.5R, where R is a rotor radius.
Figure 2. CFD model of the Darrieus
wind turbine.
Figure 3. 3D CFD mesh around the blade.
The three-dimensional mesh is comprised by hexahedral elements. Distribution of the 3D mesh in a
plane perpendicular to the axis of rotation of the Darrieus type wind turbine is the same as for a two-
dimensional mesh. The 2D mesh consists of structured mesh with quadrilateral elements near the
profile edges and unstructured mesh, also with quadrilateral elements, elsewhere. Mesh analysis of 3D
mesh has been performed in two steps. First, the Darrieus type rotor performance has been examined
for 2D mesh. Secondly, the results from the rotor 3D mesh are compared with results from the 2D
mesh. Figures 2 and 3 present the 3D computational domain and the mesh for 2D CFD model,
respectively.
Mesh sensitivity analysis of the 2D mesh has been performed for different parameters such as, for
example: the length of the finite element mesh on a profile edge (edge sizing), growth rate of
structured mesh in the boundary layer, growth rate of unstructured mesh and the number of layers of
structured mesh. During the study it is found that the distribution of the structural grid has the greatest
impact on the results of aerodynamic loads. Figure 4 shows the tangential force coefficient as a
function of azimuth position computed using the SAS turbulence model for three values of edge sizing
0.0001m; 0.00025m and 0.0004m. As it can be seen from this figure the differences in the computed
tangential force are very small for the three different length in the computational grid. Due to limited
The Science of Making Torque from Wind (TORQUE 2016) IOP PublishingJournal of Physics: Conference Series 753 (2016) 022050 doi:10.1088/1742-6596/753/2/022050
4
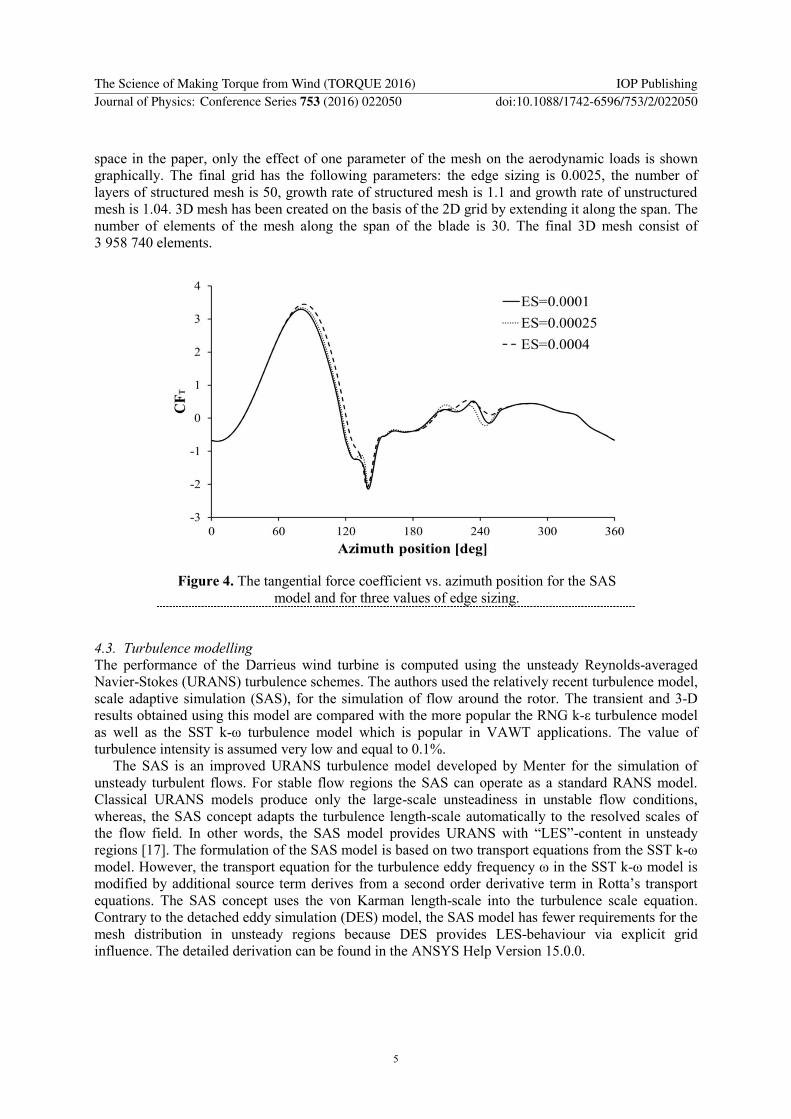
space in the paper, only the effect of one parameter of the mesh on the aerodynamic loads is shown
graphically. The final grid has the following parameters: the edge sizing is 0.0025, the number of
layers of structured mesh is 50, growth rate of structured mesh is 1.1 and growth rate of unstructured
mesh is 1.04. 3D mesh has been created on the basis of the 2D grid by extending it along the span. The
number of elements of the mesh along the span of the blade is 30. The final 3D mesh consist of
3 958 740 elements.
Figure 4. The tangential force coefficient vs. azimuth position for the SAS
model and for three values of edge sizing.
4.3. Turbulence modelling
The performance of the Darrieus wind turbine is computed using the unsteady Reynolds-averaged
Navier-Stokes (URANS) turbulence schemes. The authors used the relatively recent turbulence model,
scale adaptive simulation (SAS), for the simulation of flow around the rotor. The transient and 3-D
results obtained using this model are compared with the more popular the RNG k-ε turbulence model
as well as the SST k-ω turbulence model which is popular in VAWT applications. The value of
turbulence intensity is assumed very low and equal to 0.1%.
The SAS is an improved URANS turbulence model developed by Menter for the simulation of
unsteady turbulent flows. For stable flow regions the SAS can operate as a standard RANS model.
Classical URANS models produce only the large-scale unsteadiness in unstable flow conditions,
whereas, the SAS concept adapts the turbulence length-scale automatically to the resolved scales of
the flow field. In other words, the SAS model provides URANS with “LES”-content in unsteady
regions [17]. The formulation of the SAS model is based on two transport equations from the SST k-ω
model. However, the transport equation for the turbulence eddy frequency ω in the SST k-ω model is
modified by additional source term derives from a second order derivative term in Rotta’s transport
equations. The SAS concept uses the von Karman length-scale into the turbulence scale equation.
Contrary to the detached eddy simulation (DES) model, the SAS model has fewer requirements for the
mesh distribution in unsteady regions because DES provides LES-behaviour via explicit grid
influence. The detailed derivation can be found in the ANSYS Help Version 15.0.0.
The Science of Making Torque from Wind (TORQUE 2016) IOP PublishingJournal of Physics: Conference Series 753 (2016) 022050 doi:10.1088/1742-6596/753/2/022050
5

5. Results
5.1. Aerodynamic loads
Results of aerodynamic loads, tangential and normal components, are depicted in Figures 5 and 6.
The numerical results for the SAS 2D, the SAS 3D, the SST k-ω 2D and the RNG k-ε 3D turbulence
models are compared with the experimental results of Strickland et al. [9]. Due to limits on the
computational time on a supercomputer, the results for the SST k-ω turbulence model are presented
here for the 2D model of vertical-axis wind turbine. Figure 5 presents the comparison of the tangential
force obtained for the 2D mesh and 3D mesh having the same mesh distribution in the plane
perpendicular to the axis of rotation. As it can be seen from the figure, the three-dimensional mesh
gives results almost the same as the two-dimensional grid. The CFD results of the tangential force are
significantly different for the azimuth 90-170 degrees. This is caused by flow characteristics (flow
velocity distribution and pressure distribution) that are different for the RNG k-ε model and for the
following models: the 2D SAS, the 3D SAS and the SST k-ω. The tangential force computed using the
SAS models and the SST k-ω model are lower than the experimental one in the range of azimuths
between 90 and 170deg whereas the RNG k-ε model overestimates the results of this force component.
As a results, the power coefficient computed by the SAS models and by the SST k-ω is about 0.08-0.1
whereas by the RNG k-ε model is about 0.25. Moreover, it should be emphasized that, in the case of
the SAS models as well as the SST k-ω model, the results of the tangential blade loads seems to be
better for the leeward side of the rotor in comparison with the RNG k-ε model. The results of the
normal force computed by CFD are in reasonable agreement with the experimental results. The SAS
model predicts a local extreme of the tangential load at the azimuth of 135 deg. This kink is not
presented by other turbulence models and by the experiment. This is because, contrary to the RNG k-ε
and the SST k-ω models, the SAS shows unsteadiness near the leading edge of the blades and evolves
in the next sequences of fluid motion. Accuracy of measuring instruments used in the experiment may
be insufficient to capture the small changes in aerodynamic loads. In order to explain the differences
in the results of aerodynamic loads at the range of azimuth position between 90 and 170 degrees, the
analysis of the static pressure and the vorticity is presented in the next subsections.
Figure 5. Non-dimensional tangential aerodynamic blade force.
The Science of Making Torque from Wind (TORQUE 2016) IOP PublishingJournal of Physics: Conference Series 753 (2016) 022050 doi:10.1088/1742-6596/753/2/022050
6
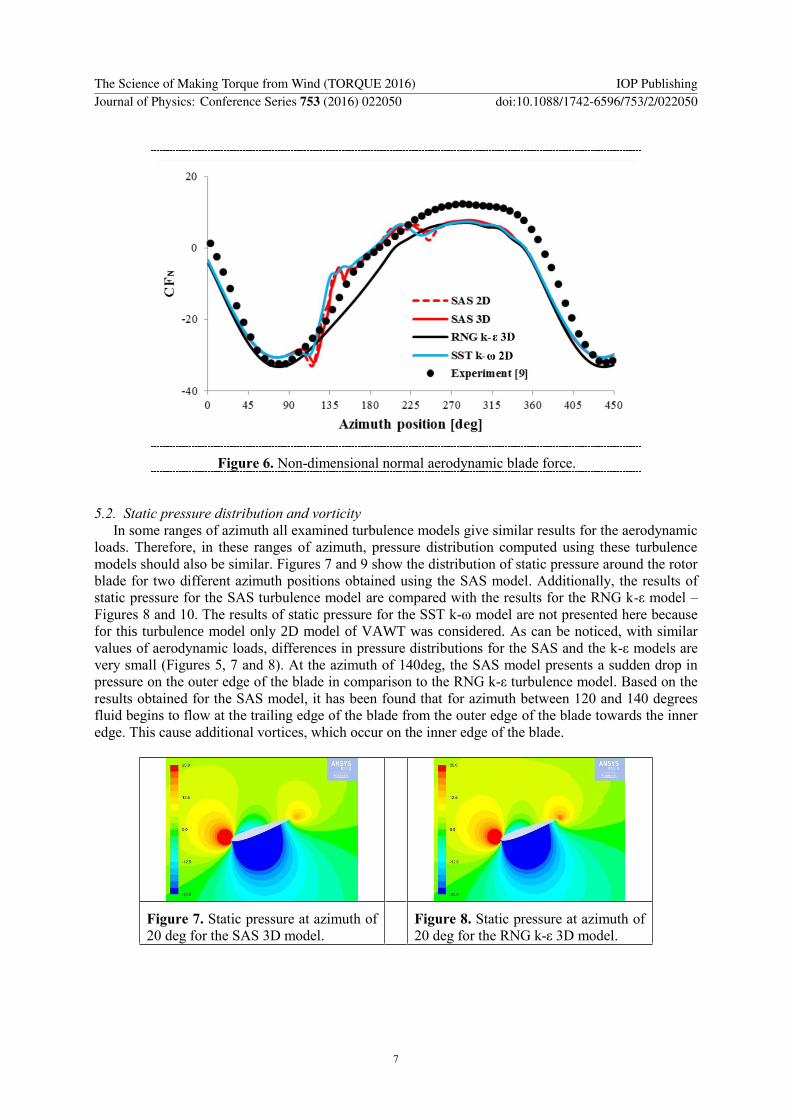
Figure 6. Non-dimensional normal aerodynamic blade force.
5.2. Static pressure distribution and vorticity
In some ranges of azimuth all examined turbulence models give similar results for the aerodynamic
loads. Therefore, in these ranges of azimuth, pressure distribution computed using these turbulence
models should also be similar. Figures 7 and 9 show the distribution of static pressure around the rotor
blade for two different azimuth positions obtained using the SAS model. Additionally, the results of
static pressure for the SAS turbulence model are compared with the results for the RNG k-ε model –
Figures 8 and 10. The results of static pressure for the SST k-ω model are not presented here because
for this turbulence model only 2D model of VAWT was considered. As can be noticed, with similar
values of aerodynamic loads, differences in pressure distributions for the SAS and the k-ε models are
very small (Figures 5, 7 and 8). At the azimuth of 140deg, the SAS model presents a sudden drop in
pressure on the outer edge of the blade in comparison to the RNG k-ε turbulence model. Based on the
results obtained for the SAS model, it has been found that for azimuth between 120 and 140 degrees
fluid begins to flow at the trailing edge of the blade from the outer edge of the blade towards the inner
edge. This cause additional vortices, which occur on the inner edge of the blade.
Figure 7. Static pressure at azimuth of
20 deg for the SAS 3D model.
Figure 8. Static pressure at azimuth of
20 deg for the RNG k-ε 3D model.
The Science of Making Torque from Wind (TORQUE 2016) IOP PublishingJournal of Physics: Conference Series 753 (2016) 022050 doi:10.1088/1742-6596/753/2/022050
7
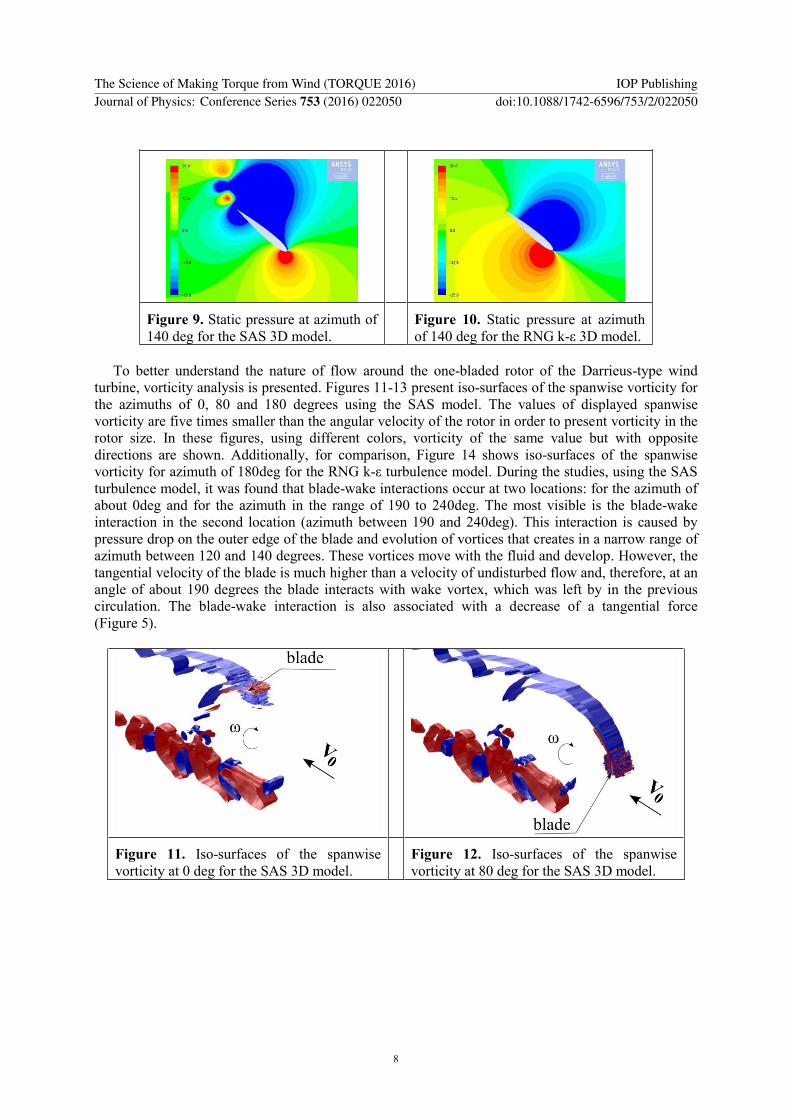
Figure 9. Static pressure at azimuth of
140 deg for the SAS 3D model.
Figure 10. Static pressure at azimuth
of 140 deg for the RNG k-ε 3D model.
To better understand the nature of flow around the one-bladed rotor of the Darrieus-type wind
turbine, vorticity analysis is presented. Figures 11-13 present iso-surfaces of the spanwise vorticity for
the azimuths of 0, 80 and 180 degrees using the SAS model. The values of displayed spanwise
vorticity are five times smaller than the angular velocity of the rotor in order to present vorticity in the
rotor size. In these figures, using different colors, vorticity of the same value but with opposite
directions are shown. Additionally, for comparison, Figure 14 shows iso-surfaces of the spanwise
vorticity for azimuth of 180deg for the RNG k-ε turbulence model. During the studies, using the SAS
turbulence model, it was found that blade-wake interactions occur at two locations: for the azimuth of
about 0deg and for the azimuth in the range of 190 to 240deg. The most visible is the blade-wake
interaction in the second location (azimuth between 190 and 240deg). This interaction is caused by
pressure drop on the outer edge of the blade and evolution of vortices that creates in a narrow range of
azimuth between 120 and 140 degrees. These vortices move with the fluid and develop. However, the
tangential velocity of the blade is much higher than a velocity of undisturbed flow and, therefore, at an
angle of about 190 degrees the blade interacts with wake vortex, which was left by in the previous
circulation. The blade-wake interaction is also associated with a decrease of a tangential force
(Figure 5).
Figure 11. Iso-surfaces of the spanwise
vorticity at 0 deg for the SAS 3D model.
Figure 12. Iso-surfaces of the spanwise
vorticity at 80 deg for the SAS 3D model.
The Science of Making Torque from Wind (TORQUE 2016) IOP PublishingJournal of Physics: Conference Series 753 (2016) 022050 doi:10.1088/1742-6596/753/2/022050
8
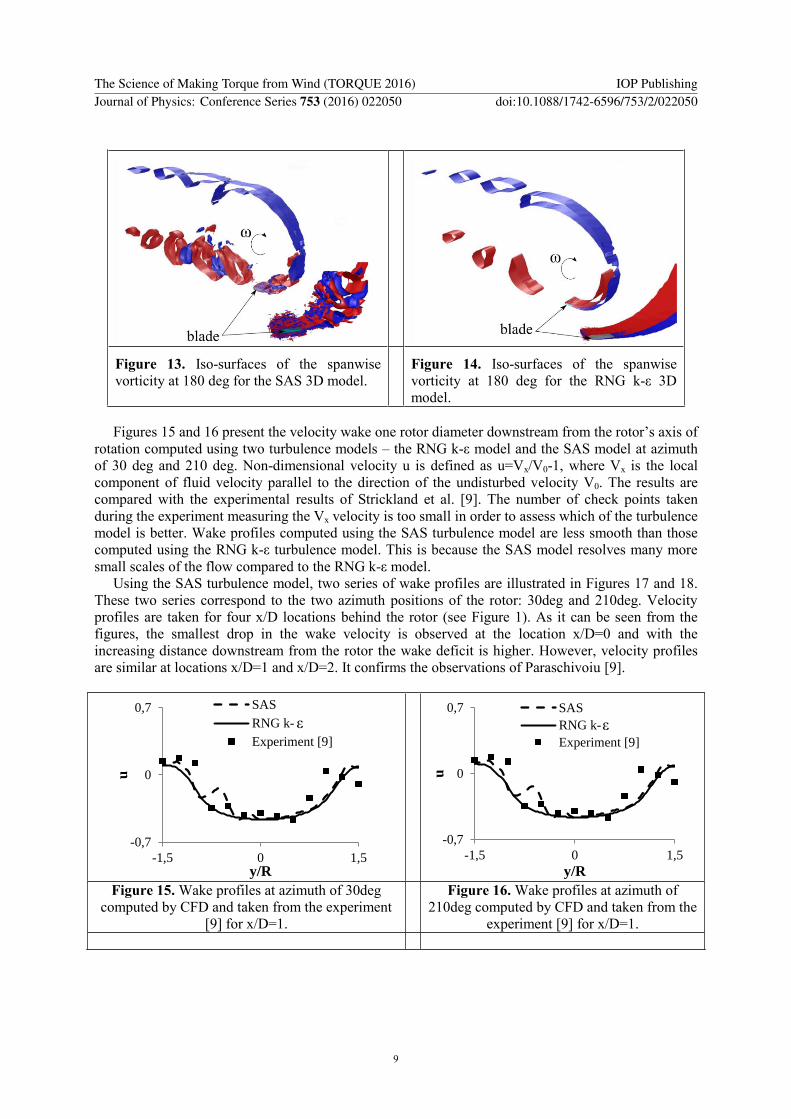
Figure 13. Iso-surfaces of the spanwise
vorticity at 180 deg for the SAS 3D model.
Figure 14. Iso-surfaces of the spanwise
vorticity at 180 deg for the RNG k-ε 3D
model.
Figures 15 and 16 present the velocity wake one rotor diameter downstream from the rotor’s axis of
rotation computed using two turbulence models – the RNG k-ε model and the SAS model at azimuth
of 30 deg and 210 deg. Non-dimensional velocity u is defined as u=Vx/V0-1, where Vx is the local
component of fluid velocity parallel to the direction of the undisturbed velocity V0. The results are
compared with the experimental results of Strickland et al. [9]. The number of check points taken
during the experiment measuring the Vx velocity is too small in order to assess which of the turbulence
model is better. Wake profiles computed using the SAS turbulence model are less smooth than those
computed using the RNG k-ε turbulence model. This is because the SAS model resolves many more
small scales of the flow compared to the RNG k-ε model.
Using the SAS turbulence model, two series of wake profiles are illustrated in Figures 17 and 18.
These two series correspond to the two azimuth positions of the rotor: 30deg and 210deg. Velocity
profiles are taken for four x/D locations behind the rotor (see Figure 1). As it can be seen from the
figures, the smallest drop in the wake velocity is observed at the location x/D=0 and with the
increasing distance downstream from the rotor the wake deficit is higher. However, velocity profiles
are similar at locations x/D=1 and x/D=2. It confirms the observations of Paraschivoiu [9].
Figure 15. Wake profiles at azimuth of 30deg
computed by CFD and taken from the experiment
[9] for x/D=1.
Figure 16. Wake profiles at azimuth of
210deg computed by CFD and taken from the
experiment [9] for x/D=1.
-0,7
0
0,7
-1,5 0 1,5
u
y/R
SAS
RNG k-
Experiment [9]
-0,7
0
0,7
-1,5 0 1,5
u
y/R
SAS
RNG k-
Experiment [9]
ε ε
The Science of Making Torque from Wind (TORQUE 2016) IOP PublishingJournal of Physics: Conference Series 753 (2016) 022050 doi:10.1088/1742-6596/753/2/022050
9

Figure 17. Wake profiles at azimuth of 30deg
computed using the SAS model.
Figure 18. Wake profiles at azimuth of
210deg computed using the SAS model.
6. Conclusions
The main objective of this research is the analysis of aerodynamic blade loads and aerodynamic wake
for a one-bladed rotor. On the basis of numerical investigations it turned out that:
The results of aerodynamic coefficients are satisfactory for the prevailing range of azimuth.
The SAS model shows much more effects of vortex wake in the rotor area compared to the
RNG k-ε turbulence model.
Based on the CFD results and using the SAS turbulence model, the rotor consisting of one
blade and operation at a tip speed ratio of 5 interacts with the vortex wake two times.
Most likely, the results of tangential force obtained for the RNG k-ε turbulence model are
too optimistic for the azimuth between 90 and 180 degrees.
The results of aerodynamic loads are similar for the SAS turbulence models and for the
SST k-ω 2D model. However, it is advisable to compare the 3D effects for these two
turbulence models.
The numerical results of wake profiles are in overall good agreement with the experiment.
Wake characteristics behind the rotor are consistent with the experiment at the distance of
one rotor diameter behind the axis of rotation.
References
[1] Mostafaeipoura A, Sedaghat A, Dehghan-Niric A A and Kalantarc V 2011 Wind energy
feasibility study for city of Shahrbabak in Iran, Renewable and Sustainable Energy Reviews
15 2545-2556
[2] Stockton K M 2004 Utility-scale wind on islands: an economic feasibility study of Ilio Point,
Hawai’I Renewable Energy 29 949–960
[3] Abdelhadya S, Borelloc B and Santoric S 2015 Economic feasibility of small wind turbines for
domestic consumers in Egypt based on the new Feed-in Tariff Energy Procedia 75 664 –
670
[4] Bortolini M, Gamberi M, Graziani A, Manzini R and Pilati F 2014 Performance and viability
analysis of small wind turbines in the European Union Renewable Energy 62 629-639
[5] Islam M, Ting D S K and Fartaj A 2008 Aerodynamic Models for Darrieus-Type Straight-
Bladed Vertical Axis Wind Turbines Renewable and Sustainable Energy Reviews 12(4)
1087-1109.
[6] Hansen M O L 2008 Aerodynamics of wind turbines Earthscan
[7] Scheurich F, Fletcher T M and Brown R E 2010 The Influence of Blade Curvature and Helical
Blade Twist on the Performance of a Vertical-Axis Wind Turbine, in 48th AIAA Aerospace
Sciences Meeting Including the New Horizons Forum and Aerospace Exposition. (Orlando,
-0,7
0
0,7
-1,5 0 1,5
u
y/R
x/D=0
x/D=0.5
x/D=1
x/D=2
-0,7
0
0,7
-1,5 0 1,5
u
y/R
x/D=0
x/D=0.5
x/D=1
x/D=2
The Science of Making Torque from Wind (TORQUE 2016) IOP PublishingJournal of Physics: Conference Series 753 (2016) 022050 doi:10.1088/1742-6596/753/2/022050
10

Florida, USA)
[8] Paraschivoiu I 2002 Wind Turbine Design With Emphasis on Darrieus Concept Polytechnic
International Press, Canada
[9] Strickland J H, Smith T and Sun K 1981 A Vortex Model of the Darrieus Turbme: An Analytical
and Experimental Study Technical Report No. SAND81-7017 Sandia National Laboratories
[10] Oler J W, Strickland J H, Im B J and Graham G H 1983 Dynamic Stall Regulation of the
Darrieus Turbine Technical Report No. SAND83-7029 Sandia National Laboratories
[11] Laneville A and Vittecoq P 1986 Dynamic Stall: The Case of the Vertical Axis Wind Turbine
Journal of Solar Energy Engineering 108 141-145
[12] Ferreira C, van Bussel G W, van Kuik G M, Scarano F 2011 On the Use of Velocity Data for
Load Estimation of a VAWT in Dynamic Stall Journal of Solar Energy Engineering 133(1)
011006-011006-8
[13] Allet A, Halle S and Paraschivolu I 1999 Numerical Simulation of Dynamic Stall Around an
Airfoil in Darrieus Motion Journal of Solar Energy Engineering 121 69-76
[14] Hansen M O L and Søresen D N 2001 CFD model for Vertical Axis Wind Turbine. In Wind
Energy for the New Millennium-Proceedings of the European Wind Energy Conference.
(Copenhagen, Denmark)
[15] Gretton G I, Bruce T and Ingram D M 2009 Hydrodynamic modelling of a vertical axis tidal
current turbine using CFD. Proceedings of the 8th European Wave and Tidal Energy
Conference. (Uppsala, Sweden)
[16] Marsh P, Ranmuthugala D, Penesis I and Thomas G 2013 Performance Predictions of a
Straight-bladed Vertical Axis Turbine Using Double-multiple Streamtube and
Computational Fluid Dynamics Models The Journal of Ocean Technology 8(1) 86-103
[17] Menter F R and Egorov Y 2010 The Scale-Adaptive Simulation Method for Unsteady Turbulent
Flow Predictions. Part 1: Theory and Model Description Flow Turbulence and Combustion
85 113-138
[18] Gauthier E, Kinsey T and Dumas G 2013 RANS versus Scale-Adaptive Turbulence Modeling
for Engineering Prediction of Oscillating-Foils Turbines. 21th Annual Conference of the
CFD Society of Canada. (Sherbrooke, Canada)
[19] Rogowski K and Maroński R 2015 CFD Computation of the Savonius Rotor Journal of
Theoretical and Applied Mechanics 53 (1) 37-45
[20] Rogowski K 2014 Analysis of Performance of the Darrieus Wind Turbines Ph.D. Thesis,
Warsaw University of Technology, Warsaw
The Science of Making Torque from Wind (TORQUE 2016) IOP PublishingJournal of Physics: Conference Series 753 (2016) 022050 doi:10.1088/1742-6596/753/2/022050
11


![Aeroelastic Stability Analysis of a Darrieus Wind Turbine · [GI] = diagonal generalized mass matrix [2EUNGI] ... [GIUN2] = diagonal generalized stiffness matrix E = structural damping](https://img.pdfslide.us/doc/110x75/5e3f3d2f6e7f9028a159bcde/aeroelastic-stability-analysis-of-a-darrieus-wind-turbine-gi-diagonal-generalized.jpg)