Embed Size (px)
Citation preview
D. Koop, CIS 602-02, Fall 2015
Scalable Data Analysis (CIS 602-02)
Graph Analytics
Dr. David Koop
Spark Streaming Run a streaming computation as a series of very small, deterministic batch jobs
11!
• Batch sizes as low as ½ sec, latency of about 1 sec
• Potential for combining batch processing and streaming processing in the same system Spark&
Spark&Streaming&
batches(of(X(seconds(
live(data(stream(
processed(results(
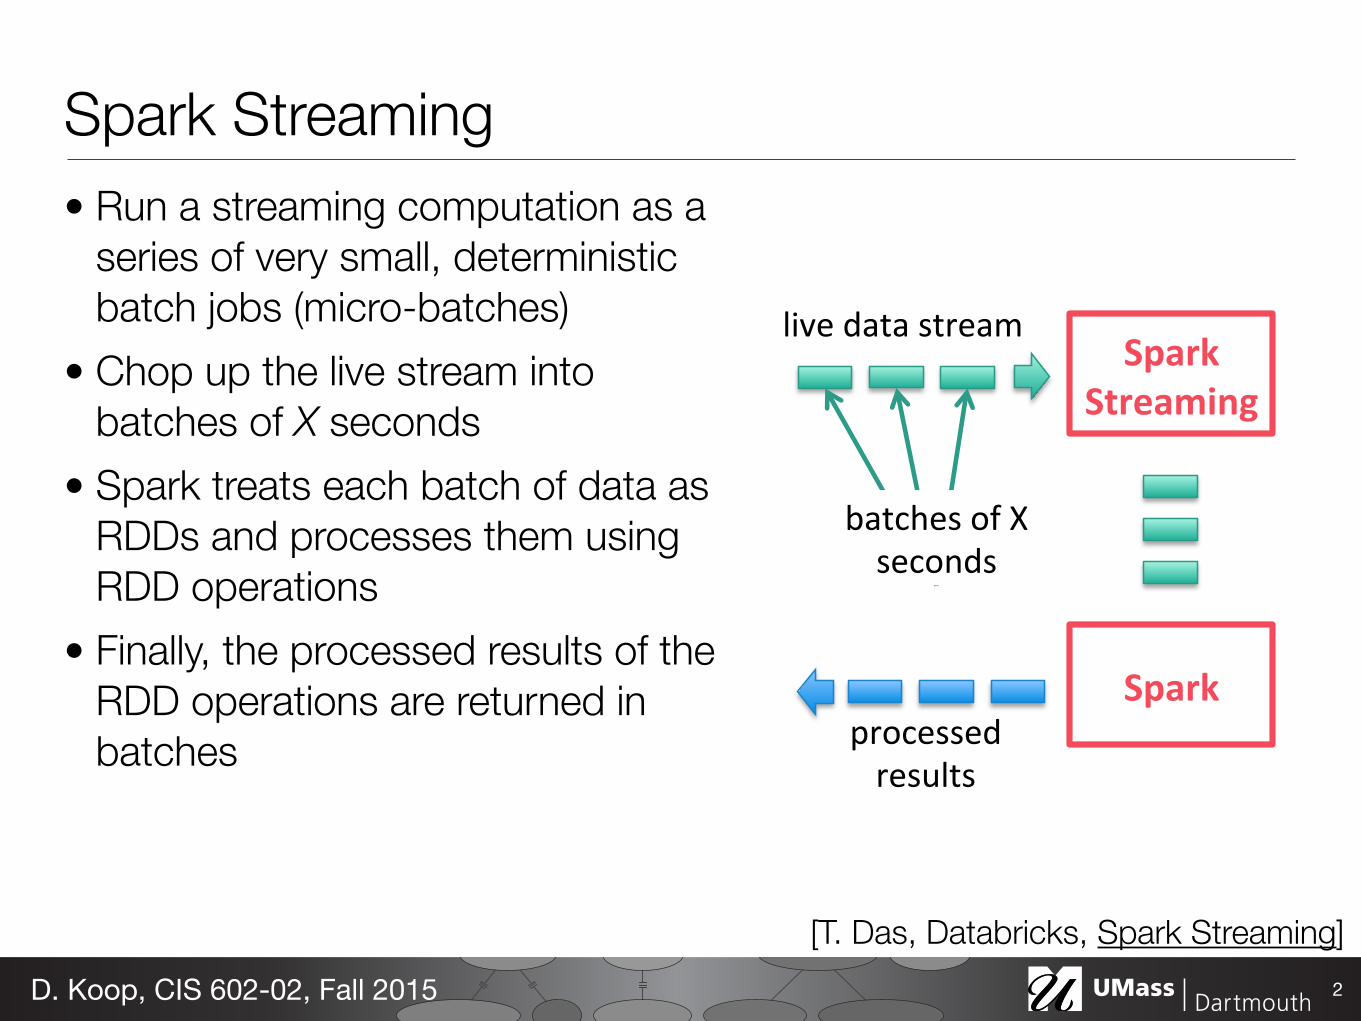
Spark Streaming• Run a streaming computation as a
series of very small, deterministic batch jobs (micro-batches)
• Chop up the live stream into batches of X seconds
• Spark treats each batch of data as RDDs and processes them using RDD operations
• Finally, the processed results of the RDD operations are returned in batches
2D. Koop, CIS 602-02, Fall 2015
[T. Das, Databricks, Spark Streaming]
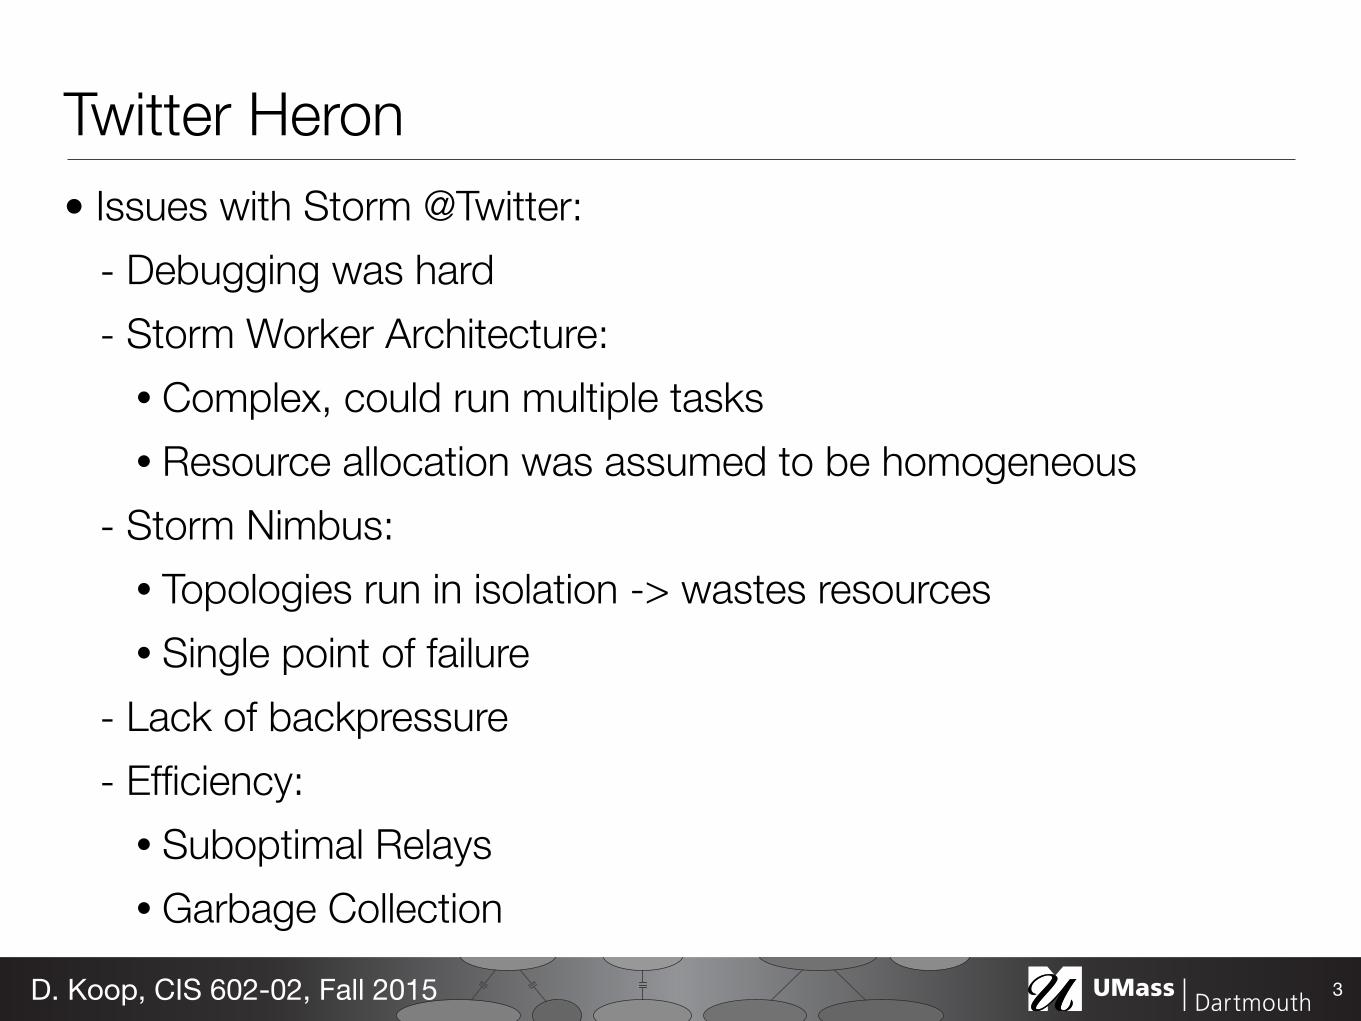
Twitter Heron• Issues with Storm @Twitter:
- Debugging was hard - Storm Worker Architecture:
• Complex, could run multiple tasks • Resource allocation was assumed to be homogeneous
- Storm Nimbus: • Topologies run in isolation -> wastes resources • Single point of failure
- Lack of backpressure - Efficiency:
• Suboptimal Relays • Garbage Collection
3D. Koop, CIS 602-02, Fall 2015
4
with a better architecture/system we have the potential to achieve significant savings in resources that are consumed when running Storm topologies.
4. Design Alternatives Considering the aforementioned issues, we weighed the options of whether to extend Storm, or to use another existing system, or to write a new system.
Since the issues discussed in Section 3 are fundamental to Storm, fixing them in Storm would have required extensive rewrite of the core components. At a high level, Storm organizes topologies as a bunch of queues that move data around, and changing this basic architectural block is hard. Modifying this existing system in such a fundamental way would have been inflexible, and potentially required much longer development cycles. The next option was to consider using another existing open-source solution, such as Apache Samza [2] or Spark Streaming [18]. However, there are a number of issues with respect to making these systems work in its current form at our scale. In addition, these systems are not compatible with Storm’s API. Rewriting the existing topologies with a different API would have been time consuming resulting in a very long migration process. Also note that there are different libraries that have been developed on top of the Storm API, such as Summingbird [8], and if we changed the underlying API of the streaming platform, we would have to change other components in our stack. Thus, we concluded that our best option was to rewrite the system from ground-up, reusing and building on some of the existing components within Twitter.
5. Heron In this section, we briefly describe the Heron data model, API, and the various Heron components.
5.1 Data Model and API A key design goal for Heron is to maintain compatibility with the Storm API. Thus, the data model and API for Heron are identical to that of Storm [20]. Like Storm, Heron runs topologies. A topology is a directed acyclic graph of spouts and bolts. Like Storm, spouts generate the input tuples that are fed into the topology, and bolts do the actual computation.
A Heron topology is equivalent to a logical query plan in a database system. Such a logical plan is translated into a physical plan before actual execution. As a part of the topology, a programmer specifies the number of tasks for each spout and each
bolt (i.e. the degree of parallelism), and how the data is partitioned as it moves across the spout and the bolt tasks (grouping). The actual topology, parallelism specification for each component, and the grouping specification, constitute the physical execution plan that is executed on the machines.
Finally, Heron’s tuple processing semantics are similar to that of Storm, and include the following:
x At most once – No tuple is processed more than once, although some tuples may be dropped, and thus may miss being analyzed by the topology.
x At least once – Each tuple is guaranteed to be processed at least once, although some tuples may be processed more than once, and may contribute to the result of the topology multiple times.
5.2 Architecture overview Since the key factors driving the need for Heron are to ease the task of manageability, improve developer productivity, and improve the predictability of performance, we had to make careful decisions about how to architect the different components of the system considering clean abstractions for various interconnected modules, and ensuring an architecture that can operate at Twitter’s scale.
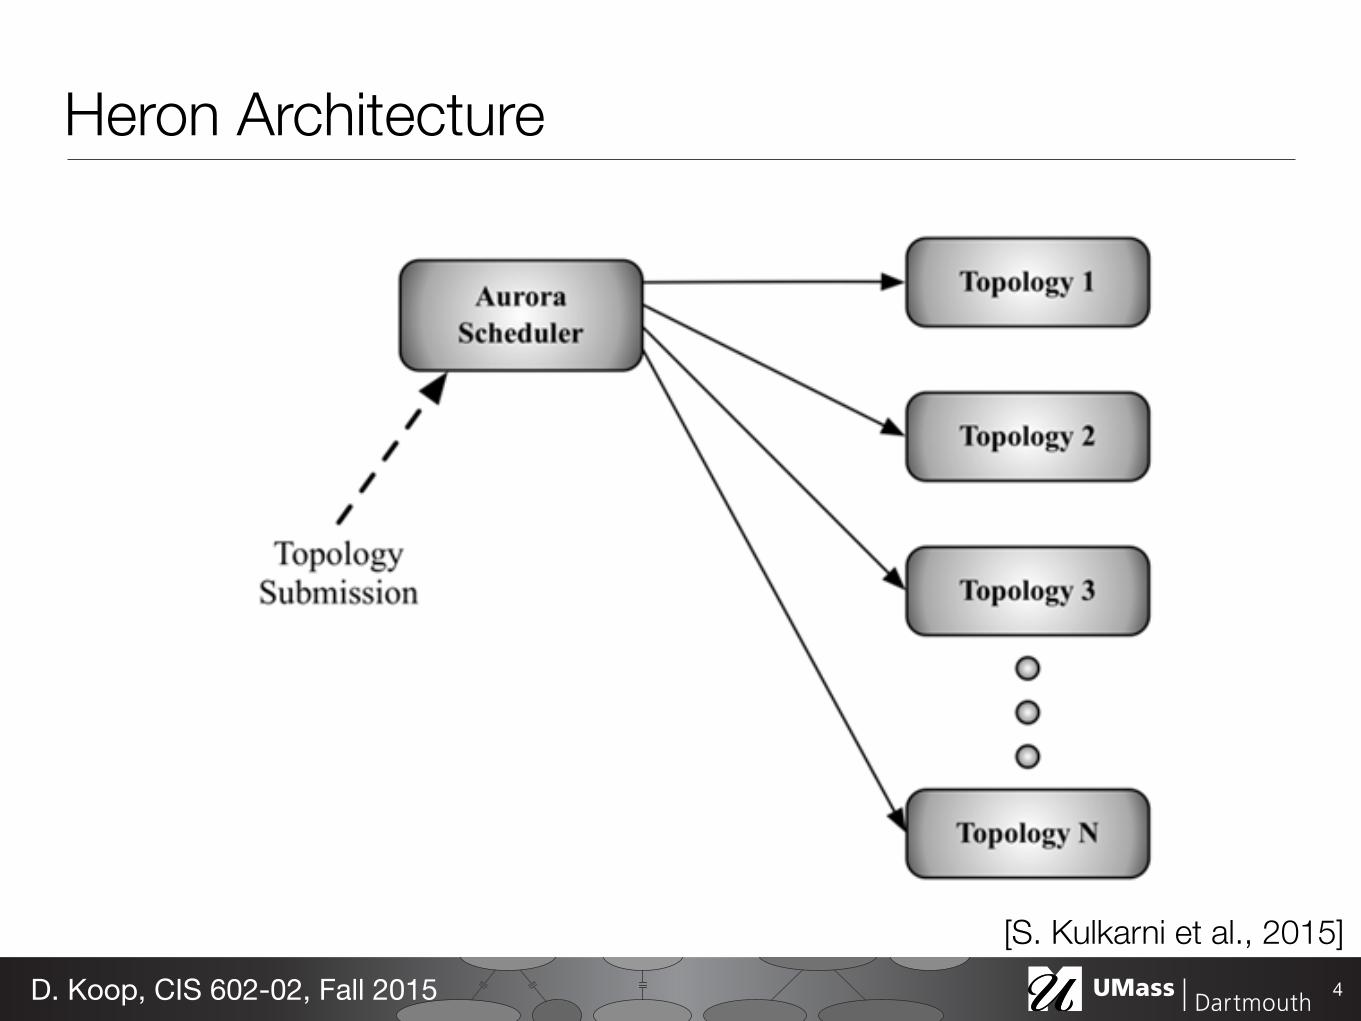
The overall architecture for Heron is shown in Figure 3. Users employ the Heron (spouts/bolts programming) API to create and deploy topologies to the Aurora scheduler, using a Heron command line tool. Aurora [1] is a generic service scheduler that runs as a framework on top of Mesos [11]. However, our architecture implements a scheduler abstraction that facilitates running Heron on other schedulers such as YARN, Mesos, and ECS (Amazon EC2 Docker Container Service). This design is a departure from Storm, where Nimbus (which is an integral component of Storm) was used for scheduling. Since Twitter’s homegrown Aurora scheduler and other open-source schedulers (e.g. YARN) have become sophisticated, we made the conscious choice of working with these schedulers rather than implementing another one.
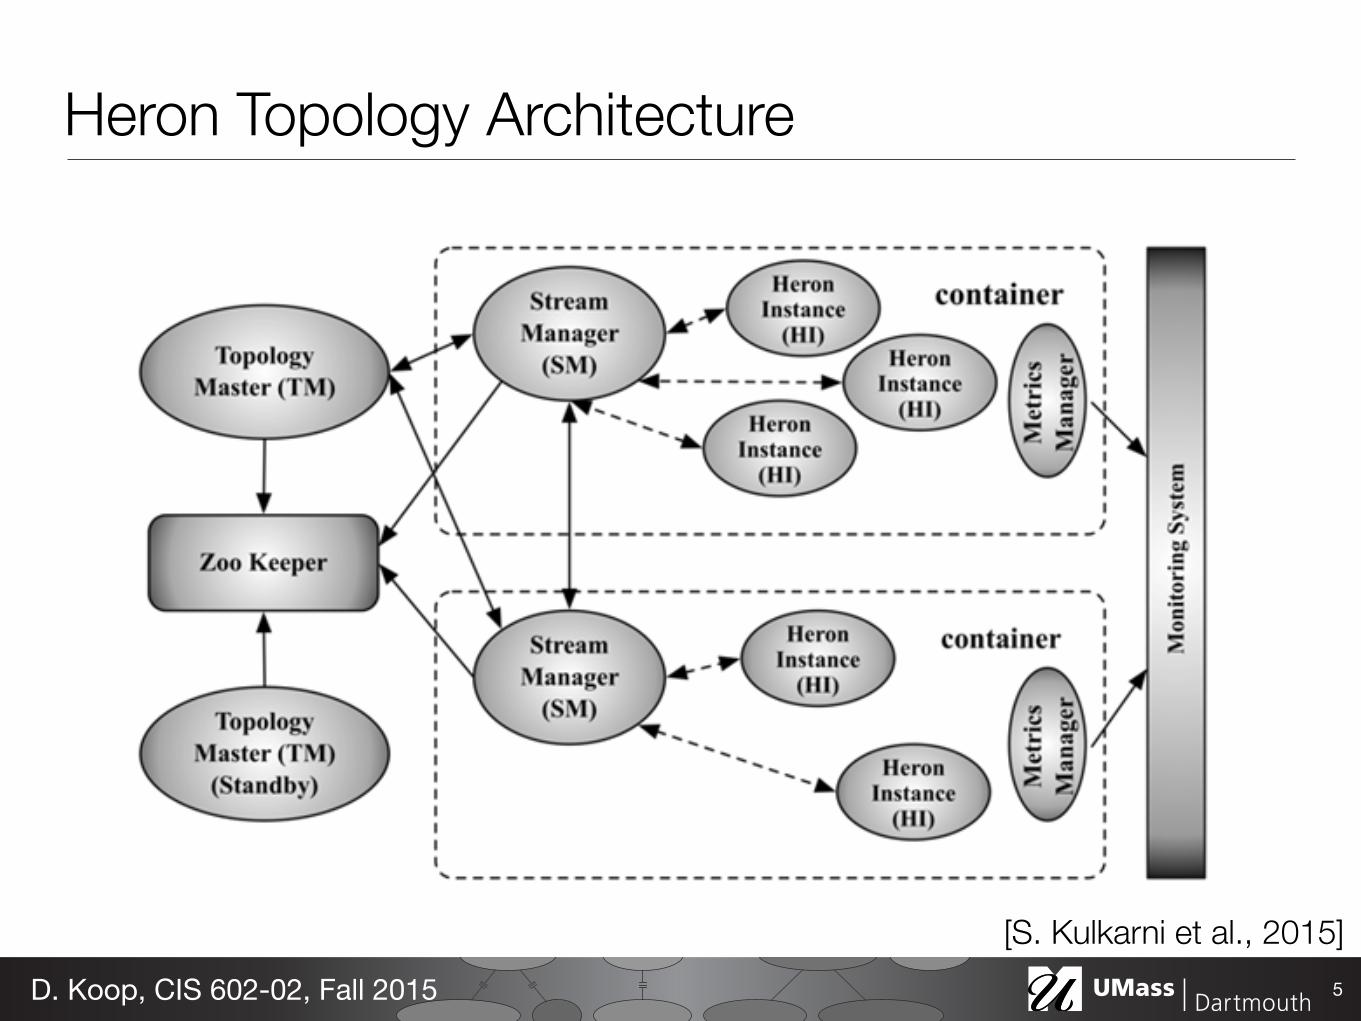
Each topology is run as an Aurora job consisting of several containers, as shown in Figure 4. The first container runs a process called the Topology Master. The remaining containers each run a Stream Manager, a Metrics Manager, and a number of processes called Heron Instances (which are spouts/bolts that run user logic code). Multiple containers can be launched on a single
Figure 3: Heron Architecture Figure 4: Heron Topology Architecture
242
Heron Architecture
4D. Koop, CIS 602-02, Fall 2015
[S. Kulkarni et al., 2015]
4
with a better architecture/system we have the potential to achieve significant savings in resources that are consumed when running Storm topologies.
4. Design Alternatives Considering the aforementioned issues, we weighed the options of whether to extend Storm, or to use another existing system, or to write a new system.
Since the issues discussed in Section 3 are fundamental to Storm, fixing them in Storm would have required extensive rewrite of the core components. At a high level, Storm organizes topologies as a bunch of queues that move data around, and changing this basic architectural block is hard. Modifying this existing system in such a fundamental way would have been inflexible, and potentially required much longer development cycles. The next option was to consider using another existing open-source solution, such as Apache Samza [2] or Spark Streaming [18]. However, there are a number of issues with respect to making these systems work in its current form at our scale. In addition, these systems are not compatible with Storm’s API. Rewriting the existing topologies with a different API would have been time consuming resulting in a very long migration process. Also note that there are different libraries that have been developed on top of the Storm API, such as Summingbird [8], and if we changed the underlying API of the streaming platform, we would have to change other components in our stack. Thus, we concluded that our best option was to rewrite the system from ground-up, reusing and building on some of the existing components within Twitter.
5. Heron In this section, we briefly describe the Heron data model, API, and the various Heron components.
5.1 Data Model and API A key design goal for Heron is to maintain compatibility with the Storm API. Thus, the data model and API for Heron are identical to that of Storm [20]. Like Storm, Heron runs topologies. A topology is a directed acyclic graph of spouts and bolts. Like Storm, spouts generate the input tuples that are fed into the topology, and bolts do the actual computation.
A Heron topology is equivalent to a logical query plan in a database system. Such a logical plan is translated into a physical plan before actual execution. As a part of the topology, a programmer specifies the number of tasks for each spout and each
bolt (i.e. the degree of parallelism), and how the data is partitioned as it moves across the spout and the bolt tasks (grouping). The actual topology, parallelism specification for each component, and the grouping specification, constitute the physical execution plan that is executed on the machines.
Finally, Heron’s tuple processing semantics are similar to that of Storm, and include the following:
x At most once – No tuple is processed more than once, although some tuples may be dropped, and thus may miss being analyzed by the topology.
x At least once – Each tuple is guaranteed to be processed at least once, although some tuples may be processed more than once, and may contribute to the result of the topology multiple times.
5.2 Architecture overview Since the key factors driving the need for Heron are to ease the task of manageability, improve developer productivity, and improve the predictability of performance, we had to make careful decisions about how to architect the different components of the system considering clean abstractions for various interconnected modules, and ensuring an architecture that can operate at Twitter’s scale.
The overall architecture for Heron is shown in Figure 3. Users employ the Heron (spouts/bolts programming) API to create and deploy topologies to the Aurora scheduler, using a Heron command line tool. Aurora [1] is a generic service scheduler that runs as a framework on top of Mesos [11]. However, our architecture implements a scheduler abstraction that facilitates running Heron on other schedulers such as YARN, Mesos, and ECS (Amazon EC2 Docker Container Service). This design is a departure from Storm, where Nimbus (which is an integral component of Storm) was used for scheduling. Since Twitter’s homegrown Aurora scheduler and other open-source schedulers (e.g. YARN) have become sophisticated, we made the conscious choice of working with these schedulers rather than implementing another one.
Each topology is run as an Aurora job consisting of several containers, as shown in Figure 4. The first container runs a process called the Topology Master. The remaining containers each run a Stream Manager, a Metrics Manager, and a number of processes called Heron Instances (which are spouts/bolts that run user logic code). Multiple containers can be launched on a single
Figure 3: Heron Architecture Figure 4: Heron Topology Architecture
242
Heron Topology Architecture
5D. Koop, CIS 602-02, Fall 2015
[S. Kulkarni et al., 2015]
6
size goes below the low water mark. The rationale for this design is to prevent a topology from rapidly oscillating between going into and coming out of the backpressure mitigation mode.
A consequence of this design is that once a tuple is emitted from the spout, Heron does not drop it, except during process or machine failure scenarios. This behavior makes tuple failures more deterministic.
When a topology is in backpressure mode, it goes as fast as the slowest component. If this situation continues to persist for a while, it could lead to data building up in the “source” queues from which the spout reads the data. Depending on the topology, spouts can be configured to drop older data.
5.5 Heron Instance The main work for a spout or a bolt is carried out in the Heron instances (HIs). Unlike the Storm worker, each HI is a JVM process, which runs only a single task of the spout or the bolt. Such a design allows us to easily debug/profile either a spout or bolt, since the developer can easily see the sequence of events and logs that originate from a HI.
Note that since the complexity of data movement has been moved to the SMs, it easy for us to consider writing native HIs in other languages in the future.
To implement the HIs, we considered two designs: one using a single thread and the other using two threads. Next, we describe these two designs.
5.5.1 Single-threaded approach In the single-threaded design, a main thread maintains a TCP communication channel to the local SM and waits for tuples. Once a tuple arrives, the user logic code is invoked in the same thread. If the user logic code program generates an output tuple, it is buffered. Once the buffer exceeds a certain threshold, it is delivered to the local SM.
While this approach has the advantage of simplicity, it has several disadvantages, as the user code can potentially block due to a variety of reasons, including:
x Invoking the sleep system call for a finite duration of time x Using read/write system calls for file or socket I/O x Calling thread synchronization primitives
We implemented this approach and realized that such blocking is not desirable for the required periodic activities such as metrics reporting. Since the duration of blocking could potentially vary, it leads to unpredictable behavior. If the metrics are not collected and sent timely, one cannot reliably troubleshoot whether an HI is in a “bad” state.
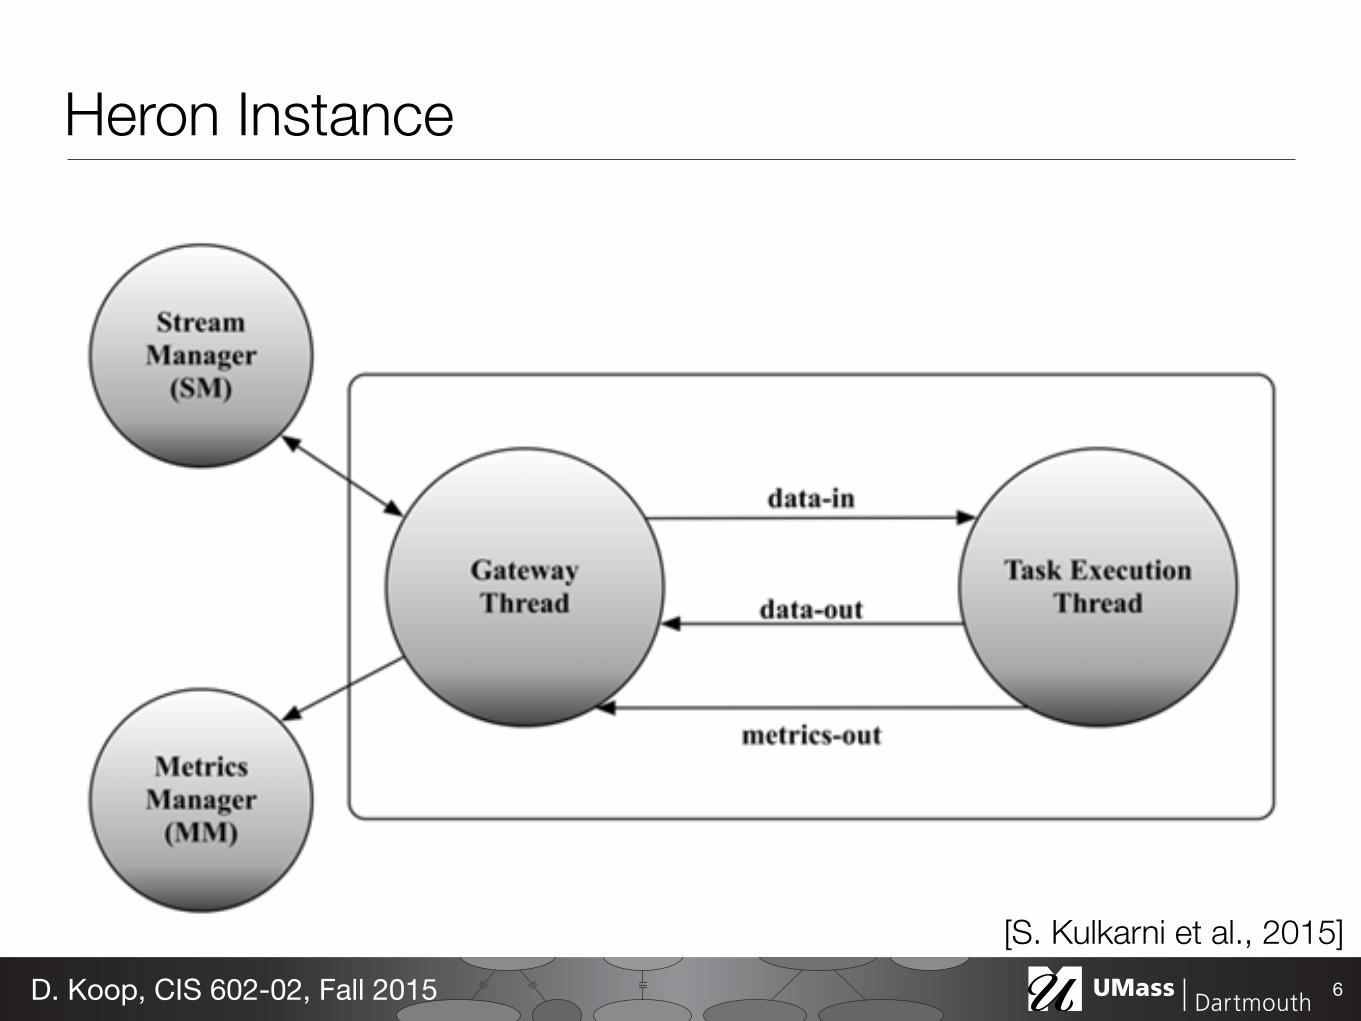
5.5.2 Two-threaded approach In this design, the HIs have two threads namely, a Gateway thread and a Task Execution thread as shown in Figure 5. The Gateway thread is responsible for controlling all the communication and data movement in and out from the HI. It maintains TCP connections to the local SM and the metrics manager. It is also responsible for receiving incoming tuples from the local SM. These tuples are sent to the Task Execution thread for processing.
The Task Execution thread runs user code. When the task execution thread is started, it executes the “open” or “prepare” method depending upon whether the instance is executing a spout or a bolt, respectively. In the case of a bolt, when tuples arrive, the task execution thread invokes the “execute” method with the incoming tuple for processing. In the case of a spout, it repeatedly calls the “nextTuple” method to fetch data from the source, and then injects this data as tuples into the topology. The emitted tuples from either spout or bolt are sent to the Gateway thread, which forwards the tuples to the local SM. In addition to processing tuples, the Task Execution thread collects various metrics such as the number of tuples executed, the number of tuples emitted, the number of tuples acknowledged, and the latency experienced during the processing of tuples.
The Gateway thread and the Task Execution thread communicate between themselves using three unidirectional queues, as shown in Figure 5. The Gateway thread uses the data-in queue to push tuples to the Task Execution thread for processing. The Task Execution thread uses the data-out queue to send tuples to the Gateway thread (for sending to other parts of the topology). The metrics-out queue is used by the Task Execution thread to pass the collected metrics to the Gateway thread.
The data-in and the data-out queues are bounded in size. The Gateway Execution thread stops reading from the local SM when the data-in queue exceeds this bound. This action triggers the backpressure mechanism at the local SM. Similarly, when items in the data-out queue exceed the bound, the Gateway thread can
Figure 5: Heron Instance Figure 6: Heron Services for Production
244
Heron Instance
6D. Koop, CIS 602-02, Fall 2015
[S. Kulkarni et al., 2015]
10
for Heron, tuple failures can happen only due to timeouts. We used 30 seconds as the timeout interval in both cases.
7.3 Word Count Topology In these set of experiments, we used a simple word count topology. In this topology, the spout tasks generate a set of random words (~175k words) during the initial “open” call, and during every “nextTuple” call. In each call, each spout simply picks a word at random and emits it. Hence spouts are extremely fast, if left unrestricted. Spouts use a fields grouping for their output, and each spout could send tuples to every other bolt in the topology. Bolts maintain an in-memory map, which is keyed by the word emitted by the spout and updates the count when it receives a tuple. This topology is a good measure of the overhead introduced by either Storm or Heron since it does not do significant work in its spouts and bolts. For each set of experiments, we varied the number of Storm spout/bolt tasks, Heron spout/bolt instances, Storm workers, and Heron containers as shown below in Table 1.
Table 1: Experimental setup for the Word Count topology
Components Expt. #1 Expt. #2 Expt. #3 Expt. #4Spout 25 100 200 500 Bolt 25 100 200 500 # Heron containers 25 100 200 500 # Storm workers 25 100 200 500
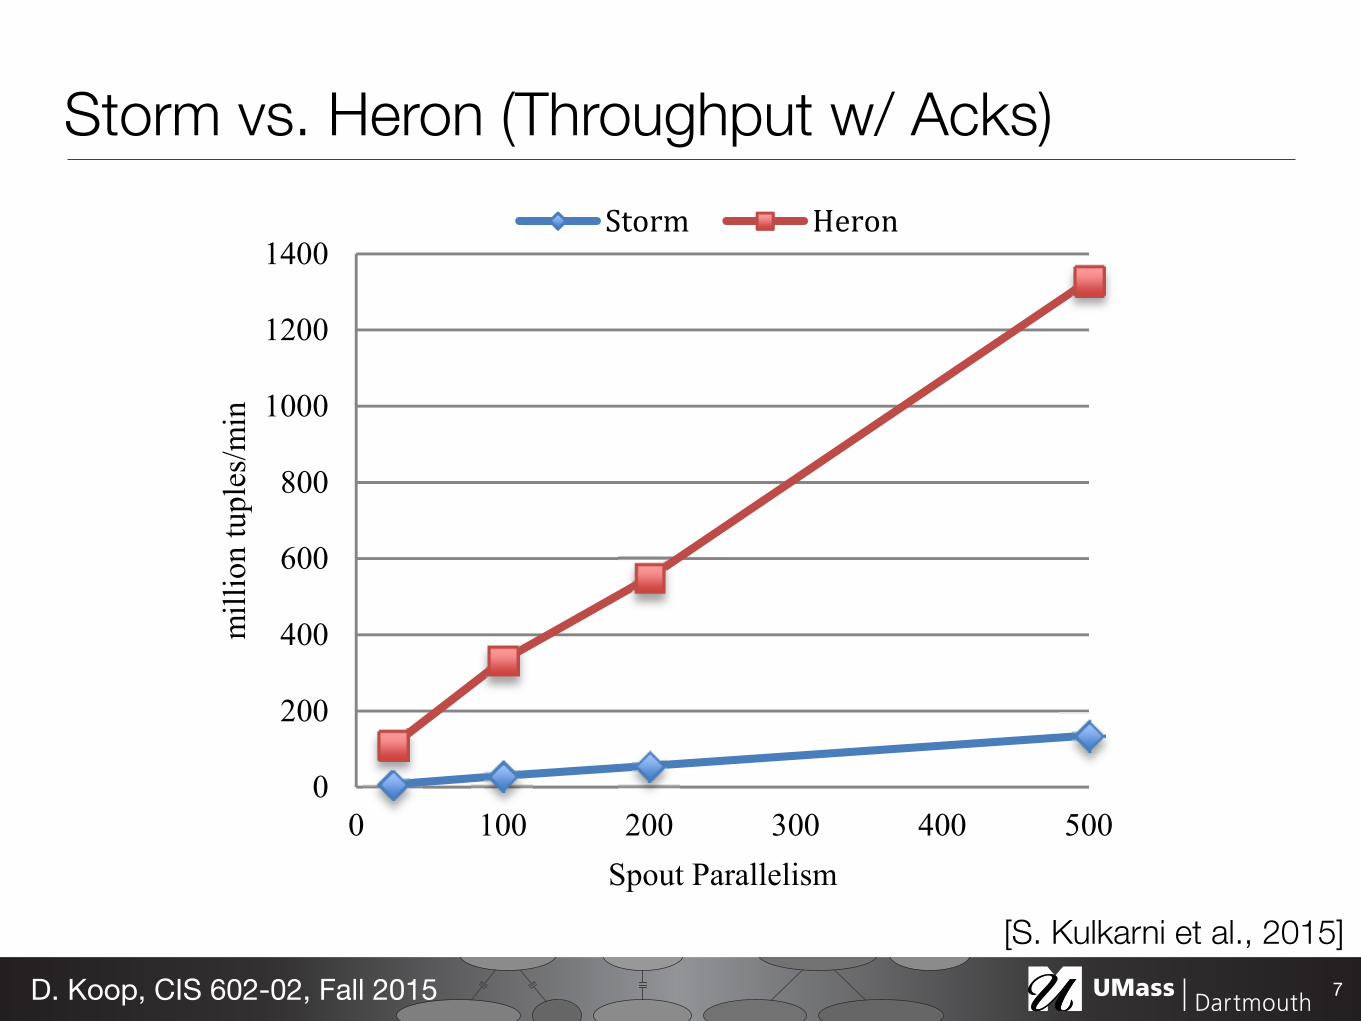
7.3.1 Acknowledgements Enabled In these experiments, the word count topology is enabled to receive acknowledgements. We measured the topology throughput, end-to-end latency, and CPU usage, and plot these results in Figure 9, Figure 10, and Figure 11 respectively. Each of these figures has four points on each line, corresponding to the four experimental setup configurations that are shown in Table 1. As shown in Figure 9, the topology throughput increases linearly for both Storm and Heron. However, for Heron, the throughput is 10-14X higher than that for Storm in all these experiments.
The end-to-end latency graph, plotted in Figure 10, shows that the latency increases far more gradually for Heron than it does for Storm. Heron latency is 5-15X lower than that of the Storm. There are many bottlenecks in Storm, as the tuples have to travel through multiple threads inside the worker and pass through multiple queues. (See Section 3.) In Heron, there are several buffers that a tuple has to pass through as they are transported from one Heron Instance to another (via the SMs). Each buffer adds some latency since tuples are transported in batches. In normal cases, this latency is approximately 20ms, and one would expect the latency to be of the same value since the tuples in this topology have the same number of hops. However, in this topology, the latency increases as the number of containers increase. This increase is a result of the SMs becoming a bottleneck, as they need to maintain buffers for each connection to the other SMs, and it takes more time to consume data from more buffers. The tuples also live in these buffers for longer time given a constant input rate (only one spout instance per container). Figure 11 shows the aggregate CPU resources that are utilized across the entire cluster that is used for this topology, as reported
Figure 9: Throughput with acknowledgements Figure 10: End-to-end latency with acknowledgements
Figure 11: CPU usage with acknowledgements
0
200
400
600
800
1000
1200
1400
0 100 200 300 400 500
mill
ion
tupl
es/m
in
Spout Parallelism
Storm Heron
0
500
1000
1500
2000
2500
0 100 200 300 400 500
late
ncy
(ms)
Spout Parallelism
Storm Heron
0
500
1000
1500
2000
2500
0 100 200 300 400 500
# co
res
Spout Parallelism
Storm Heron
248
Storm vs. Heron (Throughput w/ Acks)
7D. Koop, CIS 602-02, Fall 2015
[S. Kulkarni et al., 2015]
Projects• Goals: understand a dataset, improve an analysis technique • Report: Structure like a research paper
- Introduction, Related Work, Description, Results, Discussion, Conclusion
- May be written as a notebook - 8-10 pages - Turn in via myCourses - Due Dec. 12
• Code: Turn in code via myCourses • Presentations: Dec. 12, 11:30am
8D. Koop, CIS 602-02, Fall 2015

Extra Credit Opportunity• User Study on a visualization technique • 15 points toward assignments • Sign-up sheets available
9D. Koop, CIS 602-02, Fall 2015
Assignment 3• Spark, EC2, and Natural Language Processing • Use Million Song Dataset • Sign up for EC2 if you have not already • Not late until Dec. 12
10D. Koop, CIS 602-02, Fall 2015
Spark EC2 Demo (Continued)
11D. Koop, CIS 602-02, Fall 2015
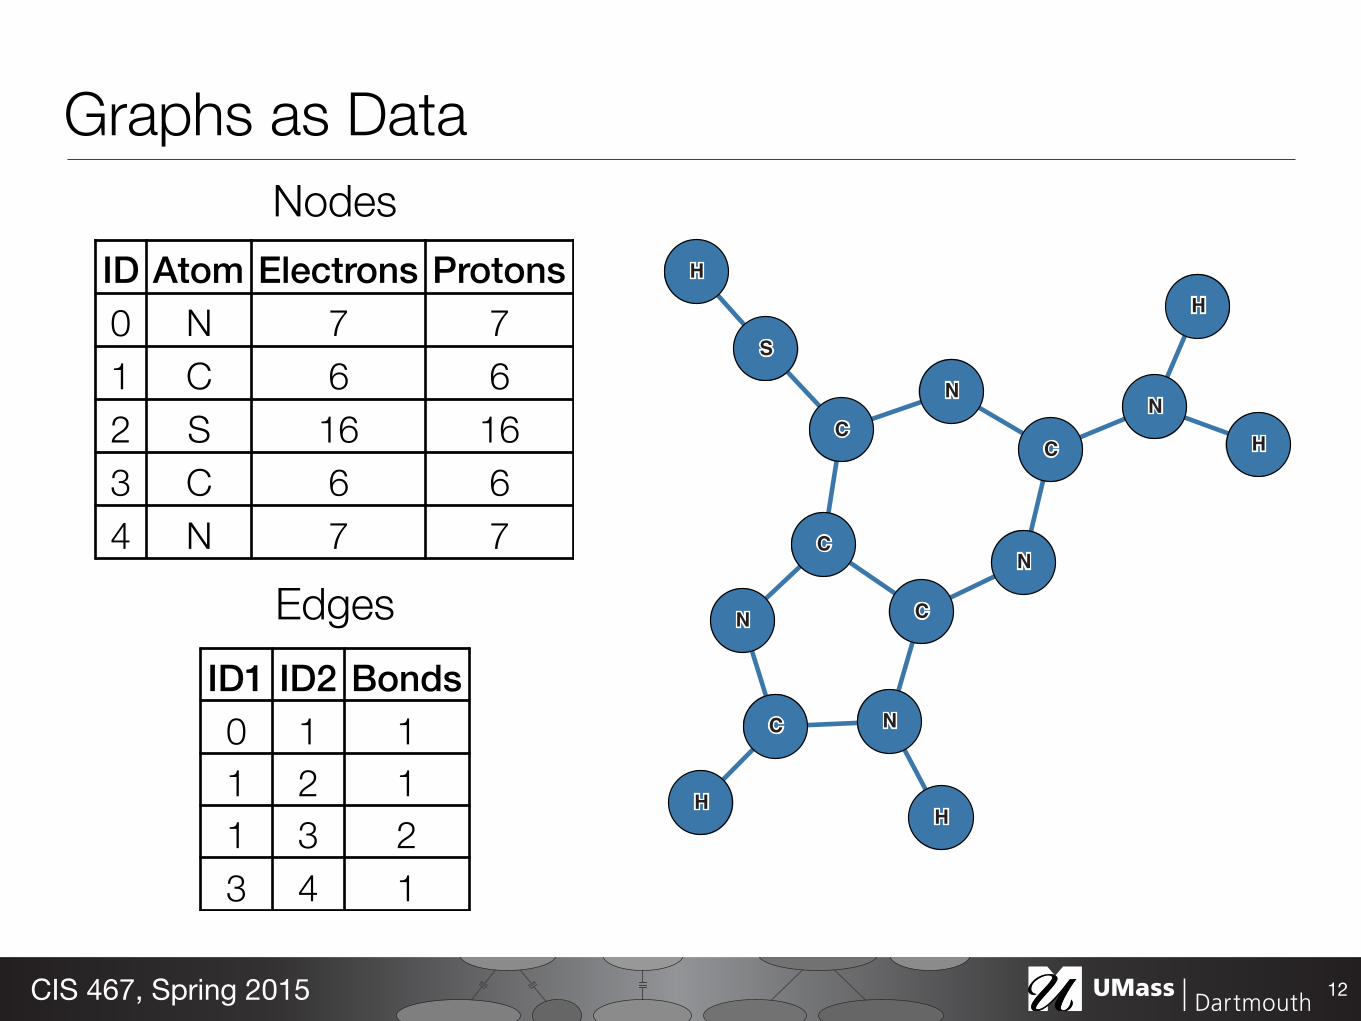
Graphs as Data
12CIS 467, Spring 2015
ID Atom Electrons Protons0 N 7 71 C 6 62 S 16 163 C 6 64 N 7 7
ID1 ID2 Bonds0 1 11 2 11 3 23 4 1
Nodes
Edges
SS
CC
CC
NN
CCNN
CC
NN
NNCC
NN
HH
HHHH
HH
HH
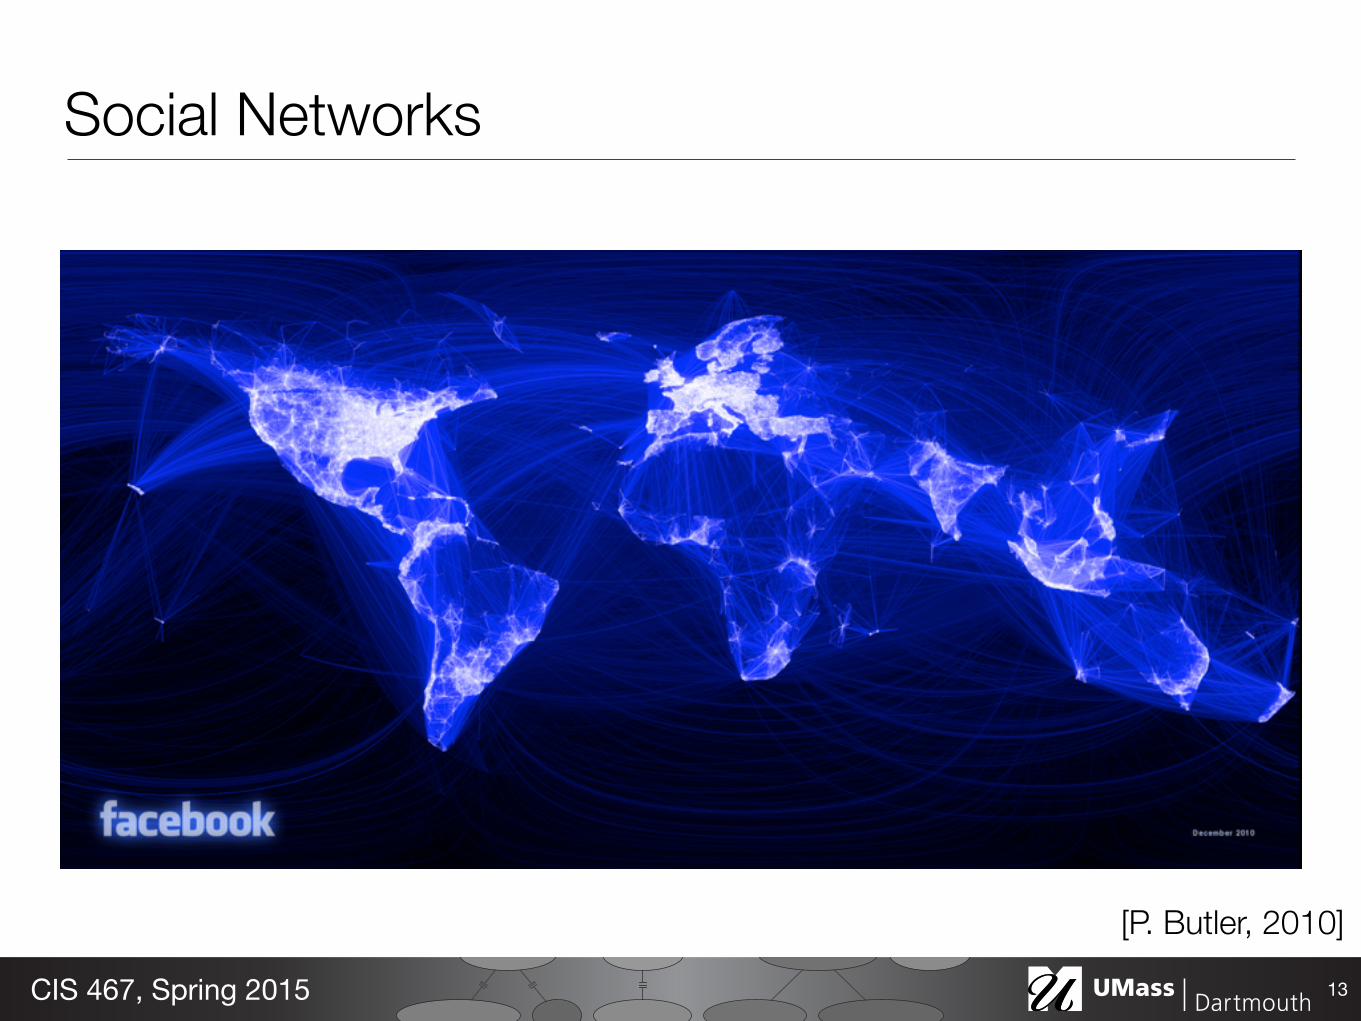
Social Networks
13CIS 467, Spring 2015
[P. Butler, 2010]
Graphs• "Every time someone visits news feed there are on average 1,500
potential stories from friends, people they follow and pages for them to see, and most people don’t have enough time to see them all" - Lars Backstrom, Facebook Engineer, 2013
14D. Koop, CIS 602-02, Fall 2015
D. Koop, CIS 602-02, Fall 2015
TAO: Facebook's Distributed Data Store for the Social Graph
N. Bronson, Z. Amsden, G. Cabrera, P. Chakka, P. Dimov,H. Ding, J. Ferris, A. Giardullo, S. Kulkarni, H. Li, M. Marchukov, D. Petrov, L. Puzar, Y. J. Song, V. Venkataramani
TAO• Reads much more frequent than writes • Most edge queries have empty results • Long-tail distribution
16D. Koop, CIS 602-02, Fall 2015
D. Koop, CIS 602-02, Fall 2015
GraphX: Unifying Data-Parallel and Graph-Parallel Analytics
J. Gonzalez
Next…• Reproducibility and Provenance • Work on Projects! • A3
18D. Koop, CIS 602-02, Fall 2015