Embed Size (px)
Citation preview

SCA PROPERTY GROUP First Half FY14 Results Presentation 14 February 2014
Coles, Sorrell TAS
For
per
sona
l use
onl
y
AGENDA
2
Overview of First Half FY14 Results
Financial Performance
Operational Performance
Key Priorities and Outlook
Questions
Appendices
1
4
5
2
3
6
For
per
sona
l use
onl
y

OVERVIEW OF FIRST HALF FY14 RESULTS Anthony Mellowes Chief Executive Officer
1
For
per
sona
l use
onl
y

FIRST HALF HIGHLIGHTS
4
Capital Management
Active Portfolio Management
$39.5m Distributable earnings 1
$1.59 NTA per unit 2
$145.7m Tasmanian acquisition 4
5.4 cents per unit Distribution paid to unitholders ³
88.5% Payout ratio 3
8.0% Portfolio weighted average cap rate 2
$43.0m Statutory net profit after tax 1
33.5% Gearing 2
97.1% Portfolio occupancy 2
1 For the six months ended 31-Dec-2013. 2 As at 31-Dec-2013. 3 Distribution in respect of the six months ended 31-Dec-2013 was paid on 30 January 2014. 4 Acquisition of the Tasmanian portfolio includes Claremont ($27.9m) which is expected to settle in October 2014. Disposals include Bright ($9.4m, settled on 10 February 2014) and Mildura ($22.4m, expected to settle in March 2014).
$75.7m of disposals 4
Financial Performance
For
per
sona
l use
onl
y

KEY ACHIEVEMENTS – DELIVERING ON STRATEGY
5
• Leasing team brought in-house during the half year period • Specialty vacancy has decreased to 11.1% (from 19.2% in December 2012) • We continue to achieve rent/sqm and incentive levels in line with our expectations
• 9.6% pa average MAT sales growth for Australian Supermarkets open more than 24 months, and 14.9% pa for stores open between 12 and 24 months (compared to market average comparable store sales growth of around 3-4% pa)
• 9 Anchors generating turnover rent as at 31-Dec-2013 (up from 3 as at 30-Jun-2013)
• Acquired a portfolio of seven quality neighbourhood shopping centres located in Tasmania for $145.7m (8.0% cap rate)
• Disposed of 7 small non-core assets for $75.7m (7.3% cap rate, $3.1m above book value)
• Refinancing and extension of debt facilities – Increased average term to maturity from 3.6 years to 4.0 years – Decreased weighted average cost of debt from 5.3% to 4.8% pa
• On-market buyback announced
• FY14 Distributable Earnings guidance increased to 12.3 cents per unit (“cpu”) (from 12.2 cpu), and FY14 Distribution guidance increased to 11.0 cpu (from 10.8 cpu). Guidance for FY14 is now 4.2% above the original PDS forecast (11.8 cpu), and our distribution guidance is 5.8% above the PDS forecast (10.4 cpu)
Earnings Guidance Upgraded
Strong Underlying Sales Growth
Active Portfolio Management
Specialty Leasing On Track
Capital Management
For
per
sona
l use
onl
y

FINANCIAL PERFORMANCE Mark Fleming Chief Financial Officer
2
For
per
sona
l use
onl
y

• Anchor gross rental includes $0.4m in turnover rent
• Other property income includes direct recoveries and casual mall leasing
• Rental guarantee receipts from Woolworths have begun to decline ahead of its expiry from December 2014 (rental guarantee “tail” for development properties will continue until FY17)
• Net interest expense will benefit in the second half from the debt refinancing announced in November 2013
• Structural vacancy allowance is set at 4% of gross fully-let specialty income
• Payout ratio is currently toward the lower end of our 85-95% band. We will look to increase the payout ratio over time as our specialty leasing progress continues
DISTRIBUTABLE EARNINGS For the Six Months Ended 31-Dec-2013
7
$m 1H14 Anchor gross rental 47.6 Specialty gross rental 26.4 Other property income 1.8 Gross property income 75.8 Rental guarantee receipts 7.0 Site access fee receipts 2.1 Rental income / receipts 84.9 Property operating expenses (20.5) Net property income / receipts 64.4 Corporate costs (5.4) Operating EBITDA 59.0 Net interest expense (12.7) Tax expense (1.2) Structural vacancy allowance (1.1) Straight lining of rental income (4.5) Distributable earnings 39.5 Number of Stapled Units (m) 648.6 Distributable Earnings per unit (cents) 6.1 Distribution per unit (cents) 5.4 Payout ratio 88.5% Tax deferred ratio 14.3%
A reconciliation between Distributable Earnings and Statutory Net Profit After Tax is set out in the Appendix.
For
per
sona
l use
onl
y

• Value of investment properties is up by $133.9m, due to: – Acquisitions ($146.3m)(1); – Work in progress on DMAs ($12.2m); – Positive re-valuations ($4.8m); and – NZ$ appreciation ($15.4m); less – Divestments (-$43.9m)(1) ; and – Other (-$0.9m).
• NTA per unit increased to $1.59 primarily due to positive property revaluations and a stronger NZ dollar
• Management Expense Ratio (“MER”) has reduced due to lower registry costs and increased scale of the underlying asset base (a benefit of the internalised management structure)
• Minimal capex spend required due to the young age of the assets in the portfolio
BALANCE SHEET As at 31-Dec-2013
8
$m 31-Dec-2013 30-Jun-2013 Change
Cash 11.8 15.4 (3.6)
Investment properties 1,638.3(2) 1,504.4 133.9
Other assets 25.0 11.4 13.6
Total assets 1,675.1 1,531.2 143.9
Debt (562.0) (450.3) (111.7)
Other liabilities (43.6) (35.9) (7.7)
Accrued distribution (35.0) (36.0) 1.0
Total liabilities (640.6) (522.2) (118.4)
Net tangible assets 1,034.5 1,009.0 25.5
Number of stapled units (m) 648.6 642.4 6.2
NTA per unit ($) $1.59 $1.57 $0.02
Corporate costs (annualised) 10.8 10.7 0.1
MER (%) 0.65% 0.71% (0.06%)
Capex $0.0m $0.2m ($0.2m)
(1) Acquisitions excludes Claremont, but includes the remaining balance of development properties acquired from Woolworths during the period (Lilydale, St James and Kwinana Dan Murphy’s). Divestments excludes Bright and Mildura. (2) Includes properties held for sale (Bright and Mildura $31.8m). Excludes Claremont ($27.9m).
For
per
sona
l use
onl
y

• Gearing of around 33.5%(1) is within target range of 25% to 40%
• We expect gearing to reduce following the sale settlements for Bright and Mildura, before increasing to between 34% and 35% by October 2014 following the completion of the Claremont and Greystanes developments (excluding any buyback impact)
• On-market buyback announced for up to 5% of issued capital at a price of up to NTA (currently $1.59 per unit) over the next 12 months
• November 2013 debt refinancing resulted in weighted average cost of debt reducing to 4.8% pa (from 5.3% pa), weighted average term to maturity increasing to 4.0 years (from 3.6 years), and no debt expiry until December 2016
• Debt capital markets alternatives are being considered for the second half of calendar year 2014 to increase our weighted average debt maturity profile further. This may increase our weighted average cost of debt in FY15
• Well within debt covenant limits of less than 50% gearing and interest cover ratio greater than 2.0x (currently 4.2x)
CAPITAL MANAGEMENT As at 31-Dec-2013
9
$m 31-Dec-2013 30-Jun-2013 Facility limit 600.0 550.0 Drawn debt (net of cash) 554.3 437.3 Gearing(1) 33.5% 28.7% % debt fixed or hedged 64% 78% Weighted average cost of debt 4.8% 5.3% Average debt facility maturity (yrs) 4.0 3.6 Average fixed / hedged debt maturity (yrs) 2.9 3.4 Interest cover ratio 4.2x 4.3x
150 225 225
FY14 FY15 FY16 FY17 FY18 FY19
Debt Facilities Expiry Profile ($m)
(1) Gearing calculated per debt covenant which is based on net debt (including $5m bank guarantee) to total tangible assets less cash
For
per
sona
l use
onl
y
OPERATIONAL PERFORMANCE Anthony Mellowes Chief Executive Officer
3
For
per
sona
l use
onl
y

PORTFOLIO OVERVIEW Average age now 5.1 years
11
Assets As at 31-Dec-2013
Number of centres
Number of specialties
GLA (sqm)
Occupancy (% GLA)
Value (A$m) WALE (yrs)
Weighted average cap rate (%)
Freestanding 14 4 52,535 99.8% 174.2 16.0 7.88
Neighbourhood 53 553 273,653 97.1% 951.8 13.3 8.06
Sub-regional 6 288 131,943 96.1% 423.5 13.9 7.87
Total Completed Assets 73 845 458,131 97.1% 1,549.5 13.8 7.99
Assets Held for Sale 2 5 12,417 98.9% 31.8 18.7 7.85
Development / Other (2) 2 27 14,946
All Assets 77 877 485,494
NSW 20%
VIC 23%
QLD 15%
WA 10%
SA 10%
TAS 8%
NZ 13% Woolworths and
Countdown supermarkets 49%
Big W 8% Dan Murphy's 1%
Coles 3%
Target 1%
Kmart 1%
Specialties 37%
Tenants by Category (by gross rent) 1 Geographic Diversification (by value)
(1) Annualised excludes vacancies (2) Excludes Claremont
For
per
sona
l use
onl
y

12
• Strong growth from both the Australian and New Zealand supermarket tenants continues
• Supermarket sales growth is a key determinant of centre health, helping to drive specialty sales growth and specialty leasing progress
• Discount department stores had a relatively subdued Christmas trading period
SUPERMARKET SALES GROWTH
31-Dec-2013 30-Jun-2013
Number of Supermarkets Growth %
Number of Supermarkets Growth %
Open 12-24 Months 13 14.9% 16 15.9%
Open >24 Months 34 9.6% 19 8.1%
Source: SCA management estimates (1) We have 53 Australian supermarket tenants in total, 6 have been open for less than 12 months. (2) We have 14 New Zealand supermarket tenants in total, 4 have been open for less than 12 months. (3) For stores open > 24 months the growth rate is calculated as “Moving Annual Turnover” comparing the 12 months to 31 December 2012 to the 12 months to 31 December 2013. For stores open 12- 24 months the
growth rate is calculated by comparing the sales for the month of December 2012 to the month of December 2013.
Australian Supermarket Sales Growth (%) (1) , (3)
31-Dec-2013 30-Jun-2013
Number of Supermarkets Growth %
Number of Supermarkets Growth %
Open 12-24 Months 5 14.0% 5 14.0%
Open >24 Months 5 6.0% 4 0.6%
New Zealand Supermarket Sales Growth (%) (2) , (3)
For
per
sona
l use
onl
y

13
• As a result of strong sales growth, we are starting to see some anchor tenants achieve turnover rent thresholds
• Once turnover rent thresholds are achieved, rental income increases in line with store sales growth
• As at 31 December 2013, 9 anchors were generating turnover rent: – All 9 tenants are in Australia – 7 of these tenants are Supermarkets
• Approximately half of the Australian supermarkets expected to be generating turnover rent by the fifth anniversary of our listing (31 December 2017)
• For the six months to 31 December 2014, turnover rent was $0.4 million and this will increase over time
TURNOVER RENT THRESHOLDS
% of Turnover Threshold
TURNOVER RENT THRESHOLDS (Number of Australian Supermarkets)(1)
Number of Anchors Above Turnover Threshold (2)
3
As at30-Jun-2013
As at31-Dec-2013
Forecast for30-June-2014
Forecast for30-June-2015
Original Centres(Incl. DMA's)
Acquired Centres
>100%
75-100%
50-75%
<50%
10 Supermarkets
2 Supermarkets
15 Supermarkets
7 Supermarkets
Source: SCA management estimates (1) Australian Supermarkets open for more than 24 months (2) Management estimates
1
8 8 9
5 3
3
9 11
14
For
per
sona
l use
onl
y

• During the six months to 31 December 2013, we have
agreed terms on 40 leasing deals over 4,107 sqm of space, reducing our specialty vacancy to 11.1% of specialty GLA
• Leases continue to be completed with high quality tenants, and on financial terms that are in line with our budgets
• We anticipate a normalised level of specialty vacancy
for our portfolio will be in the range of 3% to 5%. This is in line with the current structural vacancy allowance of 4%
• Given the progress made to date, and the strong deal
pipeline, we are confident of reaching our stabilised occupancy level targets at the conclusion of the rental guarantee period
SPECIALITY LEASING PROGRESS We remain on track to achieve normalised occupancy levels prior to the end of the Woolworths Rental Guarantee period
14
Specialty Vacancy Target (% of Specialty GLA)
19.2%
14.0% 11.1% 3.0%
To 5.0%
11 Dec 2012 30 Jun 2013 31 Dec 2013 30 Jun 2014 Target 31 Dec2014
Structural vacancy allowance = 4%
For
per
sona
l use
onl
y

15
• Good progress has been made at our higher vacancy
centres: – Kwinana has had solid leasing progress, however
Stage 3 development is yet to be completed – Mount Gambier has progressed, centre maturity
will be reached in medium term – Margaret River and Lilydale have been trading for
less than 12 months but continue to show strong leasing activity
– 6 leases concluded at Treendale leaving one remaining vacancy
• Leasing strategies are being successfully executed across all assets, aided by strong anchor tenant growth
SPECIALTY LEASING STRATEGY Four centres account for around 40% of our specialty vacancy Specialty Vacancy Across the Portfolio (% of GLA)
14.0%
11.1%
19.2%
Other, 8.5% Other, 8.0% Other, 6.6%
Treendale, 1.5% Treendale, 1.0%
Margaret River, 1.1%
Margaret River, 0.8%
Lilydale, 0.7%
Murray Bridge, 1.4%
Mt Gambier, 1.7%
Mt Gambier, 1.4%
Mt Gambier, 1.1%
Kwinana, 5.3%
Kwinana, 2.5%
Kwinana, 1.9%
December 2012 June 2013 December 2013
For
per
sona
l use
onl
y

16
• Specialty sales continue to grow strongly across the
portfolio, driven mainly by non-discretionary spend • The performance reflects the location of our centres in
predominantly high growth catchments
• Average occupancy cost expected to decline as the portfolio continues to mature
• Bias towards high quality national tenants providing
secure income
SPECIALTY KEY METRICS
Specialty sales growth (MAT) % (Tenancies open for > 24 months) 7.9%
Average specialty occupancy cost % 9.9%
Specialty sales performance
National 59%
Local 41%
Specialty Lease Composition (as at 31 December 2013)
For
per
sona
l use
onl
y

17
Claremont Plaza(1) Sorrell Plaza
Kingston Plaza
Riverside
Shoreline Plaza
Newtown Plaza
Greenpoint Plaza
Launceston
Hobart
TASMANIAN ACQUISITION - NOVEMBER 2013 Represents SCA’s entry into the Tasmanian market
• Largest quality portfolio of neighbourhood shopping centres in Tasmania
• Greater geographic diversity
• 8% yield
• Mature assets with strong NOI growth profile
• Tasmanian retail sales growth robust
• Successful integration completed
(1) Claremont settlement is delayed until October 2014 following completion of development and refurbishment
For
per
sona
l use
onl
y

KEY PRIORITIES AND OUTLOOK Anthony Mellowes Chief Executive Officer
4
For
per
sona
l use
onl
y

STRATEGY Defensive, resilient cashflows to support secure distributions
19
Focus on convenience- based retail centres
Weighted to non-discretionary retail segment
Long leases to quality anchor tenants
Appropriate capital structure
Growth opportunities
For
per
sona
l use
onl
y

POTENTIAL EARNINGS GROWTH TRENDS Solid earnings growth expected over time
20
Near Term(FY14 - FY17)
Longer Term
(FY18 +)
Anchor Rental Growth
• Anchor rental income represents about 60% of overall gross property income• Approximately 50% of Anchor tenancies expected to be in turnover rent by December 2017• Once turnover thresholds are met, rent will grow in line with Anchors’ sales growth (say c.4% pa)• Around half of Anchor tenancy leases have a minimum 5% increase in base rent after 5 years
0 - 1% 1 - 2% +
Specialty and Other Rental Growth
• Specialty rental income represents about 40% of overall gross property income• Specialty leases generally have contracted growth of 3-4% pa• Positive specialty rent reversions expected on expiry due to relatively low rent / sqm at present• Other opportunities include casual mall leasing revenue and third-line revenue• Potential volatility in FY15 and FY16 due to roll-off of Woolworths Rental Guarantee
1 - 2% 1 -2% +
Expenses• As we increase in scale, Property Operating Expenses and Corporate Costs expected to grow at a slower rate than rental income• Interest Expense is continuing to be actively managed
0% 0%
Property Development
• Katoomba, Greystanes and Claremont currently under development• Further selective extensions of our existing centres are intended to be undertaken in the future, and some refurbishments of our more mature centres
Work in progress
Work in progress
Acquisitions• Selective acquisitions will continue to be made in the fragmented convenience-based shopping centre segment• Strong pipeline of new centre openings linked to population growth
Work in progress
Work in progress
1 - 3% + 2 - 4% +
Indicative Contribution to Earnings Growth Rate
(% pa)
Core
Bus
ines
sGr
owth
Initia
tives
Description and Assumptions
For
per
sona
l use
onl
y

KEY PRIORITIES AND OUTLOOK
21
Specialty Leasing Remains Key Priority
• Target is to reduce specialty vacancy to a range of 3% to 5% by December 2014
• If this is achieved, the structural vacancy allowance will be sufficient to offset the run-off of the Woolworths rental guarantee
Integration of Newly Completed and Development Properties
• Two remaining Woolworths development properties (Katoomba and Greystanes) and one deferred settlement development property (Claremont) to be completed and integrated over the next 12 months
• Work is currently underway to assess and prioritise development opportunities in the portfolio. An update will be provided with our full year results in August 2014
Active Portfolio Management
• Further accretive acquisition opportunities consistent with our strategy will be considered
• Divestment of certain freestanding assets will be considered to further rebalance the portfolio
FY14 Guidance • FY14 Distributable Earnings guidance increased to 12.3 cpu (from 11.8 cpu in the PDS), and FY14 Distribution guidance increased to 11.0 cpu (from 10.4 cpu in the PDS) F
or p
erso
nal u
se o
nly

QUESTIONS 5
For
per
sona
l use
onl
y

APPENDICES 6
For
per
sona
l use
onl
y

STATUTORY EARNINGS RECONCILIATION Six Months to 31-Dec-2013
24
$m
Statutory Income Statement
Straight-lining of rental income Fair value adj Rental
reimbursements Distributable
earnings
Revenue Rental income 75.8 (4.5) - 7.0 78.3 Other property income 2.1 - - - 2.1
77.9 (4.5) - 7.0 80.4 Expenses Property expenses (20.5) - - - (20.5) Corporate costs (5.4) - - - (5.4)
52.0 (4.5) - 7.0 54.5 Net loss on change in fair value of investment properties 4.8 - (4.8) - - Net gain on change in fair value of financial assets (rental guarantee) 0.1 - (0.1) - -
Earnings before interest and tax (EBIT) 56.9 (4.5) (4.9) 7.0 54.5 Interest income 0.2 - - - 0.2
Finance costs (12.9) - - - (12.9)
Net profit / (loss) before tax for the period 44.2 (4.5) (4.9) 7.0 41.8 Tax (1.2) - - - (1.2)
Net profit / (loss) after tax for the period 43.0 (4.5) (4.9) 7.0 40.6 Structural vacancy allowance (1.1)
Distributable earnings 39.5
For
per
sona
l use
onl
y

PROPERTY VALUE
25
1,504.4
1,638.3 146.3 12.2 4.8
15.4 (43.9)
(0.9)
1,200
1,300
1,400
1,500
1,600
1,700
1,800
30 June 2013 Acquisitions DMA Fair Value Disposals Other FX 31 December 2013
• Acquisitions includes the Tasmanian acquisition (excluding Claremont) and the remaining balance of development properties completed by Woolworths during the period (Lilydale, St James, Kwinana Dan Murphy)
• “DMA” reflects the cost of works conducted by Woolworths during the period on the remaining development properties
• Fair Value includes valuation uplifts, offset by transactions costs associated with the Tasmanian acquisition
• Disposals excludes Bright and Mildura (which had not settled as at 31 December 2013)
A$m
F
or p
erso
nal u
se o
nly

Debt Facilities as at 31-Dec-2013
DEBT FACILITIES & HEDGING
26
$m Facility Limit
(A$m) Drawn Debt
(A$m) Maturity All-in debt cost (% pa)
Unsecured bank facility – 3 year 150.0 150.0 Dec-16
Unsecured bank facility – 4 year 225.0 220.0 Nov – 17
Unsecured bank facility – 5 year 225.0 196.1 Jul 18 – Dec 18
Total 600.0 566.1 4.8%
Covenant Actual Dec 2013
Gearing < 50% 33.5% ICR > 2.0x 4.2x
Financial Covenants
3.00%
3.25%
3.50%
0100200300400
FY14 FY15 FY16 FY17
$m
$m hedged Average hedge rate (excluding margin and line fees)
Fixed / Hedging Profile $361m represents 64% of drawn
facilities hedged as at 31-Dec-2013
For
per
sona
l use
onl
y
27
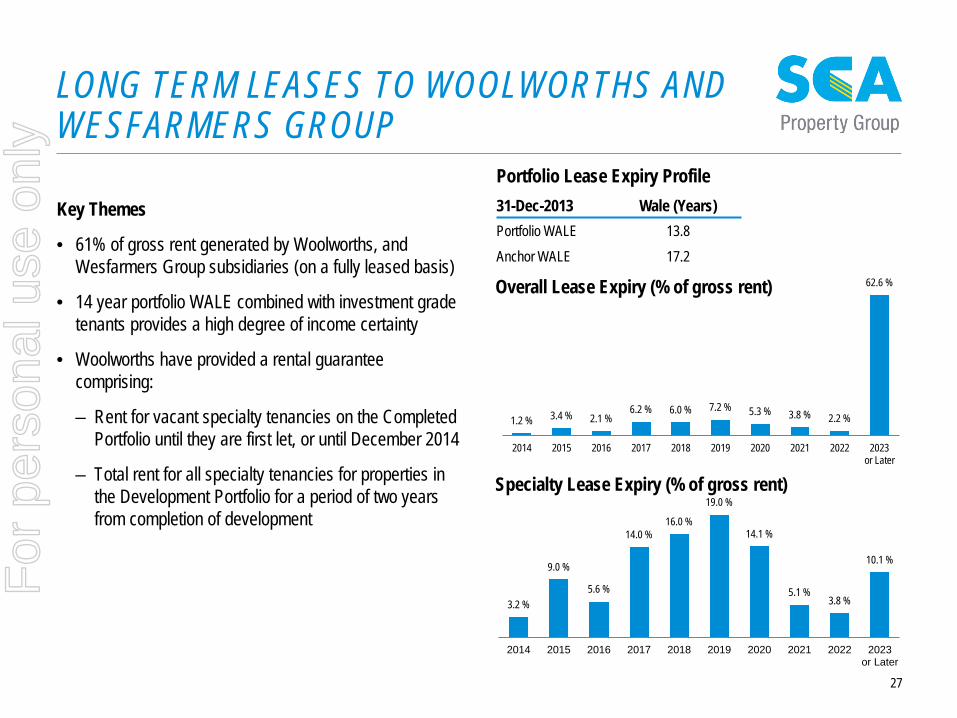
Key Themes
• 61% of gross rent generated by Woolworths, and Wesfarmers Group subsidiaries (on a fully leased basis)
• 14 year portfolio WALE combined with investment grade tenants provides a high degree of income certainty
• Woolworths have provided a rental guarantee comprising:
– Rent for vacant specialty tenancies on the Completed Portfolio until they are first let, or until December 2014
– Total rent for all specialty tenancies for properties in the Development Portfolio for a period of two years from completion of development
LONG TERM LEASES TO WOOLWORTHS AND WESFARMERS GROUP
31-Dec-2013 Wale (Years) Portfolio WALE 13.8 Anchor WALE 17.2
Portfolio Lease Expiry Profile
1.2 % 3.4 % 2.1 % 6.2 % 6.0 % 7.2 % 5.3 % 3.8 % 2.2 %
62.6 %
2014 2015 2016 2017 2018 2019 2020 2021 2022 2023or Later
Specialty Lease Expiry (% of gross rent)
3.2 %
9.0 %
5.6 %
14.0 % 16.0 %
19.0 %
14.1 %
5.1 % 3.8 %
10.1 %
2014 2015 2016 2017 2018 2019 2020 2021 2022 2023or Later
Overall Lease Expiry (% of gross rent)
For
per
sona
l use
onl
y

ACQUISITIONS DURING THE PERIOD Six months to 31 December 2013
28
Centre type Completion date
Anchor GLA (sqm)
Specialty GLA
(sqm)
Total GLA (sqm)
% GLA commited
Total purchase price ($m)
Cap rate
Woolworths Completed Centres
Lilydale, VIC Neighbourhood Jul-2013 12,791 9,280 22,071 96.2% 80.5 7.75%
St James, NZ Neighbourhood Nov-2013 3,534 971 4,505 100.0% 11.0 7.87%
Kwinana Dan Murphy’s, WA Sub-Regional Dec-2013 100.0% 5.0 8.25%
Total 16,325 10,251 26,576 96.9% 96.5 7.79%
Acquired Properties
Riverside, TAS Neighbourhood Nov-2013 2,382 726 3,108 95.1% 7.2 8.50%
Newtown, TAS Neighbourhood Nov-2013 10,129 1,253 11,382 100.0% 28.8 7.75%
Kingston, TAS Neighbourhood Nov-2013 2,998 1,728 4,726 100.0% 21.8 7.75%
Greenpoint, TAS Neighbourhood Nov-2013 3,200 2,758 5,958 100.0% 12.5 8.75%
Sorrell, TAS Neighbourhood Nov-2013 3,200 2,247 5,447 96.0% 20.5 7.75%
Shoreline, TAS Neighbourhood Nov-2013 3,434 2.807 6,241 97.9% 27.0 8.00%
Total 25,343 11,519 36,862 98.6% 117.8 7.96%
Pending Acquisition Properties
Claremont, TAS Neighbourhood Oct-2014 3,389 3,121 6,510 27.9 8.25%
Total 3,389 3,121 6,510 27.9 8.25%
For
per
sona
l use
onl
y

DIVESTMENTS DURING THE PERIOD Six months to 31 December 2013
29
Centre type Completion date
Anchor GLA (sqm)
Specialty GLA
(sqm)
Total GLA (sqm)
% GLA commited
Total sale price ($m) Cap rate
Divested Properties
Emerald Park, VIC Freestanding Nov-2013 2,915 - 2,915 100.0% 12.5 6.50%
Mullumbimby, NSW Freestanding Nov-2013 2,373 - 2,373 100.0% 9.6 7.28%
Maffra, VIC Freestanding Dec-2013 2,323 - 2,323 100.0% 9.4 7.00%
Warrnambool Dan Murphy’s, VIC Freestanding Dec-2013 1,440 - 1,440 100.0% 5.7 6.75%
Culburra Beach, NSW Freestanding Dec-2013 1,650 48 1,698 97.2% 6.7 7.25%
Total 10,701 48 10,749 99.6% 43.9 6.93%
Pending Divestment Properties
Mildura, VIC Freestanding Mar-2014 9,072 88 9,160 100.0% 22.4 8.00%
Bright, VIC Neighbourhood Feb-2014 2,903 354 3,257 95.9% 9.4 7.50%
Total 11,975 442 12,417 98.9% 31.8 7.85%
For
per
sona
l use
onl
y

PORTFOLIO LIST
30
Property State Property Type Completion Date
Total GLA (sqm)
Occupancy(% by GLA)
Number of Specialties
WALE (Years by GLA)
Valuation Cap Rate
Valuation Dec-13(A$m)
Completed PortfolioAustraliaLilydale VIC Sub-Regional Jul-13 22,071 96% 53 14.9 7.50% 80.5Pakenham VIC Sub-Regional Dec-11 16,862 99% 38 10.8 7.50% 68.0Central Highlands QLD Sub-Regional Mar-12 18,699 100% 26 15.0 7.75% 58.5Mt Gambier SA Sub-Regional Aug-12 27,557 95% 33 18.4 7.94% 66.0Murray Bridge SA Sub-Regional Nov-11 18,678 97% 54 10.7 8.25% 57.5Kwinana Marketplace WA Sub-Regional Dec-12 28,075 92% 84 12.0 8.25% 93.0Berala NSW Neighbourhood Aug-12 4,340 100% 5 17.3 8.00% 18.5Cabarita NSW Neighbourhood May-13 3,396 100% 11 15.8 9.00% 14.9Cardiff NSW Neighbourhood May-10 5,851 96% 13 17.1 8.25% 16.3Goonellabah NSW Neighbourhood Aug-12 5,040 95% 8 14.8 8.50% 16.0Lane Cove NSW Neighbourhood Nov-09 6,721 100% 16 15.1 7.25% 38.5Leura NSW Neighbourhood Apr-11 2,547 100% 6 16.3 8.25% 12.5Lismore NSW Neighbourhood Dec-85 6,923 89% 20 13.0 8.75% 23.3Macksvil le NSW Neighbourhood Mar-10 3,623 98% 5 18.6 8.50% 9.4Merimbula NSW Neighbourhood Oct-10 4,960 94% 10 15.5 8.75% 13.6Mittagong Vil lage NSW Neighbourhood Dec-07 2,235 100% 5 14.0 8.00% 7.8Moama Marketplace NSW Neighbourhood Aug-07 4,519 97% 5 17.7 8.50% 11.0Morisset NSW Neighbourhood Nov-10 4,141 91% 9 11.5 8.75% 14.2North Orange NSW Neighbourhood Dec-11 4,975 97% 14 17.1 8.00% 24.5Swansea NSW Neighbourhood Oct-09 3,750 98% 4 19.7 8.50% 11.0Ulladulla NSW Neighbourhood May-12 5,297 97% 10 17.8 8.25% 15.3West Dubbo NSW Neighbourhood Dec-10 4,205 97% 12 14.8 8.75% 12.1Albury VIC Neighbourhood Dec-11 4,949 99% 12 16.0 8.00% 18.3Ballarat VIC Neighbourhood Jan-00 8,964 100% 4 6.6 7.50% 20.0Cowes VIC Neighbourhood Nov-11 5,039 91% 12 16.8 8.25% 16.8Drouin VIC Neighbourhood Nov-08 3,798 100% 4 13.4 8.00% 12.3Epping North VIC Neighbourhood Sep-11 5,377 90% 16 14.9 7.75% 21.0Highett VIC Neighbourhood May-13 5,767 97% 13 17.1 7.75% 23.7
For
per
sona
l use
onl
y

PORTFOLIO LIST (CONTINUED)
31
Property State Property Type Completion Date
Total GLA (sqm)
Occupancy(% by GLA)
Number of Specialties
WALE (Years by GLA)
Valuation Cap Rate
Valuation Dec-13(A$m)
Langwarrin VIC Neighbourhood Oct-04 5,087 98% 14 8.4 7.75% 17.2Ocean Grove VIC Neighbourhood Dec-04 6,910 96% 19 8.5 7.50% 29.9Warrnambool VIC Neighbourhood Sep-11 4,318 97% 5 12.8 8.25% 10.6Warrnambool Target VIC Neighbourhood Jan-90 6,984 100% 11 8.7 8.00% 19.5Wyndham Vale VIC Neighbourhood Dec-09 6,914 98% 8 14.4 8.00% 18.2Ayr QLD Neighbourhood Jan-00 5,513 96% 9 10.3 8.00% 18.7Brookwater Vil lage QLD Neighbourhood Feb-13 6,761 100% 9 14.6 8.50% 25.2Carrara QLD Neighbourhood Sep-11 3,719 100% 6 13.1 8.25% 14.7Chancellor Park Marketplace QLD Neighbourhood Oct-01 5,223 98% 18 15.5 8.50% 26.3Collingwood Park QLD Neighbourhood Nov-09 4,568 95% 9 16.5 9.00% 10.8Coorparoo QLD Neighbourhood May-12 4,870 98% 10 16.8 7.75% 21.2Gladstone QLD Neighbourhood Apr-12 4,799 100% 9 14.6 7.75% 23.2Mackay QLD Neighbourhood Jun-12 4,126 100% 10 16.1 7.50% 21.0Mission Beach QLD Neighbourhood Jun-08 4,099 95% 10 12.0 9.50% 9.2Woodford QLD Neighbourhood Apr-10 3,671 87% 9 11.2 9.75% 8.6Blakes Crossing SA Neighbourhood Jul-11 5,078 97% 14 11.6 8.25% 19.3Walkervil le SA Neighbourhood Apr-13 5,333 100% 12 17.2 7.75% 19.5Busselton WA Neighbourhood Sep-12 5,181 100% 6 18.5 8.00% 19.2Margaret River WA Neighbourhood Jun-13 5,712 83% 18 14.3 8.25% 20.7Treendale WA Neighbourhood Feb-12 7,388 96% 17 10.0 8.25% 24.0Sorell TAS Neighbourhood Oct-10 5,447 96% 15 12.9 7.75% 20.5Kingston TAS Neighbourhood Dec-08 4,726 100% 14 10.5 7.75% 21.8Greenpoint TAS Neighbourhood Nov-07 5,958 100% 7 6.1 8.75% 12.5Shoreline TAS Neighbourhood Jun-72 6,241 98% 22 3.4 8.00% 27.0New Town Plaza TAS Neighbourhood Jun-73 11,382 100% 15 7.1 7.75% 28.8Riverside TAS Neighbourhood Jun-86 3,108 95% 9 6.1 8.50% 7.2Burwood DM NSW Freestanding Nov-09 1,400 100% 0 13.9 7.00% 7.4Fairfield Heights NSW Freestanding Dec-12 3,802 100% 2 18.2 7.50% 16.2Griffith North NSW Freestanding Apr-11 2,560 100% 0 13.8 7.50% 8.0Inverell BIG W NSW Freestanding Jun-10 7,689 98% 2 13.9 10.00% 15.5Katoomba DM NSW Freestanding Dec-11 1,420 100% 0 13.8 7.25% 6.0
For
per
sona
l use
onl
y

PORTFOLIO LIST (CONTINUED)
32
Property State Property TypeCompletion
Date Total GLA
(sqm) Occupancy(% by GLA)
Number of Specialties
WALE (Years by GLA)
Valuation Cap Rate
Valuation Dec-13(A$m)
New ZealandKelvin Grove NZ Neighbourhood Jun-12 3,611 100% 5 17.5 7.75% 10.4Newtown NZ Neighbourhood Dec-12 4,878 98% 6 17.8 7.25% 19.6Takanini NZ Neighbourhood Dec-10 7,298 100% 11 12.4 7.63% 29.2Warkworth NZ Neighbourhood Sep-12 3,831 91% 6 17.0 8.00% 15.4St James NZ Neighbourhood Jun-06 4,505 100% 6 15.4 7.63% 11.3Bridge Street NZ Freestanding May-13 4,293 100% 0 14.3 7.50% 13.9Dunedin South NZ Freestanding Jun-12 4,071 100% 0 13.9 7.75% 14.1Hornby NZ Freestanding Nov-10 4,317 100% 0 13.9 8.00% 14.4Kerikeri NZ Freestanding Dec-11 3,887 100% 0 18.9 8.00% 13.3Nelson South NZ Freestanding Jun-08 2,659 100% 0 18.9 7.75% 9.3Rangiora East NZ Freestanding Jan-12 3,786 100% 0 18.9 8.00% 11.5Rolleston NZ Freestanding Nov-11 4,251 100% 0 19.0 8.00% 13.1Stoddard Road NZ Freestanding Feb-13 4,200 100% 0 13.1 7.50% 17.8Tawa NZ Freestanding Mar-13 4,200 100% 0 19.1 7.50% 13.8
Assets Held for SaleBright VIC Neighbourhood Apr-10 3,257 96% 4 18.8 7.50% 9.4Mildura VIC Freestanding May-12 9,160 100% 1 18.7 8.00% 22.4
Development / OtherKatoomba NSW Freestanding Apr-14 9,387 100% 0 - 7.50% 38.5Greystanes NSW Neighbourhood Oct-14 5,559 27 - 8.00% 38.2Claremont TAS Neighbourhood Oct-14 6,510 23 - 8.25% 27.9
For
per
sona
l use
onl
y

MANAGEMENT TEAM
33
Anthony Mellowes, Chief Executive Officer • Mr Mellowes is an experienced property executive. Prior to joining SCA Property Group, Mr Mellowes was employed by Woolworths since
2002 and held a number of senior property related roles including Head of Asset Management and Group Property Operations Manager. Prior to Woolworths, Mr Mellowes worked for Lend Lease Group and Westfield Limited
• Mr Mellowes was appointed Chief Executive Officer on 16 May 2013 after previously acting as interim CEO since the group’s listing on 26 November 2012. Mr Mellowes was a key member of the Woolworths Limited team which created SCA Property Group
Mark Fleming, Chief Financial Officer • Mr Fleming was Chief Financial Officer of Treasury Wine Estates from 2011 to 2013 and previously served as General Manager Supermarket
Finance, and General Manager, Business Planning and Corporate Finance at Woolworths. Prior to Woolworths, Mr Fleming worked in investment banking at UBS, Goldman Sachs and Bankers Trust
• Mr Fleming was appointed Chief Financial Officer on 20 August 2013
Mark Lamb, General Counsel and Company Secretary • Mr Lamb is an experienced transactional lawyer with over 20 years' experience in the private sector as a partner of Corrs Chambers Westgarth
and subsequently Herbert Geer and in the listed sector as General Counsel of ING Real Estate. Mr Lamb has extensive experience in retail shopping centre developments, acquisitions, sales and major leasing transactions having acted for various REITs and public companies during his career
• Mr Lamb was appointed General Counsel and Company Secretary on 26 September 2012.
Campbell Aitken, Chief Operating Officer • Mr Aitken has over 10 years experience working in the Property Funds Management industry in a number of senior positions within the
Australian Retail REIT sector, with Charter Hall Group , Macquarie Bank and Westfield. Mr Aitken is an active member of the Property Council of Australia, currently Chairman of the Retail Property Committee and is a committee member of the Property Investment and Finance Committee. Mr Aitken has vast experience in managing acquisitions, leasing, property management, and developments.
• Mr Aitken was appointed Chief Operating Officer on 20 May 2013.
For
per
sona
l use
onl
y