Embed Size (px)
Citation preview
Saving Regret: Self-assessed Life-cycle Saving Behavior in the U.S. and Singapore
Axel Börsch-Supan, Michael D. Hurd, and Susann Rohwedder
MRDRC WP 2020-413
UM20-17
Saving Regret: Self-assessed Life-cycle Saving Behavior in the United States and Singapore
Axel Börsch-Supan MEA, TUM and NBER
Michael D. Hurd RAND, NBER and NETSPAR
Susann Rohwedder RAND and NETSPAR
September 2020
Michigan Retirement and Disability Research Center, University of Michigan, P.O. Box 1248. Ann Arbor, MI 48104, mrdrc.isr.umich.edu, (734) 615-0422
Acknowledgements The research reported herein was performed pursuant to a grant from the U.S. Social Security Administration (SSA) funded as part of the Retirement and Disability Research Consortium through the University of Michigan Retirement and Disability Research Center Award RDR18000002-02. The opinions and conclusions expressed are solely those of the author(s) and do not represent the opinions or policy of SSA or any agency of the federal government. Neither the United States government nor any agency thereof, nor any of their employees, makes any warranty, express or implied, or assumes any legal liability or responsibility for the accuracy, completeness, or usefulness of the contents of this report. Reference herein to any specific commercial product, process or service by trade name, trademark, manufacturer, or otherwise does not necessarily constitute or imply endorsement, recommendation or favoring by the United States government or any agency thereof.
Regents of the University of Michigan
Jordan B. Acker; Huntington Woods; Michael J. Behm, Grand Blanc; Mark J. Bernstein, Ann Arbor; Paul W. Brown, Ann Arbor; Shauna Ryder Diggs, Grosse Pointe; Denise Ilitch, Bingham Farms; Ron Weiser, Ann Arbor; Katherine E. White, Ann Arbor; Mark S. Schlissel, ex officio
Saving Regret: Self-assessed Life-cycle Saving Behavior in the United States and Singapore
Abstract Based on the belief that many people have under-saved and that the reason for under-saving is procrastination, paternalistic nudging to foster saving is often advocated by policy researchers. However, there is little empirical evidence that on hindsight individuals would wish to have saved more than they did, which is an implication of under-saving due to procrastination. To fill this empirical gap, we fielded surveys in the RAND American Life Panel and in the Singapore Life Panel. We asked persons ages 60 to 74 whether, if they were given the chance to do it over again, they would have saved differently earlier in their lives. If they wished to have saved more, we say they have “saving regret.” We also fielded a psychometric battery designed to classify people according to their tendency to procrastinate. We found both in the United States and in the Singapore data that about half the population expressed saving regret with the proportion being higher in the U.S. The likelihood of expressing regret was uncorrelated with our measures of procrastination: That is, individuals who affirm statements that plainly indicate a tendency to put off difficult tasks are no more likely to express saving regret than individuals who do not have that tendency. We also asked respondents whether, over their lifetimes, they had experienced unexpected events or shocks that harmed their economic situation, such as unemployment. Substantially higher fractions of the U.S. sample experienced such shocks. That experience explained the greater frequency of saving regret in the U.S.
Citation Börsch-Supan, Axel, Michael D. Hurd, and Susann Rohwedder. 2020. “Saving Regret: Self-assessed Life-cycle Saving Behavior in the U.S. and Singapore.” Ann Arbor, MI. University of Michigan Retirement and Disability Research Center (MRDRC) Working Paper; MRDRC WP 2020-413. https://mrdrc.isr.umich.edu/publications/papers/pdf/wp413.pdf
Authors’ acknowledgements Data collection of the SLP was funded by the Singapore Ministry of Education under grant number MOE2013-T3-1-009 to the Singapore Management University. Data collection of the ALP modules used in this study was funded by the National Institute on Aging (P01 AG008291) with additional funding from the Max Planck Society. Jessica Hayes provided excellent programming assistance.
1
Introduction
A number of research papers advocate paternalistic nudging to foster saving,
especially to increase economic resources in old age (Thaler 1994;Thaler and Shefrin,
1981; Laibson 1997, 1998; Laibson et al., 1998; Thaler and Sunstein 2003, 2009; Lewis
2008; Chetty et al., 2014). A justification for these interventions is the belief that many
people have under-saved and that the reason for under-saving is that often people
procrastinate, particularly about saving. An implication is that on hindsight, the preferred
choice of such persons would be to have saved more than they actually did. However,
there is little empirical evidence on the saving behavior that individuals would have
chosen on hindsight.
To fill this empirical gap, we fielded two surveys in the RAND American Life
Panel (ALP). We asked persons ages 60 to 74 whether, if they were given the chance
to do it over again, they would have saved differently earlier in their lives. If they would
have wanted to have saved more, we say they have “saving regret.”
In May 2018, we fielded a similar survey to 60-74 year old participants of the
Singapore Life Panel (SLP)1, which is modelled on the ALP Financial Crisis Surveys.
Viewed in international context, Singapore is similar to the U.S. in encouraging self-
reliance, but it has a smaller safety net and the institutions surrounding economic
preparation for retirement are very different. In particular, Singapore mandates a total
contribution rate of 37% of earnings (employee and employer combined) for most
1 Data collection of the SLP was funded by the Singapore Ministry of Education under grant
number MOE2013-T3-1-009 to the Singapore Management University.
2
workers into funds managed by the Central Provident Fund. These funds finance
consumption in retirement and health care both pre- and post-retirement. They can also
be used for financing the purchase of a home. There are very few defined benefit (DB)
pension plans, no Social Security, limited public health insurance, and no
unemployment insurance.
We use the data from the ALP and the SLP to compare saving regret in the U.S.
with that in Singapore and to shed light on the mechanisms leading to saving regret and
how these may interact with the policy environment. Because of the high level of
mandated saving in Singapore, procrastination would appear to be irrelevant, possibly
bringing the role of financial risks over the lifecycle into focus. This raises the questions
of the roles of uncertainty and the individual’s ability to manage unexpected financial
shocks in shaping retirement saving outcomes and how do these differ in Singapore
and the U.S.
Background about Singapore
For many years Singapore has experienced strong economic growth: GDP per
capita was $12,400 in 1979 and $58,800 in 2019 (both in 2010 USD). It experienced
similarly strong growth in education. In 2015, for example, only 25% of 65 to 69 year
olds in Singapore had some post-secondary education, while 45% of 50 to 54 year olds
did. This implies that in 15 years the proportion of the population attending at least
some college increased 20-percentage points.
The Singapore’s economy is strongly market based but with significant policy
interventions at several key points. The most important intervention for saving behavior
is the Central Provident Fund (CPF) operated by the Singapore Government. While
3
there is some variation by age and cohort, for most workers 37% of earnings is
mandated to be contributed to the CPF, about half paid by the employee and half by the
employer. These contributions are on a pre-tax basis (tax advantaged). They are paid
into three accounts. First, about half the mandated contribution is deposited into the
Ordinary Account. This account may be used for investment and for purchasing housing
and servicing a mortgage, even during the working life. Unspent funds from this account
may be used to support retirement spending. Second, about one-fourth of the total
contribution is paid into the Special Account, which is savings for retirement. These
funds cannot be withdrawn before age 55. Thus about 9% of earnings are dedicated
solely to retirement, slightly less than what is paid into U.S. Social Security for
retirement (about 10%). Both the Special Account and the Ordinary Account are defined
contribution (DC) pension schemes, so that, unlike the U.S. Social Security system,
they lack progressivity. Third, the remaining one-fourth of contributions are paid into the
MediSave account, used for health care insurance and spending on health care during
working life and in retirement. The MediSave account can also be used to fund family
members’ health care insurance and health care spending. At age 55, a fourth account,
the Retirement Account, is established using monies from the Special Account and the
Ordinary Account. There is a required minimum that must be deposited into the
Retirement Account. At age 65 or at least by age 70, a mandated minimum amount of
the Retirement Account must be converted to an annuity.
The savings in the Ordinary and Special accounts (about 27% of earnings) would
appear to be adequate to finance retirement, but apparently much of the Ordinary
Account savings have been used to finance the purchase of housing. Housing is quite
4
expensive in Singapore, resulting in a high concentration of wealth in housing: Our SLP
sample shows that Singaporeans 50 to 70 years old in 2018 had median housing wealth
of about $377,000 (converted to 2018 U.S. dollars using purchasing power parity)2 and
median total wealth of $613,000. To put these values into perspective, we note that
median income of Singapore couples shortly before retirement (ages 50 to 55) was
about $47,000.
All persons can buy subsidized health care insurance that aims to cover costs in
public hospitals and clinics, which perhaps are of lower quality. Lower-income persons
can be subsidized further. Higher-income persons can buy additional integrated plans;
68% of the population purchases such plans, which cover private hospitals and better
wards. The insurance purchase can be made from the MediSave account.
Most assets in CPF accounts earn interest above market rates. CPF account
holders have some ability to invest in stocks and other limited vehicles, but mostly the
funds are interest bearing. Retirement is financed by the CPF account and any private
savings. Private pensions are rare.
The “Retirement Age” is currently 62, having been increased from age 60 in
1993. Employers may not dismiss employees on grounds of age before the retirement
age of age 62. The retirement age is to be raised in steps to 65 beginning in 2022.
Employees work on contracts, which often have end dates at specific ages, particularly
age 62 and 65.
2 The conversion is to multiply the Singapore dollar by 0.94. According to the actual exchange
rate the Singapore dollar is worth about 0.73 U.S. dollar.
5
Singapore has a policy to encourage later retirement, the Retirement and Re-
employment Act (RRA). The RRA was introduced in 2007, but not enacted until 2012.
The employers of workers whose contracts ended between the ages of 62 and 65 were
encouraged to extend their contracts either in one shot or in a series of one-year
contracts to the Re-employment Age, which was specified in the RRA act to be age 65.
The new contract may be subject to negotiation, resulting in a change in duties or a
wage reduction within limits. The employer has an incentive to “re-employ” the worker
because of penalties that could be imposed should an unwillingness to re-employ not be
justified. Satisfactory reasons for not re-employing would include health conditions or
poor job performance.
The Re-Employment Age was increased to age 67 in 2017, and is scheduled to
increase to age 70 in steps beginning in 2022. Likely as a result of the discussion
surrounding the RRA, labor force participation at older ages increased sharply even
before the formal enactment in 2012: In 2005 the labor force participation rate of men
60 to 64 was 52.5% and of women was 21.3%; in 2019, these rates were 76.7% for
men and 50.7% for women.
There is no public unemployment insurance in Singapore. The stated aim of the
government is to help with re-employment. But some long-term unemployment exists
(Hurd and Rohwedder 2018).
6
Data
The RAND American Life Panel
The ALP is a standing panel of about 6,000 individuals 18 and older who are
invited to take a survey over the internet from time to time. Individuals are recruited into
the panel in a way to enhance population representation. The panel has been active in
its current form since 2006, so that data from hundreds of surveys are available and can
be linked to individuals, greatly expanding the types of analyses that can be performed
on data from any particular wave. See Pollard and Baird (2017) for details on sample
recruitment, response rates, retention, and weighting.
We designed ALP survey 455, fielded in August-December 2016 to respondents
60 or older. We obtained 1,728 completed interviews (72.3% response rate). The
questionnaire began with sociodemographic and economic characteristics, a
psychometric battery for personal characteristics, including procrastination, and a set of
questions about the respondents’ assessments of their income and living standards. To
elicit individuals’ hindsight assessment of their saving behavior, we prompted them to
look back to when they were around 45 years old and to say whether they wished they
had saved more, about the same, or less earlier in life if given the chance to re-do their
saving and spending. Specifically, we asked
…please think back to when you were around 45 years old.
Suppose you could re-do your spending and saving from then to
now, would you…
1 Save more over the years?
2 Save about the same over the years?
7
3 Save less over the years?
We call the choice of 1 “saving regret.”
We conducted a design experiment in ALP. For a random 50% of respondents
we modified response 1 to:
1 Spend less and save more over the years?
to remind respondents that saving more would require a reduction in spending. We call
this the “framed” version. Framing resulted in a reduction of regret of about 7-
percentage points. Our objective in the framing was to reduce or even avoid “cheap
talk.”
For those who expressed regret we followed up with a list of categories of
spending items such as housing, food, or clothing and asked which of them could have
been reduced. We included a response of
No way we could have cut spending. We could not have saved
more
in which case we recoded the respondent as not expressing saving regret. The
objective of the follow-up questions was to reduce “cheap talk” further; that is, to remind,
perhaps more forcefully, that saving more would require spending less.
We fielded a second survey from December 2017 to February 2018 in which we
asked again about saving regret. We used the framed version only, and used the follow-
up about categories of spending that could be reduced. In most of the results presented
in this paper, we pool the responses from the two ALP surveys and account for the
effect on the standard errors of a repeated observation on the overlap cases (2,111
individuals out of the 2,290 individuals in the second wave). Based on our experience
from the first survey, we modified several of the questions in the second wave: So for
8
some of the analyses, we only use observations from the second wave and from the
overlap cases in the first wave. For these analyses over this modestly reduced data set
we have an identical survey design in the ALP and the SLP.
To measure an individual-level lack of will-power to follow through on personal
commitments or a tendency to procrastinate, we asked a series of questions in wave 1
about an individual’s self-perception of his or her ability to accomplish difficult tasks and
about whether in past or ongoing actions the person had or does procrastinate. We call
these “psychometric” variables. They were derived from the General Procrastination
Scale (GPS) described and validated by Tuckman (1991). We asked respondents to
evaluate themselves along several dimensions, such as a self-assessment of their
general and financial planning behavior and motivations. A first set of five questions
used the following format:
Do you agree or disagree with the following statements?
The first question was
People should do what they like today rather than putting
it off until tomorrow.
1 Strongly disagree
2 Disagree
3 Neither agree or disagree
4 Agree
5 Strongly agree
This question was followed with four additional attitudinal questions. See Table 3
(Panel A) for the complete list.
9
The second set asks the respondent whether he or she behaves in a particular
manner such as this question, which directly assesses procrastination:
How often do you…
put things off you should do but aren't really interested
in?
1 Never
2 Sometime
3 Most of the time
4 Always
We use responses to seven questions of this type in this paper. See Table 3
(Panel B) for a listing. In total, we use 12 psychometric variables from the ALP. These
same 12 were also asked in the SLP survey. We anticipated that they would be strongly
related to an expression of saving regret.
An alternative explanation to procrastination for saving regret is shocks that may
have occurred earlier in life and had an important impact on the respondent’s financial
situation. In the ALP survey we asked about negative shocks in the following way:
Sometimes people have negative surprises earlier in life
that cause their finances to turn out worse than expected. Did
any of the following happen to you? Please check all that apply.
We listed 11 negative shocks, such as unemployment or a large health expense.
A similar question was posed about positive shocks. We listed eight positive shocks,
such as earned more than expected or received an inheritance. The list of shocks was
the same in ALP Wave 2 and SLP, but it was somewhat different in ALP Wave 1, so
10
that when comparing the frequency of shocks or the saving regret associated with
shocks between the ALP and the SLP, we will confine the sample to those who were in
ALP wave 2. For the overlap cases, however, we use their report of saving regret from
both waves along with their report of shocks from Wave 2.3
Taking both ALP waves together, we have 2,618 respondents in our age range,
60 to 74. Of them 2111 were in both waves (overlap cases), 328 in Wave 1 but not in
Wave 2, and 179 in Wave 2 but not in Wave 1.
The Singapore Life Panel
The Singapore Life Panel (SLP) is a monthly, internet-based survey
representative of the Singapore population ages 50 to 70 (and their spouses) when first
recruited in 2016. The SLP was modeled in many ways after the ALP Financial Crisis
Surveys, a series of monthly interviews that Hurd and Rohwedder launched in the ALP
in May 2009 (Hurd and Rohwedder 2015). The SLP has a core of regular monthly
questions, some additional regular quarterly content, plus rotating modules. In January
it obtains a complete assessment of income during the preceding year and a complete
balance sheet of assets. The SLP has consistently high response rates, obtaining about
8,000 interviews every month (Vaithianathan et al. 2018).
In May 2018, we fielded a survey in the SLP on saving regret. We aimed to
obtain data elicited in exactly the same way as in Wave 2 of the ALP survey. We asked
about saving regret in the framed version, as in Wave 2. We asked the same
3 Because of observation error or reporting error, the Wave 2 response contains additional
information, but the standard error must be adjusted for a second report from the same respondent.
11
psychometrics questions, the same measures of planning horizon, financial literacy and
probability numeracy, and about the same shocks. We obtained 4,559 responses in our
age range, 60 to 74.
Results
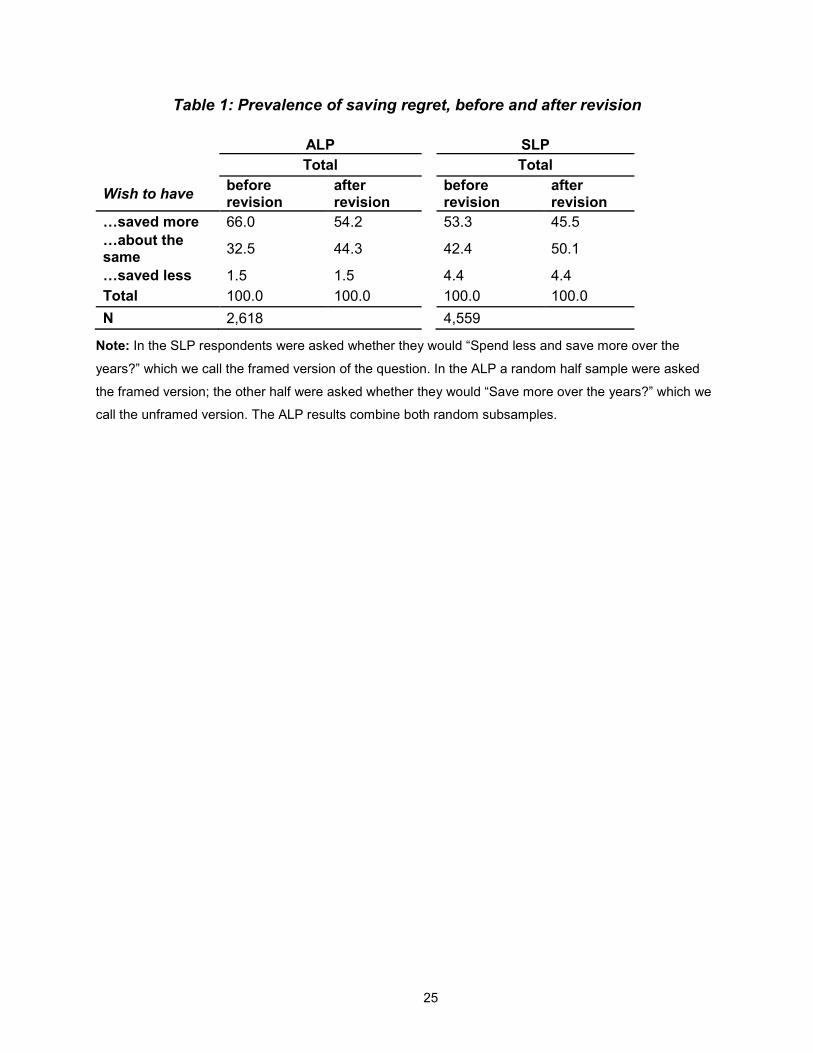
Table 1 shows the percent of respondents expressing regret in the ALP and in
the SLP, both before and after revision. Both populations reduced regret when asked
what types of spending could have been reduced, the ALP by about 12 percentage
points and the SLP by 8 percentage points. Fewer Singaporeans than Americans
wished they had saved more: Very few in either country would have saved less.
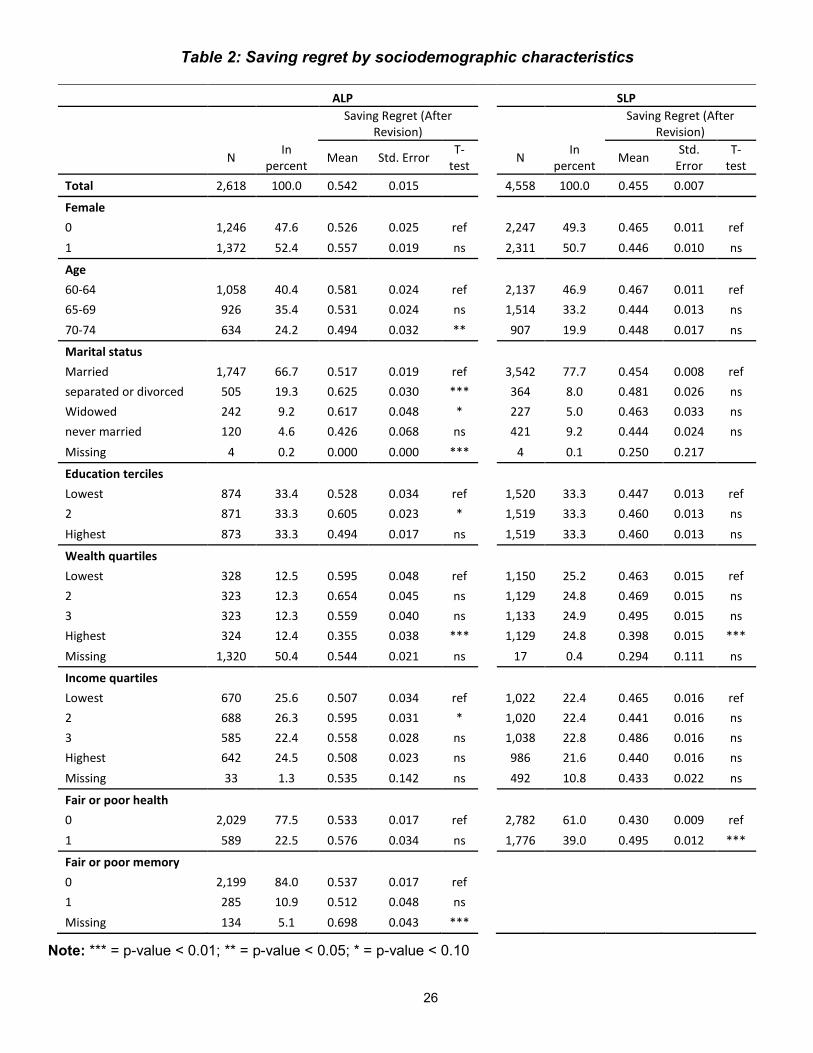
Table 2 shows the variation in saving regret as a function of demographic, social,
and economic characteristics. In both countries there is little difference between men
and women.
In the U.S. there is a monotonic age gradient: Age is associated with less regret,
and the difference between the oldest and the youngest age band is statistically
significant. That pattern is not found in Singapore.
The population distribution by marital status is quite different in Singapore:
Divorce is 11 percentage points lower and “never married” five percentage points higher
than in the U.S. Among those in the U.S., higher proportions of those who are
separated, divorced, or widowed express saving regret. This is in line with the well-
known economic status of those groups: Particularly, divorced or separated women
have fewer economic resources. This pattern by marital status is not evident in
Singapore.
12
Because the educational levels in the two countries are quite different, we
divided educational attainment into terciles. Given the large number of U.S. respondents
who have completed high school but no further education, we used randomization to
achieve the equal allocations.4 In the U.S., those in the middle educational tercile
expressed regret with the greatest frequency. In Singapore, there is no education
gradient.
In both countries, those in the highest wealth quartile are the least likely to
express saving regret, with the difference between the highest wealth quartile and the
others being greater in the ALP than in the SLP.5 There is little variation in saving regret
by income in either country. In Singapore, those in fair or poor self-assessed health are
more likely to express regret. This pattern is also observed in the U.S., but the
difference is not statistically significant.
Based on the extensive literature that explains under-saving using behavioral
explanations, we expected to see systematic and large variation in saving regret as a
function of self-rated characteristics for procrastination, lack of self-control, and present
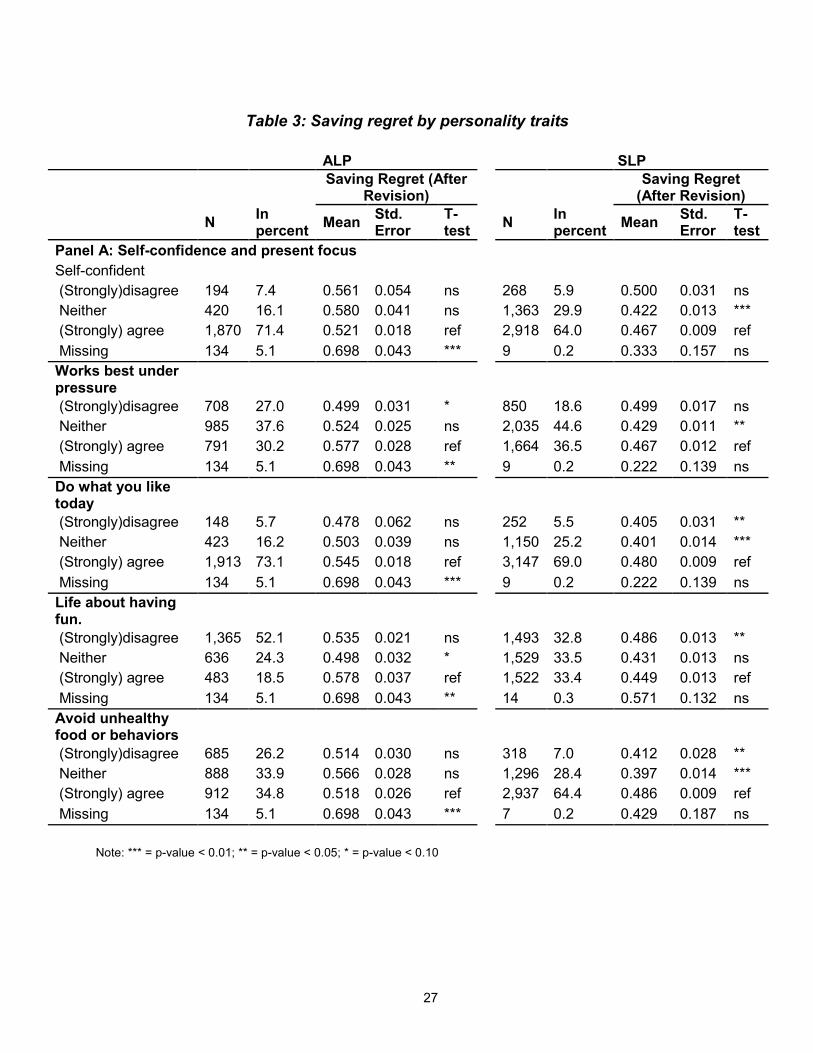
bias. In Table 3 we show how saving regret varies by such measures of personal traits.
The first five traits are meant to measure self-confidence and a focus on the
present. Because of very few responses in some of the categories, we collapsed the
five response categories (strongly disagree, disagree, neither agree nor disagree,
agree, strongly agree) into three categories (strongly disagree and disagree, neither
4 In the ALP the lowest tercile is mostly composed of those who completed high school,
whereas in the SLP, it is mostly composed of those with a primary education only. 5 The large number of missing values in the ALP are due to wealth data being collected in a
different wave of the ALP. It is only in the overlap cases that we have a wealth measure.
13
agree nor disagree, agree and strongly agree). Of interest, first, is the distribution of the
populations across the response categories. The SLP responses are split evenly
between the three categories, whereas the ALP responses are strongly shifted toward
“disagree.” The other notable difference is the response to the statement “For the sake
of my health, I stay away from unhealthy foods or behaviors that I might enjoy.” Some
35% of ALP respondents agreed with that statement compared with 64% of SLP
respondents. The distribution of responses to the other three categories are similar
across the two populations.
When we consider the relationship between the responses to the characteristics
and the expressing of saving regret, we find little correlation. For each of the five
characteristics in Panel A, we estimated the mean expression of regret over each of the
three response categories, and we make comparisons between the reference category,
the category with the most observations, and the other two categories, for a total of 10
comparisons. In the ALP, there were no significant differences in saving regret. In the
SLP, there were seven significant differences in two-sided tests at the 5% level, but just
three of them had the expected sign, that is an increase in regret for an increase in a
measure of a focus on the present. For example, 48% of those agreeing with “People
should do what they like today rather than putting it off until tomorrow” expressed saving
regret compared with 41% of those disagreeing and 40% of those neither agreeing nor
disagreeing. That is, people with a greater focus on the present were somewhat more
likely to express regret. However, in the other four significant comparisons, the sign of
the difference did not align with expectations. For example, among those who agreed
with the statement “For the sake of my health, I stay away from unhealthy foods or
14
behaviors that I might enjoy,” 49% expressed saving regret compared with 40% among
those who neither agreed nor disagreed with the statement.
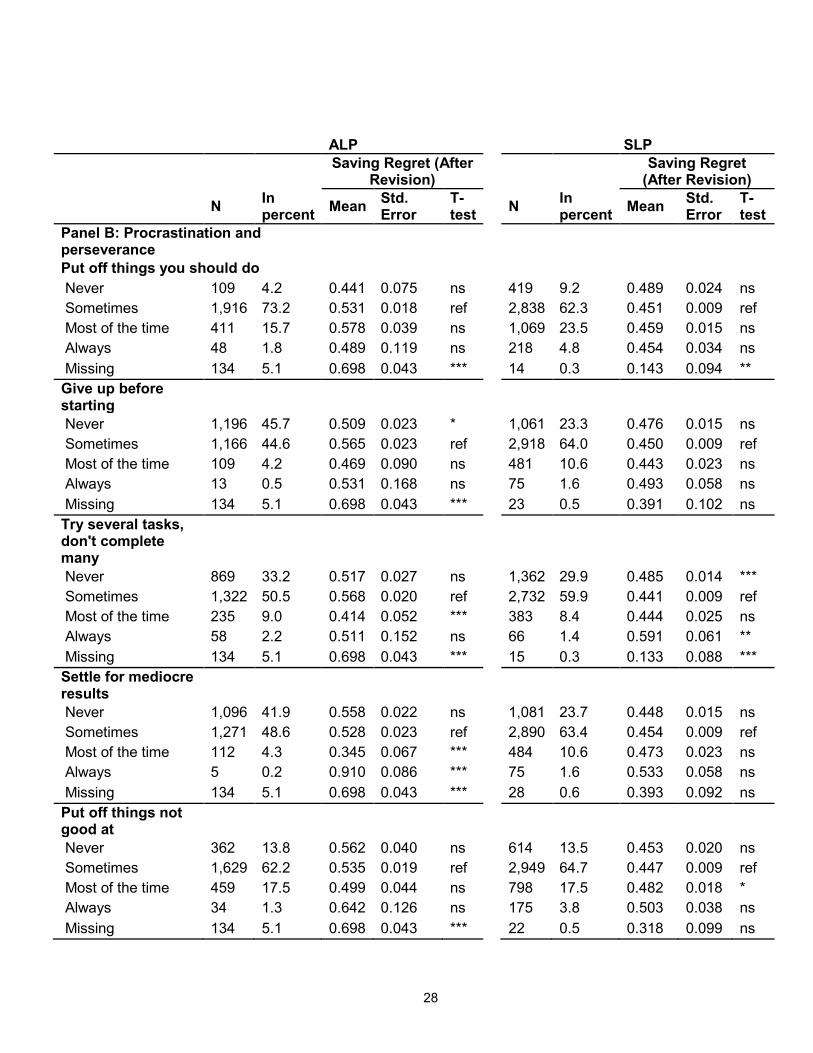
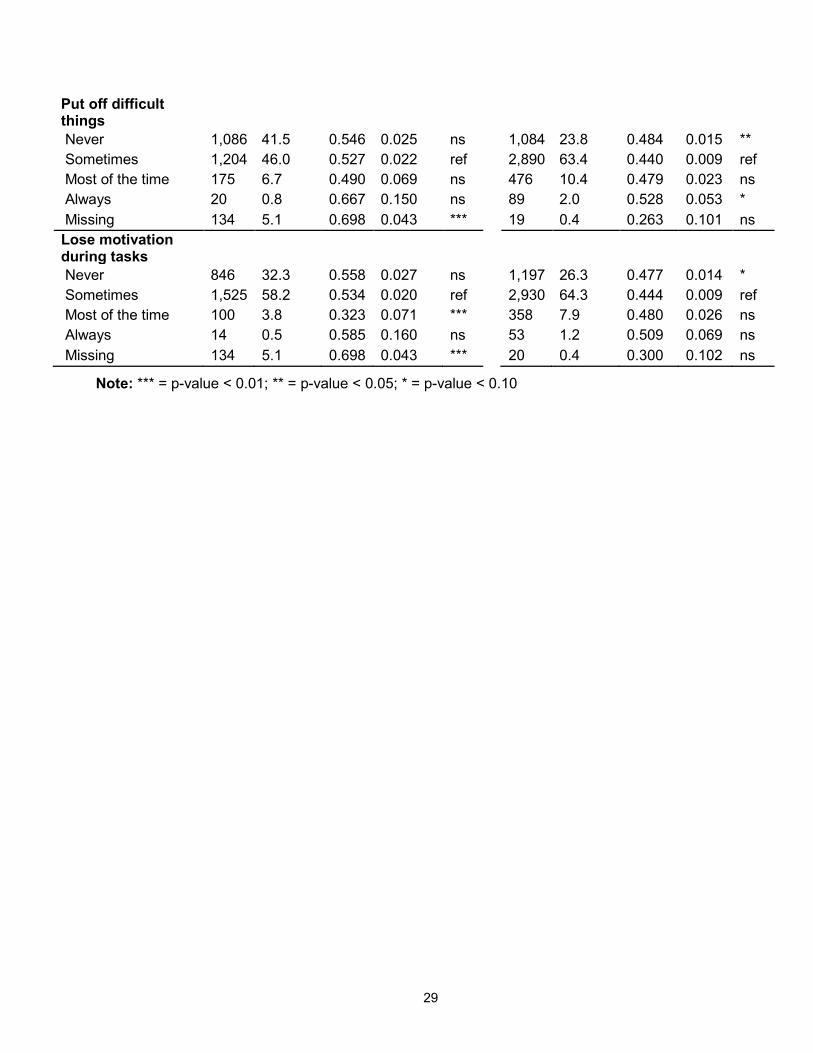
In Panel B, we show the estimates across seven statements about self-perceived
behavior. These seven may have more validity than the five in Panel A because they
ask about what individuals have actually done rather than self-perception. Several
would seem to apply directly to an inability to save such as “How often do you give up a
task when it gets difficult?” In both the ALP and the SLP, we conducted comparisons
between the reference category and the other three categories for each of the seven
behaviors for a total of 21 comparisons. In the ALP there were four significant
differences, but three were not of the anticipated sign. For example, among those who
responded “most of the time” to the question “How often do you settle for mediocre
results when you could do better?,” 35% expressed saving regret compared with 53%
among those who responded “sometimes.” In the SLP, there were three significant
comparisons, but just one had the anticipated sign: The rate of regret among those who
always try several tasks but don’t complete many was 15 percentage points higher than
the reference group (“sometimes”). However, that group comprised just 1.4 percent of
the population.
Table 4 shows the fraction expressing regret as a function of several attributes
that perhaps could be called skills. In both the ALP and the SLP large fractions have
missing values because the questions about these attributes were not on all the
surveys: the data on those attributes had to be retrieved from other ALP and SLP
surveys which were not taken by some of our respondents. The most frequent
responses to planning horizon were “next few years” or “5-10 years.” In the ALP there is
15
a monotonic reduction in regret as the planning horizon increases, although no horizons
are significant relative to the reference group. In the SLP, there is little variation in regret
except at the long horizon of 10 years or more. In the ALP, regret declines
monotonically as financial literacy increases, and the differences are large and
significant. By contrast, in the SLP there is no consistent variation in regret as a function
of financial literacy. Probability numeracy is a skill that ought to help people make better
financial decisions, and it is associated with saving regret: in both the ALP and SLP
those who had more correct answers on questions designed to test probability
numeracy were less likely to express saving regret.
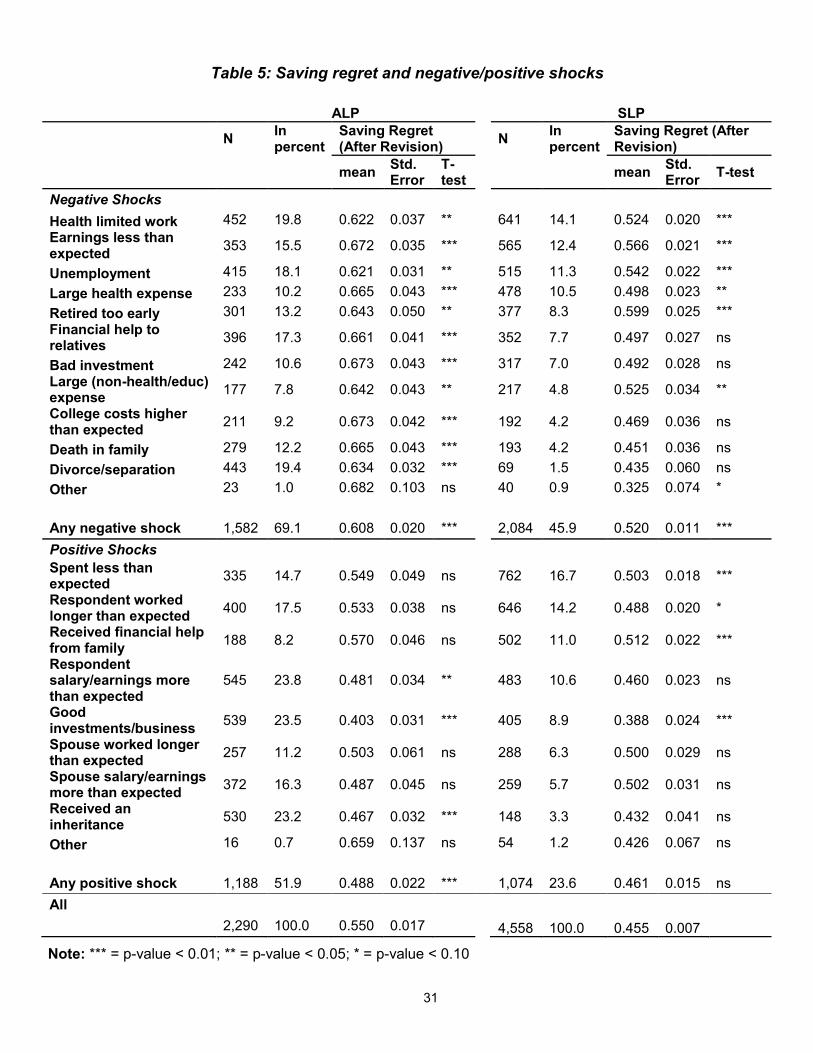
Table 5 shows the frequency of negative and positive shocks in the ALP and
SLP, ordered from most frequent to least in the SLP, and the likelihood of expressing
regret. The overall level of negative shocks is much higher in the ALP: 69% reported
that they had such a shock that impacted their financial position compared with 46% in
the SLP. Four shocks are related to the labor market. Their frequencies are higher in
the ALP and their effects on saving regret are much larger. In the ALP, the frequency of
saving regret among those who did not report a negative shock was 0.421 (see Table 7,
Panel B). Among those who experienced an unemployment shock (a spell “that cause
their finances to turn out worse than expected”), the proportion who stated regret was
0.621, a difference in the frequency of 0.20. In Singapore, among those who did not
experience a negative shock the frequency of expressing regret was 0.401. Among
those who experienced an unemployment shock, the frequency of expressing regret
was 0.542, an increase of 0.14. The other labor market shocks, “health limited work,”
“retired too early,” and “earnings less than expected,” are stated more frequently in the
16
ALP. Each also causes higher proportions of respondents in the ALP than in the SLP to
express saving regret. Other shocks more common in the ALP than in the SLP include
giving financial help to relatives, having unexpectedly high college costs, having a death
in the family, and having a divorce or separation. The impact of such shocks on saving
regret is substantial in the ALP, but negligible in the SLP. The frequency of a health
care spending shock is about the same in both surveys, but the consequences for
expressing regret are much greater in the ALP: an increase of 0.244 versus 0.097.
A larger proportion of ALP respondents reported having a positive shock, and the
shocks had a greater impact on saving regret. In the ALP, those who had any positive
shock expressed regret 6 percentage points less often than the average, but a positive
shock had essentially no effect on regret in the SLP. In both surveys, having good
investments or a good business resulted in significant reductions in expressing regret,
but relatively few SLP respondents gave such a report.
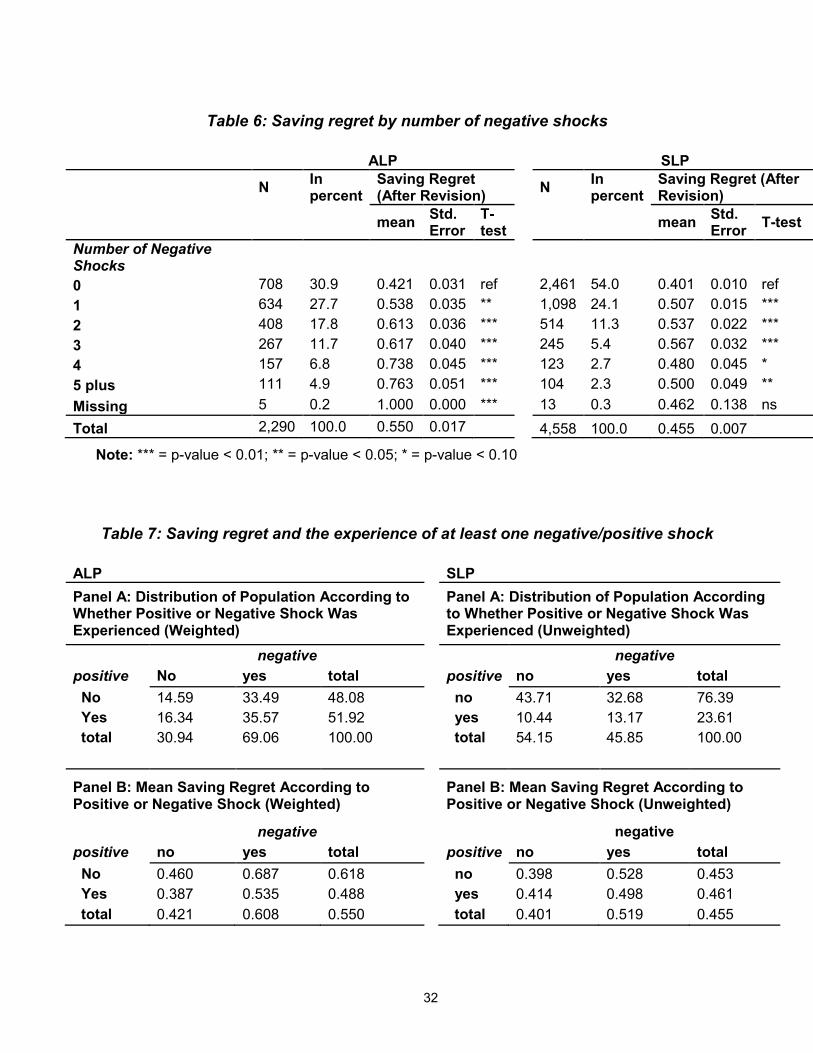
Table 6 shows the distribution of negative shocks and the associated likelihood
of regret. In the ALP, 31% of the respondents had no shocks; in the SLP, 54% had
none. Among those who did not have a shock the likelihood of regret was almost the
same, 0.421 compared with 0.401. Thus, a first explanation for the difference in the
level of regret between the U.S. and Singapore is that many more in the U.S. had one
or more negative shocks. The difference in shock prevalence is also seen at the upper
tail of the distribution: 24% of the ALP respondents reported three or more shocks
compared with just 10% in the SLP. Furthermore, the consequences of several shocks
for saving regret are greater in the ALP: The likelihood of regret increases with the
17
number of shocks, reaching 0.76 for five or more shocks, whereas the likelihood is
approximately flat at 0.50 for any number of shocks in the SLP.
Table 7, Panel A, shows the joint distribution of any positive or negative shock.
The likelihood of either type of shock is higher in the ALP. In the ALP, there is no
correlation between negative or positive shocks. For example, the likelihood of a
positive shock given a negative shock is 0.515 versus an unconditional probability of
0.519. But in the SLP, the correlation is positive: The likelihood of a positive shock given
a negative shock is 0.29 versus an unconditional probability of 0.24.
Panel B shows the likelihood of expressing regret. Reflecting the differences in
the consequences of a shock, the variation is much greater in the ALP than in the SLP.
The likelihood of regret is 0.39 among those who experienced a positive shock but not a
negative shock; this is 30 percentage points less than the likelihood among those who
experienced a negative shock but not a positive. In the SLP this difference is just 0.11.
The panel exhibits an odd result: In the SLP, those who experienced a positive shock
express saving regret slightly more often than those who do not experience such a
shock. Upon investigation of the details, we found that what we intended to be positive
shocks were often the consequences of a negative shock. For example, among those
who worked more than expected, which cet. par. would lead to greater lifetime
resources and possibly reduce saving regret, 61% experienced a negative shock
compared with 43% among those who did not work more than expected. The most
common negative shock was “earnings were less than expected,” suggesting that
working more than expected was a response to a shortfall in earnings. Similarly,
receiving financial help from family, which would be an increase in lifetime resources,
18
was associated with a greater likelihood of experiencing a negative shock, and the
increase was greatest for “health limited work,” followed by “large health expense.”
There is a similar although less pronounced tendency in the ALP: Among those who
worked more than expected, 80% experienced a negative shock compared with 67%
among those who did not work more than expected.
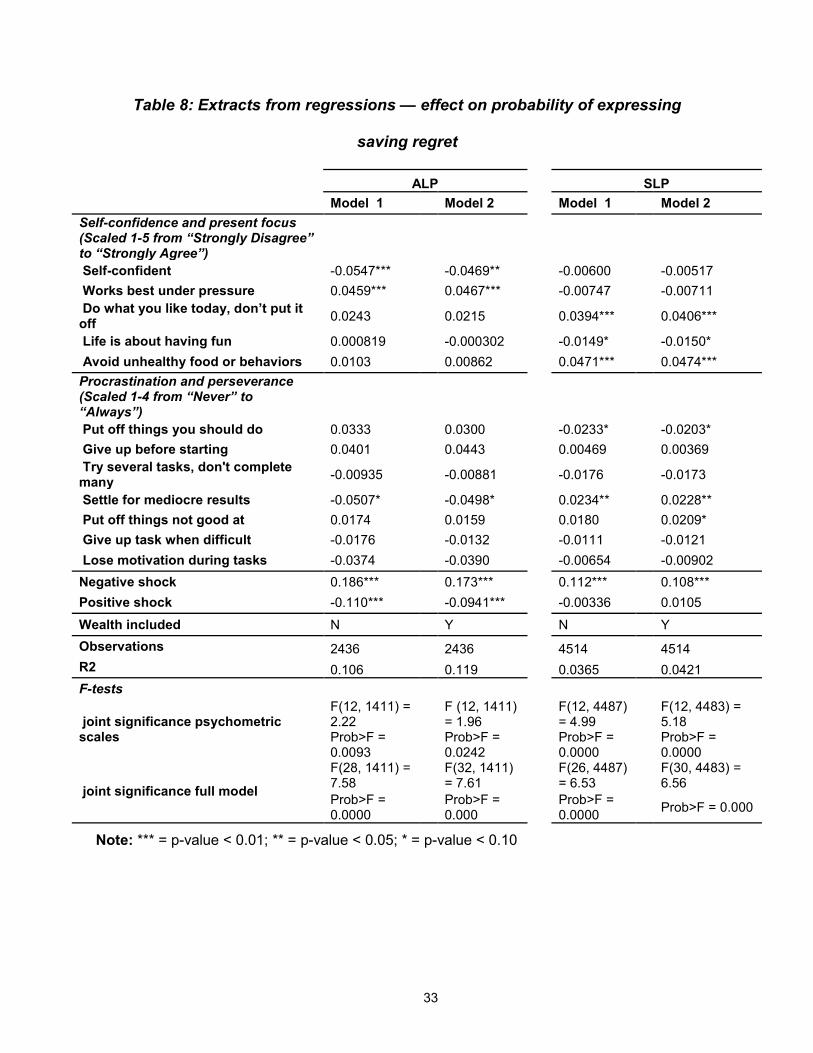
To check which of our main results are robust to controls for correlations among
the explanatory variables, we estimated regressions of the probability of regret on the
explanatory variables discussed in the preceding tables. The complete results are in the
Appendix. Table 8 has excerpts from those regressions. We entered the psychometric
variables linearly, scaled from 1 to 5 for the first group and from 1 to 4 for the second
group. Our priors for the first group are that the coefficients on “self-confident” and
“avoid unhealthy food or behaviors” would be negative and that the coefficient on “do
what you like today, don’t put it off,” “works best under pressure,” and “life is about
having fun” would be positive. In the second group, our priors were that all would be
positive. We estimated regressions that did and did not include wealth quartiles, but the
differences are negligible.
In the ALP in group 1, two coefficients are statistically significant and in accord
with our priors. The first, self-confident, has a negative coefficient; the second, works
best under pressure, has a positive coefficient. The other coefficients are not significant
and have a mix of signs with respect to conforming to priors. The coefficients that are
significant in the ALP are not significant in the SLP, and those significant in the SLP are
not significant in the ALP. Of the three that are significant in the SLP, only one, “Do
what you like today…” has the anticipated sign.
19
In the second ALP group, one coefficient is significant but it does not have the
anticipated sign: Those who tend to settle for mediocre results report less regret.
Ignoring significance levels, we find that three of the seven estimated coefficients have
the anticipated sign. In the SLP, the one significant coefficient, “settle for mediocre
results,” has the opposite sign from that in the ALP.
As for the effect of any negative shock, our regression results that do not control
for wealth quartile are similar to the results evident in the cross-tabs of Table 6. The
effect of any positive shock in the ALP is somewhat attenuated but remains significant
both statistically and in magnitude.
Discussion
Overall, we find saving regret is substantially lower in Singapore than in the U.S.
This may be a result of long-term economic conditions in each nation. The Singapore
economy has grown greatly for many years, possibly leading to a current financial
position that is better than many had expected. By contrast, since 1973 the U.S. has
had periods of a stagnating economy with periods of quite high unemployment, possibly
leading to a current financial position that is worse than many expected. The Great
Recession appears to be particularly relevant for this observation: Our U.S sample of 60
to 74 year olds would have been in prime saving years for retirement at the time of the
downturn.
Although both economies are market-driven and place considerable weight on
self-reliance, Singapore has an important forced saving mechanism, the CPF. While the
U.S. Social Security system may be even more important for retirement saving than the
CPF, particularly for low-income individuals because of the progressivity in its benefit
20
schedule, it does not force saving for health care or as a buffer for negative economic
shocks.
Actual saving outcomes in the U.S. and Singapore are similar, but the
components of saving differ substantially. According to the 2018 SLP survey, median
wealth in our target population was $613,000, converted from Singapore dollars to 2018
U.S. dollars using purchasing power parity. Median values of the components of wealth
were $377,000, housing; $116,000, CPF wealth; and $38,000, financial wealth. Median
wealth in the U.S. in the 2016 HRS was $559,000. Median values of components were
$120,000, housing; $260,000, Social Security wealth: and $59,000, financial wealth.6
Although the median wealth values are similar, the heavy concentration of wealth in
housing renders Singaporeans effectively poorer because they must finance
nonhousing consumption out of much less wealth. At the same time, because health
care can be paid from CPF savings, and because health care is so much cheaper in
Singapore than in the U.S., Singaporeans are perhaps better able to self-finance their
health care. While nearly all U.S. retired persons have Medicare, 8.6% of total spending
by those 55 to 64 and 12.3% of total spending by those 65 to 74 was on out-of-pocket
medical expenses.
Shocks appear to be quite important in both countries. Among SLP respondents,
46% had a negative shock that affected their financial position; among ALP
respondents, 69% had one. The effect of shocks was not symmetric; very few reported
they wished that they had saved less. Shocks did have a smaller impact on saving
6 The HRS total wealth does not include a wealth equivalent of DB pension entitlements, DC
pension balances from prior jobs (just the current job), nor a wealth equivalent to a claim on Medicare benefits.
21
regret among SLP respondents, which is consistent with shocks for SLP respondents
being less severe. Some institutional reasons may also contribute to shocks having less
of an impact in Singapore. In 2017, Singapore spent just 4.4% of GDP on health care
while the U.S. spent 17.9%. As a result, the forced contributions to saving in MediSave
coupled with possibly some small co-pays could shield many Singaporeans from health
care spending shocks.
College expenses may also cause greater shocks in the U.S. than in Singapore.
Between 1989 and 2016, the cost of attending a four-year university in the U.S. doubled
in real terms while median real wages barely increased.7 In Singapore, tuition at the five
autonomous universities increased by 14% in real terms between 2007 and 2016, but
median wages increased by 23% in real terms. As a result, college education became
more affordable in Singapore but less affordable in the U.S.
Another large difference between the U.S. and Singapore is the frequency of a
death in the family (likely widowing but not specifically asked) and of divorce. Both are
more frequent in the U.S., and the effects of each on saving regret is higher in the U.S.
Labor market shocks are another difference between the countries: such shocks are
more frequent in the U.S., and the effect on saving regret is greater.
We did not find that psychometric variables explain much of saving regret in
either the U.S. or Singapore. We conclude that a battery of measures of procrastination,
or a tendency not to tackle difficult tasks as measured by 12 indicators, were of little use
in distinguishing persons who would have liked to have saved more from those who
7 https://www.forbes.com/sites/camilomaldonado/2018/07/24/price-of-college-increasing-almost-
8-times-faster-than-wages/#30efd6b66c1d
22
were satisfied with their saving behavior. Our second conclusion is that to understand
economic preparation for retirement we need to understand better the role of shocks.
Part of that understanding is to learn more about individual expectations regarding
lifetime shocks and their understanding of the consequences of shocks. An approach
undertaken by government in Singapore is to force people to engage in buffer stock
saving, but this is easier to do when an important sector, health care, is so much
cheaper.
23
References
Chetty, Raj, John N Friedman, Søren Leth-Petersen, Torben Heien Nielsen, and Tore
Olsen. "Active Vs. Passive Decisions and Crowd-out in Retirement Savings
Accounts: Evidence from Denmark." The Quarterly Journal of Economics 129,
no. 3 (2014): 1141-219.
Hurd, Michael and Susann Rohwedder,” Measuring Total Household Spending in a
Monthly Internet Survey: Evidence from the American Life Panel," in Improving
the Measurement of Consumer Expenditures, Eds. Christopher Carroll, Thomas
Crossley and John Sabelhaus, University of Chicago Press, 2015, pp. 365-387.
Hurd, Michael and Susann Rohwedder, “The Impact of Unemployment on Income,
Spending and Subjective Well-Being,” presentation at “Japan-Singapore Health
& Labour Policy Roundtable,” August 30, 2018. Center for Research on the
Economics of Ageing, Singapore Management University.
Laibson, David. "Golden Eggs and Hyperbolic Discounting." The Quarterly Journal of
Economics 112, no. 2 (1997): 443-78.
Laibson, David. "Life-Cycle Consumption and Hyperbolic Discount Functions."
European Economic Review 42, no. 3-5 (1998): 861-71.
Laibson, David I, Andrea Repetto, Jeremy Tobacman, Robert E Hall, William G Gale,
and George A Akerlof. "Self-Control and Saving for Retirement." Brookings
Papers on Economic Activity 1998, no. 1 (1998): 91-196.
Lewis, Carol. "Why Barack Obama and David Cameron Are Keen To 'nudge' you."
Times Online, July 14 2008.
Pollard, Michael S. and Matthew D. Baird, The RAND American Life Panel: Technical
Description. Santa Monica, CA: RAND Corporation, 2017.
https://www.rand.org/pubs/research_reports/RR1651.html.
24
Thaler, Richard H. "Psychology and Savings Policies." The American Economic Review
84, no. 2 (1994): 186-92.
Thaler, Richard H, and Hersh M Shefrin. "An Economic Theory of Self-Control." Journal
of Political Economy 89, no. 2 (1981): 392-406.
Thaler, Richard H, and Cass R Sunstein. "Libertarian Paternalism." American Economic
Review 93, no. 2 (2003): 175-79.
Thaler, Richard H, and Cass R Sunstein. 2009. Nudge: Improving Decisions About
Health, Wealth, and Happiness: Penguin.
Tuckman, B. W. (1991). The development and concurrent validity of the Procrastination
Scale. Educational and Psychological Measurement, 51, 473–480.
Vaithianathan, Rhema, Bryce Hool, Michael D. Hurd, and Susann Rohwedder. (2018).
High-Frequency Internet Survey of a Probability Sample of Older Singaporeans:
The Singapore Life Panel®. The Singapore Economic Review, Special Edition on
Economic Issues of Population Aging in Asia.
https://doi.org/10.1142/S0217590818420043.
25
Table 1: Prevalence of saving regret, before and after revision
ALP SLP Total Total
Wish to have before revision
after revision
before revision
after revision
…saved more 66.0 54.2 53.3 45.5 …about the same 32.5 44.3
42.4 50.1
…saved less 1.5 1.5 4.4 4.4 Total 100.0 100.0 100.0 100.0 N 2,618 4,559
Note: In the SLP respondents were asked whether they would “Spend less and save more over the
years?” which we call the framed version of the question. In the ALP a random half sample were asked
the framed version; the other half were asked whether they would “Save more over the years?” which we
call the unframed version. The ALP results combine both random subsamples.
26
Table 2: Saving regret by sociodemographic characteristics
ALP SLP
Saving Regret (After
Revision) Saving Regret (After
Revision)
N In percent Mean Std. Error T-
test N In
percent Mean Std. Error
T-test
Total 2,618 100.0 0.542 0.015 4,558 100.0 0.455 0.007
Female
0 1,246 47.6 0.526 0.025 ref 2,247 49.3 0.465 0.011 ref 1 1,372 52.4 0.557 0.019 ns 2,311 50.7 0.446 0.010 ns
Age 60-64 1,058 40.4 0.581 0.024 ref 2,137 46.9 0.467 0.011 ref 65-69 926 35.4 0.531 0.024 ns 1,514 33.2 0.444 0.013 ns 70-74 634 24.2 0.494 0.032 ** 907 19.9 0.448 0.017 ns
Marital status
Married 1,747 66.7 0.517 0.019 ref 3,542 77.7 0.454 0.008 ref separated or divorced 505 19.3 0.625 0.030 *** 364 8.0 0.481 0.026 ns Widowed 242 9.2 0.617 0.048 * 227 5.0 0.463 0.033 ns never married 120 4.6 0.426 0.068 ns 421 9.2 0.444 0.024 ns Missing 4 0.2 0.000 0.000 *** 4 0.1 0.250 0.217
Education terciles Lowest 874 33.4 0.528 0.034 ref 1,520 33.3 0.447 0.013 ref 2 871 33.3 0.605 0.023 * 1,519 33.3 0.460 0.013 ns Highest 873 33.3 0.494 0.017 ns 1,519 33.3 0.460 0.013 ns
Wealth quartiles
Lowest 328 12.5 0.595 0.048 ref 1,150 25.2 0.463 0.015 ref 2 323 12.3 0.654 0.045 ns 1,129 24.8 0.469 0.015 ns 3 323 12.3 0.559 0.040 ns 1,133 24.9 0.495 0.015 ns Highest 324 12.4 0.355 0.038 *** 1,129 24.8 0.398 0.015 *** Missing 1,320 50.4 0.544 0.021 ns 17 0.4 0.294 0.111 ns
Income quartiles
Lowest 670 25.6 0.507 0.034 ref 1,022 22.4 0.465 0.016 ref 2 688 26.3 0.595 0.031 * 1,020 22.4 0.441 0.016 ns 3 585 22.4 0.558 0.028 ns 1,038 22.8 0.486 0.016 ns Highest 642 24.5 0.508 0.023 ns 986 21.6 0.440 0.016 ns Missing 33 1.3 0.535 0.142 ns 492 10.8 0.433 0.022 ns
Fair or poor health
0 2,029 77.5 0.533 0.017 ref 2,782 61.0 0.430 0.009 ref 1 589 22.5 0.576 0.034 ns 1,776 39.0 0.495 0.012 ***
Fair or poor memory
0 2,199 84.0 0.537 0.017 ref
1 285 10.9 0.512 0.048 ns
Missing 134 5.1 0.698 0.043 ***
Note: *** = p-value < 0.01; ** = p-value < 0.05; * = p-value < 0.10
27
Table 3: Saving regret by personality traits
ALP SLP
Saving Regret (After
Revision) Saving Regret
(After Revision)
N In
percent Mean Std. Error
T-test
N In percent Mean Std.
Error T-test
Panel A: Self-confidence and present focus Self-confident (Strongly)disagree 194 7.4 0.561 0.054 ns 268 5.9 0.500 0.031 ns Neither 420 16.1 0.580 0.041 ns 1,363 29.9 0.422 0.013 *** (Strongly) agree 1,870 71.4 0.521 0.018 ref 2,918 64.0 0.467 0.009 ref Missing 134 5.1 0.698 0.043 *** 9 0.2 0.333 0.157 ns Works best under pressure (Strongly)disagree 708 27.0 0.499 0.031 * 850 18.6 0.499 0.017 ns Neither 985 37.6 0.524 0.025 ns 2,035 44.6 0.429 0.011 ** (Strongly) agree 791 30.2 0.577 0.028 ref 1,664 36.5 0.467 0.012 ref Missing 134 5.1 0.698 0.043 ** 9 0.2 0.222 0.139 ns Do what you like today (Strongly)disagree 148 5.7 0.478 0.062 ns 252 5.5 0.405 0.031 ** Neither 423 16.2 0.503 0.039 ns 1,150 25.2 0.401 0.014 *** (Strongly) agree 1,913 73.1 0.545 0.018 ref 3,147 69.0 0.480 0.009 ref Missing 134 5.1 0.698 0.043 *** 9 0.2 0.222 0.139 ns Life about having fun. (Strongly)disagree 1,365 52.1 0.535 0.021 ns 1,493 32.8 0.486 0.013 ** Neither 636 24.3 0.498 0.032 * 1,529 33.5 0.431 0.013 ns (Strongly) agree 483 18.5 0.578 0.037 ref 1,522 33.4 0.449 0.013 ref Missing 134 5.1 0.698 0.043 ** 14 0.3 0.571 0.132 ns Avoid unhealthy food or behaviors
(Strongly)disagree 685 26.2 0.514 0.030 ns 318 7.0 0.412 0.028 ** Neither 888 33.9 0.566 0.028 ns 1,296 28.4 0.397 0.014 *** (Strongly) agree 912 34.8 0.518 0.026 ref 2,937 64.4 0.486 0.009 ref Missing 134 5.1 0.698 0.043 *** 7 0.2 0.429 0.187 ns
Note: *** = p-value < 0.01; ** = p-value < 0.05; * = p-value < 0.10
28
ALP SLP
Saving Regret (After
Revision) Saving Regret
(After Revision)
N In
percent Mean Std. Error
T-test
N In percent Mean Std.
Error T-test
Panel B: Procrastination and perseverance
Put off things you should do
Never 109 4.2 0.441 0.075 ns 419 9.2 0.489 0.024 ns Sometimes 1,916 73.2 0.531 0.018 ref 2,838 62.3 0.451 0.009 ref Most of the time 411 15.7 0.578 0.039 ns 1,069 23.5 0.459 0.015 ns Always 48 1.8 0.489 0.119 ns 218 4.8 0.454 0.034 ns Missing 134 5.1 0.698 0.043 *** 14 0.3 0.143 0.094 ** Give up before starting
Never 1,196 45.7 0.509 0.023 * 1,061 23.3 0.476 0.015 ns Sometimes 1,166 44.6 0.565 0.023 ref 2,918 64.0 0.450 0.009 ref Most of the time 109 4.2 0.469 0.090 ns 481 10.6 0.443 0.023 ns Always 13 0.5 0.531 0.168 ns 75 1.6 0.493 0.058 ns Missing 134 5.1 0.698 0.043 *** 23 0.5 0.391 0.102 ns Try several tasks, don't complete many
Never 869 33.2 0.517 0.027 ns 1,362 29.9 0.485 0.014 *** Sometimes 1,322 50.5 0.568 0.020 ref 2,732 59.9 0.441 0.009 ref Most of the time 235 9.0 0.414 0.052 *** 383 8.4 0.444 0.025 ns Always 58 2.2 0.511 0.152 ns 66 1.4 0.591 0.061 ** Missing 134 5.1 0.698 0.043 *** 15 0.3 0.133 0.088 *** Settle for mediocre results
Never 1,096 41.9 0.558 0.022 ns 1,081 23.7 0.448 0.015 ns Sometimes 1,271 48.6 0.528 0.023 ref 2,890 63.4 0.454 0.009 ref Most of the time 112 4.3 0.345 0.067 *** 484 10.6 0.473 0.023 ns Always 5 0.2 0.910 0.086 *** 75 1.6 0.533 0.058 ns Missing 134 5.1 0.698 0.043 *** 28 0.6 0.393 0.092 ns Put off things not good at
Never 362 13.8 0.562 0.040 ns 614 13.5 0.453 0.020 ns Sometimes 1,629 62.2 0.535 0.019 ref 2,949 64.7 0.447 0.009 ref Most of the time 459 17.5 0.499 0.044 ns 798 17.5 0.482 0.018 * Always 34 1.3 0.642 0.126 ns 175 3.8 0.503 0.038 ns Missing 134 5.1 0.698 0.043 *** 22 0.5 0.318 0.099 ns
29
Put off difficult things
Never 1,086 41.5 0.546 0.025 ns 1,084 23.8 0.484 0.015 ** Sometimes 1,204 46.0 0.527 0.022 ref 2,890 63.4 0.440 0.009 ref Most of the time 175 6.7 0.490 0.069 ns 476 10.4 0.479 0.023 ns Always 20 0.8 0.667 0.150 ns 89 2.0 0.528 0.053 * Missing 134 5.1 0.698 0.043 *** 19 0.4 0.263 0.101 ns Lose motivation during tasks
Never 846 32.3 0.558 0.027 ns 1,197 26.3 0.477 0.014 * Sometimes 1,525 58.2 0.534 0.020 ref 2,930 64.3 0.444 0.009 ref Most of the time 100 3.8 0.323 0.071 *** 358 7.9 0.480 0.026 ns Always 14 0.5 0.585 0.160 ns 53 1.2 0.509 0.069 ns Missing 134 5.1 0.698 0.043 *** 20 0.4 0.300 0.102 ns
Note: *** = p-value < 0.01; ** = p-value < 0.05; * = p-value < 0.10
30
Table 4. Saving regret by financial planning horizon,
financial literacy and numeracy
ALP
Saving Regret
(After Revision) Saving Regret (After
Revision)
N In percent Mean Std.
Error T-test
N In percent Mean Std.
Error T-test
Financial Planning Horizon I don't plan 70 4.4 0.68 0.071 ns Next few months 234 14.7 0.648 0.034 ns 577 12.7 0.492 0.021 ns Next year 155 9.7 0.64 0.04 ns 341 7.5 0.443 0.027 ns Next few years 299 18.8 0.593 0.029 ref 1,352 29.7 0.471 0.014 ref Next 5-10 years 260 16.3 0.565 0.029 ns 1,061 23.3 0.465 0.015 ns Longer than 10 years 189 11.9 0.508 0.034 *
689 15.1 0.398 0.019 ***
Missing 384 24.1 0.552 0.025 ** 538 11.8 0.441 0.021 ns Financial Literacy 0 correct answers 69 4.3 0.747 0.068 *** 352 7.7 0.426 0.026 ns 1 correct answer 132 8.3 0.737 0.045 *** 590 12.9 0.463 0.021 ns 2 correct answers 268 16.9 0.687 0.03 *** 1,316 28.9 0.467 0.014 ns 3 correct answers 452 28.4 0.556 0.02 ref 1,431 31.4 0.453 0.013 ref Missing 669 42.1 0.517 0.02 ns 869 19.1 0.450 0.017 ns Probability Numeracy
0 or 1 correct answers 146 9.2 0.505 0.045 ns
728 16.0 0.521 0.019 ns
2 correct answers 272 17.1 0.659 0.03 ** 580 12.7 0.495 0.021 ns 3 correct answers 491 30.9 0.581 0.021 ref 702 15.4 0.499 0.019 ref 4 correct answers 147 9.3 0.461 0.033 *** 1,204 26.4 0.416 0.014 *** 5 correct answers 447 9.8 0.333 0.022 *** Missing 534 33.6 0.607 0.024 ns 897 19.7 0.457 0.017 ***
Note: *** = p-value < 0.01; ** = p-value < 0.05; * = p-value < 0.10
31
Table 5: Saving regret and negative/positive shocks
ALP SLP
N In percent
Saving Regret (After Revision)
N In percent
Saving Regret (After Revision)
mean Std. Error
T-test
mean Std.
Error T-test
Negative Shocks Health limited work 452 19.8 0.622 0.037 ** 641 14.1 0.524 0.020 *** Earnings less than expected 353 15.5 0.672 0.035 *** 565 12.4 0.566 0.021 ***
Unemployment 415 18.1 0.621 0.031 ** 515 11.3 0.542 0.022 *** Large health expense 233 10.2 0.665 0.043 *** 478 10.5 0.498 0.023 ** Retired too early 301 13.2 0.643 0.050 ** 377 8.3 0.599 0.025 *** Financial help to relatives 396 17.3 0.661 0.041 *** 352 7.7 0.497 0.027 ns
Bad investment 242 10.6 0.673 0.043 *** 317 7.0 0.492 0.028 ns Large (non-health/educ) expense 177 7.8 0.642 0.043 ** 217 4.8 0.525 0.034 **
College costs higher than expected 211 9.2 0.673 0.042 *** 192 4.2 0.469 0.036 ns
Death in family 279 12.2 0.665 0.043 *** 193 4.2 0.451 0.036 ns Divorce/separation 443 19.4 0.634 0.032 *** 69 1.5 0.435 0.060 ns Other 23 1.0 0.682 0.103 ns 40 0.9 0.325 0.074 *
Any negative shock 1,582 69.1 0.608 0.020 *** 2,084 45.9 0.520 0.011 *** Positive Shocks Spent less than expected 335 14.7 0.549 0.049 ns 762 16.7 0.503 0.018 ***
Respondent worked longer than expected 400 17.5 0.533 0.038 ns 646 14.2 0.488 0.020 *
Received financial help from family 188 8.2 0.570 0.046 ns 502 11.0 0.512 0.022 ***
Respondent salary/earnings more than expected
545 23.8 0.481 0.034 ** 483 10.6 0.460 0.023 ns
Good investments/business 539 23.5 0.403 0.031 *** 405 8.9 0.388 0.024 ***
Spouse worked longer than expected 257 11.2 0.503 0.061 ns 288 6.3 0.500 0.029 ns
Spouse salary/earnings more than expected 372 16.3 0.487 0.045 ns 259 5.7 0.502 0.031 ns
Received an inheritance 530 23.2 0.467 0.032 *** 148 3.3 0.432 0.041 ns
Other 16 0.7 0.659 0.137 ns 54 1.2 0.426 0.067 ns
Any positive shock 1,188 51.9 0.488 0.022 *** 1,074 23.6 0.461 0.015 ns All 2,290 100.0 0.550 0.017 4,558 100.0 0.455 0.007
Note: *** = p-value < 0.01; ** = p-value < 0.05; * = p-value < 0.10
32
Table 6: Saving regret by number of negative shocks
ALP SLP
N In percent
Saving Regret (After Revision)
N In percent
Saving Regret (After Revision)
mean Std. Error
T-test mean Std.
Error T-test
Number of Negative Shocks 0 708 30.9 0.421 0.031 ref 2,461 54.0 0.401 0.010 ref 1 634 27.7 0.538 0.035 ** 1,098 24.1 0.507 0.015 *** 2 408 17.8 0.613 0.036 *** 514 11.3 0.537 0.022 *** 3 267 11.7 0.617 0.040 *** 245 5.4 0.567 0.032 *** 4 157 6.8 0.738 0.045 *** 123 2.7 0.480 0.045 * 5 plus 111 4.9 0.763 0.051 *** 104 2.3 0.500 0.049 ** Missing 5 0.2 1.000 0.000 *** 13 0.3 0.462 0.138 ns Total 2,290 100.0 0.550 0.017 4,558 100.0 0.455 0.007
Note: *** = p-value < 0.01; ** = p-value < 0.05; * = p-value < 0.10
Table 7: Saving regret and the experience of at least one negative/positive shock
ALP SLP Panel A: Distribution of Population According to Whether Positive or Negative Shock Was Experienced (Weighted)
Panel A: Distribution of Population According to Whether Positive or Negative Shock Was Experienced (Unweighted)
negative negative positive No yes total positive no yes total No 14.59 33.49 48.08 no 43.71 32.68 76.39 Yes 16.34 35.57 51.92 yes 10.44 13.17 23.61 total 30.94 69.06 100.00 total 54.15 45.85 100.00
Panel B: Mean Saving Regret According to Positive or Negative Shock (Weighted)
Panel B: Mean Saving Regret According to Positive or Negative Shock (Unweighted)
negative negative positive no yes total positive no yes total No 0.460 0.687 0.618 no 0.398 0.528 0.453 Yes 0.387 0.535 0.488 yes 0.414 0.498 0.461 total 0.421 0.608 0.550 total 0.401 0.519 0.455
33
Table 8: Extracts from regressions — effect on probability of expressing
saving regret
ALP SLP Model 1 Model 2 Model 1 Model 2 Self-confidence and present focus (Scaled 1-5 from “Strongly Disagree” to “Strongly Agree”)
Self-confident -0.0547*** -0.0469** -0.00600 -0.00517 Works best under pressure 0.0459*** 0.0467*** -0.00747 -0.00711 Do what you like today, don’t put it off 0.0243 0.0215
0.0394*** 0.0406***
Life is about having fun 0.000819 -0.000302 -0.0149* -0.0150* Avoid unhealthy food or behaviors 0.0103 0.00862 0.0471*** 0.0474*** Procrastination and perseverance (Scaled 1-4 from “Never” to “Always”)
Put off things you should do 0.0333 0.0300 -0.0233* -0.0203* Give up before starting 0.0401 0.0443 0.00469 0.00369 Try several tasks, don't complete many -0.00935
-0.00881
-0.0176 -0.0173
Settle for mediocre results -0.0507* -0.0498* 0.0234** 0.0228** Put off things not good at 0.0174 0.0159 0.0180 0.0209* Give up task when difficult -0.0176 -0.0132 -0.0111 -0.0121 Lose motivation during tasks -0.0374 -0.0390 -0.00654 -0.00902 Negative shock 0.186*** 0.173*** 0.112*** 0.108*** Positive shock -0.110*** -0.0941*** -0.00336 0.0105 Wealth included N Y N Y Observations 2436 2436 4514 4514 R2 0.106 0.119 0.0365 0.0421 F-tests
joint significance psychometric scales
F(12, 1411) = 2.22
F (12, 1411) = 1.96
F(12, 4487) = 4.99
F(12, 4483) = 5.18
Prob>F = 0.0093
Prob>F = 0.0242
Prob>F = 0.0000
Prob>F = 0.0000
joint significance full model F(28, 1411) = 7.58
F(32, 1411) = 7.61
F(26, 4487) = 6.53
F(30, 4483) = 6.56
Prob>F = 0.0000 Prob>F =
0.000 Prob>F = 0.0000 Prob>F = 0.000
Note: *** = p-value < 0.01; ** = p-value < 0.05; * = p-value < 0.10


![A Probabilistic Model for Minmax Regret in Combinatorial ...natarajan_karthik/wp... · Averbakh and Lebedev [6] proved that the minmax regret shortest path and minmax regret minimum](https://img.pdfslide.us/doc/110x75/5e6b5a2712edb25dd47620ca/a-probabilistic-model-for-minmax-regret-in-combinatorial-natarajankarthikwp.jpg)