Embed Size (px)
Citation preview

Savills Studley Report Seattle office sector Q4 2018
Savills Studley Research Seattle
SUMMARYMarket Highlights
STEADY LEASING
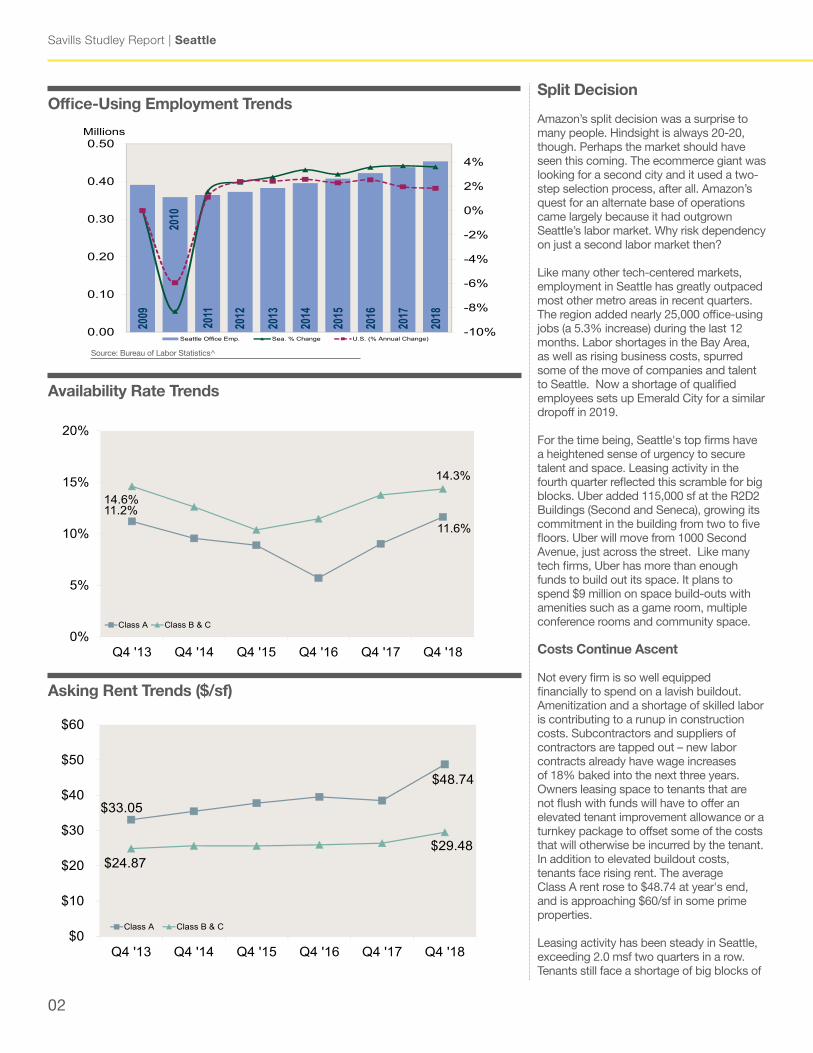
Tenants have leased nearly 9.0 million square feet (msf) in the four most recent quarters, well above the market’s long-term average.
AVAILABILITY RATES PUSH LOWER
Seattle’s overall availability rate fell a full percentage point, decreasing from 13.9% to 12.9%. The Class A availability rate dipped by 70 basis points to 11.6%.
SPIKE IN ASKING RENT
The overall asking rent rose by 3.4% to $38.59. The Class A average rent rose by 4.0% to $48.74 as new product continued to boost rent. Asking rent for some space in the newest properties is pushing into the mid-$50/sf range. SALES SPIKE
Office property sales during the first 11 months of 2018 totaled $4.9 billion, a 34% increase compared to the same period during 2017.
"Amazon’s choice of two alternate locations
– one outside the nation’s capital and the
other across from the U.S. financial capital
– took some by surprise. Dividing up the
operations between these two markets
makes more sense. The two markets have
nearly 15 million people and a workforce of
more than 3 million combined, about five
times the Seattle metro region.”
Eric Leland, Senior Managing Director
02
Savills Studley Report | Seattle
Split Decision
Amazon’s split decision was a surprise to many people. Hindsight is always 20-20, though. Perhaps the market should have seen this coming. The ecommerce giant was looking for a second city and it used a two-step selection process, after all. Amazon’s quest for an alternate base of operations came largely because it had outgrown Seattle’s labor market. Why risk dependency on just a second labor market then?
Like many other tech-centered markets, employment in Seattle has greatly outpaced most other metro areas in recent quarters. The region added nearly 25,000 office-using jobs (a 5.3% increase) during the last 12 months. Labor shortages in the Bay Area, as well as rising business costs, spurred some of the move of companies and talent to Seattle. Now a shortage of qualified employees sets up Emerald City for a similar dropoff in 2019.
For the time being, Seattle's top firms have a heightened sense of urgency to secure talent and space. Leasing activity in the fourth quarter reflected this scramble for big blocks. Uber added 115,000 sf at the R2D2 Buildings (Second and Seneca), growing its commitment in the building from two to five floors. Uber will move from 1000 Second Avenue, just across the street. Like many tech firms, Uber has more than enough funds to build out its space. It plans to spend $9 million on space build-outs with amenities such as a game room, multiple conference rooms and community space.
Costs Continue Ascent
Not every firm is so well equipped financially to spend on a lavish buildout. Amenitization and a shortage of skilled labor is contributing to a runup in construction costs. Subcontractors and suppliers of contractors are tapped out – new labor contracts already have wage increases of 18% baked into the next three years. Owners leasing space to tenants that are not flush with funds will have to offer an elevated tenant improvement allowance or a turnkey package to offset some of the costs that will otherwise be incurred by the tenant.In addition to elevated buildout costs, tenants face rising rent. The average Class A rent rose to $48.74 at year's end, and is approaching $60/sf in some prime properties.
Leasing activity has been steady in Seattle, exceeding 2.0 msf two quarters in a row. Tenants still face a shortage of big blocks of
Source: Bureau of Labor Statistics^
2009
2010
2011
2012
2013
2014
2015
2016
2017
2018
-10%
-8%
-6%
-4%
-2%
0%
2%
4%
0.00
0.10
0.20
0.30
0.40
0.50Millions
Seattle Office Emp. Sea. % Change U.S. (% Annual Change)
Office-Using Employment Trends
$48.74
$33.05
$29.48$24.87
$0
$10
$20
$30
$40
$50
$60
Q4 '18 Q4 '17Q4 '16Q4 '15Q4 '14Q4 '13
Class A Class B & C
Asking Rent Trends ($/sf)
11.6%11.2%
14.3%
14.6%
0%
5%
10%
15%
20%
Q4 '18 Q4 '17 Q4 '16 Q4 '15 Q4 '14 Q4 '13
Availability Rate Trends
Class A Class B & C
Availability Rate Trends

savills-studley.com/research 03
Q4 2018
Tenant Sq Feet Address Market AreaIndeed 200,000 1201 2nd Ave DowntownUber 115,000 1191 2nd Ave DowntownT-Mobile 121,163 13920 SE Eastgate Way Bellevue/EastsideAreanet Inc 64,407 3180 139th Ave SE Bellevue/EastsideSpaces 91,000 1201 2nd Ave DowntownVirtuoso 50,000 5050 1st Ave S DowntownNestle 47,456 450 Alaskan Way S DowntownDLA Piper 46,000 701 5th Ave DowntownFacebook, Inc. 37,056 10900 NE 4th St Bellevue/Eastside90N 34,354 3156 160th Ave SE Bellevue/Eastside
Sum of Leases 806,436
space within Downtown and the Eastside. Across the region, nearly 75% of the 6.5 msf underway is pre-leased. This total includes owner-user properties such as Amazon's Block 20. Seattle ended 2018 with an availability rate of 12.6%, down a full percentage point from the third quarter. Availability is well below 15% in all areas except for the Southend.
Future Projects Come into Focus
Over the last few years the tech sector, including biotech and life sciences have led the push into more areas of Downtown, including areas that were previously industrial. A recent report from The Downtown Seattle Association details the level of development in Downtown Seattle. Downtown has $5.6 billion of projects underway. This includes extensive multi-family development in South Lake Union and Denny Triangle. Hospitality also with record 2,192 new hotel rooms added in 2018.
Meanwhile, the NHL’s 32nd franchise, to be located in Seattle, will bring traffic to Simon Property Group’s planned development at the Northgate Mall. The NHL goal of 10,000 season ticket deposits was reached within 12 minutes and stood at 32,000 depositors. How many of these are Amazon employees is unknown.
“Office Ready Sites”
Until the last couple of years Dexter Corridor was one section of South Lake Union that had been left largely untouched by office development. BioMed Realty’s Dexter Yard is just one of the latest major undertakings in this micro-district. Located in between Dexter and Eighth Streets, the 515,000-sf lab/office building will feature 21,500-sf floorplates that will optimize flexibility. Tenants at The Yard will have access to The Field House. The open athletic field will reinforcethe flexibility within the office building and provide a play space that tenants and visitors can use for soccer. Previously an industrial section of Downtown, Dexter Corridor is now prime for office development - it already has restaurants, retail and public transportation.
Downtown Bellevue is also seeing some new construction activity. Vulcan Real Estate unveiled plans for Bellevue Plaza. The half-block project on the West side of 106th Avenue Northeast in the City Center South district would have three phases, each totaling nearly 300,000 sf.
In addition to such large-scale projects, adaptive re-use buildings have strong appeal to creative office space users. In November, Pastakia & Associates unveiled plans for a four-story building wrapping around the Bleitz Funeral Home. Called Fremont Crossing, the building will have 58,000 sf of indoor and outdoor office space, featuring floor-to-ceiling windows with views of Lake Union and canal. The owner will retain part of the original Funeral Home and connect two buildings with a two-story enclosed bridge. Patakia bought the building for $8 million in mid-November.
Housing Market Running up a Red Flag?
Just as Amazon finalized its HQ2 and HQ3 decision, home prices in the Seattle market dropped off more sharply. The Wall Street Journal recently reported that bidding wars for houses in Seattle have become less frequent.
In King County, for example, single-family home prices fell to $644,000 in November a sharp tumble from $726,000 in early 2018. Seattle posted the biggest decline in prices nationally with an 11.3% drop in the last six months. The number of houses on the market jumped by 114% year-over year.. A variety of areas, including East Bellevue, Eastside south of I-90 and Renton-Highlands, posted sharp declines in pricing. Businesses and landlords are better equipped than households to fund expansion. Still, the recent wavering in home prices suggest that the rally is losing some potency among consumers - the biggest factor in the U.S. economy.
Vacancy Rate Comparison Rental Rate Comparison ($/sf)
Major Transactions
$44.20
$41.33
$38.59
$34.69
$29.99
$26.55
$24.16
$0 $10 $20 $30 $40 $50
Downtown
Bellevue/Eastside
Seattle
US Index
Southend
Northend
Tacoma
10.0%
10.8%
11.9%
12.7%
12.9%
17.9%
29.0%
0% 10% 20% 30%
Bellevue/Eastside
Tacoma
Downtown
Northend
Seattle
US Index
Southend
Savills Studley Report | Seattle
04
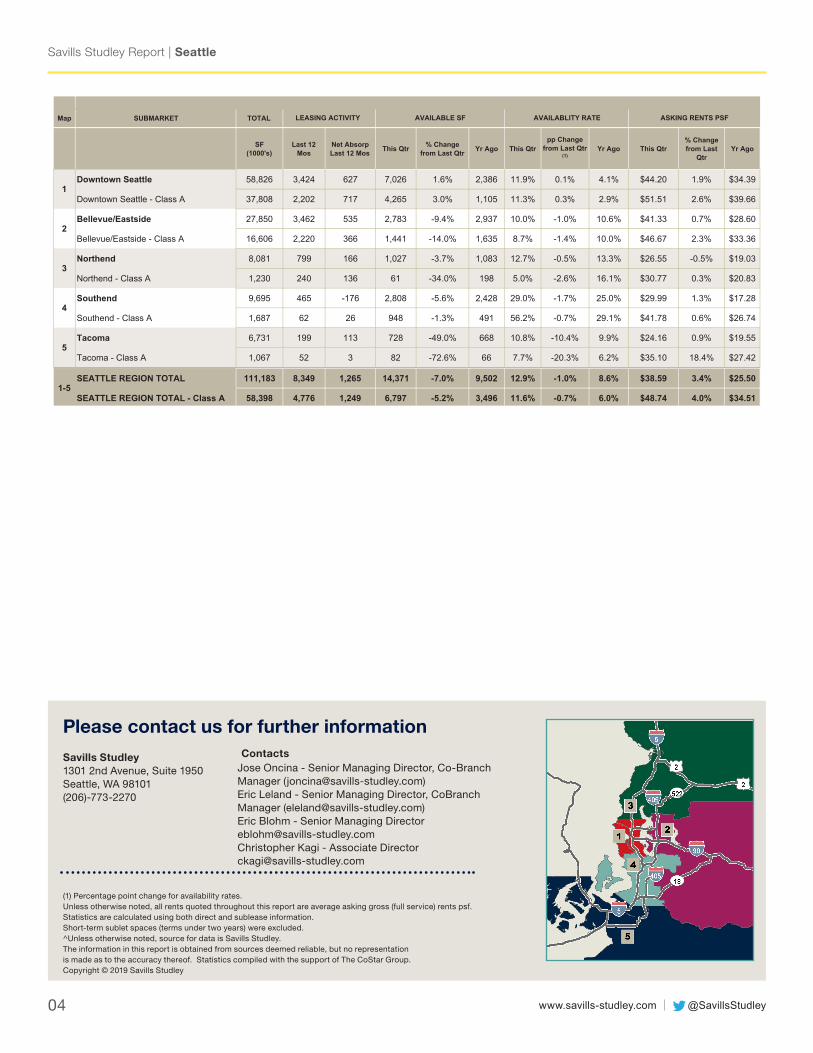
Map SUBMARKET TOTAL
SF(1000's)
Last 12 Mos
Net Absorp Last 12 Mos This Qtr % Change
from Last Qtr Yr Ago This Qtr pp Change
from Last Qtr (1)
Yr Ago This Qtr% Change from Last
QtrYr Ago
Downtown Seattle 58,826 3,424 627 7,026 1.6% 2,386 11.9% 0.1% 4.1% $44.20 1.9% $34.39
Downtown Seattle - Class A 37,808 2,202 717 4,265 3.0% 1,105 11.3% 0.3% 2.9% $51.51 2.6% $39.66
Bellevue/Eastside 27,850 3,462 535 2,783 -9.4% 2,937 10.0% -1.0% 10.6% $41.33 0.7% $28.60
Bellevue/Eastside - Class A 16,606 2,220 366 1,441 -14.0% 1,635 8.7% -1.4% 10.0% $46.67 2.3% $33.36
Northend 8,081 799 166 1,027 -3.7% 1,083 12.7% -0.5% 13.3% $26.55 -0.5% $19.03
Northend - Class A 1,230 240 136 61 -34.0% 198 5.0% -2.6% 16.1% $30.77 0.3% $20.83
Southend 9,695 465 -176 2,808 -5.6% 2,428 29.0% -1.7% 25.0% $29.99 1.3% $17.28
Southend - Class A 1,687 62 26 948 -1.3% 491 56.2% -0.7% 29.1% $41.78 0.6% $26.74
Tacoma 6,731 199 113 728 -49.0% 668 10.8% -10.4% 9.9% $24.16 0.9% $19.55
Tacoma - Class A 1,067 52 3 82 -72.6% 66 7.7% -20.3% 6.2% $35.10 18.4% $27.42
SEATTLE REGION TOTAL 111,183 8,349 1,265 14,371 -7.0% 9,502 12.9% -1.0% 8.6% $38.59 3.4% $25.50
SEATTLE REGION TOTAL - Class A 58,398 4,776 1,249 6,797 -5.2% 3,496 11.6% -0.7% 6.0% $48.74 4.0% $34.51
LEASING ACTIVITY AVAILABLITY RATE ASKING RENTS PSFAVAILABLE SF
1
2
3
4
5
1-5
@SavillsStudleywww.savills-studley.com
Contacts
Please contact us for further information
(1) Percentage point change for availability rates. Unless otherwise noted, all rents quoted throughout this report are average asking gross (full service) rents psf. Statistics are calculated using both direct and sublease information. Short-term sublet spaces (terms under two years) were excluded. ^Unless otherwise noted, source for data is Savills Studley.The information in this report is obtained from sources deemed reliable, but no representation is made as to the accuracy thereof. Statistics compiled with the support of The CoStar Group. Copyright © 2019 Savills Studley
Savills Studley1301 2nd Avenue, Suite 1950 Seattle, WA 98101(206)-773-2270
Jose Oncina - Senior Managing Director, Co-Branch Manager ([email protected])Eric Leland - Senior Managing Director, CoBranch Manager ([email protected])Eric Blohm - Senior Managing Director [email protected] Kagi - Associate [email protected]