Embed Size (px)
Citation preview
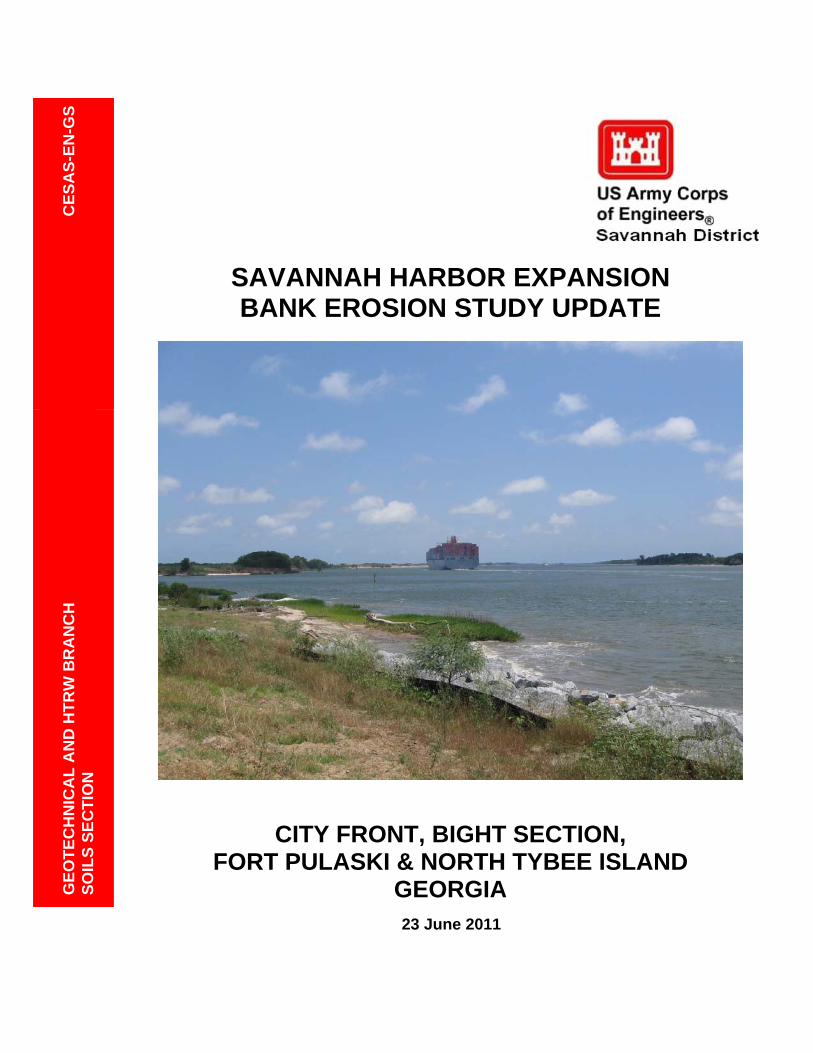
SAVANNAH HARBOR EXPANSION BANK EROSION STUDY UPDATE
CITY FRONT, BIGHT SECTION,
FORT PULASKI & NORTH TYBEE ISLAND GEORGIA
23 June 2011
C
ES
AS
-EN
-GS
GE
OT
EC
HN
ICA
L A
ND
HT
RW
BR
AN
CH
S
OIL
S S
EC
TIO
N

CESAW-TS-EG i
Savannah Harbor Expansion Bank Erosion Study Update
Table of Contents
Section Page
1.0 Introduction .......................................................................................... 1
2.0 Overview .............................................................................................. 1
3.0 General ................................................................................................. 1
4.0 Fort Pulaski and North Tybee Descriptions ....................................... 2
4.1 Fort Pulaski ................................................................................................................... 3
4.2 North Tybee .................................................................................................................. 4
5.0 Fort Pulaski ........................................................................................... 4
6.0 North Tybee .......................................................................................... 6
7.0 City Front .............................................................................................. 6
8.0 Confined Disposal Facility (Bight Section) ........................................ 6
9.0 Bank Stability Review .......................................................................... 6
10.0 Summary ............................................................................................. 6

CESAW-TS-EG ii
Appendices Appendix A 2003 Fleet Forecast Appendix B 2011 Fleet Forecast Appendix C General Location Map
References

CESAW-TS-EG 1
SAVANNAH HARBOR EXPANSION BANK EROSION STUDY UPDATE
1. Introduction
The Savannah District Geotechnical Section (CESAS-EN-GS) has completed review of the bank erosion studies for the shoreline at City Front, Bight Section, Fort Pulaski and North Tybee Island. This report supersedes all previous bank erosion studies for Savannah River. Study Update is based on the revised Fleet Forecast received April 2011, and includes available soils information, bathymetry, topographic surveys, aerial photographs, historical information, observation/review of channel side slopes resulting from previous harbor widening and deepening projects, and information from previous dredging regarding channel side slope performance. Direct correlations were made using the recently updated ‘Ship Forces on the Shoreline of the Savannah Harbor Project’ report completed by the US Army Engineer Research and Development Center (ERDC) in May 2011. Waves generated by ships traffic begins with an initial wave of a maximum height with trailing waves of a much smaller energy level. The duration of ship wakes on the shore are compared to everyday wave events, tidal, flow, rainfall, and other influences normal to the river system without ship traffic.
2. Overview This analysis estimates the loss of shoreline due to ship wakes as a direct result of deepening the Savannah River shipping channel near the City Front, Bight Section, Fort Pulaski property and the northern beach of Tybee Island, if any. This is taken as the difference between the ship wakes of today versus the ship wakes of the future, considering the without project condition compared with after deepening (with project). The total estimated shoreline erosion (due to all causes) is based on aerial photography from 1964 through 2003. While additional data is available, it doesn’t appear to change the outcome with regard to shoreline recession. Other shoreline changes are considered which include placement of dredged materials, armoring of adjacent shoreline, drainage features, and proximity of shoreline to the shipping channel. 3. General a. Original information available for the year 2003 and updated for 2010, the following without project forecast and calculations were completed for Containership + Tankers and General Cargo (GC) traffic: Information is presented for the total times (averaged) for any ship passing any given point of shoreline and thus causing waves that impact shoreline. Of the averaged event duration of 19.6 seconds for the estimated or given fleet, only three seconds maximum (approximately 15%) of the initial wave represents the highest energy level of consequence regardless of the ship size or speed. Smaller trailing waves are often less than wave activity normal to the shoreline at any given time without a ship passing event.
CESAW-TS-EG 2
From information available for the year 2010: 3,205 calls * 2 (inbound and outbound) equals 6,410 passing events of duration approximately 19.6 seconds for each ship corresponds to 125,636 seconds of impact during the year. Thus, the percent of time for ships passing any point is about 0.398% (0.00398) of the year of which only about 15% can be considered as having an effective impact on adjacent shoreline. The result is 0.060% for the year 2010. For the year 2017: 4,285 calls * 2 (inbound and outbound) equals 8,570 passing events, using same duration, corresponds to 167,972 seconds of impact during the year. Thus, the percent of time for ships passing a given point is about 0.532 % of the year and after applying the 15% impact correction, the result is 0.080% for the year 2017. Predicted for the year 2030 and beyond: 7,204 calls *2 (inbound and outbound) equals 14,408 passing events of the same duration which corresponds to about 282,397 seconds of impact during the year. Thus, the percent of time for ships passing a check point is about 0.895 % of the year 2030 and applying 15% for impact correction, the result is 0.134%. b. The latest Fleet Forecast from Economics, June 2011: For the year 2017: 4,285 calls were counted for the existing 42-foot channel depth and 4,133 calls are predicted if the channel is deepened to 47 or 48-feet. This indicates a notable reduction (3.5%) of calls, the result of which will reduce total energies and impacts to adjacent shorelines. For the year 2030 and beyond; 7,204 calls or 14,408 passing events are predicted for the without project (42’) condition and 6,714 calls or 13,428 passing events predicted for the 47-foot to 48-foot depth condition. This represents about a 7 percent reduction of ship passing events which reduces erosion forces interacting with the banks of Savannah Harbor when compared to the without project condition. c. Ship length, beam, drafts, and speed were considered for the latest forecast. Evaluation of results yielded negligible adjustments to previous calculations. The results indicate that wave forces and passing events of predicted traffic within the deepened channel are reduced; therefore minor adjustments were not included.
d. Field measurements are presented in the revised report Ship Forces on the Shoreline of the Savannah Harbor Project. A copy of the report is available as a separate publication.
4. Fort Pulaski and North Tybee Descriptions 4.1 Fort Pulaski The Fort Pulaski site is defined herein as the property along the shoreline from Georgia East NAD83 coordinates E 1049657.94, N 741683.76 (upstream) to E1052062.12, N 741085.54 (downstream); a distance of about 2,480 feet. The property is located at the entrance to the Savannah River from the Atlantic Ocean, directly adjacent to and on the outside bank of a 149 degree bend in the river. The general location is shown below.

CESAW-TS-EG 3
FORT PULASKI / TYBEE LOCATION PLAN
The Fort Pulaski shoreline is unprotected and lies immediately downstream from the protected shoreline near the Savannah Pilots Association (SPA) and immediately upstream from the protected shoreline at the lower end of Cockspur Island. A circular erosion pattern exists immediately downstream from the SPA slope protection. The erosion in this area has been observed to be caused by eddy currents from tidal flows, the extent of which far exceeds other noted erosion anomalies. In addition, three prominent drainage features formerly existed from upland areas to the shoreline spaced about 300 to 400 feet apart and located in the upstream half of the site. The drainage features appear to have been removed/filled-in. 4.2 North Tybee The North Tybee site is defined herein as the property along the shoreline from Georgia East NAD83 coordinates E 1060300.0, N 737576.0 (upstream) to E1062490.0, N 739000.0 (downstream); a distance of approximately 2,670 feet. The property is located near the
CESAW-TS-EG 4
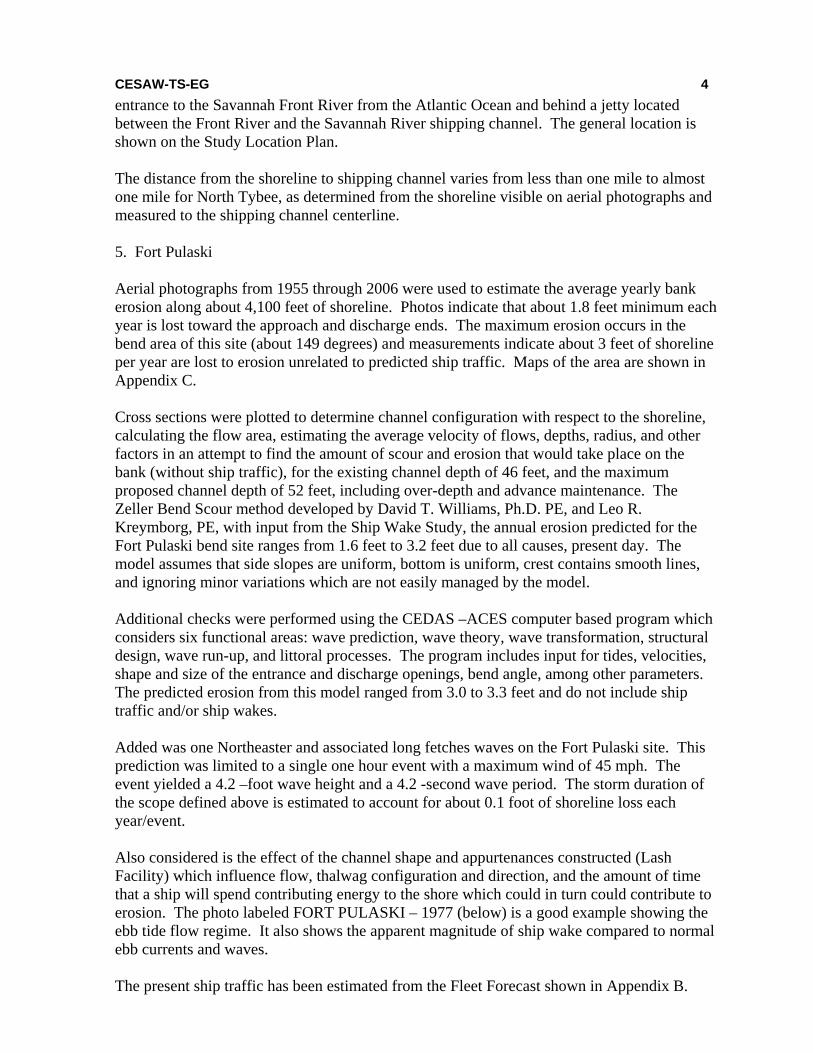
entrance to the Savannah Front River from the Atlantic Ocean and behind a jetty located between the Front River and the Savannah River shipping channel. The general location is shown on the Study Location Plan. The distance from the shoreline to shipping channel varies from less than one mile to almost one mile for North Tybee, as determined from the shoreline visible on aerial photographs and measured to the shipping channel centerline. 5. Fort Pulaski Aerial photographs from 1955 through 2006 were used to estimate the average yearly bank erosion along about 4,100 feet of shoreline. Photos indicate that about 1.8 feet minimum each year is lost toward the approach and discharge ends. The maximum erosion occurs in the bend area of this site (about 149 degrees) and measurements indicate about 3 feet of shoreline per year are lost to erosion unrelated to predicted ship traffic. Maps of the area are shown in Appendix C. Cross sections were plotted to determine channel configuration with respect to the shoreline, calculating the flow area, estimating the average velocity of flows, depths, radius, and other factors in an attempt to find the amount of scour and erosion that would take place on the bank (without ship traffic), for the existing channel depth of 46 feet, and the maximum proposed channel depth of 52 feet, including over-depth and advance maintenance. The Zeller Bend Scour method developed by David T. Williams, Ph.D. PE, and Leo R. Kreymborg, PE, with input from the Ship Wake Study, the annual erosion predicted for the Fort Pulaski bend site ranges from 1.6 feet to 3.2 feet due to all causes, present day. The model assumes that side slopes are uniform, bottom is uniform, crest contains smooth lines, and ignoring minor variations which are not easily managed by the model. Additional checks were performed using the CEDAS –ACES computer based program which considers six functional areas: wave prediction, wave theory, wave transformation, structural design, wave run-up, and littoral processes. The program includes input for tides, velocities, shape and size of the entrance and discharge openings, bend angle, among other parameters. The predicted erosion from this model ranged from 3.0 to 3.3 feet and do not include ship traffic and/or ship wakes. Added was one Northeaster and associated long fetches waves on the Fort Pulaski site. This prediction was limited to a single one hour event with a maximum wind of 45 mph. The event yielded a 4.2 –foot wave height and a 4.2 -second wave period. The storm duration of the scope defined above is estimated to account for about 0.1 foot of shoreline loss each year/event. Also considered is the effect of the channel shape and appurtenances constructed (Lash Facility) which influence flow, thalwag configuration and direction, and the amount of time that a ship will spend contributing energy to the shore which could in turn could contribute to erosion. The photo labeled FORT PULASKI – 1977 (below) is a good example showing the ebb tide flow regime. It also shows the apparent magnitude of ship wake compared to normal ebb currents and waves. The present ship traffic has been estimated from the Fleet Forecast shown in Appendix B.

CESAW-TS-EG 5
FORT PULASKI - 1977 From the Fleet Forecast predicted for Savannah Harbor before and after deepening, no additional erosion can be attributed to ship traffic. Study indicates about one meter of shoreline lost to erosion each year due to all causes and zero erosion due to ship traffic associated with deepening of the river. 6. North Tybee From the Fleet Forecast predicted for Savannah Harbor before and after deepening, no additional erosion can be attributed to ship traffic. 7. City Front Due to the reduced speed in the City Front area, drawdown and ship wake are predicted to remain unchanged. Deepening of the channel is predicted to reduce the effect of ship wake by approximately 10 percent. From the Fleet Forecast predicted for Savannah Harbor before and after deepening, no additional erosion can be attributed to ship traffic. 8. Confined Disposal Facility (Bight Section)

CESAW-TS-EG 6
This area of the bight has been predicted to experience approximately the same effect as the Fort Pulaski Site due to normal causes. However, this reach is or will be very soon armored against further erosion. After the planned dike protection has been completed, erosion from all causes is expected to be reduced to negligible. Based on the Fleet Forecast predicted for Savannah Harbor before and after deepening, no additional erosion can be attributed to ship traffic. 9. Bank Stability Review A June 2011 review of the Savannah Harbor Expansion Bank Stability Report dated April 2003 has been completed with respect to the revised Ship Wake Study, April 2011. The April 2003 report addressed the shipping channel with special attention given to areas where the deepened and/or revised channel alignment would or could impact existing shore, involve real estate taking, or directly affect real property in any way. There is nothing contained in the Ship Wake study that directly impacts the Bank Stability study in a way that would require redesign or additional takings. 10. Summary Given the current traffic predictions and forecasts, no bank erosion impact(s) can be directly attributed to the deepening project.

CESAW-TS-EG 7
APPENDIX A
2003 Fleet Forecast
Table 6. Containership Traffic for Savannah Harbor. Numbers are for both without and with project values in 0 and % total calls.
Vessel Type GEC 10% Increase 20% Increase 30% Increase
2030 2050 2030 2050 2030 2050 2030 2050 Post- Panamax
211 (5.2)
291 (3.7)
565 (14.0)
992 (12.7)
920 (22.8)
1693 (21.7)
1274 (31.6)
2394 (30.7)
Panamax 3333 (82.7)
6718 (86.1)
2979 (73.9)
6017 (77.1)
2624 (65.1)
5316 (68.1)
2270 (56.3)
4615 (59.2)
Sub- Panamax
252 (6.3)
458 (5.9)
252 (6.3)
458 (5.9)
252 (6.3)
458 (5.9)
252 (6.3)
458 (5.9)
Handysize 215 (5.3)
315 (4.0)
215 (5.3)
315 (4.0)
215 (5.3)
315 (4.0)
215 (5.3)
315 (4.0)
Feedermax 18 (0.4)
18 (0.2)
18 (0.4)
18 (0.2)
18 (0.4)
18 (0.2)
18 (0.4)
18 (0.2)
Feeder 1 (0.0)
1 (0.0)
1 (0.0)
1 (0.0)
1 (0.0)
1 (0.0)
1 (0.0)
1 (0.0)
Total Calls 4030 7801 4030 7801 4030 7801 4030 7801

CESAW-TS-EG 8
APPENDIX B
REVISED FLEET FORECAST
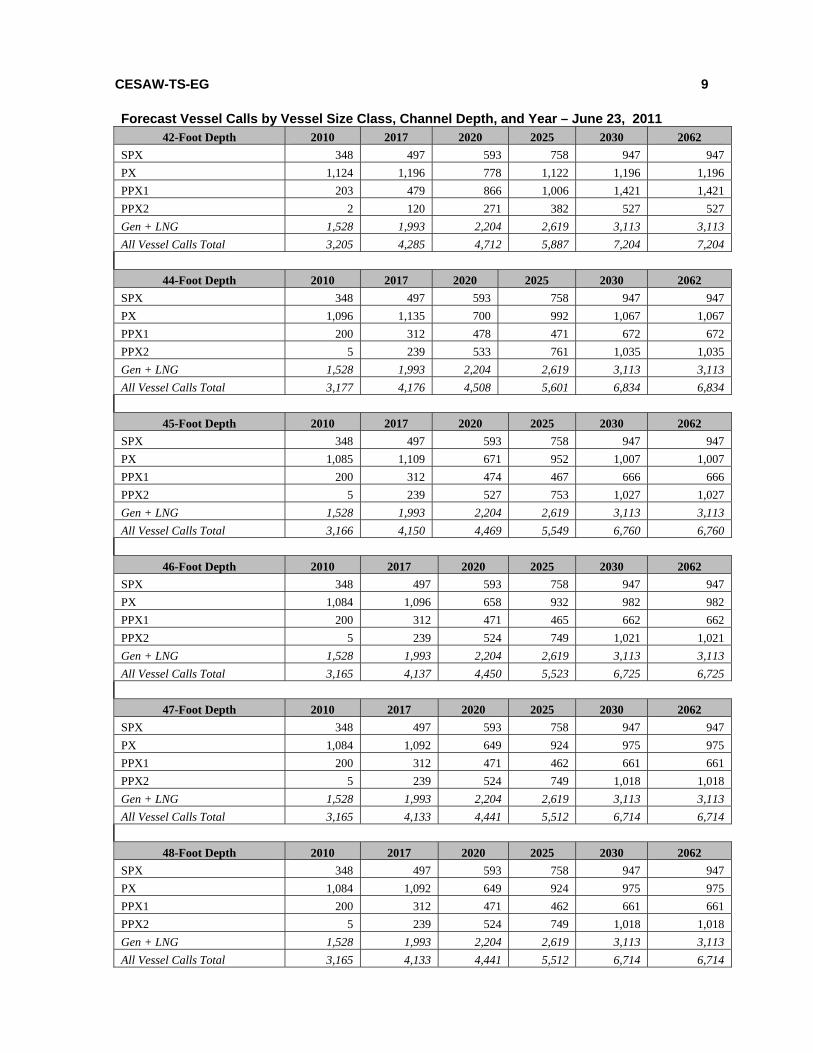
CESAW-TS-EG 9
Forecast Vessel Calls by Vessel Size Class, Channel Depth, and Year – June 23, 2011
42-Foot Depth 2010 2017 2020 2025 2030 2062
SPX 348 497 593 758 947 947
PX 1,124 1,196 778 1,122 1,196 1,196
PPX1 203 479 866 1,006 1,421 1,421
PPX2 2 120 271 382 527 527
Gen + LNG 1,528 1,993 2,204 2,619 3,113 3,113
All Vessel Calls Total 3,205 4,285 4,712 5,887 7,204 7,204
44-Foot Depth 2010 2017 2020 2025 2030 2062
SPX 348 497 593 758 947 947
PX 1,096 1,135 700 992 1,067 1,067
PPX1 200 312 478 471 672 672
PPX2 5 239 533 761 1,035 1,035
Gen + LNG 1,528 1,993 2,204 2,619 3,113 3,113
All Vessel Calls Total 3,177 4,176 4,508 5,601 6,834 6,834
45-Foot Depth 2010 2017 2020 2025 2030 2062
SPX 348 497 593 758 947 947
PX 1,085 1,109 671 952 1,007 1,007
PPX1 200 312 474 467 666 666
PPX2 5 239 527 753 1,027 1,027
Gen + LNG 1,528 1,993 2,204 2,619 3,113 3,113
All Vessel Calls Total 3,166 4,150 4,469 5,549 6,760 6,760
46-Foot Depth 2010 2017 2020 2025 2030 2062
SPX 348 497 593 758 947 947
PX 1,084 1,096 658 932 982 982
PPX1 200 312 471 465 662 662
PPX2 5 239 524 749 1,021 1,021
Gen + LNG 1,528 1,993 2,204 2,619 3,113 3,113
All Vessel Calls Total 3,165 4,137 4,450 5,523 6,725 6,725
47-Foot Depth 2010 2017 2020 2025 2030 2062
SPX 348 497 593 758 947 947
PX 1,084 1,092 649 924 975 975
PPX1 200 312 471 462 661 661
PPX2 5 239 524 749 1,018 1,018
Gen + LNG 1,528 1,993 2,204 2,619 3,113 3,113
All Vessel Calls Total 3,165 4,133 4,441 5,512 6,714 6,714
48-Foot Depth 2010 2017 2020 2025 2030 2062
SPX 348 497 593 758 947 947
PX 1,084 1,092 649 924 975 975
PPX1 200 312 471 462 661 661
PPX2 5 239 524 749 1,018 1,018
Gen + LNG 1,528 1,993 2,204 2,619 3,113 3,113
All Vessel Calls Total 3,165 4,133 4,441 5,512 6,714 6,714

CESAW-TS-EG 10
APPENDIX C
GENERAL LOCATION MAP

CESAW-TS-EG 11
CESAW-TS-EG 12
References ERDC, (2006, r-2011). “Ship Forces on the Shoreline of the Savannah Harbor Project”, Technical Report, US Army Engineer Research and Development Center, Vicksburg, MS.
CECW-EH-D Engineer Manual 1110-2-1607 (1991). “Engineering and Design Tidal Hydraulics”. Department of the Army, Corps of Engineers, Washington, DC.
CECW-EW, Engineer Manual 1110-2-1100 (2002, Updated 2003). “Engineering and Design Coastal Engineering Manual”. Department of the Army, Corps of Engineers, Washington, DC.
CESAS-EN, (2003). “Savannah Harbor Expansion Bank Stability Report”. Department of the Army, Corps of Engineers, Savannah District, Savannah, Georgia.