Embed Size (px)
Citation preview
INDUSTRIAL LANDS STUDY
PORTLAND HARBOR
Part One: Inventories, Trends and Geographic Context
February 2003
City of Portland Bureau of Planning Portland DevelopmentCommission Port of Portland
Prepared by:
Portland Bureau of Planning
For more information on the Portland Harbor Industrial Lands Study,please contact
Steve Kountz, Senior Planner, Project ManagerPortland Bureau of Planning1900 SW 4th Avenue, Suite 4100Portland, OR 97201Phone: 503-823-4551Fax: 503-823-7800TDD: 503-823-6868
This report is available atwww.planning.ci.portland.or.us
To help ensure equal access to information, the City of PortlandBureau of Planning offers accommodation to persons withdisabilities. Call 503-823-7700 in advance to arrangeaccommodation.
Portland Harbor Industrial Lands Study Part One: Inventories, Trends and Geographic Context
Prepared by:
City of Portland
Bureau of Planning 1900 SW 4th Avenue Suite 4100
Portland, OR 97201 (503) 823-7700
February 2003
Acknowledgements Portland Bureau of Planning
Mayor Vera Katz, Commissioner-in-Charge Gil Kelley, Planning Director Deborah Stein, Principal Planner Sallie Edmunds, Environmental Planning Manager Project Staff Steve Kountz, Senior Planner, Project Manager Beth Park, Community Service Aide
Associate Project Sponsors
Portland Development Corporation Lita Colligan, Business Development Manager Elissa Gertler, Economic Development Manager Fred Wearn, Development Manager Port of Portland Brian Campbell, Planning Manager Sebastian Degens, Marine Planning and Development Manager
Business Community Advisors
River Economic Advisory Group, including the following representatives of
local business and industrial associations: Cindy Catto, Associated General Contractors Mark Clemons (Group Mackenzie), North Macadam Development Council Wayne Cozad (Cube Management), Swan Island Business Association Debbie Deetz Silva (Oregon Steel Mills), Columbia Corridor Association Rob DeGraff, Portland Business Alliance Ann Gardner (Schnitzer Investment Group), Northwest Industrial Neighborhood
Association Paul Gassner, Macadam Corridor Business Association Wayne Kingsley (Portland Spirit), Central Eastside Industrial Council Steve Malany (P&C Construction), Associated General Contractors Rod McDowell (OMSI), Central Eastside Industrial Council Whitney Olson (Foss Maritime), Columbia River Towboat Association Rick Saito (Group Mackenzie), North Macadam Development Council Bob Short (Glacier Northwest), Lower Albina Council Howard Werth (Gunderson), Northwest Industrial Neighborhood Association
Additional Funding Providers
Oregon Economic and Community Development Department Portland Endangered Species Act Program
Portland Harbor Industrial Lands Study Part One i
EXECUTIVE SUMMARY The Portland Harbor Industrial Lands Study assesses the future land needs of industries in theharbor area, focusing on river-dependent, freight-related, and other concentrated industries there.A secondary purpose is to generally describe the structure, dynamics, and outlook of the urbanindustrial districts along the harbor. The study will be used as background research for areaplanning efforts related to land use, economic development, infrastructure, and the naturalenvironment. The City of Portland Bureau of Planning partnered with the Port of Portland andPortland Development Commission in drafting, funding, and overseeing the study. The study was done in two parts. The Bureau of Planning prepared Part One, which is aninventory of harbor area industries, a review of industrial trends, and analysis of the harborarea’s economic role in the region. E.D. Hovee & Company prepared Part Two in associationwith Parsons Brinkerhoff and The JD White Company. Their work draws from 80 interviewswith industry leaders to understand the decisions being made in firms that drive industrialdevelopment. Part Two analyzes how harbor area industries are changing, their future land andlocation needs, and the industrial development constraints of harbor area sites, concluding withfollow-up policy questions.
A. INVENTORY OF HARBOR AREA INDUSTRIESThe harbor study area consists of the industrial districts downstream of the Steel Bridge—Guild’s Lake, Linnton, Lower Albina, Swan Island, St. Johns, and most of Rivergate. This studyarea covers 5,532 acres of land in taxlots, about one third of the city’s industrial land supply.
EmploymentApproximately 940 private businesses employed 39,200 workers in the area in 2000.Approximately half of that employment was in the manufacturing sector and one-third indistribution (transportation and wholesale trade). A diverse mix of industrial businessesoccupies the harbor area, reflecting its age and competitive advantages as an industrial area.Much of the area has been in industrial use for nearly a century.
Clusters of particular industries in a district are an indication of its competitive advantage forthose industries. Metals and equipment manufacturing is the harbor area’s largest industrycluster, accounting for 104 businesses and 14,700 jobs in 2000. These industries have becomehighly interdependent, forming a large portion of each other’s suppliers, subcontractors, andcustomers. Larger harbor area firms in these industries include Freightliner, Gunderson,Cascade General, ESCO, and Oregon Steel.
Distribution (transportation and wholesale trade) is the second largest industry cluster in theharbor area, consisting of 375 businesses and 12,700 jobs. The distribution industries that havehigh concentrations of employment in the harbor area are water, air, and truck transportation andwholesale trade of alcoholic beverages, metals, furniture, chemicals, and petroleum products.
ii Portland Harbor Industrial Lands Study Part One
Land useThe primary development feature of the harbor area is that it is Oregon’s freight transportationhub, connecting the seaport with the Columbia and Snake Rivers barge routes, two interstatehighways, and two transcontinental railroads. Freight-related (transportation and wholesale)firms and infrastructure span the entire length of the harbor and the width of the adjacentindustrial districts. Rail lines run the length of the harbor on both sides, and the Albina and Lakerail yards are situated within a few hundred feet of the river. There is no similar place in Oregonwith this confluence of significant intermodal transportation facilities—nor is there expectationof a similar hub developing elsewhere in the state in the foreseeable future.
Much of the harbor riverfront is lined with river-dependent industrial uses, which is partly theresult of zoning regulations that reserve those properties for such use. River-dependent usesinclude marine terminals, vessel-related industries, and manufacturers that need to locateadjacent to the river for transportation access. River-dependent uses cover an estimated 72percent (1,704 acres) of the occupied riverfront (between the river and nearest street or railroadright-of-way) in the study area.
Maps 2 through 5 depict the development pattern of area industries. Most industries aredispersed throughout the harbor area, but some are concentrated in particular locations. Thepetroleum terminals are grouped on the west side of the river in the Linnton and Guild’s Lakeareas, where most of the gasoline and diesel used in Oregon is received via tankers and theOlympic pipeline. Automobile import terminals (i.e. Honda, Hyundai, and Toyota) are situatedin Rivergate and St. Johns, near Ford and GM’s upland distribution facilities. Most of the harborarea’s industrial machinery firms, metal fabricators, and printing and publishing firms are tightlyclustered in the southern Guild’s Lake and Lower Albina areas.
Industrial sites in the harbor area vary widely in size. The median size of industrial sites is 2.2acres, although the larger industrial sites bring the average size up to 8.0 acres. Utilities, primarymetals, manufacturing, and water transportation uses occupy sites that average 20 acres or larger.Average employment density is 8.1 jobs per acre. Manufacturing has the highest employmentdensity at 12.4 jobs per acre; and utilities have the lowest at 0.5 per acre.
Based on Metro’s regional inventory of vacant industrial land dated July 2000, 735 acres werevacant (undeveloped) in the study area, which is 13 percent of the total 5,532 acres of land intaxlots. Metro classified 543 acres (10 percent of the total land in taxlots) in Tiers A and B,indicating unconstrained and less constrained sites. Over half of the vacant land in the harborarea is located in Rivergate, and the Port of Portland is the largest owner of those sites.
B. INDUSTRY TRENDSRegional Employment TrendsIndustrial employment in the metro area (Multnomah, Washington, Clackamas, Columbia, andYamhill Counties) grew by 37 percent between 1980 and 2000, compared to 12 percent growthnationwide. Metro area industries added 77,200 net new jobs during that period. Of those newjobs, 46 percent were in transportation and wholesale trade, 26 percent in electronicsmanufacturing, and 28 percent in construction.
Portland Harbor Industrial Lands Study Part One iii
While manufacturing employment in the U.S. declined by 9 percent between 1980 and 2000, itincreased by 18 percent in the Portland metro area. The metro area share of nationalmanufacturing employment grew by 31 percent during those decades. Electronics was the metroarea’s driving growth industry in the manufacturing sector, adding 20,100 net new jobs between1980 and 2000. Combined employment in the other manufacturing industries declined slightly,less than 1 percent, compared to a 10 percent decline nationally. The printing and publishing,rubber and plastics, and transportation equipment manufacturing industries each added morethan 2,000 jobs in the metro area, while substantial employment reductions occurred in lumber,paper, apparel, textiles, and instruments manufacturing.
Multnomah County is the metro area’s primary location of industrial jobs, but its share of themetro area’s industrial employment reduced from 59 percent in 1980 to 48 percent in 2000. Atleast three reasons for the county’s declining share are apparent: being more built out than itssuburban neighbors; having a different mix of expanding and contracting industries (e.g.,electronics employment is concentrated in Washington County); and substantial relocation insome industries (e.g., wholesale of durable goods) to other counties.
U.S. maritime employment has declined over the last two decades, as U.S. maritime operationshave become less labor intensive and offshore competition has grown. Between 1980 and 1999,U.S. waterborne cargo tonnage increased by 0.9 percent per year, but national employment inmarine cargo handling declined by 1.8 percent per year. Between 1980 and 1999, the U.S. losthalf of its shipbuilding and repair jobs.
Employment forecasts by Metro and the Oregon Office of Economic Analysis predict continuingindustrial job growth following the current recession. Metro’s 2030 regional forecast completedlast March predicts 0.8 percent average annual growth in manufacturing jobs, 1.5 percent intransportation and utilities, and 1.6 percent in wholesale trade—each far outpacing nationalforecasts. The regional forecast for the metals and equipment industries is mixed, withanticipated employment gains in industrial machinery exceeding modest reductions intransportation equipment and metals.
Land Use TrendsMany U.S. cities have lost much of their central city industrial land to other uses, asdevelopment pressure has led to conversion of industrial land to residential and commercial usesthat command higher market land values. To date, this has not occurred extensively within theCity of Portland. Most of Portland's industrial land is protected by industrial sanctuary zoning,limiting the encroachment of non-industrial uses. Portland has approximately 18,800 acres ofindustrially zoned land. Since 1991, the City has converted approximately 2.5 percent (474acres) of its industrial land to other zones and has established environmental protection zoningon another 3 percent (570 acres).
The proportion of land in industrial and river-dependent uses has been relatively stable orgrowing along most of the harbor between 1960 and 1997, as revealed by periodic land useinventories conducted by the Port of Portland. There are two exceptions, where land hasconverted from industrial to other uses: the River District (west side of the river between theBroadway and Fremont Bridges) and North Beach (east side between St. John’s Bridge and
iv Portland Harbor Industrial Lands Study Part One
University of Portland. Both areas were primarily in marine industrial use in 1960, and both aretransitioning into parts of the expanding urban mixed-use centers nearby (Central City and St.Johns town center).
On average, 21 acres per year of new marine cargo and marine industrial development occurredalong the harbor between 1960 and 1997. Much of that development occurred on about 2,700acres of land acquired around 1960 by the Port of Portland in Rivergate and on vacant land in theSwan Island area. Of the 232 acres that were vacant in 1990 and occupied by 1997, 105 acreswere developed as marine cargo uses, 43 acres as marine industrial, and 20 acres as marineinfrastructure. Marine cargo developments since 1990 have included the Portland Bulk Terminalat Terminal 5 (T-5), the chassis yard and intermodal yard expansion at T-6, and the Ash Groveplant near the Albina rail yard.
The Regional Industrial Lands Study forecasts 6,310 acres of net industrial land absorption(demand) in the Portland-Vancouver area from 2000 to 2020. In Multnomah County, the studyforecasts 813 acres of industrial land absorption over the 20-year period and found a vacant landsupply of 2,572 acres, including 442 acres in Tier A and 1,960 acres in Tier B (less constrainedsites for new development).
The Rivergate area is well situated to receive a significant portion of Portland’s maritimeindustrial growth, having the advantages of large sites, vacant land, convenient rail access, andfew Superfund sites. However, the freight distribution complex is not necessarily movingnorthward. Transportation and wholesale firms remain more densely concentrated in the upperharbor area (Guild’s Lake, Swan Island, and Lower Albina).
Cargo and Freight TrendsBetween 1960 and 2000, marine cargo tonnage handled at Portland Harbor increased by 253percent, primarily driven by growth in exports. The average annual growth rate over the 40-yearperiod and in the 1990s was 2.3 percent. Among West Coast ports, Portland has multiple cargoniches in dry bulk exports (primarily wheat), auto imports, regional container service, andpetroleum from the Puget Sound. Between 1985 and 2000, Portland captured an increased shareof West Coast marine cargo in dry bulks, autos, and breakbulks. Portland, Seattle, and Tacomahad declining shares of West Coast container cargo between 1985 and 2000, as an increasingshare has concentrated at the Los Angeles and Long Beach harbors.
DRI-WEFA predicts average annual growth of total marine cargo to be handled at the LowerColumbia River ports between 2000 and 2030 at –0.4 to +0.8 percent (0.2 percent midpoint)without channel deepening. With the proposed Columbia River channel deepening to 43 feet,the forecast range is 0.0 to 1.3 percent (0.7 percent midpoint). DRI-WEFA is projecting anincrease across all cargo types, except liquid bulk, which declined after 2000 as the Olympicpipeline has come back into full use following repairs.
Rail is the primary mode of transportation for ocean bound cargo, handling 51 percent of alltonnage in the metro area. Another 26 percent is hauled by barge and 22 percent by truck. Railtonnage has increased by 1.8 percent per year over the last ten years. Preliminary forecasts beingprepared as part of the I-5 Trade Corridor study anticipate rail tonnage to increase at an even
Portland Harbor Industrial Lands Study Part One v
greater 3.0 to 3.5 percent annualized rate over the next ten years. Significant increases areexpected for auto, grain, and bulk unit trains.
C. REGIONAL ROLE OF HARBOR AREA Industrial Location FactorsFour primary functions of the harbor area are identified as factors that influence which industrieslocate there: multi-modal distribution infrastructure, industry clusters, heavy industrial character,and central urban location.
Freight transportation investment is a significant industrial location advantage for the harbor areain at least two respects: as a freight hub location for distribution industries and as a marine andrail access location for manufacturers that require those facilities. As shown in Map 8, theharbor area and Columbia Corridor are the center of the region’s freight distribution facilitiesand industrial activity that requires rail or maritime access. Portland is well positioned by itslocation and intermodal infrastructure for continued growth as a West Coast distribution hub.
Among the mix of industries in the harbor area, the metals and equipment industries (primarymetals, fabricated metal products, industrial machinery, electronics equipment, andtransportation equipment) appear to be the most affected by inter-firm linkages as a locationfactor. In 1998, 57 percent of the production inputs of the metals and equipment industriesnationally were provided by other firms within that industry group. The significant trade volumebetween these industries is consistent with their geographic concentration in the harbor area.The presence of more than 200 metals and equipment firms (manufacturing and wholesale) there,their skilled labor pool, established networks of suppliers and customers, specializedinfrastructure, and other inter-firm relationships are potentially significant location factors forthe cluster’s continued growth.
Another apparent location factor is that the harbor area is the region’s largest heavy industrialdistrict. Conceptually, heavy industrial areas provide locations for industries with objectionableimpacts and appearance, separated from other urban areas. Examples in the harbor area of whatare traditionally perceived as heavy industries include steel mills, heavy equipmentmanufacturing, petroleum bulk storage, chemicals manufacturing and distribution, utility yards,rail yards, and marine terminals. Most of the land in Portland with heavy industrial zoning is inthe harbor area, and nearly all of the rest is adjacent in the Columbia Corridor west of I-5.A fourth factor that influences the mix of industries in the harbor area is its central urbanlocation. The harbor area offers large employers central access to the metro area’s skilled labormarkets and is an advantage for distributors with nearby or regional delivery locations.
Relation to Other Regional SeaportsPortland is a major West Coast seaport, the fourth largest in total marine cargo tonnage in 2000with 34.3 million short tons, as reported by the U.S. Army Corps of Engineers. In comparison,total marine cargo tonnage was 24.1 million in Seattle, 22.3 million in Tacoma, and 12.2 millionin Oakland. Of the 34.3 million tons of waterborne cargo handled at Portland Harbor in 2000, 18million tons (52 percent) was international cargo, 7.1 million tons (21 percent) was coastwise
vi Portland Harbor Industrial Lands Study Part One
cargo (primarily petroleum from Puget Sound refineries), and 9.3 million tons (27 percent) wasinternal cargo carried by barge.
Portland terminals handled 66 percent of the total marine cargo tonnage of the Columbia Riverdeepwater seaports in 2000. By comparison, Vancouver (Washington) handled 15 percent;Kalama, 11 percent; Longview, 8 percent; and Astoria, less than 1 percent. Portland Harborcurrently competes with the other Columbia River seaports primarily for dry bulk and breakbulkcargo. Virtually all of the Columbia River container and petroleum cargo and 86 percent of theautomobile cargo were handled in Portland in 2000.
Among the vacant industrial sites currently marketed by the port authorities at the LowerColumbia River seaports, the only 100 acre and larger sites currently available are one in Kalamaand two in Longview. Based on research conducted for the Port of Portland, the land area needsfor new marine terminals reflecting current and projected technology are 115-125 acre sites forgrain and dry bulk terminals, to accommodate a rail loop, and 50-100 acre sites for auto andcontainer terminals, to provide adequate yard storage area. Land requirements for river-dependent manufacturing, warehouse, and industrial service facilities are more varied. There arealso many existing river-dependent industrial sites on Portland Harbor in the 5-50 acre range.
The Port of Portland’s Marine Terminals Master Plan process underway has proposedalternatives to accommodate new grain, dry bulk, auto, and container facilities throughredevelopment, consolidation, or relocation of facilities within the existing terminal sites. ThePort of Portland also owns and is reserving West Hayden Island for future marine terminaldevelopment, which includes about 550 acres of potential development area. In addition, thePort of Vancouver has recently prepared an environmental impact statement for a subarea plan todevelop Columbia Gateway, which is proposed to include 152-504 acres for water-dependentindustry in addition to other proposed industrial land.
Regional Economic Role of Harbor AreaThe harbor area is a regional job engine. For each of the 34,300 industrial jobs there in 2000, anaverage 1.9 additional jobs was supported in the six-county metro area by the purchases ofharbor area firms and employees. Accounting for these multiplier effects, the total employmentin the metro area supported by harbor area industries is an estimated 99,800 jobs. That isapproximately one in eight regional jobs. The total annual payroll of those metro area jobs is$3.5 billion. These estimates are based on regional multipliers calculated by the U.S. Bureau ofEconomic Analysis in the Regional Input-Output Modeling System (RIMSII). The multipliereffects of industrial sectors are generally higher than other sectors because of above-averageindustrial wages and levels of trade with other regional firms.
Among the multiplier effects of harbor area industries, Portland’s maritime activity by itselfgenerated 21,000 jobs and $970 million of resultant employee earnings in 2000, as calculated byMartin Associates in 2001. The multiplier effects of Portland’s maritime activity span thePacific Northwest states.
In addition to job and income creation, the study area also has the specialized function of beingOregon’s primary port and distribution hub. The presence of this hub within the region provides

Portland Harbor Industrial Lands Study Part One vii
more convenient transportation access to the region’s producers and consumers and saves ontransportation costs. For example, HDR Engineering in 2000 calculated that shippers in thePacific Northwest saved $67.9 million per year in transportation costs as a result of Portland’scontainer terminal at T-6.
Table of Contents
EXECUTIVE SUMMARY i
INTRODUCTION IX
Study Area x
On Format v
1. INVENTORIES 1
A. Industries by Employment 1
Sectoral Mix 1
Concentrated Industries 2
River-Dependent Industries 7
B. Land Uses 11
Firm Locations and Industry Clusters 11
Land Area 18
Vacant Lands 20
2. TRENDS 25
A. Employment Trends 25
Industrial Sectors 25
Maritime Employment 30
Employment Forecasts 32
Transportation Analysis Zones Forecast 34
B. Land Use Trends 35
Industrial Zoning Changes 35
Harbor Land Use Trends 37
Regional Industrial Land Forecast 39
C. Freight Distribution Trends 39
Marine Cargo 39
Mode Split of Marine Cargo 44
Rail Freight 45
Truck Traffic 46
3. LOCATION FACTORS AND CONTEXT 49
A. Industrial Location Factors 49
Distribution Infrastructure and Facilities 49
Industry Clustering 54
Central Urban Location 57
Regional Heavy Industrial Complex 59
Emerging Environmental Challenges 60
B. Relation to Other Regional Seaports 61
Cargo Distribution 61
Available Land for River-Dependent Industry 63
C. Regional Economic Role of Harbor Area 65
Role of the Harbor Area’s Traded Sectors 65
Regional Multiplier Effects of Harbor Area Jobs 66
Employment and Income Benefits of Maritime Activity 68
Regional Transportation Costs and Access 69
BIBLIOGRAPHY 70
List of Maps
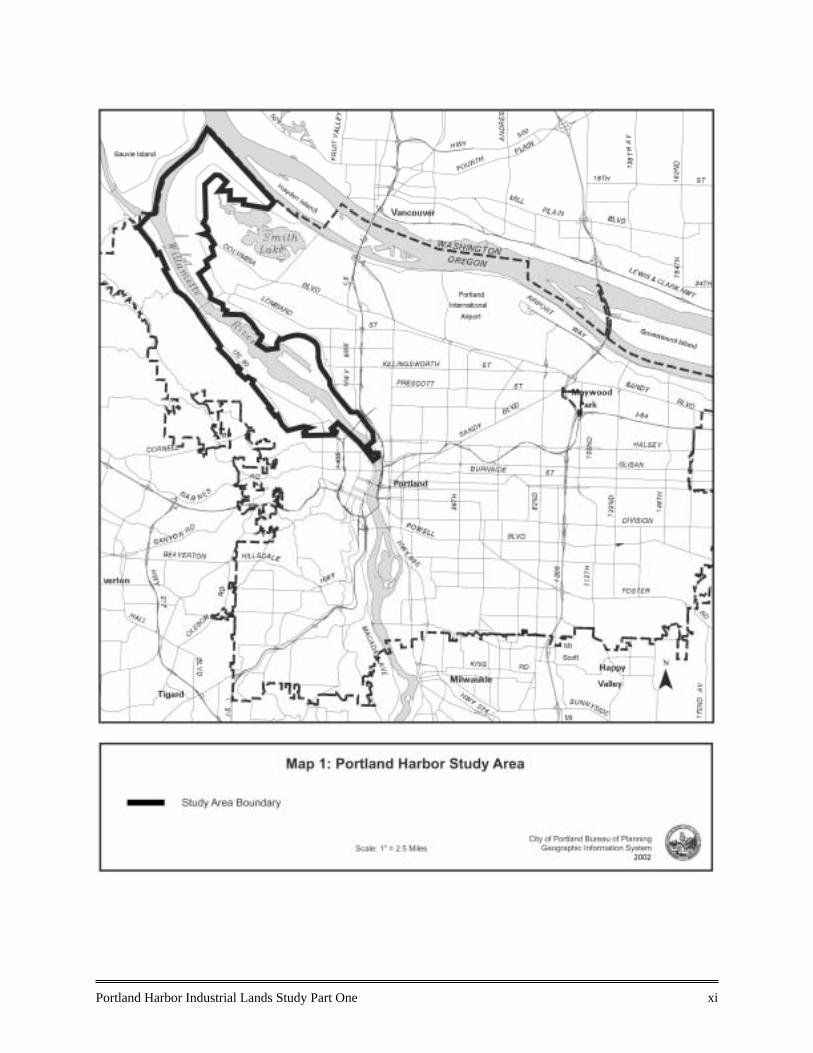
Map 1. Portland Harbor Study Area xi
Map 2. All Industries 13
Map 3. Distribution Industries 14
Map 4. Metals and Equipment Industries 15
Map 5. Other Concentrated Industries 16
Map 6. Vacant Land Supply 23
Map 7. Northwest States Freight Distribution Network 50
Map 8. Metro Area Industrial Lands and Transportation Network 51
List of Tables Table 1. Employment and Establishments by Sector in Study Area, 2000 1
Table 2. Business Establishments, Employment, and Location Quotientsin the Study Area, 2000 3
Table 3. Largest Employers in Industrial Sectors in Study Area, 2002 5
Table 4. Harbor Riverfront in River-Dependent Use, Other Uses, and Vacant, 2000 8
Table 5. Land Area of Industries in Study Area, 2000 19
Table 6. Vacant Industrial Lands in the Study Area, 2000 20
Table 7. Employment Trends of Industrial Sectors in Multnomah County and PMSA, 1980-2000 26
Table 8. Employment Shift-Share Analysis of Industrial Sectors, PMSA to Nation, 1980-2000 28
Table 9. Maritime Employment Trends in U.S., 1980-1999 31
Table 10. Employment Projections to 2030, Portland-Vancouver Region and U.S. 33
Table 11. Employment Forecast by Transportation Analysis Zones (TAZs) to 2020 34
Table 12. Industrial Zone Changes in Portland, 1991-2001 36
Table 13. Portland Harbor Land Use Absorption, 1960-1997 37
Table 14. Portland Harbor Cargo Trends, 1960-2000 39
Table 15. Portland Harbor Vessel Activity Trends, 1960-2000 40
Table 16. Shift-Share Analysis of West Coast Marine Cargo, 1985-2000 41
Table 17. Transport Mode Summary of Freight Flows in Portland-VancouverMetropolitan Area, 1996 and Forecast 2030 45
Table 18. Rail freight trends on Portland area lines, 1989-1999 45
Table 19. Traffic Counts on Selected Truck Streets in Study Area, 1990-2001 48
Table 20. Commodity Inputs and Outputs of Selected Industries in the U.S., 1998 55
Table 21. Shift-Share Analysis of Columbia River Marine Cargo, 1985-2000 61
Table 22. Available and Planned Industrial Sites at Lower Columbia River Seaports,September 2002 64
Table 23. Multiplier Effects of Employment and Earnings in Study Area, 2000 66
Portland Harbor Industrial Lands Study Part One ix
INTRODUCTION Portland Harbor is a major West Coast port, the fourth largest in overall tonnage in 2000. Alongwith the adjacent Columbia Corridor, the harbor area is Oregon’s distribution hub for marine,rail, truck, and air cargo. A diverse mix of manufacturing industries along the harbor alsoanchors a hefty segment of the regional economy. Overall, harbor area firms generated one outof eight jobs in the Portland-Vancouver region in 2000, taking into account the multiplier effectsof purchases by harbor area firms and employees. Many existing studies and data sources, to which this report is indebted, provide a substantialbase of information and insight on particular aspects of the working harbor. This study builds onthat work as a focused industrial analysis of the harbor area. The primary purpose of the study isto assess the future demand and supply of industrial land in the harbor area, focusing on river-dependent, freight-related, and other concentrated industries in the area. In doing so, asecondary purpose is to describe the structure, dynamics, and outlook of these urban industrialdistricts. The City of Portland Bureau of Planning partnered with the Port of Portland and PortlandDevelopment Commission in drafting, funding, and overseeing the study. The River EconomicAdvisory Group, a business and industry stakeholder group, was also instrumental in identifyingthe need for such research and reviewing the project work plan and draft products. The study is intended to provide background research for various planning efforts in the harborarea. It will help the City formulate policy revisions and action strategies in current and futureriver planning efforts related to land use, watershed health, industrial development, recreation,and the Portland Harbor Superfund project. The study will inform the Portland DevelopmentCommission’s industrial development efforts in the area. And the Port of Portland will use studyresults in considering strategic decisions on land use, development, and marine facilitiesplanning.
Study ApproachThe study consists of two parts that differ by method and tasks. Part One, of which this report isthe product, is primarily a statistical analysis of available data and a synthesis of relevantsecondary sources. The first chapter is an inventory of harbor area industries in terms ofemployment and land use. Chapter 2 reviews local and regional trends and forecasts onemployment, freight volume, and industrial land uses pertinent to the harbor area. And Chapter3 provides a contextual description of the factors that attract industry to the harbor area, itsrelation to other regional seaports, and its economic contribution to the regional economy.
E.D. Hovee & Company prepared Part Two of the study in association with Parsons Brinkerhoffand the JD White Company. Their analysis is based on 80 interviews with industry leaders andexperts and other supportive research. That analysis includes a more in-depth description ofindustry dynamics and location factors, an assessment of future demand for industrial land in thearea, a sensitivity analysis of issues that could affect that demand, a rating of industrial sitequality in the area, and a framework of resulting policy questions.
x Portland Harbor Industrial Lands Study Part One
Study AreaThe study area consists of the industrial districts along Portland Harbor, including Guilds Lake,Linnton, Lower Albina, Swan Island, St. Johns, and Rivergate. This area is depicted in Map 1.The terms harbor area and study area are used interchangeably throughout this report.
The study area boundary is based primarily on two geographic features: the harbor shippingchannel and the entire existing industrial districts adjacent to the channel. The main reason forfocus on the harbor area is to assess the land needs of river-dependent industries—that is, themarine terminals, vessel-related industries, and manufacturers that need to locate adjacent to theriver for transportation access. The deep draft channel spans most of the Willamette River inPortland, generally downstream from the Broadway Bridge, and along the Columbia Riveradjacent to Port of Portland Terminal 6. The reasons for including the entire adjacent industrialdistricts are to examine the inter dynamics and competing land needs of other industries in theselarger districts.
The study area consists more specifically of the industrial and employment zones mapped in thePortland Zoning Code along the harbor, with some exceptions to better reflect actual conditionsat specific sites. The southern portion of the study area is extended beyond the Broadway Bridgeto the Steel Bridge on the eastside, to include the Louis Dreyfus grain terminal, a major river-dependent use. Some large institutional uses are excluded from the study area: the University ofPortland and the Multnomah County Detention Facility sites. Additionally, some Metro Title 3designated wetland areas owned by the Port of Portland, along the Columbia Slough, areexcluded. The study area includes all parcels within the Portland Zoning Code’s “RiverIndustrial” (i overlay) zone, which is intended to encourage and promote the development ofriver-dependent and river-related industries.
On FormatMuch of the information in this report is presented in detailed tables, to give readers the optionto concentrate on information of individual interest. The typical format consists of tables, noteson methodology, and a series of observations drawn from the data. Summary observations arehighlighted in text boxes, followed by related information and discussion.
Portland Harbor Industrial Lands Study Part One xi
Portland Harbor Industrial Lands Study, Part One 1
1. INVENTORIES
A. INDUSTRIES BY EMPLOYMENT
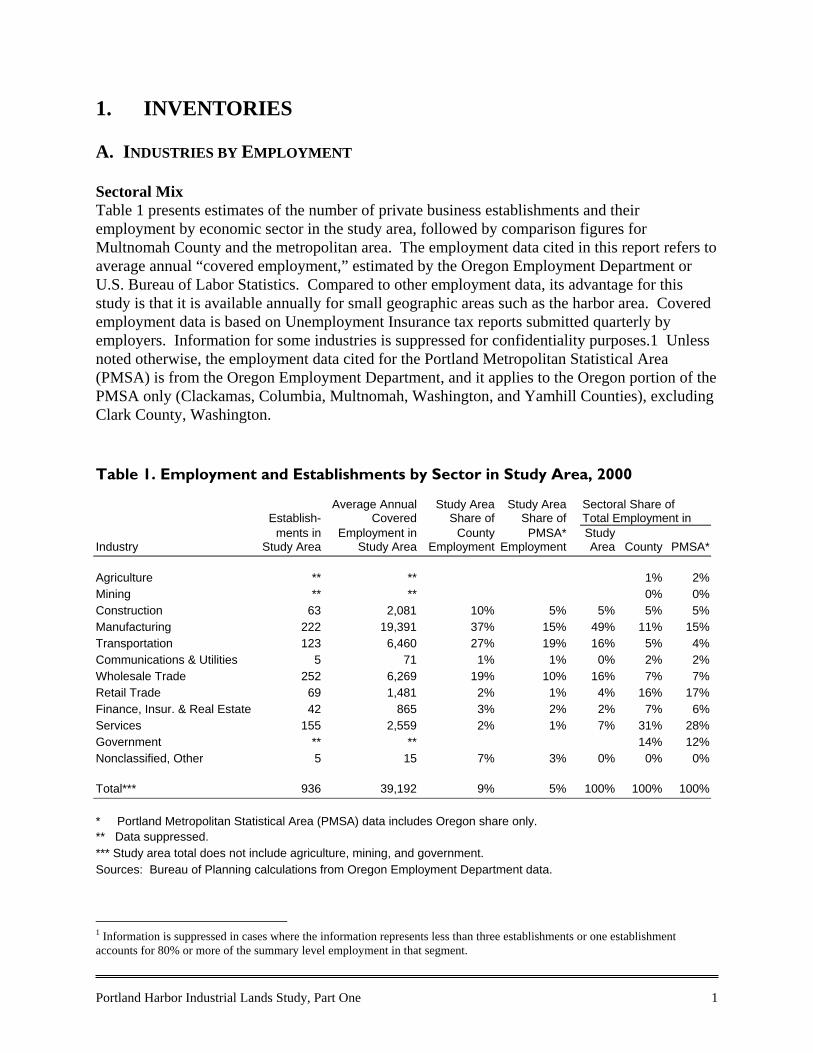
Sectoral Mix Table 1 presents estimates of the number of private business establishments and theiremployment by economic sector in the study area, followed by comparison figures forMultnomah County and the metropolitan area. The employment data cited in this report refers toaverage annual “covered employment,” estimated by the Oregon Employment Department orU.S. Bureau of Labor Statistics. Compared to other employment data, its advantage for thisstudy is that it is available annually for small geographic areas such as the harbor area. Coveredemployment data is based on Unemployment Insurance tax reports submitted quarterly byemployers. Information for some industries is suppressed for confidentiality purposes.1 Unlessnoted otherwise, the employment data cited for the Portland Metropolitan Statistical Area(PMSA) is from the Oregon Employment Department, and it applies to the Oregon portion of thePMSA only (Clackamas, Columbia, Multnomah, Washington, and Yamhill Counties), excludingClark County, Washington. Table 1. Employment and Establishments by Sector in Study Area, 2000
Average Annual Study Area Study Area Sectoral Share ofEstablish- Covered Share of Share of Total Employment in
Industryments in
Study AreaEmployment in
Study AreaCounty
EmploymentPMSA*
EmploymentStudyArea County PMSA*
Agriculture ** ** 1% 2%Mining ** ** 0% 0%Construction 63 2,081 10% 5% 5% 5% 5%Manufacturing 222 19,391 37% 15% 49% 11% 15%Transportation 123 6,460 27% 19% 16% 5% 4%Communications & Utilities 5 71 1% 1% 0% 2% 2%Wholesale Trade 252 6,269 19% 10% 16% 7% 7%Retail Trade 69 1,481 2% 1% 4% 16% 17%Finance, Insur. & Real Estate 42 865 3% 2% 2% 7% 6%Services 155 2,559 2% 1% 7% 31% 28%Government ** ** 14% 12%Nonclassified, Other 5 15 7% 3% 0% 0% 0%
Total*** 936 39,192 9% 5% 100% 100% 100%
* Portland Metropolitan Statistical Area (PMSA) data includes Oregon share only.** Data suppressed.*** Study area total does not include agriculture, mining, and government.Sources: Bureau of Planning calculations from Oregon Employment Department data.
1 Information is suppressed in cases where the information represents less than three establishments or one establishmentaccounts for 80% or more of the summary level employment in that segment.
2 Portland Harbor Industrial Lands Study Part One
Approximately one in eleven jobs in Multnomah County were located in the study area in 2000.Nearly half of the study area employment was in the manufacturing sector, and approximatelyone third in the distribution sectors of transportation and wholesale trade. Since industrial andemployment zoning in the area limit commercial development, retail and services represent arelatively minor portion (12 percent) of study area employment.
A significant cluster of public sector facilities also exists in the harbor area, on which data issuppressed in Tables 1 and 2 because one organization accounts for more than 80 percent of thearea’s government employment. Among the public employers with harbor facilities that requireriver access for transportation are the Port of Portland, U.S. Naval Reserve, U.S. Coast Guard,U.S. Army Corps of Engineers, Multnomah County Sheriff, and Portland Fire Bureau.
Concentrated IndustriesIndustrial geographers have found that industries do not emerge and grow ubiquitously.Particular industries tend to be concentrated in particular regions and districts, where theybenefit from proximity to markets, access to increasingly productive inputs, networks ofsubcontractors and suppliers, and other location advantages. As a result, regions and districtshave varying mixes of industries and specializations. At the same time, industries are not fixedin place. They move in response to competition, business cycles, and product and processinnovation. This chapter and the next provide a recent snapshot of the concentrated industries inthe Portland Harbor area and a summary of trends that describe how and to what extent they arechanging.
Industry concentration is explored in this report through employment location quotients, astatistical tool commonly used for such analysis. A location quotient measures an industry’sconcentration in a particular location relative to its larger context, typically a district to a regionor a region to a nation. High or low location quotients reflect significant geographicspecialization or underrepresentation. Employment location quotients are calculated as theindustry’s share of the total employment in the subset area divided by its share of totalemployment in the larger area. If the industry’s employment share in the two geographic areas isequal, the location quotient is 1; if more concentrated in the subset area, it is more than 1; if lessconcentrated, less than 1.
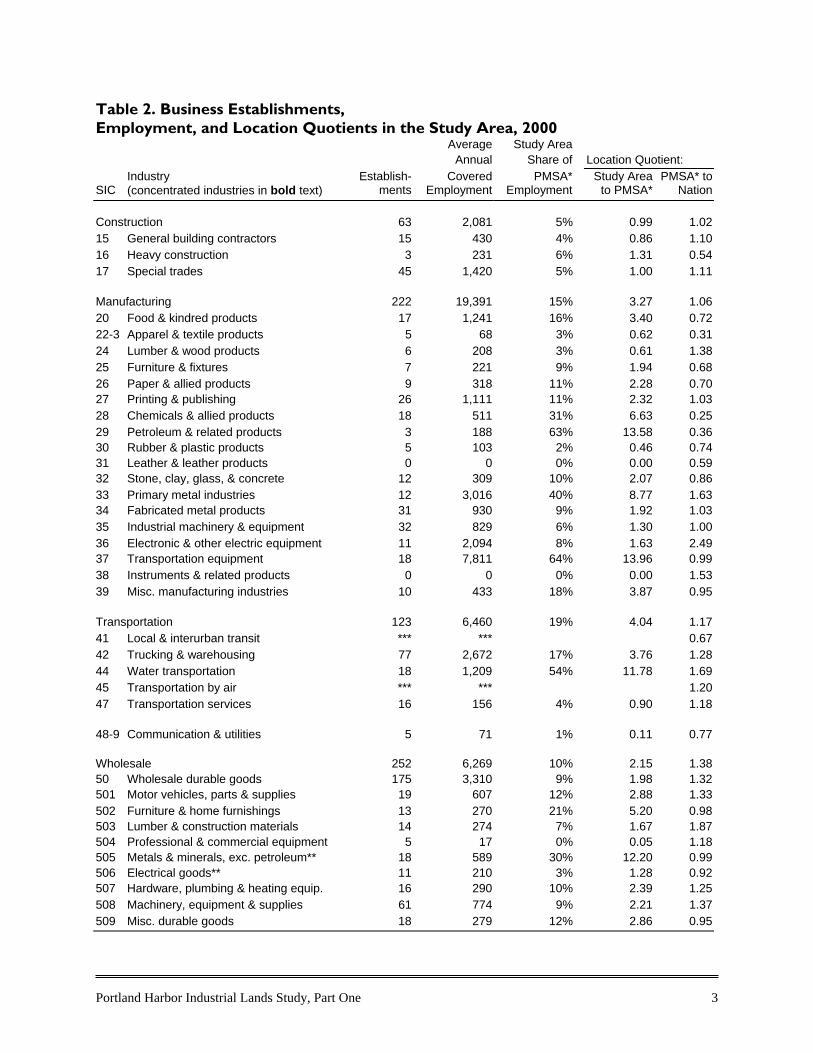
Table 2 presents information on the employment, number of business establishments, andlocation quotients of industries in the harbor area at the two-digit SIC level and wholesale tradesegments at the three-digit level. 2 The table focuses on the industrial sectors of construction,manufacturing, transportation, communication and utilities, and wholesale trade. No servicesector industries (retail, finance, insurance, real estate, services, and government) at the two-digit
2 The Standard Industrial Classification (SIC) Manual of the U.S. Office of Management and Budget classifies industries by a 4-digit numerical system. Each digit relates to a level of detail. For example, SIC 3731 applies to Shipbuilding and Repair, SIC373 to Ship and Boat Building and Repair, and SIC 37 to Transportation Equipment Manufacturing. SIC 2 and 3 include allmanufacturing industries.
An estimated 936 private business establishments in the harbor area employed 39,192workers in 2000.
Portland Harbor Industrial Lands Study, Part One 3
Table 2. Business Establishments,Employment, and Location Quotients in the Study Area, 2000
Average Study AreaAnnual Share of Location Quotient:
SICIndustry(concentrated industries in bold text)
Establish-ments
CoveredEmployment
PMSA*Employment
Study Areato PMSA*
PMSA* toNation
Construction 63 2,081 5% 0.99 1.0215 General building contractors 15 430 4% 0.86 1.1016 Heavy construction 3 231 6% 1.31 0.5417 Special trades 45 1,420 5% 1.00 1.11
Manufacturing 222 19,391 15% 3.27 1.0620 Food & kindred products 17 1,241 16% 3.40 0.7222-3 Apparel & textile products 5 68 3% 0.62 0.3124 Lumber & wood products 6 208 3% 0.61 1.3825 Furniture & fixtures 7 221 9% 1.94 0.6826 Paper & allied products 9 318 11% 2.28 0.7027 Printing & publishing 26 1,111 11% 2.32 1.0328 Chemicals & allied products 18 511 31% 6.63 0.2529 Petroleum & related products 3 188 63% 13.58 0.3630 Rubber & plastic products 5 103 2% 0.46 0.7431 Leather & leather products 0 0 0% 0.00 0.5932 Stone, clay, glass, & concrete 12 309 10% 2.07 0.8633 Primary metal industries 12 3,016 40% 8.77 1.6334 Fabricated metal products 31 930 9% 1.92 1.0335 Industrial machinery & equipment 32 829 6% 1.30 1.0036 Electronic & other electric equipment 11 2,094 8% 1.63 2.4937 Transportation equipment 18 7,811 64% 13.96 0.9938 Instruments & related products 0 0 0% 0.00 1.5339 Misc. manufacturing industries 10 433 18% 3.87 0.95
Transportation 123 6,460 19% 4.04 1.1741 Local & interurban transit *** *** 0.6742 Trucking & warehousing 77 2,672 17% 3.76 1.2844 Water transportation 18 1,209 54% 11.78 1.6945 Transportation by air *** *** 1.2047 Transportation services 16 156 4% 0.90 1.18
48-9 Communication & utilities 5 71 1% 0.11 0.77
Wholesale 252 6,269 10% 2.15 1.3850 Wholesale durable goods 175 3,310 9% 1.98 1.32501 Motor vehicles, parts & supplies 19 607 12% 2.88 1.33502 Furniture & home furnishings 13 270 21% 5.20 0.98503 Lumber & construction materials 14 274 7% 1.67 1.87504 Professional & commercial equipment 5 17 0% 0.05 1.18505 Metals & minerals, exc. petroleum** 18 589 30% 12.20 0.99506 Electrical goods** 11 210 3% 1.28 0.92507 Hardware, plumbing & heating equip. 16 290 10% 2.39 1.25508 Machinery, equipment & supplies 61 774 9% 2.21 1.37509 Misc. durable goods 18 279 12% 2.86 0.95
4 Portland Harbor Industrial Lands Study Part One
Table 2. continuedAverage Study Area
Annual Share of Location Quotient:
SICIndustry(concentrated industries in bold text)
Establish-ments
CoveredEmployment
PMSA*Employment
Study Areato PMSA*
PMSA* toNation
51 Wholesale nondurable goods 77 2,959 11% 2.58 1.46511 Paper & paper products 9 319 12% 2.96 1.31512 Drugs, proprietaries & sundries** *** *** 0.67513 Apparel, piece goods & notions** *** *** 2.52514 Groceries & related products** 11 298 2% 0.88 1.20516 Chemicals & allied products 16 252 23% 5.53 0.93517 Petroleum & petroleum products** 8 375 16% 6.73 1.22518 Beer, wine, distilled alcoholic bvgs.** 10 784 32% 12.96 1.22519 Misc. nondurable goods 19 211 5% 1.29 0.99
Combined Industrial Sectors 665 34,272 12% 2.60 1.10Total of all industries 936 39,192 5%
* Portland Metropolitan Statistical Area (PMSA) data includes Oregon share only for industries at the 2-digit SIC level and the entire PMSA (including Clark County, Washington) for industries at the 3-digit level.** Employment share and location quotient calculations use statewide data for this industry, because PMSA data is suppressed.*** Data suppressed.Sources: Bureau of Planning calculations from Oregon Employment Department and U.S. Bureau ofLabor Statistics data.
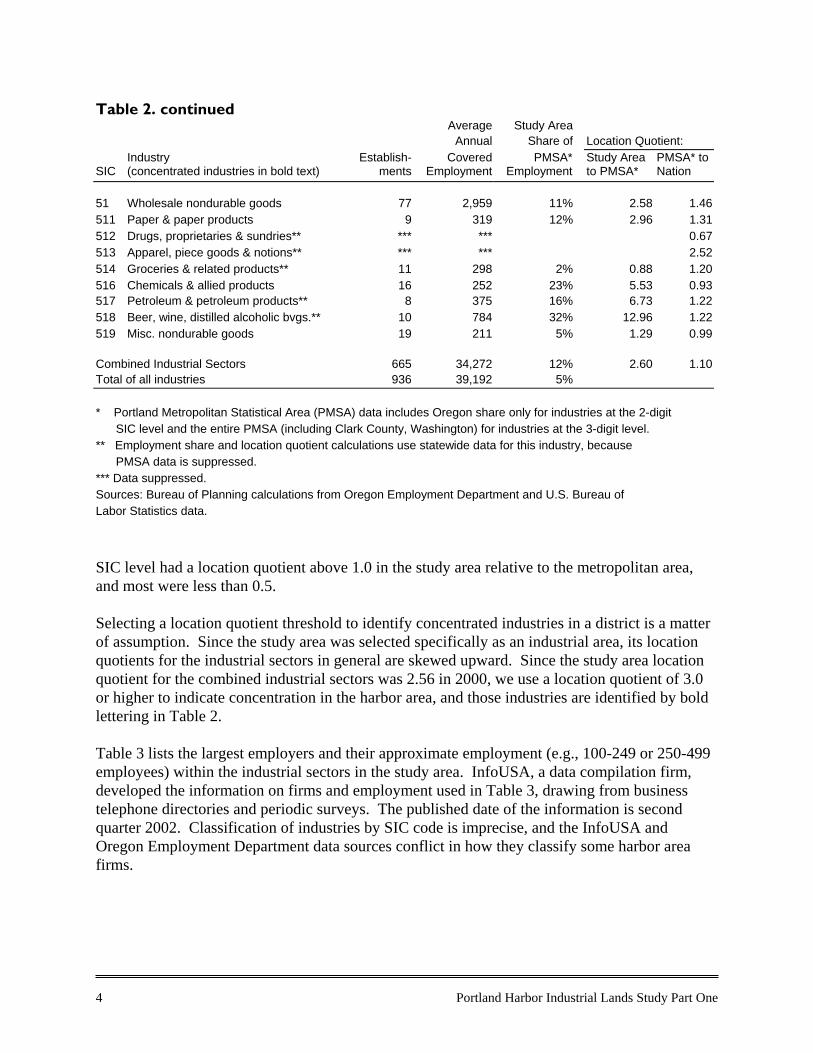
SIC level had a location quotient above 1.0 in the study area relative to the metropolitan area,and most were less than 0.5.
Selecting a location quotient threshold to identify concentrated industries in a district is a matterof assumption. Since the study area was selected specifically as an industrial area, its locationquotients for the industrial sectors in general are skewed upward. Since the study area locationquotient for the combined industrial sectors was 2.56 in 2000, we use a location quotient of 3.0or higher to indicate concentration in the harbor area, and those industries are identified by boldlettering in Table 2.
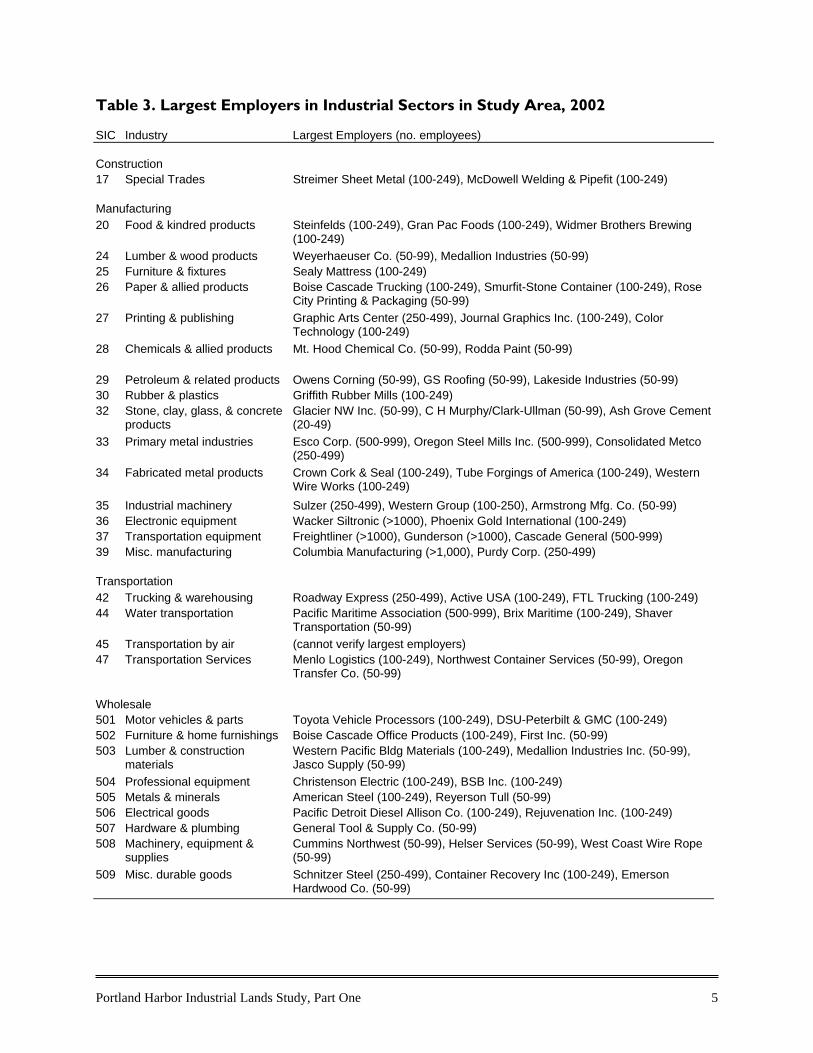
Table 3 lists the largest employers and their approximate employment (e.g., 100-249 or 250-499employees) within the industrial sectors in the study area. InfoUSA, a data compilation firm,developed the information on firms and employment used in Table 3, drawing from businesstelephone directories and periodic surveys. The published date of the information is secondquarter 2002. Classification of industries by SIC code is imprecise, and the InfoUSA andOregon Employment Department data sources conflict in how they classify some harbor areafirms.
Portland Harbor Industrial Lands Study, Part One 5
Table 3. Largest Employers in Industrial Sectors in Study Area, 2002
SIC Industry Largest Employers (no. employees)
Construction17 Special Trades Streimer Sheet Metal (100-249), McDowell Welding & Pipefit (100-249)
Manufacturing20 Food & kindred products Steinfelds (100-249), Gran Pac Foods (100-249), Widmer Brothers Brewing
(100-249)24 Lumber & wood products Weyerhaeuser Co. (50-99), Medallion Industries (50-99)25 Furniture & fixtures Sealy Mattress (100-249)26 Paper & allied products Boise Cascade Trucking (100-249), Smurfit-Stone Container (100-249), Rose
City Printing & Packaging (50-99)27 Printing & publishing Graphic Arts Center (250-499), Journal Graphics Inc. (100-249), Color
Technology (100-249)28 Chemicals & allied products Mt. Hood Chemical Co. (50-99), Rodda Paint (50-99)
29 Petroleum & related products Owens Corning (50-99), GS Roofing (50-99), Lakeside Industries (50-99)30 Rubber & plastics Griffith Rubber Mills (100-249)32 Stone, clay, glass, & concrete
productsGlacier NW Inc. (50-99), C H Murphy/Clark-Ullman (50-99), Ash Grove Cement(20-49)
33 Primary metal industries Esco Corp. (500-999), Oregon Steel Mills Inc. (500-999), Consolidated Metco(250-499)
34 Fabricated metal products Crown Cork & Seal (100-249), Tube Forgings of America (100-249), WesternWire Works (100-249)
35 Industrial machinery Sulzer (250-499), Western Group (100-250), Armstrong Mfg. Co. (50-99)36 Electronic equipment Wacker Siltronic (>1000), Phoenix Gold International (100-249)37 Transportation equipment Freightliner (>1000), Gunderson (>1000), Cascade General (500-999)39 Misc. manufacturing Columbia Manufacturing (>1,000), Purdy Corp. (250-499)
Transportation42 Trucking & warehousing Roadway Express (250-499), Active USA (100-249), FTL Trucking (100-249)44 Water transportation Pacific Maritime Association (500-999), Brix Maritime (100-249), Shaver
Transportation (50-99)45 Transportation by air (cannot verify largest employers)47 Transportation Services Menlo Logistics (100-249), Northwest Container Services (50-99), Oregon
Transfer Co. (50-99)
Wholesale501 Motor vehicles & parts Toyota Vehicle Processors (100-249), DSU-Peterbilt & GMC (100-249)502 Furniture & home furnishings Boise Cascade Office Products (100-249), First Inc. (50-99)503 Lumber & construction
materialsWestern Pacific Bldg Materials (100-249), Medallion Industries Inc. (50-99),Jasco Supply (50-99)
504 Professional equipment Christenson Electric (100-249), BSB Inc. (100-249)505 Metals & minerals American Steel (100-249), Reyerson Tull (50-99)506 Electrical goods Pacific Detroit Diesel Allison Co. (100-249), Rejuvenation Inc. (100-249)507 Hardware & plumbing General Tool & Supply Co. (50-99)508 Machinery, equipment &
suppliesCummins Northwest (50-99), Helser Services (50-99), West Coast Wire Rope(50-99)
509 Misc. durable goods Schnitzer Steel (250-499), Container Recovery Inc (100-249), EmersonHardwood Co. (50-99)
6 Portland Harbor Industrial Lands Study Part One
Table 3. continued
SIC Industry Largest Employers (no. employees)
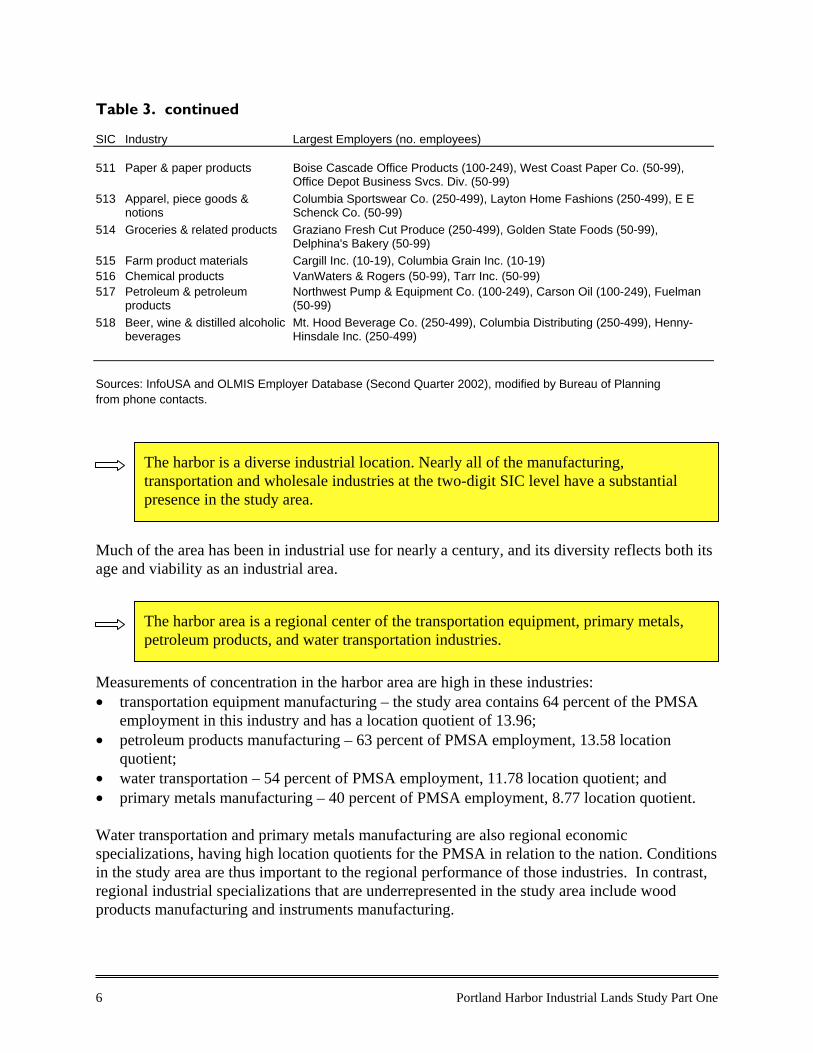
511 Paper & paper products Boise Cascade Office Products (100-249), West Coast Paper Co. (50-99),Office Depot Business Svcs. Div. (50-99)
513 Apparel, piece goods ¬ions
Columbia Sportswear Co. (250-499), Layton Home Fashions (250-499), E ESchenck Co. (50-99)
514 Groceries & related products Graziano Fresh Cut Produce (250-499), Golden State Foods (50-99),Delphina's Bakery (50-99)
515 Farm product materials Cargill Inc. (10-19), Columbia Grain Inc. (10-19)516 Chemical products VanWaters & Rogers (50-99), Tarr Inc. (50-99)517 Petroleum & petroleum
productsNorthwest Pump & Equipment Co. (100-249), Carson Oil (100-249), Fuelman(50-99)
518 Beer, wine & distilled alcoholicbeverages
Mt. Hood Beverage Co. (250-499), Columbia Distributing (250-499), Henny-Hinsdale Inc. (250-499)
Sources: InfoUSA and OLMIS Employer Database (Second Quarter 2002), modified by Bureau of Planningfrom phone contacts.
Much of the area has been in industrial use for nearly a century, and its diversity reflects both itsage and viability as an industrial area.
Measurements of concentration in the harbor area are high in these industries:• transportation equipment manufacturing – the study area contains 64 percent of the PMSA
employment in this industry and has a location quotient of 13.96;• petroleum products manufacturing – 63 percent of PMSA employment, 13.58 location
quotient;• water transportation – 54 percent of PMSA employment, 11.78 location quotient; and• primary metals manufacturing – 40 percent of PMSA employment, 8.77 location quotient.
Water transportation and primary metals manufacturing are also regional economicspecializations, having high location quotients for the PMSA in relation to the nation. Conditionsin the study area are thus important to the regional performance of those industries. In contrast,regional industrial specializations that are underrepresented in the study area include woodproducts manufacturing and instruments manufacturing.
The harbor area is a regional center of the transportation equipment, primary metals,petroleum products, and water transportation industries.
The harbor is a diverse industrial location. Nearly all of the manufacturing,transportation and wholesale industries at the two-digit SIC level have a substantialpresence in the study area.
Portland Harbor Industrial Lands Study, Part One 7
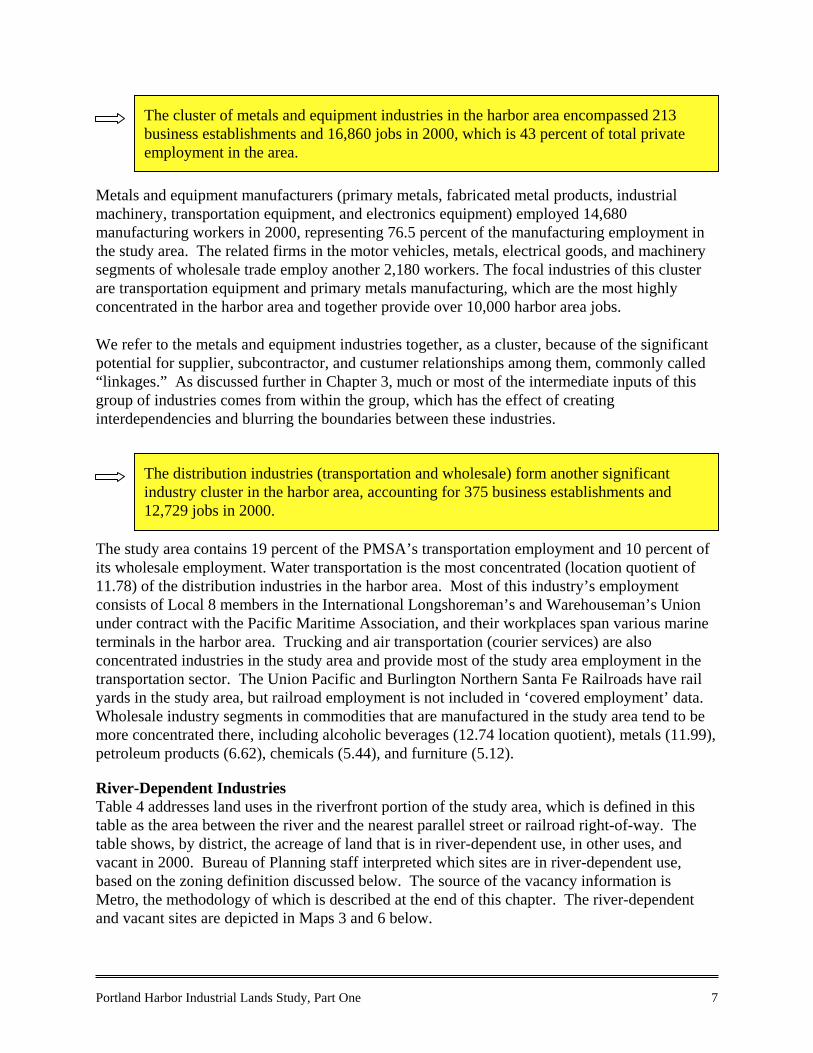
Metals and equipment manufacturers (primary metals, fabricated metal products, industrialmachinery, transportation equipment, and electronics equipment) employed 14,680manufacturing workers in 2000, representing 76.5 percent of the manufacturing employment inthe study area. The related firms in the motor vehicles, metals, electrical goods, and machinerysegments of wholesale trade employ another 2,180 workers. The focal industries of this clusterare transportation equipment and primary metals manufacturing, which are the most highlyconcentrated in the harbor area and together provide over 10,000 harbor area jobs. We refer to the metals and equipment industries together, as a cluster, because of the significantpotential for supplier, subcontractor, and custumer relationships among them, commonly called“linkages.” As discussed further in Chapter 3, much or most of the intermediate inputs of thisgroup of industries comes from within the group, which has the effect of creatinginterdependencies and blurring the boundaries between these industries.
The study area contains 19 percent of the PMSA’s transportation employment and 10 percent ofits wholesale employment. Water transportation is the most concentrated (location quotient of11.78) of the distribution industries in the harbor area. Most of this industry’s employmentconsists of Local 8 members in the International Longshoreman’s and Warehouseman’s Unionunder contract with the Pacific Maritime Association, and their workplaces span various marineterminals in the harbor area. Trucking and air transportation (courier services) are alsoconcentrated industries in the study area and provide most of the study area employment in thetransportation sector. The Union Pacific and Burlington Northern Santa Fe Railroads have railyards in the study area, but railroad employment is not included in ‘covered employment’ data.Wholesale industry segments in commodities that are manufactured in the study area tend to bemore concentrated there, including alcoholic beverages (12.74 location quotient), metals (11.99),petroleum products (6.62), chemicals (5.44), and furniture (5.12).
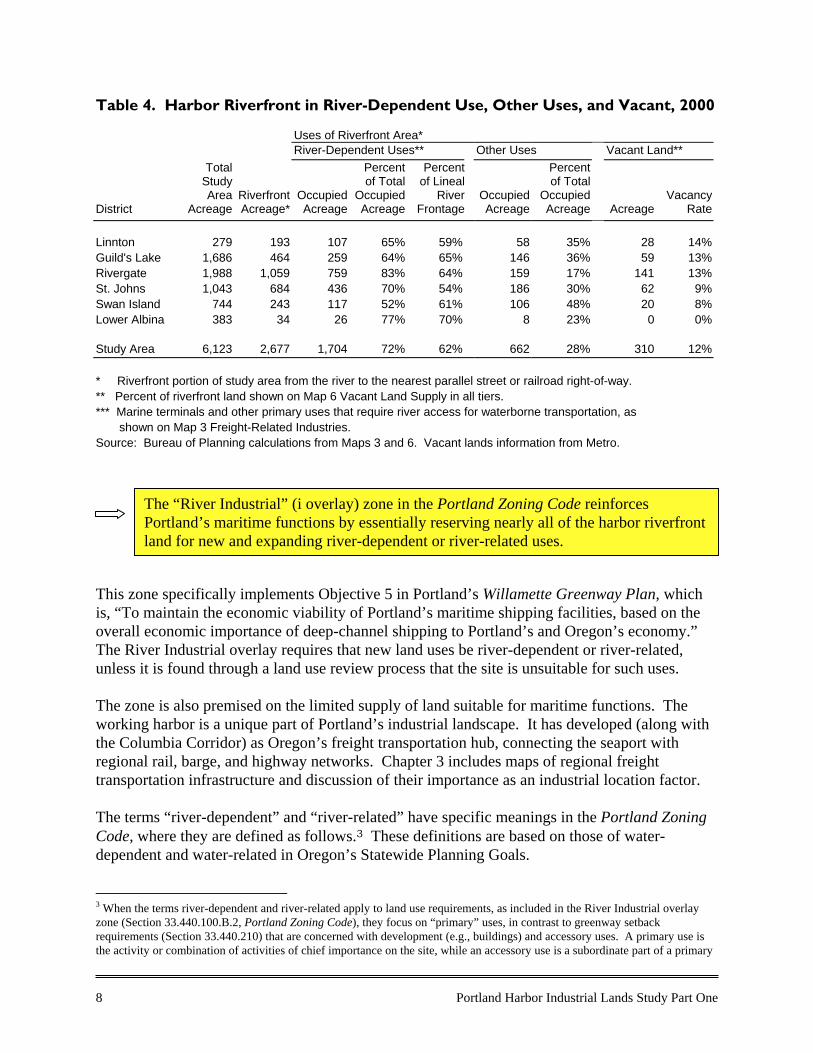
River-Dependent IndustriesTable 4 addresses land uses in the riverfront portion of the study area, which is defined in thistable as the area between the river and the nearest parallel street or railroad right-of-way. Thetable shows, by district, the acreage of land that is in river-dependent use, in other uses, andvacant in 2000. Bureau of Planning staff interpreted which sites are in river-dependent use,based on the zoning definition discussed below. The source of the vacancy information isMetro, the methodology of which is described at the end of this chapter. The river-dependentand vacant sites are depicted in Maps 3 and 6 below.
The cluster of metals and equipment industries in the harbor area encompassed 213business establishments and 16,860 jobs in 2000, which is 43 percent of total privateemployment in the area.
The distribution industries (transportation and wholesale) form another significantindustry cluster in the harbor area, accounting for 375 business establishments and12,729 jobs in 2000.
8 Portland Harbor Industrial Lands Study Part One
Table 4. Harbor Riverfront in River-Dependent Use, Other Uses, and Vacant, 2000
Uses of Riverfront Area*River-Dependent Uses** Other Uses Vacant Land**
District
TotalStudyArea
AcreageRiverfrontAcreage*
OccupiedAcreage
Percentof Total
OccupiedAcreage
Percent of Lineal
RiverFrontage
OccupiedAcreage
Percent of Total
OccupiedAcreage Acreage
VacancyRate
Linnton 279 193 107 65% 59% 58 35% 28 14%Guild's Lake 1,686 464 259 64% 65% 146 36% 59 13%Rivergate 1,988 1,059 759 83% 64% 159 17% 141 13%St. Johns 1,043 684 436 70% 54% 186 30% 62 9%Swan Island 744 243 117 52% 61% 106 48% 20 8%Lower Albina 383 34 26 77% 70% 8 23% 0 0%
Study Area 6,123 2,677 1,704 72% 62% 662 28% 310 12%
* Riverfront portion of study area from the river to the nearest parallel street or railroad right-of-way.** Percent of riverfront land shown on Map 6 Vacant Land Supply in all tiers.*** Marine terminals and other primary uses that require river access for waterborne transportation, as shown on Map 3 Freight-Related Industries.Source: Bureau of Planning calculations from Maps 3 and 6. Vacant lands information from Metro.
This zone specifically implements Objective 5 in Portland’s Willamette Greenway Plan, whichis, “To maintain the economic viability of Portland’s maritime shipping facilities, based on theoverall economic importance of deep-channel shipping to Portland’s and Oregon’s economy.”The River Industrial overlay requires that new land uses be river-dependent or river-related,unless it is found through a land use review process that the site is unsuitable for such uses.
The zone is also premised on the limited supply of land suitable for maritime functions. Theworking harbor is a unique part of Portland’s industrial landscape. It has developed (along withthe Columbia Corridor) as Oregon’s freight transportation hub, connecting the seaport withregional rail, barge, and highway networks. Chapter 3 includes maps of regional freighttransportation infrastructure and discussion of their importance as an industrial location factor.
The terms “river-dependent” and “river-related” have specific meanings in the Portland ZoningCode, where they are defined as follows.3 These definitions are based on those of water-dependent and water-related in Oregon’s Statewide Planning Goals.
3 When the terms river-dependent and river-related apply to land use requirements, as included in the River Industrial overlayzone (Section 33.440.100.B.2, Portland Zoning Code), they focus on “primary” uses, in contrast to greenway setbackrequirements (Section 33.440.210) that are concerned with development (e.g., buildings) and accessory uses. A primary use isthe activity or combination of activities of chief importance on the site, while an accessory use is a subordinate part of a primary
The “River Industrial” (i overlay) zone in the Portland Zoning Code reinforcesPortland’s maritime functions by essentially reserving nearly all of the harbor riverfrontland for new and expanding river-dependent or river-related uses.
Portland Harbor Industrial Lands Study, Part One 9
River-Dependent. A use which can be carried out only on, in, or adjacent to a river because itrequires access to the river for waterborne transportation or recreation. River-dependent alsoincludes development, which by its nature, can be built only on, in, or over a river. Bridgessupported by piers or pillars, as opposed to fill, are river-dependent development.
River-Related. A use or development which is not directly dependent upon access to a waterbody but which provides goods or services that are directly associated with river-dependent landor waterway use or development, and which, if not located adjacent to water, would result in apublic loss of quality in the goods or services offered. Residences (including houseboats),parking areas, spoil and dump sites, roads and highways, restaurants, businesses, factories, andrecreational vehicle parks are not generally considered dependent or related to water.Recreational trails and viewpoints adjacent to the river are river-related development. Bridgeexit and entrance ramps supported by piers or pillars, as opposed to fill, are river-relateddevelopment.
To characterize which of the existing uses in the study area are river-dependent, we propose thefollowing categories and corresponding examples of uses that require river access for waterbornetransportation.4
• Marine cargo terminals, in which commodities are loaded to or unloaded from ships andstored on land for eventual distribution in a relatively unaltered state. Examples in the studyarea include the Port of Portland marine terminals (among SIC code 9621), variouspetroleum bulk terminals and associated tank farms (among SIC 5171), and private grainterminals (among SIC 5149 and 5153).
• Marine- or vessel-related services. Among the variety of examples in the study area aremarine cargo handling and services (among SIC 4491 and 4499), towing and barge services(among SIC 4424, 4449, and 4492), dredging related services (among SIC 9512 and 9621),and naval and coast guard services (among SIC 9621).
• Marine-dependent manufacturers, which depend on marine loading facilities for transport of
raw materials or finished products. Examples in the study area include firms thatmanufacture ships or barges (SIC 3731), steel (among SIC 33), chemicals (among SIC 28),asphalt products (among SIC 295), and concrete (among SIC 32).
The term river-related is more narrowly defined for primary uses than river-dependent, and, uponpreliminary review, none of the industrial uses in the study area appears to meet it. As analternative, the term freight-related is explored in this report to acknowledge and investigate thelocation advantages of the harbor area (not necessarily the riverfront) for transportation andwholesale industries. Harbor functions require a network of waterborne, rail and trucktransportation systems. Firms involved with freight distribution have varying needs to locateadjacent to or near that infrastructure. For example, the Albina and Lake rail yards provide
use and clearly incidental to a primary use. For example, a marine terminal is a river-dependent primary use. On that marineterminal site, a dock and loading crane are river-dependent accessory uses, but an office and employee parking lot are not. 4 These categories closely mirror those used by the Port of Portland in the 1997 Portland Harbor Land Use Inventory to identify“marine-related uses,” which, as defined in that inventory, also depend upon access to the river.
10 Portland Harbor Industrial Lands Study Part One
important rail capacity in the study area, not adjacent to the river but within a few hundred feet.We loosely characterize freight-related industries as the entire transportation and wholesalesectors, which generally require convenient access to the freight transportation system. A surveyof these firms could also be used to define a narrower group of freight-system dependentindustries that would be likely to close down without adjacent or nearby access to thetransportation infrastructure network along the harbor.
The parcels in river-dependent use are depicted on Map 3. Again, the riverfront area is definedhere as the properties between the river and the nearest street or railroad right-of-way, whichcovers 2,677 acres in the study area. Property acreage is measured to a waterline location, so thesubmerged portions of some riverfront parcels are excluded from this acreage calculation. Thewaterline location is near the ordinary low water level, although the specific elevation is notconfirmed. In Part 2 of the study, E.D. Hovee and Co. analyzes a larger riverfront area of 3,133acres, which includes some vacant and marine cargo facilities on the landward side of the neareststreet or railroad right-of-way, such as the GATX, Chevron, and Tosco facilities on Front Ave.
An accurate calculation of the riverbank area would require surveying the top of bank andordinary low water level for the study area, which has not been done. As an alternative, the bankarea is estimated using the following assumptions. The length of the riverfront in the study areais measured at 26.73 miles, using GIS mapping tools. The average bank height is approximatedas 24 feet, which is the difference between the 100-year flood elevation (28 feet) and ordinarylow water (4 feet) for most of the harbor area. Average bank slope is estimated to be 2.5H:1V,which is depicted in the Willamette Riverbank Design Notebook as typical of a traditional riprapbank. The harbor riverbanks also include a combination of river beach, natural bank,bioengineered bank, seawall, structures, and unclassified fill, some of which are more steep, andothers less steep, than riprap. Using these assumptions, average bank width is estimated at 60feet. The Portland Zoning Code allows river-dependent and river-related development within thebank and setback areas, as determined through a land use review process.
Martin Associates (2001) estimated that 7,189 jobs are directly dependent on cargomoving over the private and public port facilities at Portland Harbor, although many ofthe employers are not actually located along the harbor.
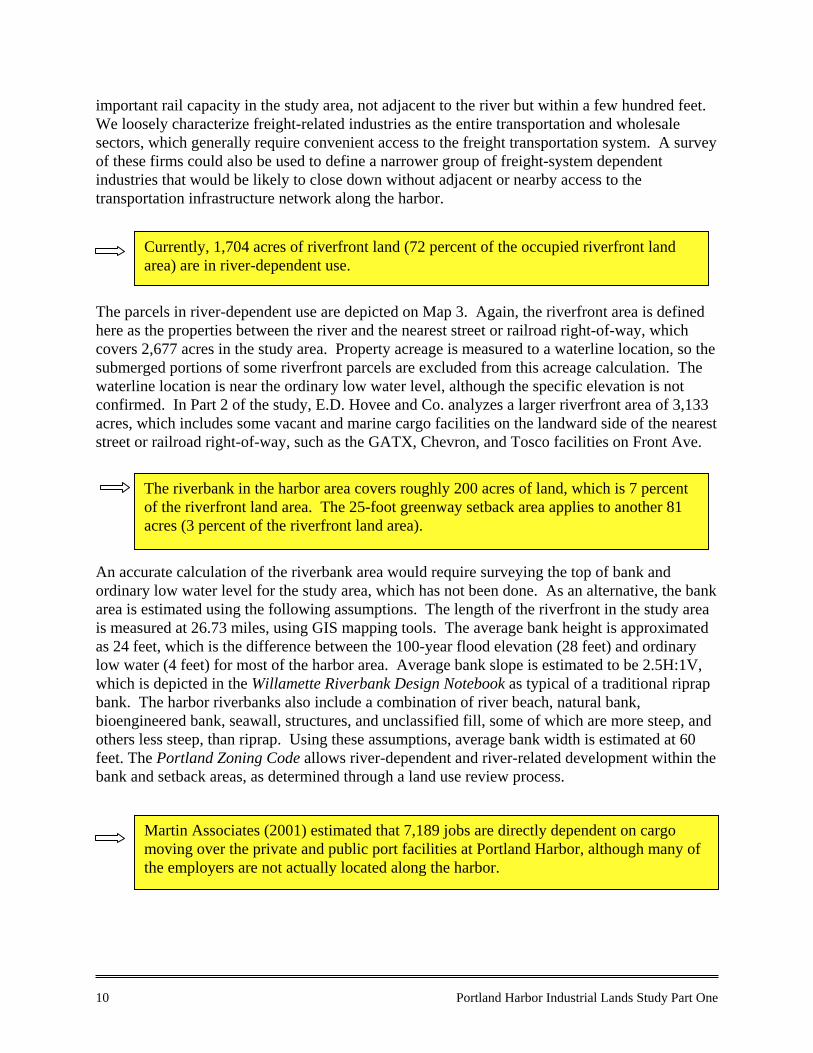
The riverbank in the harbor area covers roughly 200 acres of land, which is 7 percentof the riverfront land area. The 25-foot greenway setback area applies to another 81acres (3 percent of the riverfront land area).
Currently, 1,704 acres of riverfront land (72 percent of the occupied riverfront landarea) are in river-dependent use.
Portland Harbor Industrial Lands Study, Part One 11
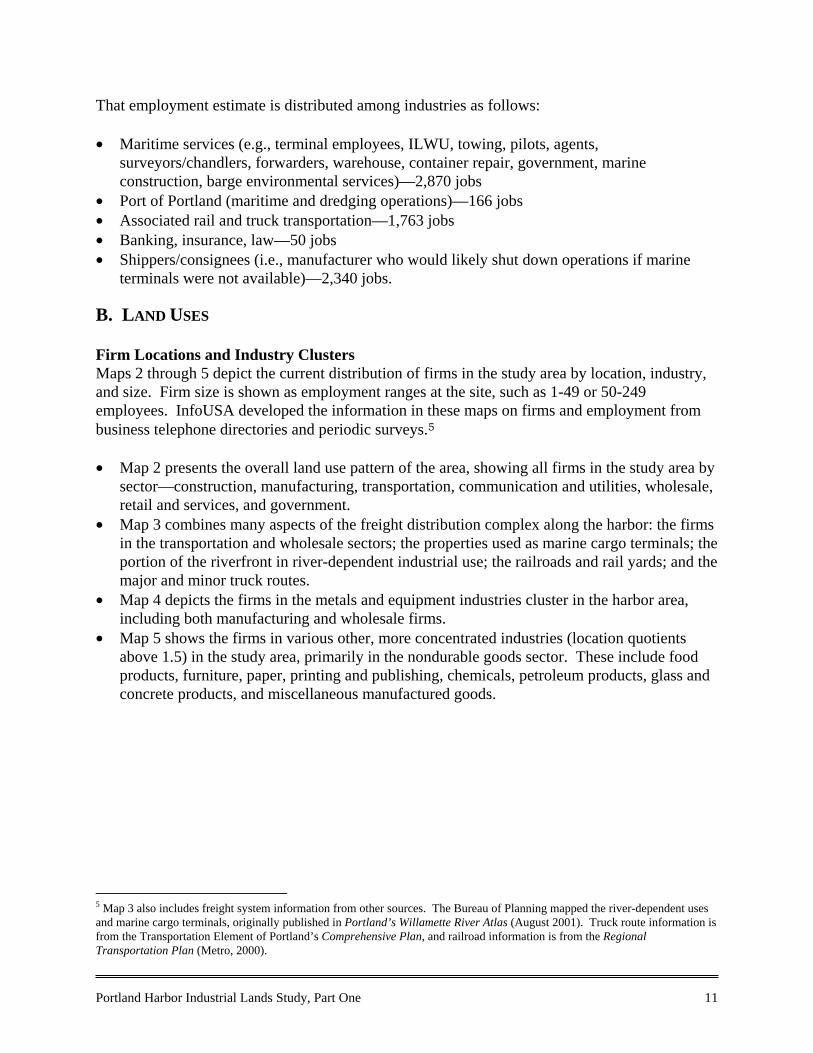
That employment estimate is distributed among industries as follows: • Maritime services (e.g., terminal employees, ILWU, towing, pilots, agents,
surveyors/chandlers, forwarders, warehouse, container repair, government, marineconstruction, barge environmental services)—2,870 jobs
• Port of Portland (maritime and dredging operations)—166 jobs• Associated rail and truck transportation—1,763 jobs• Banking, insurance, law—50 jobs• Shippers/consignees (i.e., manufacturer who would likely shut down operations if marine
terminals were not available)—2,340 jobs.
B. LAND USES
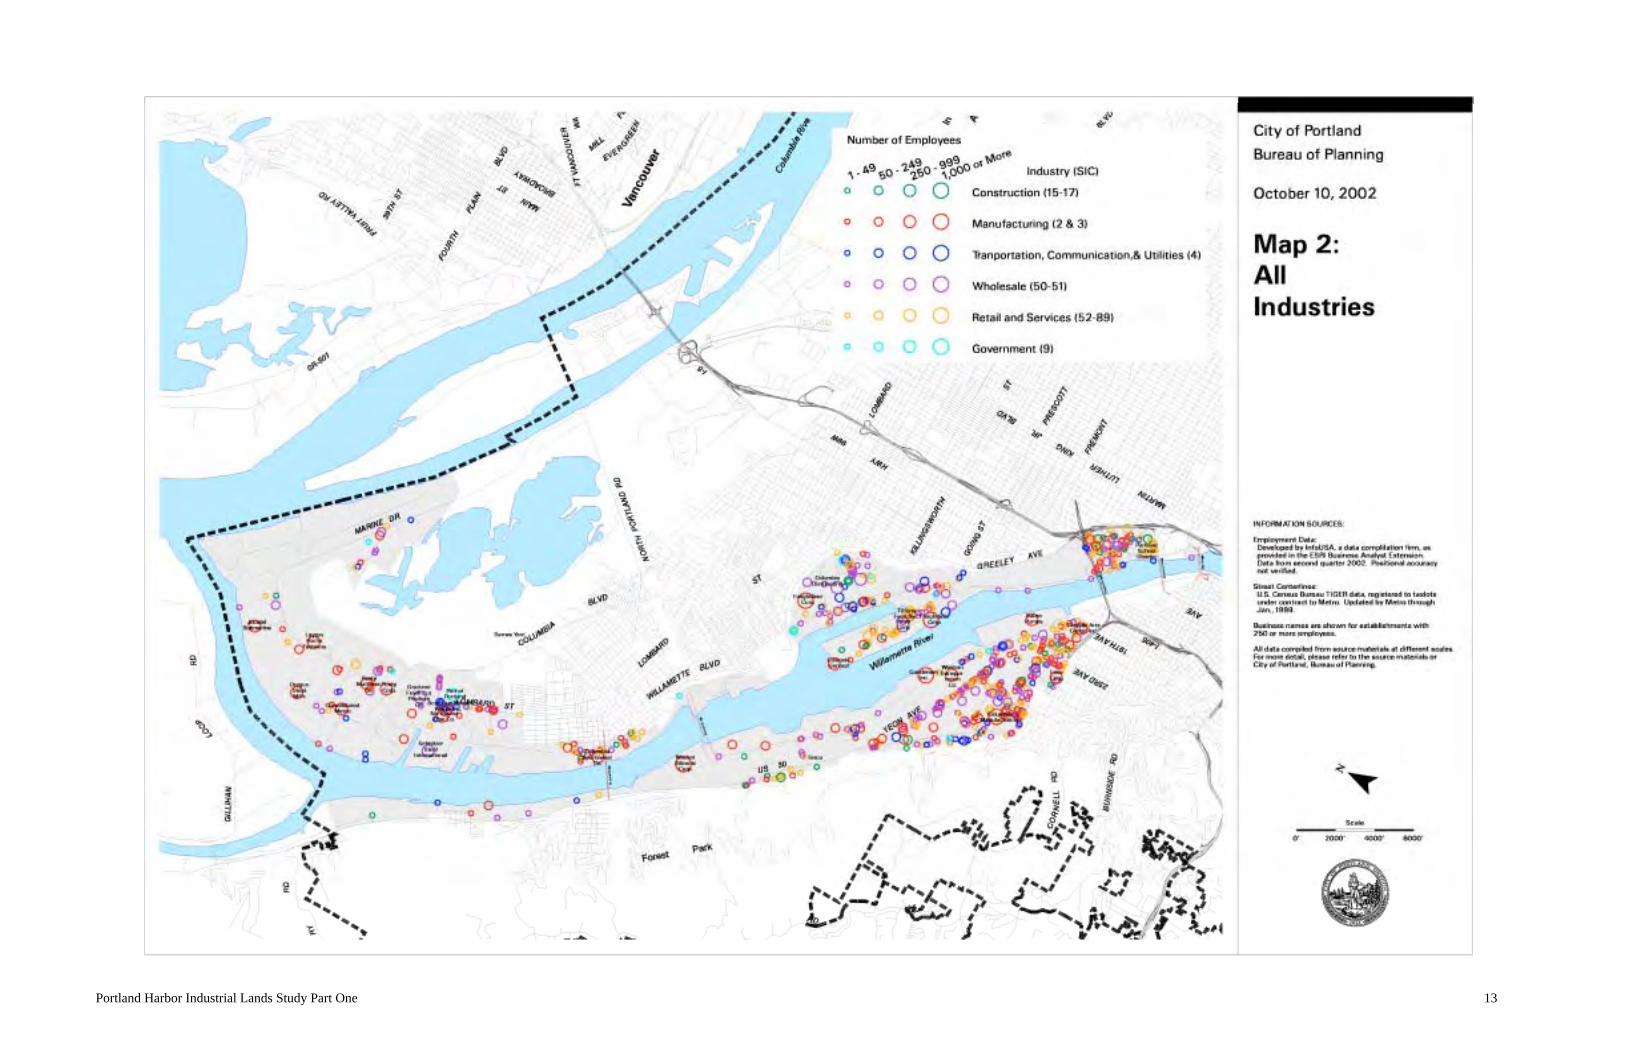
Firm Locations and Industry ClustersMaps 2 through 5 depict the current distribution of firms in the study area by location, industry,and size. Firm size is shown as employment ranges at the site, such as 1-49 or 50-249employees. InfoUSA developed the information in these maps on firms and employment frombusiness telephone directories and periodic surveys.5 • Map 2 presents the overall land use pattern of the area, showing all firms in the study area by
sector—construction, manufacturing, transportation, communication and utilities, wholesale,retail and services, and government.
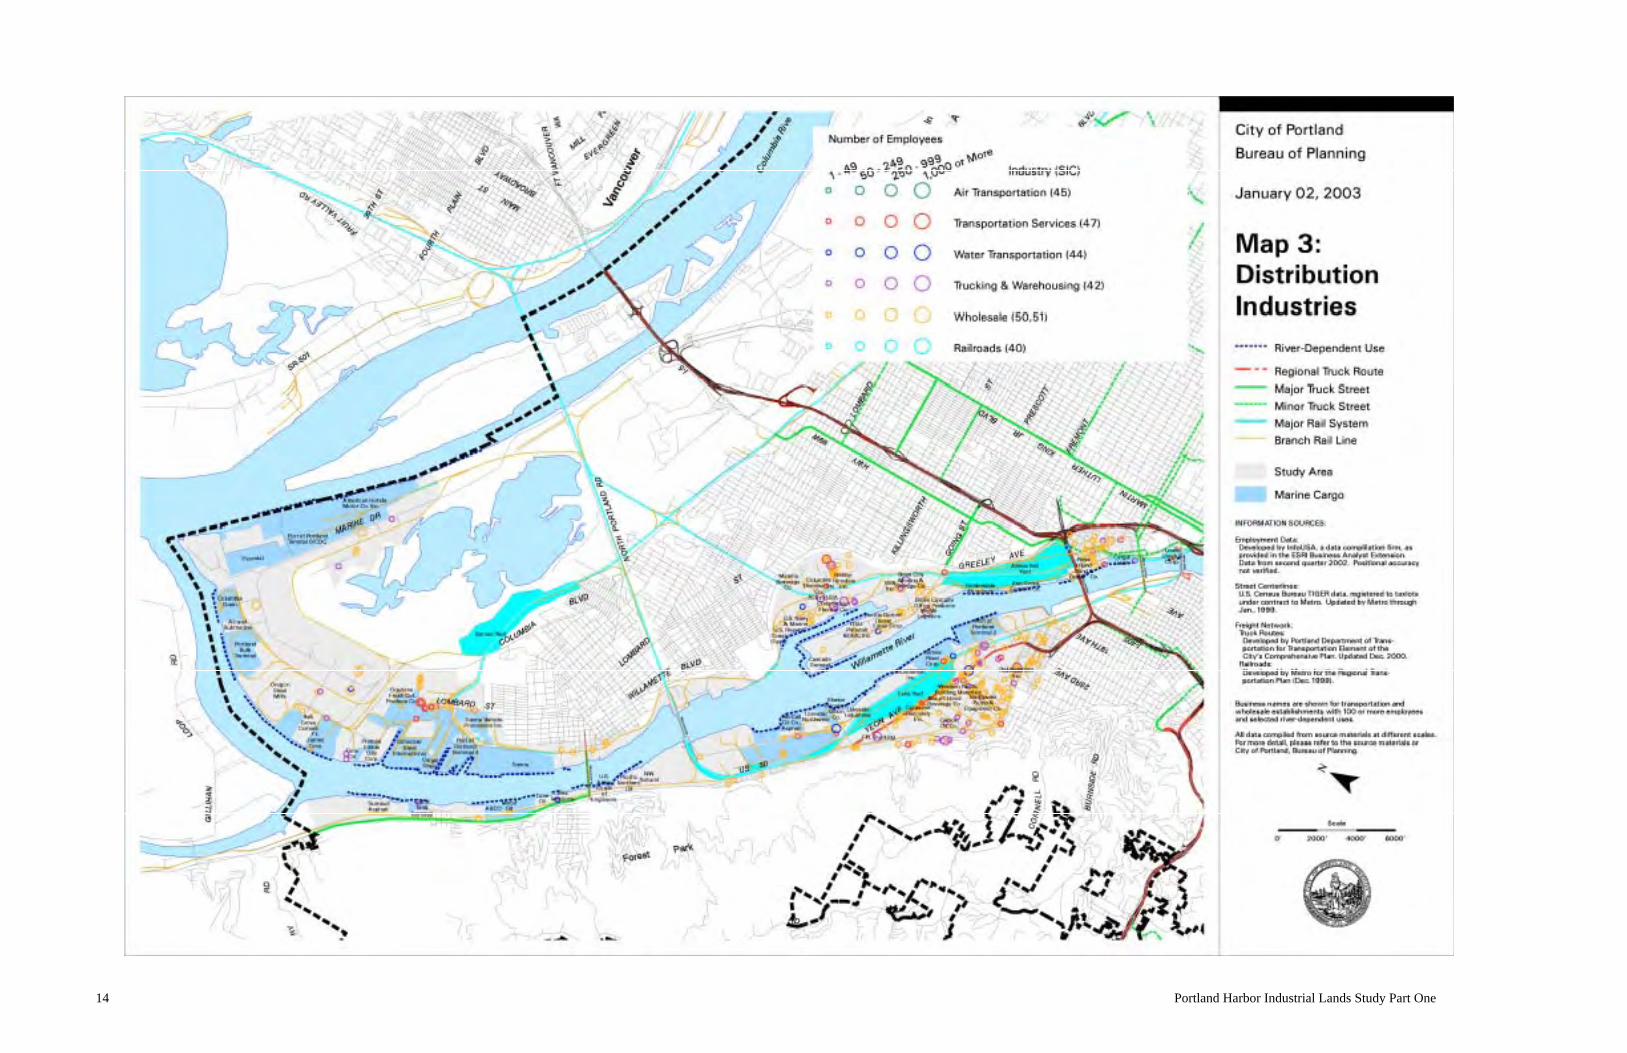
• Map 3 combines many aspects of the freight distribution complex along the harbor: the firmsin the transportation and wholesale sectors; the properties used as marine cargo terminals; theportion of the riverfront in river-dependent industrial use; the railroads and rail yards; and themajor and minor truck routes.
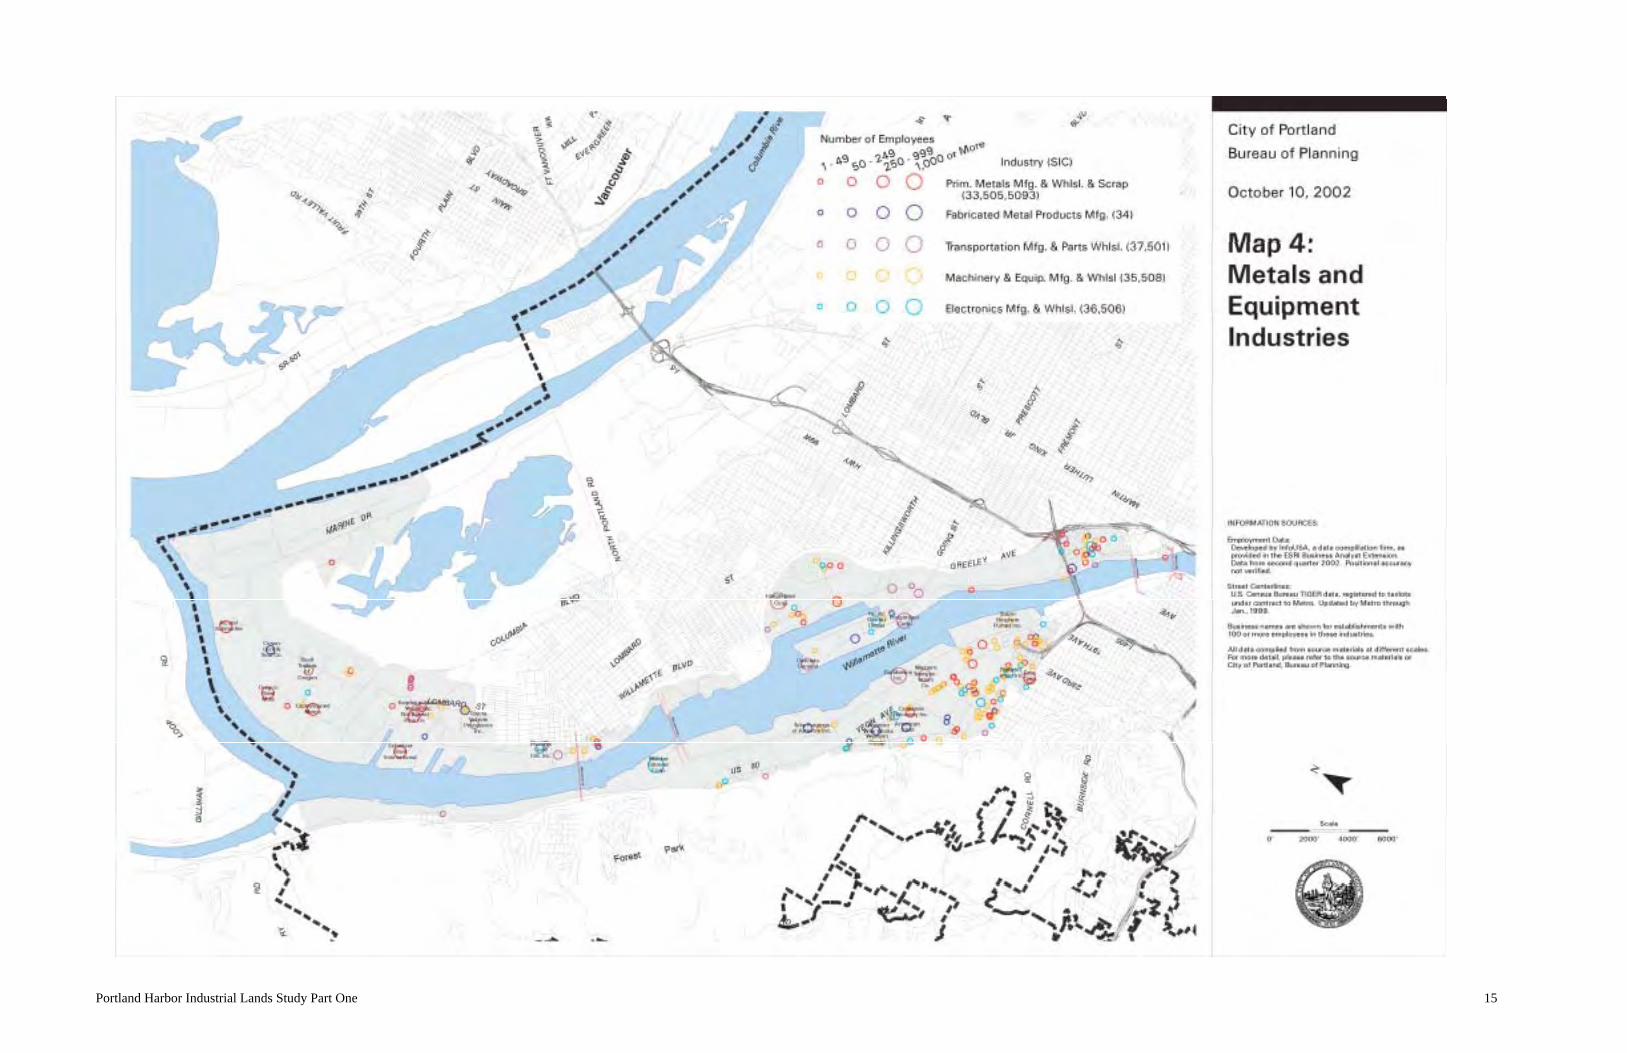
• Map 4 depicts the firms in the metals and equipment industries cluster in the harbor area,including both manufacturing and wholesale firms.
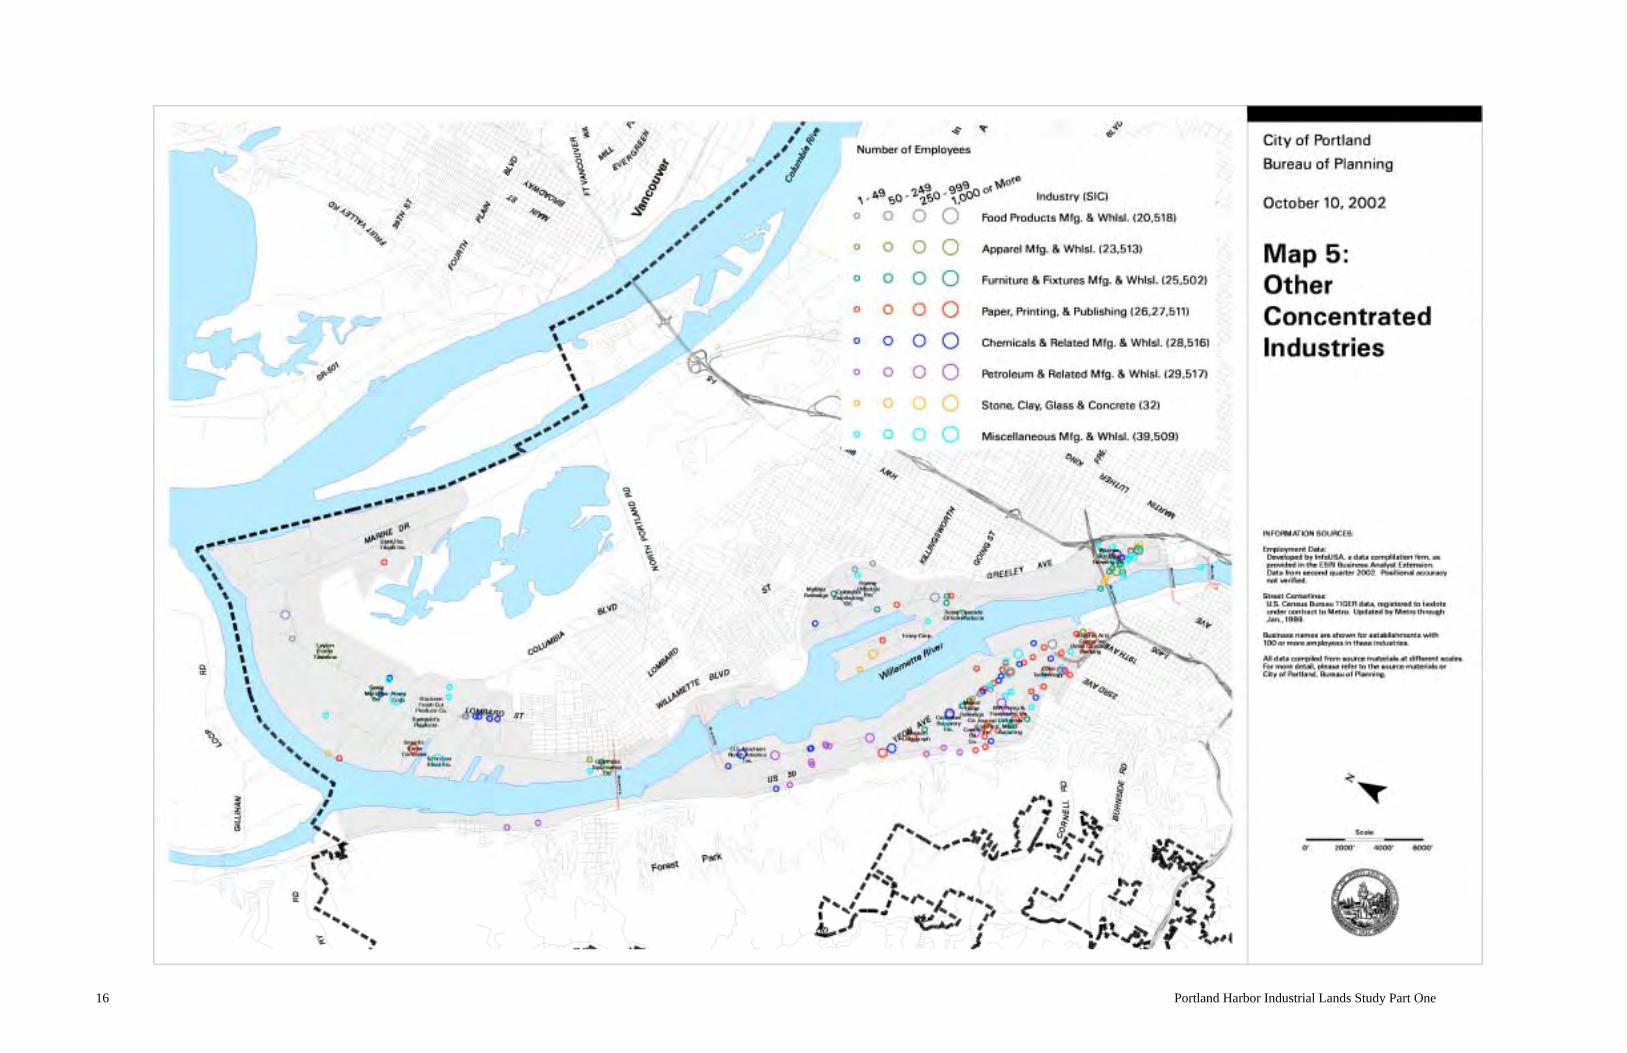
• Map 5 shows the firms in various other, more concentrated industries (location quotientsabove 1.5) in the study area, primarily in the nondurable goods sector. These include foodproducts, furniture, paper, printing and publishing, chemicals, petroleum products, glass andconcrete products, and miscellaneous manufactured goods.
5 Map 3 also includes freight system information from other sources. The Bureau of Planning mapped the river-dependent usesand marine cargo terminals, originally published in Portland’s Willamette River Atlas (August 2001). Truck route information isfrom the Transportation Element of Portland’s Comprehensive Plan, and railroad information is from the RegionalTransportation Plan (Metro, 2000).
Portland Harbor Industrial Lands Study Part One 13
14 Portland Harbor Industrial Lands Study Part One
Portland Harbor Industrial Lands Study Part One 15
16 Portland Harbor Industrial Lands Study Part One
Portland Harbor Industrial Lands Study Part One 17
The harbor appears not so much to be a linear feature along the riverfront as a freight distributioncomplex that spans the wider industrial districts adjacent to the harbor. Marine cargo terminalsand other river-dependent industries extend the river’s length from the grain terminals andconcrete industries in Lower Albina to the container and auto facilities at Port of PortlandTerminal 6. Railroads also run the length of the harbor on both sides. Union Pacific andBurlington Northern Santa Fe each have rail yards within a few hundred feet of the harbor.Wholesale and transportation firms are much more densely concentrated in the Guild’s Lake,Swan Island, and Lower Albina areas than in the northerly Rivergate, St. Johns, and Linntonareas.
Several petroleum bulk terminals—GATX (Shell), ARCO, Mobile, Tosco, Pacific Northern,Unocal, Chevron, and McCall Oil— are concentrated on the west side of the river in the Linntonand Guild’s Lake areas. This area serves as Oregon’s petroleum distribution hub, receivinggasoline, diesel, fuel oil, and other petroleum products via tanker vessels and the Olympicpipeline, which extends through Linnton from the Puget Sound.
The Honda, Hyundai, and Toyota marine terminals in the Rivergate and St. Johns areas aresituated nearly adjacent to the Ford and General Motors land-side distribution facilities. Trainsthat bring Ford, GM, and Honda automobiles from the Midwest to North Portland for regionaldistribution by truck make return trips to the inland U.S. loaded with Honda, Hyundai, Subaru(Vancouver marine terminal), and Toyota automobiles.
Examples of large, transportation equipment firms:• Freightliner, truck manufacturing, more than 1,000 employees• Cascade General, ship repair, more than 1,000 employees• Gunderson, rail car and barge manufacturing, more than 1,000 employees• Western Transportation, ship repair, 250-499 employees• Boydstun Metal Works, 250-499 employees• Toyota Vehicle Processors, automobile detailing, 100-249 employees
Examples of large, primary metals firms:• Esco, steel mill, 500-999 employees• Oregon Steel Mills, 500-999 employees
Much of the employment in the harbor area’s transportation equipment and primarymetals industries is within large employers located on large sites, many along theriverfront.
Freight-related firms and infrastructure span the entire length of the harbor and thewidth of the adjacent industrial districts.
Among the distribution industries, the petroleum and automobile terminals are the mosttightly clustered geographically.
18 Portland Harbor Industrial Lands Study Part One
• Consolidated Metco, aluminum foundry, 250-499 employees• Northwest Pipe, pipe manufacturer, 250-499 employees• Schnitzer Steel, steel recycling and distribution, 250-499 employees• Alcatel Submarine, cable manufacturing, 250-499 employees (closed in 2001)
The riverfront facilities cited above (Cascade General, Gunderson, Toyota, Oregon Steel,Schnitzer, and Alcatel) are all river-dependent uses.
Potentially related to their geographic concentration, these two industries have much smalleraverage firm size than the other metals and equipment industries. The printing, publishing, andpaper industries (manufacturing and wholesale) are also clustered in the southern Guild’s Lakeand Lower Albina areas (35 establishments), close to the Central City.
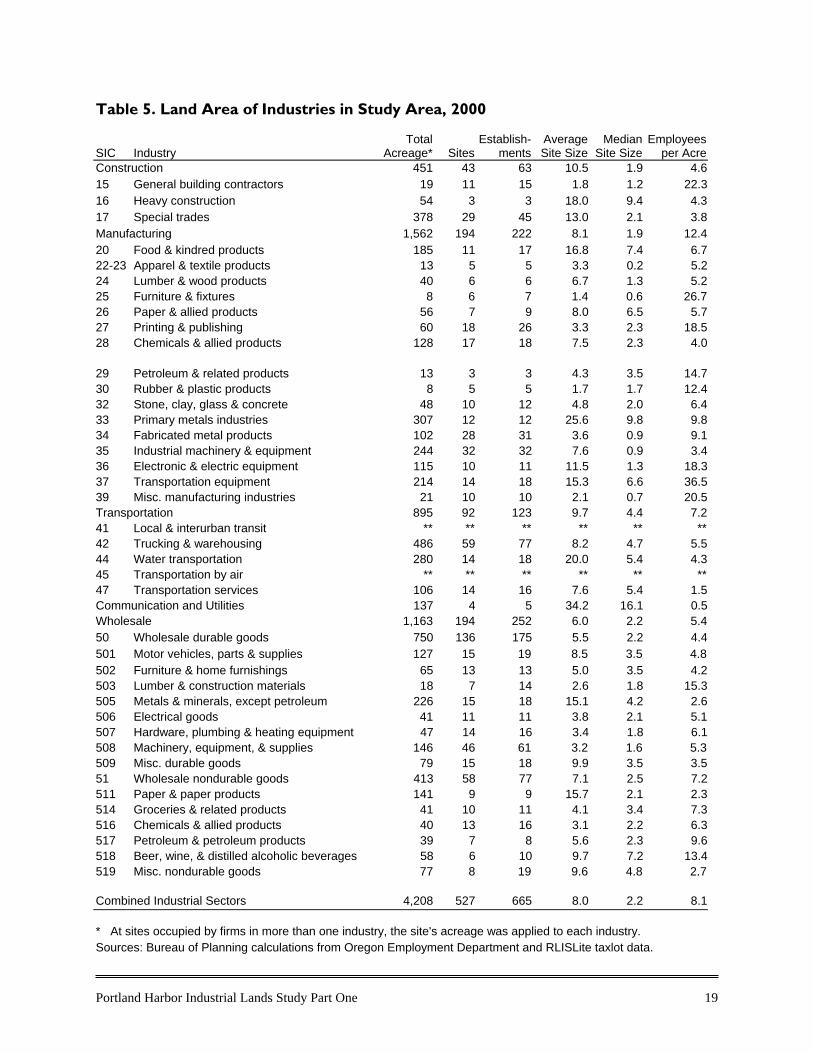
Land AreaTable 5 shows the size (average and median) of properties and employees per acre of industriesin the harbor area. The Bureau of Planning calculated this information from Metro’s RLISLitetaxlot data and Oregon Employment Department data on firm addresses and employment. Theadjacent parcels under single ownership were grouped together as single sites. The land area ofsome sites is double counted—if the site was occupied by more than one firm in more than oneindustry, the acreage of the entire site was applied to each industry. A rough indication of theextent of double-counting can be gleaned from the difference in the number of sites andestablishments within each industry shown in Table 5—that difference approximates the numberof businesses on multiple-business sites. Additionally, the Oregon Employment Department datadoes not include site and employment information for the following very large sites: the Port ofPortland’s public terminal facilities (approximately 125 acres at the Terminal 6 container facilityand 49 acres at Terminal 2); Union Pacific Railroad’s Albina Yard (approximately 185 acres), orBurlington Northern Santa Fe Railroad’s Lake Yard (approximately 150 acres).
The size of properties in the harbor area varies widely. Industries with average site size largerthan twenty acres include utilities, primary metals manufacturing, and water transportation.Among the industrial sectors, manufacturing has the highest employment density with 12.4employees per acre, and utilities the least with 0.5 employees per acre.
Among the metals and equipment industries, the most tightly clustered are the 56industrial machinery (manufacturing and wholesale) establishments and 17 fabricatedmetal products establishments in the southern Guild’s Lake and Lower Albina areas.
The median size of sites occupied by firms in the industrial sectors is 2.2 acres, and theaverage size is 8.0 acres.
Portland Harbor Industrial Lands Study Part One 19
Table 5. Land Area of Industries in Study Area, 2000
SIC IndustryTotal
Acreage* SitesEstablish-
mentsAverageSite Size
MedianSite Size
Employeesper Acre
Construction 451 43 63 10.5 1.9 4.615 General building contractors 19 11 15 1.8 1.2 22.316 Heavy construction 54 3 3 18.0 9.4 4.317 Special trades 378 29 45 13.0 2.1 3.8Manufacturing 1,562 194 222 8.1 1.9 12.420 Food & kindred products 185 11 17 16.8 7.4 6.722-23 Apparel & textile products 13 5 5 3.3 0.2 5.224 Lumber & wood products 40 6 6 6.7 1.3 5.225 Furniture & fixtures 8 6 7 1.4 0.6 26.726 Paper & allied products 56 7 9 8.0 6.5 5.727 Printing & publishing 60 18 26 3.3 2.3 18.528 Chemicals & allied products 128 17 18 7.5 2.3 4.0
29 Petroleum & related products 13 3 3 4.3 3.5 14.730 Rubber & plastic products 8 5 5 1.7 1.7 12.432 Stone, clay, glass & concrete 48 10 12 4.8 2.0 6.433 Primary metals industries 307 12 12 25.6 9.8 9.834 Fabricated metal products 102 28 31 3.6 0.9 9.135 Industrial machinery & equipment 244 32 32 7.6 0.9 3.436 Electronic & electric equipment 115 10 11 11.5 1.3 18.337 Transportation equipment 214 14 18 15.3 6.6 36.539 Misc. manufacturing industries 21 10 10 2.1 0.7 20.5Transportation 895 92 123 9.7 4.4 7.241 Local & interurban transit ** ** ** ** ** **42 Trucking & warehousing 486 59 77 8.2 4.7 5.544 Water transportation 280 14 18 20.0 5.4 4.345 Transportation by air ** ** ** ** ** **47 Transportation services 106 14 16 7.6 5.4 1.5Communication and Utilities 137 4 5 34.2 16.1 0.5Wholesale 1,163 194 252 6.0 2.2 5.450 Wholesale durable goods 750 136 175 5.5 2.2 4.4501 Motor vehicles, parts & supplies 127 15 19 8.5 3.5 4.8502 Furniture & home furnishings 65 13 13 5.0 3.5 4.2503 Lumber & construction materials 18 7 14 2.6 1.8 15.3505 Metals & minerals, except petroleum 226 15 18 15.1 4.2 2.6506 Electrical goods 41 11 11 3.8 2.1 5.1507 Hardware, plumbing & heating equipment 47 14 16 3.4 1.8 6.1508 Machinery, equipment, & supplies 146 46 61 3.2 1.6 5.3509 Misc. durable goods 79 15 18 9.9 3.5 3.551 Wholesale nondurable goods 413 58 77 7.1 2.5 7.2511 Paper & paper products 141 9 9 15.7 2.1 2.3514 Groceries & related products 41 10 11 4.1 3.4 7.3516 Chemicals & allied products 40 13 16 3.1 2.2 6.3517 Petroleum & petroleum products 39 7 8 5.6 2.3 9.6518 Beer, wine, & distilled alcoholic beverages 58 6 10 9.7 7.2 13.4519 Misc. nondurable goods 77 8 19 9.6 4.8 2.7
Combined Industrial Sectors 4,208 527 665 8.0 2.2 8.1
* At sites occupied by firms in more than one industry, the site's acreage was applied to each industry.Sources: Bureau of Planning calculations from Oregon Employment Department and RLISLite taxlot data.
20 Portland Harbor Industrial Lands Study Part One
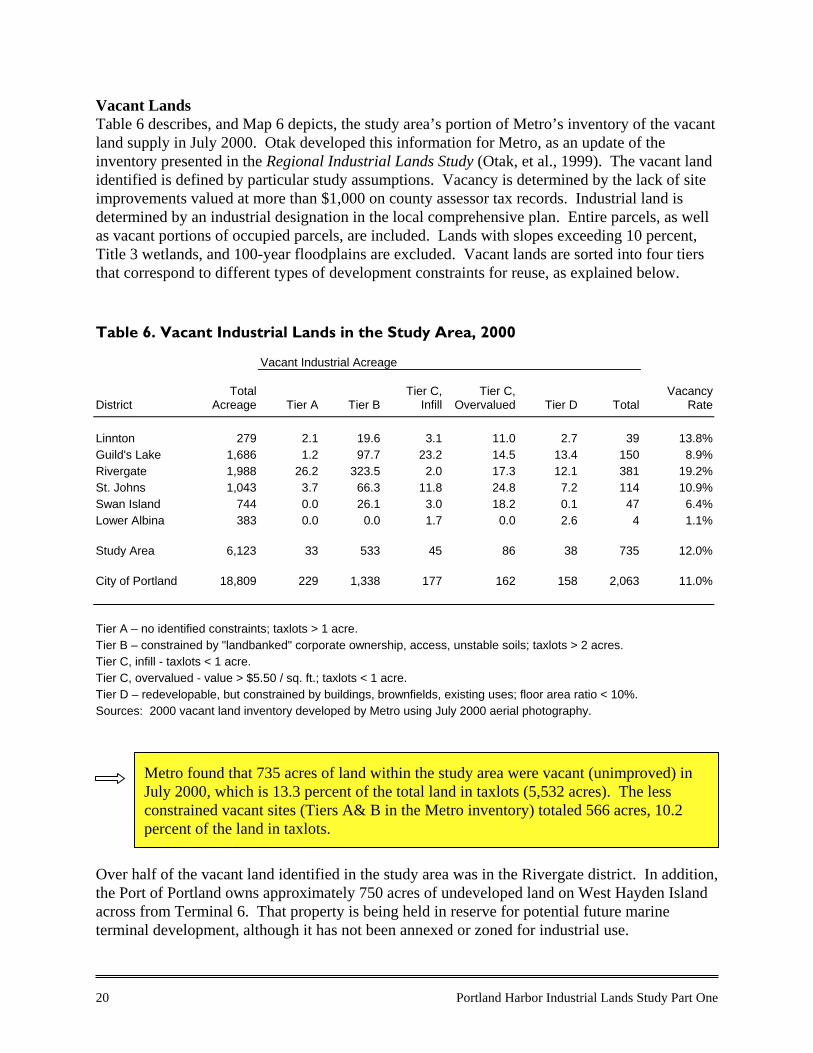
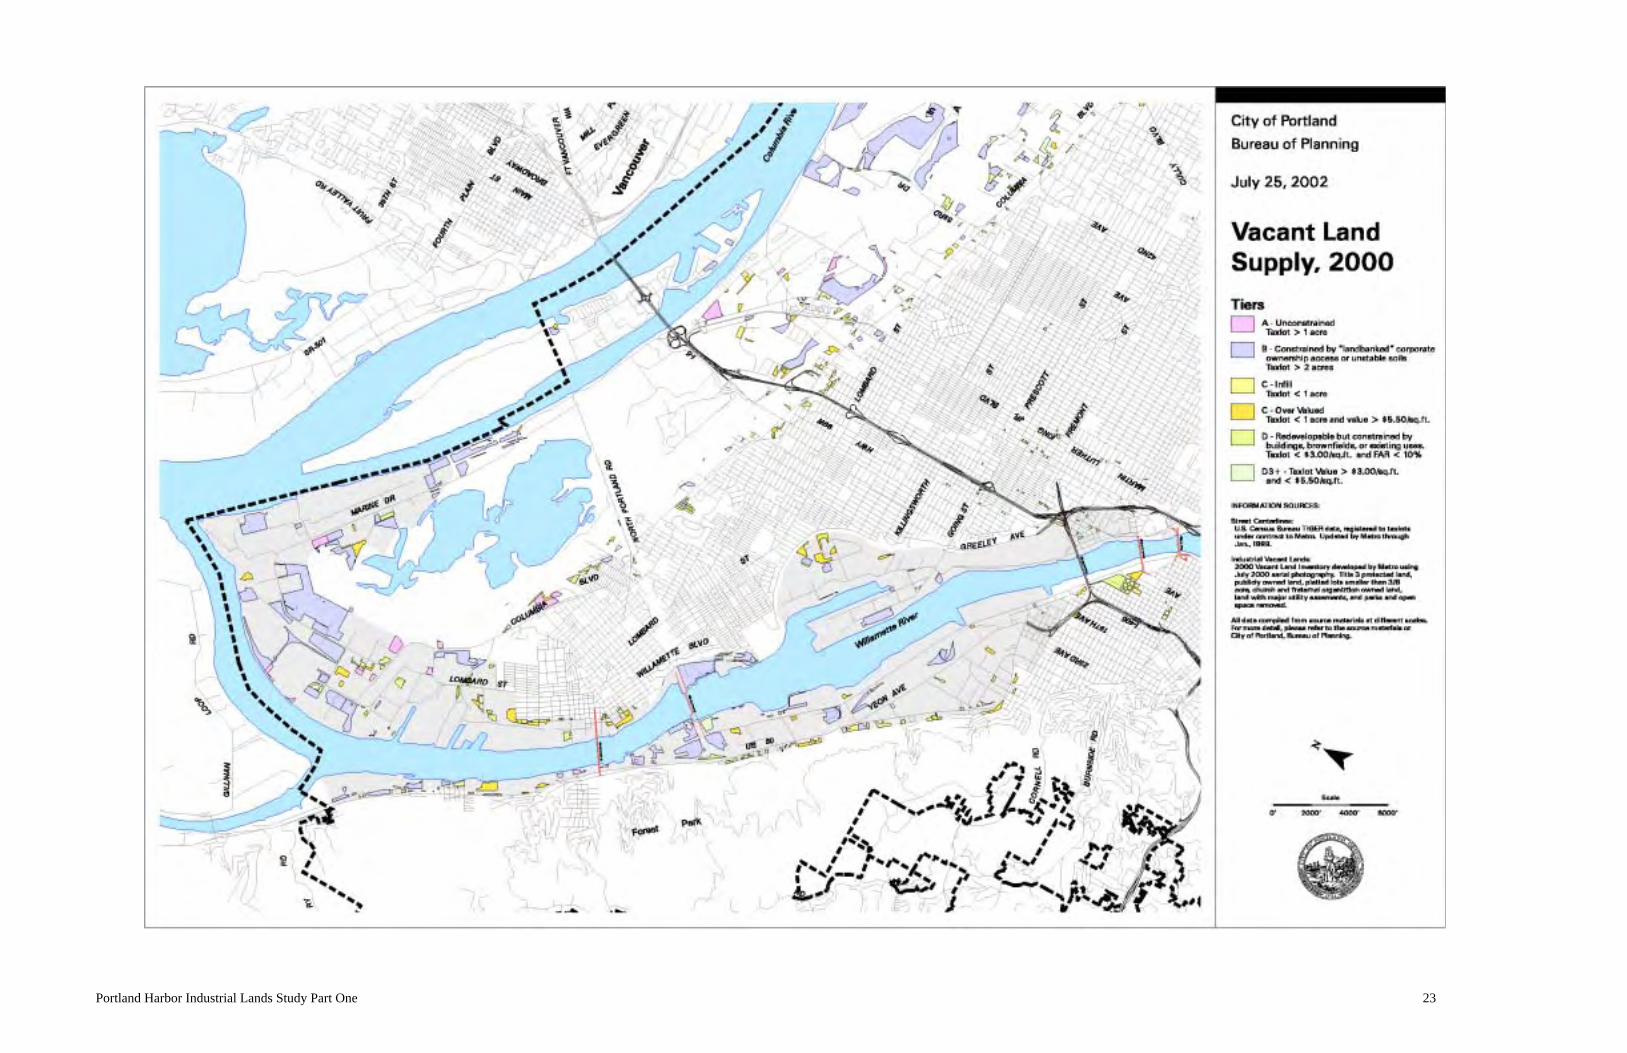
Vacant LandsTable 6 describes, and Map 6 depicts, the study area’s portion of Metro’s inventory of the vacantland supply in July 2000. Otak developed this information for Metro, as an update of theinventory presented in the Regional Industrial Lands Study (Otak, et al., 1999). The vacant landidentified is defined by particular study assumptions. Vacancy is determined by the lack of siteimprovements valued at more than $1,000 on county assessor tax records. Industrial land isdetermined by an industrial designation in the local comprehensive plan. Entire parcels, as wellas vacant portions of occupied parcels, are included. Lands with slopes exceeding 10 percent,Title 3 wetlands, and 100-year floodplains are excluded. Vacant lands are sorted into four tiersthat correspond to different types of development constraints for reuse, as explained below.
Table 6. Vacant Industrial Lands in the Study Area, 2000
Vacant Industrial Acreage
DistrictTotal
Acreage Tier A Tier BTier C,
InfillTier C,
Overvalued Tier D TotalVacancy
Rate
Linnton 279 2.1 19.6 3.1 11.0 2.7 39 13.8%Guild's Lake 1,686 1.2 97.7 23.2 14.5 13.4 150 8.9%Rivergate 1,988 26.2 323.5 2.0 17.3 12.1 381 19.2%St. Johns 1,043 3.7 66.3 11.8 24.8 7.2 114 10.9%Swan Island 744 0.0 26.1 3.0 18.2 0.1 47 6.4%Lower Albina 383 0.0 0.0 1.7 0.0 2.6 4 1.1%
Study Area 6,123 33 533 45 86 38 735 12.0%
City of Portland 18,809 229 1,338 177 162 158 2,063 11.0%
Tier A – no identified constraints; taxlots > 1 acre.Tier B – constrained by "landbanked" corporate ownership, access, unstable soils; taxlots > 2 acres.Tier C, infill - taxlots < 1 acre.Tier C, overvalued - value > $5.50 / sq. ft.; taxlots < 1 acre.Tier D – redevelopable, but constrained by buildings, brownfields, existing uses; floor area ratio < 10%.Sources: 2000 vacant land inventory developed by Metro using July 2000 aerial photography.
Over half of the vacant land identified in the study area was in the Rivergate district. In addition,the Port of Portland owns approximately 750 acres of undeveloped land on West Hayden Islandacross from Terminal 6. That property is being held in reserve for potential future marineterminal development, although it has not been annexed or zoned for industrial use.
Metro found that 735 acres of land within the study area were vacant (unimproved) inJuly 2000, which is 13.3 percent of the total land in taxlots (5,532 acres). The lessconstrained vacant sites (Tiers A& B in the Metro inventory) totaled 566 acres, 10.2percent of the land in taxlots.
Portland Harbor Industrial Lands Study Part One 21
Nearly three fourths of the vacant land identified in the study area was classified as Tier B,which is constrained by ownership (e.g., “landbanked” for future expansion), access limitations,or unstable soils. Much of that land is in Tier B because it is owned by the Port of Portland (thelargest landowner in the study area) and is available for lease only or for marine-related use only.Those parcels are not necessarily less ready for immediate development than Tier A. Vacantportions of sites that could be used for future expansion are also included in this tier, such as onthe Wacker Siltronic and NW Natural properties.
Some notable changes have occurred in the vacant land supply since 2000. The Atofina (59acres), Time Oil (approximately 20 occupied acres), and Alcatel (15 acres) sites, each locatedadjacent to the river, have been vacated.

22 Portland Harbor Industrial Lands Study Part One
Portland Harbor Industrial Lands Study Part One 23
Portland Harbor Industrial Lands Study Part One 25
2. TRENDS
A. EMPLOYMENT TRENDS
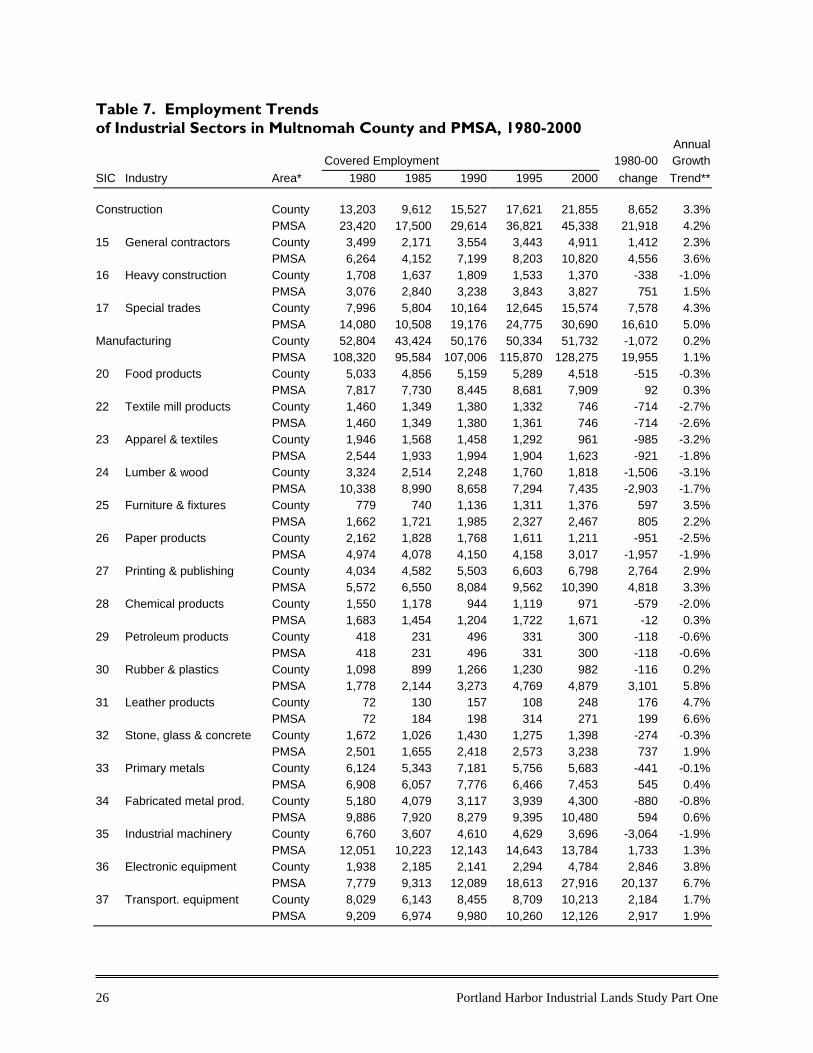
Industrial SectorsThe mix of industries and their location in the Portland metropolitan area changed markedly inthe 1980s and 1990s. These decades were also a business-cycle period, as the recession of theearly 1980s led to substantial growth through the 1990s and back into recession in 2001. Tables7 and 8 provide an overview of these changes, using employment as an indicator.
Table 7 presents employment trends in the industrial sectors (construction, manufacturing,transportation, communication and utilities, and wholesale trade) during the 1980-2000 period inMultnomah County and the PMSA (Oregon portion).6 Trend data is not shown for the studyarea specifically, because covered employment data in smaller geographic areas was lessaccurate before the early 1990s.7
Table 8 is an accompanying “shift-share” analysis, showing how the PMSA share of nationalemployment in the industrial sectors has shifted over the 1980-2000 period. Shift-share analysisis a tool used to compare the performance of an industry in one geographic area relative toanother over time. Comparing Tables 7 and 8 also shows whether each industry’s regionalgrowth or decline is part of a national trend.
Net new industrial employment of the top job-growth industries in the PMSA during the 1980-2000 period was as follows:
• electronic equipment manufacturing—20,137 new jobs in PMSA, 14 percent of thosejobs in Multnomah County;
• special trades construction—16,610 new PMSA jobs, 46 percent in Multnomah County;• nondurable wholesale trade—12,667 new PMSA jobs, 24 percent in Multnomah County;• air transportation—9,036 new PMSA jobs, 86 percent in Multnomah County; and• durable wholesale trade—5,846 new PMSA jobs, including an employment loss in
Multnomah County.
6 The average annual growth rate of each industry over the 20-year period is calculated as the slope of an exponential regressioncurve plotted with 1980, 1985, 1990, 1995, and 2000 data. This statistical tool considers incremental changes over the 20-yearperiod to estimate the rate of growth, instead of just using the starting and ending data. 7 Reporting changes were made in the 1980s and 1990s to more accurately link employment to actual workplace addresses infirms with more than one location, making 10-20 year trend analysis less reliable in smaller geographic areas within the county.
During the 1980s and 1990s, the metropolitan area’s top job-growth industries in theindustrial sectors were electronics manufacturing, the construction trades, airtransportation, and wholesale trade.
26 Portland Harbor Industrial Lands Study Part One
Table 7. Employment Trendsof Industrial Sectors in Multnomah County and PMSA, 1980-2000
AnnualCovered Employment 1980-00 Growth
SIC Industry Area* 1980 1985 1990 1995 2000 change Trend**
Construction County 13,203 9,612 15,527 17,621 21,855 8,652 3.3%PMSA 23,420 17,500 29,614 36,821 45,338 21,918 4.2%
15 General contractors County 3,499 2,171 3,554 3,443 4,911 1,412 2.3%PMSA 6,264 4,152 7,199 8,203 10,820 4,556 3.6%
16 Heavy construction County 1,708 1,637 1,809 1,533 1,370 -338 -1.0%PMSA 3,076 2,840 3,238 3,843 3,827 751 1.5%
17 Special trades County 7,996 5,804 10,164 12,645 15,574 7,578 4.3%PMSA 14,080 10,508 19,176 24,775 30,690 16,610 5.0%
Manufacturing County 52,804 43,424 50,176 50,334 51,732 -1,072 0.2%PMSA 108,320 95,584 107,006 115,870 128,275 19,955 1.1%
20 Food products County 5,033 4,856 5,159 5,289 4,518 -515 -0.3%PMSA 7,817 7,730 8,445 8,681 7,909 92 0.3%
22 Textile mill products County 1,460 1,349 1,380 1,332 746 -714 -2.7%PMSA 1,460 1,349 1,380 1,361 746 -714 -2.6%
23 Apparel & textiles County 1,946 1,568 1,458 1,292 961 -985 -3.2%PMSA 2,544 1,933 1,994 1,904 1,623 -921 -1.8%
24 Lumber & wood County 3,324 2,514 2,248 1,760 1,818 -1,506 -3.1%PMSA 10,338 8,990 8,658 7,294 7,435 -2,903 -1.7%
25 Furniture & fixtures County 779 740 1,136 1,311 1,376 597 3.5%PMSA 1,662 1,721 1,985 2,327 2,467 805 2.2%
26 Paper products County 2,162 1,828 1,768 1,611 1,211 -951 -2.5%PMSA 4,974 4,078 4,150 4,158 3,017 -1,957 -1.9%
27 Printing & publishing County 4,034 4,582 5,503 6,603 6,798 2,764 2.9%PMSA 5,572 6,550 8,084 9,562 10,390 4,818 3.3%
28 Chemical products County 1,550 1,178 944 1,119 971 -579 -2.0%PMSA 1,683 1,454 1,204 1,722 1,671 -12 0.3%
29 Petroleum products County 418 231 496 331 300 -118 -0.6%PMSA 418 231 496 331 300 -118 -0.6%
30 Rubber & plastics County 1,098 899 1,266 1,230 982 -116 0.2%PMSA 1,778 2,144 3,273 4,769 4,879 3,101 5.8%
31 Leather products County 72 130 157 108 248 176 4.7%PMSA 72 184 198 314 271 199 6.6%
32 Stone, glass & concrete County 1,672 1,026 1,430 1,275 1,398 -274 -0.3%PMSA 2,501 1,655 2,418 2,573 3,238 737 1.9%
33 Primary metals County 6,124 5,343 7,181 5,756 5,683 -441 -0.1%PMSA 6,908 6,057 7,776 6,466 7,453 545 0.4%
34 Fabricated metal prod. County 5,180 4,079 3,117 3,939 4,300 -880 -0.8%PMSA 9,886 7,920 8,279 9,395 10,480 594 0.6%
35 Industrial machinery County 6,760 3,607 4,610 4,629 3,696 -3,064 -1.9%PMSA 12,051 10,223 12,143 14,643 13,784 1,733 1.3%
36 Electronic equipment County 1,938 2,185 2,141 2,294 4,784 2,846 3.8%PMSA 7,779 9,313 12,089 18,613 27,916 20,137 6.7%
37 Transport. equipment County 8,029 6,143 8,455 8,709 10,213 2,184 1.7%PMSA 9,209 6,974 9,980 10,260 12,126 2,917 1.9%
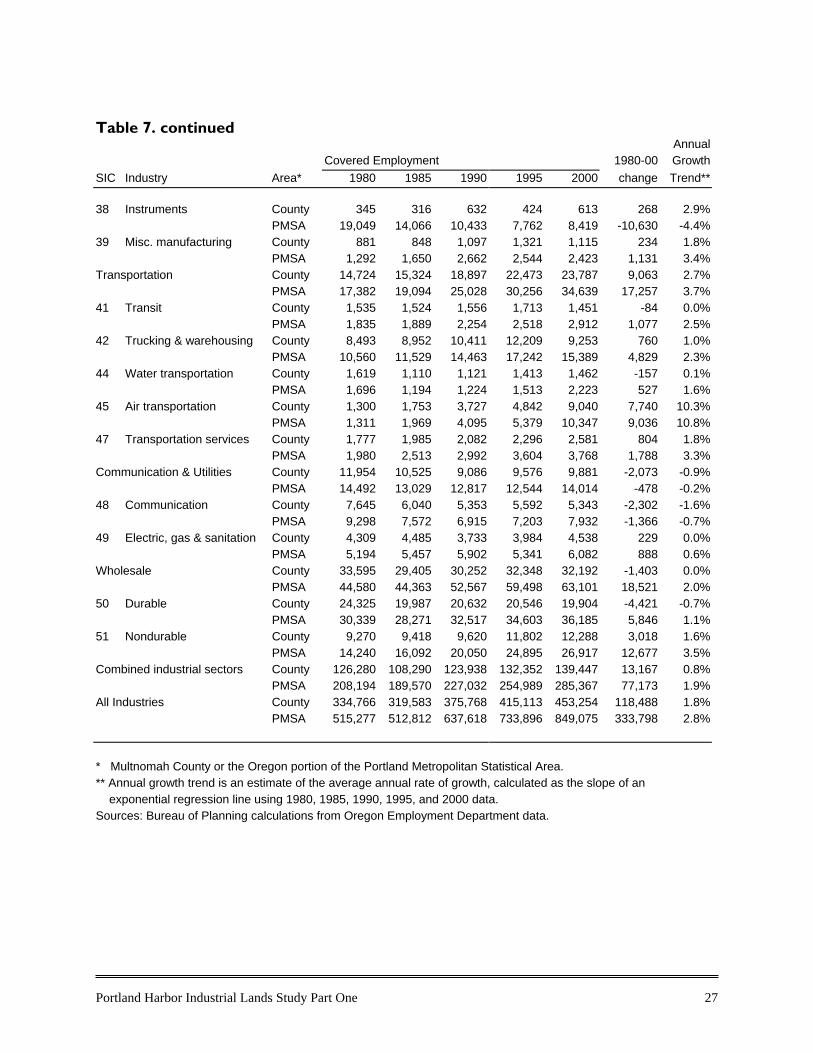
Portland Harbor Industrial Lands Study Part One 27
Table 7. continued
AnnualCovered Employment 1980-00 Growth
SIC Industry Area* 1980 1985 1990 1995 2000 change Trend**
38 Instruments County 345 316 632 424 613 268 2.9%PMSA 19,049 14,066 10,433 7,762 8,419 -10,630 -4.4%
39 Misc. manufacturing County 881 848 1,097 1,321 1,115 234 1.8%PMSA 1,292 1,650 2,662 2,544 2,423 1,131 3.4%
Transportation County 14,724 15,324 18,897 22,473 23,787 9,063 2.7%PMSA 17,382 19,094 25,028 30,256 34,639 17,257 3.7%
41 Transit County 1,535 1,524 1,556 1,713 1,451 -84 0.0%PMSA 1,835 1,889 2,254 2,518 2,912 1,077 2.5%
42 Trucking & warehousing County 8,493 8,952 10,411 12,209 9,253 760 1.0%PMSA 10,560 11,529 14,463 17,242 15,389 4,829 2.3%
44 Water transportation County 1,619 1,110 1,121 1,413 1,462 -157 0.1%PMSA 1,696 1,194 1,224 1,513 2,223 527 1.6%
45 Air transportation County 1,300 1,753 3,727 4,842 9,040 7,740 10.3%PMSA 1,311 1,969 4,095 5,379 10,347 9,036 10.8%
47 Transportation services County 1,777 1,985 2,082 2,296 2,581 804 1.8%PMSA 1,980 2,513 2,992 3,604 3,768 1,788 3.3%
Communication & Utilities County 11,954 10,525 9,086 9,576 9,881 -2,073 -0.9%PMSA 14,492 13,029 12,817 12,544 14,014 -478 -0.2%
48 Communication County 7,645 6,040 5,353 5,592 5,343 -2,302 -1.6%PMSA 9,298 7,572 6,915 7,203 7,932 -1,366 -0.7%
49 Electric, gas & sanitation County 4,309 4,485 3,733 3,984 4,538 229 0.0%PMSA 5,194 5,457 5,902 5,341 6,082 888 0.6%
Wholesale County 33,595 29,405 30,252 32,348 32,192 -1,403 0.0%PMSA 44,580 44,363 52,567 59,498 63,101 18,521 2.0%
50 Durable County 24,325 19,987 20,632 20,546 19,904 -4,421 -0.7%PMSA 30,339 28,271 32,517 34,603 36,185 5,846 1.1%
51 Nondurable County 9,270 9,418 9,620 11,802 12,288 3,018 1.6%PMSA 14,240 16,092 20,050 24,895 26,917 12,677 3.5%
Combined industrial sectors County 126,280 108,290 123,938 132,352 139,447 13,167 0.8%PMSA 208,194 189,570 227,032 254,989 285,367 77,173 1.9%
All Industries County 334,766 319,583 375,768 415,113 453,254 118,488 1.8%PMSA 515,277 512,812 637,618 733,896 849,075 333,798 2.8%
* Multnomah County or the Oregon portion of the Portland Metropolitan Statistical Area.** Annual growth trend is an estimate of the average annual rate of growth, calculated as the slope of an exponential regression line using 1980, 1985, 1990, 1995, and 2000 data.Sources: Bureau of Planning calculations from Oregon Employment Department data.
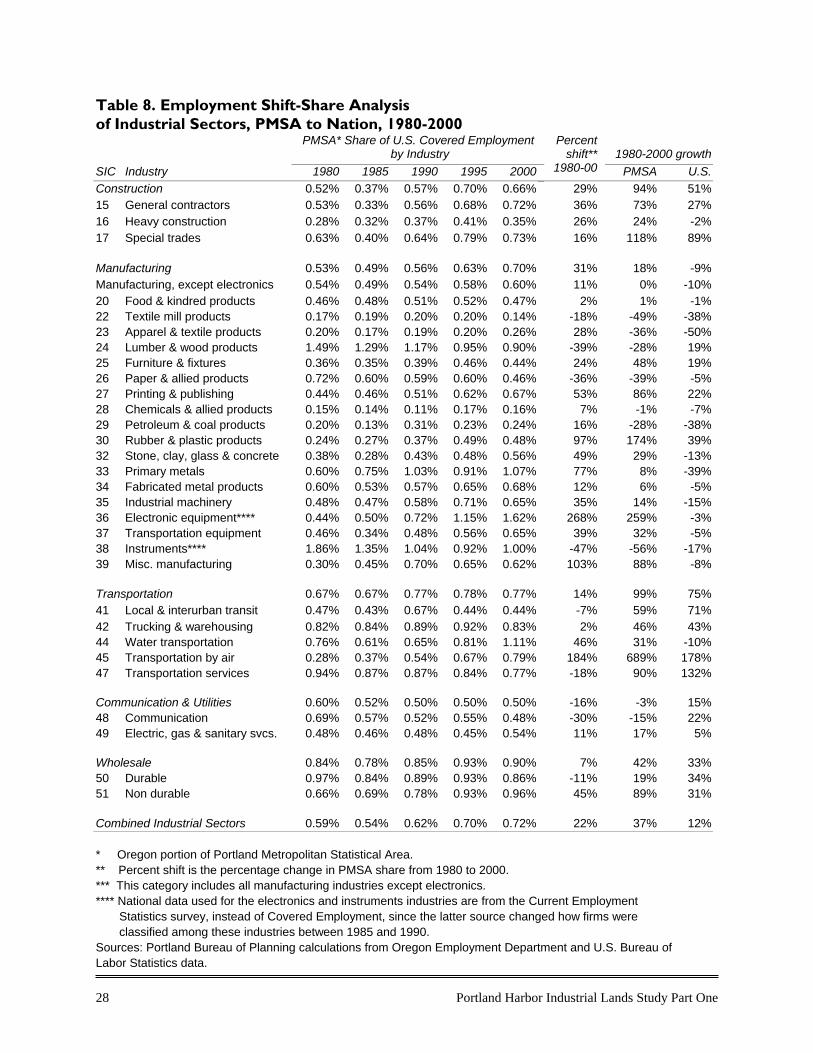
28 Portland Harbor Industrial Lands Study Part One
Table 8. Employment Shift-Share Analysisof Industrial Sectors, PMSA to Nation, 1980-2000 PMSA* Share of U.S. Covered Employment
by Industry
1980-2000 growth SIC Industry 1980 1985 1990 1995 2000
Percentshift**
1980-00 PMSA U.S. Construction 0.52% 0.37% 0.57% 0.70% 0.66% 29% 94% 51% 15 General contractors 0.53% 0.33% 0.56% 0.68% 0.72% 36% 73% 27% 16 Heavy construction 0.28% 0.32% 0.37% 0.41% 0.35% 26% 24% -2% 17 Special trades 0.63% 0.40% 0.64% 0.79% 0.73% 16% 118% 89% Manufacturing 0.53% 0.49% 0.56% 0.63% 0.70% 31% 18% -9% Manufacturing, except electronics 0.54% 0.49% 0.54% 0.58% 0.60% 11% 0% -10% 20 Food & kindred products 0.46% 0.48% 0.51% 0.52% 0.47% 2% 1% -1% 22 Textile mill products 0.17% 0.19% 0.20% 0.20% 0.14% -18% -49% -38% 23 Apparel & textile products 0.20% 0.17% 0.19% 0.20% 0.26% 28% -36% -50% 24 Lumber & wood products 1.49% 1.29% 1.17% 0.95% 0.90% -39% -28% 19% 25 Furniture & fixtures 0.36% 0.35% 0.39% 0.46% 0.44% 24% 48% 19% 26 Paper & allied products 0.72% 0.60% 0.59% 0.60% 0.46% -36% -39% -5% 27 Printing & publishing 0.44% 0.46% 0.51% 0.62% 0.67% 53% 86% 22% 28 Chemicals & allied products 0.15% 0.14% 0.11% 0.17% 0.16% 7% -1% -7% 29 Petroleum & coal products 0.20% 0.13% 0.31% 0.23% 0.24% 16% -28% -38% 30 Rubber & plastic products 0.24% 0.27% 0.37% 0.49% 0.48% 97% 174% 39% 32 Stone, clay, glass & concrete 0.38% 0.28% 0.43% 0.48% 0.56% 49% 29% -13% 33 Primary metals 0.60% 0.75% 1.03% 0.91% 1.07% 77% 8% -39% 34 Fabricated metal products 0.60% 0.53% 0.57% 0.65% 0.68% 12% 6% -5% 35 Industrial machinery 0.48% 0.47% 0.58% 0.71% 0.65% 35% 14% -15% 36 Electronic equipment**** 0.44% 0.50% 0.72% 1.15% 1.62% 268% 259% -3% 37 Transportation equipment 0.46% 0.34% 0.48% 0.56% 0.65% 39% 32% -5% 38 Instruments**** 1.86% 1.35% 1.04% 0.92% 1.00% -47% -56% -17% 39 Misc. manufacturing 0.30% 0.45% 0.70% 0.65% 0.62% 103% 88% -8% Transportation 0.67% 0.67% 0.77% 0.78% 0.77% 14% 99% 75% 41 Local & interurban transit 0.47% 0.43% 0.67% 0.44% 0.44% -7% 59% 71% 42 Trucking & warehousing 0.82% 0.84% 0.89% 0.92% 0.83% 2% 46% 43% 44 Water transportation 0.76% 0.61% 0.65% 0.81% 1.11% 46% 31% -10% 45 Transportation by air 0.28% 0.37% 0.54% 0.67% 0.79% 184% 689% 178% 47 Transportation services 0.94% 0.87% 0.87% 0.84% 0.77% -18% 90% 132% Communication & Utilities 0.60% 0.52% 0.50% 0.50% 0.50% -16% -3% 15% 48 Communication 0.69% 0.57% 0.52% 0.55% 0.48% -30% -15% 22% 49 Electric, gas & sanitary svcs. 0.48% 0.46% 0.48% 0.45% 0.54% 11% 17% 5% Wholesale 0.84% 0.78% 0.85% 0.93% 0.90% 7% 42% 33% 50 Durable 0.97% 0.84% 0.89% 0.93% 0.86% -11% 19% 34% 51 Non durable 0.66% 0.69% 0.78% 0.93% 0.96% 45% 89% 31% Combined Industrial Sectors 0.59% 0.54% 0.62% 0.70% 0.72% 22% 37% 12% * Oregon portion of Portland Metropolitan Statistical Area. ** Percent shift is the percentage change in PMSA share from 1980 to 2000. *** This category includes all manufacturing industries except electronics. **** National data used for the electronics and instruments industries are from the Current Employment Statistics survey, instead of Covered Employment, since the latter source changed how firms were classified among these industries between 1985 and 1990. Sources: Portland Bureau of Planning calculations from Oregon Employment Department and U.S. Bureau of Labor Statistics data.
Portland Harbor Industrial Lands Study Part One 29
Growth in the electronics manufacturing industry reflects an expanding Portland metropolitanarea share of national employment from 0.37 percent in 1980 to 1.46 percent in 2000, as shownin Table 8. Thus, the Portland area is one of the focal points of national growth in this industry.Similarly, the PMSA share of air transportation employment increased from 0.28 to 0.79 percent;nondurable goods wholesale trade from 0.66 to 0.96 percent; and special trades constructionfrom 0.63 to 0.73 percent. In contrast, the PMSA’s 7,210 new jobs in wholesale trade of durablegoods did not keep up with the industry’s national growth, and the PMSA employment share fellfrom 0.97 to 0.86 percent.
The metropolitan area added 77,200 net new industrial jobs between 1980 and 2000. Of thosenew jobs, 46 percent were in the distribution sectors of transportation and wholesale trade, 26percent in manufacturing, and 28 percent in construction. During that 20-year period, thePortland metropolitan area share of national employment grew by 22 percent.
Only 17 percent of the industrial employment added in the region between 1980 and 2000occurred in Multnomah County. One likely reason for Multnomah County’s loss of employmentshare is its relative availability of vacant industrial land, since Multnomah County is generallymore built out than its suburban neighbors. A second reason is Multnomah County’s particularmix of expanding and contracting industries relative to the region, as shown in Table 7. Forexample, the fast growing electronics manufacturing industry is concentrated in WashingtonCounty, while most of the slower growing and declining industries in the industrial sectors areconcentrated in Multnomah County. A third reason is that some industries experiencedsubstantial employment cutbacks in Multnomah County and growth elsewhere in the region,including durable goods wholesale, communication, industrial machinery, and fabricated metalproducts. Electronics has been the metropolitan area’s driving growth industry in the manufacturing sector,adding 20,137 net new jobs between 1980 and 2000, compared with 19,955 net new jobs for theentire manufacturing sector. Combined employment in the region’s other manufacturingindustries declined slightly, less than 1 percent, but it declined 10 percent nationally. Excludingelectronics, the PMSA’s share of the national manufacturing employment increased by 11percent during these decades. Thus, regional manufacturers were significantly outperformingtheir national counterparts in job creation. The printing and publishing, rubber and plastics, and
Multnomah County is the metropolitan area’s primary industrial location, but its shareof the PMSA’s employment in the industrial sectors reduced from 59 percent in 1980 to48 percent in 2000.
While manufacturing employment in the U.S. declined by 9 percent between 1980 and2000, it increased by 18 percent in the Portland metropolitan area. The metro areashare of national manufacturing employment grew by 31 percent during those decades.
Industrial employment in the Portland metropolitan area grew by 37 percent between1980 and 2000, compared to 12 percent growth nationwide.
30 Portland Harbor Industrial Lands Study Part One
transportation equipment industries each added more than 2,000 jobs in the PMSA over the1980-2000 period, while substantial employment reductions occurred in lumber, paper, apparel,textiles, and instruments manufacturing. The decline in the apparel and textiles manufacturingreflects a national trend, while that in the lumber, paper, and instruments industries reflects adeclining PMSA share of national employment.
Air transportation was by far the largest source of industrial job growth in Multnomah County.The air transportation industry is concentrated near the Portland International Airport, althoughair courier employment also substantially expanded in the harbor area. Water transportationemployment experienced modest growth in the PMSA but essentially none in MultnomahCounty. This industry’s employment nationally was declining, so local water transportationfirms were outperforming their national counterparts. Multnomah County is clearly the center ofthe PMSA’s transportation employment, although its share reduced from 85 percent in 1980 to69 percent in 2000, due primarily to suburban growth in trucking and warehousing employment.
In contrast, over 20,000 new wholesale jobs were added in the PMSA with substantial growth inboth durable and nondurable goods. Multnomah County’s share of PMSA employment indurable goods wholesale dropped from 80 percent in 1980 to 55 percent in 2000; nondurablegoods wholesale, from 65 to 46 percent.
Population in the Portland area is growing faster than nationally, and the PMSA share of nationalconstruction employment increased from 0.52 to 0.66 percent over the 1980-2000 period. Threeout of four new construction jobs in the PMSA were in special trades construction, whichexpanded at a rapid average annual rate of 5.0 percent. In contrast, heavy constructionemployment expanded at an average annual rate of 1.5 percent in the PMSA and declined inMultnomah County.
Maritime EmploymentTo provide a more detailed look at maritime-related employment, Table 9 shows nationalemployment trends since 1980 in selected industry segments at the 4-digit SIC level that includemaritime-related uses. These industry segments were chosen to include most of the river-dependent uses on Portland Harbor. Historical trend data is not published for the PMSA at the 4-digit SIC level, but national data is useful for trend analysis at this level of detail.
In the transportation sector, the leading employment generator has been the airtransportation industry, growing in Multnomah County from 1,300 jobs in 1980 to9,040 in 2000.
The wholesale of durable goods industry in Multnomah County had a downsizingperiod in the early 1980s, losing over 4,000 jobs, and then stabilized but did notsubstantially rebound afterward.
The construction sector added 21,918 jobs in the PMSA between 1980 and 2000,including 8,652 jobs in Multnomah County.
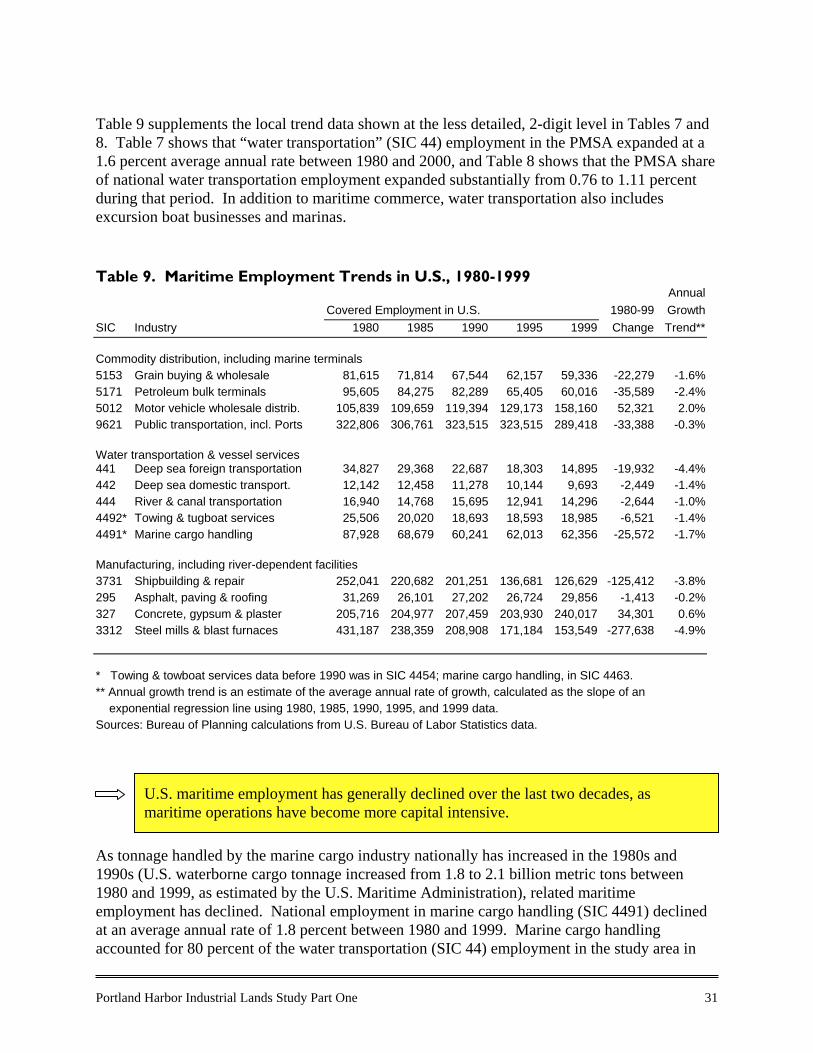
Portland Harbor Industrial Lands Study Part One 31
Table 9 supplements the local trend data shown at the less detailed, 2-digit level in Tables 7 and8. Table 7 shows that “water transportation” (SIC 44) employment in the PMSA expanded at a1.6 percent average annual rate between 1980 and 2000, and Table 8 shows that the PMSA shareof national water transportation employment expanded substantially from 0.76 to 1.11 percentduring that period. In addition to maritime commerce, water transportation also includesexcursion boat businesses and marinas.
Table 9. Maritime Employment Trends in U.S., 1980-1999Annual
Covered Employment in U.S. 1980-99 GrowthSIC Industry 1980 1985 1990 1995 1999 Change Trend**
Commodity distribution, including marine terminals5153 Grain buying & wholesale 81,615 71,814 67,544 62,157 59,336 -22,279 -1.6%5171 Petroleum bulk terminals 95,605 84,275 82,289 65,405 60,016 -35,589 -2.4%5012 Motor vehicle wholesale distrib. 105,839 109,659 119,394 129,173 158,160 52,321 2.0%9621 Public transportation, incl. Ports 322,806 306,761 323,515 323,515 289,418 -33,388 -0.3%
Water transportation & vessel services441 Deep sea foreign transportation 34,827 29,368 22,687 18,303 14,895 -19,932 -4.4%442 Deep sea domestic transport. 12,142 12,458 11,278 10,144 9,693 -2,449 -1.4%444 River & canal transportation 16,940 14,768 15,695 12,941 14,296 -2,644 -1.0%4492* Towing & tugboat services 25,506 20,020 18,693 18,593 18,985 -6,521 -1.4%4491* Marine cargo handling 87,928 68,679 60,241 62,013 62,356 -25,572 -1.7%
Manufacturing, including river-dependent facilities3731 Shipbuilding & repair 252,041 220,682 201,251 136,681 126,629 -125,412 -3.8%295 Asphalt, paving & roofing 31,269 26,101 27,202 26,724 29,856 -1,413 -0.2%327 Concrete, gypsum & plaster 205,716 204,977 207,459 203,930 240,017 34,301 0.6%3312 Steel mills & blast furnaces 431,187 238,359 208,908 171,184 153,549 -277,638 -4.9%
* Towing & towboat services data before 1990 was in SIC 4454; marine cargo handling, in SIC 4463.** Annual growth trend is an estimate of the average annual rate of growth, calculated as the slope of an exponential regression line using 1980, 1985, 1990, 1995, and 1999 data.Sources: Bureau of Planning calculations from U.S. Bureau of Labor Statistics data.
As tonnage handled by the marine cargo industry nationally has increased in the 1980s and1990s (U.S. waterborne cargo tonnage increased from 1.8 to 2.1 billion metric tons between1980 and 1999, as estimated by the U.S. Maritime Administration), related maritimeemployment has declined. National employment in marine cargo handling (SIC 4491) declinedat an average annual rate of 1.8 percent between 1980 and 1999. Marine cargo handlingaccounted for 80 percent of the water transportation (SIC 44) employment in the study area in
U.S. maritime employment has generally declined over the last two decades, asmaritime operations have become more capital intensive.
32 Portland Harbor Industrial Lands Study Part One
2000. The shipbuilding and repair industry (another large employer in the study area) eliminatedapproximately half of its U.S. employment between 1980 and 1999.
Employment ForecastsIn March 2002, Metro completed an employment forecast for the Portland-VancouverMetropolitan Area by industry to the year 2030. The industrial employment projections of thatforecast are shown in Table 10. Metro conducted the forecast to inform upcoming decisions onexpansion of the urban growth boundary. The forecast is based on assumptions of national andglobal conditions prepared by DRI-WEFA, a national forecasting firm.
Both Metro and the Oregon Office of Economic Analysis8 foresee employment growth over thenext five years in most manufacturing and distribution industries. Industrial job growth in thePortland-Vancouver area is predicted to substantially outpace the national average. Wholesaletrade, transportation, and electronics manufacturing are predicted to be the primary job-growthindustries of the region’s industrial sectors, in similar fashion to the trends of recent decades.
Three out of four new manufacturing jobs between 2000 and 2030 are expected to be created inthe electronics and instruments industries (the forecast combines these two industries).Continued employment reductions are projected in the food products, textiles and apparel,lumber, and paper industries.
Based on the Metro forecast and the current mix of harbor area industries, transportation andwholesale trade are likely to be the leading job-growth sectors in the harbor area. The long-termforecast for the metals and equipment industries is mixed but stable overall: anticipatedemployment gains in industrial machinery manufacturing exceed the modest reductions expectedin transportation equipment and metals. The harbor area could also share in the projectedregional growth of other manufacturing industries, including electronics, printing and publishing,and the grouped categories of “other durable goods” (e.g., furniture and fixtures, concreteproducts) and “other nondurable goods” (e.g., rubber and plastics, chemicals, and petroleumproducts).
8 The Oregon Office of Economic Analysis (Department of Administrative Services) also prepares employment forecasts byindustry. Their five-year statewide forecasts are used for state budget analysis. The projections of their March 2002 forecast arecomparable to those of the Metro forecast in Table 9.
The region’s shifting mix of manufacturing industries is projected to continue.
Extrapolating from the Metro forecast, overall industrial employment can be expectedto increase moderately in the harbor area over the next 30 years.
Metro (2001) predicts a 0.8 percent average annual growth in regional manufacturingemployment from 2000 to 2030, 1.5 percent in transportation and utilities, and 1.6percent in wholesale trade.
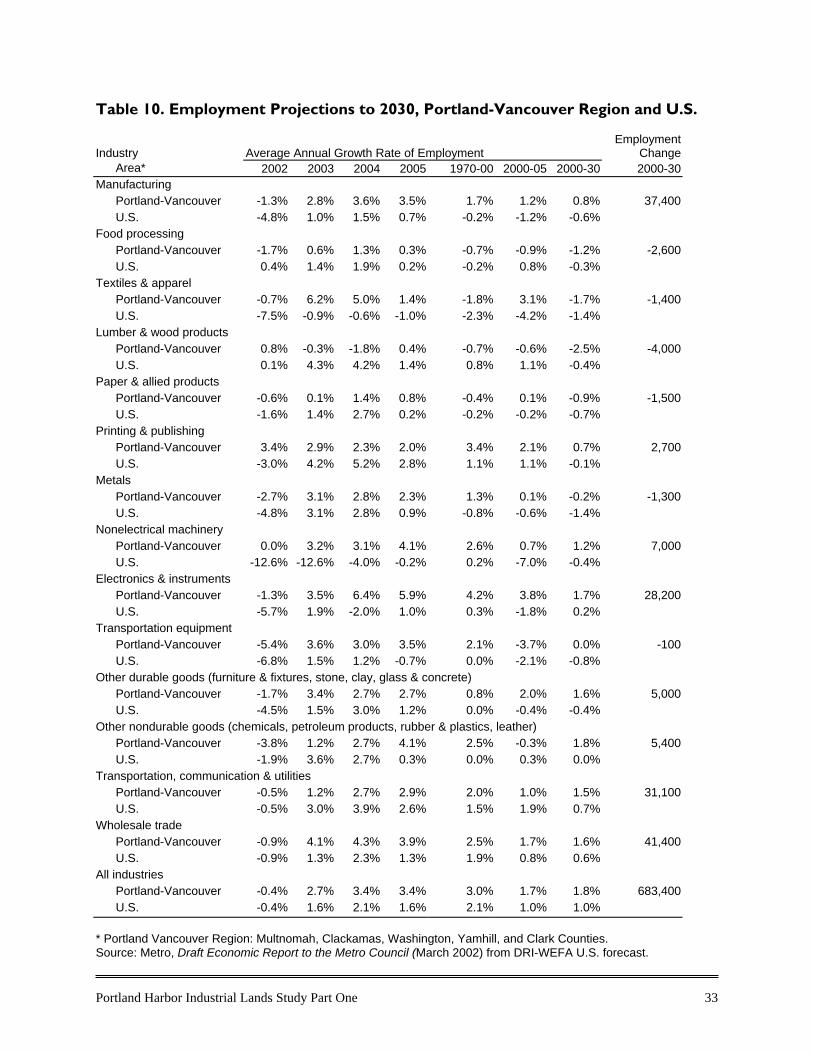
Portland Harbor Industrial Lands Study Part One 33
Table 10. Employment Projections to 2030, Portland-Vancouver Region and U.S.
Industry Average Annual Growth Rate of EmploymentEmployment
ChangeArea* 2002 2003 2004 2005 1970-00 2000-05 2000-30 2000-30
ManufacturingPortland-Vancouver -1.3% 2.8% 3.6% 3.5% 1.7% 1.2% 0.8% 37,400U.S. -4.8% 1.0% 1.5% 0.7% -0.2% -1.2% -0.6%
Food processingPortland-Vancouver -1.7% 0.6% 1.3% 0.3% -0.7% -0.9% -1.2% -2,600U.S. 0.4% 1.4% 1.9% 0.2% -0.2% 0.8% -0.3%
Textiles & apparelPortland-Vancouver -0.7% 6.2% 5.0% 1.4% -1.8% 3.1% -1.7% -1,400U.S. -7.5% -0.9% -0.6% -1.0% -2.3% -4.2% -1.4%
Lumber & wood productsPortland-Vancouver 0.8% -0.3% -1.8% 0.4% -0.7% -0.6% -2.5% -4,000U.S. 0.1% 4.3% 4.2% 1.4% 0.8% 1.1% -0.4%
Paper & allied productsPortland-Vancouver -0.6% 0.1% 1.4% 0.8% -0.4% 0.1% -0.9% -1,500U.S. -1.6% 1.4% 2.7% 0.2% -0.2% -0.2% -0.7%
Printing & publishingPortland-Vancouver 3.4% 2.9% 2.3% 2.0% 3.4% 2.1% 0.7% 2,700U.S. -3.0% 4.2% 5.2% 2.8% 1.1% 1.1% -0.1%
MetalsPortland-Vancouver -2.7% 3.1% 2.8% 2.3% 1.3% 0.1% -0.2% -1,300U.S. -4.8% 3.1% 2.8% 0.9% -0.8% -0.6% -1.4%
Nonelectrical machineryPortland-Vancouver 0.0% 3.2% 3.1% 4.1% 2.6% 0.7% 1.2% 7,000U.S. -12.6% -12.6% -4.0% -0.2% 0.2% -7.0% -0.4%
Electronics & instrumentsPortland-Vancouver -1.3% 3.5% 6.4% 5.9% 4.2% 3.8% 1.7% 28,200U.S. -5.7% 1.9% -2.0% 1.0% 0.3% -1.8% 0.2%
Transportation equipmentPortland-Vancouver -5.4% 3.6% 3.0% 3.5% 2.1% -3.7% 0.0% -100U.S. -6.8% 1.5% 1.2% -0.7% 0.0% -2.1% -0.8%
Other durable goods (furniture & fixtures, stone, clay, glass & concrete)Portland-Vancouver -1.7% 3.4% 2.7% 2.7% 0.8% 2.0% 1.6% 5,000U.S. -4.5% 1.5% 3.0% 1.2% 0.0% -0.4% -0.4%
Other nondurable goods (chemicals, petroleum products, rubber & plastics, leather)Portland-Vancouver -3.8% 1.2% 2.7% 4.1% 2.5% -0.3% 1.8% 5,400U.S. -1.9% 3.6% 2.7% 0.3% 0.0% 0.3% 0.0%
Transportation, communication & utilitiesPortland-Vancouver -0.5% 1.2% 2.7% 2.9% 2.0% 1.0% 1.5% 31,100U.S. -0.5% 3.0% 3.9% 2.6% 1.5% 1.9% 0.7%
Wholesale tradePortland-Vancouver -0.9% 4.1% 4.3% 3.9% 2.5% 1.7% 1.6% 41,400U.S. -0.9% 1.3% 2.3% 1.3% 1.9% 0.8% 0.6%
All industriesPortland-Vancouver -0.4% 2.7% 3.4% 3.4% 3.0% 1.7% 1.8% 683,400U.S. -0.4% 1.6% 2.1% 1.6% 2.1% 1.0% 1.0%
* Portland Vancouver Region: Multnomah, Clackamas, Washington, Yamhill, and Clark Counties.Source: Metro, Draft Economic Report to the Metro Council (March 2002) from DRI-WEFA U.S. forecast.
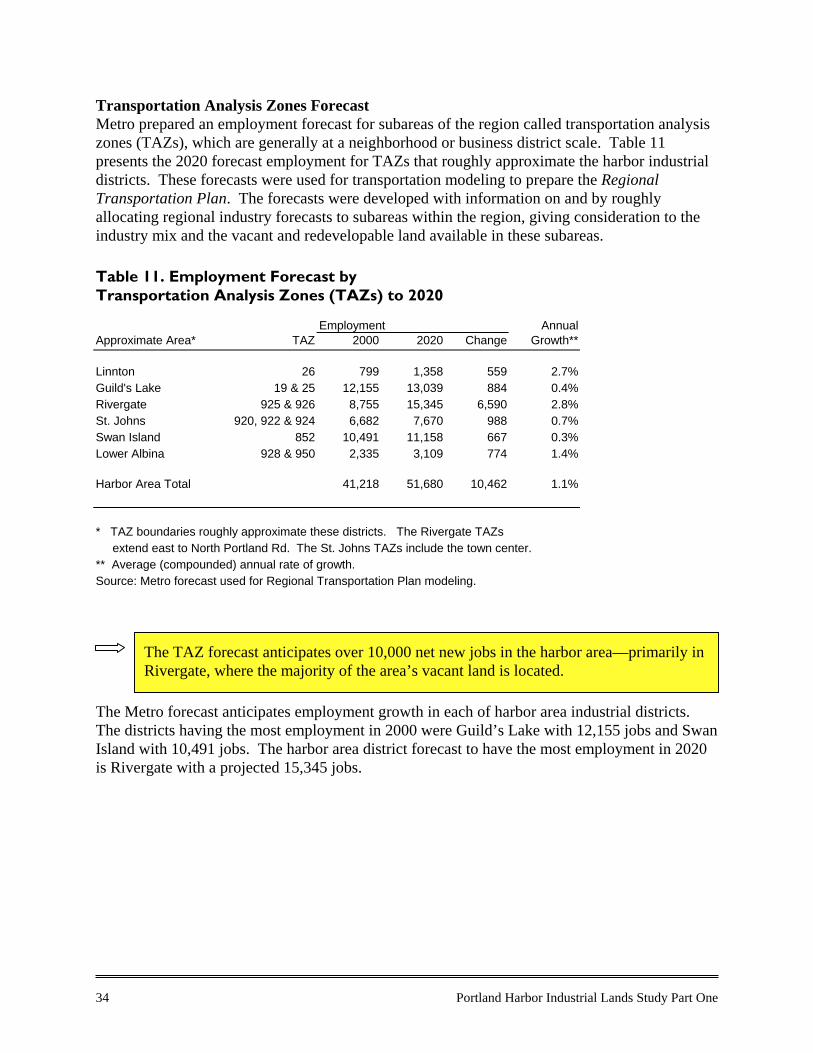
34 Portland Harbor Industrial Lands Study Part One
Transportation Analysis Zones ForecastMetro prepared an employment forecast for subareas of the region called transportation analysiszones (TAZs), which are generally at a neighborhood or business district scale. Table 11presents the 2020 forecast employment for TAZs that roughly approximate the harbor industrialdistricts. These forecasts were used for transportation modeling to prepare the RegionalTransportation Plan. The forecasts were developed with information on and by roughlyallocating regional industry forecasts to subareas within the region, giving consideration to theindustry mix and the vacant and redevelopable land available in these subareas.
Table 11. Employment Forecast byTransportation Analysis Zones (TAZs) to 2020
Employment AnnualApproximate Area* TAZ 2000 2020 Change Growth**
Linnton 26 799 1,358 559 2.7%Guild's Lake 19 & 25 12,155 13,039 884 0.4%Rivergate 925 & 926 8,755 15,345 6,590 2.8%St. Johns 920, 922 & 924 6,682 7,670 988 0.7%Swan Island 852 10,491 11,158 667 0.3%Lower Albina 928 & 950 2,335 3,109 774 1.4%
Harbor Area Total 41,218 51,680 10,462 1.1%
* TAZ boundaries roughly approximate these districts. The Rivergate TAZs extend east to North Portland Rd. The St. Johns TAZs include the town center.** Average (compounded) annual rate of growth.Source: Metro forecast used for Regional Transportation Plan modeling.
The Metro forecast anticipates employment growth in each of harbor area industrial districts.The districts having the most employment in 2000 were Guild’s Lake with 12,155 jobs and SwanIsland with 10,491 jobs. The harbor area district forecast to have the most employment in 2020is Rivergate with a projected 15,345 jobs.
The TAZ forecast anticipates over 10,000 net new jobs in the harbor area—primarily inRivergate, where the majority of the area’s vacant land is located.
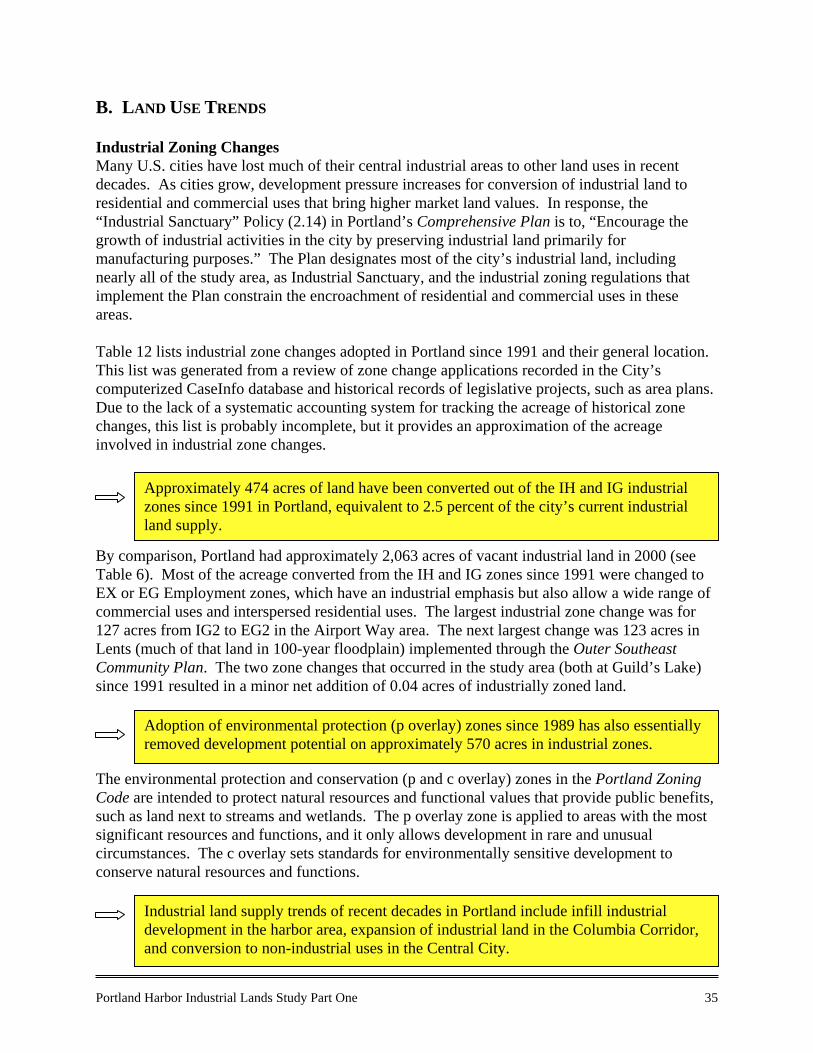
Portland Harbor Industrial Lands Study Part One 35
B. LAND USE TRENDS
Industrial Zoning ChangesMany U.S. cities have lost much of their central industrial areas to other land uses in recentdecades. As cities grow, development pressure increases for conversion of industrial land toresidential and commercial uses that bring higher market land values. In response, the“Industrial Sanctuary” Policy (2.14) in Portland’s Comprehensive Plan is to, “Encourage thegrowth of industrial activities in the city by preserving industrial land primarily formanufacturing purposes.” The Plan designates most of the city’s industrial land, includingnearly all of the study area, as Industrial Sanctuary, and the industrial zoning regulations thatimplement the Plan constrain the encroachment of residential and commercial uses in theseareas.
Table 12 lists industrial zone changes adopted in Portland since 1991 and their general location.This list was generated from a review of zone change applications recorded in the City’scomputerized CaseInfo database and historical records of legislative projects, such as area plans.Due to the lack of a systematic accounting system for tracking the acreage of historical zonechanges, this list is probably incomplete, but it provides an approximation of the acreageinvolved in industrial zone changes.
By comparison, Portland had approximately 2,063 acres of vacant industrial land in 2000 (seeTable 6). Most of the acreage converted from the IH and IG zones since 1991 were changed toEX or EG Employment zones, which have an industrial emphasis but also allow a wide range ofcommercial uses and interspersed residential uses. The largest industrial zone change was for127 acres from IG2 to EG2 in the Airport Way area. The next largest change was 123 acres inLents (much of that land in 100-year floodplain) implemented through the Outer SoutheastCommunity Plan. The two zone changes that occurred in the study area (both at Guild’s Lake)since 1991 resulted in a minor net addition of 0.04 acres of industrially zoned land.
The environmental protection and conservation (p and c overlay) zones in the Portland ZoningCode are intended to protect natural resources and functional values that provide public benefits,such as land next to streams and wetlands. The p overlay zone is applied to areas with the mostsignificant resources and functions, and it only allows development in rare and unusualcircumstances. The c overlay sets standards for environmentally sensitive development toconserve natural resources and functions.
Approximately 474 acres of land have been converted out of the IH and IG industrialzones since 1991 in Portland, equivalent to 2.5 percent of the city’s current industrialland supply.
Industrial land supply trends of recent decades in Portland include infill industrialdevelopment in the harbor area, expansion of industrial land in the Columbia Corridor,and conversion to non-industrial uses in the Central City.
Adoption of environmental protection (p overlay) zones since 1989 has also essentiallyremoved development potential on approximately 570 acres in industrial zones.
36 Portland Harbor Industrial Lands Study Part One
Table 12. Industrial Zone Changes in Portland, 1991-2001
Date
LUR Case/LegislativeProject Location Change
IG or IHacreageaffected Notes
Land Use Review Cases5/91 91-00106 Guild's Lake IH to IG1 06/91 91-00334 Lower Albina IG1 not changed 0 Mapping error correction6/91 91-00335 Northwest IG1 to CS -0.25 Mapping error correction9/91 91-00476 NE 181st/Airport Way IG2 to EG2 -127.35 Change to Comprehensive Plan
designation3/92 92-00027 Central Eastside IG1 to EX -0.67 Change to Comprehensive Plan
designation6/92 92-00342 Hayden Island RF to IG2 0.85 Mapping error correction10/92 92-00603 Guild's Lake OS to IH 1.510/93 93-00547 Guild's Lake OS to IH 1.46 Mapping error correction12/93 93-00721 Northwest IG1 not changed 05/95 94-00896 Central Eastside IG1 to EG2 -13.24 Change to Comprehensive Plan
designation5/95 95-00153 Central Eastside IG1 to EX -0.59 Change to Comprehensive Plan
designation8/96 96-00502 Central Eastside EX to IG1 0.07 Mapping error correction7/97 97-00131 Central Eastside IG1 to EX -0.36 Change to Comprehensive Plan
designation9/97 97-00158 Northwest IG1 to EX -7.022/99 98-00903 Central Eastside IG1 to EX -0.83 Change to Comprehensive Plan
designation1/00 99-00486 Hayden Island R2 to IG2 1.68Open 00-00672 Sullivans Gulch IG1, IH, CG to EX Approximately 5 acres may be affected.1/02 01-00617 Central Eastside IG1 to OS & EX -43.93 I-5 and Eastbank Esplanade right-of-way
-189
Legislative Projects*8/93 Albina Community Plan -451/96 Outer Southeast Community Plan 123 ac. changed from IH and IG in Lents; 54
ac. from IG in Hazelwood
4/98 Sellwood-Moreland Neighborhood Plan -15 14 ac. to EX or EG28/01 Northwest Transition Zoning Project -42 Changes to support new streetcar line and
limit telecommunication facilities
-300
Net acreage of industrial zone changes, 1991 to present: -489Existing acreage in industrial zones (May 14, 2002) 18,809Percentage loss of industrial land, 1991-2001: -2.5%
* Acreage is approximate. Source: Bureau of Planning from CaseInfo database and historical records.
Examples of development and rezoning actions in the harbor area prior to 1991:
• development of the Rivergate Industrial District and expansion of development in the SwanIsland/Mocks Bottom area by the Port of Portland;
• annexation and IH Heavy Industrial zoning in various portions of Rivergate;• EX Employment zoning along the west bank between the Broadway and Fremont Bridges;
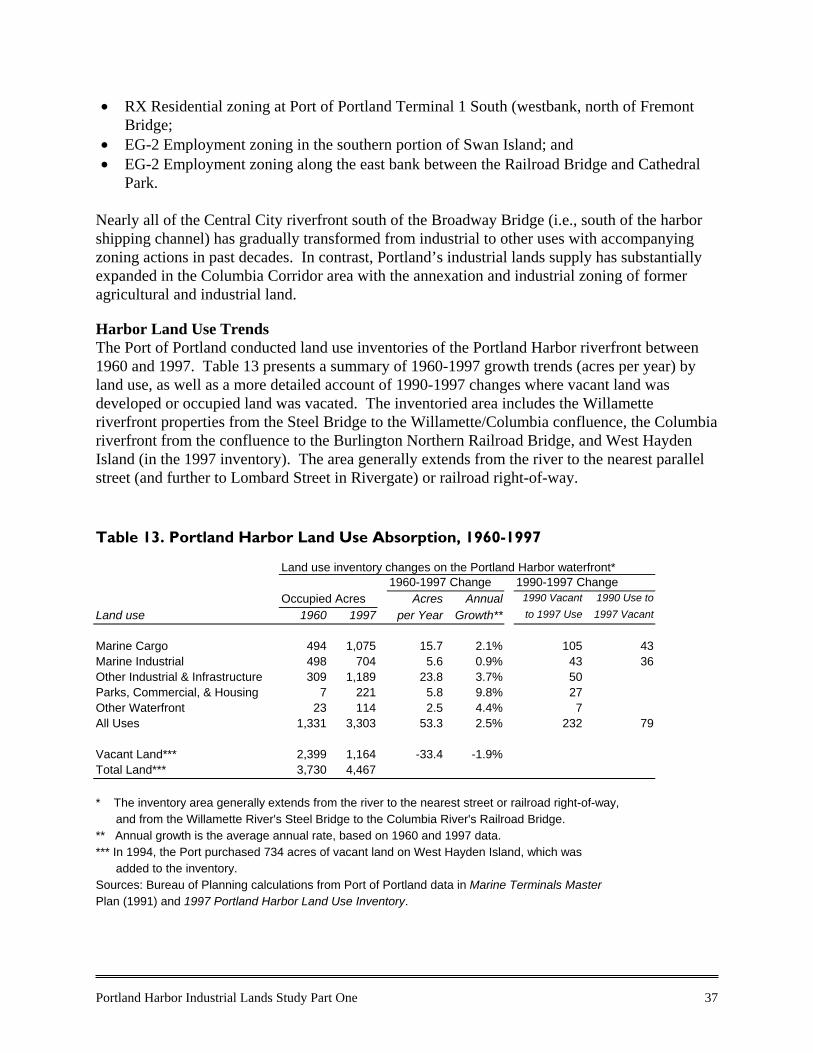
Portland Harbor Industrial Lands Study Part One 37
• RX Residential zoning at Port of Portland Terminal 1 South (westbank, north of FremontBridge;
• EG-2 Employment zoning in the southern portion of Swan Island; and• EG-2 Employment zoning along the east bank between the Railroad Bridge and Cathedral
Park.
Nearly all of the Central City riverfront south of the Broadway Bridge (i.e., south of the harborshipping channel) has gradually transformed from industrial to other uses with accompanyingzoning actions in past decades. In contrast, Portland’s industrial lands supply has substantiallyexpanded in the Columbia Corridor area with the annexation and industrial zoning of formeragricultural and industrial land.
Harbor Land Use TrendsThe Port of Portland conducted land use inventories of the Portland Harbor riverfront between1960 and 1997. Table 13 presents a summary of 1960-1997 growth trends (acres per year) byland use, as well as a more detailed account of 1990-1997 changes where vacant land wasdeveloped or occupied land was vacated. The inventoried area includes the Willametteriverfront properties from the Steel Bridge to the Willamette/Columbia confluence, the Columbiariverfront from the confluence to the Burlington Northern Railroad Bridge, and West HaydenIsland (in the 1997 inventory). The area generally extends from the river to the nearest parallelstreet (and further to Lombard Street in Rivergate) or railroad right-of-way.
Table 13. Portland Harbor Land Use Absorption, 1960-1997
Land use inventory changes on the Portland Harbor waterfront*1960-1997 Change 1990-1997 Change
Occupied Acres Acres Annual 1990 Vacant 1990 Use toLand use 1960 1997 per Year Growth** to 1997 Use 1997 Vacant
Marine Cargo 494 1,075 15.7 2.1% 105 43Marine Industrial 498 704 5.6 0.9% 43 36Other Industrial & Infrastructure 309 1,189 23.8 3.7% 50Parks, Commercial, & Housing 7 221 5.8 9.8% 27Other Waterfront 23 114 2.5 4.4% 7All Uses 1,331 3,303 53.3 2.5% 232 79
Vacant Land*** 2,399 1,164 -33.4 -1.9%Total Land*** 3,730 4,467
* The inventory area generally extends from the river to the nearest street or railroad right-of-way, and from the Willamette River's Steel Bridge to the Columbia River's Railroad Bridge.** Annual growth is the average annual rate, based on 1960 and 1997 data.*** In 1994, the Port purchased 734 acres of vacant land on West Hayden Island, which was added to the inventory.Sources: Bureau of Planning calculations from Port of Portland data in Marine Terminals MasterPlan (1991) and 1997 Portland Harbor Land Use Inventory.
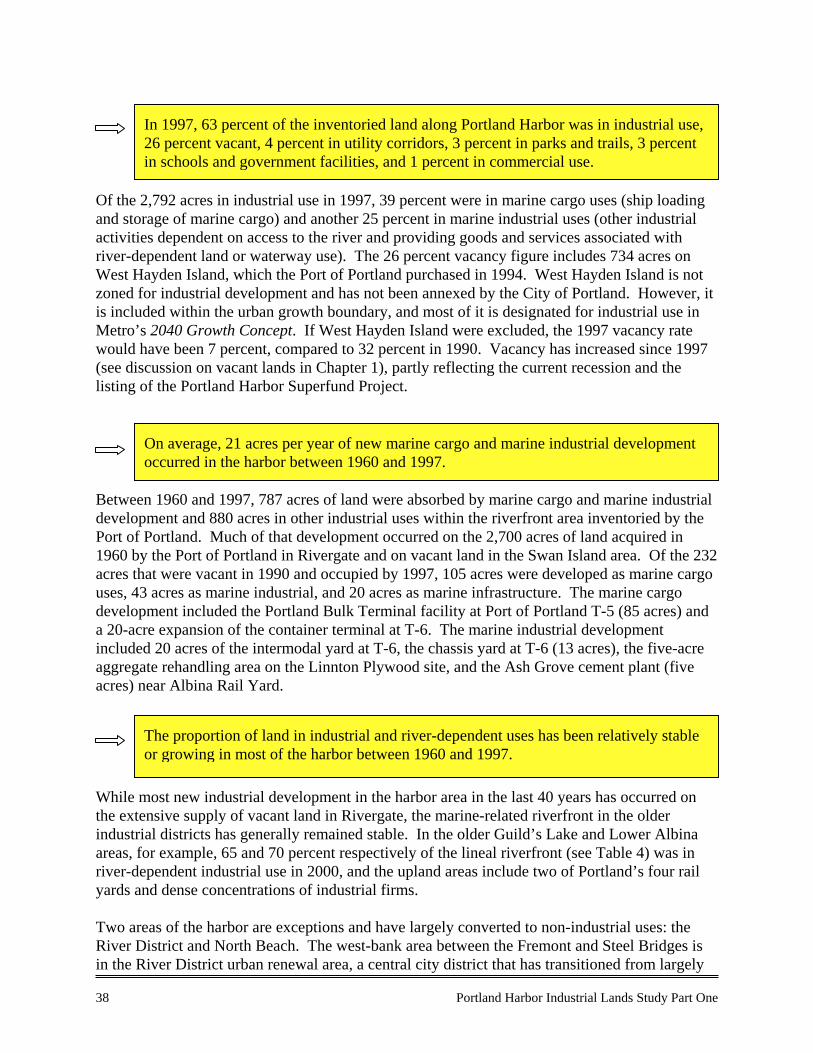
38 Portland Harbor Industrial Lands Study Part One
Of the 2,792 acres in industrial use in 1997, 39 percent were in marine cargo uses (ship loadingand storage of marine cargo) and another 25 percent in marine industrial uses (other industrialactivities dependent on access to the river and providing goods and services associated withriver-dependent land or waterway use). The 26 percent vacancy figure includes 734 acres onWest Hayden Island, which the Port of Portland purchased in 1994. West Hayden Island is notzoned for industrial development and has not been annexed by the City of Portland. However, itis included within the urban growth boundary, and most of it is designated for industrial use inMetro’s 2040 Growth Concept. If West Hayden Island were excluded, the 1997 vacancy ratewould have been 7 percent, compared to 32 percent in 1990. Vacancy has increased since 1997(see discussion on vacant lands in Chapter 1), partly reflecting the current recession and thelisting of the Portland Harbor Superfund Project.
Between 1960 and 1997, 787 acres of land were absorbed by marine cargo and marine industrialdevelopment and 880 acres in other industrial uses within the riverfront area inventoried by thePort of Portland. Much of that development occurred on the 2,700 acres of land acquired in1960 by the Port of Portland in Rivergate and on vacant land in the Swan Island area. Of the 232acres that were vacant in 1990 and occupied by 1997, 105 acres were developed as marine cargouses, 43 acres as marine industrial, and 20 acres as marine infrastructure. The marine cargodevelopment included the Portland Bulk Terminal facility at Port of Portland T-5 (85 acres) anda 20-acre expansion of the container terminal at T-6. The marine industrial developmentincluded 20 acres of the intermodal yard at T-6, the chassis yard at T-6 (13 acres), the five-acreaggregate rehandling area on the Linnton Plywood site, and the Ash Grove cement plant (fiveacres) near Albina Rail Yard.
While most new industrial development in the harbor area in the last 40 years has occurred onthe extensive supply of vacant land in Rivergate, the marine-related riverfront in the olderindustrial districts has generally remained stable. In the older Guild’s Lake and Lower Albinaareas, for example, 65 and 70 percent respectively of the lineal riverfront (see Table 4) was inriver-dependent industrial use in 2000, and the upland areas include two of Portland’s four railyards and dense concentrations of industrial firms.
Two areas of the harbor are exceptions and have largely converted to non-industrial uses: theRiver District and North Beach. The west-bank area between the Fremont and Steel Bridges isin the River District urban renewal area, a central city district that has transitioned from largely
In 1997, 63 percent of the inventoried land along Portland Harbor was in industrial use,26 percent vacant, 4 percent in utility corridors, 3 percent in parks and trails, 3 percentin schools and government facilities, and 1 percent in commercial use.
On average, 21 acres per year of new marine cargo and marine industrial developmentoccurred in the harbor between 1960 and 1997.
The proportion of land in industrial and river-dependent uses has been relatively stableor growing in most of the harbor between 1960 and 1997.
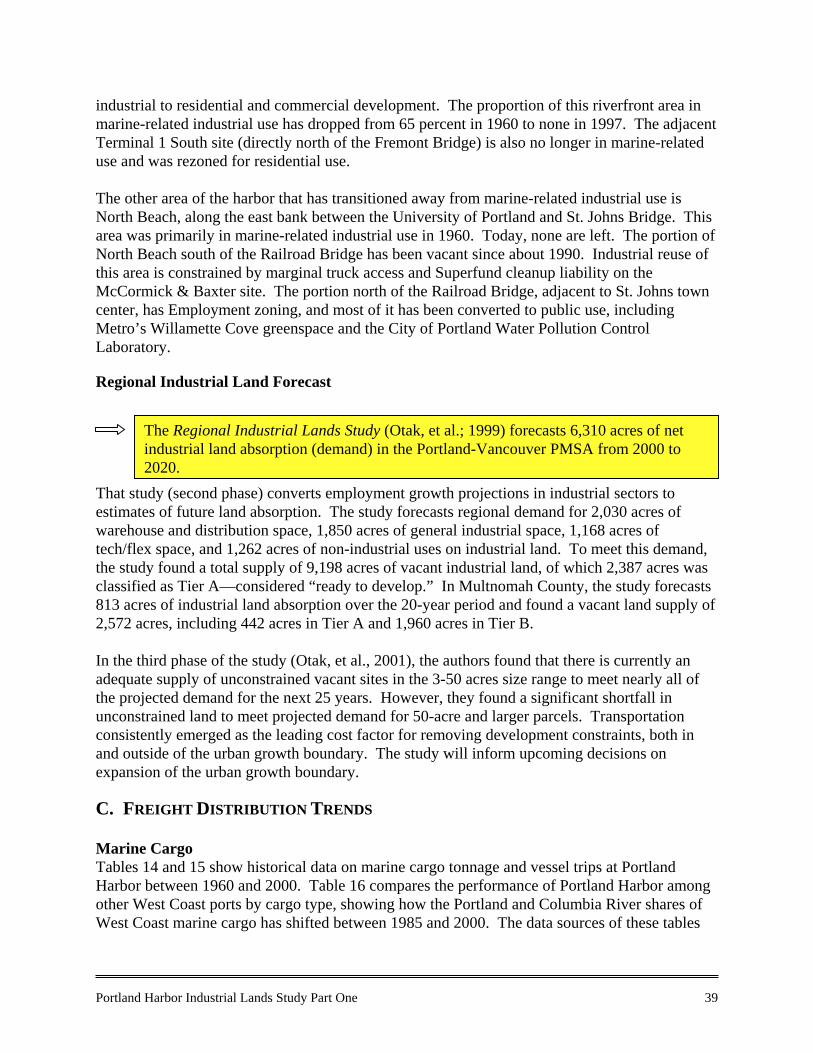
Portland Harbor Industrial Lands Study Part One 39
industrial to residential and commercial development. The proportion of this riverfront area inmarine-related industrial use has dropped from 65 percent in 1960 to none in 1997. The adjacentTerminal 1 South site (directly north of the Fremont Bridge) is also no longer in marine-relateduse and was rezoned for residential use.
The other area of the harbor that has transitioned away from marine-related industrial use isNorth Beach, along the east bank between the University of Portland and St. Johns Bridge. Thisarea was primarily in marine-related industrial use in 1960. Today, none are left. The portion ofNorth Beach south of the Railroad Bridge has been vacant since about 1990. Industrial reuse ofthis area is constrained by marginal truck access and Superfund cleanup liability on theMcCormick & Baxter site. The portion north of the Railroad Bridge, adjacent to St. Johns towncenter, has Employment zoning, and most of it has been converted to public use, includingMetro’s Willamette Cove greenspace and the City of Portland Water Pollution ControlLaboratory.
Regional Industrial Land Forecast
That study (second phase) converts employment growth projections in industrial sectors toestimates of future land absorption. The study forecasts regional demand for 2,030 acres ofwarehouse and distribution space, 1,850 acres of general industrial space, 1,168 acres oftech/flex space, and 1,262 acres of non-industrial uses on industrial land. To meet this demand,the study found a total supply of 9,198 acres of vacant industrial land, of which 2,387 acres wasclassified as Tier A—considered “ready to develop.” In Multnomah County, the study forecasts813 acres of industrial land absorption over the 20-year period and found a vacant land supply of2,572 acres, including 442 acres in Tier A and 1,960 acres in Tier B.
In the third phase of the study (Otak, et al., 2001), the authors found that there is currently anadequate supply of unconstrained vacant sites in the 3-50 acres size range to meet nearly all ofthe projected demand for the next 25 years. However, they found a significant shortfall inunconstrained land to meet projected demand for 50-acre and larger parcels. Transportationconsistently emerged as the leading cost factor for removing development constraints, both inand outside of the urban growth boundary. The study will inform upcoming decisions onexpansion of the urban growth boundary.
C. FREIGHT DISTRIBUTION TRENDS
Marine CargoTables 14 and 15 show historical data on marine cargo tonnage and vessel trips at PortlandHarbor between 1960 and 2000. Table 16 compares the performance of Portland Harbor amongother West Coast ports by cargo type, showing how the Portland and Columbia River shares ofWest Coast marine cargo has shifted between 1985 and 2000. The data sources of these tables
The Regional Industrial Lands Study (Otak, et al.; 1999) forecasts 6,310 acres of netindustrial land absorption (demand) in the Portland-Vancouver PMSA from 2000 to2020.
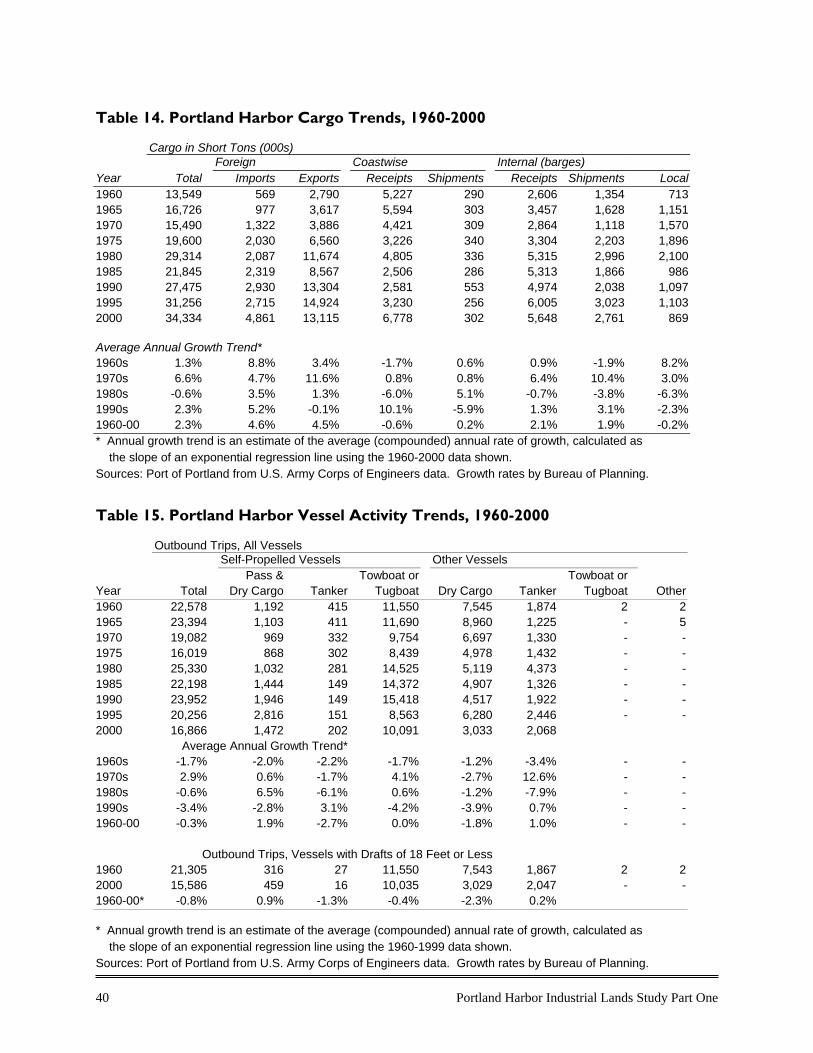
40 Portland Harbor Industrial Lands Study Part One
Table 14. Portland Harbor Cargo Trends, 1960-2000
Cargo in Short Tons (000s)Foreign Coastwise Internal (barges)
Year Total Imports Exports Receipts Shipments Receipts Shipments Local1960 13,549 569 2,790 5,227 290 2,606 1,354 7131965 16,726 977 3,617 5,594 303 3,457 1,628 1,1511970 15,490 1,322 3,886 4,421 309 2,864 1,118 1,5701975 19,600 2,030 6,560 3,226 340 3,304 2,203 1,8961980 29,314 2,087 11,674 4,805 336 5,315 2,996 2,1001985 21,845 2,319 8,567 2,506 286 5,313 1,866 9861990 27,475 2,930 13,304 2,581 553 4,974 2,038 1,0971995 31,256 2,715 14,924 3,230 256 6,005 3,023 1,1032000 34,334 4,861 13,115 6,778 302 5,648 2,761 869
Average Annual Growth Trend*1960s 1.3% 8.8% 3.4% -1.7% 0.6% 0.9% -1.9% 8.2%1970s 6.6% 4.7% 11.6% 0.8% 0.8% 6.4% 10.4% 3.0%1980s -0.6% 3.5% 1.3% -6.0% 5.1% -0.7% -3.8% -6.3%1990s 2.3% 5.2% -0.1% 10.1% -5.9% 1.3% 3.1% -2.3%1960-00 2.3% 4.6% 4.5% -0.6% 0.2% 2.1% 1.9% -0.2%* Annual growth trend is an estimate of the average (compounded) annual rate of growth, calculated as the slope of an exponential regression line using the 1960-2000 data shown.Sources: Port of Portland from U.S. Army Corps of Engineers data. Growth rates by Bureau of Planning.
Table 15. Portland Harbor Vessel Activity Trends, 1960-2000
Outbound Trips, All VesselsSelf-Propelled Vessels Other Vessels
Pass & Towboat or Towboat orYear Total Dry Cargo Tanker Tugboat Dry Cargo Tanker Tugboat Other1960 22,578 1,192 415 11,550 7,545 1,874 2 21965 23,394 1,103 411 11,690 8,960 1,225 - 51970 19,082 969 332 9,754 6,697 1,330 - -1975 16,019 868 302 8,439 4,978 1,432 - -1980 25,330 1,032 281 14,525 5,119 4,373 - -1985 22,198 1,444 149 14,372 4,907 1,326 - -1990 23,952 1,946 149 15,418 4,517 1,922 - -1995 20,256 2,816 151 8,563 6,280 2,446 - -2000 16,866 1,472 202 10,091 3,033 2,068
Average Annual Growth Trend*1960s -1.7% -2.0% -2.2% -1.7% -1.2% -3.4% - -1970s 2.9% 0.6% -1.7% 4.1% -2.7% 12.6% - -1980s -0.6% 6.5% -6.1% 0.6% -1.2% -7.9% - -1990s -3.4% -2.8% 3.1% -4.2% -3.9% 0.7% - -1960-00 -0.3% 1.9% -2.7% 0.0% -1.8% 1.0% - -
Outbound Trips, Vessels with Drafts of 18 Feet or Less1960 21,305 316 27 11,550 7,543 1,867 2 22000 15,586 459 16 10,035 3,029 2,047 - -1960-00* -0.8% 0.9% -1.3% -0.4% -2.3% 0.2%
* Annual growth trend is an estimate of the average (compounded) annual rate of growth, calculated as the slope of an exponential regression line using the 1960-1999 data shown.Sources: Port of Portland from U.S. Army Corps of Engineers data. Growth rates by Bureau of Planning.
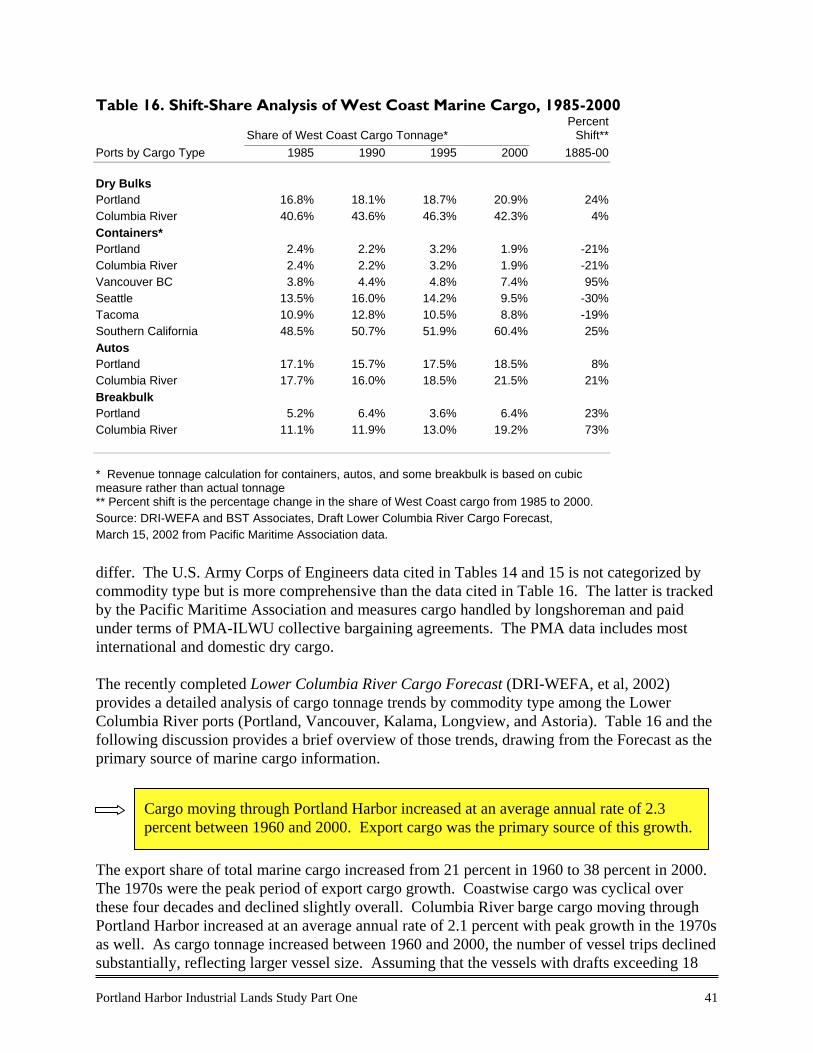
Portland Harbor Industrial Lands Study Part One 41
Table 16. Shift-Share Analysis of West Coast Marine Cargo, 1985-2000
Share of West Coast Cargo Tonnage*Percent
Shift**Ports by Cargo Type 1985 1990 1995 2000 1885-00
Dry BulksPortland 16.8% 18.1% 18.7% 20.9% 24%Columbia River 40.6% 43.6% 46.3% 42.3% 4%Containers*Portland 2.4% 2.2% 3.2% 1.9% -21%Columbia River 2.4% 2.2% 3.2% 1.9% -21%Vancouver BC 3.8% 4.4% 4.8% 7.4% 95%Seattle 13.5% 16.0% 14.2% 9.5% -30%Tacoma 10.9% 12.8% 10.5% 8.8% -19%Southern California 48.5% 50.7% 51.9% 60.4% 25%AutosPortland 17.1% 15.7% 17.5% 18.5% 8%Columbia River 17.7% 16.0% 18.5% 21.5% 21%BreakbulkPortland 5.2% 6.4% 3.6% 6.4% 23%Columbia River 11.1% 11.9% 13.0% 19.2% 73%
* Revenue tonnage calculation for containers, autos, and some breakbulk is based on cubicmeasure rather than actual tonnage** Percent shift is the percentage change in the share of West Coast cargo from 1985 to 2000.Source: DRI-WEFA and BST Associates, Draft Lower Columbia River Cargo Forecast,March 15, 2002 from Pacific Maritime Association data.
differ. The U.S. Army Corps of Engineers data cited in Tables 14 and 15 is not categorized bycommodity type but is more comprehensive than the data cited in Table 16. The latter is trackedby the Pacific Maritime Association and measures cargo handled by longshoreman and paidunder terms of PMA-ILWU collective bargaining agreements. The PMA data includes mostinternational and domestic dry cargo.
The recently completed Lower Columbia River Cargo Forecast (DRI-WEFA, et al, 2002)provides a detailed analysis of cargo tonnage trends by commodity type among the LowerColumbia River ports (Portland, Vancouver, Kalama, Longview, and Astoria). Table 16 and thefollowing discussion provides a brief overview of those trends, drawing from the Forecast as theprimary source of marine cargo information.
The export share of total marine cargo increased from 21 percent in 1960 to 38 percent in 2000.The 1970s were the peak period of export cargo growth. Coastwise cargo was cyclical overthese four decades and declined slightly overall. Columbia River barge cargo moving throughPortland Harbor increased at an average annual rate of 2.1 percent with peak growth in the 1970sas well. As cargo tonnage increased between 1960 and 2000, the number of vessel trips declinedsubstantially, reflecting larger vessel size. Assuming that the vessels with drafts exceeding 18
Cargo moving through Portland Harbor increased at an average annual rate of 2.3percent between 1960 and 2000. Export cargo was the primary source of this growth.
42 Portland Harbor Industrial Lands Study Part One
feet generally reflect oceangoing cargo (foreign and coastwise cargo in Table 14), the averagetonnage of oceangoing ships more than doubled between 1960 and 1999 from approximately7,000 to 17,000 short tons.
The forecast is conservative, given the 2.3 percent average rate of marine cargo growth duringthe 1960-2000 period. These high and low scenarios reflect a range of 34 to 55 million tons ofLower Columbia River marine cargo in 2030.
Dry bulks made up nearly two thirds of Lower Columbia River marine cargo tonnage in 2000.Lower Columbia dry bulk cargo increased from 14.7 million revenue tons in 1982 to 22.8million in 2000, with a brief peak of 31.2 million in 1995. Most of that cargo is wheat broughtby barge or rail from eastern Oregon, Washington, and inland states for export to Asia. Otherdry bulk exports include barley, corn, soybeans, soda ash, potash, and bentonite. Dry bulkimports include limestone, cement, salt, and alumina.
The combined Lower Columbia River ports accounted for 42.3 percent of the dry bulk marinecargo handled at West Coast ports in 2000, up from 40.6 percent in 1985. That percentage isroughly equivalent to market share. Half of the Lower Columbia dry bulk cargo in 2000 washandled at Portland Harbor, also up slightly from 1985. Of the six grain terminals operating onthe Lower Columbia, one is in Vancouver, two in Kalama, and three in Portland.
The DRI-WEFA cargo forecast for the Lower Columbia River ports considers the proposedchannel-deepening project from 40 to 43 feet as a variable, providing cargo projections with andwithout deepening. The channel-deepening project would accommodate the expanding fleet oflarger grain and container ships that are constrained by the existing channel depth. The forecastpredicts a range of 0.5 to 1.5 percent average annual growth of grain tonnage through LowerColumbia River ports from 2000 to 2030 without channel deepening and 1.0 to 2.0 percent withdeepening. The 2000-2030 forecast for non-grain dry bulks is –0.3 to 1.7 percent average annualgrowth for exports and –1.2 to 1.0 percent for imports (not affected by channel deepening).
DRI-WEFA predicts –0.4 to +0.8 percent average annual growth of total marine cargohandled at the Lower Columbia River ports between 2000 and 2030 without channeldeepening. With the proposed Columbia River channel deepening to 43 feet, theforecast range is 0.0 to 1.3 percent.
Dry bulk exports are the Columbia River ports’ primary competitive niche amongWest Coast ports. Modest long-term growth is expected in dry bulk cargo.
Portland Harbor Industrial Lands Study Part One 43
The volume of assembled automobiles moving through Portland Harbor has fluctuated from 2.3million revenue tons in 1982 to 3.6 million in 1988, 2.2 million in 1996, and 3.7 million in 2000.Portland’s three auto terminals (Toyota, Honda, and Hyundai) accounted for 17.1 percent of theautomobiles handled at West Coast ports in 1985 and 18.5 percent in 2000. The Subaru terminalin Vancouver handled another 3.0 percent of West Coast auto cargo in 2000. The DRI-WEFAforecast for Lower Columbia River automobile cargo predicts -0.1 to 1.3 percent average annualgrowth from 2000 to 2030.
Between 1990 and 2000, the Pacific Northwest share (including Vancouver BC) of West Coastcontainer traffic (full TEUs) decreased from 36.2 percent in 1990 to 27.9 percent in 2000, whilethe Southern California share increased from 50.7 to 60.4 percent. Portland had a relativelysmall, 1.9-percent share of West Coast container traffic in 2000.
While the range of commodities shipped by containers is diverse, Portland’s container facilitiesprimarily serve a niche market for export of agricultural and forest products. The highestvolume commodities in 2000 were hay and animal feed, paper, and lumber. Port of PortlandTerminal 6 handled 99.7 percent of the Lower Columbia River container tonnage in 2000. TheDRI-WEFA forecast for Lower Columbia River container cargo predicts 0 to 1.5 percent averageannual growth from 2000 to 2030 without channel deepening and 2.0 to 3.6 percent withdeepening.
Most general cargo that can be shipped in containers is now done so. Breakbulk cargo consistsof general goods not shipped in containers, typically steel, paper, and wood products. Breakbulkgrowth since 1997 has been primarily in steel imports. Steel imports accounted for 55 percent ofthe Lower Columbia River breakbulk tonnage in 2000, and wood and paper product exportsmade up another 25 percent. Portland’s share of Columbia River breakbulk cargo increasedfrom 43.1 percent in 1982 to 55.9 percent in 1989, and then dropped to 33.2 percent in 2000. TheDRI-WEFA forecast for Lower Columbia River breakbulk cargo predicts 0.5 to 0.8 percentaverage annual growth of breakbulk exports from 2000 to 2030; 0.2 to 1.8 percent averageannual growth of breakbulk imports.
Containerized cargo at Portland Harbor increased rapidly from 0.7 million revenuetons in 1982 to 4.2 million in 1995 and leveled off after 1995. Moderate growth ofcontainer cargo is forecast.
Automobile imports are another of Portland Harbor’s competitive niches. Modestlong-term growth is expected in automobile cargo.
Columbia River breakbulk cargo increased slightly from 0.9 to 1.0 million revenue tonsbetween 1982 and 1997, and then grew rapidly to 1.9 million tons in 2000.
44 Portland Harbor Industrial Lands Study Part One
Refined petroleum products, primarily gasoline and diesel, are the primary liquid bulkcommodity shipped on the Lower Columbia River. The rapid growth of refined petroleum cargoafter 1998 reflected the explosion of the Olympic pipeline, as tanker shipments provided animmediate alternative to pipeline transportation. The pipeline has since been repaired. Portlandis the primary Lower Columbia River port for handling liquid bulks. All of the refinedpetroleum cargo on the Lower Columbia in 2000 arrived in Portland Harbor terminals.
The DRI-WEFA forecast for the Lower Columbia River ports predicts a –1.3 to –0.6 percentaverage annual decline in refined petroleum cargo from 2000 to 2030. The 2030 forecast 0.6 to1.6 percent average annual growth for crude oil and –0.6 to 0.6 percent for liquid chemicals andfertilizers.
Mode Split of Marine CargoOcean cargo is transported to or from the marine terminals by rail, truck, barge, or intermodalfacilities. Table 17 shows the distribution of ocean cargo among these connecting transportmodes at Portland and Vancouver Harbors in 1996 and projections for 2030, along withcomparison mode shares of all freight flows in the Portland Metropolitan Area. This informationwas drawn from the Commodity Flow Analysis for the Portland Metropolitan Area, prepared byICF Kaiser, et al., in 1999. A primary data source for this forecast was the 1993 CommodityFlow Survey conducted by the U.S. Bureau of Census. DRI-WEFA is currently updating the1999 commodity flow forecast, using data from the 1997 Commodity Flow Survey. Completionof the DRI-WEFA forecast is expected later this year.
The ICF Kaiser Commodity Flow Forecast predicted that the share of ocean cargo transported toor from Portland and Vancouver marine terminals by rail will increase from 51 percent in 1996to 56 percent in 2030. Marine and rail distribution provide similar functions, emphasizingeconomical transport of heavy commodities over long distances, and Portland is a regionalconnecting point for these transport modes. Columbia River barge transportation is a low-costalternative to rail for grain and other bulk commodities.
Lower Columbia River receipts of refined petroleum products increased moderatelyfrom 2.2 million tons in 1990 to 2.6 million tons in 1998 and then rapidly to 5.3 milliontons in 2000.
The majority of ocean cargo is carried to or from Portland and Vancouver Harbors byrail, and that share is projected to increase in coming decades.
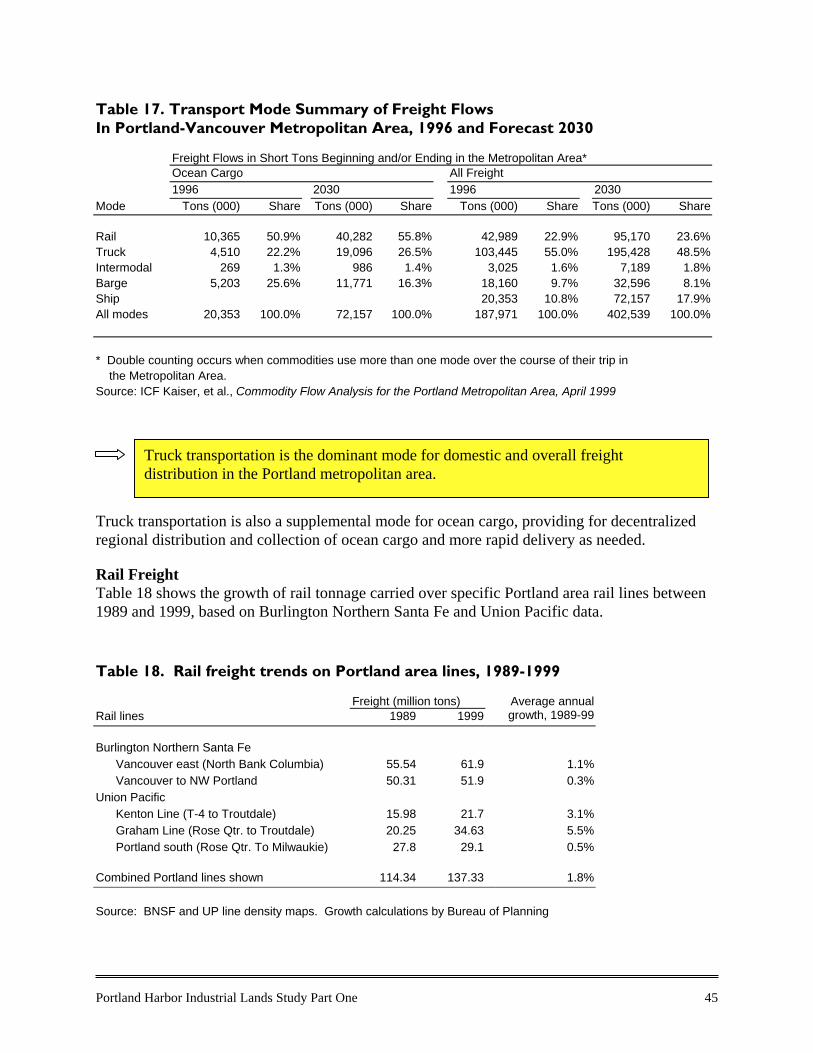
Portland Harbor Industrial Lands Study Part One 45
Table 17. Transport Mode Summary of Freight FlowsIn Portland-Vancouver Metropolitan Area, 1996 and Forecast 2030
Freight Flows in Short Tons Beginning and/or Ending in the Metropolitan Area*Ocean Cargo All Freight1996 2030 1996 2030
Mode Tons (000) Share Tons (000) Share Tons (000) Share Tons (000) Share
Rail 10,365 50.9% 40,282 55.8% 42,989 22.9% 95,170 23.6%Truck 4,510 22.2% 19,096 26.5% 103,445 55.0% 195,428 48.5%Intermodal 269 1.3% 986 1.4% 3,025 1.6% 7,189 1.8%Barge 5,203 25.6% 11,771 16.3% 18,160 9.7% 32,596 8.1%Ship 20,353 10.8% 72,157 17.9%All modes 20,353 100.0% 72,157 100.0% 187,971 100.0% 402,539 100.0%
* Double counting occurs when commodities use more than one mode over the course of their trip in the Metropolitan Area.Source: ICF Kaiser, et al., Commodity Flow Analysis for the Portland Metropolitan Area, April 1999
Truck transportation is also a supplemental mode for ocean cargo, providing for decentralizedregional distribution and collection of ocean cargo and more rapid delivery as needed.
Rail FreightTable 18 shows the growth of rail tonnage carried over specific Portland area rail lines between1989 and 1999, based on Burlington Northern Santa Fe and Union Pacific data.
Table 18. Rail freight trends on Portland area lines, 1989-1999
Freight (million tons)Rail lines 1989 1999
Average annualgrowth, 1989-99
Burlington Northern Santa FeVancouver east (North Bank Columbia) 55.54 61.9 1.1%Vancouver to NW Portland 50.31 51.9 0.3%
Union PacificKenton Line (T-4 to Troutdale) 15.98 21.7 3.1%Graham Line (Rose Qtr. to Troutdale) 20.25 34.63 5.5%Portland south (Rose Qtr. To Milwaukie) 27.8 29.1 0.5%
Combined Portland lines shown 114.34 137.33 1.8%
Source: BNSF and UP line density maps. Growth calculations by Bureau of Planning
Truck transportation is the dominant mode for domestic and overall freightdistribution in the Portland metropolitan area.
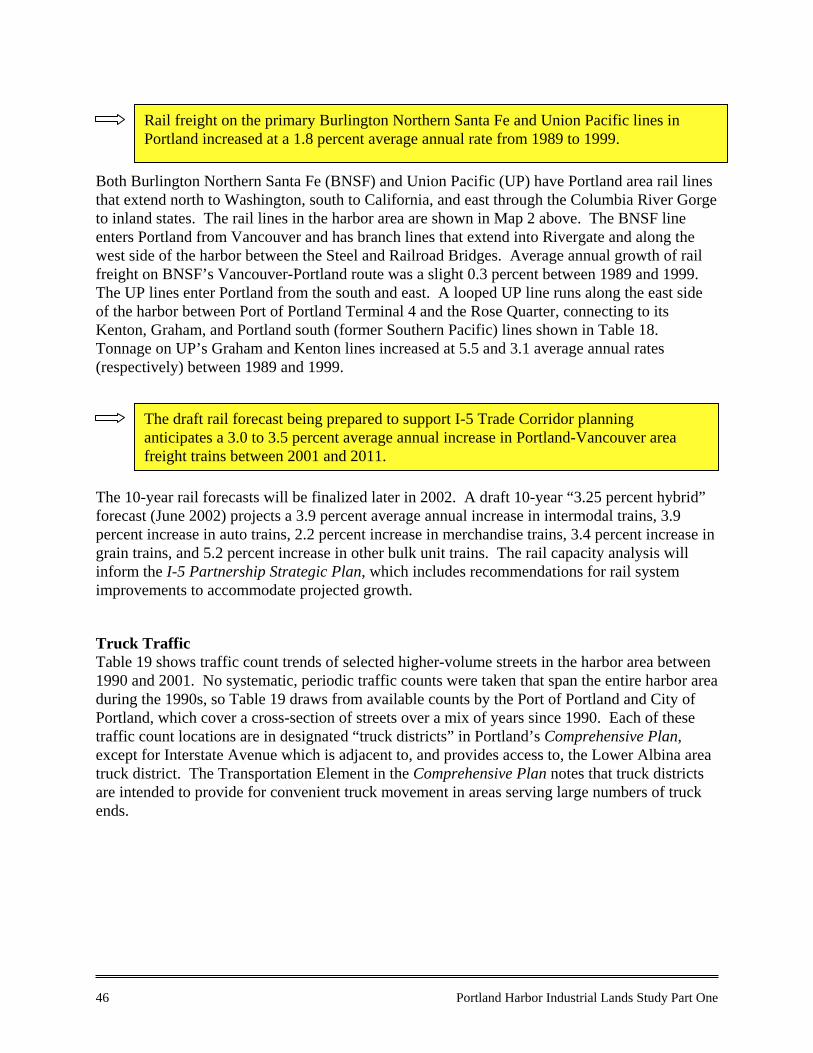
46 Portland Harbor Industrial Lands Study Part One
Both Burlington Northern Santa Fe (BNSF) and Union Pacific (UP) have Portland area rail linesthat extend north to Washington, south to California, and east through the Columbia River Gorgeto inland states. The rail lines in the harbor area are shown in Map 2 above. The BNSF lineenters Portland from Vancouver and has branch lines that extend into Rivergate and along thewest side of the harbor between the Steel and Railroad Bridges. Average annual growth of railfreight on BNSF’s Vancouver-Portland route was a slight 0.3 percent between 1989 and 1999.The UP lines enter Portland from the south and east. A looped UP line runs along the east sideof the harbor between Port of Portland Terminal 4 and the Rose Quarter, connecting to itsKenton, Graham, and Portland south (former Southern Pacific) lines shown in Table 18.Tonnage on UP’s Graham and Kenton lines increased at 5.5 and 3.1 average annual rates(respectively) between 1989 and 1999.
The 10-year rail forecasts will be finalized later in 2002. A draft 10-year “3.25 percent hybrid”forecast (June 2002) projects a 3.9 percent average annual increase in intermodal trains, 3.9percent increase in auto trains, 2.2 percent increase in merchandise trains, 3.4 percent increase ingrain trains, and 5.2 percent increase in other bulk unit trains. The rail capacity analysis willinform the I-5 Partnership Strategic Plan, which includes recommendations for rail systemimprovements to accommodate projected growth.
Truck TrafficTable 19 shows traffic count trends of selected higher-volume streets in the harbor area between1990 and 2001. No systematic, periodic traffic counts were taken that span the entire harbor areaduring the 1990s, so Table 19 draws from available counts by the Port of Portland and City ofPortland, which cover a cross-section of streets over a mix of years since 1990. Each of thesetraffic count locations are in designated “truck districts” in Portland’s Comprehensive Plan,except for Interstate Avenue which is adjacent to, and provides access to, the Lower Albina areatruck district. The Transportation Element in the Comprehensive Plan notes that truck districtsare intended to provide for convenient truck movement in areas serving large numbers of truckends.
Rail freight on the primary Burlington Northern Santa Fe and Union Pacific lines inPortland increased at a 1.8 percent average annual rate from 1989 to 1999.
The draft rail forecast being prepared to support I-5 Trade Corridor planninganticipates a 3.0 to 3.5 percent average annual increase in Portland-Vancouver areafreight trains between 2001 and 2011.
Portland Harbor Industrial Lands Study Part One 47
The two highest volume streets in the study area are Swan Island’s Going Street, carrying 38,616daily trips in October 2000 at the railroad crossing (the entrance to the Swan Island area), andthe Guild’s Lake area’s Yeon Avenue with 35,686 daily trips in January 2001 at 35th Avenue.Going Street (between I-5 and Greeley Avenue) is designed a “major truck street” and YeonAvenue (between I-405 and Highway 30) a “regional truck route” in Metro’s RegionalTransportation Plan. As shown in Table 19, Going Street had a modest increase in trafficvolume between 1994 and 2000, and Yeon Avenue had a modest reduction between 1995 and2001. The traffic volume of the other streets shown in Table 19 ranged from 7,936 to 13,358daily trips.
The ICF Kaiser Commodity Flow Analysis (1999) found that lumber, wood products andfurniture accounted for 56 percent of truck freight in the Portland-Vancouver metropolitan areain 1996, followed by processed food products with 18 percent and stone, clay, concrete, andsimilar products with 9 percent.
Traffic volumes on the busier truck streets in the harbor area generally increased duringthe 1990s. The fastest growth was in the Rivergate area, reflecting the development ofvacant land there.
Lumber, wood products, and furniture were the dominant commodity group carried bytruck in the region in 1996.
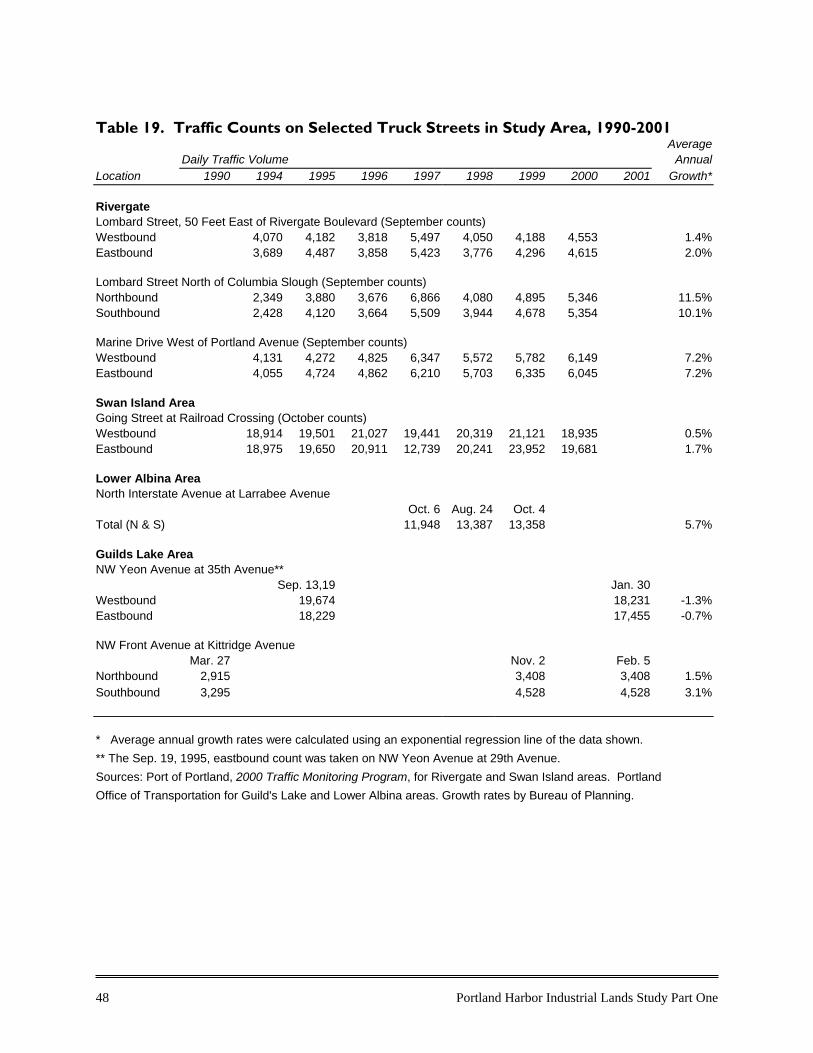
48 Portland Harbor Industrial Lands Study Part One
Table 19. Traffic Counts on Selected Truck Streets in Study Area, 1990-2001Average
Daily Traffic Volume AnnualLocation 1990 1994 1995 1996 1997 1998 1999 2000 2001 Growth*
RivergateLombard Street, 50 Feet East of Rivergate Boulevard (September counts)Westbound 4,070 4,182 3,818 5,497 4,050 4,188 4,553 1.4%Eastbound 3,689 4,487 3,858 5,423 3,776 4,296 4,615 2.0%
Lombard Street North of Columbia Slough (September counts)Northbound 2,349 3,880 3,676 6,866 4,080 4,895 5,346 11.5%Southbound 2,428 4,120 3,664 5,509 3,944 4,678 5,354 10.1%
Marine Drive West of Portland Avenue (September counts)Westbound 4,131 4,272 4,825 6,347 5,572 5,782 6,149 7.2%Eastbound 4,055 4,724 4,862 6,210 5,703 6,335 6,045 7.2%
Swan Island AreaGoing Street at Railroad Crossing (October counts)Westbound 18,914 19,501 21,027 19,441 20,319 21,121 18,935 0.5%Eastbound 18,975 19,650 20,911 12,739 20,241 23,952 19,681 1.7%
Lower Albina AreaNorth Interstate Avenue at Larrabee Avenue
Oct. 6 Aug. 24 Oct. 4Total (N & S) 11,948 13,387 13,358 5.7%
Guilds Lake AreaNW Yeon Avenue at 35th Avenue**
Sep. 13,19 Jan. 30Westbound 19,674 18,231 -1.3%Eastbound 18,229 17,455 -0.7%
NW Front Avenue at Kittridge AvenueMar. 27 Nov. 2 Feb. 5
Northbound 2,915 3,408 3,408 1.5%Southbound 3,295 4,528 4,528 3.1%
* Average annual growth rates were calculated using an exponential regression line of the data shown.** The Sep. 19, 1995, eastbound count was taken on NW Yeon Avenue at 29th Avenue. Sources: Port of Portland, 2000 Traffic Monitoring Program, for Rivergate and Swan Island areas. PortlandOffice of Transportation for Guild's Lake and Lower Albina areas. Growth rates by Bureau of Planning.
Portland Harbor Industrial Lands Study Part One 49
3. LOCATION FACTORS AND CONTEXT
A. INDUSTRIAL LOCATION FACTORS
Distribution Infrastructure and FacilitiesMaps 7 and 8 depict the freight infrastructure network of the Northwest states and the Portlandmetropolitan area. Map 7 shows the Pacific Northwest seaports; the Columbia/Snake Riversbarge routes; the Union Pacific, Burlington Northern Santa Fe, and Canadian Pacific rail lines;and interstate highways. Size of seaports is shown by total marine cargo volume in short tons in2000, based on U.S. Army Corps of Engineers data in Waterborne Commerce of the U.S.Vancouver B.C. tonnage data is from the Port of Vancouver website.
Map 8 displays the industrial lands, freight infrastructure, and major freight facilities in thePortland metropolitan area. Industrial and employment zoning depict the region’s industrial landuse pattern. The railroads, truck routes, and freight transportation facilities on Map 8 are fromMetro’s 2000 Regional Transportation Plan. Marine facilities are where freight is transferredfrom water- to land-based modes; rail facilities, from rail spurs to other modes; and air facilities,from airport runways to land-based modes. Rail yards, which are shown separately from otherrail facilities, are those operated by Union Pacific and Burlington Northern Santa Fe. Truckterminals are truck-to-truck transfer facilities that are primary gateways for freight entering orleaving the region.
As shown in Map 7, Portland is located at the intersection of the Lower Columbia Riverdeepwater shipping channel, the Upper Columbia/Snake Rivers barge routes, two major nationalrailroads, and two interstate highways. The U.S. Army Corps of Engineers maintains thedeepwater channel at 40-foot depth and 600-foot width from the Pacific Ocean to Portland andVancouver Harbors. The Upper Columbia and Snake River barge network includes 26 portsupriver from Portland that extend north into Eastern Washington and east to Lewiston, Idaho.Portland’s rail access is a unique advantage to marine trade. Union Pacific (UP) and BurlingtonNorthern Santa Fe (BNSF) each have West Coast and east-west transcontinental rail lines thatrun through Portland. The east-west lines leading to Portland cross the Cascade Range along theColumbia River at river grade. The two alternative BNSF lines that cross the Cascade Range tothe Puget Sound over Stevens Pass and Stampede Pass require helper locomotives, a costdisadvantage for heavy-haul bulk trains. And the I-5 and I-84 highways intersect in Portland,providing truck access along the West Coast and across the country.
Portland is well positioned by its location and intermodal infrastructure for growth as aWest Coast distribution hub.
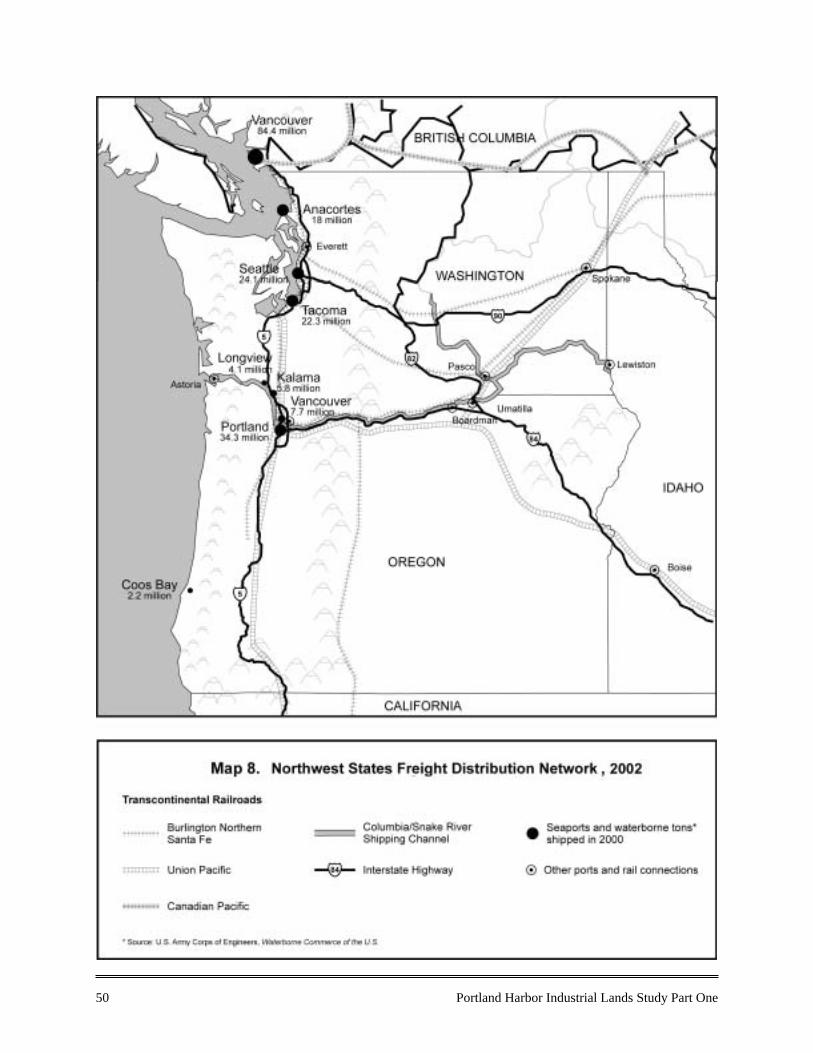
50 Portland Harbor Industrial Lands Study Part One
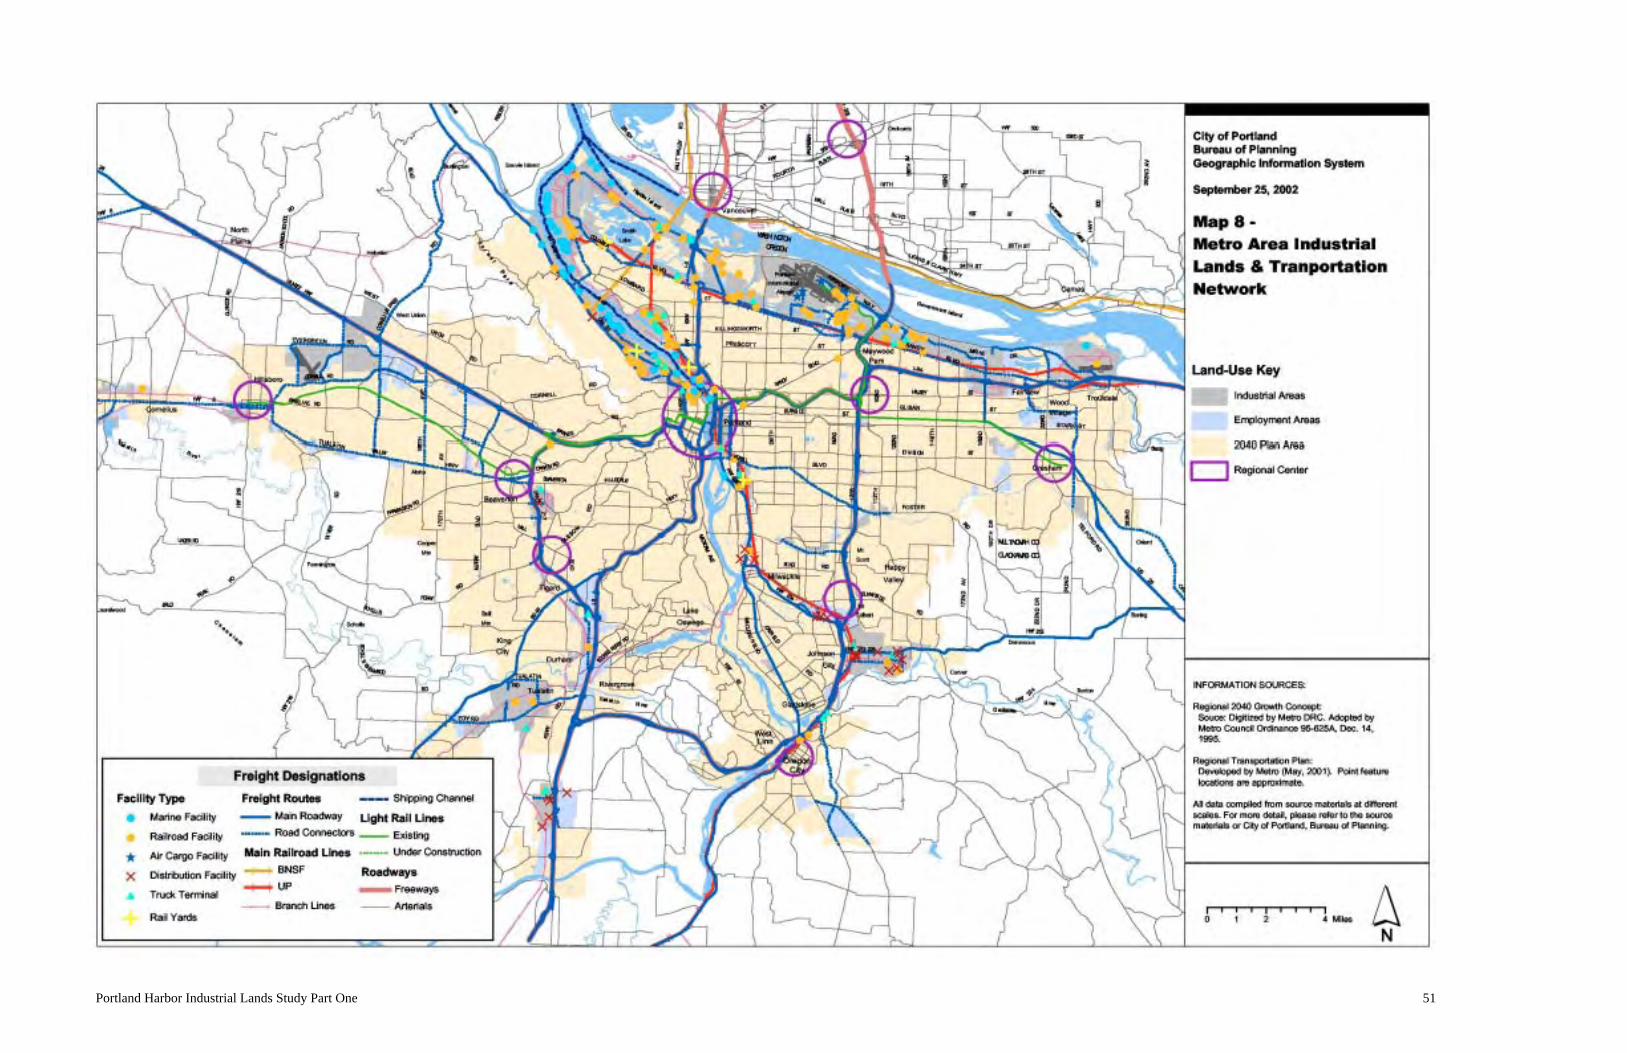
Portland Harbor Industrial Lands Study Part One 51
Portland Harbor Industrial Lands Study Part One 53
The majority of marine cargo tonnage consists of grain and other export dry bulks, en routeprimarily to Asia, that arrive at terminals by rail or barge. Several firms also use Portland as animport center for domestic rail and truck distribution, such as Toyota, Hyundai, Honda, Nike,and Columbia Sportswear. Regional distribution (i.e., of freight with an origin or destination inthe region) is more diverse and dispersed. Trucking is the primary transport mode for regionaldistribution, although regional producers and wholesalers to regional markets also rely on rail,ship, barge, pipeline, and air transportation. Air cargo shipping through PDX is primarily ofdomestic cargo on all-cargo carriers. Portland’s air freight activity includes regional hubs forUPS and FedEx and shipping for much of the region’s high tech sector. Through-traffic offreight that does not stop in the region is another major use of distribution infrastructure. Thiscombination of regional functions provides a critical mass of facilities that use and support amultimodal distribution network, and these functions also compete for network capacity atcongested locations during peak periods.
As shown in Map 8, the industrial districts throughout the region are generally well served bytruck routes with close access to the freeway system. Rail access is more concentrated along themain rail lines—BNSF lines on the west side of Portland Harbor, Rivergate, and Vancouver andUP lines on the harbor’s east side, southward into Clackamas County, and the ColumbiaCorridor. Marine facilities, railroad facilities, air cargo facilities, and truck terminals (see Map8) are even more tightly clustered in the harbor area and Columbia Corridor, showing theinterconnection of these transportation modes.
Map 8 shows the network of intermodal freight infrastructure and the cluster of relatedtransportation facilities in the harbor area. Map 3 in Chapter 1 shows the cluster of 252wholesale firms in the harbor area and a variety of concrete, metals, and transportationequipment manufacturers that require river access for water transportation. A strikingconvergence of freight transportation investment and related industrial land uses is evident inthese maps. Additionally, Table 10 in Chapter 2, which reviews Metro’s 2030 employmentforecast, shows that the transportation and wholesale industries are projected to be primarysources of the region’s industrial job growth. Thus, the importance of freight infrastructure andfacilities as an industrial location factor in the region appears likely to increase in the comingdecades.
The harbor area and Columbia Corridor are the center of the region’s freightdistribution facilities and industrial activity that requires rail or maritime access.
Freight transportation investment is a significant industrial location advantage for theharbor area in at least two respects: as a freight hub location for distribution industriesgrowth and as a marine and rail access location for manufacturers that require thosefacilities.
Portland’s freight network supports a variety of international, domestic, and regionaldistribution functions.
54 Portland Harbor Industrial Lands Study Part One
Industrial “globalization” trends that have been widely recognized since the 1970s includeinternational movements of many segments of production processes to lower-cost locations,increasing competition by product diversification into domestic and export niche markets, and“just in time” production and delivery to reduce product and raw material inventories (Storper,1997). These shifts in how goods are produced and transported have contributed to a substantialincrease in global trade and have generated major technological and process changes in thedistribution industries. For example, containers, which can be efficiently transloaded betweentrucks, railcars, ships, and barges, reducing the need for piecemeal reloading at ports, havebecome a predominant technological feature of global trade. Also, as the timing, transportmodes, quantities, and geography of shipping has become more complex, managing the“logistics” of the supply chain to increase productivity has become an expanding function of thedistribution industries. These structural shifts indicate an increasing role for the wholesale andtransportation industries in multimodal distribution hubs.
The U.S. Army Corps of Engineers and sponsoring ports have proposed the Columbia RiverChannel Improvements Project to deepen the shipping channel from 40 to 43 foot depth, whichis intended to increase access to the expanding international fleet of deeper draft grain andcontainer ships. The feasibility report and environmental impact statement for this project arecurrently under consideration. The Corps has also begun work on a Dredge MaterialsManagement Plan for the Lower Willamette River, to provide for continued maintenancedredging and dredge materials management, including the contaminated portions of the harbor.The I-5 Corridor Partnership, including Oregon and Washington Departments of Transportationand others, has studied and proposed a series of infrastructure and managementrecommendations to maintain truck and rail capacity along the I-5 corridor between I-84 and I-205 in Vancouver. The multifaceted recommendations include I-5 widening to six lanes (threeper direction) from the Fremont Bridge to I-205, further study of 10-lane bridge capacity, furtherstudy of rail capacity improvements, and land use management to protect industrial land along I-5 and interchange capacity. These major infrastructure projects will expand the region’scompetitive capacity as an intermodal distribution hub.
Industry ClusteringTable 20 is an input-output table, which quantifies the flow of commodities as intermediateinputs between industries. Specifically, the table shows the use of commodities in the U.S. byselected industries that are substantially represented in the study area (generally having locationquotients above 1.5 in the study area relative to the PMSA). The table can be read in two ways:each column shows an industry’s composition of intermediate inputs from other industries;
Long-term industrial strategies that have dramatically expanded global trade in recentdecades indicate continuing growth potential of multimodal distribution hubs.
Major investments to maintain and expand the capacity of regional freightinfrastructure are currently being considered.
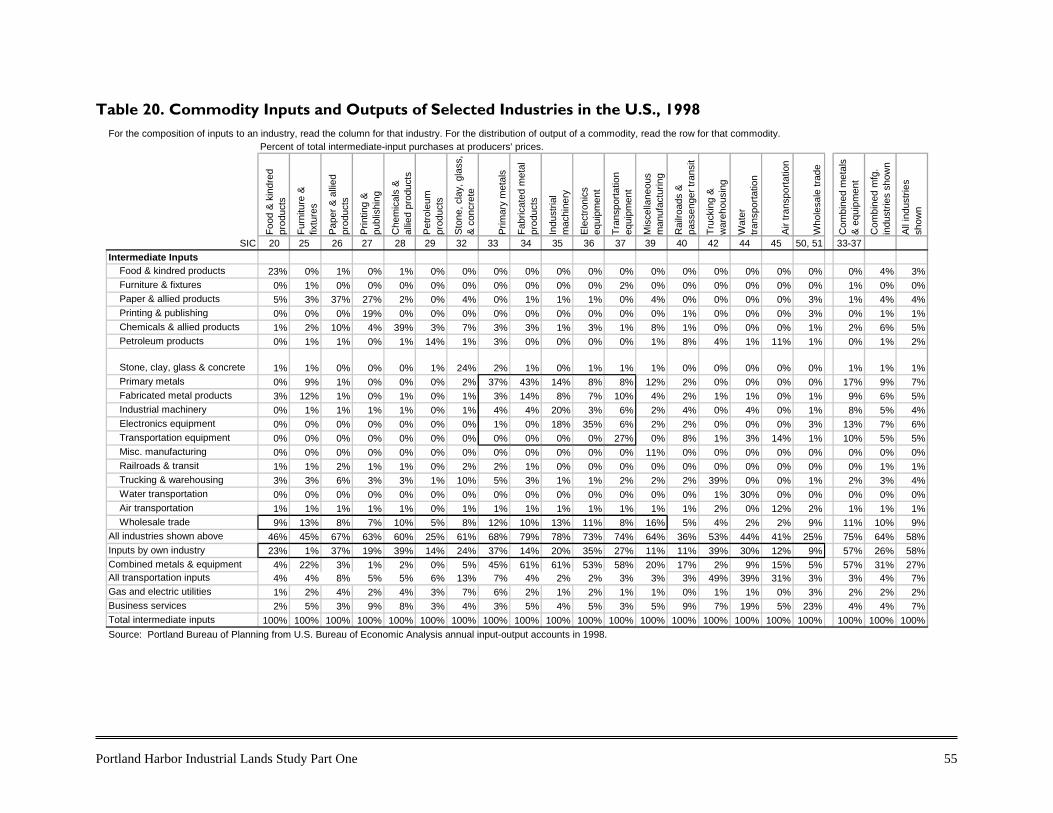
Portland Harbor Industrial Lands Study Part One 55
Table 20. Commodity Inputs and Outputs of Selected Industries in the U.S., 1998
For the composition of inputs to an industry, read the column for that industry. For the distribution of output of a commodity, read the row for that commodity. Percent of total intermediate-input purchases at producers' prices.
Food
& k
indr
ed
prod
ucts
Furn
iture
&
fixtu
res
Pape
r & a
llied
prod
ucts
Prin
ting
& pu
blis
hing
Che
mic
als
& al
lied
prod
ucts
Petro
leum
pr
oduc
ts
Ston
e, c
lay,
gla
ss,
& co
ncre
te
Prim
ary
met
als
Fabr
icat
ed m
etal
pr
oduc
ts
Indu
stria
l m
achi
nery
Elec
troni
cs
equi
pmen
t
Tran
spor
tatio
n eq
uipm
ent
Mis
cella
neou
s m
anuf
actu
ring
Rai
lroad
s &
pass
enge
r tra
nsit
Truc
king
&
war
ehou
sing
Wat
er
trans
porta
tion
Air t
rans
porta
tion
Who
lesa
le tr
ade
Com
bine
d m
etal
s &
equi
pmen
t
Com
bine
d m
fg.
indu
strie
s sh
own
All i
ndus
tries
sh
own
SIC 20 25 26 27 28 29 32 33 34 35 36 37 39 40 42 44 45 50, 51 33-37Intermediate Inputs Food & kindred products 23% 0% 1% 0% 1% 0% 0% 0% 0% 0% 0% 0% 0% 0% 0% 0% 0% 0% 0% 4% 3% Furniture & fixtures 0% 1% 0% 0% 0% 0% 0% 0% 0% 0% 0% 2% 0% 0% 0% 0% 0% 0% 1% 0% 0% Paper & allied products 5% 3% 37% 27% 2% 0% 4% 0% 1% 1% 1% 0% 4% 0% 0% 0% 0% 3% 1% 4% 4% Printing & publishing 0% 0% 0% 19% 0% 0% 0% 0% 0% 0% 0% 0% 0% 1% 0% 0% 0% 3% 0% 1% 1% Chemicals & allied products 1% 2% 10% 4% 39% 3% 7% 3% 3% 1% 3% 1% 8% 1% 0% 0% 0% 1% 2% 6% 5% Petroleum products 0% 1% 1% 0% 1% 14% 1% 3% 0% 0% 0% 0% 1% 8% 4% 1% 11% 1% 0% 1% 2%
Stone, clay, glass & concrete 1% 1% 0% 0% 0% 1% 24% 2% 1% 0% 1% 1% 1% 0% 0% 0% 0% 0% 1% 1% 1% Primary metals 0% 9% 1% 0% 0% 0% 2% 37% 43% 14% 8% 8% 12% 2% 0% 0% 0% 0% 17% 9% 7% Fabricated metal products 3% 12% 1% 0% 1% 0% 1% 3% 14% 8% 7% 10% 4% 2% 1% 1% 0% 1% 9% 6% 5% Industrial machinery 0% 1% 1% 1% 1% 0% 1% 4% 4% 20% 3% 6% 2% 4% 0% 4% 0% 1% 8% 5% 4% Electronics equipment 0% 0% 0% 0% 0% 0% 0% 1% 0% 18% 35% 6% 2% 2% 0% 0% 0% 3% 13% 7% 6% Transportation equipment 0% 0% 0% 0% 0% 0% 0% 0% 0% 0% 0% 27% 0% 8% 1% 3% 14% 1% 10% 5% 5% Misc. manufacturing 0% 0% 0% 0% 0% 0% 0% 0% 0% 0% 0% 0% 11% 0% 0% 0% 0% 0% 0% 0% 0% Railroads & transit 1% 1% 2% 1% 1% 0% 2% 2% 1% 0% 0% 0% 0% 0% 0% 0% 0% 0% 0% 1% 1% Trucking & warehousing 3% 3% 6% 3% 3% 1% 10% 5% 3% 1% 1% 2% 2% 2% 39% 0% 0% 1% 2% 3% 4% Water transportation 0% 0% 0% 0% 0% 0% 0% 0% 0% 0% 0% 0% 0% 0% 1% 30% 0% 0% 0% 0% 0% Air transportation 1% 1% 1% 1% 1% 0% 1% 1% 1% 1% 1% 1% 1% 1% 2% 0% 12% 2% 1% 1% 1% Wholesale trade 9% 13% 8% 7% 10% 5% 8% 12% 10% 13% 11% 8% 16% 5% 4% 2% 2% 9% 11% 10% 9%All industries shown above 46% 45% 67% 63% 60% 25% 61% 68% 79% 78% 73% 74% 64% 36% 53% 44% 41% 25% 75% 64% 58%Inputs by own industry 23% 1% 37% 19% 39% 14% 24% 37% 14% 20% 35% 27% 11% 11% 39% 30% 12% 9% 57% 26% 58%Combined metals & equipment 4% 22% 3% 1% 2% 0% 5% 45% 61% 61% 53% 58% 20% 17% 2% 9% 15% 5% 57% 31% 27%All transportation inputs 4% 4% 8% 5% 5% 6% 13% 7% 4% 2% 2% 3% 3% 3% 49% 39% 31% 3% 3% 4% 7%Gas and electric utilities 1% 2% 4% 2% 4% 3% 7% 6% 2% 1% 2% 1% 1% 0% 1% 1% 0% 3% 2% 2% 2%Business services 2% 5% 3% 9% 8% 3% 4% 3% 5% 4% 5% 3% 5% 9% 7% 19% 5% 23% 4% 4% 7%Total intermediate inputs 100% 100% 100% 100% 100% 100% 100% 100% 100% 100% 100% 100% 100% 100% 100% 100% 100% 100% 100% 100% 100%Source: Portland Bureau of Planning from U.S. Bureau of Economic Analysis annual input-output accounts in 1998.
56 Portland Harbor Industrial Lands Study Part One
each row shows a commodity’s distribution as output to other industries. The data source is theAnnual Input-Output Accounts of the U.S. Economy, 1998 (Planting and Kuhbach, 2001).Higher proportions in the table represent more significant trade linkages between firms andindustries. The highest shares of trade tend to be among firms in the same industry, anindication of “vertical disintegration.” Vertical disintegration is the dispersal of production tosubcontractors, suppliers, and services instead of production internally within verticallyintegrated firms. Higher shares of trade between industries can also be seen as a blurring ofindustry boundaries, showing that linked industries have interdependent roles in a largerproduction process.
The inter-firm and inter-industry production complexes evident in Table 20 have geographicimplications. As globalization of production has reduced the importance of proximity to marketsas an industrial location factor, it has increased the importance of access to inter-firm productioncomplexes and suitable labor markets. Industrial districts literature beginning in the 1980srecognized that localized clusters of firms in high tech, film, and other industries have emergedas a common competitive model of industrial organization, distinct from the “fordist” model ofmass-production in vertically integrated firms (Piore and Sabel, 1984; Storper and Walker,1989). Networks of firms with significant trade, competition, and cooperative relationships anda skilled labor pool combine to give firms in the cluster a competitive edge, or agglomerationeconomies. A key advantage results from an expansive industrialization process within thecluster, where competition drives innovation in new activities and technologies to continuallydevelop new products and split off new firms.
Industrial districts focused on localized linkages are only one form of the specialized industrialcomplexes that have driven growth in many second-tier cities such as Portland and Seattle(distinct from the largest metropolitan areas) in the last two decades (Markusen, et al., 1999).These complexes also include “hub-and-spoke” districts dominated by one or a few large firmswith significant inter-firm relationships in and outside the region (e.g., Boeing in Seattle);satellite industrial platforms made up primarily of branch plants with minimal intra-district trade;and state-anchored districts that develop around large universities, military bases, or similarinstitutions. The role of these clusters in regional economies is further discussed in last sectionof this chapter.
The existence of an integrated metals and equipment industries complex (primary metals,fabricated metal products, industrial machinery, electronics equipment, and transportationequipment) is suggested by their significant input-output relationships and their geographicclustering in the harbor area. In 1998, approximately 57 percent of the production inputs of the
The Portland area’s industry clusters in primary metals and transportation equipmentmanufacturing are part of a larger complex of metals and equipment industries withsignificant inter-industry linkages.
Agglomeration economies, evident in the geographic clustering of many industries in asmall number of locations, have been recognized in industrial location literature as asignificant location factor.
Portland Harbor Industrial Lands Study Part One 57
metals and equipment industries nationally was provided by other firms within that industrygroup, as shown in Table 20. For instance, the primary metals industry is a major supplier toeach of the others. In particular, 43 percent of the inputs to the fabricated metal productsindustry were from the primary metals industry. The transportation equipment industry is amajor consumer of output from each of the others. The industrial machinery and electronicsindustry are also major consumers of each other’s products and of fabricated metal products andprimary metals. The significant trade volumes between these industries appear to be consistentwith the substantial representation of each in the harbor area. As described in Chapter 1, themetals and equipment industries cluster in the harbor area in 2000 included 213 businessestablishments and 16,860 jobs. The presence of these firms, their skilled labor pool, establishednetworks of suppliers and customers, specialized infrastructure, and other inter-firm relationshipsare potentially significant location factors for the cluster’s continued growth.
Wholesale trade made up 10 percent of intermediate inputs into the combined manufacturingindustries shown in Table 20. Given the significance of these linkages, it is not surprising thatthe manufacturing industries that are highly concentrated in the harbor area tend also to havehigh concentrations of related wholesale trade (e.g., metals, transportation equipment, foodproducts, chemicals, and petroleum industries).
Transportation costs accounted for an additional 4 percent of intermediate inputs into thecombined manufacturing industries, the highest shares being 13 percent of inputs to thestone/clay/glass/concrete industries category, 8 percent to paper products, 7 percent to primarymetals, and 6 percent to petroleum products. These manufacturing industries with the highestshares of transportation costs nationally also have substantial presence of firms and employmentin the harbor area, benefiting from the area’s network of transportation infrastructure andfacilities.
Combining all of the industries shown in Table 20 that have substantial representation in theharbor area, 58 percent of their inputs are provided by other firms among those industries. Someindustries benefit more than others from location within diverse industrial districts.Transportation equipment, electronics equipment, fabricated metal products, and industrialmachinery manufacturers, on average, depend on the other industries shown in the table for morethan 70 percent of their inputs.
Central Urban LocationAs shown in Map 8, the harbor area is centrally located in the region and directly north ofdowntown Portland. Its central location provides both advantages and disadvantages forindustry.
The wholesale and manufacturing sectors have significant inter-industry tradelinkages.
Table 20 also shows the advantage of a diverse industrial district for inter-industrytrade.
58 Portland Harbor Industrial Lands Study Part One
Recent studies have highlighted the importance of suitable labor markets as a primary inter-regional location factor for manufacturing firms in the U.S. (Dumais, et al., 1997; PortlandDevelopment Commission, 2002). As technology and knowledge have become increasingfactors of industrial competitiveness, location of a firm in a place where skilled and professionallabor want to live has in turn become more important (Atkinson and Gottlieb, 2001). For largemanufacturing employers, labor access may also be an important intra-regional locationadvantage for the harbor area, drawing from its central access to the regional labor market,transit options, and the livability of Portland’s close-in neighborhoods. As housing costs inPortland have increased closer to the Central City, other locations in the region likely becomemore attractive to large employers of lower paid workers. However, the average employeeearnings in the local industrial sectors generally is much higher than the county average for allsectors, as shown in Table 23 below. The labor access advantage of a central location may bereduced over time by urban traffic congestion, although that reduction can potentially bemitigated by transit improvements in industrial areas.
Harbor area wholesalers that serve regional markets benefit from relative proximity to deliverydestinations across the region and central access to the region’s truck network. These proximity-to-market advantages for wholesale facilities are in addition to the freight hub advantagesdiscussed above, resulting from proximity to freight terminals (the primary freight entry pointsinto the region) and to related manufacturers. As with labor access benefits, the advantage of acentral regional location for wholesalers may be reduced over time by urban traffic congestion atparticular locations and peak periods.
Historical industrial development has been displaced from parts of the Central City toaccommodate highway construction (e.g., former Harbor Drive and I-5) and higher densitymixed-use development (e.g., Pearl District and North Macadam). Industrial Sanctuary zoning(discussed in Chapter 2) has been applied as a tool to prevent conversion of important industrialland to other uses. The Guild’s Lake Industrial Sanctuary Plan, adopted earlier this year,established the Vaughn Street corridor as an “iron curtain,” the northern boundary of CentralCity mixed-use development on the west side of the river.
Access to labor is a primary industrial location factor between regions. Within theregion, the harbor area offers central access to the metropolitan area labor supply.
For regional wholesaling and delivery facilities, the harbor area’s central location isalso a location advantage.
A central location can increase gentrification pressure to convert land to non-industrialuses that bring higher land values.
Portland Harbor Industrial Lands Study Part One 59
Regional Heavy Industrial Complex Conceptually, heavy industrial areas provide locations for industries with objectionable impactsand appearance, separated from other urban areas. Thus, maintaining an adequate supply ofheavy industrial land in suitable locations reduces their disturbance in the rest of the city. Theharbor area is one of the primary locations in the region for many uses that are typicallyperceived as heavy industrial, such as steel mills, heavy equipment manufacturing, petroleumbulk storage, chemicals manufacturing and distribution, utility yards, rail yards, and marineterminals. Also, most of the land in Portland with heavy industrial zoning is in the harbor area,and nearly all of the rest is adjacent, i.e., in the Columbia Corridor west of I-5. Metro’s 2040Growth Concept also designates other smaller heavy industrial areas in the region, including atHillsboro, Tualatin, Gresham, and Vancouver. Examples of objectionable impacts include use of hazardous materials, air pollution, waterpollution, scale of heavy equipment use, odors, noise, dust, and outdoor storage. An accountingof these impacts is not necessarily consistent with the types of industries and facilities that havehistorically been considered heavy industrial. The historical image of heavy industry as majorpolluters is less relevant today. Environmental regulations require control and filtering ofindustrial point sources of air and water pollution. For example, a large warehouse that wouldtypically be considered light industrial may generate more air pollution from truck exhaust than aheavy equipment factory with a regulated smokestack. Also, indiscriminate dumping practicesthat were historically common and contributed to many of today’s contaminated sites have beencurbed. There remains, nevertheless, a perhaps growing difference between general industrialareas that include traditional heavy industries and contemporary light industrial parkscharacterized by more flex office and retail space, minimal rail access, and more aesthetic designcontrol.
The Portland Zoning Code does distinguish between IH Heavy Industrial and IG GeneralIndustrial zones, and these two zones implement Portland’s Industrial Sanctuary policy. Most ofthe IH zoning is along the Willamette, and most of the Columbia Corridor and Central Eastsideare in IG zones. Nevertheless, both zones allow nearly all industrial uses, including smokestackindustries in IG zones. The essential use-related difference is that IH is more restrictive in theuse of hazardous substances. Specifically, packaged explosives are allowed in IH zones with ahazardous substances review and not allowed in IG; and flammable solids, irritating gases, and
“Heavy industrial” uses characterize the established land use pattern in most of theharbor area, and those lands are a substantial portion of the region’s heavy industrialland supply.
What constitutes heavy industry and heavy industrial areas, however, is imprecise andevolving.
Portland’s heavy industrial districts are more a result of practice than regulation.
60 Portland Harbor Industrial Lands Study Part One
combustible liquids in bulk form require a hazardous substances review in IG and not in IH.There are also some design standard differences between IH and IG zones regarding buildingsetbacks, lot coverage, and landscaping.
Emerging Environmental Challenges
• A six-mile segment of Portland Harbor was listed as a Superfund site in 2000. This projectaddresses contaminated in-water sediments and approximately 50 (as of 2002) upland siteinvestigation and clean-up projects. The multi-year Superfund project entails investigation,contamination source control, remedies to remove or isolate contaminants, restoration ofresulting natural resource damages, and assigning liability for project costs.
• Willamette River populations of Steelhead Trout and Chinook Salmon were listed (in 1998and 1999, respectively) as threatened under the Endangered Species Act (ESA). The Actrestricts, at both a programatic and case-by-case level, activities that have potential to harmthe fish or its habitat. The City of Portland is developing a comprehensive program torespond to the listings and assist with species recovery. Federal permitting of in-waterconstruction (e.g., harbor docks) and discharges also enforce ESA restrictions.
• Among its provisions, the Clean Water Act sets standards for point-source discharges intowaterways and stormwater discharges by jurisdictions with more than 50,000 people,enforced through NPDES (National Pollution Discharge Elimination System) permits.Section 303(d) of the Act also requires states to develop plans to reduce pollution in waterquality impaired streams, including the Lower Willamette River which is listed for mercury,bacteria, high temperature, and (near the McCormick & Baxter site in Portland Harbor) PCPand arsenic. The City of Portland is preparing watershed plans that will recommend ways toachieve compliance with both the Clean Water Act and Endangered Species Act.
• Oregon’s Statewide Planning Goal 5 requires local jurisdictions to inventory naturalresources, including riparian areas and wildlife habitat, and take steps to protect them. Whilemost jurisdictions have complied with Goal 5, Metro is currently developing a regionalinterpretation of Goal 5 with the fish and wildlife conservation element of Title 3 in itsFunctional Plan. Title 3 will set regional Goal 5 standards for natural resource protections,such as riparian setbacks.
These environmental initiatives have a wide range of potential implications for industrialoperations in the harbor area, including cost and allocation of liability for cleanup andrestoration, effect on available land for industrial expansion, disruption to current and futureindustrial operations, and the initiatives’ effects on timing of property investments.
The City of Portland is currently in the early stages of developing the Riverside Plan, an areaplan for the river corridor. Its products will include technical studies (including this document)and area-specific policies and recommended actions on land use and built form, transportation,recreation, economic development, and natural resources. Among the tasks of this planningeffort are to integrate ESA, Watershed Health, and Title 3 Goal 5 responses for the river corridorand develop a land-use framework for the Superfund project. Those tasks are part of a broader
Major environmental planning projects affecting the harbor area are underway thatimplement federal and state mandates.
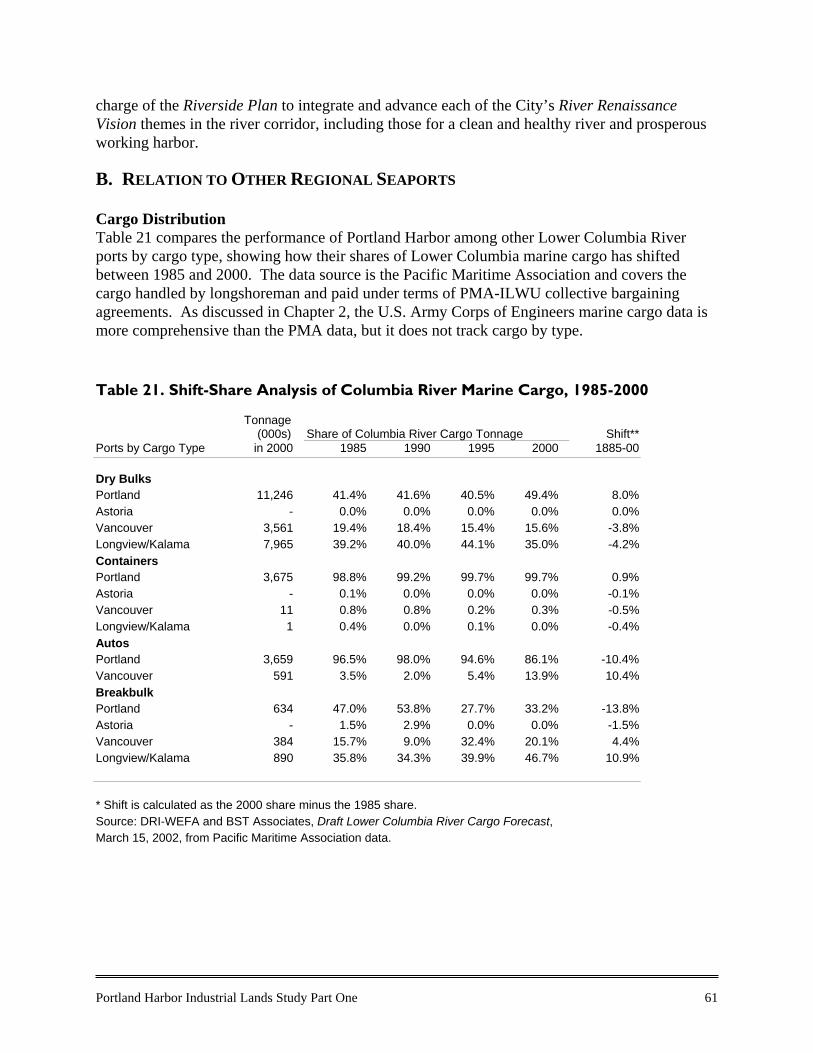
Portland Harbor Industrial Lands Study Part One 61
charge of the Riverside Plan to integrate and advance each of the City’s River RenaissanceVision themes in the river corridor, including those for a clean and healthy river and prosperousworking harbor.
B. RELATION TO OTHER REGIONAL SEAPORTS
Cargo DistributionTable 21 compares the performance of Portland Harbor among other Lower Columbia Riverports by cargo type, showing how their shares of Lower Columbia marine cargo has shiftedbetween 1985 and 2000. The data source is the Pacific Maritime Association and covers thecargo handled by longshoreman and paid under terms of PMA-ILWU collective bargainingagreements. As discussed in Chapter 2, the U.S. Army Corps of Engineers marine cargo data ismore comprehensive than the PMA data, but it does not track cargo by type.
Table 21. Shift-Share Analysis of Columbia River Marine Cargo, 1985-2000
Tonnage(000s) Share of Columbia River Cargo Tonnage Shift**
Ports by Cargo Type in 2000 1985 1990 1995 2000 1885-00
Dry BulksPortland 11,246 41.4% 41.6% 40.5% 49.4% 8.0%Astoria - 0.0% 0.0% 0.0% 0.0% 0.0%Vancouver 3,561 19.4% 18.4% 15.4% 15.6% -3.8%Longview/Kalama 7,965 39.2% 40.0% 44.1% 35.0% -4.2%ContainersPortland 3,675 98.8% 99.2% 99.7% 99.7% 0.9%Astoria - 0.1% 0.0% 0.0% 0.0% -0.1%Vancouver 11 0.8% 0.8% 0.2% 0.3% -0.5%Longview/Kalama 1 0.4% 0.0% 0.1% 0.0% -0.4%AutosPortland 3,659 96.5% 98.0% 94.6% 86.1% -10.4%Vancouver 591 3.5% 2.0% 5.4% 13.9% 10.4%BreakbulkPortland 634 47.0% 53.8% 27.7% 33.2% -13.8%Astoria - 1.5% 2.9% 0.0% 0.0% -1.5%Vancouver 384 15.7% 9.0% 32.4% 20.1% 4.4%Longview/Kalama 890 35.8% 34.3% 39.9% 46.7% 10.9%
* Shift is calculated as the 2000 share minus the 1985 share.Source: DRI-WEFA and BST Associates, Draft Lower Columbia River Cargo Forecast,March 15, 2002, from Pacific Maritime Association data.
62 Portland Harbor Industrial Lands Study Part One
A comparison of total marine cargo tonnage (short tons) handled in 2000 among the largest WestCoast seaports is as follows (U.S. Army Corps of Engineers, Waterborne Commerce of the U.S.;Vancouver B.C. data is from the Port of Vancouver website):
Vancouver, B.C. 84.4 million Puget Sound, WA Seattle 24.1 million Tacoma 22.3 million Anacortes 18.0 million Columbia River Portland, OR 34.3 million Portland, excluding internal barge activity 25.1 million Vancouver, WA 7.7 million Kalama, WA 5.8 million Longview, WA 4.1 million Bay Area, CA Richmond 19.5 million Oakland 12.2 million San Francisco 3.6 million Southern California Long Beach 70.2 million Los Angeles 48.2 million San Diego 3.7 million
The cargo and vessel mix of each of these ports varies widely. By tonnage, grain is the primarymarine cargo line in Portland, containers in Seattle and Tacoma, petroleum at Anacortes, andcoal in Vancouver BC. Of the 34.3 million tons of waterborne cargo handled at Portland Harborin 2000, 18.0 million tons (52 percent) was international cargo, 7.1 million tons (21 percent) wascoastwise cargo (primarily petroleum from Puget Sound refineries), and 9.3 million tons (27percent) was internal cargo carried by barge (see Table 14).
The primary deepwater ports on the Columbia River are Portland, Vancouver, Kalama, andLongview. Each abuts the deepwater (40 foot) channel, the Union Pacific and the BurlingtonNorthern Santa Fe main lines, and I-5. Astoria is also a deepwater port, but handled less thanone percent of the Columbia River marine cargo tonnage in 2000 (see Table 21) and does notabut I-5 or the UP or BNSF railroads. A comparison of total marine cargo tonnage (short tons)handled at the Columbia River deepwater ports in 2000 is as follows (U.S. Army Corps ofEngineers, Waterborne Commerce of the U.S.):
Portland Harbor is a major West Coast seaport, the fourth largest in total marine cargotonnage in 2000.
Portland terminals handled about two thirds of the total marine cargo tonnage of theColumbia River seaports in 2000.
Portland Harbor Industrial Lands Study Part One 63
Portland 34.3 million 66% Vancouver, WA 7.7 million 15% Longview, WA 4.1 million 8% Kalama, WA 5.8 million 11% Total 51.9 million 100%
Most of the cargo handled at each of the Columbia River seaports is for export. The primarymarine exports (by weight) are wheat, soda ash, and potash in Portland; wheat in Vancouver,wheat and corn in Kalama, and logs in Longview. As shown in Table 21, Portland handledabout 49 percent of the Columbia River dry bulk tonnage in 2000, up from 41 percent in 1995following construction of the Portland Bulk Terminal at T-5 (Port of Portland Terminal 5).Grain terminals operating include three in Portland (Columbia Grain at T-5 and Cargill andLouis Dreyfus in Lower Albina), two in Kalama (United Harvest and Kalama Export), and onein Vancouver (United Harvest). Portland’s share of Columbia River breakbulk cargo has fallen from 47 percent in 1985 to 33percent in 2000, as the cargo mix and location have shifted (BST and DRI-WEFA, 2002).Columbia River imports of breakbulk steel have increased from 276,100 metric tons in 1990 to1.2 million in 2000, at which time 52 percent was handled in Portland, 18 percent in Vancouver,25 percent in Kalama, and 5 percent in Longview. Breakbulk lumber exports and coastwiseshipments from the Columbia River plummeted from 350,500 metric tons in 1990 to 31,800 in2000, and 74 percent of the 1980 tonnage was shipped from Portland. Reductions in breakbulklumber exports are attributed to declines in regional production, shift to domestic markets, andconversion from breakbulk to container shipping. Columbia River exports of breakbulknewsprint, nearly all from the NORPAC mill in Longview, have grown from 247,200 metric tonsin 1990 to 367,000 in 2000. As Columbia River log exports have dropped from 1.7 million tonsin 1982 to 0.7 million in 2000, the share of log tonnage in Longview and Kalama has increasedfrom 68 percent in 1982 to 92 percent in 2000.
Available Land for River-Dependent Industry Table 22 presents a selective summary of available vacant and planned river industrial sites atPortland, Vancouver, Kalama, and Longview harbors. Specifically, the table includes sites thatare at least ten acres in size, have deepwater shipping channel access, and are owned by the Portsof Portland, Vancouver, Kalama, or Longview. The 10-acre and port-ownership criteria areintended to be indicators of suitability for marine cargo and marine industrial use. These criteriaresult in an incomplete summary of vacant land. For example, the 146 acres of available sites inPortland shown in Table 22 is less than half of the 310 acres of vacant riverfront land in thestudy area shown in Table 5. Other sites shown in Table 4 generally have constraints to currentavailability, including vacant portions of private sites held for future expansion, Superfundproject sites, and land with employment (not industrial) zoning. For reference, the 1,100-acreColumbia Gateway site planned by the Port of Vancouver and 750-acre West Hayden Island site
Portland Harbor currently competes with the other Columbia River seaports primarilyfor dry bulk and breakbulk cargo. Virtually all of the Columbia River container andpetroleum cargo and 86 percent of the automobile cargo were handled in Portland in2000.
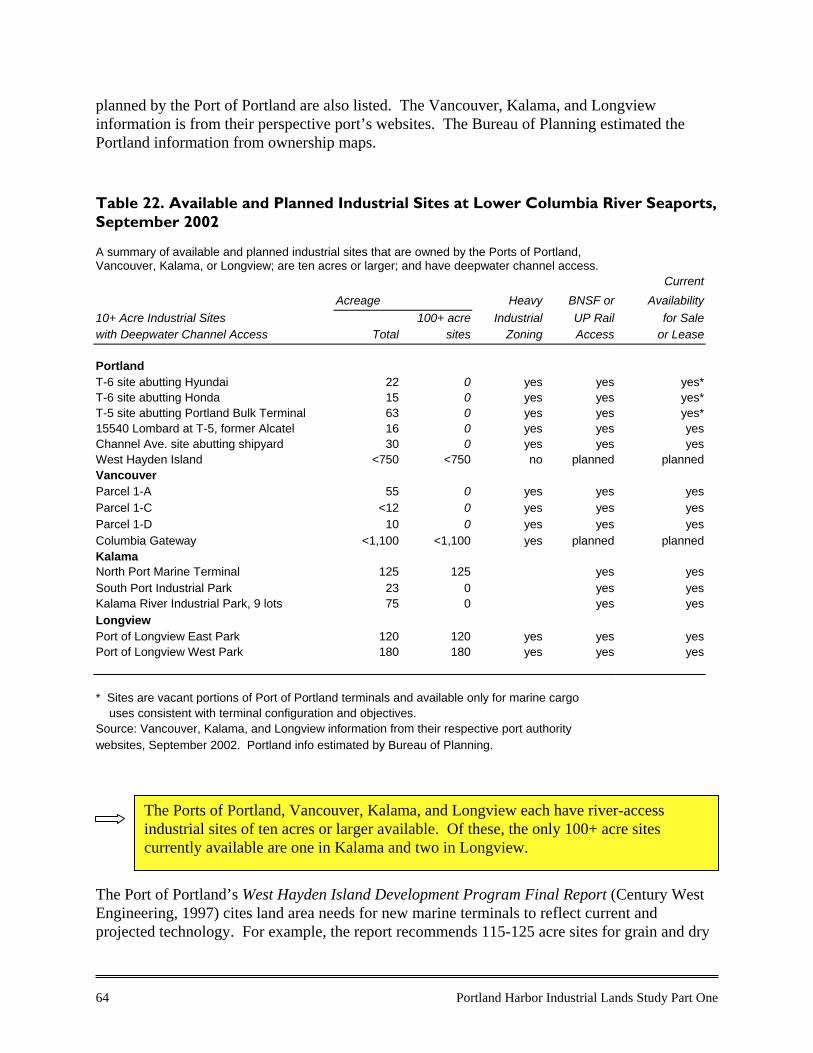
64 Portland Harbor Industrial Lands Study Part One
planned by the Port of Portland are also listed. The Vancouver, Kalama, and Longviewinformation is from their perspective port’s websites. The Bureau of Planning estimated thePortland information from ownership maps. Table 22. Available and Planned Industrial Sites at Lower Columbia River Seaports,September 2002 A summary of available and planned industrial sites that are owned by the Ports of Portland, Vancouver, Kalama, or Longview; are ten acres or larger; and have deepwater channel access. Current Acreage Heavy BNSF or Availability 10+ Acre Industrial Sites 100+ acre Industrial UP Rail for Sale with Deepwater Channel Access Total sites Zoning Access or Lease
Portland T-6 site abutting Hyundai 22 0 yes yes yes* T-6 site abutting Honda 15 0 yes yes yes* T-5 site abutting Portland Bulk Terminal 63 0 yes yes yes* 15540 Lombard at T-5, former Alcatel 16 0 yes yes yes Channel Ave. site abutting shipyard 30 0 yes yes yes West Hayden Island <750 <750 no planned planned Vancouver Parcel 1-A 55 0 yes yes yes Parcel 1-C <12 0 yes yes yes Parcel 1-D 10 0 yes yes yes Columbia Gateway <1,100 <1,100 yes planned planned Kalama North Port Marine Terminal 125 125 yes yes South Port Industrial Park 23 0 yes yes Kalama River Industrial Park, 9 lots 75 0 yes yes Longview Port of Longview East Park 120 120 yes yes yes Port of Longview West Park 180 180 yes yes yes * Sites are vacant portions of Port of Portland terminals and available only for marine cargo uses consistent with terminal configuration and objectives. Source: Vancouver, Kalama, and Longview information from their respective port authority websites, September 2002. Portland info estimated by Bureau of Planning. The Port of Portland’s West Hayden Island Development Program Final Report (Century WestEngineering, 1997) cites land area needs for new marine terminals to reflect current andprojected technology. For example, the report recommends 115-125 acre sites for grain and dry
The Ports of Portland, Vancouver, Kalama, and Longview each have river-accessindustrial sites of ten acres or larger available. Of these, the only 100+ acre sitescurrently available are one in Kalama and two in Longview.
Portland Harbor Industrial Lands Study Part One 65
bulk terminals, to accommodate a rail loop, and 50-100 acre sites for auto and containerterminals, to provide adequate yard storage area. Land requirements for river-dependentmanufacturing, warehouse, and industrial service facilities are more varied. There are manyexisting river-dependent industrial sites on Portland Harbor in the 5-50 acre range. The onlyvacant site with more than 100 acres along Portland Harbor is West Hayden Island, and onlythree sites have more than 50 acres—at T-5 and the former McCormick & Baxter and Atofinasites. The 63-acre vacant portion of T-5 is primarily within the Portland Bulk Terminal rail loopand its use is probably limited to that facility’s expansion or a compatible mineral bulk terminal.The approximately 50-acre McCormick & Baxter site and 60-acre Atofina site are part of theharbor Superfund project. As such, they are not currently available for reuse and havesignificant cleanup liability constraints. The McCormick & Baxter site also has marginal truckaccess over residential streets and requires major access improvements. The Port of Portland’sMarine Terminals Master Plan process underway has also proposed alternatives foraccommodation of new grain, dry bulk, auto, and container facilities through redevelopment,consolidation, or relocation of facilities within the existing terminal sites. In 1960, the Port of Portland purchased 2,700 acres in the Rivergate Industrial District forindustrial development. Most of that land is now in industrial use. In 2000, only 381 acres ofRivergate land was still vacant in the study area, which includes most of Rivergate. In acomparable strategy, the Port of Portland purchased approximately 734 acres on West HaydenIsland, which is being held in reserve for future marine terminal development when the marketwarrants. The West Hayden Island Development Program Final Report (Century WestEngineering, 1997) proposes a flexible 556-acre development area for grain, mineral bulk, andcontainer facilities and a 269-acre open space area for wetland and shallow water habitat. The Port of Vancouver has recently prepared a draft environmental impact statement for asubarea plan to develop Columbia Gateway. The alternatives propose 504-720 acres ofindustrial development on the 1,094-acre site, including 152-504 acres of water-dependentindustry and 242-326 acres of mitigation open space. Both the West Hayden Island andColumbia Gateway are in the 100-year floodplain and their development would require extensivefill to a suitable elevation on developed portions of the site.
C. REGIONAL ECONOMIC ROLE OF HARBOR AREA
Role of the Harbor Area’s Traded Sectors A region’s economic growth or contraction in the long run tends to be tied to the performance ofits “traded sectors.” Traded sectors are those that compete across regions in national andinternational markets. Michael Porter (2000; 2002) has broadly applied the concept of clusteringas an explanation of regional economic structure. He has found that traded sectors tend toconcentrate in a small number of locations, where agglomeration economies provide acompetitive advantage in national and international markets. These industries tend to be theengines of regional economic competitiveness and generate high wage jobs through productivitygrowth. In the Regional Connections Project (1999), the Institute of Portland Metropolitan
The Ports of Portland and Vancouver also own large undeveloped sites planned forfuture industrial use—West Hayden Island and Columbia Gateway.
66 Portland Harbor Industrial Lands Study Part One
Studies similarly explains Portland’s recent growth as largely the result of expansion in a fewtraded clusters (identified by higher location quotients, number of employees, and growth rates). Traded clusters with the highest employment in the Portland-Vancouver PMSA in 1999 were asfollows, in descending order (Porter, 2002). Those concentrated in the harbor area (havinglocation quotients above 3 in the harbor area relative to the PMSA) are shown in bold text:
Business services Information technology Education and knowledge creation Distribution services Financial services Transportation and logistics Heavy construction services Tourism and hospitality Metal manufacturing Analytical instruments Processed food Motor vehicles Medical devices Publishing and printing Forest products
Regional Multiplier Effects of Harbor Area Jobs Table 23 shows the multiplier effects of harbor area jobs in 2000 on employment and income inthe Portland-Vancouver PMSA. The output associated with each job in the harbor areaindirectly generates additional jobs and resulting earnings in the region, called multiplier effects.The employment multipliers used in the table account for the sum of (1) the “direct” employmentat business establishments in the harbor area; (2) the “induced” employment resulting frompurchases by harbor area employees of goods and services in the region; and (3) the “indirect”employment resulting from purchases of intermediate inputs by harbor area firms from otherfirms in the region. Industries that pay higher wages and salaries and that purchase moreintermediate inputs in the region for a given level of output have higher multipliers. The U.S.Bureau of Economic Analysis calculated the multipliers used in the table through the RegionalInput-Output Modeling System (RIMSII) applied to the Portland-Vancouver PMSA.
Most of the Portland area’s traded clusters with the highest levels of employment arethe types of land uses that locate in industrial districts. Some of these clusters areconcentrated in the harbor area.
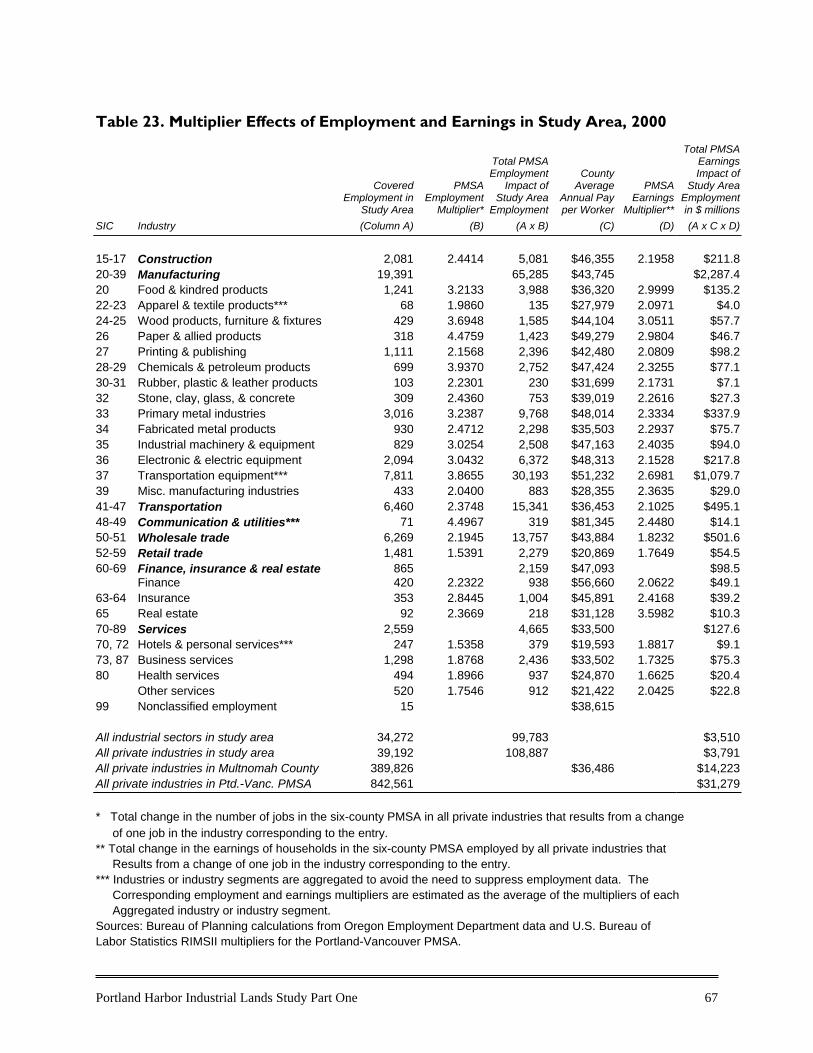
Portland Harbor Industrial Lands Study Part One 67
Table 23. Multiplier Effects of Employment and Earnings in Study Area, 2000
CoveredEmployment in
Study Area
PMSAEmployment
Multiplier*
Total PMSAEmployment
Impact ofStudy Area
Employment
CountyAverage
Annual Payper Worker
PMSAEarnings
Multiplier**
Total PMSA
EarningsImpact of
Study AreaEmploymentin $ millions
SIC Industry (Column A) (B) (A x B) (C) (D) (A x C x D) 15-17 Construction 2,081 2.4414 5,081 $46,355 2.1958 $211.8 20-39 Manufacturing 19,391 65,285 $43,745 $2,287.4 20 Food & kindred products 1,241 3.2133 3,988 $36,320 2.9999 $135.2 22-23 Apparel & textile products*** 68 1.9860 135 $27,979 2.0971 $4.0 24-25 Wood products, furniture & fixtures 429 3.6948 1,585 $44,104 3.0511 $57.7 26 Paper & allied products 318 4.4759 1,423 $49,279 2.9804 $46.7 27 Printing & publishing 1,111 2.1568 2,396 $42,480 2.0809 $98.2 28-29 Chemicals & petroleum products 699 3.9370 2,752 $47,424 2.3255 $77.1 30-31 Rubber, plastic & leather products 103 2.2301 230 $31,699 2.1731 $7.1 32 Stone, clay, glass, & concrete 309 2.4360 753 $39,019 2.2616 $27.3 33 Primary metal industries 3,016 3.2387 9,768 $48,014 2.3334 $337.9 34 Fabricated metal products 930 2.4712 2,298 $35,503 2.2937 $75.7 35 Industrial machinery & equipment 829 3.0254 2,508 $47,163 2.4035 $94.0 36 Electronic & electric equipment 2,094 3.0432 6,372 $48,313 2.1528 $217.8 37 Transportation equipment*** 7,811 3.8655 30,193 $51,232 2.6981 $1,079.7 39 Misc. manufacturing industries 433 2.0400 883 $28,355 2.3635 $29.0 41-47 Transportation 6,460 2.3748 15,341 $36,453 2.1025 $495.1 48-49 Communication & utilities*** 71 4.4967 319 $81,345 2.4480 $14.1 50-51 Wholesale trade 6,269 2.1945 13,757 $43,884 1.8232 $501.6 52-59 Retail trade 1,481 1.5391 2,279 $20,869 1.7649 $54.5 60-69 Finance, insurance & real estate 865 2,159 $47,093 $98.5 Finance 420 2.2322 938 $56,660 2.0622 $49.1 63-64 Insurance 353 2.8445 1,004 $45,891 2.4168 $39.2 65 Real estate 92 2.3669 218 $31,128 3.5982 $10.3 70-89 Services 2,559 4,665 $33,500 $127.6 70, 72 Hotels & personal services*** 247 1.5358 379 $19,593 1.8817 $9.1 73, 87 Business services 1,298 1.8768 2,436 $33,502 1.7325 $75.3 80 Health services 494 1.8966 937 $24,870 1.6625 $20.4 Other services 520 1.7546 912 $21,422 2.0425 $22.8 99 Nonclassified employment 15 $38,615 All industrial sectors in study area 34,272 99,783 $3,510 All private industries in study area 39,192 108,887 $3,791 All private industries in Multnomah County 389,826 $36,486 $14,223 All private industries in Ptd.-Vanc. PMSA 842,561 $31,279
* Total change in the number of jobs in the six-county PMSA in all private industries that results from a change of one job in the industry corresponding to the entry. ** Total change in the earnings of households in the six-county PMSA employed by all private industries that Results from a change of one job in the industry corresponding to the entry. *** Industries or industry segments are aggregated to avoid the need to suppress employment data. The Corresponding employment and earnings multipliers are estimated as the average of the multipliers of each Aggregated industry or industry segment. Sources: Bureau of Planning calculations from Oregon Employment Department data and U.S. Bureau of Labor Statistics RIMSII multipliers for the Portland-Vancouver PMSA.
68 Portland Harbor Industrial Lands Study Part One
The multipliers are based on the 1992 benchmark input-output accounts for the U.S. economyand 1997 regional location quotients. This regional employment impact accounts for direct, induced, and indirect employment effects.In 2000, the output of industrial firms that employed 34, 300 workers in the harbor areagenerated 99,800 jobs in the Portland-Vancouver PMSA. In comparison, Multnomah Countyhad 390,000 private sector jobs in 2000, and the Portland-Vancouver PMSA had 843,000. Theregional employment impact of the transportation equipment manufacturing firms in the harborarea was 30,200 jobs; the primary metals manufacturing firms, 9,800 jobs; the transportation andwholesale firms, 29,100 jobs. Industrial sectors continue to pay employee earnings that are significantly above the average ofall sectors in Multnomah County. In 2000, the ratio of average annual employee earnings in theindustrial sectors to the county average of all sectors was as follows:
Employee earnings ratio
Construction 127% Manufacturing 120% Transportation 100% Communication & utilities 223% Wholesale 120%
While the employee earnings ratio for the transportation sector is the same as the county averageof all sectors, the ratio for the water transportation industry specifically is 143 percent.
Employment and Income Benefits of Maritime Activity Martin Associates (2001) calculated these economic impacts. The estimated 21,364 jobs thatdepend on maritime activity include 7,189 direct jobs involved in the harbor’s maritimeoperations, 4,222 induced jobs from local purchases made by those directly employed as a resultof port activity, and 9,953 indirect jobs from local purchases by firms directly dependent on port
The industrial firms in the harbor area generated $3.5 billion of employee earnings inthe Portland Vancouver region in 2000, which is 11 percent of the total regionalpayroll of private firms.
Maritime activity at Portland Harbor generated 21,364 jobs and $970 million ofresulting employee earnings in 2000.
Overall, the industrial firms operating in the harbor area generated approximately oneout of eight jobs in the Portland-Vancouver region in 2000, taking into account themultiplier effects of regional purchases by harbor area firms and employees.
Portland Harbor Industrial Lands Study Part One 69
activity. In addition to these jobs that are dependent on maritime activity, there are another52,233 “influenced” jobs with Oregon manufacturers and agricultural producers that export orimport cargo through Portland Harbor, primarily through the container terminal at T-6. Theseimpacts were estimated for the year 2000. Employment impacts have likely reduced since 2000as cargo tonnage has declined (e.g., grain, containers, alumina, and salt). The direct employment includes 2,870 jobs in the maritime services sector; 1,793 trucking andrailroad jobs involved in moving cargo to and from port terminals; 2,340 jobs at port-dependentmanufacturers (shippers) located on or near the harbor; 166 jobs in the Port of Portland marineand dredge operations; and 50 jobs in banking, insurance, and legal services related to porttransactions. Of this direct employment, an estimated 1,234 jobs were attributable to containercargo, 759 jobs to petroleum cargo, 740 jobs to breakbulk, 700 jobs to alumina, 686 jobs to sandand gravel, 659 jobs to grain, 583 jobs to autos, and the rest to various other commodities insmaller amounts. Virtually all of the direct employment occurred in Oregon or Washington, and81 percent in the Portland-Vancouver PMSA.
Regional Transportation Costs and Access HDR Engineering (2000) calculated these transportation cost savings, representing the differencebetween existing transportation costs and hypothetical costs in the absence of Portland’scontainer service. Approximately $17.9 million of the estimated savings accrued to shippers ofgrain, seed, fruit, and hay; $11.2 million to wood products shippers; $8.4 million to paper andpaperboard shippers; $6.1 million to vegetables shippers; $5.0 million to wood pulp and wastepaper shippers; and the rest to shippers of other commodities. An estimated 79 percent of thesavings was for export cargo and 21 percent for imports. Portland’s container market area,where exporters and importers benefit from these cost savings, includes Oregon and parts ofWashington, Idaho, and Montana. About two thirds of the savings resulted from cargo shipped through T-6, and one third resultedfrom competitively lowered rates by ocean carriers for regional commodities handled at othercontainer ports. In other words, to compete for cargo originating in Portland’s container marketarea, ocean carriers calling on Seattle, Tacoma, and Oakland container facilities essentiallyabsorb the rail or truck drayage costs from Portland to these other ports. Port of Portland staff have estimated that shipper savings has likely declined to between $54million and $58 million since 2000, due to reduced inland transportation rates. Regional exporters and consumers also accrue transportation cost savings from access toPortland’s bulk, breakbulk and auto terminals, as well as its rail, barge, truck, and air freightfacilities. Savings result from modal options within a distribution hub, which enable shippers tomanage their supply chain transactions to increase productivity. Modal options also increasetransportation system reliability, providing a relative cushion against shocks. For example, after
Shippers in the Pacific Northwest saved $67.9 million per year in transportation costs asa result of Portland’s container terminal at T-6.

70 Portland Harbor Industrial Lands Study Part One
the explosion of the Olympic pipeline, which supplied most of Oregon’s gasoline and diesel,Portland Harbor’s petroleum tanker volume more than tripled between 1998 and 1999 to meetthe demand. As the global marketplace continues to become more integrated, using thedistribution sector as a tool to increase productivity, exporters and consumers will be primarybeneficiaries of those changes.
Portland Harbor Industrial Lands Study Part One 71
BIBLIOGRAPHY Bureau of Economic Analysis, U.S. Department of Commerce. 1999. Regional Input-Output
Multipliers for the Portland Vancouver PMSA. Washington, D.C.: U.S. GovernmentPrinting Office.
Bureau of Planning, City of Portland, Oregon. 1991. Portland Zoning Code. Portland, Oregon. Bureau of Planning, City of Portland, Oregon. 2001a. McCormick & Baxter Reuse Assessment.
Portland, Oregon. Bureau of Planning, City of Portland, Oregon. 2001b. Guild’s Lake Industrial Sanctuary Plan.
Portland, Oregon. Century West Engineering, et al., prepared for Port of Portland. 1997. West Hayden Island
Development Program: Final Report. Portland, Oregon. CH2MHill, BRW, VZM, Intergraph Corporation, Gene Leverton, and Jeanne Lawson &
Associates. 1997. Oregon’s Intermodal Management System. Portland, Oregon. Columbia River Economic Development Council. 2000. “Report to Clark County on Current
Industrial Land Inventory.” Vancouver, Washington. Custred, M. 1998. “Alternative Analysis of Terminal Facilities in the Portland Harbor,”
Master’s Field Paper. Portland State University: Portland, Oregon. DRI-WEFA and BST Associates. 2002. Lower Columbia River Marine Cargo Forecast.
Portland, Oregon. HDR Engineering, Inc., and John Martin & Associates. 2000. Port of Portland Marine
Economic Impact Study: Container Transportation Cost-Benefit Analysis. Portland, Oregon. Holmes, J. 1986. The Organizational and Locational Structure of Production Subcontracting.
In Production, Work, Territory, eds. Scott, A., and M. Storper. Boston: Allen & Unwin, 80-106.
ICF Kaiser, Columbus Group, Reebie Associates, WEFA Group, and Port of Portland. 1999.
Commodity Flow Analysis for the Portland Metropolitan Area. Portland, Oregon. Institute of Portland Metropolitan Studies, Portland State University. 1999. “Progress of a
Region: The Metropolitan Portland Economy in the 1990s,” Regional Connections ProjectTechnical Report. Portland, Oregon.
Markusen, A., Y.-S. Lee, and S. DiGiovanna. 1999. Second Tier Cities: Rapid Growth Beyond
the Metropolis. Minneapolis, Minnesota: University of Minnesota Press.
72 Portland Harbor Industrial Lands Study Part One
Martin Associates. 2001. The Local and Regional Economic Impacts of the Portland Harbor.Lancaster, Pennsylvania.
Merchants Exchange, Columbia Snake River Marketing Group. 2001. The Great Waterway:
The Guide to Marine Facilities and Industrial Properties on the Columbia Snake RiverSystem. Vancouver, Washington.
Metro. 2000. 2000 Regional Transportation Plan. Portland, Oregon. Metro. 2002a. “Economic Report to the Metro Council: Draft 2000-2030 Regional Forecast.”
Portland, Oregon. Metro. 2002b. “2002-2022 Urban Growth Report: An Employment Land Need Analysis.”Portland, Oregon. Office of Economic Analysis, Department of Administrative Services, State of Oregon. 2001.
“Economic and Revenue Forecast, September 2001.” Salem, Oregon. Oregon Employment Department. 2002. “Covered Employment and Payroll.” Salem, Oregon. Otak, Inc., Hammer Siler George Associates, and Golder Associates. 1999. Regional Industrial
Lands Study for the Portland-Vancouver Metropolitan Area. Portland, Oregon. Otak, Inc., ECONorthwest, Parametrix. 2001. Phase 3: Regional Industrial Lands Study for the
Portland-Vancouver Metropolitan Area. Portland, Oregon. Piore, M., and C. Sabel. 1984. The Second Industrial Divide. New York: Basic Books. Planting, M., and P. Kuhbach. 2001. “Annual Input-Output Accounts of the U.S. Economy,
1998.” Survey of Current Business, December: 41-70. Washington, D.C.: U.S. GovernmentPrinting Office.
Port of Portland. 1991. Marine Terminals Master Plan: 1991 Update. Portland, Oregon. Port of Portland. 1998. 1997 Portland Harbor Land Use Inventory. Portland, Oregon. Port of Portland. 2000. 2000 Traffic Monitoring Program. Portland, Oregon. Porter, M. 2000. “Location, Competition, and Economic Development: Clusters in a Global
Economy.” Economic Development Quarterly 14, no. 1: 15-34. Porter, M. 2002. “Oregon: Profile of the State Economy.” Institute for Strategy and
Competitiveness, Harvard Business School: Cambridge, Massachusetts. Portland Development Commission. 2002. Draft Economic Development Strategy for the City
of Portland. “Location Factors by Sector” and other appendices. Portland, Oregon.
Portland Harbor Industrial Lands Study Part One 73
Portland/Vancouver I-5 Transportation and Trade Partnership. 2002. Final Strategic Plan.
Portland, Oregon. Slyman, P. 1996. “Oregon’s Oil: A Geographic View of Petroleum Distribution and Associated
Risks,” Master’s Thesis. Portland State University: Portland, Oregon. Storper, M. 1997. The Regional World: Territorial Development in a Global Economy. New
York: Guilford. Storper, M., and R. Walker. 1989. The Capitalist Imperative: Territory, Technology, and
Industrial Growth. Oxford, UK: Basil Blackwell. U.S. Army Corps of Engineers. 2001. Waterborne Commerce of the U.S. Washington, D.C.:U.S. Government Printing Office.
PORTLAND HARBOR
INDUSTRIAL LANDS STUDY
Part Two: Interviews and Analysis
February 2003
Prepared by:
City of PortlandBureau of Planning
Portland Development Commission
Port of Portland
For more information on the Portland Harbor Industrial Lands Study, please contact
Steve Kountz, Senior Planner, Project ManagerPortland Bureau of Planning1900 SW 4th Avenue, Suite 4100Portland, OR 97201Phone: 503-823-4551Fax: 503-823-7800TDD: 503-823-6868
This report is available atwww.planning.ci.portland.or.us
To help ensure equal access to information, the City of PortlandBureau of Planning offers accommodation to persons withdisabilities. Call 503-823-7700 in advance to arrangeaccommodation.
Portland Harbor Industrial Lands StudyPart Two: Interviews and Analysis
Prepared for:
City of Portland Bureau of PlanningPortland Development Commission
Port of Portland
Prepared by:
E.D. Hovee & CompanyP.O. Box 225
951 Officers RowVancouver, Washington 98666
(360) 696-9870
In Cooperation With:
Parsons BrinckerhoffThe J. D. White Company, Inc.
February 2003

E.D. Hovee & Company
Portland Harbor Industrial Lands Study Part Two Page i
EXECUTIVE SUMMARY
The Portland Harbor Industrial Lands Study (PHILS) assesses the future land needs of industriesin the Portland Harbor area, focusing on river-dependent, freight-related, and other concentratedindustries in this area. The study has been prepared for the City of Portland Bureau of Planning,Portland Development Commission, and Port of Portland.
This Part Two study draws from a series of 80 in-depth personal interviews conducted withharbor area industry leaders, two focus groups and additional input-output economic analysis.The results are intended to supplement Part One employment and land use analysis conducted bythe Bureau of Planning.
What follows is a summary of major observations focused primarily on this Part Two PHILSassessment.
PART ONE PHILS SUMMARY
The Bureau of Planning’s Part One report reviews employment and land use trends over the last20 years from within the Portland metropolitan area. A summary of results and implications fromthe Part One study pertinent to the Part Two analysis follows:
• Approximately 940 private sector businesses are located within the Portland Harbor area,employing nearly 39,200 workers or one in eleven jobs in Multnomah County. Half ofthe study area’s workers are employed by manufacturers, with another one-third indistribution (transportation and wholesale sectors).
• Portland’s share of the nation’s manufacturing base is increasing even as manufacturingrepresents a smaller component of the nation’s total employment base. Much of theregion’s heavy manufacturing base and its core transportation infrastructure is centeredon the harbor industrial area. Nearly 65% of the harbor study area’s future employmentgrowth has been forecast to occur within the Rivergate area.
• U.S. maritime employment is declining as marine terminal operations have become lesslabor intensive and offshore competition has grown. However, Portland’s harbor area isthe center of the region’s and state’s competitive maritime industry – with competitiveniches as a major west coast center for auto imports, grain and dry bulk exports andspecialty container activity.
• Industrial sites within the Portland Harbor area vary widely in size. The median propertysize is 2.2 acres. However, the large industrial sites within the study area bring averagesite size up to 8 acres. Average employment density is 8.1 jobs per acre withmanufacturing having the highest employment density at 12.4 workers per acre.
• The Portland Harbor area comprises over 5,532 acres of industrial land (excluding rights-of-way) – or nearly one-third of the City’s industrial land base. As of July 2000, 543acres (or 10%) were vacant Tier A/B lands. (Metro classifies undeveloped, unconstrainedland over 1 acre Tier A; Tier B is comprised of undeveloped land with some constraints –including land banked sites – over 2 acres). Only 33 acres are free of constraints (Tier A).Over one-half of the vacant land is located in Rivergate.
E.D. Hovee & Company
Portland Harbor Industrial Lands Study Part Two Page ii
In short, Portland’s harbor is Oregon’s freight transportation hub, connecting the seaport withregional barge routes, interstate highways, and transcontinental railroads. It is also in closeproximity to Portland International Airport. There is no similar place in Oregon with thisconfluence of significant intermodal transportation facilities – nor is there any expectation that asimilar transportation hub will be developed elsewhere in the state for the foreseeable future.
The Part One Bureau of Planning research raised two central questions for Portland’s harborindustrial area. Simply stated, those questions are: Will Portland’s harbor area continue as thefocus for the region’s maritime and heavy manufacturing activities? Or, is the harbor areatransitioning to a different and as yet undefined future? Part Two industry interviews areintended to provide an initial framework within which these questions can be addressed.
PART TWO INDUSTRY INTERVIEWS
The consultant team interviewed a selected target group of 80 business leaders within thePortland harbor industrial study area. Information obtained from the interviews provides bothfactual information and opinions into the public policy and economic issues affecting areaindustries:
• Industries in the Portland Harbor area can be divided into two distinct groups: a) river-dependent uses encompassing aggregate firms, marine terminals, and supporting marineservices, and b) other non-marine or non-river dependent firms including manufacturing,wholesale/distribution and land-holding activities.The manufacturing grouping is represented by seven industry clusters that comprisechemicals, electronics, food-related, metals, printing/publishing, transportationmanufacturing, and specialty manufacturing industries. Wholesale/distribution includesdistribution centers, distribution service providers, recycling, and wholesalers.
• The firms interviewed employ almost 13,000 full and part-time workers. Themanufacturing sector employs the largest number (70%) of workers. River-dependentemployers provide another 16% of the jobs, followed by wholesale distribution at 14%.The more than 12,500 full-time employees for the firms interviewed represent 32% of the39,200 jobs in Portland’s harbor industrial area.
In addition to the firm interviews, two focus group discussions were conducted during September2002. The groups were convened to: (a) present and discuss results of what was learned from theindustry interviews and associated analysis; and (b) identify potential policy implications forWillamette River planning initiatives.
Results of both the interview and focus group research have been organized around four majorquestions – which also serve as a basis for discussion of potentially important policy questionsand options. Responses to these questions – as stated by interview and focus group participants –are summarized as follows:
E.D. Hovee & Company
Portland Harbor Industrial Lands Study Part Two Page iii
1. What are the Major Trends & Issues Affecting Prospects for Portland’s Harbor AreaIndustries?
• Business activity is expected to be stable through the recession but limited job growth isanticipated with economic recovery.
• Even with expansion, existing medium-larger firms anticipate minimal need for addedindustrial land.
• Remaining cost competitive emerges as the #1 issue for harbor area firms – extendingbeyond the current economic downturn. This is in part due to the growing perception ofPortland as a high cost place to do business.
• Many long time manufacturers will reinvent their business model and operations over thenext 10-20 years – to remain competitive domestically and globally.
• Local issues affecting business investment are noted as including:
Superfund uncertainty & competitive multi-modal transport – for riverfrontowners.
Regional congestion (freight/employee), non-industrial encroachment, permitting,public policy & community support – for riverfront and upland firms.
2. Will the Mix of Harbor Industries Change?
Both current conditions and the outlook vary depending on the industry grouping considered:
• River-Dependent – need multi modal access including 20+ foot depth for barges, 30-40+ foot for deep draft vessels. These firms serve as suppliers and transporters to theentire metro area and state. Little near-term expansion is anticipated except for autoimports.
• Wholesale Distribution – separated between (a) serving Central City and metro areafrom a central location and (b) markets beyond the metro area. Firms that serve thelocal market likely will continue to value a harbor area location; demand for firmsserving a regional or national market is more uncertain depending on comparativecosts of business and intermodal transport accessibility.
• Manufacturing: Chemicals & electronics – tend to be suppliers to the region’s industrial base; a
central harbor-area location with in-place capital investment remains important. Printing/publishing – have and will continue to value Central City proximity and
interaction though the industry is rapidly becoming more global. Metals & transportation – significant inter-industry linkages are led by
Freightliner, Esco, Oregon Steel, and Gunderson, firms that are also associatedwith growth prospects for a wide array of additional support businesses.
Mid/large manufacturer land needs are expected to be relatively modest; growthneeds are linked to the desire or capacity to accommodate smaller firms. Growth willoccur within existing operations before plant expansion is considered.
E.D. Hovee & Company
Portland Harbor Industrial Lands Study Part Two Page iv
• Other Sectors Potentially Suited to Harbor Area – sectors with a potential (but notcurrent) harbor presence include:
High tech/bio tech Creative services/information technology Wood/plastics/fiber materials Corporate headquarters & business parks
3. What are the Needs & Issues Facing River-Dependent Industries & Sites?
• From existing operations, greatest demand (for 100+ acres) is indicated by marineterminals (notably auto importers).
• Approximately 9% of 3,130 acres of riverfront property is classified as vacant (andwithin the top two tiers of the 2000 Buildable Land Inventory) by Metro.
• Only 153 acres of Tier A/B vacant riverfront land are situated north of the St. JohnsBridge.
• A site constraints evaluation has focused on threshold criteria of appropriate zoning andminimum depth barge access. Other criteria considered include deep draft shipping,rail/street access, lot depth, environmental contamination, compatible neighbors,wetlands, trail easements, flood plain, and scenic overlay.
• Capital investment for riverfront and related sites may be deferred pending Superfundresolution.
• Harbor area firms express interest in reserving riverfront sites for industrial use – whethermarine dependent or not.
• Reserving riverfront land for future generations’ industrial use also is an expressed orimplied interest for a number of firms – even if demand for added riverfront activity isnot readily foreseeable today.
4. What are the Needs & Issues Facing Upland Industries & Sites?
• There appears to be a general consensus to continue exclusion of residential and largescale commercial from the industrial sanctuary.
• Less agreement is evident on how broadly “industrial” should be construed withpotential flexibility for:
Corporate office Support retail/service Creative services/information technology Business park/flex space
• Priority emphasis is desired by firms throughout the harbor area for roadwayimprovements for freight and employee commutes.
• Some shift from manufacturing to transportation dependent firms is expected, particularlyif major manufacturing anchors downsize or terminate Portland operations.
• There is strong interest in improved transit – including service for shift workers.
E.D. Hovee & Company
Portland Harbor Industrial Lands Study Part Two Page v
• Firms desire greater evidence of public support for improved, faster, lower-costpermitting, and managing labor issues including rising workers compensation and healthcare costs. Public support is seen as the first step in taking action to address these issues.
• Pro-active public decision-maker support also is desired for (a) increased business/policymaker interaction, and (b) policy/investment decisions that make a difference.
HARBOR INDUSTRY ANALYSIS
The second portion of this Part Two analysis employs input-output economic data to investigateand expand upon the insights expressed by interview and focus group participants andrecognized in Part One of the PHILS study. This section focuses on identifying the Portlandmetro economy’s current and prospective competitive advantage and the clusters of economicactivity for which the harbor is particularly well positioned. Also considered are the land useimplications of industry trends and the quality of the harbor area’s industrial land supply.
Competitive Advantage. To identify the industries for which the Portland metro areas offers thegreatest competitive advantages – on both a regional and national scale – a series of screeningcriteria were applied to industry sectors. Five sets of screening criteria have been developed:
1. Current and changing competitive position – of the industry relative to the nation.2. Worker productivity – and change in productivity.3. Value-added output – measured in terms of value of output per labor hour.4. Economic impact – measured by employment multiplier and/or forecast employment
growth.5. Wage levels – including changes over time compared to other industries in the metro
area.
Taken together, nearly half of the industrial sectors portray the Portland-Vancouver metro area asbeing strongly competitive. Industry sectors meeting four or more of the criteria noted include:
Construction InstrumentsLumber & Wood Trucking & WarehousingPaper Products Water TransportationStone, Glass & Concrete CommunicationsIndustrial Machinery Electric, Gas & SanitationElectronic Equipment Wholesale TradeTransportation Equipment
As indicated by the boldface type, nine of these thirteen sectors are already well representedwithin Portland’s harbor industrial area. Maintaining and enhancing the region’s competitiveposition for these key sectors will be dependent on steps to preserve and enhance the capacity forPortland’s harbor industrial users. The economic vitality of the entire region cannot be easilyseparated from the prospects of sectors for which the harbor area is particularly well suited.
E.D. Hovee & Company
Portland Harbor Industrial Lands Study Part Two Page vi
Summary Economic Impact. Consistent with employment data developed by the Bureau ofPlanning for Part One, Portland’s harbor industrial area currently has an employment base of39,190 jobs. Of these, 34,270 (or 87%) are industrial jobs.
The harbor area’s 34,270 industrial jobs leverage another 46,890 jobs throughout the metro area– for a total of 81,160 jobs directly and indirectly attributable to harbor area industries.
The full economic impact to the metro area of Portland’s harbor area extends beyond thesequantitative estimates. Businesses and residents regionwide are dependent on goods and servicesthat often are uniquely provided by harbor area industries.
District Characteristics. Interviews with study area business leaders reveal a number of intra-and inter-industry relationships within the harbor area, as well as inside and outside the region.In effect, the Portland harbor industrial area currently functions similar to a hub-and-spokedistrict for several key industry groupings and clusters.
Study area activity has been dominated by a few large firms (hubs) such as Freightliner,Gunderson, Wacker, Oregon Steel Mills, ESCO, and Port of Portland. The ten largest harbor areaprivate sector firms employ over 60% of the study area’s workers. Due to extensive inter-firmrelationships (spokes), these industry leaders also support a significant portion of the remainingworkforce.
However, the harbor area may be in transition. While still dominated by large locally ownedfirms, the district increasingly appears to be shifting more to a satellite platform model, in whichbranch offices or plants are both supplied by and cater to customers outside of the industrialdistrict. This is exemplified by the comment from a focus group participant – and supported byinterviews – that the harbor’s future may be more toward wholesale-distribution andtransportation-oriented activities rather than manufacturing.
In the short term, this transition suggests a hybrid district comprised both of large locally ownedfirms as well as regional/branch plants. Yet the ongoing trend of local firms seekingnational/international alliances (e.g. Freightliner) creates challenges for locally dominatedsectors to remain competitive with a hub-and-spoke model. Also noted is the trend for non-localfirms using Portland as a regional hub to serve the western states of Oregon, Washington, Idaho,and Montana.
In this report, inter-industry linkages have been mapped for the transportation equipment andmetals manufacturing industry clusters – which still approximate the hub-and-spoke model. Incontrast, a third cluster profiled – maritime industry – more closely approximates the model of asatellite platform district – with more diverse supplier and customer linkages both locally andglobally.
Riverfront Site Constraints. In order to address the long-term viability of utilizing riverfrontproperties for continued maritime use, E.D. Hovee & Company developed a set of criteria foridentifying potential site development constraints. Threshold criteria are appropriate zoning andminimum depth barge access. Other criteria considered include deep draft shipping, rail/street
E.D. Hovee & Company
Portland Harbor Industrial Lands Study Part Two Page vii
access, lot depth, site contamination, compatible neighbors, environmental constraints, traileasements, flood plain, and scenic overlay height restrictions.
• Of the approximately 3,130 acres of riverfront property, an estimated 580 acres (19%)have no constraints – all located in Rivergate. The majority (51%) of riverfront propertiescomprising 1,600 acres have 1-3 constraints that could require some form of mitigation toremain suitable for maritime use.
• An estimated 270 acres (9%) has anywhere from 4-11 constraints. In some cases, theconstraints noted may be amenable to remediation for river-dependent uses in a mannerthat allows private investment to proceed. In other instances, the constraints or cost toconvert may exceed what industrial users find feasible in today’s market.
• Finally, 670 acres (21% of the total) are deemed as not meeting minimal thresholdconstraints for suitable industrial zoning and direct barge access. This includes someriver-related (but upland properties) that may be suitable for non-marine industrialactivity.
Upland Sites. The harbor industrial area has another 2,400 acres of upland property – siteslocated inland and away from the Willamette and Columbia riverfronts. While a detailedquantitative and mapping assessment of these properties has not been conducted as part of thisPHILS study, criteria that could be important to assess site suitability and constraints forindustrial use include such factors as appropriate zoning, site size, rail/truck and transitaccessibility, site contamination, and compatible neighbors. Undertaking such an assessment willrequire data not readily available to usefully and objectively assess upland site constraints – for abroader variety of parcels and potential uses than with riverfront sites.
Land Use Sensitivity. As Portland’s harbor industrial area adapts to changing market andregulatory challenges, the type and intensity of industrial activity that chooses to locate in thisarea likely will be affected by three specific factors – availability of useable (ready-to-build)land, development and business occupancy costs, and viable alternative locations inside oroutside the region.
Specifically noted is that the availability of Tier A ready-to-build property is currently extremelylimited – at only 33 acres. At some riverfront sites, the combination of environmental andinfrastructure requirements will be more costly than the resulting value of the land for industrialreuse – meaning that there is little to no incentive from a current or prospective owner toredevelop. Viable alternative locations are extremely limited within the region – particularly formarine terminal and heavy industrial uses – meaning that future relocations or major industryexpansions would more likely occur outside the Portland metro area.
The degree to which these factors affect land demand in the harbor area may well differ with theperspective of each user or developer. However, for both existing and prospective riverfront andupland users, these considerations can be expected to challenge the harbor area’s long-termviability and competitiveness.
E.D. Hovee & Company
Portland Harbor Industrial Lands Study Part Two Page viii
In addition to the sensitivity factors noted above, two other sets of private business planningdecisions have been identified – either of which could substantially affect both transportation andland-use planning for the harbor area long-term:
• Growing need of the two main rail carriers serving Portland to establish a several hundredacre intermodal rail yard – most likely outside the harbor area and possibly outside themetro area.
• Potential to eventually consolidate up to three existing grain elevators (including twonear the Rose Quarter) at an alternate location on the lower Columbia – subject to needsfor superior/expanded unit train service and ability to make a new facility investment thatincreases economic returns to the operator(s) long-term.
POLICY QUESTIONS
A series of policy questions to be addressed have been raised by this Part Two study – withindustry driven perspectives drawn from industry interviews and focus groups.
All Harbor Industries. Many of the cost disadvantages faced by harbor industries – such asdistance from major markets – may be beyond the influence of the Portland community to affect.Other factors – related to labor, infrastructure and regulation – may be more amenable tocorrective public policy and action, although not without attendant public expense.
For riverfront and some nearby owners, issues most pressing today include uncertainty andpotential cost associated with Superfund cleanup and maintenance of competitive multi-modaltransportation (marine, rail, highway). For upland as well as waterfront industries, additionalissues of concern include regional congestion (for employees and freight), encroachment ofincompatible non-industrial uses, high cost and time delay for permitting, and perceived lack ofcity/regional public policy and community support.
If not addressed, these are issues that individually or collectively could cause harbor industries torelocate and/or disinvest over time. There appear to be two primary suggestions identified bythose interviewed to proactively address industry concerns – expressed interest/interaction fromthe City followed by policies and investments that can make a demonstrable difference forharbor industries.
River-Dependent Industries. Relatively little demand for added industrial land is expected fromthe existing major industries interviewed – except for auto import facilities. However, if patternsof demand experienced in the past re-emerged (including significant new facilities located fromoutside the region), existing vacant riverfront sites north of the St. Johns Bridge could bedepleted within as little as a 7-year period.
Limited availability of vacant riverfront sites (150 acres north of the St. Johns Bridge) occurs at atime when a greater number of sites on the Willamette River lie underutilized or vacant due toindustry contractions or closures. The speed of site reuse likely depends on market recovery(from the current recession), Portland’s changing competitive position for non-auto maritimeuses, and regulatory conditions – especially cost liability resolution for Superfund sites.
E.D. Hovee & Company
Portland Harbor Industrial Lands Study Part Two Page ix
Currently, 670 acres of riverfront land do not meet threshold criteria for river-dependentindustrial use. Another 270 acres face multiple constraints. In summary, 30% of the 3,130 acresof riverfront land may be questionable for on-going river-dependent industrial or marine terminaluse in the future.
In summary, appropriate public policy questions for riverfront sites are essentially four-fold:
• Determination of which sites are sufficiently constrained to no longer be suitable forriver-dependent industrial use – whether now or in the future.
• Determination of whether to reserve suitable but vacant or underutilized riverfront sitesfor river-dependent industry or non-river-dependent industry for the long-term – even ifriver-dependent demand is not anticipated on the immediate horizon.
• Consideration of how to best allocate limited remaining riverfront sites (150 acres) northof the St. Johns Bridge – including possible actions to convert Tier B lands to Tier Astatus.
• Consideration of incentives for conversion of suitable but vacant or underutilized sitesback to productive use – generating additional jobs and tax revenues.
Upland Industries. The primary issue distinctive to upland sites relates to maintenance of theexisting industrial sanctuary. While continued sanctuary designation appears widely supported,there will continue to be questions surrounding the amount of flexibility that should beencouraged – for related commercial functions, corporate office, creative service/informationtechnology, and business park/flex space applications. Transitional areas at the interface betweenharbor industrial districts and adjoining commercial or residential neighborhoods also maywarrant consideration.
Portland Harbor’s Future. Both business leaders and public policy makers will play a vital rolein shaping the harbor’s economic future. A significant number of the business leadersinterviewed indicated they are uncertain about the economic/financial outlook of their companiesand industry. These uncertainties stem from forces external and internal to the City of Portland.Local policy makers can directly influence the effect of internal forces by forging partnershipswith the private sector to develop mutually beneficial harbor area economic developmentstrategies.
Based on this industry-driven interview and focus group discussion process, a variety ofalternative development permutations are viewed as possible. The development alternative thatactually emerges will depend on how the Portland Harbor area is positioned to encourage on-going and future economic activity.
A continuation of current industry trends coupled with no significant change in the public policyand regulatory environment could result in limited re-investment or disinvestment in waterfrontsites, with resolution of Superfund and related harbor planning and regulatory issues being amajor factor. Continuation of the status quo also could result in more non-maritime activity andperhaps a shift over time from manufacturing to wholesale-distribution.
E.D. Hovee & Company
Portland Harbor Industrial Lands Study Part Two Page x
Policies and investments made by the public sector likely will affect the character of privateinvestment, whether in transition toward an alternative set of economic activities or torevitalization of existing industries. Futures that diverge from the status quo most oftenmentioned by interview and focus group participants have involved discussion of industrialrevitalization and/or transition:
• Efforts made to strengthen Portland’s distinctive maritime niches, reposition harbor areamanufacturing, reinvest in multi-modal transportation, maintain the harbor industrialsanctuary, and dramatically streamline current regulatory including greenwayrequirements could help to facilitate a revitalization of the harbor’s traditional industries.
• Transitioning toward (or incorporating) a different set of industries/activities, whileperhaps consistent with recent public policy and national market trends, would representmore of a departure from the status quo for Portland’s harbor industrial area.
Concluding Observations. In conclusion, five overall observations are suggested from thispreliminary review of public policy questions:
1. The future of Portland’s harbor industrial area is less certain today than in even the recentpast – due to the confluence of changing global market conditions and public policy.
2. What happens in the harbor area is of profound importance to the economic vitality ofPortland and the entire metro area.
3. The future that happens can and will be strongly influenced by local public policy andinvestment decisions yet to be made.
4. An appropriate starting point for multi-agency public planning is to determine the maritimefuture of the Willamette River (below the Steel Bridge) and the Columbia River, followed byevaluation of Portland’s realistic and desired future for traditional industries includingtransportation equipment and metals manufacturing.
5. The public policy course selected has the best opportunity for successful realization withactive public/private sector collaboration.
E.D. Hovee & Company
Portland Harbor Industrial Lands Study Part Two
Table of ContentsEXECUTIVE SUMMARY i
I. INTRODUCTION 1
A. Background 1
B. PHILS Purpose 2
C. Approach to Part Two 5
D. Organization 6
II. PART 1 PHILS SUMMARY 7
A. Employment Trends 7
B. Land Use Trends 9
C. Freight Distribution 9
D. Business Inventories 11
E. Planning for Industry 12
F. Summary Implications Of Part One Research 13
III. INDUSTRY INTERVIEWS 15
A. Approach to Interviews 15
B. Industry Profile 16
C. Economic Base 17
D. Transportation & Utility Infrastructure 19
E. Location Attributes 24
F. Interindustry Linkages 26
G. Competition 28
H. Trends & Emerging Issues 30
I. Challenges, Opportunities & Plans 31
J. Harbor Area Issues 33
K. Focus Group Results 37
IV. HARBOR INDUSTRY ANALYSIS 45
A. Competitive Advantages 45
B. Changing Dynamics of Harbor Industries 54
C. Industrial Sites & Suitability 62
D. Land Use Sensitivity 65
E.D. Hovee & Company
Portland Harbor Industrial Lands Study Part Two
E. Land Demand 69
V. POLICY QUESTIONS 73
A. All Harbor Area Industries 73
B. River-Dependent Industries 78
C. Upland Industries 82
D. Portland Harbor’s Future 83
E. Summary Observations 85
APPENDIX A. INDUSTRY INTERVIEW QUESTIONNAIRE 87
APPENDIX B. FOCUS GROUP DISCUSSION 95
APPENDIX C. RIVERFRONT SITE CONSTRAINTS REVIEW 109
ENDNOTES 119
Table of FiguresFigure 1. Interviews Completed by Industry Grouping 16
Figure 2. Industry Cluster by Major Grouping 17
Figure 3. Site Usage 18
Figure 4. Current Employment by Industry Group 18
Figure 5. Annual Gross Business Revenues (in millions of $) 19
Figure 6. Long Haul Shipments into Harbor Area 20
Figure 7. Long Haul Shipments Out of Harbor Area 21
Figure 8. Usage of Marine Terminals 21
Figure 9. Materials/Products Shipped Via Marine Terminals 22
Figure 10. Portland Harbor Area Location Advantages 24
Figure 11. Vendor/Customer Relationships 27
Figure 12. Competitive Position of Harbor Industries 29
Figure 13. Operational Plans over the Next 3-5 & 5-20 Years 32
Figure 14. Portland Harbor Superfund Effect 33
Figure 15. Effect of Columbia River Channel Deepening Project 34
Figure 16. Effect of Willamette River Maintenance Dredging 34
Figure 17. Effects of I-5 Trade Corridor Improvements 35
Figure 18. Effects of Endangered Species & Clean Water Acts 35
E.D. Hovee & Company
Portland Harbor Industrial Lands Study Part Two
Figure 19. Effects of Recreational Boating & Trail Access 36
Figure 20. Effects of Transitioning to Non-Industrial Uses 36
Figure 21. Effects of Reserving Land Harbor Industrial Riverfront Sites 37
Figure 22. Focus Group Questions & Discussion 39
Figure 23. Concentration of Portland-Vancouver Metro Area’s Employment Base 46
Figure 24. Average Productivity by Sector for Portland-Vancouver Metro Area (versus U.S.) 48
Figure 25. Export Orientation, Local Procurement, and Economic Impact by Sector 49
Figure 26. The Portland-Vancouver Metro Area Competitive Advantage 51
Figure 27. Screening Competitive Advantage Industries 53
Figure 28. Economic Impact of Portland Harbor Area Industry 54
Figure 29. Industrial District Characteristics 56
Figure 30. Industry Mapping of Local and Non-Local Relationships 58
Figure 31. Transportation Equipment Manufacturing Linkages 59
Figure 32. Metal Industry Linkages 60
Figure 33. Marine Terminal Industry Linkages 61
Figure 34. Ranking Criteria for Evaluating Long-term Viability of Riverfront Properties forMarine Terminal Use 62
Figure 35. Constraints Evaluation for River-Dependent Use Map 64
Figure 36. Potential Criteria for Upland Site Suitability 65
Figure 37. Alternatives for Industry Relocation 67
Figure 38. Portland Harbor Vacant Industrial Lands (2000) 69
Figure 39. Vacant Industrial Lands by Subarea (2000) 69
Figure 40. Portland Harbor Area Employment Forecast 70
Figure 41. Portland Harbor Jobs Forecast vs. Vacant Industrial Land 70
Figure 42. Portland Harbor Futures 84

E.D. Hovee & Company
Portland Harbor Industrial Lands Study Part Two
E.D. Hovee & Company
Portland Harbor Industrial Lands Study Part Two 1
I. INTRODUCTION
As Part Two of the Portland Harbor Industrial Lands Study (PHILS), E.D Hovee & Companytogether with Parsons Brinckerhoff and The JD White Company, Inc. has conducted anassessment of the changing economic dynamics of the Portland harbor industrial area. This PartTwo study has been prepared on behalf of City of Portland Bureau of Planning in partnershipwith the Portland Development Commission and Port of Portland.
A. BACKGROUND
The history of Portland is inextricably linked to commerce on the Columbia and WillametteWaterways. The City’s first industrial activities were oriented to the river, the docks,stevedoring, warehousing, distribution and manufacturing activities.
As with other American waterfront cities, Portland’s relationship to its riverfront has changedover the last three decades:
Economic Drivers:
• A primary driver for marine industrial land development has been the continuedexpansion of foreign trade. Historically, waterborne trade through the Columbia Riverhas increased by about 3% annually. On average, over 200 acres of new industrial landhave been needed each decade to keep pace with the volume of trade at the Port ofPortland alone, even after redevelopment and joint venture strategies are considered.
• In recent years, interest in the marine industrial activities of the Portland Harbor areahave increased markedly with expanded port traffic, a changed economic outlook,shrinking land supplies, neighborhood impact concerns, public interest in waterfrontaccess, and issues associated with environmental quality of the Willamette River.
Marine Industrial Trends:
• Marine terminal and industrial land backup needs associated with maritime shipping haveincreased – placing more emphasis on larger Willamette River sites closer to theconfluence with the Columbia and on Columbia River frontage.
• Some formerly marine dependent properties (e.g. Terminal One, McCormick Baxter) arenow vacant and/or lightly used while other local industries (e.g. grain elevators,aggregate operations, shipyard repair) continue to rely on significant levels of Willamettewater-borne commerce.
• Local industries today are relying on an increased array of transportation modes inaddition to maritime shipping – including rail, truck, air, ecommerce and/or somecombination of the above. Less clear have been the linkages between and the shiftingreliance on these various modes of freight transport.
• Within the Pacific Northwest, the focus of regional distribution also has shifted in recentyears from Portland to the Seattle-Tacoma metro area. This shift has occurred despite taxand location advantages for the Portland region – due to issues related to multi-modaltransportation, the structure of related economic base activity, and suitable siteavailability.
E.D. Hovee & Company
Portland Harbor Industrial Lands Study Part Two 2
Emerging Issues:
• West coast ports are dominated by a few activity centers. Portland’s ability to competewith the major players is limited by the Columbia River channel’s 40 foot depth, whichseverely constrains container shipping – as the container industry transitions to deeperdraft vessels.
• The designation of Portland harbor as a Federal Superfund site, the channel deepeningproject, Port expansion in North Portland, and proposed future Port development of WestHayden Island for marine industrial use have captured the attention of the City, businesscommunity, neighborhood and citizen interests.
• Increased scarcity of metro area industrial sites is beginning to place a greater premiumon maintenance and recycling of existing properties for continued if not more intenseindustrial use.
• Pending the outcome of these emerging issues, the future of some harbor-orientedindustries has been called into question. Cost and uncertainty associated with issues suchas Superfund and brownfield sites make the financial feasibility of continued use forindustrial activity more tenuous. There is increasing discussion of re-focusing non-strategic river front sites for other forms of reuse ranging from open space to mixed-usedevelopment.
Cooperative Planning:
• The ongoing revitalization of Portland’s Central City has brought new interest in reuseand redevelopment of selected waterfront sites for uses not related to maritime industryor transportation – for residential, lodging, retail, office, recreation and mixed-usedevelopment.
• The City has initiated the River Plan program to coalesce and focus harbor-relatedplanning efforts into more of a common vision. The City and the Port are cooperating inthis effort, with broader business and community representation through the RiverEconomic Advisory Group.
B. PHILS PURPOSE
The Portland Harbor Industrial Lands Study (PHILS) is set within the context of these changingeconomic drivers, marine industrial trends, and emerging issues. This Part Two research projectis intended to assess the future land needs of industries in the Portland Harbor area, focusing onriver-dependent, freight-related, and other concentrated industries in this area.
The study has been prepared for the City of Portland Bureau of Planning, Portland DevelopmentCommission, and Port of Portland. The purpose of the study is to inform the City of theeconomic implications of potential revisions to land use policies in the Portland Harbor industrialareas, including a preliminary assessment of which lands should be reserved for river-dependentand river-related industry.
Related Strategic Planning. The study will inform the Portland Development Commission’swork on industrial development strategies, supporting the update underway of Portland’s
E.D. Hovee & Company
Portland Harbor Industrial Lands Study Part Two 3
Economic Development Strategy. The PHILS study also will assist the Port of Portland byinforming strategic decisions on land use, development, and planning for marine facilities.
A number of other related planning efforts will also benefit from the information collected fromthis PHILS research. This research is intended to inform the Portland Harbor Superfund Siteproject, as background research for harbor land use planning. PHILS will shed light on the landuse and economic implications of major regional freight infrastructure projects underconsideration, including maintenance dredging, channel deepening, and I-5 improvements.
PHILS Phasing. The PHILS study comprises two phases that have been conductedconcurrently:
• Part One, prepared by Bureau of Planning staff, involves a contextual summary ofindustry patterns and trends in the study area – based on published information and data.
• Part Two, the consultant team’s work, represents an in-depth analysis of why firms andindustries are in the study area and what presence they may have in the harbor area of thefuture.
Study Area. The PHILS study area consists generally of the industrially zoned districts situatedalong Portland’s Harbor – including the Guild’s Lake, Linnton, Lower Albina, Swan Island, St.Johns, and Rivergate industrial areas.
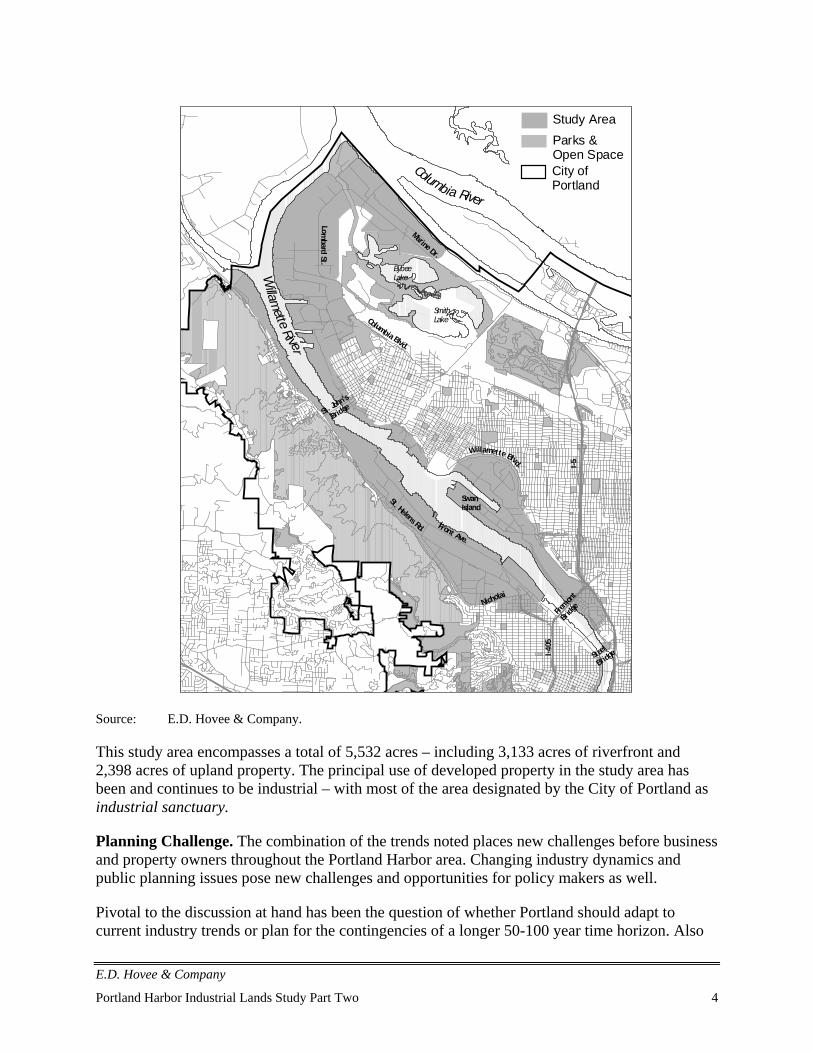
E.D. Hovee & Company
Portland Harbor Industrial Lands Study Part Two 4
Study AreaParks & Open SpaceCity of Portland
Swan Island
SmithLake
BybeeLakeW
illamette River
Columbia River
Marine Dr.
Lombard St.
Columbia Blvd.
St. John's
Bridge
Fremont
Bridge
Front Ave.
Steel
Bridge
I-5
I-405
Willamette Blvd.
St. Helens Rd.
Nicholai
Source: E.D. Hovee & Company.
This study area encompasses a total of 5,532 acres – including 3,133 acres of riverfront and2,398 acres of upland property. The principal use of developed property in the study area hasbeen and continues to be industrial – with most of the area designated by the City of Portland asindustrial sanctuary.
Planning Challenge. The combination of the trends noted places new challenges before businessand property owners throughout the Portland Harbor area. Changing industry dynamics andpublic planning issues pose new challenges and opportunities for policy makers as well.
Pivotal to the discussion at hand has been the question of whether Portland should adapt tocurrent industry trends or plan for the contingencies of a longer 50-100 year time horizon. Also
E.D. Hovee & Company
Portland Harbor Industrial Lands Study Part Two 5
important is the need to determine sites that should be reserved short- or long-term for maritimecommerce versus those that might appropriately transition to other uses.
Approach to Analysis. The E.D. Hovee project team has viewed its consultant responsibility asessentially two-fold:
• In depth, on-the-ground assessment of issues and opportunities faced by a cross-sectionof industry leaders whose decisions will shape or reshape the future of Portland’swaterfront.
• Integrating results of interviews with city provided Part 1 inventory, characterization andtrend analysis.
The aim was to conduct the interview research and analysis thoroughly and in concert with theCity’s Part 1 analysis. Results are intended to be presented in a manner that is concise, clear anduseful for affected industries, policy makers and the broader Portland community.
C. APPROACH TO PART TWO
Key elements of the Part Two PHILS research have involved interviews, focus groups andresulting analysis.
Interviews. This Part Two PHILS research is driven by an intensive interview process. Theconsultant team has conducted 80 interviews with business leaders from companies locatedwithin the Portland harbor industrial area. Questions were organized around eight topics:
• Historical background of firm or organization• Current harbor-related marine, industrial or other activities• Current location attributes• Inter-industry linkages (vendor and customer) both locally and internationally• Sources of competition in Portland, regionally and globally• Industry changes and emerging trends (market, technology, transportation, distribution)• Challenges, opportunities and plans (for the firm or organization)• Concluding comments and suggestions
Focus Groups. Subsequent to conducting a majority of the business interviews, the consultantteam facilitated two more in-depth focus groups: one with interested business leaders andanother with the River Economic Advisory Group. The purposes for meeting with the focusgroups were to ascertain the degree to which the results of the work completed to date wasaccurate, to identify issues affecting harbor businesses, and to outline policy considerations formaintaining the study area as an economically viable segment of the Portland economy.
Analysis. This Part Two study concludes by addressing the following:
• Industry dynamics – portrayed in two ways: a) using the firm mapping techniqueidentified by the City in 2-3 different illustrative types of firms or organizations; and b)
E.D. Hovee & Company
Portland Harbor Industrial Lands Study Part Two 6
applying the results of the database to an input-output economic model to assess theeconomic impacts of harbor industrial lands on the Portland metro area generally, and onkey industry sectors (e.g. wholesale trade, manufacturing) more specifically.i
• Land use implications – involving preliminary estimates of expanding versus decliningharbor industry sectors – together with associated building space and land acreagerequirements. More detailed cross-tabs are used to characterize demand anticipated forriverfront properties by river segment, and for upland properties. Assessments include adescription of land and location attributes critical to realization of demand projections.
• Land use sensitivity – discussion is focused on factors pivotal to affecting harbor areaindustrial activity. These factors include net useable acreage, cost ofdevelopment/business occupancy and availability of viable alternative sites in and outsidethe Portland metro area.
• Industrial site quality – assessed via identification of threshold criteria and other factorsthat may constrain a site’s suitability for industrial use – distinguishing properties forwhich on-going use is relatively certain versus sites for which reuse is less certain andfocused on sites directly accessible to the Willamette or Columbia Rivers.
• Policy questions – characterized in terms of importance for riverfront and upland sites.Rather than framing these policy issues solely in either/or terms, policy implications of 2-3 attainable alternative Portland Harbor industrial scenarios are also considered –covering an approximately 20-year time horizon.
D. ORGANIZATION
The remainder of this study is organized around the following topics:
Part 1 PHILS SummaryIndustry Interview ResultsHarbor Industry Analysis
Policy Questions
Three appendices are provided with this Part Two PHILS report. Appendix A provides a copy ofthe industry interview questionnaire. Appendix B details results of the focus group discussion.Appendix C includes a site specific review of the riverfront constraints/use suitability analysis.
E.D. Hovee & Company
Portland Harbor Industrial Lands Study Part Two 7
II. PART 1 PHILS SUMMARY
The City of Portland Bureau of Planning has conducted Part 1 of the Portland Harbor IndustrialLand Study (PHILS). The Part 1 report reviews employment and land use trends over the last 20years from within the Portland metropolitan area and focuses on an inventory of employmentsectors and land uses specifically in the Portland Harbor area.
The Part 1 analysis has been instrumental to both inform and shape this Part Two research andinterview report. A summary of results and implications from the Part 1 study is presented in thissection.
A. EMPLOYMENT TRENDS
The Bureau of Planning performed a macro level analysis of the employment and land use trendswithin the region and Multnomah County. That analysis provides insight into the underlyingchanges occurring within Portland’s economic base and where those changes are occurring.
Employment information covers regional trends, Multnomah County maritime employment andemployment forecasts.
Regional Trends. The mix of industries and their location in the Portland metropolitan area haschanged markedly over the last two decades. Manufacturing employment in the regionexperienced relatively modest average annual growth of 1.1%. However, the region's share ofnational manufacturing employment increased from 0.53% to 0.70%, as manufacturing growthhas been slower elsewhere in the U.S. In effect, Portland’s share of the nation’s manufacturingbase is increasing even as manufacturing represents a smaller component of the nation’s totalemployment base.
Electronic manufacturing, construction trades, air transportation, and wholesale trade constitutethe region's top job growth industries. The electronic manufacturing and construction tradesectors lead all industries with 20,140 and 21,920 added jobs between 1980 and 2000,respectively. Wholesale Trade added 18,520 jobs and air transportation with an additional 9,040jobs.
The printing and publishing (+4,820), rubber and plastics (+3,100), and transportation equipment(+2,920) industries also added industrial jobs; however, job growth in these sectors has beenmore than offset by losses within lumber (-2,900), paper (-1,960), apparel and textiles (-920),and instruments (-10,630). Job losses in the apparel and textile sectors coincide with nationaltrends, while lumber, paper, and instruments reflects a declining regional share of nationalemployment – signaling a potential change in the region’s national competitiveness for thosesectors.
Multnomah County. Multnomah County is the Portland region’s primary location of industrialjobs. However, its share of the region’s industrial job base has fallen from 59% (1980) to 48%(2000), as it captured only 17% of the region’s industrial job growth over the last two decades.Multnomah County’s shrinking competitive share is due to:
E.D. Hovee & Company
Portland Harbor Industrial Lands Study Part Two 8
• Multnomah County (including the City of Portland) being generally more built out thanits more suburban neighbors.
• The particular mix of expanding and contracting industries in Multnomah County relativeto the region. For example, the fastest-growing industry (electronics manufacturing) isconcentrated in Washington County, while more of the slower growing and decliningindustries are concentrated in Multnomah County.
• Some industries experienced substantial employment cutbacks in Multnomah County, butexpanded elsewhere in the region. Examples are durable goods wholesale,communication, industrial machinery, and fabricated metal products.
Maritime Employment. U.S. maritime employment has declined over the last two decades, asU.S. maritime operations have become less labor intensive and offshore competition has grown:
• Between 1980 and 1999, U.S. waterborne cargo tonnage increased by 0.9% per year evenas related employment declined by 1.8% per year. In 2000, marine cargo handlingemployment accounted for 80% of all water transportation employment within thePortland Harbor study area.
• Between 1980 and 1999, the U.S. lost half of its shipbuilding and repair jobs, as lessexpensive offshore competitors (such as Korea) increased their market presence in U.S.for non-defense related shipbuilding and repair.
Employment Forecasts. According to Metro and Oregon Office of Economic Analysis,industrial job growth in the Portland metropolitan area is predicted to substantially outpace thenational average, increasing the region’s national competitiveness for industrial jobs.Employment is expected to get back on track with its historical growth trajectory as the recessionends, though the recovery in Oregon likely will lag the nation.
Wholesale trade, transportation, and electronics are expected to continue to lead the region in jobgrowth. The region’s shifting mix of manufacturing industries is projected to continue. Three outof four new manufacturing jobs are forecast to occur within the electronics sector. However, jobreductions within food products, apparel and textiles, lumber, and paper industries are projectedto persist over the next 30 years.
Based on the Metro forecast and the current mix of harbor area industries, transportation andwholesale trade could be expected to continue as leading job-growth sectors in the harbor area.Employment in metals and equipment industries will be mixed but potentially stable, withanticipated gains for industrial machinery exceeding modest reductions in transportationequipment and metals.
The harbor area may also capture a portion of the region’s growth in other sectors such aselectronics, printing and publishing, other durable goods (e.g. furniture and fixtures, concreteproducts), and other nondurable goods (e.g. rubber and plastics, chemicals, and petroleumproducts).ii
E.D. Hovee & Company
Portland Harbor Industrial Lands Study Part Two 9
B. LAND USE TRENDS
Many U.S. cities have lost much of their central city industrial land to other uses as developmentpressure has led to conversion of industrial land to residential and commercial uses thatcommand higher market land values. To date, this has not occurred extensively within the cityof Portland as most of the city's industrial land is protected by the City’s industrial sanctuarypolicy (Comprehensive Plan Policy 2.14), limiting the encroachment of non-industrial uses.
Citywide Changes. The city of Portland has 18,800 acres of industrially zoned land,approximately 11% is vacant. Over the last decade, the City has allowed only a limited amountof industrial land (2.5%) to convert to other uses. The majority of these conversions have beenfocused within four specific areas: a) 181st/Airport Way, b) Lents, c) Central Eastside, and d)River District. These latter two districts are located within Portland’s Central City area.
Harbor Area Changes. According to a 1997 Port of Portland Industrial Land Study,approximately 3,730 acres (excluding West Hayden Island) of land is located along the PortlandHarbor – 2,790 acres are in industrial use. Approximately 39% of the industrial land was inmarine cargo uses, directly dependent on access to the Willamette and Columbia River system.
Between 1960 and 1997, the proportion of land in industrial or marine use has been relativelystable or growing in most of the harbor area except for:
• River District – the proportion of riverfront area in marine-related industrial use droppedfrom 65% in 1960 to none in 1997. This is largely due to the creation of the River Districturban renewal area and termination of marine cargo activities at the Port of Portland’sTerminal 1 facility.
• North Beach Areas – have transitioned from being primarily marine-related to publicuse or vacant. Much of the area south of the Railroad Bridge on the east bank of theWillamette is vacant due to marginal truck access and superfund cleanup liability. Thearea north of the Railroad Bridge, adjacent to St. John’s Town Center, has converted topublic use (e.g. Metro’s Willamette Cove greenspace and the city of Portland’s WaterPollution Control Laboratory).
According the 1997 study, only 7% (or 260 acres) of the land located long the Portland Harborwas vacant (defined as either undeveloped or unleased), down from 32% in 1990. However,vacancies have increased since 1997, reflecting the current economic recession and effects of the1999 Portland Harbor Superfund Project.
Between 1990 and 1997, 160 acres were developed for industrial uses. All but 14 acres were formarine-related uses. Marine cargo developments included the Portland Bulk Terminal at T-5, thechassis yard and intermodal yard expansion at T-6, and the Ash Grove plant at Albina Rail Yard.
C. FREIGHT DISTRIBUTION
The movement of goods through the Portland Harbor area also has changed over the last fourdecades, reflective of changing market conditions and transportation technology. The Bureau ofPlanning has reviewed several studies to obtain a basic understanding of what changes haveoccurred and trends are forecasted over the next 30 years.
E.D. Hovee & Company
Portland Harbor Industrial Lands Study Part Two 10
Marine Cargo. Cargo tonnage has generally increased over the last 40 years, with the 1970sbeing the peak period of growth. Between 1960 and 2000, marine cargo tonnage increased at anannual rate of 2.3%, primarily driven by growth in exports. Columbia River barge cargoincreased at a similar rate (2.1% per year). However, cargo growth has been restricted to vesselswith drafts greater than 18 feet, as outbound trips for vessels with less than 18 foot drafts havedeclined across all cargo types.
Portland has been capturing an increased share of marine cargo on the West Coast, with theexception of containers. Portland handles 21% of the West Coast’s dry bulk goods, 19% of theautomobiles, and 6% of breakbulks. However, Portland handles less than 2% of all West Coastcontainer traffic, as Southern California is the dominate market. Note: Portland represents aniche container market driven by agriculture and forest product exports.
Over the next 30 years, DRI-WEFA is projecting an increase across all cargo types except liquidbulk. Increases in liquid fertilizers and chemicals are expected to be offset by declines in refinedpetroleum products. Declines in refined petroleum marine shipment are expected to occur with atransition back toward pipeline shipments.
Mode Split of Marine Cargo. Rail is the primary mode of transportation for ocean bound cargo,handling 51% of all tonnage. Another 26% is barged and 22% is trucked. Shipments areexpected to increase across all modes of transportation; however, the proportion moving bybarge is projected to decrease.
Trucking is the preferred method of transporting non-ocean freight, followed by rail and ships.Non-ocean tonnage is also projected to increase. However, the proportion trucked will decline asrail and ships capture an increased share of tonnage.
Rail Freight. Rail tonnage has increased by 1.8% per year over the last ten years. Preliminaryforecasts being prepared as part of the I-5 Trade Corridor study anticipate rail tonnage toincrease at an even greater 3.0%-3.5% annualized rate over the next ten years. Significantincreases are expected for auto, grain, and bulk unit trains. This growth may place significantstrains on regional rail capacity as the Pacific Northwest is recognized as having some of themost congested rail corridors in the nation – for both east-west and north-south freightmovements.
Truck Traffic. Traffic volumes on the busier “truck streets” in the harbor area generallyincreased during the 1990s. The primary reason was development of vacant land in the Rivergatearea. Swan Island’s Going Street and Guild’s Lake area’s Yeon Avenue are the two highestvolume streets in the harbor industrial area.
A 1999 Commodity Flow Analysis found that lumber, wood products and furniture accounted for56% of regional truck freight. Food products accounted for another 18% and aggregate-relatedproducts represented 9%. All are products that are relatively heavy and bulky in relation toproduct value.
E.D. Hovee & Company
Portland Harbor Industrial Lands Study Part Two 11
D. BUSINESS INVENTORIES
The Bureau of Planning also has conducted a more detailed analysis of the harbor area to garneran understanding of the current economic inter-dynamics and competing land needs of industrieswithin the study area.
Approximately 940 private sector businesses are located within the Portland Harbor area,employing nearly 39,200 workers or one in eleven jobs in Multnomah County. Half of the studyarea’s workers are employed by manufacturers, with another one-third in distribution(transportation and wholesale sectors).
Concentrated Industries. The harbor area has been in industrial use for nearly a century. Bothits age and continuing competitive advantage as an industrial area has led to the diverse mix ofbusinesses currently in operation. However, the harbor area has specific industry concentrationsin transportation equipment, primary metals, petroleum products, and water transportation.
Over three-quarters of private sector manufacturing workers are employed in metals andequipment manufacturing; most work for primary metals and transportation equipment firms.Due to established supplier, subcontractor, and customer linkages, these industries have becomehighly interdependent upon one another.
Distribution industries (transportation and wholesale trade) employs 31% of study area workers.Water transportation is the most concentrated sector of the distribution industries, due to theproximity of deep water access. Wholesaling of alcoholic beverages, metals, petroleum products,chemicals, and furniture is also well represented.
River-Dependent Industries. Portland’s Harbor is Oregon’s freight transportation hub,connecting the seaport with regional barge routes, interstate highways, and transcontinentalrailroads. There is no similar place in Oregon with this confluence of significant intermodaltransportation facilities – nor is there any expectation of development of a similar transportationhub elsewhere in the state for the foreseeable future.
Much of the harbor riverfront is lined with river-dependent industrial uses, which is a result ofCity policy reserving those properties for only river-related and river-dependent activities. River-dependent activities within the Portland harbor industrial area can be grouped into threecategories:
• Marine Cargo Terminals – loading and unloading of commodities for trans-shipment orstorage on land for eventual distribution.
• Marine- or Vessel-Related Services – includes barging, dredging, and cargo handlingservices, as well as naval and coast guard services.
• Marine-Dependent Manufacturers – including fabricators that rely upon marinefacilities for transport of raw and finished products.
A 2001 study conducted for the Port of Portland estimated that almost 7,200 jobs depend oncargo moving through private and public port facilities.
E.D. Hovee & Company
Portland Harbor Industrial Lands Study Part Two 12
E. PLANNING FOR INDUSTRY
Freight-related firms including transportation and wholesale activities that depend on theHarbor’s multimodal transportation network for conducting business and infrastructure span theentire length of the harbor and the width of the adjacent industrial districts. Marine cargoterminals and other river-dependent industries extend from the grain terminals and concreteindustries in Lower Albina to the container and auto facilities at Terminal 6. Rail lines run thelength of both sides of the harbor with Albina and Lake rail yards situated within a few hundredfeet of the river.
The “lower harbor” area of Rivergate is well situated to receive a significant portion ofPortland’s maritime industrial growth, with competitive advantages of large sites, vacant land,convenient rail access, and few superfund sites. However, the freight distribution complex is notyet necessarily moving northward. Transportation and wholesale firms remain denselyconcentrated in the “upper harbor” area (Guild’s Lake, Swan Island, and Lower Albina). Theinvestment represented by this existing transportation and distribution infrastructure could beexpensive and logistically challenging to duplicate elsewhere – even with eventual relocation tothe nearby Rivergate area.
Concentrated Industries. Within the distribution industries, petroleum and automobileterminals are tightly clustered around Port terminal facilities. The west side of the river inLinnton and Guild’s Lake areas serves as Oregon’s petroleum distribution hub receiving productvia tankers and Olympic pipeline. Automobile terminals are situated in Rivergate and St. John’s,where trains unloading Ford, GM, and Honda vehicles from the Midwest load vehicles from Asia(i.e. Honda, Hyundai, and Subaru) bound for inland U.S.
Major employers requiring large sites encompass most of the transportation equipment andprimary metal industries. Many of these companies have riverfront facilities due to their historicdependence on the river for transporting products. There also are a number of smaller metals andequipment firms that are concentrated in the southern Guild’s Lake and Lower Albina areas.Southern Guild’s Lake and Lower Albina is also home to printing, publishing, and paperindustries.
Land Area. Industrial sites within the Portland Harbor area vary widely in size. The median(50% being below or greater) property size is 2.2 acres. However, the large industrial sites withinthe study area bring average site size up to 8 acres. Utilities, primary metals, manufacturing, andwater transportation uses tend to occupy sites that average 20 acres or greater.
Average employment density is 8.1 jobs per acre. Manufacturing has the highest employmentdensity at 12.4 workers per acre; and utilities have the lowest job density at 0.5 employees peracre.
Vacant Lands. The Portland Harbor area comprises over 5,532 acres of industrial land – ornearly one-third of the City’s industrial base. As of July 2000, 543 acres (or 10%) wereundeveloped, vacant Tier A/B lands. Over one-half of the vacant land is located in Rivergate.Only 33 acres are free of constraints (Tier A), as over 90% of the vacant land is constrained by
E.D. Hovee & Company
Portland Harbor Industrial Lands Study Part Two 13
landbanking, corporate ownership, access, unstable slopes, or taxlots smaller than 2 acres. ThePort of Portland is the largest owner of these lands.
Recent industry contractions indicate that harbor area land and buildings available for lease maybe increasing. Atrofina (59 acres), Time Oil (20 acres), and Alcatel (15 acres) have all eithervacated sites or ceased operations. Considerations such as environmental contamination andassociated regulations may hinder reinvestment in these sites. Vestas’ interest in a 113 acreRivergate site represents a potential reduction to the area’s inventory of land available for lease.The Vestas project also illustrates the relatively lumpy and somewhat unpredictable nature ofharbor area investment opportunity coming from outside the Portland metro area.
F. SUMMARY IMPLICATIONS OF PART ONE RESEARCH
The Portland metro area represents a growing share of the U.S. economy and industrial base.Over the last 20 years, the region has captured an increasing share of the nation’s manufacturingemployment. And marine facilities have captured an increased share of West Coast tonnage.
However, the region’s ability to maintain or improve its competitiveness will depend part-in-parcel on how it addresses environmental issues, maintaining an adequate supply of industrialland (including large sites), continuing to make freight mobility improvements, and creating apositive business environment.
Industrial Base. Multnomah County, more specifically the City of Portland, will have to addressthese same issues to minimize additional erosion of its industrial base. As the region hasincreased its competitiveness nationally, Multnomah County has been falling behind, as:
• Multnomah County is generally more built out than its suburban neighbors;• The particular mix of industries in Multnomah County have been stagnate or declining;
and• Some industries experienced substantial employment cutbacks in Multnomah County, but
expanded elsewhere in the region – which may signal a decline in the county’s ability tocompete competitively with the rest of the region.
The harbor area is located at the heart of Portland’s industrial/economic base. One-third of theCity’s industrial land is located within the Portland Harbor area and area employers provide onein eleven jobs countywide. More important is the harbor’s intrinsic link to the regional andstatewide economy – and to a certain degree the Pacific Northwest – as a distribution hub due todeep water access and multi-modal transportation infrastructure. While the region has beencompetitive nationally for industrial development – including for traditional heavy industry – itis not clear whether these trends will continue to benefit the harbor area in the future. Addressingquestions of future industry plans is a major focus of the Part Two PHILS research.
Marine Terminals. Marine facilities in Portland have been capturing an increasing share of westcoast marine cargo activity, except containers. Marine cargo business is forecast to continue toincrease across all cargo types except petroleum. Some forecasters expect pipeline activity toincrease coinciding with a decrease in vessel reliance.iii
E.D. Hovee & Company
Portland Harbor Industrial Lands Study Part Two 14
Marine activity requiring drafts greater than 18 feet is also expected to grow. However, smallervessels with less than 18 foot drafts are anticipated to remain unchanged and may declineslightly.
Policy & Planning. Unlike most central city industrial areas throughout the U.S., the PortlandHarbor area has experienced only minor loss of industrial land to other competing uses. Theprimary reason is the City’s industrial sanctuary policy that is designed to protect againstencroachment of incompatible uses. Whether or not to maintain the industrial sanctuary policyin its current form may be an issue to be addressed through this planning process.
Another issue that is being assessed is whether to maintain waterfront property for water-related/dependent activities. Between 1990 and 1997, 160 acres of industrial land was developedin the harbor area. All but 14 acres were marine-related. This has equated to an annual absorptionof 21 acres per year for marine activities.
All of these issues are part of two larger, more central questions for Portland’s harbor industrialarea. Simply stated, those questions are: Will Portland’s harbor area continue as the focus for theregion’s maritime and heavy manufacturing activities? Or, is the harbor area transitioning to adifferent and as yet undefined future?
To better address these questions, Part Two of the Portland Harbor Industrial Land Study(PHILS) draws from the perspectives of a cross-section of industries currently conductingbusiness in the harbor area – both river dependent and upland firms. It is to the results of thesein-depth interviews that this analysis now turns.
E.D. Hovee & Company
Portland Harbor Industrial Lands Study Part Two 15
III. INDUSTRY INTERVIEWS
The focus of this Part Two PHILS research is to obtain a more in-depth understanding of thecharacteristics of industries operating in Portland’s harbor industrial area. This purpose has beenaccomplished through a series of interviews with a cross-section of area industries. The interviewprocess has obtained information regarding current characteristics and operational issues as wellas perspectives about future prospects for continued operation and investment.
The consultant team interviewed a selected target group of 80 business leaders within thePortland harbor industrial study area. Information obtained from the interviews provides someinsight into the public policy and economic issues affecting area industries.
This evaluation is intended to provide the framework for discussing issues and potential publicsector policies. A summary of common themes is provided in this section. A copy of the surveyquestionnaire is provided in Appendix A.
A. APPROACH TO INTERVIEWS
Due to the length and potentially sensitive nature of the interview questionnaire, a structuredprocess was used to select, contact, conduct and tabulate responses from the interviews. Keyfeatures of the interview process have included:
• Identification of firms constituting a representative cross-section of harbor area industriesby business type and location – with focus on larger firms or industry leaders within eachmajor sector.iv
• Mailing of a letter inviting participation in the interview process – with the letter jointlysigned by chief executive officers of the City of Portland Bureau of Planning, PortlandDevelopment Commission and Port of Portland.
• Follow-up personal contact to schedule an interview appointment by a consultant teamrepresentative – typically with the questionnaire e-mailed or faxed to the participatingcompany in advance of the interview.
• Conduct of the interview with the company CEO or other primary decision maker, withinterviews occurring on the premises of the participating company whenever possible.
• Entry of results into a computer database – for tabulation of both quantitative andqualitative responses.
• Calculation of all group averages – as a weighted average of those responding to aparticular question.
• Aggregation of results so that comments are not directly attributable to any individualrespondent – to maintain the confidentiality of proprietary information and opinions.
It is noted that the interview process, while yielding useful information, required a level of effortbeyond what is typically required for one-on-one business interviews. This appears to be the casefor a variety of reasons including: length of the interview questionnaire, proprietary nature ofmuch of the information requested, time constraints of respondents, concerns over how the
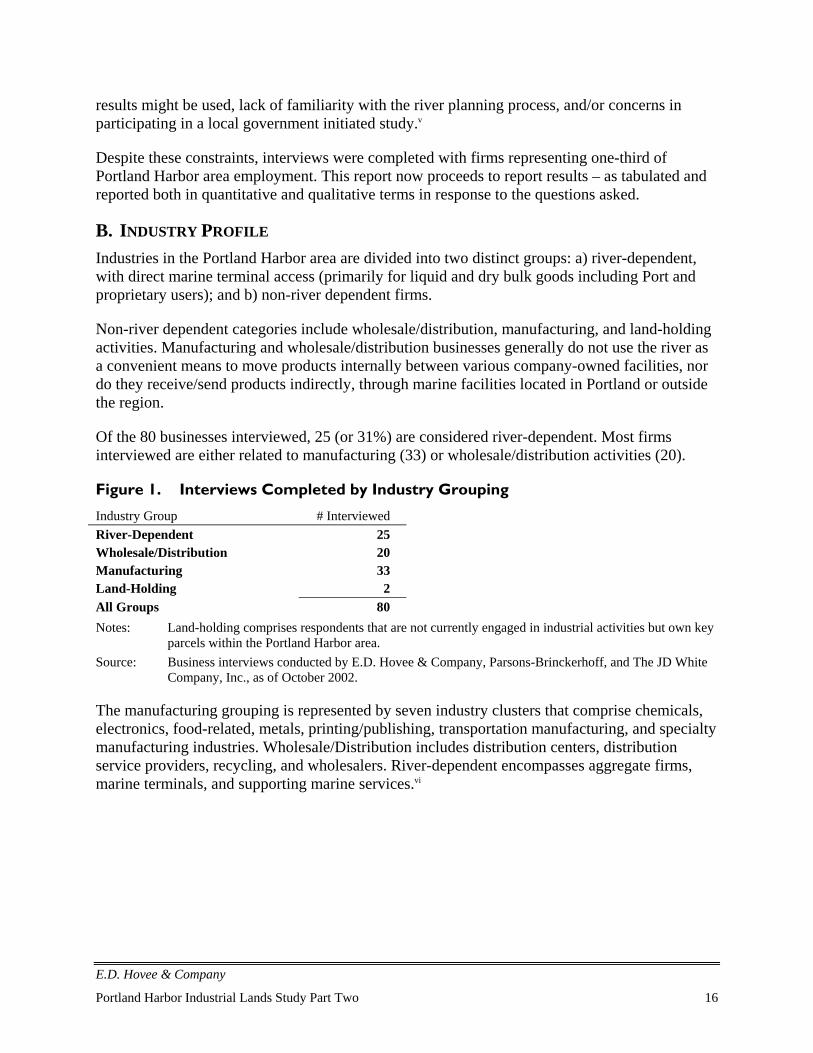
E.D. Hovee & Company
Portland Harbor Industrial Lands Study Part Two 16
results might be used, lack of familiarity with the river planning process, and/or concerns inparticipating in a local government initiated study.v
Despite these constraints, interviews were completed with firms representing one-third ofPortland Harbor area employment. This report now proceeds to report results – as tabulated andreported both in quantitative and qualitative terms in response to the questions asked.
B. INDUSTRY PROFILE
Industries in the Portland Harbor area are divided into two distinct groups: a) river-dependent,with direct marine terminal access (primarily for liquid and dry bulk goods including Port andproprietary users); and b) non-river dependent firms.
Non-river dependent categories include wholesale/distribution, manufacturing, and land-holdingactivities. Manufacturing and wholesale/distribution businesses generally do not use the river asa convenient means to move products internally between various company-owned facilities, nordo they receive/send products indirectly, through marine facilities located in Portland or outsidethe region.
Of the 80 businesses interviewed, 25 (or 31%) are considered river-dependent. Most firmsinterviewed are either related to manufacturing (33) or wholesale/distribution activities (20).
Figure 1. Interviews Completed by Industry Grouping
Industry Group # InterviewedRiver-Dependent 25Wholesale/Distribution 20Manufacturing 33Land-Holding 2All Groups 80Notes: Land-holding comprises respondents that are not currently engaged in industrial activities but own key
parcels within the Portland Harbor area.Source: Business interviews conducted by E.D. Hovee & Company, Parsons-Brinckerhoff, and The JD White
Company, Inc., as of October 2002.
The manufacturing grouping is represented by seven industry clusters that comprise chemicals,electronics, food-related, metals, printing/publishing, transportation manufacturing, and specialtymanufacturing industries. Wholesale/Distribution includes distribution centers, distributionservice providers, recycling, and wholesalers. River-dependent encompasses aggregate firms,marine terminals, and supporting marine services.vi
E.D. Hovee & Company
Portland Harbor Industrial Lands Study Part Two 17
Figure 2. Industry Cluster by Major Grouping
Industry GroupIndustry Cluster(# of Interviews)
River-Dependent (25) Aggregate (6)Marine Terminal (15)Marine Service (4)
Wholesale/Distribution (20) Distribution Center (9)Distribution Service (6)Recycling (2)Wholesaler (3)
Manufacturing (33) Chemicals (3)Electronics (1)Food-Related (4)Metals (6)Printing/Publishing (2)Transportation Manufacturing (5)Specialty Manufacturing (12)
Source: Business interviews conducted by E.D. Hovee & Company, Parsons-Brinckerhoff, and The JD WhiteCompany, Inc., October 2002. Above listing excludes two interviews with land-holding entities.
The non-river-dependent businesses typically have located in Portland’s harbor industrial areasfor one of two reasons:
• Transportation advantages (rail but primarily truck access to Central City and region)• Historic reasons no longer necessarily applicable
Interconnectedness of harbor area industrial uses has developed over time and represents asignificant competitive advantage for firms that are suppliers to or customers of other harborindustries. Examples of industry clusters include maritime bulks, metals, graphic arts/printing,and distribution.
Loss of a single major firm (e.g. Freightliner) could, in some cases, jeopardize supportingbusinesses. More detailed examples of inter-industry linkages are provided in Section IV of thisreport.
C. ECONOMIC BASE
As background information, respondents provided information about site usage, employment,other plant locations, and gross business revenues.
Site Usage. Portland’s harbor area industries exhibit a pattern of remarkable longevity – oftenwith deep roots in the harbor area. On average, those interviewed have operated at their currentlocation for 32 years. The newest firm of those interviewed located in the harbor area three yearsago. The railroads and barging services have had harbor area operations for 100+ years.
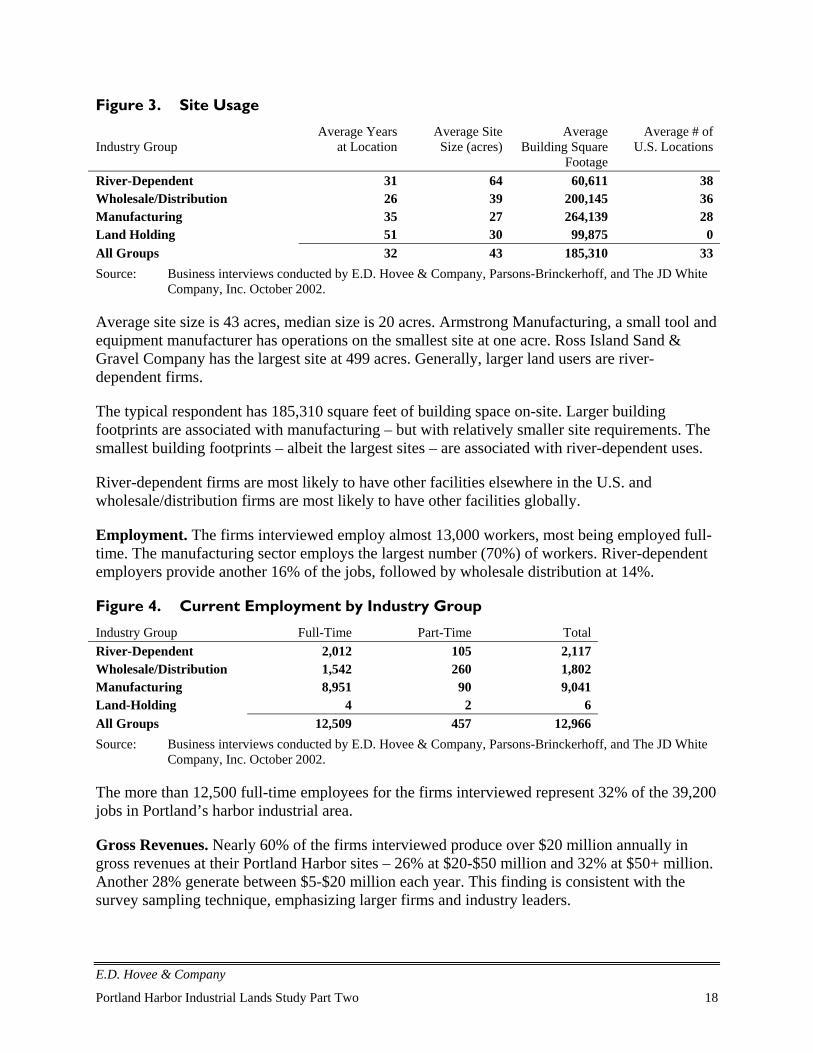
E.D. Hovee & Company
Portland Harbor Industrial Lands Study Part Two 18
Figure 3. Site Usage
Industry GroupAverage Years
at LocationAverage SiteSize (acres)
AverageBuilding Square
Footage
Average # ofU.S. Locations
River-Dependent 31 64 60,611 38Wholesale/Distribution 26 39 200,145 36Manufacturing 35 27 264,139 28Land Holding 51 30 99,875 0All Groups 32 43 185,310 33Source: Business interviews conducted by E.D. Hovee & Company, Parsons-Brinckerhoff, and The JD White
Company, Inc. October 2002.
Average site size is 43 acres, median size is 20 acres. Armstrong Manufacturing, a small tool andequipment manufacturer has operations on the smallest site at one acre. Ross Island Sand &Gravel Company has the largest site at 499 acres. Generally, larger land users are river-dependent firms.
The typical respondent has 185,310 square feet of building space on-site. Larger buildingfootprints are associated with manufacturing – but with relatively smaller site requirements. Thesmallest building footprints – albeit the largest sites – are associated with river-dependent uses.
River-dependent firms are most likely to have other facilities elsewhere in the U.S. andwholesale/distribution firms are most likely to have other facilities globally.
Employment. The firms interviewed employ almost 13,000 workers, most being employed full-time. The manufacturing sector employs the largest number (70%) of workers. River-dependentemployers provide another 16% of the jobs, followed by wholesale distribution at 14%.
Figure 4. Current Employment by Industry Group
Industry Group Full-Time Part-Time TotalRiver-Dependent 2,012 105 2,117Wholesale/Distribution 1,542 260 1,802Manufacturing 8,951 90 9,041Land-Holding 4 2 6All Groups 12,509 457 12,966Source: Business interviews conducted by E.D. Hovee & Company, Parsons-Brinckerhoff, and The JD White
Company, Inc. October 2002.
The more than 12,500 full-time employees for the firms interviewed represent 32% of the 39,200jobs in Portland’s harbor industrial area.
Gross Revenues. Nearly 60% of the firms interviewed produce over $20 million annually ingross revenues at their Portland Harbor sites – 26% at $20-$50 million and 32% at $50+ million.Another 28% generate between $5-$20 million each year. This finding is consistent with thesurvey sampling technique, emphasizing larger firms and industry leaders.
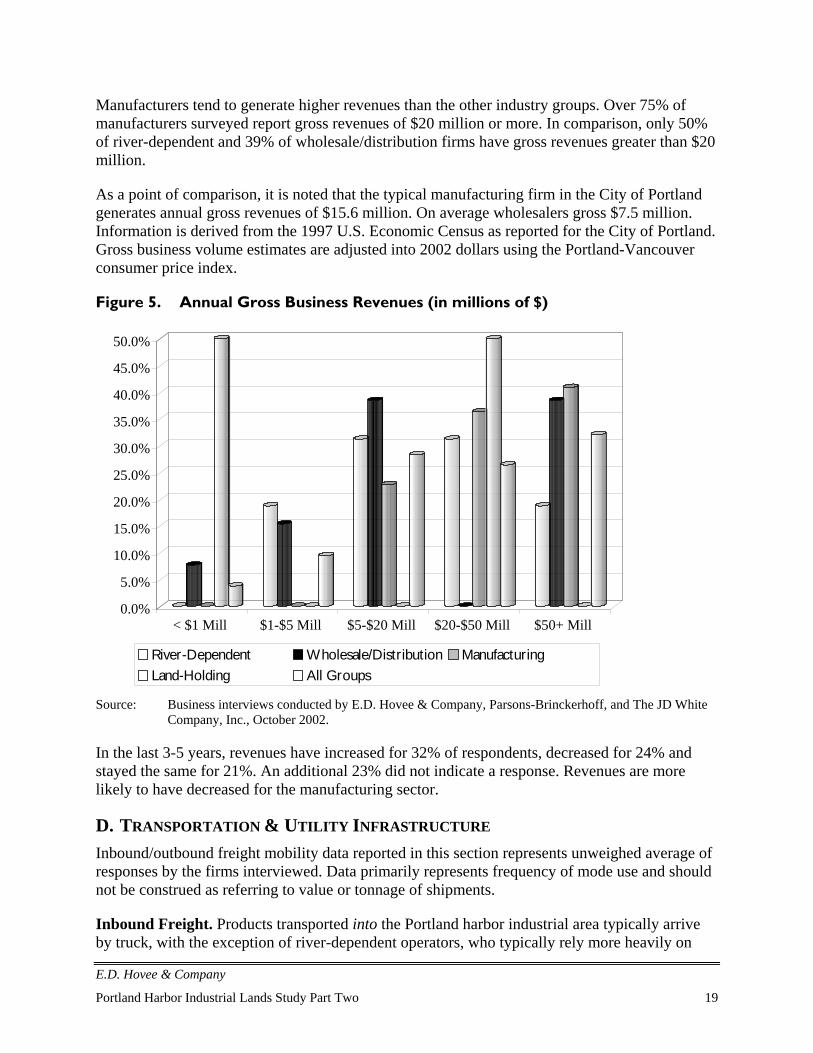
E.D. Hovee & Company
Portland Harbor Industrial Lands Study Part Two 19
Manufacturers tend to generate higher revenues than the other industry groups. Over 75% ofmanufacturers surveyed report gross revenues of $20 million or more. In comparison, only 50%of river-dependent and 39% of wholesale/distribution firms have gross revenues greater than $20million.
As a point of comparison, it is noted that the typical manufacturing firm in the City of Portlandgenerates annual gross revenues of $15.6 million. On average wholesalers gross $7.5 million.Information is derived from the 1997 U.S. Economic Census as reported for the City of Portland.Gross business volume estimates are adjusted into 2002 dollars using the Portland-Vancouverconsumer price index.
Figure 5. Annual Gross Business Revenues (in millions of $)
0.0%
5.0%
10.0%
15.0%
20.0%
25.0%
30.0%
35.0%
40.0%
45.0%
50.0%
< $1 Mill $1-$5 Mill $5-$20 Mill $20-$50 Mill $50+ Mill
River-Dependent Wholesale/Distribution ManufacturingLand-Holding All Groups
Source: Business interviews conducted by E.D. Hovee & Company, Parsons-Brinckerhoff, and The JD WhiteCompany, Inc., October 2002.
In the last 3-5 years, revenues have increased for 32% of respondents, decreased for 24% andstayed the same for 21%. An additional 23% did not indicate a response. Revenues are morelikely to have decreased for the manufacturing sector.
D. TRANSPORTATION & UTILITY INFRASTRUCTURE
Inbound/outbound freight mobility data reported in this section represents unweighed average ofresponses by the firms interviewed. Data primarily represents frequency of mode use and shouldnot be construed as referring to value or tonnage of shipments.
Inbound Freight. Products transported into the Portland harbor industrial area typically arriveby truck, with the exception of river-dependent operators, who typically rely more heavily on
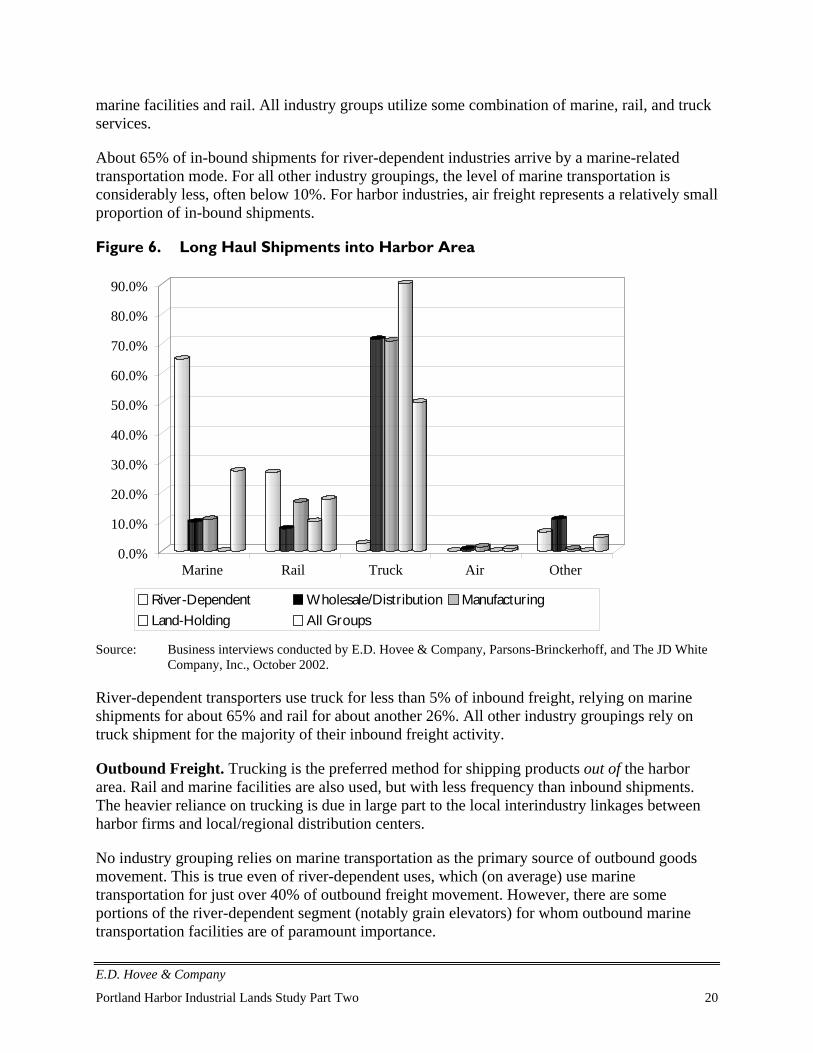
E.D. Hovee & Company
Portland Harbor Industrial Lands Study Part Two 20
marine facilities and rail. All industry groups utilize some combination of marine, rail, and truckservices.
About 65% of in-bound shipments for river-dependent industries arrive by a marine-relatedtransportation mode. For all other industry groupings, the level of marine transportation isconsiderably less, often below 10%. For harbor industries, air freight represents a relatively smallproportion of in-bound shipments.
Figure 6. Long Haul Shipments into Harbor Area
0.0%
10.0%
20.0%
30.0%
40.0%
50.0%
60.0%
70.0%
80.0%
90.0%
Marine Rail Truck Air Other
River-Dependent Wholesale/Distribution ManufacturingLand-Holding All Groups
Source: Business interviews conducted by E.D. Hovee & Company, Parsons-Brinckerhoff, and The JD WhiteCompany, Inc., October 2002.
River-dependent transporters use truck for less than 5% of inbound freight, relying on marineshipments for about 65% and rail for about another 26%. All other industry groupings rely ontruck shipment for the majority of their inbound freight activity.
Outbound Freight. Trucking is the preferred method for shipping products out of the harborarea. Rail and marine facilities are also used, but with less frequency than inbound shipments.The heavier reliance on trucking is due in large part to the local interindustry linkages betweenharbor firms and local/regional distribution centers.
No industry grouping relies on marine transportation as the primary source of outbound goodsmovement. This is true even of river-dependent uses, which (on average) use marinetransportation for just over 40% of outbound freight movement. However, there are someportions of the river-dependent segment (notably grain elevators) for whom outbound marinetransportation facilities are of paramount importance.
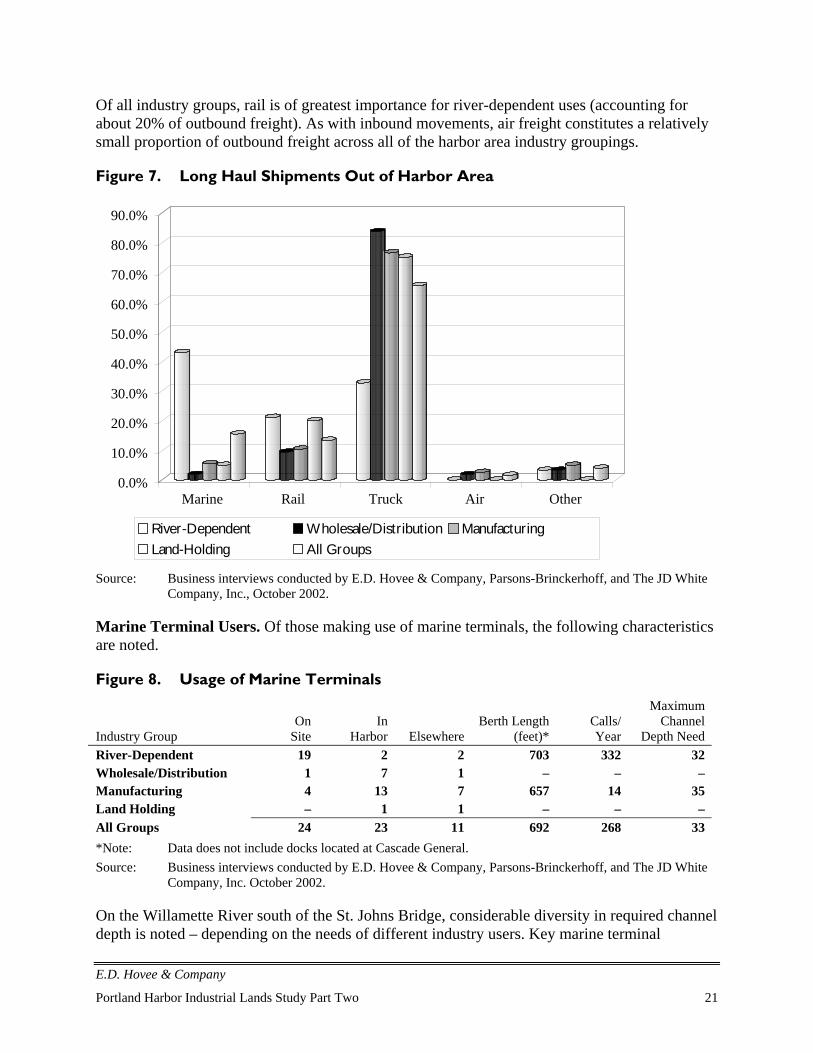
E.D. Hovee & Company
Portland Harbor Industrial Lands Study Part Two 21
Of all industry groups, rail is of greatest importance for river-dependent uses (accounting forabout 20% of outbound freight). As with inbound movements, air freight constitutes a relativelysmall proportion of outbound freight across all of the harbor area industry groupings.
Figure 7. Long Haul Shipments Out of Harbor Area
0.0%
10.0%
20.0%
30.0%
40.0%
50.0%
60.0%
70.0%
80.0%
90.0%
Marine Rail Truck Air Other
River-Dependent Wholesale/Distribution ManufacturingLand-Holding All Groups
Source: Business interviews conducted by E.D. Hovee & Company, Parsons-Brinckerhoff, and The JD WhiteCompany, Inc., October 2002.
Marine Terminal Users. Of those making use of marine terminals, the following characteristicsare noted.
Figure 8. Usage of Marine Terminals
Industry GroupOn
SiteIn
Harbor ElsewhereBerth Length
(feet)*Calls/Year
MaximumChannel
Depth NeedRiver-Dependent 19 2 2 703 332 32Wholesale/Distribution 1 7 1 – – –Manufacturing 4 13 7 657 14 35Land Holding – 1 1 – – –All Groups 24 23 11 692 268 33*Note: Data does not include docks located at Cascade General.Source: Business interviews conducted by E.D. Hovee & Company, Parsons-Brinckerhoff, and The JD White
Company, Inc. October 2002.
On the Willamette River south of the St. Johns Bridge, considerable diversity in required channeldepth is noted – depending on the needs of different industry users. Key marine terminal
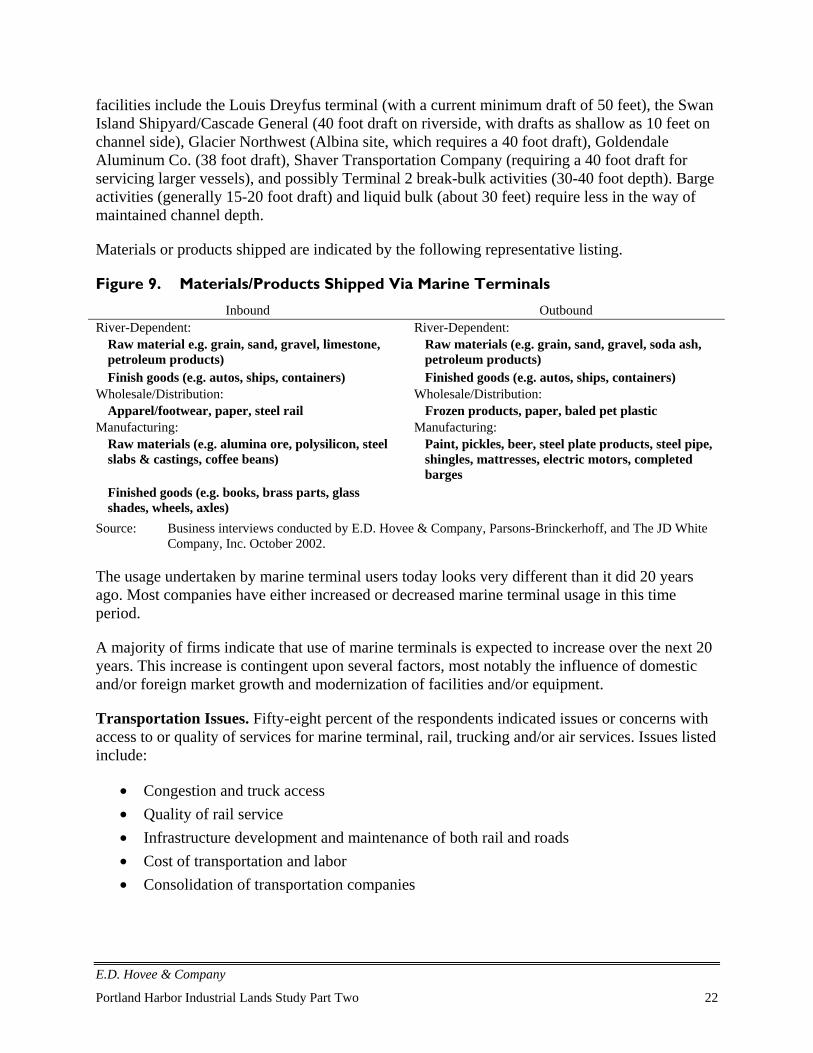
E.D. Hovee & Company
Portland Harbor Industrial Lands Study Part Two 22
facilities include the Louis Dreyfus terminal (with a current minimum draft of 50 feet), the SwanIsland Shipyard/Cascade General (40 foot draft on riverside, with drafts as shallow as 10 feet onchannel side), Glacier Northwest (Albina site, which requires a 40 foot draft), GoldendaleAluminum Co. (38 foot draft), Shaver Transportation Company (requiring a 40 foot draft forservicing larger vessels), and possibly Terminal 2 break-bulk activities (30-40 foot depth). Bargeactivities (generally 15-20 foot draft) and liquid bulk (about 30 feet) require less in the way ofmaintained channel depth.
Materials or products shipped are indicated by the following representative listing.
Figure 9. Materials/Products Shipped Via Marine Terminals
Inbound OutboundRiver-Dependent: River-Dependent:
Raw material e.g. grain, sand, gravel, limestone,petroleum products)
Raw materials (e.g. grain, sand, gravel, soda ash,petroleum products)
Finish goods (e.g. autos, ships, containers) Finished goods (e.g. autos, ships, containers)Wholesale/Distribution: Wholesale/Distribution:
Apparel/footwear, paper, steel rail Frozen products, paper, baled pet plasticManufacturing: Manufacturing:
Raw materials (e.g. alumina ore, polysilicon, steelslabs & castings, coffee beans)
Paint, pickles, beer, steel plate products, steel pipe,shingles, mattresses, electric motors, completedbarges
Finished goods (e.g. books, brass parts, glassshades, wheels, axles)
Source: Business interviews conducted by E.D. Hovee & Company, Parsons-Brinckerhoff, and The JD WhiteCompany, Inc. October 2002.
The usage undertaken by marine terminal users today looks very different than it did 20 yearsago. Most companies have either increased or decreased marine terminal usage in this timeperiod.
A majority of firms indicate that use of marine terminals is expected to increase over the next 20years. This increase is contingent upon several factors, most notably the influence of domesticand/or foreign market growth and modernization of facilities and/or equipment.
Transportation Issues. Fifty-eight percent of the respondents indicated issues or concerns withaccess to or quality of services for marine terminal, rail, trucking and/or air services. Issues listedinclude:
• Congestion and truck access• Quality of rail service• Infrastructure development and maintenance of both rail and roads• Cost of transportation and labor• Consolidation of transportation companies
E.D. Hovee & Company
Portland Harbor Industrial Lands Study Part Two 23
Even river-dependent firms use marine transportation for less than 50% of outbound shipments.As with inbound activity, rail generally accounts for less than 20% of outbound freight activity.Use of air freight is relatively minor.
Utilities: Businesses interviewed typically use a wide range of utilities for their operations.There is no variation between industry clusters.
Future usage does vary by service and industry cluster.
• Water – nearly two-thirds of those responding indicated no change over the next 3-5years. However, 38% of manufacturers report that they anticipate their water usage toincrease. No major issues were noted regarding quality or quantity of service.
• Sewer – again, nearly two-thirds do not expect their sewer usage to change, but 36% ofmanufacturers’ project an increase. As with water, no major issues were noted regardingexisting service.
• Electric – fifty percent of respondents do not expect their electric usage to change, whilethe other 50% anticipate a growing need – two-thirds of those projecting increases aremanufacturers.Two major issues were noted by respondents: power outages and costs. Comments madeabout power outages related to supply shortages experienced during 2001 and thebusiness costs associated with downtime/restart-up of heavy machinery. Rising energycosts are of particular concern to manufacturers and certain marine terminal users asescalating costs affect their ability to deliver goods and services at a competitive price. Inparticular, metals firms and transportation equipment manufacturers have been especiallyhard hit as they struggle to maintain global competitiveness with lower cost Pacific Rimproducers. A prime example is the demise of the aluminum industry with aluminumsupplies now arriving from offshore producers.
• Natural Gas – fifty percent of firms indicated no change while the other 50% projectincreases – manufacturers account for three-quarters of all increases. No major concernswere noted.
• Telecommunications – over fifty percent of respondents expect their telecommunicationsusage to increase, with manufacturers leading the way. Several respondents mentionedissues with both quality and availability of telecommunication services. The primaryissues surrounding availability is attributable to lack of high speed data/internal service.Quality of service relates to frustrations with customer service. Specific problems citedincluded line static and occasional outages. Some firms have employed cell phones as aback up means to minimizing business interruptions due to harbor area phone outages.
In general, a number of firms commented about the increasing cost of utilities. A few noted thatutilities now represent over 10% of business operating costs. Firms are especially sensitive torising utility costs, or other business expense, during the current economic recession as managersattempt to maintain or reduce operations expense.
E.D. Hovee & Company
Portland Harbor Industrial Lands Study Part Two 24
E. LOCATION ATTRIBUTES
Business leaders were asked to identify both advantages and disadvantages of being locatedwithin the Portland harbor industrial area. A number of common themes emerge from interviewsconducted to date.
Advantages. The question posed to those interviewed was: Currently, what are the primaryadvantages for operating at this location? Representatives identified seven common advantagesto being located within the Portland harbor industrial area.
Access to a solid, intermodal transportation infrastructure is generally viewed as the greatestadvantage across all industry groups. Frequently listed transportation advantages are “proximityto freeways” and the importance of the “convergence of all transportation modes.” Closeproximity to customers and vendors, followed by proximity to river, access to a skilled laborforce, and low cost availability of land and building space also were frequently mentioned.
Industrial sanctuary designation appears to be a locational advantage primarily to manufacturers,but this should not be construed unimportant to other industry groups. A significant number ofall respondents indicated a preference for reserving riverfront properties for maritime/industrialactivities and a reservation about allowing industrial sites to convert to non-industrial uses.
Figure 10. Portland Harbor Area Location Advantages
Location AdvantageRiver
Depend Whsl Dist Mfg Misc TotalTransportation infrastructure 13 11 11 1 35Close proximity to customers/vendors 5 6 10 1 21Central location to skilled workforce 2 2 6 - 10Land/space availability/low cost 2 4 2 - 8Proximity to river 12 1 1 - 14Established industrial area - - 4 - 4Unique property characteristics 2 - 3 1 5Source: Business interviews conducted by E.D. Hovee & Company, Parsons-Brinckerhoff, and The JD White
Company, Inc., October 2002.
Disadvantages. Unlike the location advantages, no clear cut indications emerge as to locationaldisadvantages within the Portland harbor industrial area. However, there are a number of issuesthat were mentioned with some frequency:
• Traffic congestion/constrained transportation network• Proximity of residential areas• General costliness of conducting business in Portland• Not central to major consumer markets• High labor costs• Expensive real estate• Limited channel depth/lack of container handlers
E.D. Hovee & Company
Portland Harbor Industrial Lands Study Part Two 25
• Perceived lack of public transit• Poorly configured marine terminals• Bad connection to freeways/I-5• Lack of city support• Stringent environmental regulations• Lack of dining• Proximity to river• Lack of room for expansion
The concerns with traffic congestion included many of Portland’s main freeways such as I-5, I-405, Highway 26 and Highway 217. The main issues with freeway congestion are theinterference of the timely transportation of freight and employee commute times.
Concerns also were voiced regarding the effectiveness of rail service. There is a desire for“longer unit trains,” an increase in the number of switches per day, and “reciprocity” betweenBNSF and UP.
While no individual disadvantage was highly represented, a common overall theme throughoutmany of the interviews appears to be that Portland is now perceived as a difficult place toconduct business for several factors:
• High cost of doing business (both regulatory and market)• Perceived anti-business sentiment• Small economy/consumer market of Portland metro area• Not central to major U.S. markets
A recurring comment throughout the interview process is the perception of Portland as “businessunfriendly,” especially from firms that have been rooted in the harbor area for decades. Thisperception stems from concerns regarding the cost of doing business and the feeling of beingunwanted. Several firms stated that the combination of taxes, utilities, and environmentalcompliance costs are out of line with other metro areas, most notably in the south and east coast,such as North Carolina. For many firms, the competition is now more with urban or ruralcommunities across the U.S., as well as offshore.
As one respondent surmised, “If the city wants to recruit and maintain industries to Portland theyneed to develop incentives (lower cost of taxes and utilities) as well as facilitate a streamlinedpermitting process.” Another firm commented that “it costs $50 to correct a $15 problem.”
Managers or owners of long-time local companies comment on public efforts to court newbusinesses, but view nothing comparable as being done directly for existing firms. The multiplelayers of federal, state, and local government regulations make it difficult or costly to addressissues such as environmental cleanup before a major problem occurs.
E.D. Hovee & Company
Portland Harbor Industrial Lands Study Part Two 26
One small manufacturing firm cited an experience that while making a business trip to acustomer in North Carolina, local public officials “rolled out the red carpet.” They greetedcompany officials at the airport, dined them, and gave a community tour. At the end of thebusiness trip, the Portland business manager was handed a one-page building permit applicationstating that they could literally start construction tomorrow. Company officials were surprised athow well they were treated, especially given the fact they are not a Fortune 500 firm.
When questioned about why the community had gone to so much trouble, local public officialsstated they just wanted to attract firms with good paying jobs. The reason the companyrepresentative mentioned this North Carolina experience was the firm had just completed arecent expansion in Portland. The representative continued by stating that it took an extra 18months to complete their Portland project, due to difficulties in working through Portland’spermitting processes.
Comments made regarding Portland being a small market relate to the fact that many of theharbor area’s major employers do not rely on Portland as their primary source of business. Anumber of manufacturing firms, specifically transportation equipment manufacturers, mentionedthat the east coast and south constitute more significant customer markets for their industry.
Useful Life. For most firms – across all industry groupings – there are no significant constraintsto the remaining useful life of current plan and equipment. The cycle time for reinvestment isconsiderably longer than for many of the region’s high tech firms, for example. A number ofrespondents characterized remaining useful life as “indefinite.” However, a number of themaritime/river-dependent users mentioned that their facilities need investment, but are not likelyto make those decisions for another few years.
F. INTERINDUSTRY LINKAGES
Those interviewed were asked about vendor and supplier relationships service needs,industry/trade association representation, and actions that could be taken “to attract firms withwhom you conduct business to Portland.” Due to the proprietary nature of the questions,responses are noted primarily in broad form. This information was employed in the moredetailed linkage analysis of Chapter Four.
Vendors & Customers. The following profiles are noted by industry group.
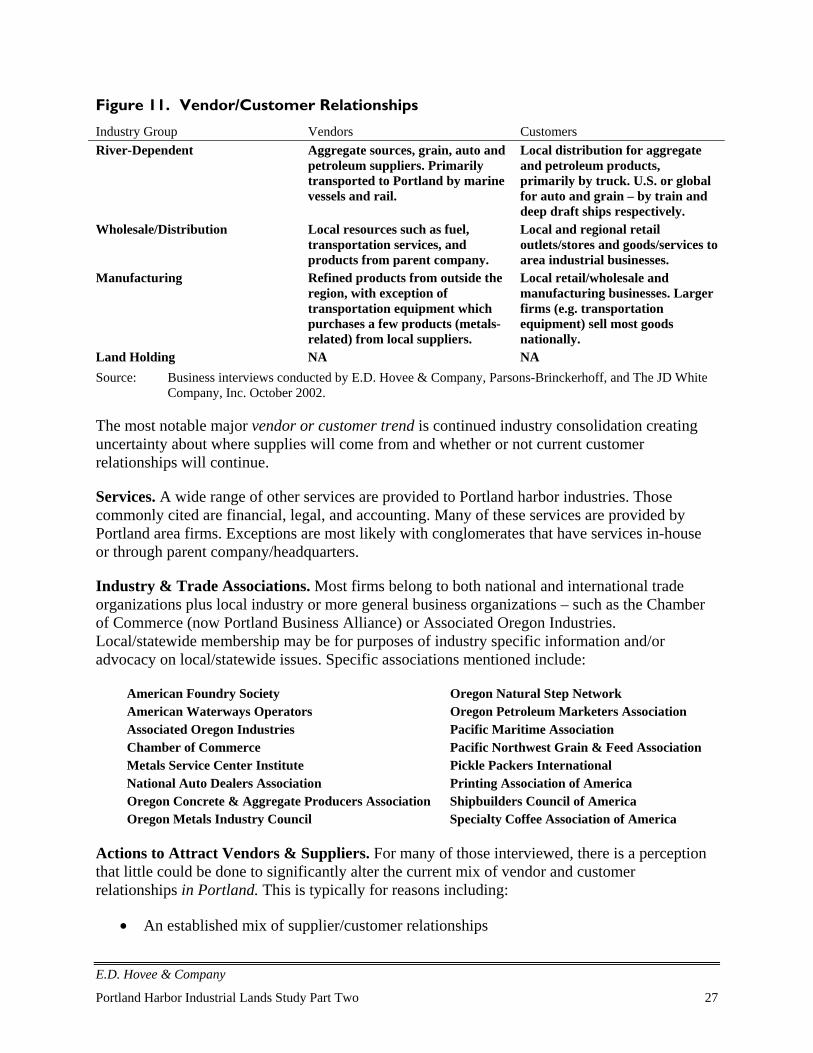
E.D. Hovee & Company
Portland Harbor Industrial Lands Study Part Two 27
Figure 11. Vendor/Customer Relationships
Industry Group Vendors CustomersRiver-Dependent Aggregate sources, grain, auto and
petroleum suppliers. Primarilytransported to Portland by marinevessels and rail.
Local distribution for aggregateand petroleum products,primarily by truck. U.S. or globalfor auto and grain – by train anddeep draft ships respectively.
Wholesale/Distribution Local resources such as fuel,transportation services, andproducts from parent company.
Local and regional retailoutlets/stores and goods/services toarea industrial businesses.
Manufacturing Refined products from outside theregion, with exception oftransportation equipment whichpurchases a few products (metals-related) from local suppliers.
Local retail/wholesale andmanufacturing businesses. Largerfirms (e.g. transportationequipment) sell most goodsnationally.
Land Holding NA NASource: Business interviews conducted by E.D. Hovee & Company, Parsons-Brinckerhoff, and The JD White
Company, Inc. October 2002.
The most notable major vendor or customer trend is continued industry consolidation creatinguncertainty about where supplies will come from and whether or not current customerrelationships will continue.
Services. A wide range of other services are provided to Portland harbor industries. Thosecommonly cited are financial, legal, and accounting. Many of these services are provided byPortland area firms. Exceptions are most likely with conglomerates that have services in-houseor through parent company/headquarters.
Industry & Trade Associations. Most firms belong to both national and international tradeorganizations plus local industry or more general business organizations – such as the Chamberof Commerce (now Portland Business Alliance) or Associated Oregon Industries.Local/statewide membership may be for purposes of industry specific information and/oradvocacy on local/statewide issues. Specific associations mentioned include:
American Foundry Society Oregon Natural Step NetworkAmerican Waterways Operators Oregon Petroleum Marketers AssociationAssociated Oregon Industries Pacific Maritime AssociationChamber of Commerce Pacific Northwest Grain & Feed AssociationMetals Service Center Institute Pickle Packers InternationalNational Auto Dealers Association Printing Association of AmericaOregon Concrete & Aggregate Producers Association Shipbuilders Council of AmericaOregon Metals Industry Council Specialty Coffee Association of America
Actions to Attract Vendors & Suppliers. For many of those interviewed, there is a perceptionthat little could be done to significantly alter the current mix of vendor and customerrelationships in Portland. This is typically for reasons including:
• An established mix of supplier/customer relationships
E.D. Hovee & Company
Portland Harbor Industrial Lands Study Part Two 28
• Specialized nature of key suppliers – not likely to be readily duplicated in Portland• Relatively small size of the Portland market• Negative industry perceptions of Portland as a place to do business
Regarding the small size of the Portland market, one firm stated, “The manufacturing base isn’tlarge enough to support a solid base of vendors to maintain competitive pricing.” A number offirms cite issues with the center of their market located somewhere other than Portland. In somecases, that center is on the East Coast and Portland is “too far.”
One small, but rapidly growing, manufacturing firm commented that they have to seek outsuppliers in other regions around the U.S. and Canada. They indicated a willingness to invest inlocal companies to develop the technologies required locally. However, they want local and stategovernment agencies to demonstrate willingness to partner with them or other local companies inworking through the regulatory process. Basically, the interest in investment is coupled with anexpressed desire for compliance with the regulatory process to feel like more of a “team effort.”
For those who did note some level of opportunity, the following types of actions are suggestedfor vendors and customers:
• Streamlining regulatory process• Providing certainty around environmental issues• Developing a positive business environment• Make transportation improvements• Grow local economy
“Fine tuning the regulatory environment” and “streamlining the review and permit process” werestated by several firms, in order to enable their businesses to make changes in a timely manner.Financially, Portland requires a “higher cost to invest due to the slow city process.”
Many firms stress the importance of developing a positive business environment. One firmexpressed a desire for Portland to “foster and nurture” the “internal growth” of businesses. Thisfirm specifically listed disadvantages as the high cost of land, the large quantity of paperwork,and the lack of support, where as other places have rolled out the “red carpet” and made them“feel wanted.” The representative of another firm simply stated, “It is just a matter of letting usknow you want us!”
G. COMPETITION
The changing competitive landscape may be critical to a firm’s interests in remaining orexpanding in Portland. For harbor industries that service local customers or clientele, globalcompetitiveness is of lesser concern than for Portland businesses selling into the domestic orworldwide market.
As with the discussion of interindustry linkages, the presentation of interview results isaggregated and generalized to avoid disclosure of proprietary information.
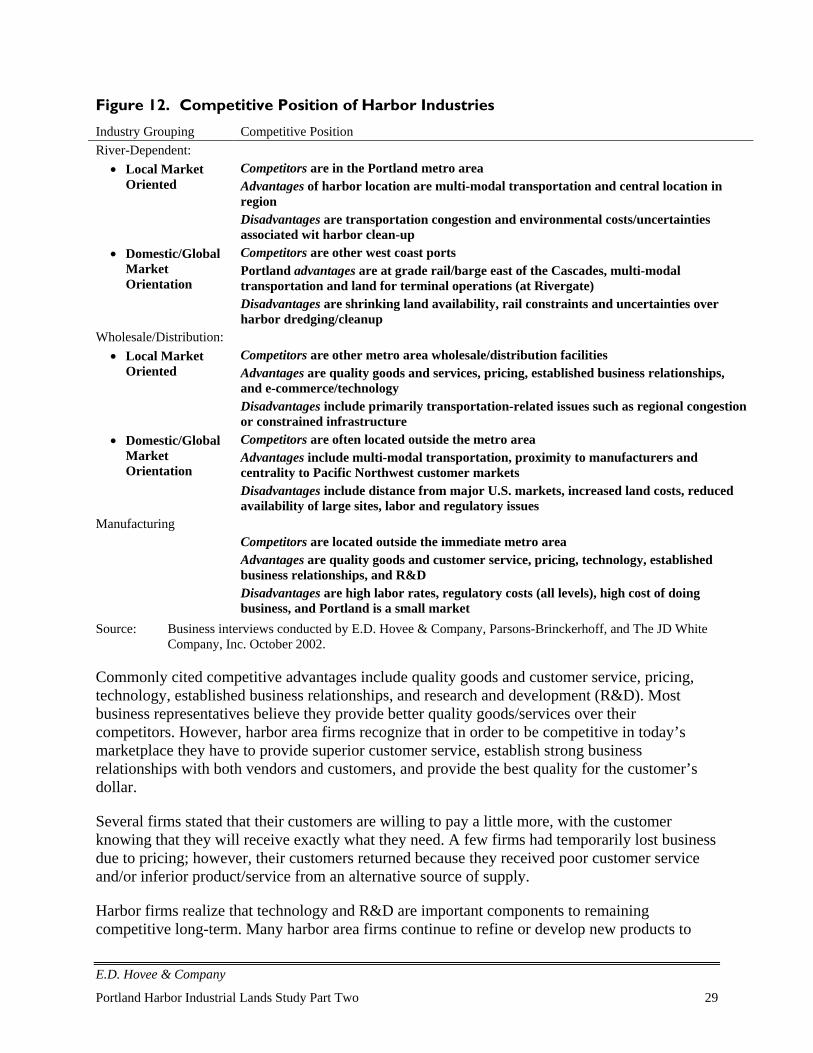
E.D. Hovee & Company
Portland Harbor Industrial Lands Study Part Two 29
Figure 12. Competitive Position of Harbor Industries
Industry Grouping Competitive PositionRiver-Dependent:
• Local MarketOriented
Competitors are in the Portland metro areaAdvantages of harbor location are multi-modal transportation and central location inregionDisadvantages are transportation congestion and environmental costs/uncertaintiesassociated wit harbor clean-up
• Domestic/GlobalMarketOrientation
Competitors are other west coast portsPortland advantages are at grade rail/barge east of the Cascades, multi-modaltransportation and land for terminal operations (at Rivergate)Disadvantages are shrinking land availability, rail constraints and uncertainties overharbor dredging/cleanup
Wholesale/Distribution:• Local Market
OrientedCompetitors are other metro area wholesale/distribution facilitiesAdvantages are quality goods and services, pricing, established business relationships,and e-commerce/technologyDisadvantages include primarily transportation-related issues such as regional congestionor constrained infrastructure
• Domestic/GlobalMarketOrientation
Competitors are often located outside the metro areaAdvantages include multi-modal transportation, proximity to manufacturers andcentrality to Pacific Northwest customer marketsDisadvantages include distance from major U.S. markets, increased land costs, reducedavailability of large sites, labor and regulatory issues
ManufacturingCompetitors are located outside the immediate metro areaAdvantages are quality goods and customer service, pricing, technology, establishedbusiness relationships, and R&DDisadvantages are high labor rates, regulatory costs (all levels), high cost of doingbusiness, and Portland is a small market
Source: Business interviews conducted by E.D. Hovee & Company, Parsons-Brinckerhoff, and The JD WhiteCompany, Inc. October 2002.
Commonly cited competitive advantages include quality goods and customer service, pricing,technology, established business relationships, and research and development (R&D). Mostbusiness representatives believe they provide better quality goods/services over theircompetitors. However, harbor area firms recognize that in order to be competitive in today’smarketplace they have to provide superior customer service, establish strong businessrelationships with both vendors and customers, and provide the best quality for the customer’sdollar.
Several firms stated that their customers are willing to pay a little more, with the customerknowing that they will receive exactly what they need. A few firms had temporarily lost businessdue to pricing; however, their customers returned because they received poor customer serviceand/or inferior product/service from an alternative source of supply.
Harbor firms realize that technology and R&D are important components to remainingcompetitive long-term. Many harbor area firms continue to refine or develop new products to
E.D. Hovee & Company
Portland Harbor Industrial Lands Study Part Two 30
stay ahead of the competition. Examples range from developing new roofing materials to thecreation of enclosed car carriers.
H. TRENDS & EMERGING ISSUES
Business leaders were asked to identify emerging trends or issues affecting their companiescentered around seven specific topics. While there is significant variation, a few key trends arementioned with frequency.
• Consolidation & Mergers – Many firms are continuing to deal with industrymergers/consolidation and trying to determine how they can remain in business. Portlandharbor industries are both forging new global alliances and competing globally. Not onlyare local firms facing increased competition from national/global interests, but they alsoare being affected by consolidation of vendors and customers, as well as being absorbedby national conglomerates.One firm is finding “continued competitive growth by larger, better funded firms.”Another firm cited increased difficulty in maintaining vendor relationships as suppliersare absorbed by large conglomerates. This shrinkage of the competitive base of mid-to-large size firms brings into question the ability to readily procure supplies and/ormaintain a viable customer base.
• Enhancing Transportation Network – Several respondents cite the currenttransportation infrastructure as a key advantage of operating within the Portland harborindustrial area. However, long-term economic viability of the area will require continuedenhancement of the transportation network. Enhancements include minimizing surfacetransportation congestion (for both freight and employee commutes), greater rail capacity(especially unit trains and rail reciprocity), and improved marine terminal facilities (fromcontainers to bulk facilities). Firms realize the importance of the harbor’s transportationnetwork and the need for long-term investments.
• Workforce – Area employers express concern with their ability to access qualified,skilled labor. A number of firms interviewed cite inadequacies in the K-12 school system.As one business manager expressed, “Public schools don’t provide links tomanufacturing.” Another indicated the need for public schools to offer opportunities to betrained in a broad set of skills, from welding to computers. Another growing concern isthe rising cost of labor including benefits, such as healthcare and workers compensation.
• Capital Investment – Representatives of several firms question whether it is feasible orcompetitive to make major long-term investments in Portland. One firm has invested $4.5million in its Portland foundries over the last few years, and over half of that investmenthas been for environmental regulations. As stated by the respondent, “Future capitalinvested in Portland will depend on the Portland plant’s ability to compete in theworldwide markets.” This competitiveness is hampered when a significant portion of newinvestment is aimed at regulatory compliance – which creates little added value tocustomers.
Many of those interviewed expect to continue making minor investments to maintaintheir current competitiveness. Continued automation and integration of new technologiesis pivotal for remaining in business.
E.D. Hovee & Company
Portland Harbor Industrial Lands Study Part Two 31
Firms today are more reliant on e-commerce and telecommunications for reachingcustomers or buying from suppliers. Continued automation will likely lead to greaterproduction, at least in the short-term. However, as traditional industries mature, fewergains from automation may be realized, raising questions about long-term stability andviability.
I. CHALLENGES, OPPORTUNITIES & PLANS
Primary Challenges. When asked what is the most important challenge presently facing yourfirm’s operation in regards to its current location, answers tended to be unique to each firm inquestion. However, these specific answers can be grouped into several common categories.Caution in interpreting these interview results is warranted – due to the location and industryspecific nature of the comments received.
Local Infrastructure & Regulatory Environment:
• Anti-business environment – perception of not being wanted or frustrations resultingfrom bad regulatory experience
• Expensive place to conduct business (e.g. high taxes, stringent environmentalregulations, difficult permitting, etc.) – refers to the combination of a down economyand rising regulatory costs
• Understanding, working and complying with regulations – including difficulties inworking through malaise of local, state, and federal regulations
• Encroachment of non-industrial activity – specific to areas bordered by residential• Traffic congestion – mostly with respect to the regional freeway and arterial system
Marine/Port Facilities:
• Channel deepening to maintain viable port facilities• Better configuration of rail access to minimize site access issues• Long-term ability to handle marine cargo demand and required facilities
Private Market Issues:
• Minimizing costs to be competitive – both regulatory and internal to firm• Generating enough business to utilize existing capacity – Portland is a small market• Finding adequate skilled and motivated labor• Rising labor costs• Keeping up with customer demand• Penetrating new markets• Finding unencumbered available land/space to meet long-term needs
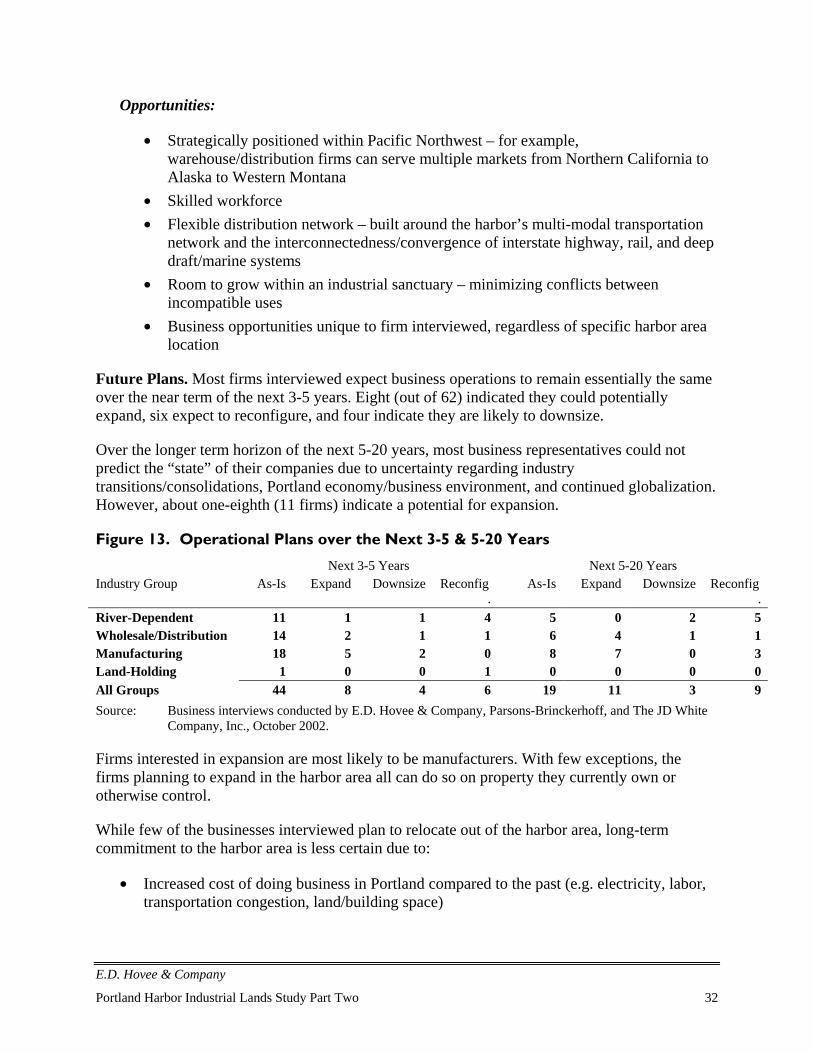
E.D. Hovee & Company
Portland Harbor Industrial Lands Study Part Two 32
Opportunities:
• Strategically positioned within Pacific Northwest – for example,warehouse/distribution firms can serve multiple markets from Northern California toAlaska to Western Montana
• Skilled workforce• Flexible distribution network – built around the harbor’s multi-modal transportation
network and the interconnectedness/convergence of interstate highway, rail, and deepdraft/marine systems
• Room to grow within an industrial sanctuary – minimizing conflicts betweenincompatible uses
• Business opportunities unique to firm interviewed, regardless of specific harbor arealocation
Future Plans. Most firms interviewed expect business operations to remain essentially the sameover the near term of the next 3-5 years. Eight (out of 62) indicated they could potentiallyexpand, six expect to reconfigure, and four indicate they are likely to downsize.
Over the longer term horizon of the next 5-20 years, most business representatives could notpredict the “state” of their companies due to uncertainty regarding industrytransitions/consolidations, Portland economy/business environment, and continued globalization.However, about one-eighth (11 firms) indicate a potential for expansion.
Figure 13. Operational Plans over the Next 3-5 & 5-20 Years
Next 3-5 Years Next 5-20 YearsIndustry Group As-Is Expand Downsize Reconfig
.As-Is Expand Downsize Reconfig
.River-Dependent 11 1 1 4 5 0 2 5Wholesale/Distribution 14 2 1 1 6 4 1 1Manufacturing 18 5 2 0 8 7 0 3Land-Holding 1 0 0 1 0 0 0 0All Groups 44 8 4 6 19 11 3 9Source: Business interviews conducted by E.D. Hovee & Company, Parsons-Brinckerhoff, and The JD White
Company, Inc., October 2002.
Firms interested in expansion are most likely to be manufacturers. With few exceptions, thefirms planning to expand in the harbor area all can do so on property they currently own orotherwise control.
While few of the businesses interviewed plan to relocate out of the harbor area, long-termcommitment to the harbor area is less certain due to:
• Increased cost of doing business in Portland compared to the past (e.g. electricity, labor,transportation congestion, land/building space)
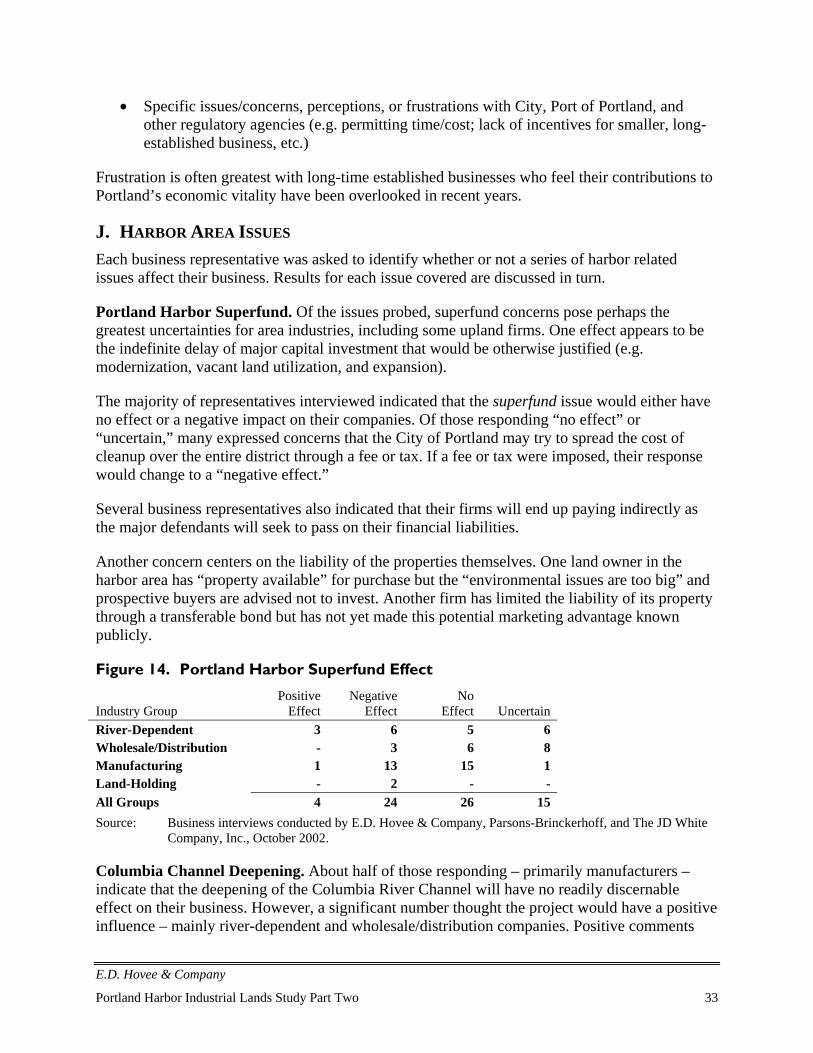
E.D. Hovee & Company
Portland Harbor Industrial Lands Study Part Two 33
• Specific issues/concerns, perceptions, or frustrations with City, Port of Portland, andother regulatory agencies (e.g. permitting time/cost; lack of incentives for smaller, long-established business, etc.)
Frustration is often greatest with long-time established businesses who feel their contributions toPortland’s economic vitality have been overlooked in recent years.
J. HARBOR AREA ISSUES
Each business representative was asked to identify whether or not a series of harbor relatedissues affect their business. Results for each issue covered are discussed in turn.
Portland Harbor Superfund. Of the issues probed, superfund concerns pose perhaps thegreatest uncertainties for area industries, including some upland firms. One effect appears to bethe indefinite delay of major capital investment that would be otherwise justified (e.g.modernization, vacant land utilization, and expansion).
The majority of representatives interviewed indicated that the superfund issue would either haveno effect or a negative impact on their companies. Of those responding “no effect” or“uncertain,” many expressed concerns that the City of Portland may try to spread the cost ofcleanup over the entire district through a fee or tax. If a fee or tax were imposed, their responsewould change to a “negative effect.”
Several business representatives also indicated that their firms will end up paying indirectly asthe major defendants will seek to pass on their financial liabilities.
Another concern centers on the liability of the properties themselves. One land owner in theharbor area has “property available” for purchase but the “environmental issues are too big” andprospective buyers are advised not to invest. Another firm has limited the liability of its propertythrough a transferable bond but has not yet made this potential marketing advantage knownpublicly.
Figure 14. Portland Harbor Superfund Effect
Industry GroupPositive
EffectNegative
EffectNo
Effect UncertainRiver-Dependent 3 6 5 6Wholesale/Distribution - 3 6 8Manufacturing 1 13 15 1Land-Holding - 2 - -All Groups 4 24 26 15Source: Business interviews conducted by E.D. Hovee & Company, Parsons-Brinckerhoff, and The JD White
Company, Inc., October 2002.
Columbia Channel Deepening. About half of those responding – primarily manufacturers –indicate that the deepening of the Columbia River Channel will have no readily discernableeffect on their business. However, a significant number thought the project would have a positiveinfluence – mainly river-dependent and wholesale/distribution companies. Positive comments
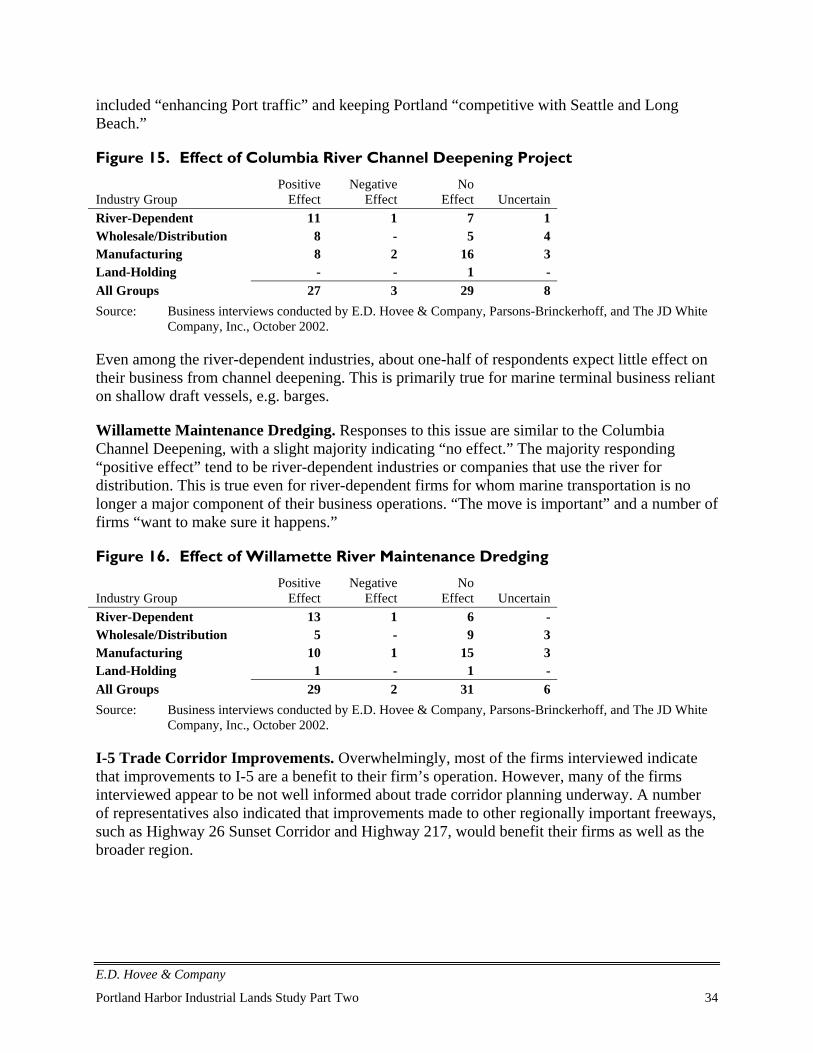
E.D. Hovee & Company
Portland Harbor Industrial Lands Study Part Two 34
included “enhancing Port traffic” and keeping Portland “competitive with Seattle and LongBeach.”
Figure 15. Effect of Columbia River Channel Deepening Project
Industry GroupPositive
EffectNegative
EffectNo
Effect UncertainRiver-Dependent 11 1 7 1Wholesale/Distribution 8 - 5 4Manufacturing 8 2 16 3Land-Holding - - 1 -All Groups 27 3 29 8Source: Business interviews conducted by E.D. Hovee & Company, Parsons-Brinckerhoff, and The JD White
Company, Inc., October 2002.
Even among the river-dependent industries, about one-half of respondents expect little effect ontheir business from channel deepening. This is primarily true for marine terminal business relianton shallow draft vessels, e.g. barges.
Willamette Maintenance Dredging. Responses to this issue are similar to the ColumbiaChannel Deepening, with a slight majority indicating “no effect.” The majority responding“positive effect” tend to be river-dependent industries or companies that use the river fordistribution. This is true even for river-dependent firms for whom marine transportation is nolonger a major component of their business operations. “The move is important” and a number offirms “want to make sure it happens.”
Figure 16. Effect of Willamette River Maintenance Dredging
Industry GroupPositive
EffectNegative
EffectNo
Effect UncertainRiver-Dependent 13 1 6 -Wholesale/Distribution 5 - 9 3Manufacturing 10 1 15 3Land-Holding 1 - 1 -All Groups 29 2 31 6Source: Business interviews conducted by E.D. Hovee & Company, Parsons-Brinckerhoff, and The JD White
Company, Inc., October 2002.
I-5 Trade Corridor Improvements. Overwhelmingly, most of the firms interviewed indicatethat improvements to I-5 are a benefit to their firm’s operation. However, many of the firmsinterviewed appear to be not well informed about trade corridor planning underway. A numberof representatives also indicated that improvements made to other regionally important freeways,such as Highway 26 Sunset Corridor and Highway 217, would benefit their firms as well as thebroader region.
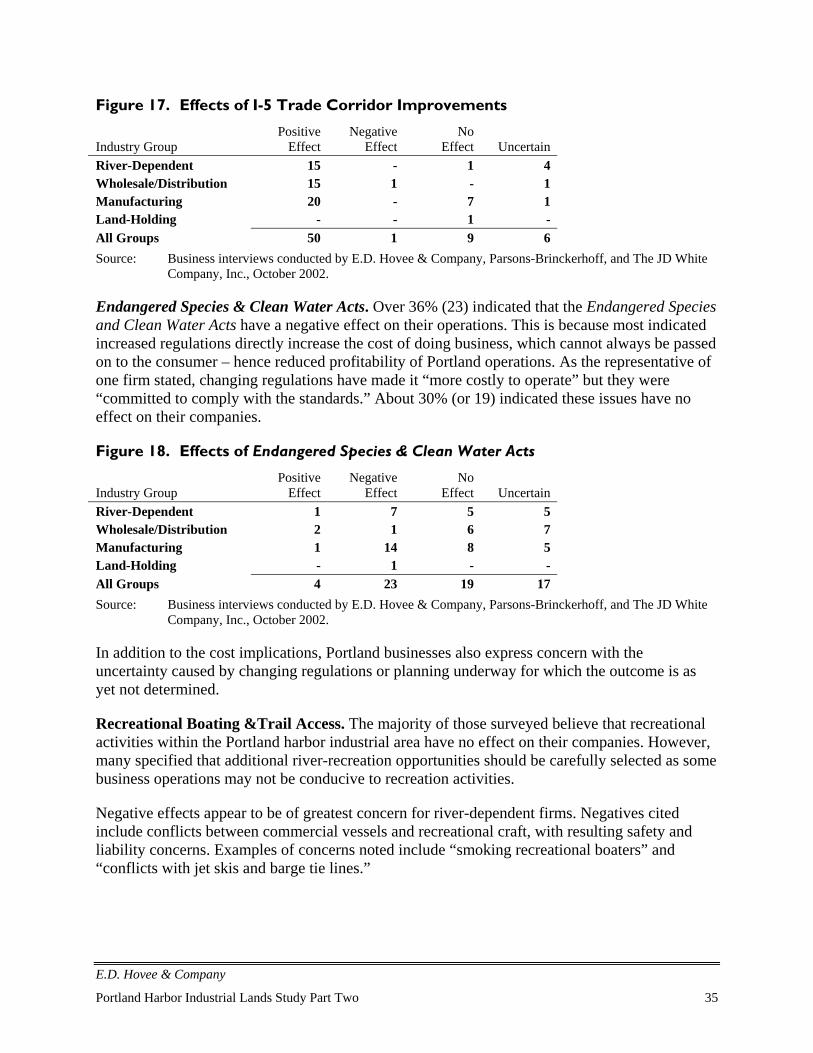
E.D. Hovee & Company
Portland Harbor Industrial Lands Study Part Two 35
Figure 17. Effects of I-5 Trade Corridor Improvements
Industry GroupPositive
EffectNegative
EffectNo
Effect UncertainRiver-Dependent 15 - 1 4Wholesale/Distribution 15 1 - 1Manufacturing 20 - 7 1Land-Holding - - 1 -All Groups 50 1 9 6Source: Business interviews conducted by E.D. Hovee & Company, Parsons-Brinckerhoff, and The JD White
Company, Inc., October 2002.
Endangered Species & Clean Water Acts. Over 36% (23) indicated that the Endangered Speciesand Clean Water Acts have a negative effect on their operations. This is because most indicatedincreased regulations directly increase the cost of doing business, which cannot always be passedon to the consumer – hence reduced profitability of Portland operations. As the representative ofone firm stated, changing regulations have made it “more costly to operate” but they were“committed to comply with the standards.” About 30% (or 19) indicated these issues have noeffect on their companies.
Figure 18. Effects of Endangered Species & Clean Water Acts
Industry GroupPositive
EffectNegative
EffectNo
Effect UncertainRiver-Dependent 1 7 5 5Wholesale/Distribution 2 1 6 7Manufacturing 1 14 8 5Land-Holding - 1 - -All Groups 4 23 19 17Source: Business interviews conducted by E.D. Hovee & Company, Parsons-Brinckerhoff, and The JD White
Company, Inc., October 2002.
In addition to the cost implications, Portland businesses also express concern with theuncertainty caused by changing regulations or planning underway for which the outcome is asyet not determined.
Recreational Boating &Trail Access. The majority of those surveyed believe that recreationalactivities within the Portland harbor industrial area have no effect on their companies. However,many specified that additional river-recreation opportunities should be carefully selected as somebusiness operations may not be conducive to recreation activities.
Negative effects appear to be of greatest concern for river-dependent firms. Negatives citedinclude conflicts between commercial vessels and recreational craft, with resulting safety andliability concerns. Examples of concerns noted include “smoking recreational boaters” and“conflicts with jet skis and barge tie lines.”
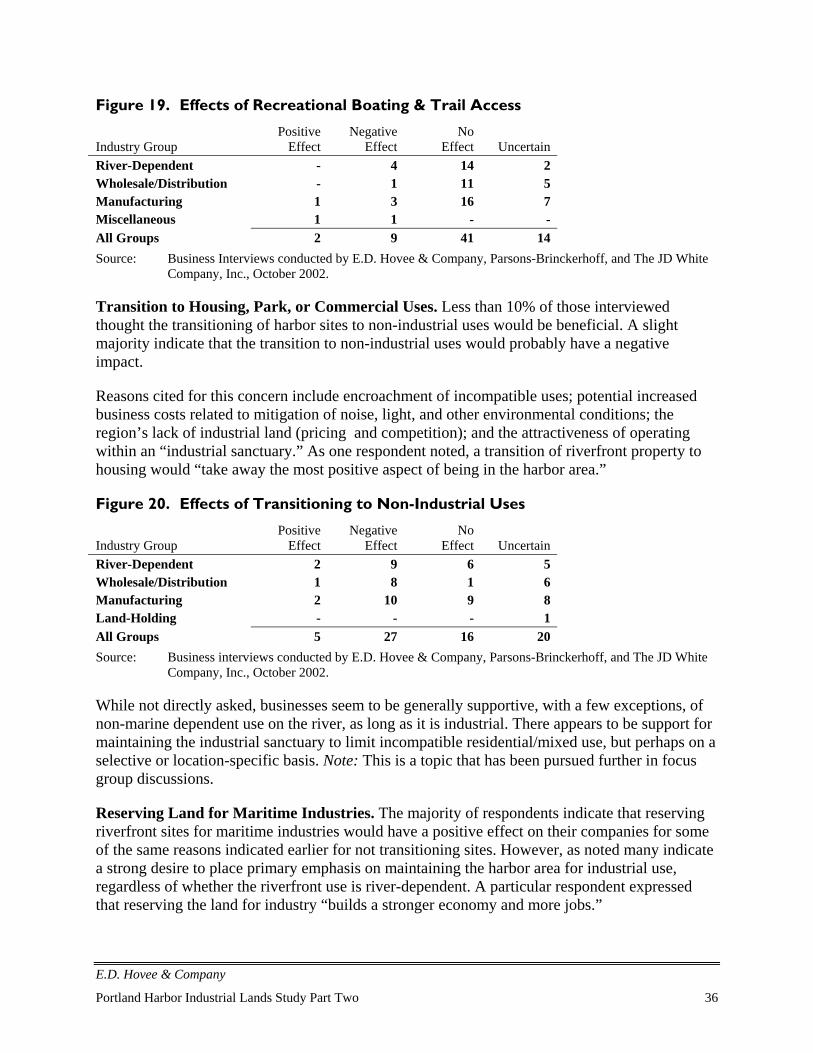
E.D. Hovee & Company
Portland Harbor Industrial Lands Study Part Two 36
Figure 19. Effects of Recreational Boating & Trail Access
Industry GroupPositive
EffectNegative
EffectNo
Effect UncertainRiver-Dependent - 4 14 2Wholesale/Distribution - 1 11 5Manufacturing 1 3 16 7Miscellaneous 1 1 - -All Groups 2 9 41 14Source: Business Interviews conducted by E.D. Hovee & Company, Parsons-Brinckerhoff, and The JD White
Company, Inc., October 2002.
Transition to Housing, Park, or Commercial Uses. Less than 10% of those interviewedthought the transitioning of harbor sites to non-industrial uses would be beneficial. A slightmajority indicate that the transition to non-industrial uses would probably have a negativeimpact.
Reasons cited for this concern include encroachment of incompatible uses; potential increasedbusiness costs related to mitigation of noise, light, and other environmental conditions; theregion’s lack of industrial land (pricing and competition); and the attractiveness of operatingwithin an “industrial sanctuary.” As one respondent noted, a transition of riverfront property tohousing would “take away the most positive aspect of being in the harbor area.”
Figure 20. Effects of Transitioning to Non-Industrial Uses
Industry GroupPositive
EffectNegative
EffectNo
Effect UncertainRiver-Dependent 2 9 6 5Wholesale/Distribution 1 8 1 6Manufacturing 2 10 9 8Land-Holding - - - 1All Groups 5 27 16 20Source: Business interviews conducted by E.D. Hovee & Company, Parsons-Brinckerhoff, and The JD White
Company, Inc., October 2002.
While not directly asked, businesses seem to be generally supportive, with a few exceptions, ofnon-marine dependent use on the river, as long as it is industrial. There appears to be support formaintaining the industrial sanctuary to limit incompatible residential/mixed use, but perhaps on aselective or location-specific basis. Note: This is a topic that has been pursued further in focusgroup discussions.
Reserving Land for Maritime Industries. The majority of respondents indicate that reservingriverfront sites for maritime industries would have a positive effect on their companies for someof the same reasons indicated earlier for not transitioning sites. However, as noted many indicatea strong desire to place primary emphasis on maintaining the harbor area for industrial use,regardless of whether the riverfront use is river-dependent. A particular respondent expressedthat reserving the land for industry “builds a stronger economy and more jobs.”
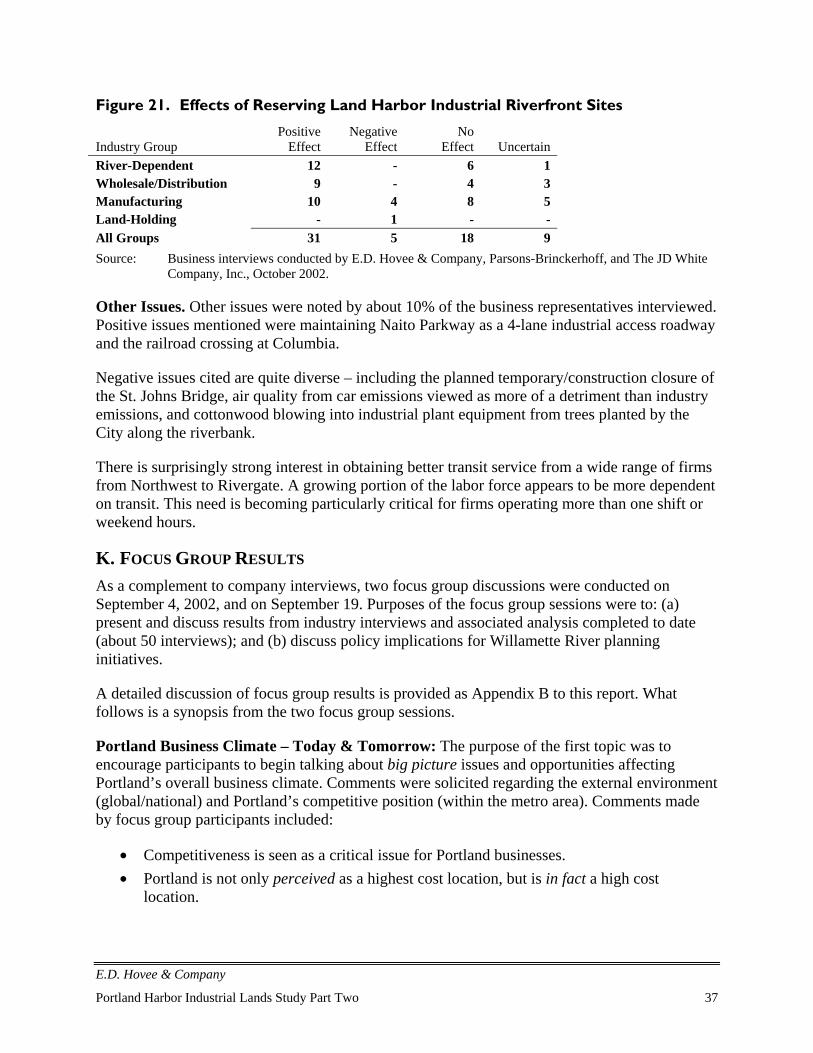
E.D. Hovee & Company
Portland Harbor Industrial Lands Study Part Two 37
Figure 21. Effects of Reserving Land Harbor Industrial Riverfront Sites
Industry GroupPositive
EffectNegative
EffectNo
Effect UncertainRiver-Dependent 12 - 6 1Wholesale/Distribution 9 - 4 3Manufacturing 10 4 8 5Land-Holding - 1 - -All Groups 31 5 18 9Source: Business interviews conducted by E.D. Hovee & Company, Parsons-Brinckerhoff, and The JD White
Company, Inc., October 2002.
Other Issues. Other issues were noted by about 10% of the business representatives interviewed.Positive issues mentioned were maintaining Naito Parkway as a 4-lane industrial access roadwayand the railroad crossing at Columbia.
Negative issues cited are quite diverse – including the planned temporary/construction closure ofthe St. Johns Bridge, air quality from car emissions viewed as more of a detriment than industryemissions, and cottonwood blowing into industrial plant equipment from trees planted by theCity along the riverbank.
There is surprisingly strong interest in obtaining better transit service from a wide range of firmsfrom Northwest to Rivergate. A growing portion of the labor force appears to be more dependenton transit. This need is becoming particularly critical for firms operating more than one shift orweekend hours.
K. FOCUS GROUP RESULTS
As a complement to company interviews, two focus group discussions were conducted onSeptember 4, 2002, and on September 19. Purposes of the focus group sessions were to: (a)present and discuss results from industry interviews and associated analysis completed to date(about 50 interviews); and (b) discuss policy implications for Willamette River planninginitiatives.
A detailed discussion of focus group results is provided as Appendix B to this report. Whatfollows is a synopsis from the two focus group sessions.
Portland Business Climate – Today & Tomorrow: The purpose of the first topic was toencourage participants to begin talking about big picture issues and opportunities affectingPortland’s overall business climate. Comments were solicited regarding the external environment(global/national) and Portland’s competitive position (within the metro area). Comments madeby focus group participants included:
• Competitiveness is seen as a critical issue for Portland businesses.• Portland is not only perceived as a highest cost location, but is in fact a high cost
location.
E.D. Hovee & Company
Portland Harbor Industrial Lands Study Part Two 38
• There is a perception that the City and Port have adopted the attitude that if companiesmove anywhere in the region, it’s good for the region – even if they don’t stay in the Cityof Portland.
• There seems to be a “so what” public agency mind set – exemplified by the City’shandling of the Columbia Sportswear corporate headquarters office relocation.
• Environmental regulatory encroachment is voiced as a growing concern.• Does Portland have a continuing role as a major west coast port? What is that role?• Portland’s harbor area is “out of the mainstream” and receives little visibility or public
interest. There is no branding of the harbor image or product.• Portland now has a reputation of having no land to build on.• Certainly Title 3 exacerbates the situation including the provision that you can’t develop
just one portion of a parcel.• More than one company representative stated that the firm has expanded outside of
Oregon, but not within the state.• There was a comment that “there is nothing like a good recession to get people’s
attention.” Another participant questioned whether this (focus on harbor industry andother economic development needs region-wide) is just “palliative” and short-term untilthe current recession ends.
• The anticipated River Plan can be a step in the right direction.
Harbor Questions & Discussion: The remainder of each focus group session was organized toprovide background information and obtain participant input on four harbor area questions. Eachquestion is presented, followed by preliminary findings from interviews and then representativeparticipant comments.
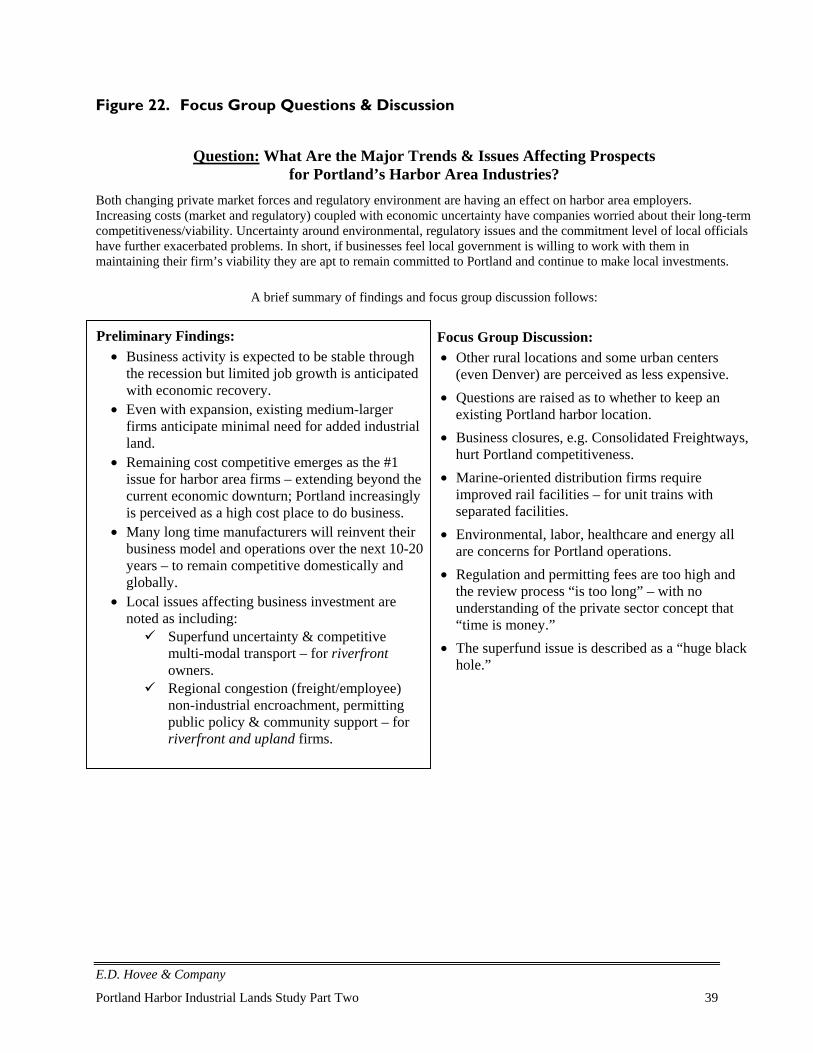
E.D. Hovee & Company
Portland Harbor Industrial Lands Study Part Two 39
Figure 22. Focus Group Questions & Discussion
Question: What Are the Major Trends & Issues Affecting Prospectsfor Portland’s Harbor Area Industries?
Both changing private market forces and regulatory environment are having an effect on harbor area employers.Increasing costs (market and regulatory) coupled with economic uncertainty have companies worried about their long-termcompetitiveness/viability. Uncertainty around environmental, regulatory issues and the commitment level of local officialshave further exacerbated problems. In short, if businesses feel local government is willing to work with them inmaintaining their firm’s viability they are apt to remain committed to Portland and continue to make local investments.
A brief summary of findings and focus group discussion follows:
Focus Group Discussion:• Other rural locations and some urban centers
(even Denver) are perceived as less expensive.• Questions are raised as to whether to keep an
existing Portland harbor location.• Business closures, e.g. Consolidated Freightways,
hurt Portland competitiveness.• Marine-oriented distribution firms require
improved rail facilities – for unit trains withseparated facilities.
• Environmental, labor, healthcare and energy allare concerns for Portland operations.
• Regulation and permitting fees are too high andthe review process “is too long” – with nounderstanding of the private sector concept that“time is money.”
• The superfund issue is described as a “huge blackhole.”
Preliminary Findings:• Business activity is expected to be stable through
the recession but limited job growth is anticipatedwith economic recovery.
• Even with expansion, existing medium-largerfirms anticipate minimal need for added industrialland.
• Remaining cost competitive emerges as the #1issue for harbor area firms – extending beyond thecurrent economic downturn; Portland increasinglyis perceived as a high cost place to do business.
• Many long time manufacturers will reinvent theirbusiness model and operations over the next 10-20years – to remain competitive domestically andglobally.
• Local issues affecting business investment arenoted as including:
Superfund uncertainty & competitivemulti-modal transport – for riverfrontowners.
Regional congestion (freight/employee)non-industrial encroachment, permittingpublic policy & community support – forriverfront and upland firms.
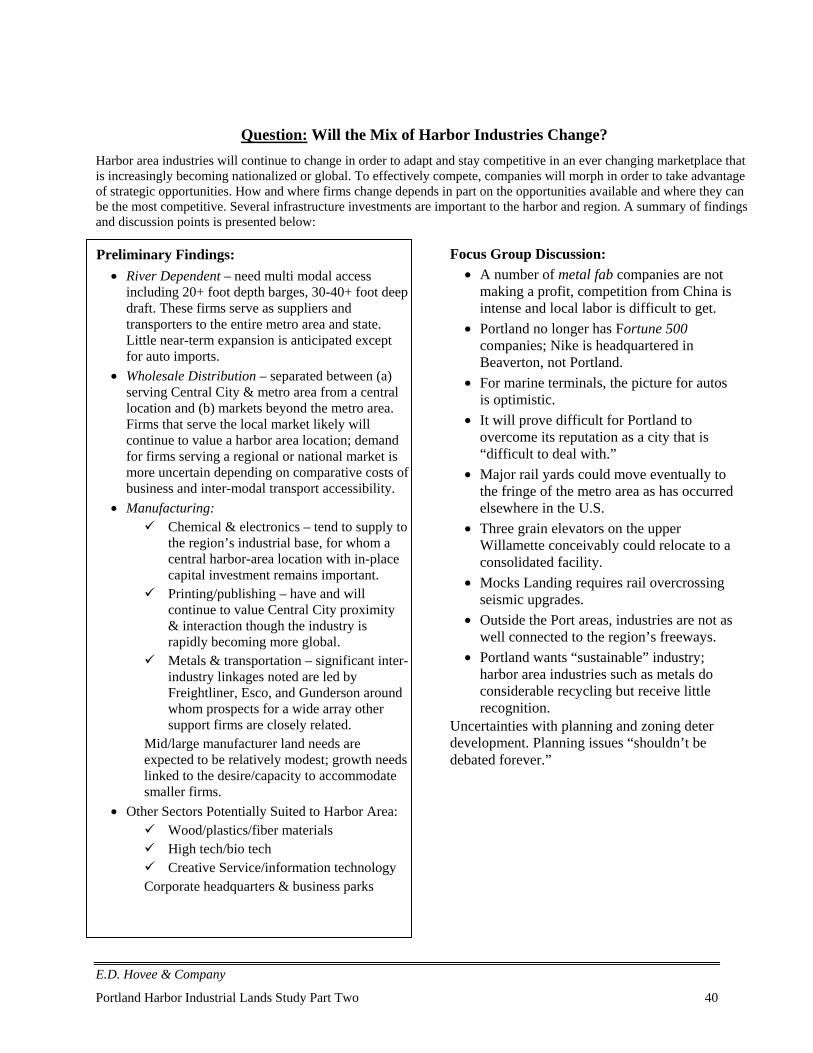
E.D. Hovee & Company
Portland Harbor Industrial Lands Study Part Two 40
Question: Will the Mix of Harbor Industries Change?Harbor area industries will continue to change in order to adapt and stay competitive in an ever changing marketplace thatis increasingly becoming nationalized or global. To effectively compete, companies will morph in order to take advantageof strategic opportunities. How and where firms change depends in part on the opportunities available and where they canbe the most competitive. Several infrastructure investments are important to the harbor and region. A summary of findingsand discussion points is presented below:
Focus Group Discussion:• A number of metal fab companies are not
making a profit, competition from China isintense and local labor is difficult to get.
• Portland no longer has Fortune 500companies; Nike is headquartered inBeaverton, not Portland.
• For marine terminals, the picture for autosis optimistic.
• It will prove difficult for Portland toovercome its reputation as a city that is“difficult to deal with.”
• Major rail yards could move eventually tothe fringe of the metro area as has occurredelsewhere in the U.S.
• Three grain elevators on the upperWillamette conceivably could relocate to aconsolidated facility.
• Mocks Landing requires rail overcrossingseismic upgrades.
• Outside the Port areas, industries are not aswell connected to the region’s freeways.
• Portland wants “sustainable” industry;harbor area industries such as metals doconsiderable recycling but receive littlerecognition.
Uncertainties with planning and zoning deterdevelopment. Planning issues “shouldn’t bedebated forever.”
Preliminary Findings:• River Dependent – need multi modal access
including 20+ foot depth barges, 30-40+ foot deepdraft. These firms serve as suppliers andtransporters to the entire metro area and state.Little near-term expansion is anticipated exceptfor auto imports.
• Wholesale Distribution – separated between (a)serving Central City & metro area from a centrallocation and (b) markets beyond the metro area.Firms that serve the local market likely willcontinue to value a harbor area location; demandfor firms serving a regional or national market ismore uncertain depending on comparative costs ofbusiness and inter-modal transport accessibility.
• Manufacturing: Chemical & electronics – tend to supply to
the region’s industrial base, for whom acentral harbor-area location with in-placecapital investment remains important.
Printing/publishing – have and willcontinue to value Central City proximity& interaction though the industry israpidly becoming more global.
Metals & transportation – significant inter-industry linkages noted are led byFreightliner, Esco, and Gunderson aroundwhom prospects for a wide array othersupport firms are closely related.
Mid/large manufacturer land needs areexpected to be relatively modest; growth needslinked to the desire/capacity to accommodatesmaller firms.
• Other Sectors Potentially Suited to Harbor Area: Wood/plastics/fiber materials High tech/bio tech Creative Service/information technology
Corporate headquarters & business parks
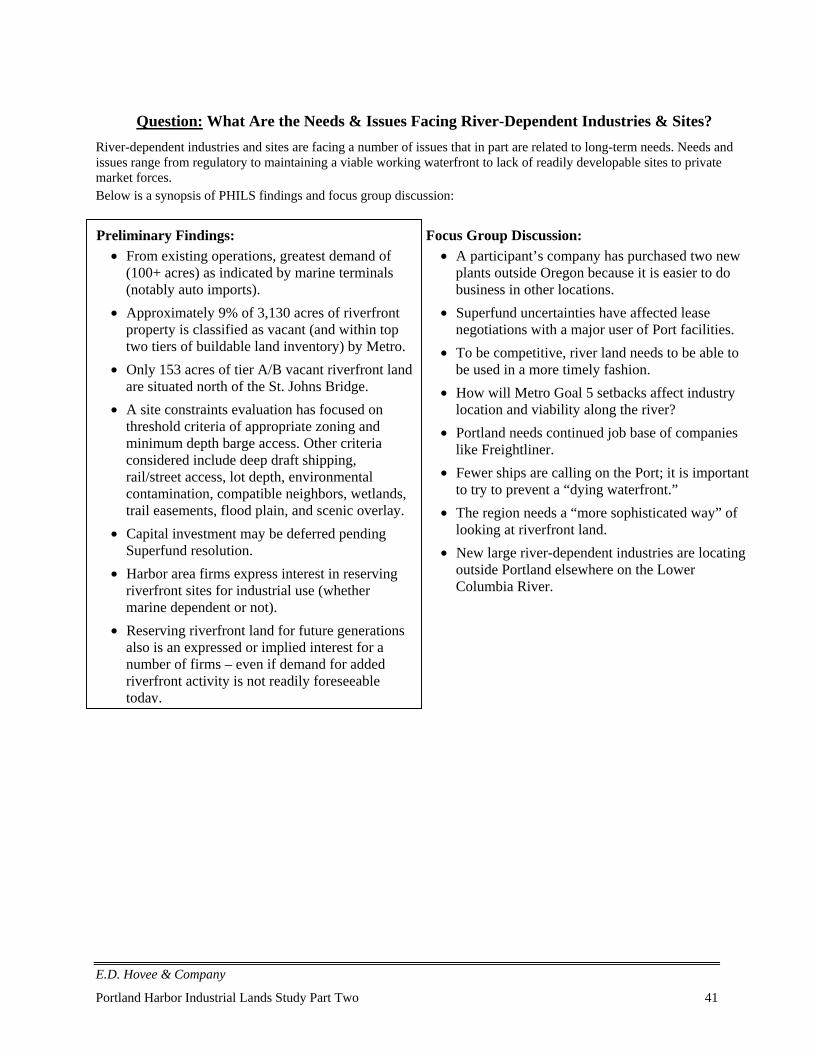
E.D. Hovee & Company
Portland Harbor Industrial Lands Study Part Two 41
Question: What Are the Needs & Issues Facing River-Dependent Industries & Sites?River-dependent industries and sites are facing a number of issues that in part are related to long-term needs. Needs andissues range from regulatory to maintaining a viable working waterfront to lack of readily developable sites to privatemarket forces.Below is a synopsis of PHILS findings and focus group discussion:
Focus Group Discussion:• A participant’s company has purchased two new
plants outside Oregon because it is easier to dobusiness in other locations.
• Superfund uncertainties have affected leasenegotiations with a major user of Port facilities.
• To be competitive, river land needs to be able tobe used in a more timely fashion.
• How will Metro Goal 5 setbacks affect industrylocation and viability along the river?
• Portland needs continued job base of companieslike Freightliner.
• Fewer ships are calling on the Port; it is importantto try to prevent a “dying waterfront.”
• The region needs a “more sophisticated way” oflooking at riverfront land.
• New large river-dependent industries are locatingoutside Portland elsewhere on the LowerColumbia River.
Preliminary Findings:• From existing operations, greatest demand of
(100+ acres) as indicated by marine terminals(notably auto imports).
• Approximately 9% of 3,130 acres of riverfrontproperty is classified as vacant (and within toptwo tiers of buildable land inventory) by Metro.
• Only 153 acres of tier A/B vacant riverfront landare situated north of the St. Johns Bridge.
• A site constraints evaluation has focused onthreshold criteria of appropriate zoning andminimum depth barge access. Other criteriaconsidered include deep draft shipping,rail/street access, lot depth, environmentalcontamination, compatible neighbors, wetlands,trail easements, flood plain, and scenic overlay.
• Capital investment may be deferred pendingSuperfund resolution.
• Harbor area firms express interest in reservingriverfront sites for industrial use (whethermarine dependent or not).
• Reserving riverfront land for future generationsalso is an expressed or implied interest for anumber of firms – even if demand for addedriverfront activity is not readily foreseeabletoday.
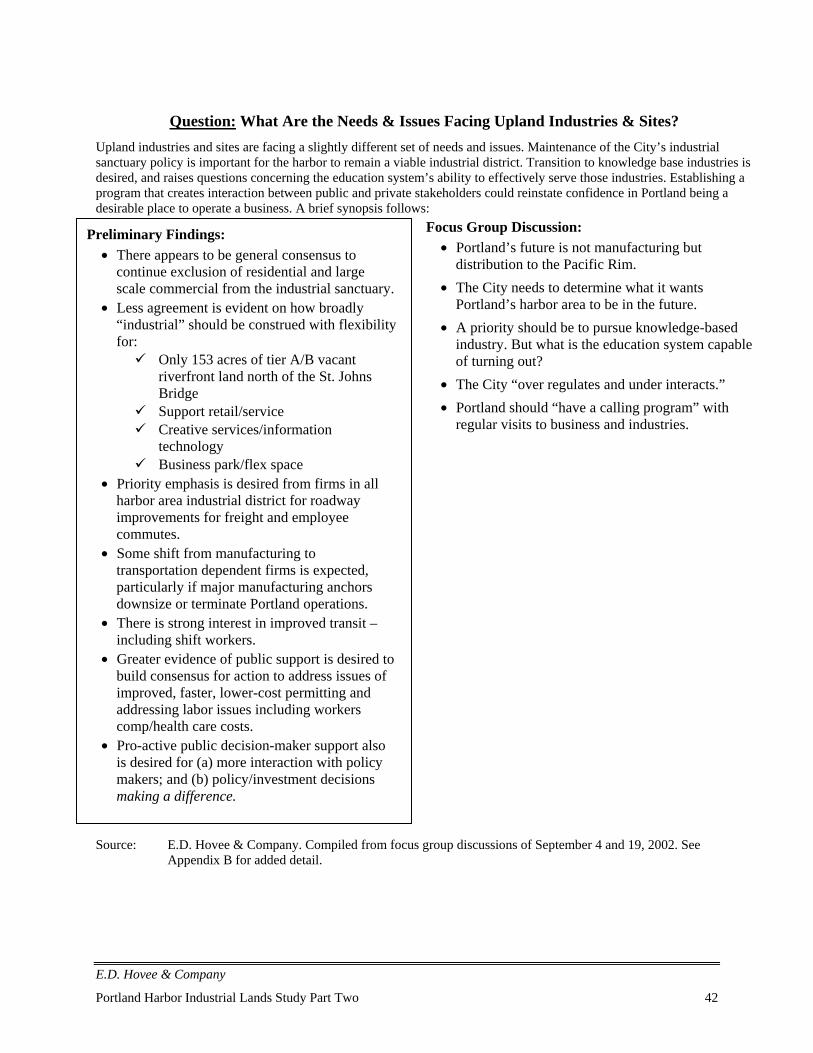
E.D. Hovee & Company
Portland Harbor Industrial Lands Study Part Two 42
Question: What Are the Needs & Issues Facing Upland Industries & Sites?Upland industries and sites are facing a slightly different set of needs and issues. Maintenance of the City’s industrialsanctuary policy is important for the harbor to remain a viable industrial district. Transition to knowledge base industries isdesired, and raises questions concerning the education system’s ability to effectively serve those industries. Establishing aprogram that creates interaction between public and private stakeholders could reinstate confidence in Portland being adesirable place to operate a business. A brief synopsis follows:
Focus Group Discussion:• Portland’s future is not manufacturing but
distribution to the Pacific Rim.• The City needs to determine what it wants
Portland’s harbor area to be in the future.• A priority should be to pursue knowledge-based
industry. But what is the education system capableof turning out?
• The City “over regulates and under interacts.”• Portland should “have a calling program” with
regular visits to business and industries.
Source: E.D. Hovee & Company. Compiled from focus group discussions of September 4 and 19, 2002. SeeAppendix B for added detail.
Preliminary Findings:• There appears to be general consensus to
continue exclusion of residential and largescale commercial from the industrial sanctuary.
• Less agreement is evident on how broadly“industrial” should be construed with flexibilityfor:
Only 153 acres of tier A/B vacantriverfront land north of the St. JohnsBridge
Support retail/service Creative services/information
technology Business park/flex space
• Priority emphasis is desired from firms in allharbor area industrial district for roadwayimprovements for freight and employeecommutes.
• Some shift from manufacturing totransportation dependent firms is expected,particularly if major manufacturing anchorsdownsize or terminate Portland operations.
• There is strong interest in improved transit –including shift workers.
• Greater evidence of public support is desired tobuild consensus for action to address issues ofimproved, faster, lower-cost permitting andaddressing labor issues including workerscomp/health care costs.
• Pro-active public decision-maker support alsois desired for (a) more interaction with policymakers; and (b) policy/investment decisionsmaking a difference.
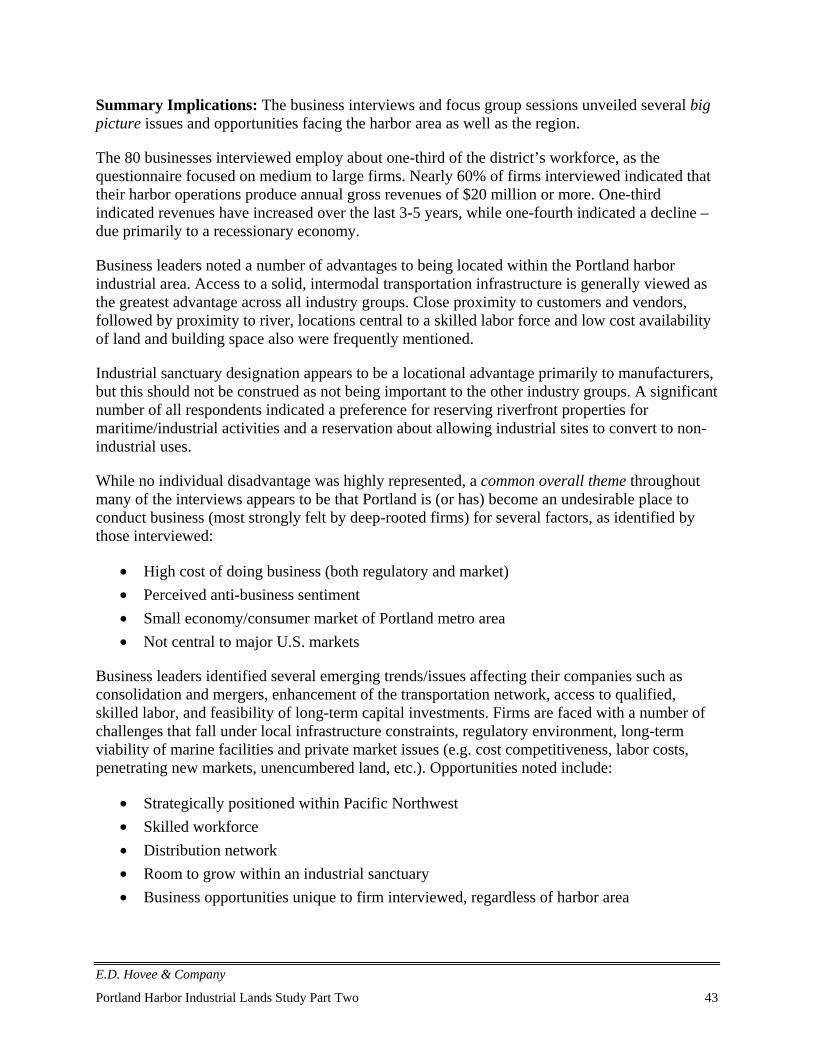
E.D. Hovee & Company
Portland Harbor Industrial Lands Study Part Two 43
Summary Implications: The business interviews and focus group sessions unveiled several bigpicture issues and opportunities facing the harbor area as well as the region.
The 80 businesses interviewed employ about one-third of the district’s workforce, as thequestionnaire focused on medium to large firms. Nearly 60% of firms interviewed indicated thattheir harbor operations produce annual gross revenues of $20 million or more. One-thirdindicated revenues have increased over the last 3-5 years, while one-fourth indicated a decline –due primarily to a recessionary economy.
Business leaders noted a number of advantages to being located within the Portland harborindustrial area. Access to a solid, intermodal transportation infrastructure is generally viewed asthe greatest advantage across all industry groups. Close proximity to customers and vendors,followed by proximity to river, locations central to a skilled labor force and low cost availabilityof land and building space also were frequently mentioned.
Industrial sanctuary designation appears to be a locational advantage primarily to manufacturers,but this should not be construed as not being important to the other industry groups. A significantnumber of all respondents indicated a preference for reserving riverfront properties formaritime/industrial activities and a reservation about allowing industrial sites to convert to non-industrial uses.
While no individual disadvantage was highly represented, a common overall theme throughoutmany of the interviews appears to be that Portland is (or has) become an undesirable place toconduct business (most strongly felt by deep-rooted firms) for several factors, as identified bythose interviewed:
• High cost of doing business (both regulatory and market)• Perceived anti-business sentiment• Small economy/consumer market of Portland metro area• Not central to major U.S. markets
Business leaders identified several emerging trends/issues affecting their companies such asconsolidation and mergers, enhancement of the transportation network, access to qualified,skilled labor, and feasibility of long-term capital investments. Firms are faced with a number ofchallenges that fall under local infrastructure constraints, regulatory environment, long-termviability of marine facilities and private market issues (e.g. cost competitiveness, labor costs,penetrating new markets, unencumbered land, etc.). Opportunities noted include:
• Strategically positioned within Pacific Northwest• Skilled workforce• Distribution network• Room to grow within an industrial sanctuary• Business opportunities unique to firm interviewed, regardless of harbor area
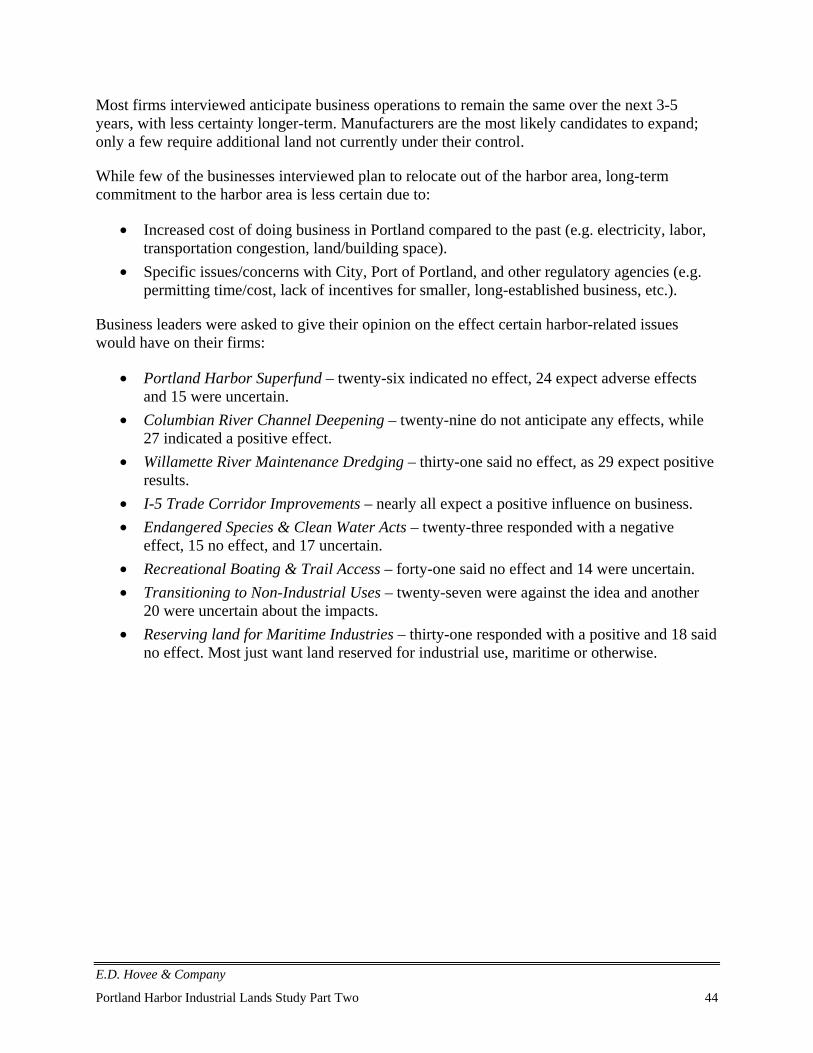
E.D. Hovee & Company
Portland Harbor Industrial Lands Study Part Two 44
Most firms interviewed anticipate business operations to remain the same over the next 3-5years, with less certainty longer-term. Manufacturers are the most likely candidates to expand;only a few require additional land not currently under their control.
While few of the businesses interviewed plan to relocate out of the harbor area, long-termcommitment to the harbor area is less certain due to:
• Increased cost of doing business in Portland compared to the past (e.g. electricity, labor,transportation congestion, land/building space).
• Specific issues/concerns with City, Port of Portland, and other regulatory agencies (e.g.permitting time/cost, lack of incentives for smaller, long-established business, etc.).
Business leaders were asked to give their opinion on the effect certain harbor-related issueswould have on their firms:
• Portland Harbor Superfund – twenty-six indicated no effect, 24 expect adverse effectsand 15 were uncertain.
• Columbian River Channel Deepening – twenty-nine do not anticipate any effects, while27 indicated a positive effect.
• Willamette River Maintenance Dredging – thirty-one said no effect, as 29 expect positiveresults.
• I-5 Trade Corridor Improvements – nearly all expect a positive influence on business.• Endangered Species & Clean Water Acts – twenty-three responded with a negative
effect, 15 no effect, and 17 uncertain.• Recreational Boating & Trail Access – forty-one said no effect and 14 were uncertain.• Transitioning to Non-Industrial Uses – twenty-seven were against the idea and another
20 were uncertain about the impacts.• Reserving land for Maritime Industries – thirty-one responded with a positive and 18 said
no effect. Most just want land reserved for industrial use, maritime or otherwise.
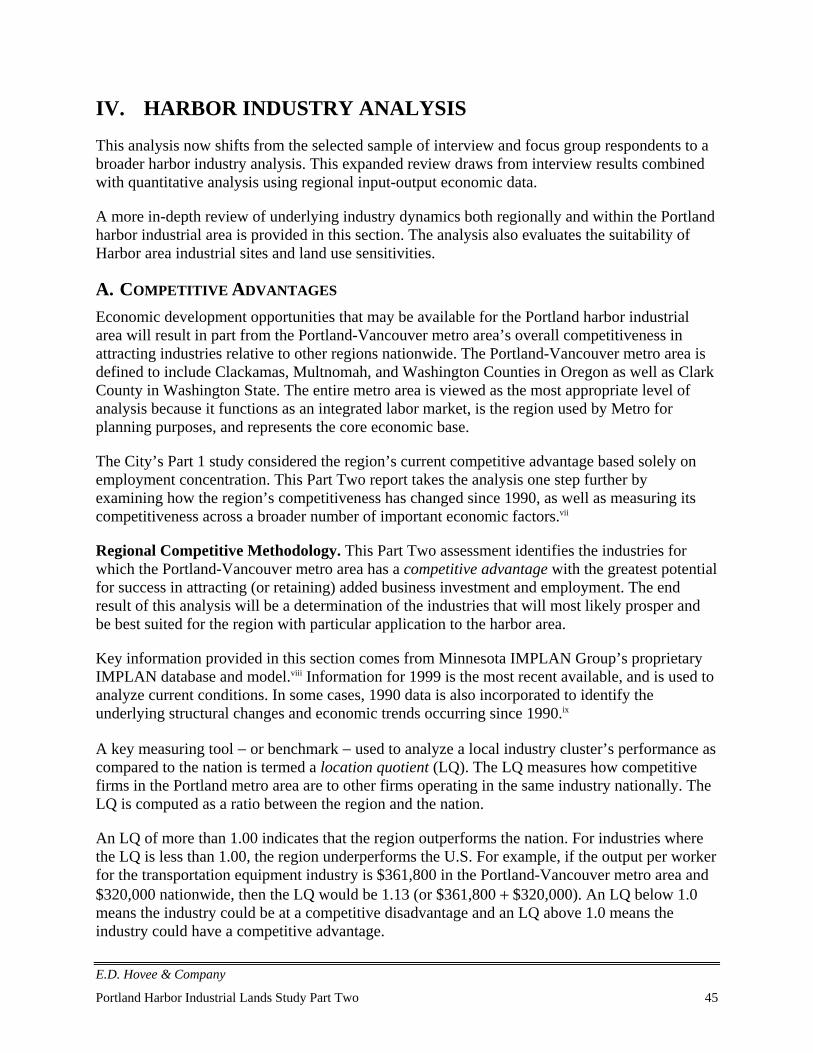
E.D. Hovee & Company
Portland Harbor Industrial Lands Study Part Two 45
IV. HARBOR INDUSTRY ANALYSIS
This analysis now shifts from the selected sample of interview and focus group respondents to abroader harbor industry analysis. This expanded review draws from interview results combinedwith quantitative analysis using regional input-output economic data.
A more in-depth review of underlying industry dynamics both regionally and within the Portlandharbor industrial area is provided in this section. The analysis also evaluates the suitability ofHarbor area industrial sites and land use sensitivities.
A. COMPETITIVE ADVANTAGES
Economic development opportunities that may be available for the Portland harbor industrialarea will result in part from the Portland-Vancouver metro area’s overall competitiveness inattracting industries relative to other regions nationwide. The Portland-Vancouver metro area isdefined to include Clackamas, Multnomah, and Washington Counties in Oregon as well as ClarkCounty in Washington State. The entire metro area is viewed as the most appropriate level ofanalysis because it functions as an integrated labor market, is the region used by Metro forplanning purposes, and represents the core economic base.
The City’s Part 1 study considered the region’s current competitive advantage based solely onemployment concentration. This Part Two report takes the analysis one step further byexamining how the region’s competitiveness has changed since 1990, as well as measuring itscompetitiveness across a broader number of important economic factors.vii
Regional Competitive Methodology. This Part Two assessment identifies the industries forwhich the Portland-Vancouver metro area has a competitive advantage with the greatest potentialfor success in attracting (or retaining) added business investment and employment. The endresult of this analysis will be a determination of the industries that will most likely prosper andbe best suited for the region with particular application to the harbor area.
Key information provided in this section comes from Minnesota IMPLAN Group’s proprietaryIMPLAN database and model.viii Information for 1999 is the most recent available, and is used toanalyze current conditions. In some cases, 1990 data is also incorporated to identify theunderlying structural changes and economic trends occurring since 1990.ix
A key measuring tool − or benchmark − used to analyze a local industry cluster’s performance ascompared to the nation is termed a location quotient (LQ). The LQ measures how competitivefirms in the Portland metro area are to other firms operating in the same industry nationally. TheLQ is computed as a ratio between the region and the nation.
An LQ of more than 1.00 indicates that the region outperforms the nation. For industries wherethe LQ is less than 1.00, the region underperforms the U.S. For example, if the output per workerfor the transportation equipment industry is $361,800 in the Portland-Vancouver metro area and$320,000 nationwide, then the LQ would be 1.13 (or $361,800 + $320,000). An LQ below 1.0means the industry could be at a competitive disadvantage and an LQ above 1.0 means theindustry could have a competitive advantage.
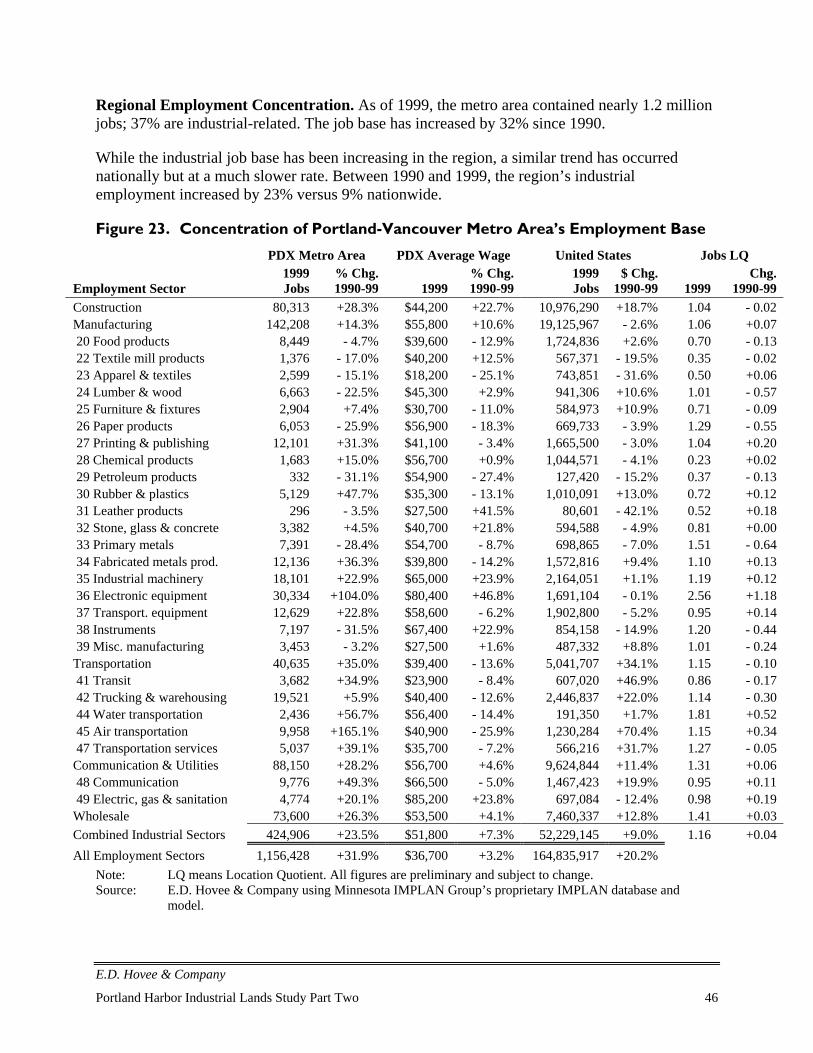
E.D. Hovee & Company
Portland Harbor Industrial Lands Study Part Two 46
Regional Employment Concentration. As of 1999, the metro area contained nearly 1.2 millionjobs; 37% are industrial-related. The job base has increased by 32% since 1990.
While the industrial job base has been increasing in the region, a similar trend has occurrednationally but at a much slower rate. Between 1990 and 1999, the region’s industrialemployment increased by 23% versus 9% nationwide.
Figure 23. Concentration of Portland-Vancouver Metro Area’s Employment Base
PDX Metro Area PDX Average Wage United States Jobs LQ
Employment Sector1999Jobs
% Chg.1990-99 1999
% Chg.1990-99
1999Jobs
$ Chg.1990-99 1999
Chg.1990-99
Construction 80,313 +28.3% $44,200 +22.7% 10,976,290 +18.7% 1.04 - 0.02Manufacturing 142,208 +14.3% $55,800 +10.6% 19,125,967 - 2.6% 1.06 +0.0720 Food products 8,449 - 4.7% $39,600 - 12.9% 1,724,836 +2.6% 0.70 - 0.1322 Textile mill products 1,376 - 17.0% $40,200 +12.5% 567,371 - 19.5% 0.35 - 0.0223 Apparel & textiles 2,599 - 15.1% $18,200 - 25.1% 743,851 - 31.6% 0.50 +0.0624 Lumber & wood 6,663 - 22.5% $45,300 +2.9% 941,306 +10.6% 1.01 - 0.5725 Furniture & fixtures 2,904 +7.4% $30,700 - 11.0% 584,973 +10.9% 0.71 - 0.0926 Paper products 6,053 - 25.9% $56,900 - 18.3% 669,733 - 3.9% 1.29 - 0.5527 Printing & publishing 12,101 +31.3% $41,100 - 3.4% 1,665,500 - 3.0% 1.04 +0.2028 Chemical products 1,683 +15.0% $56,700 +0.9% 1,044,571 - 4.1% 0.23 +0.0229 Petroleum products 332 - 31.1% $54,900 - 27.4% 127,420 - 15.2% 0.37 - 0.1330 Rubber & plastics 5,129 +47.7% $35,300 - 13.1% 1,010,091 +13.0% 0.72 +0.1231 Leather products 296 - 3.5% $27,500 +41.5% 80,601 - 42.1% 0.52 +0.1832 Stone, glass & concrete 3,382 +4.5% $40,700 +21.8% 594,588 - 4.9% 0.81 +0.0033 Primary metals 7,391 - 28.4% $54,700 - 8.7% 698,865 - 7.0% 1.51 - 0.6434 Fabricated metals prod. 12,136 +36.3% $39,800 - 14.2% 1,572,816 +9.4% 1.10 +0.1335 Industrial machinery 18,101 +22.9% $65,000 +23.9% 2,164,051 +1.1% 1.19 +0.1236 Electronic equipment 30,334 +104.0% $80,400 +46.8% 1,691,104 - 0.1% 2.56 +1.1837 Transport. equipment 12,629 +22.8% $58,600 - 6.2% 1,902,800 - 5.2% 0.95 +0.1438 Instruments 7,197 - 31.5% $67,400 +22.9% 854,158 - 14.9% 1.20 - 0.4439 Misc. manufacturing 3,453 - 3.2% $27,500 +1.6% 487,332 +8.8% 1.01 - 0.24
Transportation 40,635 +35.0% $39,400 - 13.6% 5,041,707 +34.1% 1.15 - 0.1041 Transit 3,682 +34.9% $23,900 - 8.4% 607,020 +46.9% 0.86 - 0.1742 Trucking & warehousing 19,521 +5.9% $40,400 - 12.6% 2,446,837 +22.0% 1.14 - 0.3044 Water transportation 2,436 +56.7% $56,400 - 14.4% 191,350 +1.7% 1.81 +0.5245 Air transportation 9,958 +165.1% $40,900 - 25.9% 1,230,284 +70.4% 1.15 +0.3447 Transportation services 5,037 +39.1% $35,700 - 7.2% 566,216 +31.7% 1.27 - 0.05
Communication & Utilities 88,150 +28.2% $56,700 +4.6% 9,624,844 +11.4% 1.31 +0.0648 Communication 9,776 +49.3% $66,500 - 5.0% 1,467,423 +19.9% 0.95 +0.1149 Electric, gas & sanitation 4,774 +20.1% $85,200 +23.8% 697,084 - 12.4% 0.98 +0.19
Wholesale 73,600 +26.3% $53,500 +4.1% 7,460,337 +12.8% 1.41 +0.03Combined Industrial Sectors 424,906 +23.5% $51,800 +7.3% 52,229,145 +9.0% 1.16 +0.04All Employment Sectors 1,156,428 +31.9% $36,700 +3.2% 164,835,917 +20.2%
Note: LQ means Location Quotient. All figures are preliminary and subject to change.Source: E.D. Hovee & Company using Minnesota IMPLAN Group’s proprietary IMPLAN database and
model.
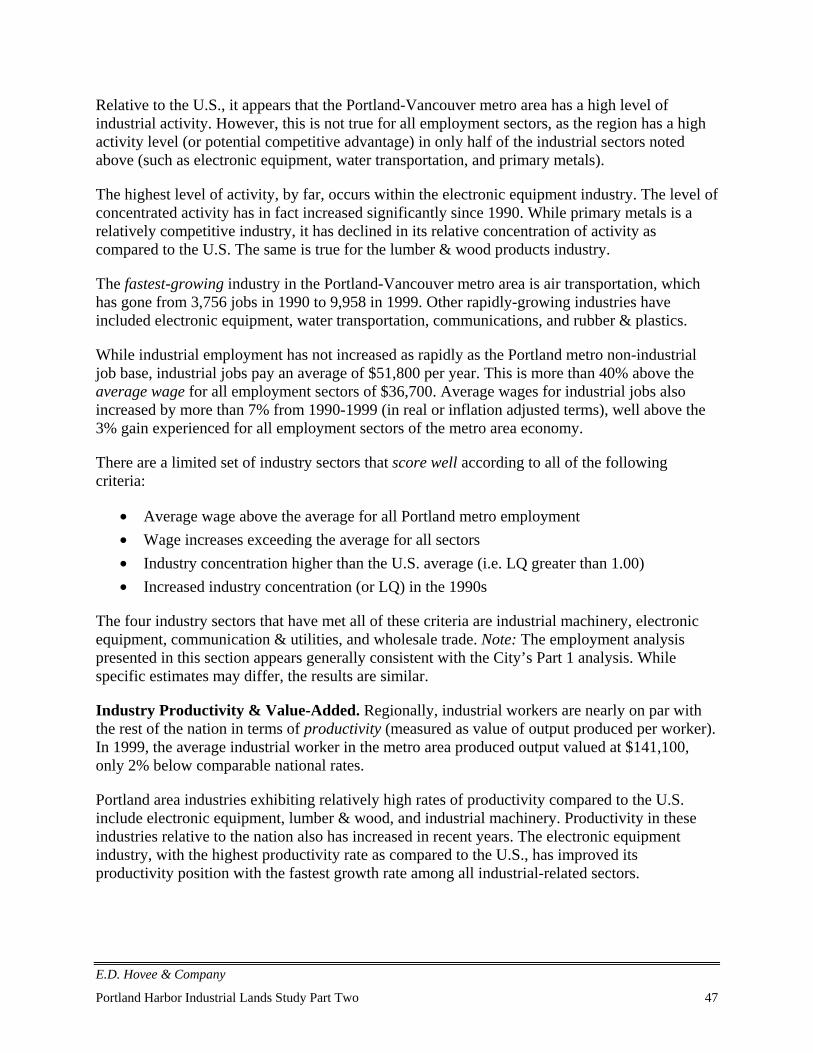
E.D. Hovee & Company
Portland Harbor Industrial Lands Study Part Two 47
Relative to the U.S., it appears that the Portland-Vancouver metro area has a high level ofindustrial activity. However, this is not true for all employment sectors, as the region has a highactivity level (or potential competitive advantage) in only half of the industrial sectors notedabove (such as electronic equipment, water transportation, and primary metals).
The highest level of activity, by far, occurs within the electronic equipment industry. The level ofconcentrated activity has in fact increased significantly since 1990. While primary metals is arelatively competitive industry, it has declined in its relative concentration of activity ascompared to the U.S. The same is true for the lumber & wood products industry.
The fastest-growing industry in the Portland-Vancouver metro area is air transportation, whichhas gone from 3,756 jobs in 1990 to 9,958 in 1999. Other rapidly-growing industries haveincluded electronic equipment, water transportation, communications, and rubber & plastics.
While industrial employment has not increased as rapidly as the Portland metro non-industrialjob base, industrial jobs pay an average of $51,800 per year. This is more than 40% above theaverage wage for all employment sectors of $36,700. Average wages for industrial jobs alsoincreased by more than 7% from 1990-1999 (in real or inflation adjusted terms), well above the3% gain experienced for all employment sectors of the metro area economy.
There are a limited set of industry sectors that score well according to all of the followingcriteria:
• Average wage above the average for all Portland metro employment• Wage increases exceeding the average for all sectors• Industry concentration higher than the U.S. average (i.e. LQ greater than 1.00)• Increased industry concentration (or LQ) in the 1990s
The four industry sectors that have met all of these criteria are industrial machinery, electronicequipment, communication & utilities, and wholesale trade. Note: The employment analysispresented in this section appears generally consistent with the City’s Part 1 analysis. Whilespecific estimates may differ, the results are similar.
Industry Productivity & Value-Added. Regionally, industrial workers are nearly on par withthe rest of the nation in terms of productivity (measured as value of output produced per worker).In 1999, the average industrial worker in the metro area produced output valued at $141,100,only 2% below comparable national rates.
Portland area industries exhibiting relatively high rates of productivity compared to the U.S.include electronic equipment, lumber & wood, and industrial machinery. Productivity in theseindustries relative to the nation also has increased in recent years. The electronic equipmentindustry, with the highest productivity rate as compared to the U.S., has improved itsproductivity position with the fastest growth rate among all industrial-related sectors.
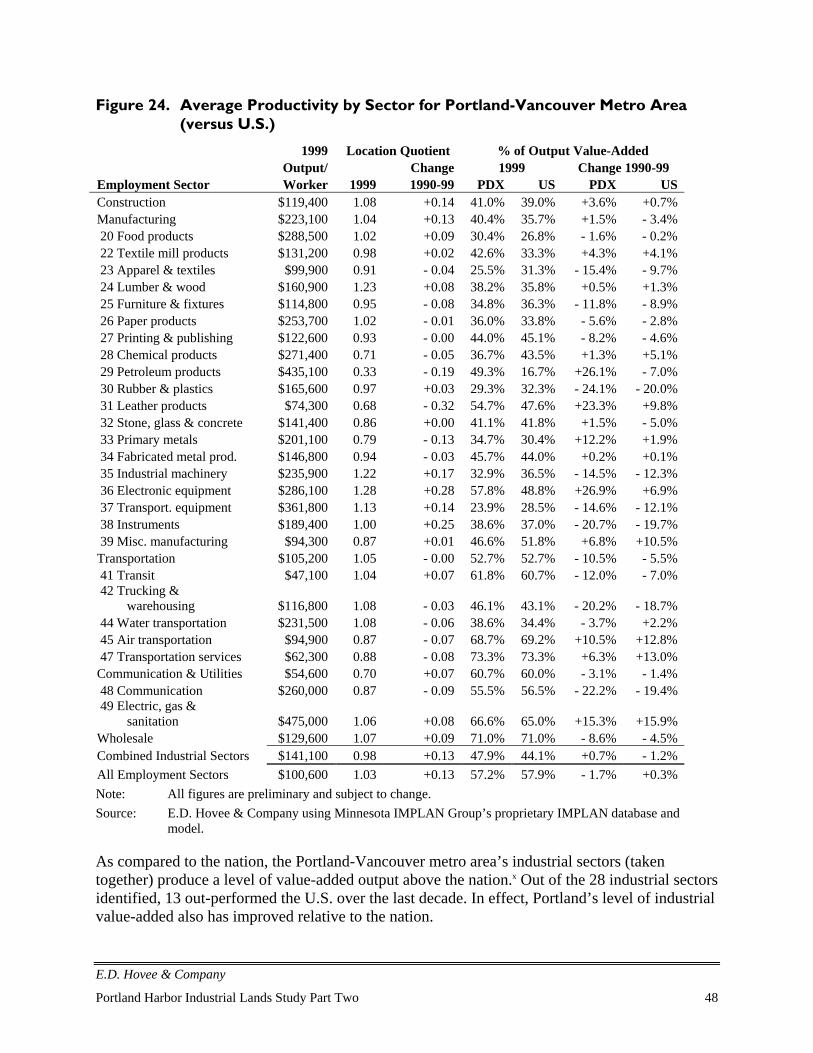
E.D. Hovee & Company
Portland Harbor Industrial Lands Study Part Two 48
Figure 24. Average Productivity by Sector for Portland-Vancouver Metro Area(versus U.S.)
1999 Location Quotient % of Output Value-AddedOutput/ Change 1999 Change 1990-99
Employment Sector Worker 1999 1990-99 PDX US PDX USConstruction $119,400 1.08 +0.14 41.0% 39.0% +3.6% +0.7%Manufacturing $223,100 1.04 +0.13 40.4% 35.7% +1.5% - 3.4%20 Food products $288,500 1.02 +0.09 30.4% 26.8% - 1.6% - 0.2%22 Textile mill products $131,200 0.98 +0.02 42.6% 33.3% +4.3% +4.1%23 Apparel & textiles $99,900 0.91 - 0.04 25.5% 31.3% - 15.4% - 9.7%24 Lumber & wood $160,900 1.23 +0.08 38.2% 35.8% +0.5% +1.3%25 Furniture & fixtures $114,800 0.95 - 0.08 34.8% 36.3% - 11.8% - 8.9%26 Paper products $253,700 1.02 - 0.01 36.0% 33.8% - 5.6% - 2.8%27 Printing & publishing $122,600 0.93 - 0.00 44.0% 45.1% - 8.2% - 4.6%28 Chemical products $271,400 0.71 - 0.05 36.7% 43.5% +1.3% +5.1%29 Petroleum products $435,100 0.33 - 0.19 49.3% 16.7% +26.1% - 7.0%30 Rubber & plastics $165,600 0.97 +0.03 29.3% 32.3% - 24.1% - 20.0%31 Leather products $74,300 0.68 - 0.32 54.7% 47.6% +23.3% +9.8%32 Stone, glass & concrete $141,400 0.86 +0.00 41.1% 41.8% +1.5% - 5.0%33 Primary metals $201,100 0.79 - 0.13 34.7% 30.4% +12.2% +1.9%34 Fabricated metal prod. $146,800 0.94 - 0.03 45.7% 44.0% +0.2% +0.1%35 Industrial machinery $235,900 1.22 +0.17 32.9% 36.5% - 14.5% - 12.3%36 Electronic equipment $286,100 1.28 +0.28 57.8% 48.8% +26.9% +6.9%37 Transport. equipment $361,800 1.13 +0.14 23.9% 28.5% - 14.6% - 12.1%38 Instruments $189,400 1.00 +0.25 38.6% 37.0% - 20.7% - 19.7%39 Misc. manufacturing $94,300 0.87 +0.01 46.6% 51.8% +6.8% +10.5%
Transportation $105,200 1.05 - 0.00 52.7% 52.7% - 10.5% - 5.5%41 Transit $47,100 1.04 +0.07 61.8% 60.7% - 12.0% - 7.0%42 Trucking &
warehousing $116,800 1.08 - 0.03 46.1% 43.1% - 20.2% - 18.7%44 Water transportation $231,500 1.08 - 0.06 38.6% 34.4% - 3.7% +2.2%45 Air transportation $94,900 0.87 - 0.07 68.7% 69.2% +10.5% +12.8%47 Transportation services $62,300 0.88 - 0.08 73.3% 73.3% +6.3% +13.0%
Communication & Utilities $54,600 0.70 +0.07 60.7% 60.0% - 3.1% - 1.4%48 Communication $260,000 0.87 - 0.09 55.5% 56.5% - 22.2% - 19.4%49 Electric, gas &
sanitation $475,000 1.06 +0.08 66.6% 65.0% +15.3% +15.9%Wholesale $129,600 1.07 +0.09 71.0% 71.0% - 8.6% - 4.5%Combined Industrial Sectors $141,100 0.98 +0.13 47.9% 44.1% +0.7% - 1.2%All Employment Sectors $100,600 1.03 +0.13 57.2% 57.9% - 1.7% +0.3%Note: All figures are preliminary and subject to change.Source: E.D. Hovee & Company using Minnesota IMPLAN Group’s proprietary IMPLAN database and
model.
As compared to the nation, the Portland-Vancouver metro area’s industrial sectors (takentogether) produce a level of value-added output above the nation.x Out of the 28 industrial sectorsidentified, 13 out-performed the U.S. over the last decade. In effect, Portland’s level of industrialvalue-added also has improved relative to the nation.
E.D. Hovee & Company
Portland Harbor Industrial Lands Study Part Two 49
Export Orientation, Procurement & Multipliers. Traditionally, to be deemed export-oriented,an industry must export at least 50% of its output to purchasers outside the region. Taken as awhole, the region’s industrial sectors come close the threshold as they export almost 50% of theiroutput to communities outside the Portland-Vancouver metro area.
Figure 25. Export Orientation, Local Procurement, and Economic Impact bySector
% of PortlandOutput Exported 1999
Change Local Economic Multipliers (1999)Employment Sector 1999 1990-99 Procure. Output Income JobsConstruction 18.1% +8.5% 100.0% 1.82 1.85 2.16Manufacturing 69.3% +48.7%20 Food products 45.5% +38.5% 41.8% 1.72 2.74 3.4222 Textile mill products 84.1% +80.5% 7.0% 1.55 1.65 1.8023 Apparel & textiles 10.4% +5.1% 26.0% 1.63 2.34 1.7224 Lumber & wood 26.7% - 3.4% 80.4% 1.93 2.17 2.4725 Furniture & fixtures 10.0% - 2.4% 53.0% 1.74 2.03 1.9026 Paper products 89.2% +43.3% 11.8% 1.65 2.06 2.6827 Printing & publishing 45.4% +43.3% 43.7% 1.68 1.77 1.9328 Chemical products 16.1% +6.6% 21.4% 1.63 2.12 2.7929 Petroleum products 1.9% - 3.0% 12.4% 1.29 1.78 2.1730 Rubber & plastics 100.0% +99.7% 1.2% 1.66 2.15 2.1431 Leather products 21.4% +6.8% 10.5% 1.52 1.52 1.4432 Stone, glass & concrete 87.5% +80.1% 7.9% 1.70 1.90 2.0433 Primary metals 96.2% +65.8% 2.7% 1.60 1.83 2.2734 Fabricated metal prod. 90.9% +57.9% 10.5% 1.52 1.73 1.8535 Industrial machinery 65.6% +44.1% 32.6% 1.72 1.96 2.6836 Electronic equipment 68.8% +41.3% 63.1% 1.57 1.75 2.6237 Transport. equipment 91.8% +80.3% 7.4% 1.54 2.24 2.9938 Instruments 49.0% +36.8% 62.2% 1.82 1.87 2.6339 Misc. manufacturing 87.1% +67.7% 9.9% 1.60 1.80 1.63
Transportation 36.8% - 4.8%41 Transit 27.6% +3.2% 74.3% 1.72 1.55 1.4042 Trucking & warehousing 19.5% - 20.8% 99.6% 1.97 2.06 2.2544 Water transportation 67.7% +19.9% 100.0% 1.85 2.40 3.3445 Air transportation 63.9% +18.2% 46.2% 1.51 1.48 1.6147 Transportation services 31.2% - 15.7% 69.5% 1.71 1.50 1.55
Communication & Utilities 28.1% +17.1%48 Communication 35.2% +12.2% 54.7% 1.67 1.97 2.9549 Electric, gas & sanitation 20.2% +20.0% 93.8% 1.39 1.80 2.90
Wholesale 32.6% - 6.5% 99.9% 1.61 1.58 1.96Combined Industrial Sectors 49.6% +28.0%All Employment Sectors 36.8% +11.4%
Note: All figures are preliminary and subject to change.Source: E.D. Hovee & Company using Minnesota IMPLAN Group’s proprietary IMPLAN database and
model.
E.D. Hovee & Company
Portland Harbor Industrial Lands Study Part Two 50
Twelve of 28 industry sectors reviewed appear to be export-oriented, with most of the other 16showing very low proportions of their output being sold or delivered outside the region. Themain reason the group as a whole does not quite meet the 50% benchmark is that this region’stransportation industry, in particular trucking & warehouse – one of the region’s largestemployment sectors – is mostly locally focused.
Industries exporting more than 90% of their output outside the metro area include: rubber &plastics, primary metals, transportation equipment, and fabricated metal products. All four ofthese sectors have a strong presence in the harbor area. Another four industries showing arelatively high amount of export orientation include paper products, stone, glass & concrete,miscellaneous manufacturing, and textile mill products.
Industries making significant local purchases are generally found within transportation andwholesale sectors. However, there are a few manufacturers that also exhibit high levels of localpurchasing, including lumber & wood, electronic equipment, and instruments.
Less than half of the industrial sectors have a jobs multiplier under 2.0 – in other words theysupport less than one job elsewhere in the Portland economy for every worker they directlyemploy. In fact, a number of industries support two or more indirect and induced jobs for everydirect job. These sectors include food products, water transportation, transportation equipment –all of which have an active presence in Portland’s Harbor industrial area. Note: Multipliersidentified in the Planning Bureau’s Part I analysis may differ, due to differences in geographicrepresentation and data source.
Competitive Advantage Framework. The framework for evaluating potential competitiveadvantages is predicated on the assessment of the current and changing competitive position ofvarious industry clusters in the region as compared to the nation. As indicated by the chart whichfollows, four distinctive quadrants of competitiveness can be identified:
• Strong and growing sectors represent industries that have an existing competitivepresence in the metro area, exceeding the national average. For these sectors, the region’scompetitive position not only is above average, but has increased in recent years (from1990–1999).
• In contrast, weak and declining industries are those that currently have below averagerepresentation; the region’s competitive position for these sectors diminished even furtherbetween 1990 and 1999.
• A mature industry is one that currently maintains a strong and competitive position, butwhose competitive position has decreased since 1990.
• Finally, emerging sectors are those that historically have maintained a below averagecompetitive position but have achieved gains in competitive share since 1990.
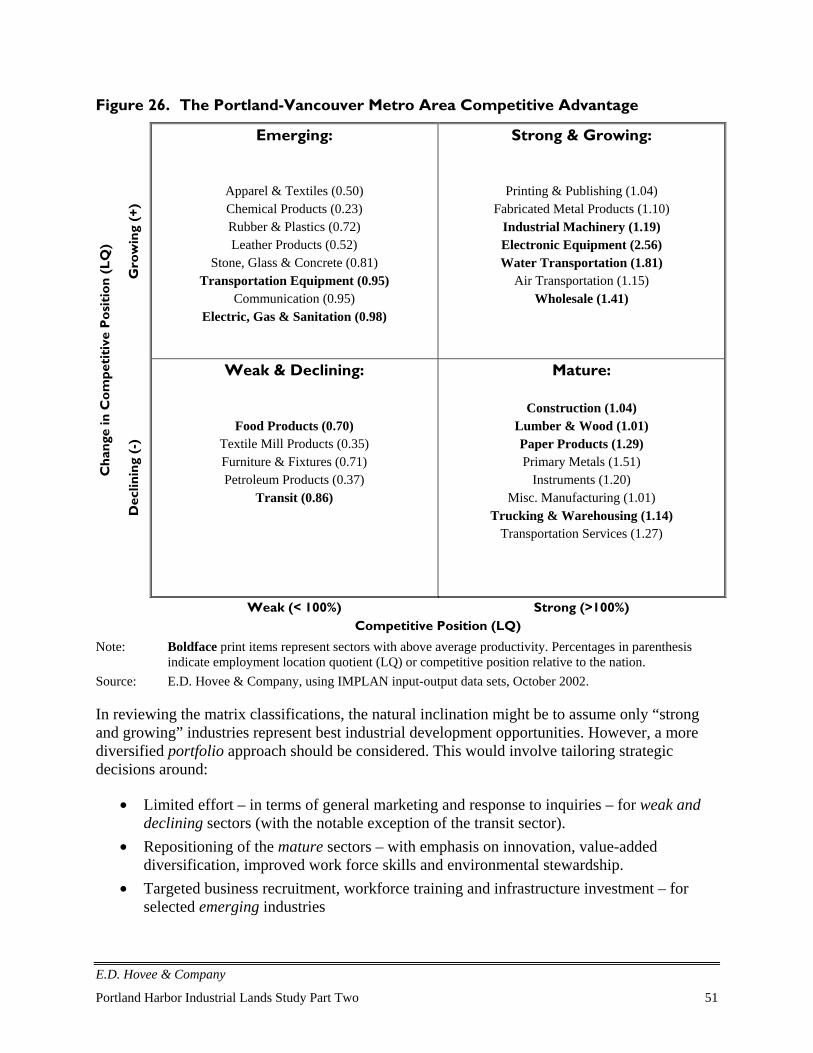
E.D. Hovee & Company
Portland Harbor Industrial Lands Study Part Two 51
Figure 26. The Portland-Vancouver Metro Area Competitive Advantage
Gro
win
g (+
)Emerging:
Apparel & Textiles (0.50)Chemical Products (0.23)Rubber & Plastics (0.72)Leather Products (0.52)
Stone, Glass & Concrete (0.81)Transportation Equipment (0.95)
Communication (0.95)Electric, Gas & Sanitation (0.98)
Strong & Growing:
Printing & Publishing (1.04)Fabricated Metal Products (1.10)
Industrial Machinery (1.19)Electronic Equipment (2.56)Water Transportation (1.81)
Air Transportation (1.15)Wholesale (1.41)
Cha
nge
in C
om
peti
tive
Po
siti
on
(LQ
)
Dec
linin
g (-
)
Weak & Declining:
Food Products (0.70)Textile Mill Products (0.35)Furniture & Fixtures (0.71)Petroleum Products (0.37)
Transit (0.86)
Mature:
Construction (1.04)Lumber & Wood (1.01)Paper Products (1.29)Primary Metals (1.51)
Instruments (1.20)Misc. Manufacturing (1.01)
Trucking & Warehousing (1.14)Transportation Services (1.27)
Weak (< 100%) Strong (>100%)Competitive Position (LQ)
Note: Boldface print items represent sectors with above average productivity. Percentages in parenthesisindicate employment location quotient (LQ) or competitive position relative to the nation.
Source: E.D. Hovee & Company, using IMPLAN input-output data sets, October 2002.
In reviewing the matrix classifications, the natural inclination might be to assume only “strongand growing” industries represent best industrial development opportunities. However, a morediversified portfolio approach should be considered. This would involve tailoring strategicdecisions around:
• Limited effort – in terms of general marketing and response to inquiries – for weak anddeclining sectors (with the notable exception of the transit sector).
• Repositioning of the mature sectors – with emphasis on innovation, value-addeddiversification, improved work force skills and environmental stewardship.
• Targeted business recruitment, workforce training and infrastructure investment – forselected emerging industries
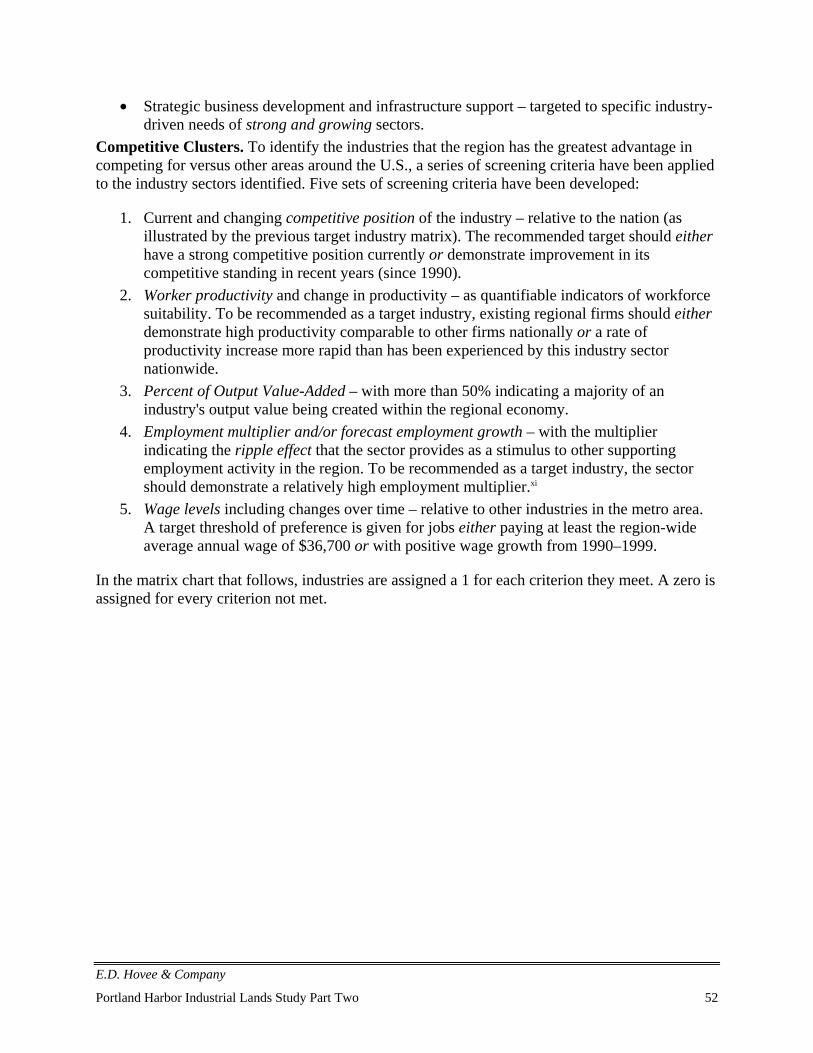
E.D. Hovee & Company
Portland Harbor Industrial Lands Study Part Two 52
• Strategic business development and infrastructure support – targeted to specific industry-driven needs of strong and growing sectors.
Competitive Clusters. To identify the industries that the region has the greatest advantage incompeting for versus other areas around the U.S., a series of screening criteria have been appliedto the industry sectors identified. Five sets of screening criteria have been developed:
1. Current and changing competitive position of the industry – relative to the nation (asillustrated by the previous target industry matrix). The recommended target should eitherhave a strong competitive position currently or demonstrate improvement in itscompetitive standing in recent years (since 1990).
2. Worker productivity and change in productivity – as quantifiable indicators of workforcesuitability. To be recommended as a target industry, existing regional firms should eitherdemonstrate high productivity comparable to other firms nationally or a rate ofproductivity increase more rapid than has been experienced by this industry sectornationwide.
3. Percent of Output Value-Added – with more than 50% indicating a majority of anindustry's output value being created within the regional economy.
4. Employment multiplier and/or forecast employment growth – with the multiplierindicating the ripple effect that the sector provides as a stimulus to other supportingemployment activity in the region. To be recommended as a target industry, the sectorshould demonstrate a relatively high employment multiplier.xi
5. Wage levels including changes over time – relative to other industries in the metro area.A target threshold of preference is given for jobs either paying at least the region-wideaverage annual wage of $36,700 or with positive wage growth from 1990–1999.
In the matrix chart that follows, industries are assigned a 1 for each criterion they meet. A zero isassigned for every criterion not met.
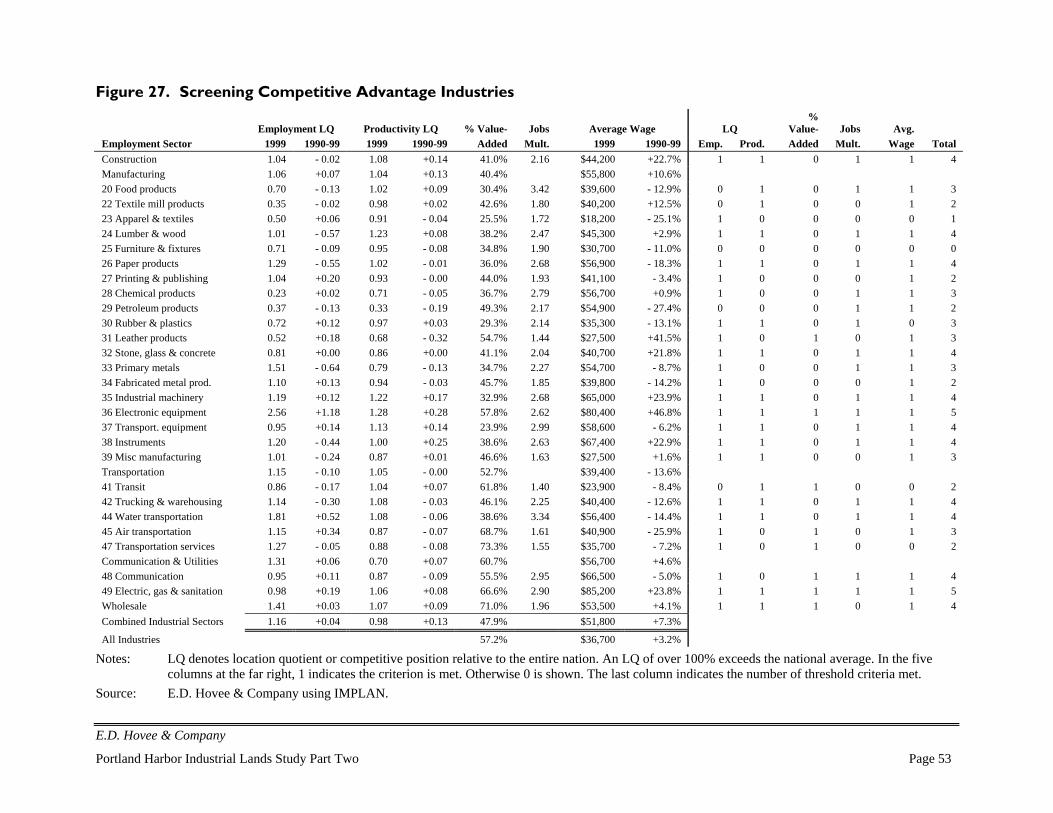
E.D. Hovee & Company
Portland Harbor Industrial Lands Study Part Two Page 53
Figure 27. Screening Competitive Advantage Industries
Employment LQ Productivity LQ % Value- Jobs Average Wage LQ%
Value- Jobs Avg.Employment Sector 1999 1990-99 1999 1990-99 Added Mult. 1999 1990-99 Emp. Prod. Added Mult. Wage TotalConstruction 1.04 - 0.02 1.08 +0.14 41.0% 2.16 $44,200 +22.7% 1 1 0 1 1 4Manufacturing 1.06 +0.07 1.04 +0.13 40.4% $55,800 +10.6%20 Food products 0.70 - 0.13 1.02 +0.09 30.4% 3.42 $39,600 - 12.9% 0 1 0 1 1 322 Textile mill products 0.35 - 0.02 0.98 +0.02 42.6% 1.80 $40,200 +12.5% 0 1 0 0 1 223 Apparel & textiles 0.50 +0.06 0.91 - 0.04 25.5% 1.72 $18,200 - 25.1% 1 0 0 0 0 124 Lumber & wood 1.01 - 0.57 1.23 +0.08 38.2% 2.47 $45,300 +2.9% 1 1 0 1 1 425 Furniture & fixtures 0.71 - 0.09 0.95 - 0.08 34.8% 1.90 $30,700 - 11.0% 0 0 0 0 0 026 Paper products 1.29 - 0.55 1.02 - 0.01 36.0% 2.68 $56,900 - 18.3% 1 1 0 1 1 427 Printing & publishing 1.04 +0.20 0.93 - 0.00 44.0% 1.93 $41,100 - 3.4% 1 0 0 0 1 228 Chemical products 0.23 +0.02 0.71 - 0.05 36.7% 2.79 $56,700 +0.9% 1 0 0 1 1 329 Petroleum products 0.37 - 0.13 0.33 - 0.19 49.3% 2.17 $54,900 - 27.4% 0 0 0 1 1 230 Rubber & plastics 0.72 +0.12 0.97 +0.03 29.3% 2.14 $35,300 - 13.1% 1 1 0 1 0 331 Leather products 0.52 +0.18 0.68 - 0.32 54.7% 1.44 $27,500 +41.5% 1 0 1 0 1 332 Stone, glass & concrete 0.81 +0.00 0.86 +0.00 41.1% 2.04 $40,700 +21.8% 1 1 0 1 1 433 Primary metals 1.51 - 0.64 0.79 - 0.13 34.7% 2.27 $54,700 - 8.7% 1 0 0 1 1 334 Fabricated metal prod. 1.10 +0.13 0.94 - 0.03 45.7% 1.85 $39,800 - 14.2% 1 0 0 0 1 235 Industrial machinery 1.19 +0.12 1.22 +0.17 32.9% 2.68 $65,000 +23.9% 1 1 0 1 1 436 Electronic equipment 2.56 +1.18 1.28 +0.28 57.8% 2.62 $80,400 +46.8% 1 1 1 1 1 537 Transport. equipment 0.95 +0.14 1.13 +0.14 23.9% 2.99 $58,600 - 6.2% 1 1 0 1 1 438 Instruments 1.20 - 0.44 1.00 +0.25 38.6% 2.63 $67,400 +22.9% 1 1 0 1 1 439 Misc manufacturing 1.01 - 0.24 0.87 +0.01 46.6% 1.63 $27,500 +1.6% 1 1 0 0 1 3Transportation 1.15 - 0.10 1.05 - 0.00 52.7% $39,400 - 13.6%41 Transit 0.86 - 0.17 1.04 +0.07 61.8% 1.40 $23,900 - 8.4% 0 1 1 0 0 242 Trucking & warehousing 1.14 - 0.30 1.08 - 0.03 46.1% 2.25 $40,400 - 12.6% 1 1 0 1 1 444 Water transportation 1.81 +0.52 1.08 - 0.06 38.6% 3.34 $56,400 - 14.4% 1 1 0 1 1 445 Air transportation 1.15 +0.34 0.87 - 0.07 68.7% 1.61 $40,900 - 25.9% 1 0 1 0 1 347 Transportation services 1.27 - 0.05 0.88 - 0.08 73.3% 1.55 $35,700 - 7.2% 1 0 1 0 0 2Communication & Utilities 1.31 +0.06 0.70 +0.07 60.7% $56,700 +4.6%48 Communication 0.95 +0.11 0.87 - 0.09 55.5% 2.95 $66,500 - 5.0% 1 0 1 1 1 449 Electric, gas & sanitation 0.98 +0.19 1.06 +0.08 66.6% 2.90 $85,200 +23.8% 1 1 1 1 1 5Wholesale 1.41 +0.03 1.07 +0.09 71.0% 1.96 $53,500 +4.1% 1 1 1 0 1 4Combined Industrial Sectors 1.16 +0.04 0.98 +0.13 47.9% $51,800 +7.3%
All Industries 57.2% $36,700 +3.2%
Notes: LQ denotes location quotient or competitive position relative to the entire nation. An LQ of over 100% exceeds the national average. In the fivecolumns at the far right, 1 indicates the criterion is met. Otherwise 0 is shown. The last column indicates the number of threshold criteria met.
Source: E.D. Hovee & Company using IMPLAN.
E.D. Hovee & Company
Portland Harbor Industrial Lands Study Part Two Page 54
Only the electronic equipment and electric/gas/sanitation industries meet all five criteria.However, another eleven industries met four of the five criteria. Taken together, nearly half ofthe industrial sectors portray the Portland-Vancouver metro area as being strongly competitive.Industries meeting four or more criteria include:
Construction InstrumentsLumber & Wood Trucking & WarehousingPaper Products Water TransportationStone, Glass & Concrete CommunicationsIndustrial Machinery Electric, Gas & SanitationElectronic Equipment Wholesale TradeTransportation Equipment
As indicated by the boldface type, nine of these thirteen sectors are already well representedwithin Portland’s harbor industrial area. Maintaining and enhancing the region’s competitiveposition for these key sectors will be dependent on steps to preserve and enhance the capacity forPortland’s harbor industrial users.
Summary Economic Impact. Consistent with employment data developed by the Bureau ofPlanning for Part 1, Portland’s harbor industrial area currently has an employment base of 39,190jobs. Of these, 34,270 (or 87%) are industrial jobs.
The harbor area’s 34,270 industrial jobs leverage another 46,890 jobs throughout the metro area– for a total of 81,160 jobs directly and indirectly attributable to harbor area industries.
Figure 28. Economic Impact of Portland Harbor Area Industry
JobsPortland Harbor Area Industries (Direct) 34,270Other Economic Activity Indirectly Supported in Portland Metro Area 46,890Total Economic Impact to Portland Metro Area 81,160Economic Impact Multiplier 2.37Source: E.D. Hovee & Company, using IMPLAN and Bureau of Planning employment data.
The overall impact multiplier of 2.37 for harbor area industries exceeds the typical multipliersassociated with service sector jobs. This is due to relatively high wages of harbor area firmscoupled with extensive local inter-industry linkages – as revealed both by industry interviewsand input-output data.
The full economic impact to the metro area of Portland’s harbor area extends beyond what isrepresented by these quantitative estimates. Businesses and residents regionwide are dependenton goods and services that often are uniquely provided by harbor area industries.
B. CHANGING DYNAMICS OF HARBOR INDUSTRIES
Based on interviews conducted for this Part Two report, three industry clusters are of specialinterest for more detailed evaluation – transportation equipment manufacturing, metals, and
E.D. Hovee & Company
Portland Harbor Industrial Lands Study Part Two Page 55
marine terminals. Before consideration of the inter-industry linkages that these clusters represent,we first describe an analytic framework for distinct characteristics and harbor industry linkages.
District Characteristics. As evidenced by Part 1 and 2 PHILS analysis, the Portland harborindustrial district represents an important and dynamic segment of the region’s economy.Interviews with study area business leaders unveiled a number of intra- and inter-industryrelationships within the harbor area, as well as inside and outside the region.
In thinking about the functioning of an industrial district, two alternative analytic frameworks areuseful for consideration:
• A hub-and-spoke district – with large and often locally headquartered firms supplyingcustomers often outside the district but with numerous local suppliers.
• A satellite platform district – with branch offices or plants served by suppliers andcatering to customers largely located out of the industrial district.
The Portland harbor industrial area currently functions similar to a hub-and-spoke district.xii
Study area activity has been dominated by a few large firms such as Freightliner, Gunderson,Wacker, Oregon Steel Mills, ESCO, and Port of Portland. The ten largest harbor area privatesector firms employ over 60% of the study area’s workers. Due to extensive inter-firmrelationships, they also support a significant portion of the remaining workforce.
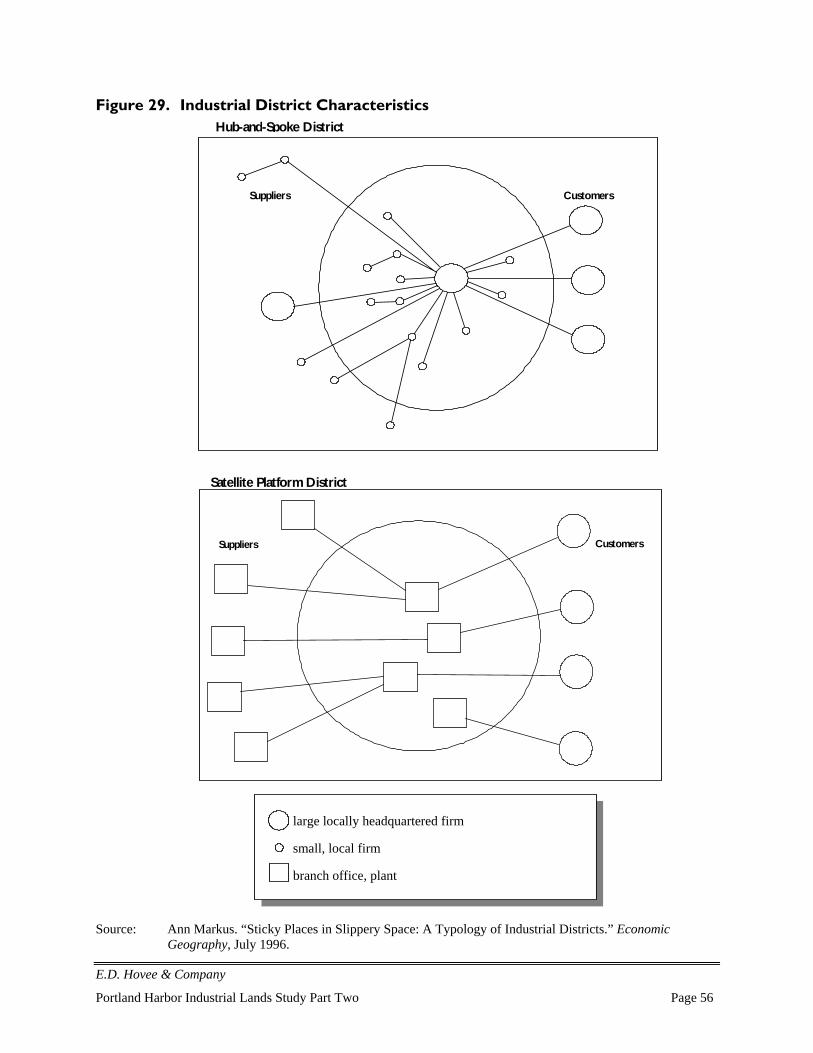
E.D. Hovee & Company
Portland Harbor Industrial Lands Study Part Two Page 56
Figure 29. Industrial District Characteristics
Suppliers Customers
Suppliers Customers
Hub-and-Spoke District
Satellite Platform District
large locally headquartered firm small, local firm branch office, plant
Source: Ann Markus. “Sticky Places in Slippery Space: A Typology of Industrial Districts.” EconomicGeography, July 1996.
large locally headquartered firm
small, local firm
branch office, plant
E.D. Hovee & Company
Portland Harbor Industrial Lands Study Part Two Page 57
However, the harbor area may be in transition. While still dominated by large locally ownedfirms, the district increasingly appears to be shifting more to the satellite platform model. This isexemplified by the focus group comment that the harbor’s future may be more toward wholesaledistribution rather than manufacturing.
In the short term, this transition means a hybrid district of both large locally owned firms as wellas regional/branch plants. Yet the ongoing trend of local firms seeking national/internationalalliances (e.g. Freightliner) creates challenges for locally dominated sectors to remaincompetitive with a hub and spoke model. Also noted is the trend for non-local firms usingPortland as a regional hub to serve the western states of Oregon, Washington, Idaho, andMontana.
Harbor Industry Linkages. The business interviews revealed a number of industry linkages.Because the interview questionnaire primarily focuses on the three largest suppliers, customers,and competitors, the linkages depicted in this analysis likely underestimate the amount ofinteraction between harbor activities.
The Portland harbor industrial area has developed primarily around the district’s majorindustrial/marine activities such as transportation equipment manufacturing (e.g. Freightliner,Gunderson, Zidell, etc.), petroleum products, metals, and marine terminals at the Port ofPortland. In an effort to depict the business linkages between harbor industries, informationcollected from the business interviews is illustrated using a multi-firm/industry mapping diagramdeveloped by the University of Minnesota.
The mapping diagram denotes inter-relationships by organizing activities into four quadrantsand placing the subject activity in the center of the quadrants. Activities within the fourquadrants are further divided between relationships identified within the local region versusoutside the region. Linkages between specific activities are illustrated by the connecting lines: a)solid line for direct linkages with central activity in question and b) dashed line for linkages notdirectly associated with central activity.
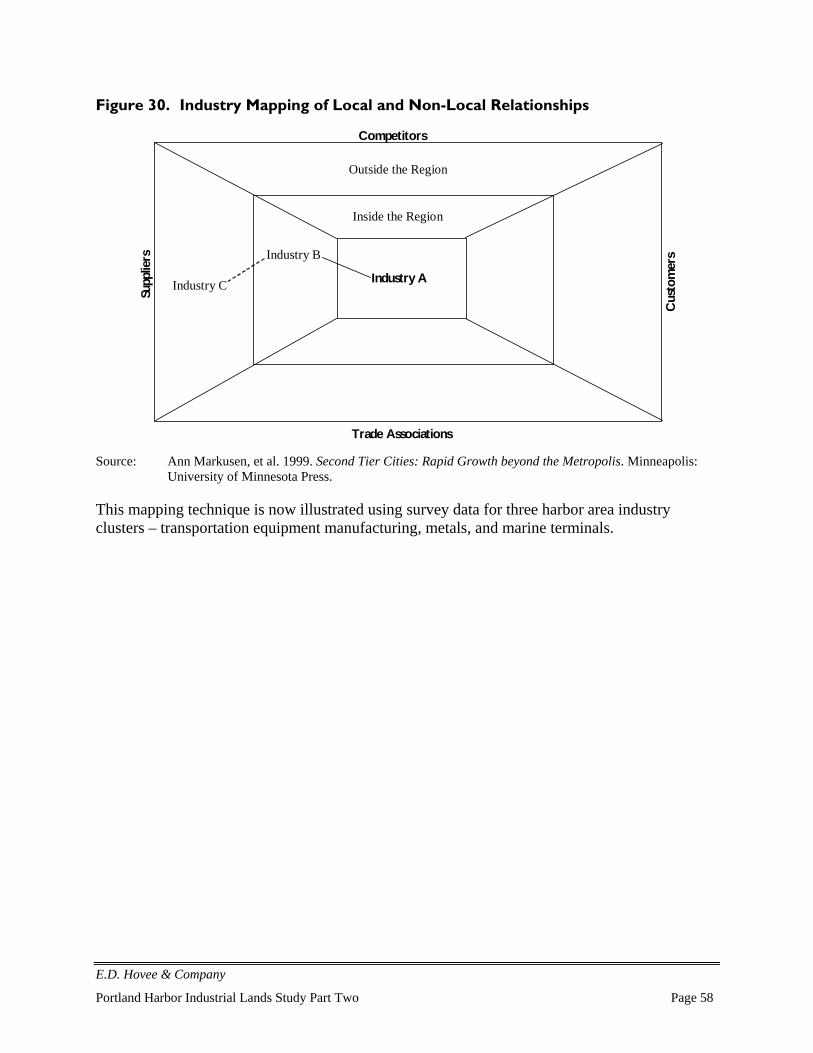
E.D. Hovee & Company
Portland Harbor Industrial Lands Study Part Two Page 58
Figure 30. Industry Mapping of Local and Non-Local Relationships
Trade Associations
Supp
liers
Cust
omer
s
Industry C
Industry B
Industry A
Inside the Region
Outside the Region
Competitors
Source: Ann Markusen, et al. 1999. Second Tier Cities: Rapid Growth beyond the Metropolis. Minneapolis:University of Minnesota Press.
This mapping technique is now illustrated using survey data for three harbor area industryclusters – transportation equipment manufacturing, metals, and marine terminals.
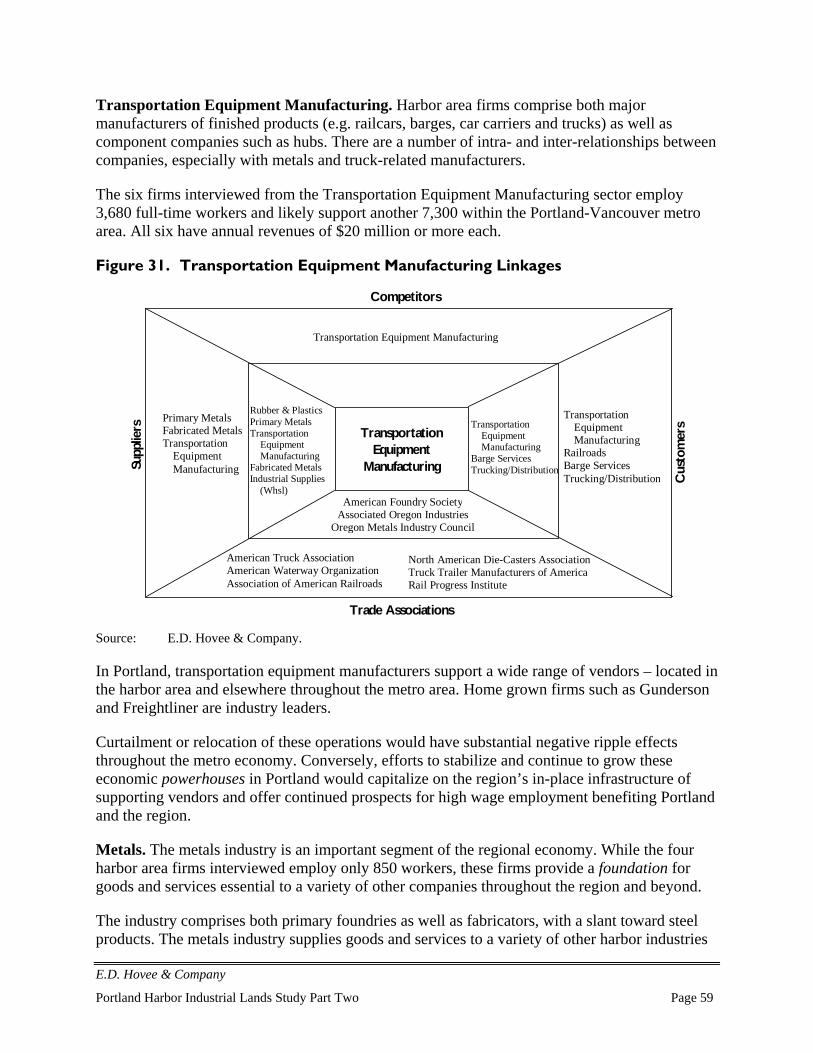
E.D. Hovee & Company
Portland Harbor Industrial Lands Study Part Two Page 59
Transportation Equipment Manufacturing. Harbor area firms comprise both majormanufacturers of finished products (e.g. railcars, barges, car carriers and trucks) as well ascomponent companies such as hubs. There are a number of intra- and inter-relationships betweencompanies, especially with metals and truck-related manufacturers.
The six firms interviewed from the Transportation Equipment Manufacturing sector employ3,680 full-time workers and likely support another 7,300 within the Portland-Vancouver metroarea. All six have annual revenues of $20 million or more each.
Figure 31. Transportation Equipment Manufacturing Linkages
Competitors
Trade Associations
Supp
liers
Cust
omer
s Primary Metals Fabricated Metals Transportation
Equipment Manufacturing
Rubber & Plastics Primary Metals Transportation
Equipment Manufacturing
Fabricated Metals Industrial Supplies
(Whsl)
Transportation Equipment
Manufacturing
American Foundry Society Associated Oregon Industries
Oregon Metals Industry Council
Transportation Equipment Manufacturing
Barge Services Trucking/Distribution
American Truck Association American Waterway Organization Association of American Railroads
North American Die-Casters Association Truck Trailer Manufacturers of America Rail Progress Institute
Transportation Equipment Manufacturing
Railroads Barge Services Trucking/Distribution
Transportation Equipment Manufacturing
Source: E.D. Hovee & Company.
In Portland, transportation equipment manufacturers support a wide range of vendors – located inthe harbor area and elsewhere throughout the metro area. Home grown firms such as Gundersonand Freightliner are industry leaders.
Curtailment or relocation of these operations would have substantial negative ripple effectsthroughout the metro economy. Conversely, efforts to stabilize and continue to grow theseeconomic powerhouses in Portland would capitalize on the region’s in-place infrastructure ofsupporting vendors and offer continued prospects for high wage employment benefiting Portlandand the region.
Metals. The metals industry is an important segment of the regional economy. While the fourharbor area firms interviewed employ only 850 workers, these firms provide a foundation forgoods and services essential to a variety of other companies throughout the region and beyond.
The industry comprises both primary foundries as well as fabricators, with a slant toward steelproducts. The metals industry supplies goods and services to a variety of other harbor industries
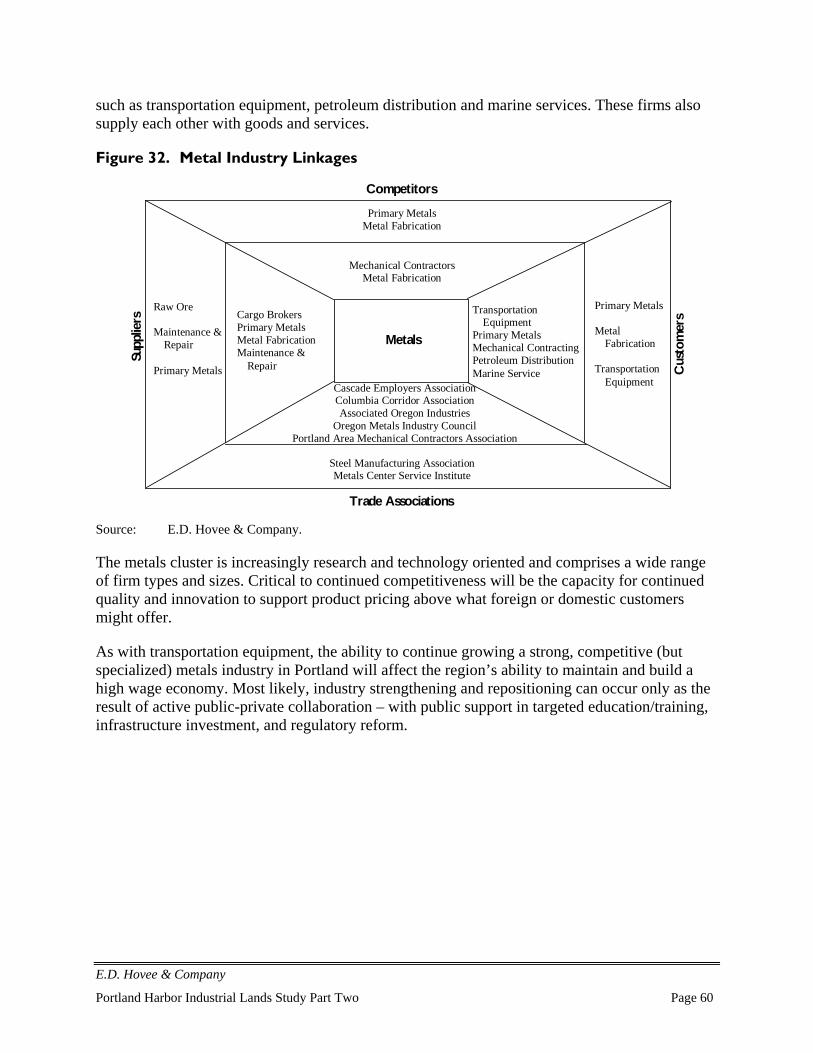
E.D. Hovee & Company
Portland Harbor Industrial Lands Study Part Two Page 60
such as transportation equipment, petroleum distribution and marine services. These firms alsosupply each other with goods and services.
Figure 32. Metal Industry Linkages
Competitors
Trade Associations
Supp
liers
Cust
omer
s
Metals
Cascade Employers AssociationColumbia Corridor Association Associated Oregon Industries
Oregon Metals Industry Council Portland Area Mechanical Contractors Association
Mechanical Contractors Metal Fabrication
Transportation Equipment
Primary Metals Mechanical Contracting Petroleum Distribution Marine Service
Primary Metals Metal
Fabrication Transportation
Equipment
Cargo Brokers Primary Metals Metal Fabrication Maintenance &
Repair
Raw Ore Maintenance &
Repair Primary Metals
Primary MetalsMetal Fabrication
Steel Manufacturing Association Metals Center Service Institute
Source: E.D. Hovee & Company.
The metals cluster is increasingly research and technology oriented and comprises a wide rangeof firm types and sizes. Critical to continued competitiveness will be the capacity for continuedquality and innovation to support product pricing above what foreign or domestic customersmight offer.
As with transportation equipment, the ability to continue growing a strong, competitive (butspecialized) metals industry in Portland will affect the region’s ability to maintain and build ahigh wage economy. Most likely, industry strengthening and repositioning can occur only as theresult of active public-private collaboration – with public support in targeted education/training,infrastructure investment, and regulatory reform.
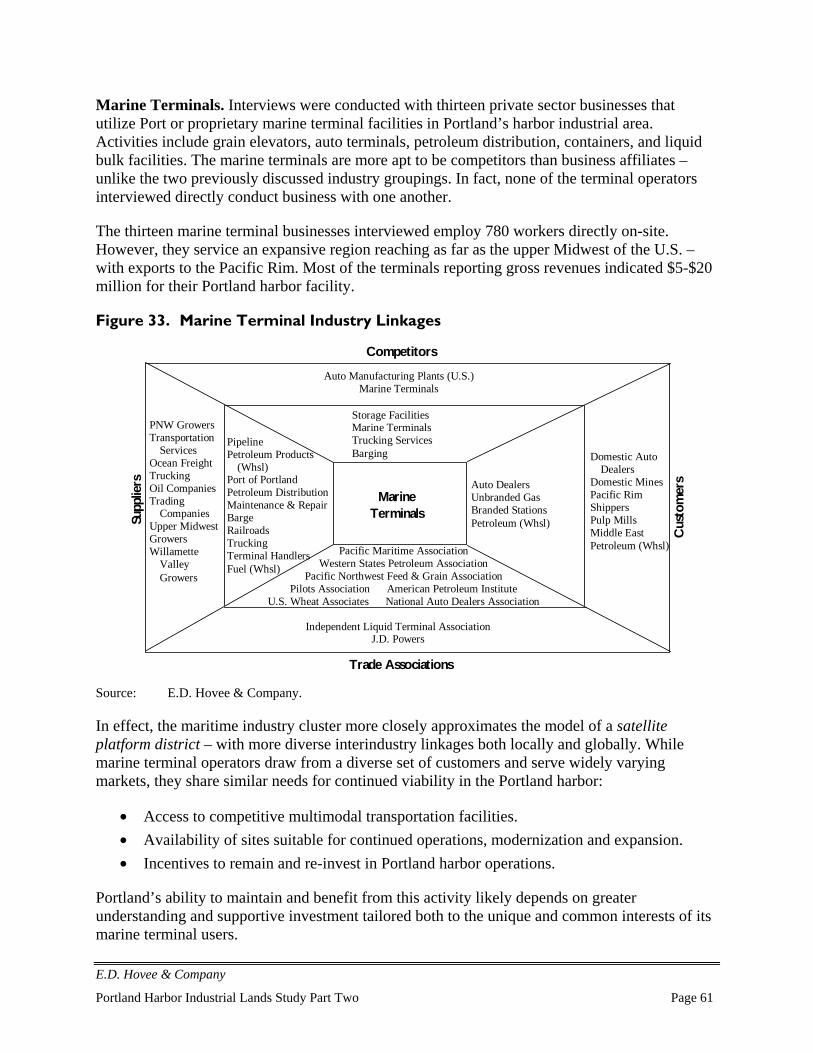
E.D. Hovee & Company
Portland Harbor Industrial Lands Study Part Two Page 61
Marine Terminals. Interviews were conducted with thirteen private sector businesses thatutilize Port or proprietary marine terminal facilities in Portland’s harbor industrial area.Activities include grain elevators, auto terminals, petroleum distribution, containers, and liquidbulk facilities. The marine terminals are more apt to be competitors than business affiliates –unlike the two previously discussed industry groupings. In fact, none of the terminal operatorsinterviewed directly conduct business with one another.
The thirteen marine terminal businesses interviewed employ 780 workers directly on-site.However, they service an expansive region reaching as far as the upper Midwest of the U.S. –with exports to the Pacific Rim. Most of the terminals reporting gross revenues indicated $5-$20million for their Portland harbor facility.
Figure 33. Marine Terminal Industry Linkages
Competitors
Trade Associations
Supp
liers
Cust
omer
s
Marine Terminals
Pacific Maritime Association Western States Petroleum Association
Pacific Northwest Feed & Grain Association Pilots Association American Petroleum Institute
U.S. Wheat Associates National Auto Dealers Association
Storage Facilities Marine Terminals Trucking Services Barging
Auto Dealers Unbranded Gas Branded Stations Petroleum (Whsl)
Domestic Auto Dealers
Domestic Mines Pacific Rim Shippers Pulp Mills Middle East Petroleum (Whsl)
Pipeline Petroleum Products
(Whsl) Port of Portland Petroleum Distribution Maintenance & Repair Barge Railroads Trucking Terminal Handlers Fuel (Whsl)
PNW Growers Transportation
Services Ocean Freight Trucking Oil Companies Trading
Companies Upper Midwest Growers Willamette
Valley Growers
Auto Manufacturing Plants (U.S.)Marine Terminals
Independent Liquid Terminal Association J.D. Powers
Marine Terminals
Source: E.D. Hovee & Company.
In effect, the maritime industry cluster more closely approximates the model of a satelliteplatform district – with more diverse interindustry linkages both locally and globally. Whilemarine terminal operators draw from a diverse set of customers and serve widely varyingmarkets, they share similar needs for continued viability in the Portland harbor:
• Access to competitive multimodal transportation facilities.• Availability of sites suitable for continued operations, modernization and expansion.• Incentives to remain and re-invest in Portland harbor operations.
Portland’s ability to maintain and benefit from this activity likely depends on greaterunderstanding and supportive investment tailored both to the unique and common interests of itsmarine terminal users.
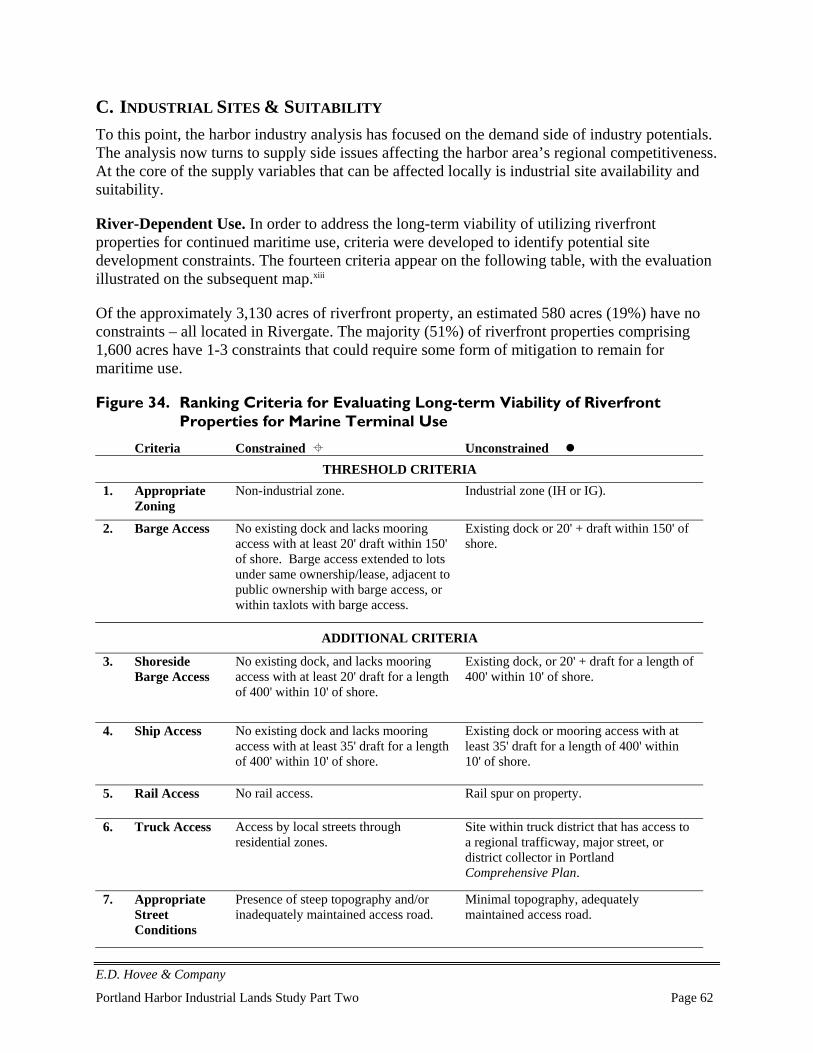
E.D. Hovee & Company
Portland Harbor Industrial Lands Study Part Two Page 62
C. INDUSTRIAL SITES & SUITABILITY
To this point, the harbor industry analysis has focused on the demand side of industry potentials.The analysis now turns to supply side issues affecting the harbor area’s regional competitiveness.At the core of the supply variables that can be affected locally is industrial site availability andsuitability.
River-Dependent Use. In order to address the long-term viability of utilizing riverfrontproperties for continued maritime use, criteria were developed to identify potential sitedevelopment constraints. The fourteen criteria appear on the following table, with the evaluationillustrated on the subsequent map.xiii
Of the approximately 3,130 acres of riverfront property, an estimated 580 acres (19%) have noconstraints – all located in Rivergate. The majority (51%) of riverfront properties comprising1,600 acres have 1-3 constraints that could require some form of mitigation to remain formaritime use.
Figure 34. Ranking Criteria for Evaluating Long-term Viability of RiverfrontProperties for Marine Terminal Use
Criteria Constrained Unconstrained THRESHOLD CRITERIA
1. AppropriateZoning
Non-industrial zone. Industrial zone (IH or IG).
2. Barge Access No existing dock and lacks mooringaccess with at least 20' draft within 150'of shore. Barge access extended to lotsunder same ownership/lease, adjacent topublic ownership with barge access, orwithin taxlots with barge access.
Existing dock or 20' + draft within 150' ofshore.
ADDITIONAL CRITERIA
3. ShoresideBarge Access
No existing dock, and lacks mooringaccess with at least 20' draft for a lengthof 400' within 10' of shore.
Existing dock, or 20' + draft for a length of400' within 10' of shore.
4. Ship Access No existing dock and lacks mooringaccess with at least 35' draft for a lengthof 400' within 10' of shore.
Existing dock or mooring access with atleast 35' draft for a length of 400' within10' of shore.
5. Rail Access No rail access. Rail spur on property.
6. Truck Access Access by local streets throughresidential zones.
Site within truck district that has access toa regional trafficway, major street, ordistrict collector in PortlandComprehensive Plan.
7. AppropriateStreetConditions
Presence of steep topography and/orinadequately maintained access road.
Minimal topography, adequatelymaintained access road.
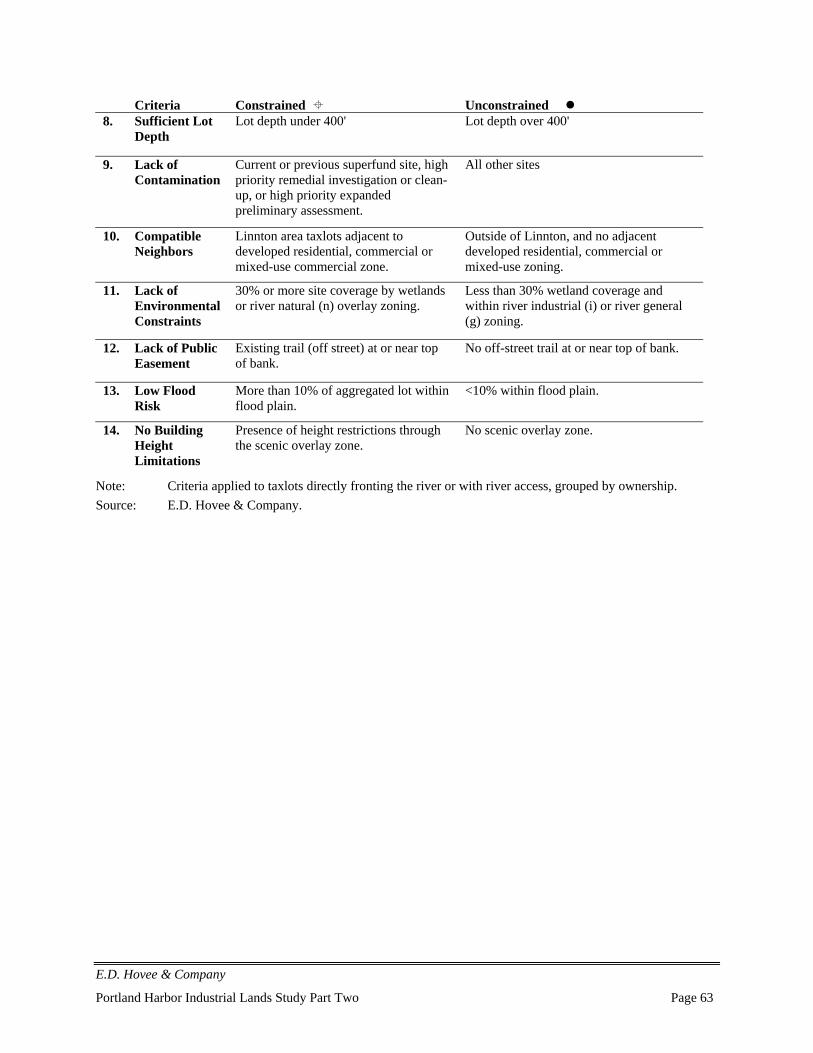
E.D. Hovee & Company
Portland Harbor Industrial Lands Study Part Two Page 63
Criteria Constrained Unconstrained 8. Sufficient Lot
DepthLot depth under 400' Lot depth over 400'
9. Lack ofContamination
Current or previous superfund site, highpriority remedial investigation or clean-up, or high priority expandedpreliminary assessment.
All other sites
10. CompatibleNeighbors
Linnton area taxlots adjacent todeveloped residential, commercial ormixed-use commercial zone.
Outside of Linnton, and no adjacentdeveloped residential, commercial ormixed-use zoning.
11. Lack ofEnvironmentalConstraints
30% or more site coverage by wetlandsor river natural (n) overlay zoning.
Less than 30% wetland coverage andwithin river industrial (i) or river general(g) zoning.
12. Lack of PublicEasement
Existing trail (off street) at or near topof bank.
No off-street trail at or near top of bank.
13. Low FloodRisk
More than 10% of aggregated lot withinflood plain.
<10% within flood plain.
14. No BuildingHeightLimitations
Presence of height restrictions throughthe scenic overlay zone.
No scenic overlay zone.
Note: Criteria applied to taxlots directly fronting the river or with river access, grouped by ownership.Source: E.D. Hovee & Company.
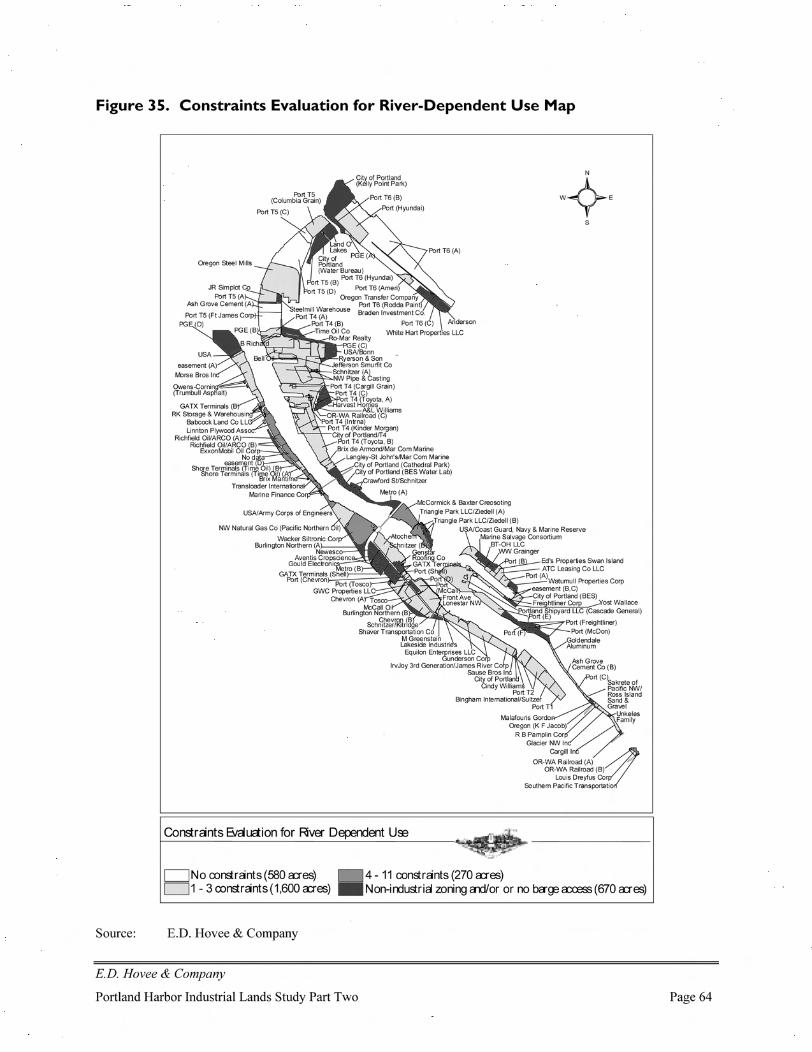
E.D. Hovee & Company
Portland Harbor Industrial Lands Study Part Two Page 65
An estimated 270 acres (9%) has anywhere from 4-11 constraints. In some cases, the constraintsmay be amenable to remediation for river-dependent uses in a manner that allows privateinvestment to proceed. In other instances, the constraints or cost to convert may exceed whatindustrial users find feasible in today’s market.
Finally, 670 acres (21% of the total) are deemed as not meeting minimal threshold constraints ofsuitable industrial zoning and barge access. This includes sites (particularly upland properties)that may be suitable for non-marine industrial activity.
Upland Sites. The harbor industrial area has another 2,398 acres of upland property, or siteslocated inland and away from the Willamette and Columbia riverfronts. A detailed quantitativeand mapping assessment of these properties has not been conducted as part of this study. This isfor two reasons:
• The criteria important for evaluating constraints or suitability for non-river-dependentindustrial use are different from and more varied than for river-dependent industrialactivity.
• There is less data readily available to usefully and objectively assess upland siteconstraints.
Criteria that could be applied to assessing upland site limitations could be drawn from thefollowing listing.
Figure 36. Potential Criteria for Upland Site Suitability
1. Appropriate zoning – industrial or employment zone.2. Site size – can be more varied depending on business needs and whether developed for single user or
as multi-tenant industrial park space.3. Truck access – freeway connections and congestion.4. Transit access – distance from bus stop and frequency/availability of service (including
evening/weekend shifts).5. Lack of contaminated sites – current or previous superfund designation high priority remedial
investigation or cleanup, or high priority expanded preliminary assessment.6. Compatible neighbors – proximity to residential or commercial uses that could be negatively affected
by or object to industrial use (particularly at edges of the harbor industrial area).Source: E.D. Hovee & Company.
D. LAND USE SENSITIVITY
The type and intensity of industrial activity that will locate within the Portland harbor area willbe affected by several market and non-market factors. Three specific factors that will challengethe harbor area’s long-term viability and competitiveness relate to availability of useable land,development and business occupancy costs, and viable alternative locations inside or outside theregion.
Useable Land. A number of the river-dependent sites have constraints, which limits the amountof useable acreage for further maritime use/development. As noted earlier, only 580 acres haveno constraints, most of which are owned by the Port of Portland and are located along theColumbia River at T-6. There is a significant amount of land (1,600 acres) that is encumbered
E.D. Hovee & Company
Portland Harbor Industrial Lands Study Part Two Page 66
with 1-3 constraints. These sites tend to be privately owned/operated and are located along theWillamette River. There are only a few hundred acres that have a significant number ofencumbrances (4-11 constraints). However, these sites are strategic for the Harbor’s long-termmaritime viability. These sites include Linnton, Oregon’s petroleum hub, and McCormick Baxterproperties.
In order for Portland to maintain a viable maritime industry, the public sector will need to workwith the private sector to find feasible means for mediating the challenges facing the encumberedriverfront sites. Currently, it appears that the more constraints a site has the less investment (ormore disinvestment) is occurring.
A specific example of the practical issues that site constraints pose – even for establishedindustries – is provided by Portland’s petro-chemical industry. At identified petroleum facilitysites, interview results indicate that the expense of meeting environmental regulations hasdeterred private investment. Unless a constructive framework is developed to address many ofthe issues facing riverfront properties, Portland may experience relocation or displacement, overthe long-term, as has occurred at other sites such as Linnton and McCormick Baxter.
Development/Business Occupancy Costs. One of the primary issues affecting the harbor area,as well as the entire City of Portland, relates to comparative costs of development and ongoingbusiness operations. Some development costs are more specific to the harbor area (such asbrownfield remediation) than the rest of Portland. However, if the harbor area is going to remaincompetitive with other industrial districts inside or outside the region, the issue of regulatorycosts borne by the private sector appears increasingly critical to address.
Other studies conducted for sites within the harbor area have shown that industrial reuse on theWillamette River can have a negative land value. Negative land value occurs when the cost ofenvironmental remediation and infrastructure exceed the competitive value of a land parcel readyfor development.
When the land value goes negative, there is no incentive for the current land owner (or aprospective purchaser) to proceed with redevelopment. Industrial reuse is particularly vulnerable,since industry typically supports a lower land value than other private market uses – includingresidential and commercial reuse.
Studies completed for two sites in particular, McCormick Baxter and Terminal One North,indicate that without infusion of public sector resources, redevelopment for industrial (andperhaps even other higher value) use is infeasible, which means these sites are likely to remainvacant for at least the near term.
Viable Alternatives. Viable locations for various industries depends on the nature of the activityin question. The chart below identifies potential locations by industry cluster.
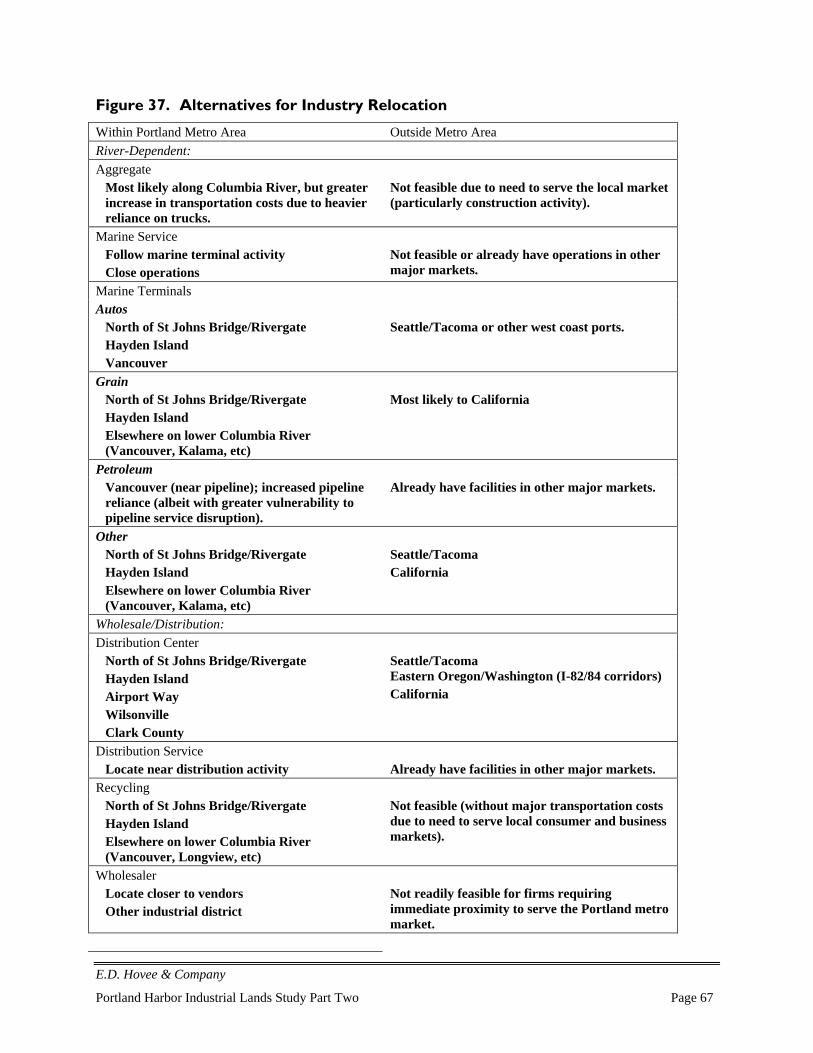
E.D. Hovee & Company
Portland Harbor Industrial Lands Study Part Two Page 67
Figure 37. Alternatives for Industry Relocation
Within Portland Metro Area Outside Metro AreaRiver-Dependent:Aggregate
Most likely along Columbia River, but greaterincrease in transportation costs due to heavierreliance on trucks.
Not feasible due to need to serve the local market(particularly construction activity).
Marine ServiceFollow marine terminal activityClose operations
Not feasible or already have operations in othermajor markets.
Marine TerminalsAutos
North of St Johns Bridge/RivergateHayden IslandVancouver
Seattle/Tacoma or other west coast ports.
GrainNorth of St Johns Bridge/RivergateHayden IslandElsewhere on lower Columbia River(Vancouver, Kalama, etc)
Most likely to California
PetroleumVancouver (near pipeline); increased pipelinereliance (albeit with greater vulnerability topipeline service disruption).
Already have facilities in other major markets.
OtherNorth of St Johns Bridge/RivergateHayden IslandElsewhere on lower Columbia River(Vancouver, Kalama, etc)
Seattle/TacomaCalifornia
Wholesale/Distribution:Distribution Center
North of St Johns Bridge/RivergateHayden IslandAirport WayWilsonvilleClark County
Seattle/TacomaEastern Oregon/Washington (I-82/84 corridors)California
Distribution ServiceLocate near distribution activity Already have facilities in other major markets.
RecyclingNorth of St Johns Bridge/RivergateHayden IslandElsewhere on lower Columbia River(Vancouver, Longview, etc)
Not feasible (without major transportation costsdue to need to serve local consumer and businessmarkets).
WholesalerLocate closer to vendorsOther industrial district
Not readily feasible for firms requiringimmediate proximity to serve the Portland metromarket.
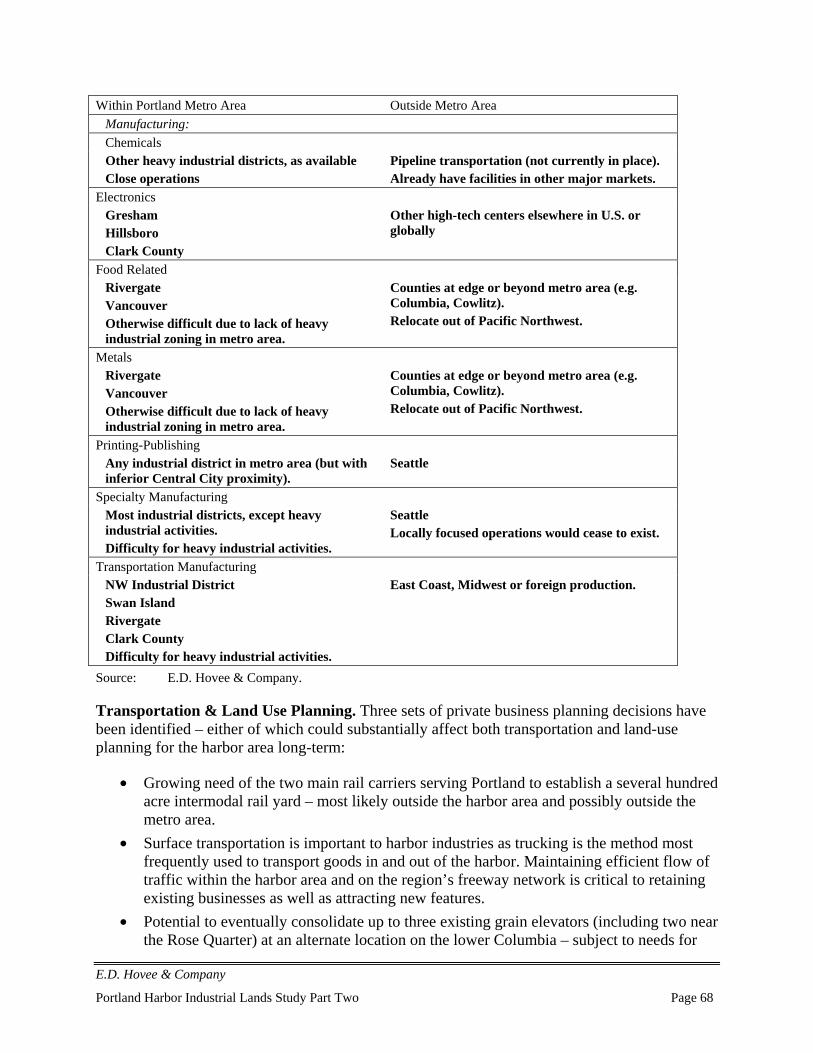
E.D. Hovee & Company
Portland Harbor Industrial Lands Study Part Two Page 68
Within Portland Metro Area Outside Metro AreaManufacturing:ChemicalsOther heavy industrial districts, as availableClose operations
Pipeline transportation (not currently in place).Already have facilities in other major markets.
ElectronicsGreshamHillsboroClark County
Other high-tech centers elsewhere in U.S. orglobally
Food RelatedRivergateVancouverOtherwise difficult due to lack of heavyindustrial zoning in metro area.
Counties at edge or beyond metro area (e.g.Columbia, Cowlitz).Relocate out of Pacific Northwest.
MetalsRivergateVancouverOtherwise difficult due to lack of heavyindustrial zoning in metro area.
Counties at edge or beyond metro area (e.g.Columbia, Cowlitz).Relocate out of Pacific Northwest.
Printing-PublishingAny industrial district in metro area (but withinferior Central City proximity).
Seattle
Specialty ManufacturingMost industrial districts, except heavyindustrial activities.Difficulty for heavy industrial activities.
SeattleLocally focused operations would cease to exist.
Transportation ManufacturingNW Industrial DistrictSwan IslandRivergateClark CountyDifficulty for heavy industrial activities.
East Coast, Midwest or foreign production.
Source: E.D. Hovee & Company.
Transportation & Land Use Planning. Three sets of private business planning decisions havebeen identified – either of which could substantially affect both transportation and land-useplanning for the harbor area long-term:
• Growing need of the two main rail carriers serving Portland to establish a several hundredacre intermodal rail yard – most likely outside the harbor area and possibly outside themetro area.
• Surface transportation is important to harbor industries as trucking is the method mostfrequently used to transport goods in and out of the harbor. Maintaining efficient flow oftraffic within the harbor area and on the region’s freeway network is critical to retainingexisting businesses as well as attracting new features.
• Potential to eventually consolidate up to three existing grain elevators (including two nearthe Rose Quarter) at an alternate location on the lower Columbia – subject to needs for
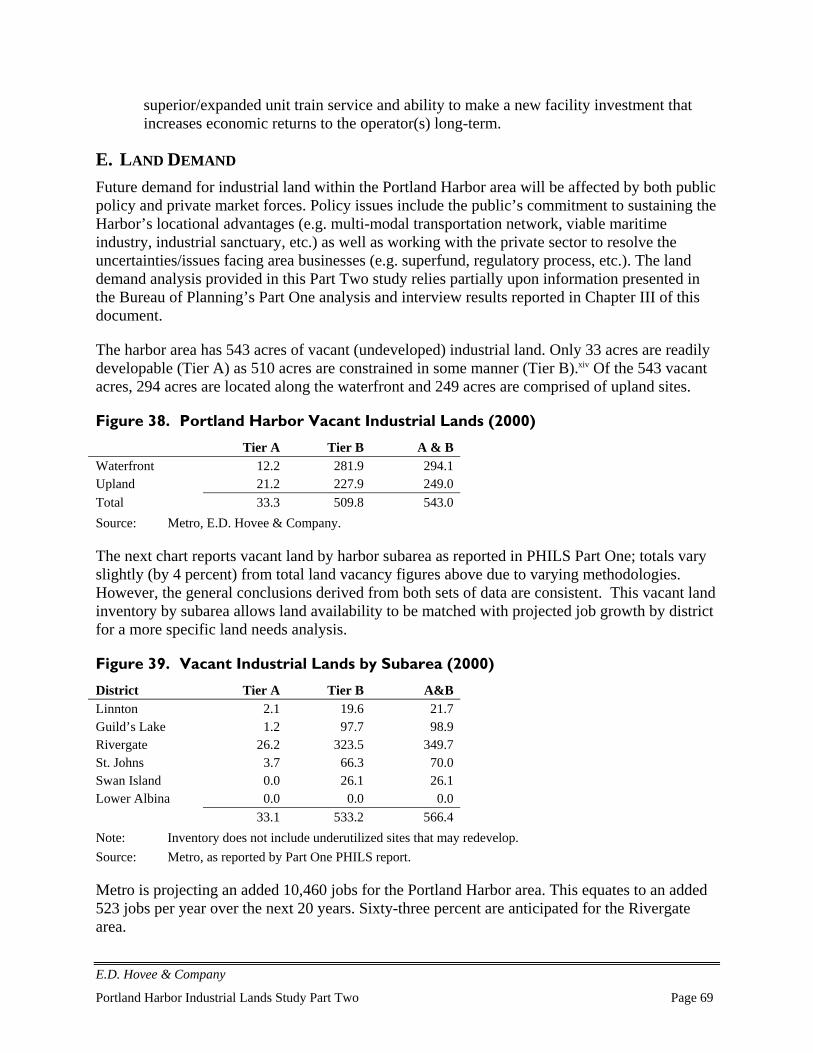
E.D. Hovee & Company
Portland Harbor Industrial Lands Study Part Two Page 69
superior/expanded unit train service and ability to make a new facility investment thatincreases economic returns to the operator(s) long-term.
E. LAND DEMAND
Future demand for industrial land within the Portland Harbor area will be affected by both publicpolicy and private market forces. Policy issues include the public’s commitment to sustaining theHarbor’s locational advantages (e.g. multi-modal transportation network, viable maritimeindustry, industrial sanctuary, etc.) as well as working with the private sector to resolve theuncertainties/issues facing area businesses (e.g. superfund, regulatory process, etc.). The landdemand analysis provided in this Part Two study relies partially upon information presented inthe Bureau of Planning’s Part One analysis and interview results reported in Chapter III of thisdocument.
The harbor area has 543 acres of vacant (undeveloped) industrial land. Only 33 acres are readilydevelopable (Tier A) as 510 acres are constrained in some manner (Tier B).xiv Of the 543 vacantacres, 294 acres are located along the waterfront and 249 acres are comprised of upland sites.
Figure 38. Portland Harbor Vacant Industrial Lands (2000)
Tier A Tier B A & BWaterfront 12.2 281.9 294.1Upland 21.2 227.9 249.0Total 33.3 509.8 543.0Source: Metro, E.D. Hovee & Company.
The next chart reports vacant land by harbor subarea as reported in PHILS Part One; totals varyslightly (by 4 percent) from total land vacancy figures above due to varying methodologies.However, the general conclusions derived from both sets of data are consistent. This vacant landinventory by subarea allows land availability to be matched with projected job growth by districtfor a more specific land needs analysis.
Figure 39. Vacant Industrial Lands by Subarea (2000)
District Tier A Tier B A&BLinnton 2.1 19.6 21.7Guild’s Lake 1.2 97.7 98.9Rivergate 26.2 323.5 349.7St. Johns 3.7 66.3 70.0Swan Island 0.0 26.1 26.1Lower Albina 0.0 0.0 0.0
33.1 533.2 566.4Note: Inventory does not include underutilized sites that may redevelop.Source: Metro, as reported by Part One PHILS report.
Metro is projecting an added 10,460 jobs for the Portland Harbor area. This equates to an added523 jobs per year over the next 20 years. Sixty-three percent are anticipated for the Rivergatearea.
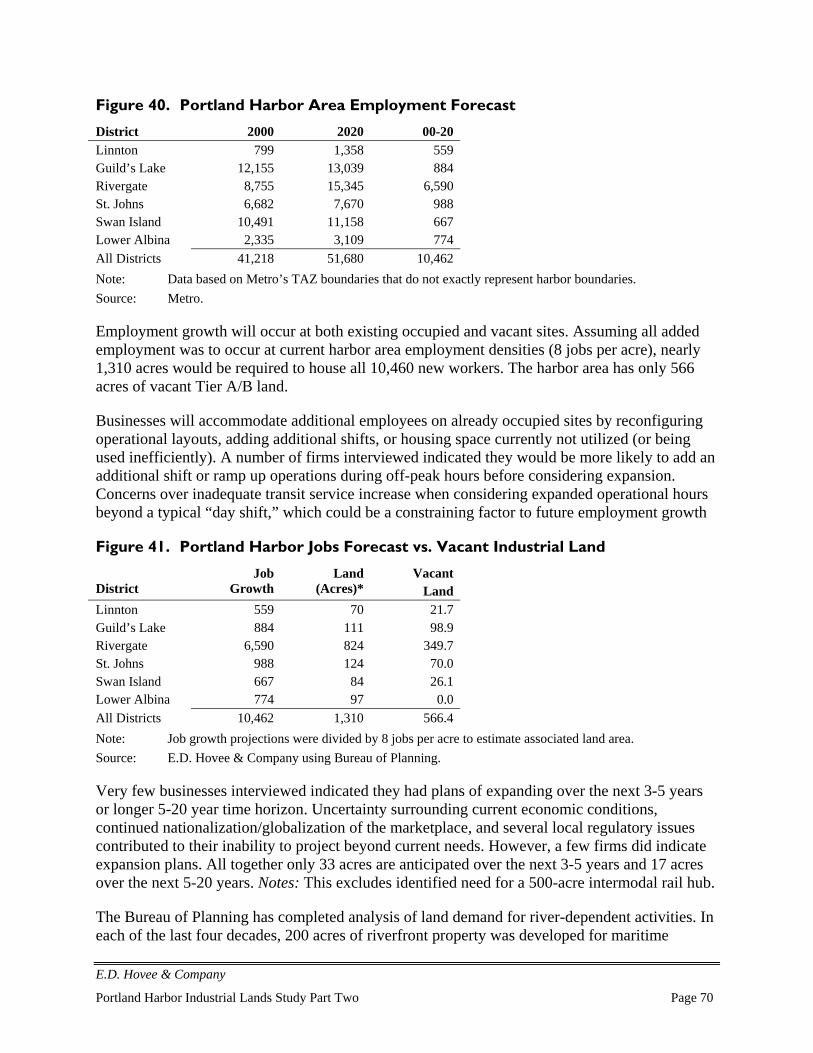
E.D. Hovee & Company
Portland Harbor Industrial Lands Study Part Two Page 70
Figure 40. Portland Harbor Area Employment Forecast
District 2000 2020 00-20Linnton 799 1,358 559Guild’s Lake 12,155 13,039 884Rivergate 8,755 15,345 6,590St. Johns 6,682 7,670 988Swan Island 10,491 11,158 667Lower Albina 2,335 3,109 774All Districts 41,218 51,680 10,462Note: Data based on Metro’s TAZ boundaries that do not exactly represent harbor boundaries.Source: Metro.
Employment growth will occur at both existing occupied and vacant sites. Assuming all addedemployment was to occur at current harbor area employment densities (8 jobs per acre), nearly1,310 acres would be required to house all 10,460 new workers. The harbor area has only 566acres of vacant Tier A/B land.
Businesses will accommodate additional employees on already occupied sites by reconfiguringoperational layouts, adding additional shifts, or housing space currently not utilized (or beingused inefficiently). A number of firms interviewed indicated they would be more likely to add anadditional shift or ramp up operations during off-peak hours before considering expansion.Concerns over inadequate transit service increase when considering expanded operational hoursbeyond a typical “day shift,” which could be a constraining factor to future employment growth
Figure 41. Portland Harbor Jobs Forecast vs. Vacant Industrial Land
DistrictJob
GrowthLand
(Acres)*Vacant
LandLinnton 559 70 21.7Guild’s Lake 884 111 98.9Rivergate 6,590 824 349.7St. Johns 988 124 70.0Swan Island 667 84 26.1Lower Albina 774 97 0.0All Districts 10,462 1,310 566.4Note: Job growth projections were divided by 8 jobs per acre to estimate associated land area.Source: E.D. Hovee & Company using Bureau of Planning.
Very few businesses interviewed indicated they had plans of expanding over the next 3-5 yearsor longer 5-20 year time horizon. Uncertainty surrounding current economic conditions,continued nationalization/globalization of the marketplace, and several local regulatory issuescontributed to their inability to project beyond current needs. However, a few firms did indicateexpansion plans. All together only 33 acres are anticipated over the next 3-5 years and 17 acresover the next 5-20 years. Notes: This excludes identified need for a 500-acre intermodal rail hub.
The Bureau of Planning has completed analysis of land demand for river-dependent activities. Ineach of the last four decades, 200 acres of riverfront property was developed for maritime

E.D. Hovee & Company
Portland Harbor Industrial Lands Study Part Two Page 71
activities. This equates to an annual average absorption of 20 acres. Assuming a similar trendwas to continue over the next 20-30 years, 400-600 acres of riverfront industrial property couldbe needed to sustain an economically viable working waterfront. Assimilating this amount ofriverfront property could prove challenging, and brings into question the potential of usingnearby upland sites – including potential future consideration of industrial land reservesassociated with the west end of Hayden Island.

E.D. Hovee & Company
Portland Harbor Industrial Lands Study Part Two Page 72
E.D. Hovee & Company
Portland Harbor Industrial Lands Study Part Two Page 73
V. POLICY QUESTIONS
The analyses completed for both Part One and Two studies have surfaced a number of policyissues that should be addressed as the City carries forward its Portland harbor planning efforts.As noted at the beginning of this Part Two PHILS report, results are also expected to beimportant for Portland’s updated economic development strategy and for marine facilitiesplanning by the Port of Portland.
The Bureau of Planning proposed policy questions for this study to address. Additional relatedpolicy issues have surfaced from the industry interviews and economic research conducted forthis Part Two PHILS report. These Part Two results are termed “survey results.”
Policy questions addressed are grouped into four major topic areas covering: a) all harbor areaindustries, b) river-dependent industries, c) upland industries, and d) alternative futures.
A. ALL HARBOR AREA INDUSTRIES
Further understanding of three questions posed by the Bureau of Planning will be important indeciding which alternative future is the more viable – whether from a market-driven or publicpolicy perspective. The first question relates to overall trends and issues for harbor industries, thesecond to the potentially changing mix of harbor area business activity, and the third to overallpolicy implications.
1. What are the major trends and issues affecting business and employment prospects forPortland’s harbor area industries?
• What are the major industry trends affecting Portland harbor area industries? To whatextent will harbor firms be in the same business 5-10 years from now? In what ways maythe face of business change? And, what are the long-term implications for the Portlandharbor industrial area?
While the national economic downturn has dramatically affected Oregon and the metroarea, Portland’s harbor industries generally appear to be holding their own. On average,reported employment is up by about 7% for full-time employees and down 5% for part-time employees compared to 3-5 years ago.
While stable on the downside, these businesses (generally the larger employers in theharbor area) also do not expect to be adding substantial numbers of new jobs as theeconomy rebounds. Average gains of 9% for full-time and 30% for part-time employeesare projected over the next 3-5 years. These gains would bring full-time employmentback slightly ahead of pre-recession levels; more substantial growth potential appears tolie with part-time jobs.
While considerable investment is occurring or is expected, both river-dependent andlarger upland firms that plan to expand generally can do so without need for additionalharbor area industrial land. Some industries – such as transportation and metalsmanufacturing – may essentially reinvent themselves over the next 10-20 years. All firms
E.D. Hovee & Company
Portland Harbor Industrial Lands Study Part Two Page 74
that serve a national or global market are facing extraordinary competitive pressures –particularly to be more cost competitive.
• Has Portland changed from a low-moderate cost to high cost city for business? If so, arethese trends beyond local/regional control or can Portland’s cost competitiveness beimproved? Can cost disadvantages be offset by technological innovation and industryleadership? What supportive actions can be taken by the City, Port and other regionaland state agencies?
Finding ways to remain cost-competitive appears to be the #1 issue facing Portlandharbor area industries. The challenge is particularly intense for these firms because theygenerally perceive Portland as no longer a low-moderate but rather a high cost city fromwhich to do business – compared to their industry peers. The reasons vary by firm andinclude such factors as wage and benefit costs, cost of land, distance frommarket/transportation cost, underinvestment in transportation and educationinfrastructure, and the combined cost, uncertainty and perceived anti-business characterof state/local regulation.
Some of these cost disadvantages – such as distance from market – may be beyond theinfluence of the Portland community to affect. Other factors – related to labor,infrastructure and regulation – may be more amenable to corrective public policy andaction, although not without attendant public expense.
• What harbor area issues are most affecting business planning and investment decisionsnow? In what ways? What issues potentially could become major tipping points –causing business to disinvest in the harbor area? How can these issues be addressed pro-actively, responding to critical business concerns and interests?
For riverfront and some nearby owners, issues most pressing today include uncertaintyand potential cost associated with superfund cleanup and maintenance of competitivemulti-modal transportation (marine, rail, highway). For upland as well as waterfrontindustries, additional issues of concern include regional congestion (for employees andfreight), encroachment of incompatible non-industrial use, high cost and time delay forpermitting, and perceived lack of city/regional public policy and community support.
If not addressed, these are issues that individually or collectively could cause harborindustries to relocate and/or disinvest over time. There appear to be two primary means toproactively address industry concerns – expressed interest/interaction from the Cityfollowed by policies and investments that can make a demonstrable difference for harborindustries.
2. How will the mix of industries change in the harbor area to 2030?
• Map the primary inter-firm and inter-industry linkages that keep particular industrysegments in the harbor area.
E.D. Hovee & Company
Portland Harbor Industrial Lands Study Part Two Page 75
Key linkages for major harbor area industry groupings are summarized as follows:
River-Dependent – Aggregate firms require multi-modal access including convenientlocal street access to major street networks. Firms must be linked to both ColumbiaRiver sites in order to transport aggregate materials (generally barged in for shallow15-20 foot draft), and to Central City/metro area construction sites. Marineterminal/service firms require deeper draft facilities of 30-40+ feet, multi-modalaccess, and significant site depth. These firms are widely linked as suppliers to theregion’s gas/petroleum product distribution network; regional manufacturing,wholesale and retail industries; and as transporters of products ranging from Portlandmetro industrial goods to Pacific Northwest/Midwest agricultural commodities.
Wholesale/Distribution – Firms can be generally classified as two types: a) thoseserving metro area business and consumer needs, thereby placing premium value on acentral regional (including Central City) location together with ready freeway access;and b) distribution centers/transshipment facilities serving markets largely locatedoutside the metro area. For this second group, intermodal connections andcompetitive business cost factors are of greater importance than a central location.
Manufacturing – Harbor area chemical and electronics companies are suppliers to awide spectrum of the metro area’s high tech and general manufacturing industrialbase. Food-related companies also are diverse, and vary in their utilization of regionalagriculture for a regional/global market versus a local/metro market.Printing/publishing firms benefit from proximity to the Central City and frominteraction with close-by suppliers and customers.
Metals and transportation firms have substantial in-place capital investment, oftenrequiring intermodal transportation capability for bulk products, and draw onextensive vendor-supplier relationships with other similar firms as well aswholesalers and transporters in the harbor area. The long-term viability of the harbormetals/transportation clusters is closely aligned with operations of local industryleaders – notably Freightliner, Esco and Gunderson. These linkages will beillustrated with greater detail in the final report.
All harbor area manufacturing clusters (except printing/publishing) typically requireheavy to general industrial zoned land that may not be readily available or suitableelsewhere in the Portland metro area. Metro’s 2000 Buildable Industrial LandsInventory identifies only 238 vacant Tier A acres designated for heavy industrial usethroughout the region, much of which appears to be comprised of relatively smalldevelopment parcels. Including Tier B land brings the regional total of vacant heavyindustrial inventory to just over 1,500 acres.
• Are the land needs of these industry clusters growing, stable, or declining and by howmuch (e.g., acres per year to 2030)?
E.D. Hovee & Company
Portland Harbor Industrial Lands Study Part Two Page 76
Land needs vary depending on the general industry grouping and more detailed clusterunder consideration:
River-Dependent – Little near-term expansion demand from existing firms/operationsin the Portland harbor area is foreseen, with the possible exception of auto importfacilities. Relocation demand is possible depending on factors such as marketpressures for existing close-in sites, resolution of superfund and dredging issues, andresults of the River Renaissance Plan.
Wholesale/Distribution – Demand has been and is expected to remain strong,consistent with historically low vacancy rates for close-in distribution space. Demandwill remain particularly active with firms primarily serving the Central City/Portlandmetro market, assuming reasonable levels of local arterial and freeway congestion aremaintained. The need for Portland harbor area distribution facilities serving a broaderregional to global market is more uncertain, and depends on factors such as thecompetitive cost of business in Portland and suitable transportation access comparedto other site alternatives considered.
Manufacturing – Land needs for the industries surveyed ranges from none to modestexpansion, as most firms report the ability to accommodate expansion needs on-site.However, the interview sample excludes smaller firms that may be currentlygenerating strong land demand, both for new locations and expansion.
• What other growing industries are well suited to the harbor area because of its locationadvantages (e.g., truck access in central location) and what are their likely land needs(e.g., acres per year)?
Survey Results: For this response, the analysis draws not only from the survey results todate but other related research conducted by our firm. Some opportunities can be clearlydiscerned; others are more speculative. Therefore, no specific land demand projectionsare made at this time. For discussion purposes, it is assumed that comprehensive plandesignations/zoning may be changed to meet the needs of the industries described.
Regional Distribution – This assumes that Portland regains competitive share lost toSeattle-Tacoma over the last 20 +/- years. Factors pivotal to successful repositioninginclude available and reasonably priced land, strengthened Port/maritime activities,transition of more freight to rail (with the Columbia River as a more attractive east-west route), and supportive economic development programs.
Transportation/Metals – If these existing harbor area industry clusters remain inPortland, many of these businesses likely will be dramatically reconfigured over thenext 10-20 years. These industries are expected to move toward more leadingtechnology R&D, prototype development, testing, marketing and administrativefunctions.
Wood, Plastic and other Fiber Material Technologies (including end products suchas furniture) – This assumes a renewed priority to re-capitalize on Portland’s historic
E.D. Hovee & Company
Portland Harbor Industrial Lands Study Part Two Page 77
forest products dominance, this time with green products and engineered compositesmost likely leading the way.
High Tech/Bio Tech – The harbor area could be positioned to attract firms that: a)support existing high tech and the emerging biotech/lifescience cluster (i.e. vendorsand contractors); and b) major fab operations (as in semiconductors similar toWacker).
Creative Services & Information Technology (including film & video) – While likelycentered in Portland’s Central City, close-in portions of the harbor area present someopportunity due to the strong presence of the existing printing/publishing cluster.Large isolated land sites could prove attractive for larger footprint uses as for a soundstage facility. Attracting more of this investment activity likely requires adjustmentsto the existing industrial sanctuary.
Corporate Headquarters & Business Park Facilities – Prime sites could includeriverfront locations no longer suited for river-dependent activity and too expensive(when all site costs are considered) to justify industrial reuse. Accommodation orrecruitment of this emerging cluster would also require modifications to existingindustrial sanctuary policy.
3. What planning and policy issues are important to address for harbor industries?
• What is the composite industrial land demand for riverfront and upland industrial sites?This question is difficult to address from interview data – because interview informationdoes not cover needs of smaller industries and/or potential new firms not currentlylocated in the harbor area. However, Metro employment forecasts provide one possibleindicator of industrial land need – assuming regional growth allocations are realized.Within Metro’s regional land inventory, there are only 33 acres of vacant Tier A landplus another 510 acres of vacant Tier B sites. This includes both river and upland sites. Atabsorption rates consistent with the Metro employment forecast, the Tier A inventorywould be depleted within less than one year and the entire Tier A/B inventory within 9years. This assumes that Tier B lands can be readily converted to Tier A status within theabsorption time period indicated.If this demand materializes, it can be expected from three primary sources: auto-orientedmarine terminals, smaller industries in the harbor area with potential to expand, and firmsnot currently present in the harbor area or metro region.
• What types of public infrastructure investments are important to continued vitality ofharbor area industries?For both river dependent and upland firms, continued investment in the region’s multi-modal transportation system is of critical importance to industry competitiveness. I-5Trade Corridor and congestion relief on the region’s freeway and arterial network is ofinterest to a wide range of businesses. Improved transit service also is identified as agrowing interest.While of greatest significance for river-dependent firms continued competitiveness of theharbor area’s intermodal capability also affects related upland industries – especially
E.D. Hovee & Company
Portland Harbor Industrial Lands Study Part Two Page 78
transportation and distribution firms. This includes initiatives to maintain and improvePortland facilities and intermodal rail capabilities.
• How can local authorities minimize regulatory costs?The cost, time delays and uncertainties associated with permitting coupled with theperceived lack of public agency and community support for traditional industry are majorsources of frustration for many business owners – especially those with deep roots in thePortland community. Streamlining the permitting process in a manner that produces apredictable outcome within a reasonable timeframe is of critical importance to addressboth on-going maintenance needs and reinvestment in new or upgraded facilities.Providing assistance in working through the complex web of local, state, and federalregulations would go a long way toward rebuilding a positive relationship/image witharea businesses.
• What can be done to present Portland as a business friendly community?Businesses indicate that addressing industry concerns can be proactively addressed by: a)interaction with City and Port policy and decision-makers, followed by b) City policy andinvestment commitments that can make a demonstrable difference for harbor areaindustries.
B. RIVER-DEPENDENT INDUSTRIES
Two questions are of primary importance in planning for the needs of Portland’s river-dependentindustry – virtually all of which is encompassed by the Willamette/Columbia harbor area definedfor this study. The first question relates to the amount of land required; the second to mostsuitable locations.
1. How much land is needed for expansion of river-dependent industry to 2030?
• The 1997 Harbor Land Use Inventory found a 21-acre per year average of marineindustrial development on previously vacant land since the previous 1990 inventory. Isthat acres-per-year trend likely to be similar over the next 30 years?
Future demand for marine industrial land will likely be driven primarily by users notcurrently located in the Portland Harbor area, possibly coupled with relocation andexpansion of a limited set of existing Portland Harbor area industries.
Based on interviews completed to date, there appears to be little net new land demand onat least the near term horizon from existing river-dependent industries, with the exceptionof auto import facilities. Future demand from external and relocation sources can come inlarge increments (e.g. a Vestas-type use) but is difficult to predict in advance. A keypolicy issue is whether to reserve marine industrial uses for future needs that can not bereadily foreseen. Policy for the harbor area should address the importance of maintaininga working waterfront and determine what is required to sustain an economically viablemaritime trade – both short-term and over a longer 50-100 year time horizon.
• How much 30-year demand for land is for 50+-acre, ship-access sites? How much for5+-acre, barge-access sites?
E.D. Hovee & Company
Portland Harbor Industrial Lands Study Part Two Page 79
In general, firms that were interviewed had difficulty projecting land needs 30 years out.Those that did venture an opinion generally indicate little to no need for added land. Mostfirms also report adequate expansion potential on their existing site for at least the nearterm (3-5 years). The greatest near-term land demand increase is projected by marineterminals, which estimated a combined total demand increase of 100+ acres. Minimalincreases in land demand (not currently controlled) have been projected by manufacturers(metals, electronics and specialty) – for a total by those reporting of just under 20 acres.This demand was reported by manufacturing firms currently located on water accesssites. The exception is with rail distribution, reporting a long-term need for an additional500 acres – not expected to be readily accommodated within the harbor area and perhapsnot in the Portland metro area.
• Will there be a glut of vacant riverfront land as a result of the Superfund project (e.g.,Atofina, Time Oil) or industry contraction (e.g., Alcatel, Cascade General)?
Land data collected over the past two years preliminarily suggests an estimated 294 acresof vacant (unbuilt) riverfront/direct river access property that is not in active use, with thepossible exception of minor storage activities. These sites comprise about 9% of theapproximately 3,133 acres in Portland’s industrial harbor area that directly front theWillamette or Columbia Rivers, or have river access (as illustrated by the land constraintsmapping conducted with this analysis).
It is noted that this inventory does not include sites that are built but currently vacant –whether for sale or lease. Also noted is that, while the extent to which sites areunderutilized due to Superfund or other factors has proven difficult to quantify, surveyresults clearly suggest that opportunities for redevelopment are contingent uponachieving greater clarity as to public/private responsibilities for remediation and theassociated private property owner cost.
The constraints mapping of Section III to this report indicates an estimated 670 acres ofland not well suited for river-dependent industrial activity. Another 270 acres is identifiedas having 4-11 constraints. These sites are most at risk of transitioning from active river-dependent/industrial use in the future – depending on long-term economic prospects andregulatory conditions.
For at least the immediate (3-5 year) future, it appears likely that more land along theWillamette Riverfront will be vacant or underutilized. Even sites with existing businessesmay not operate to their full potential or capacity as new investment is deferred.
Underinvestment in riverfront sites can be attributed to both market and regulatoryconsiderations. The recession has been particularly challenging for capital goods andtrade-related industries – which characterize the industries of Portland’s harbor area.With economic recovery, a longer-term challenge will be Portland’s competitive positionfor trade and industrial investment.
This longer-term competitive posture will be affected by decisions about key regionalinvestments as for channel deepening and maintenance, and ultimate resolution of major
E.D. Hovee & Company
Portland Harbor Industrial Lands Study Part Two Page 80
policy/planning issues – notably superfund liability. If resolution of these issues placesPortland’s riverfront industries at an increased competitive disadvantage, riverfront siteunderinvestment could become more pronounced than they are at present. Conversely, ifresolution is achieved allowing for an adequate financial return on investment, currentlyvacant and underutilized sites could come back on-line with active river-dependentand/or other industrial use.
• If the existing River Industrial Zone was substantially reduced (e.g., to the T-4 to T-6area of the Peninsula), how soon would competing industrial uses deplete the availablesupply of vacant harbor riverfront land?
This response assumes that the proposed reduction is for river-dependent uses (alongWillamette and Columbia frontage) and that there are no other significant changes inupland industrial sanctuary designations.
Metro’s 2000 industrial buildable lands inventory identifies 152 acres of Tier A/B vacantriverfront north of the St. Johns Bridge (roughly equal to the land between the Port’s T-2and T-4). Of this amount, only 12 acres are designated as Tier A with 140 acresclassified as Tier B.
In comparison, developed riverfront industrial land south of the St. John’s Bridge isestimated to total just under 760 acres (also based on 2000 data). While this amount ofdevelopment could not be accommodated with waterfront sites alone, the ability to atleast partially accommodate potential relocation need is expanded if upland sites areincluded.
The inventory of all vacant Tier A land north of the St. Johns Bridge (river plus uplandsites) is 32 acres. Tier B sites add 362 acres. Best case, this inventory of river-orientedand upland sites would be adequate to handle only about one-half of the acreage ofcurrent river-dependent industries south of the St. Johns Bridge.
In summary, the speed with which riverfront land north of the St. John’s Bridge isabsorbed will primarily depend on: a) expansion of T-4 related auto import facilities; b)any relocation demand from river-dependent (and possibly other) industries south of T-4on the Willamette; and c) accommodation of external demand from river-dependent usersnot currently located in Portland’s industrial harbor area. If demand continued at thehistorical (90-97) pace of 21 acres per year, Tier A and B riverfront sites could bedepleted in as little as 7 years.
2. What locations make sense to reserve for river-dependent industry?
• Which lands are the most advantageous, which are moderately advantageous, and whichare marginally suited to meet future demand for river-dependent industrial use?
The results of a preliminary riverfront sites constraints review are described in thecriteria/matrix and map attached as Appendix C to this report. Fourteen criteriarecommended on a preliminary basis to assess site suitability for river-dependent use are:
E.D. Hovee & Company
Portland Harbor Industrial Lands Study Part Two Page 81
Threshold Criteria:
Appropriate zoning Barge access
Additional Criteria: Shoreside barge access Ship access (deep draft) Rail access Truck access Appropriate street conditions Sufficient lot depth Lack of contamination Compatible neighbors Lack of environmental constraints Lack of public easement Low flood risk No building height limitation
• How long will the delay of major capital investment in the Superfund project areacontinue?
Based on comments of those interviewed, major capital investment is generally likely tobe postponed at least until there is more certainty as to affected private owner costresponsibilities. If the time period for clear assignment of costs is extended indefinitely,some existing operating businesses may make decisions to effectively disinvest inexisting Portland Harbor facilities.
In situations where private Superfund related cost responsibilities exceed private ownerresources, some remaining facilities could be closed. If private clean-up costs plusdemolition exceed underlying land values consistent with property zoning, affectedcurrent and future vacated sites could remain underutilized indefinitely, unless land useredesignations allowing high value uses or public funding support for remediationoccurred.
• Should riverfront sites be considered for non-river-dependent uses? If so, for what usesand under what conditions?
While this question was not directly asked in the interviews, there appears to be definitemajority interest in having the City continue to preserve the working harbor area forindustrial use. This interest is further supported by focus group discussion. If river-dependent use is no longer likely (at some river sites), conversion to another non-waterdependent industrial use is generally preferred over conversion to significant retail,office, residential or mixed use.
E.D. Hovee & Company
Portland Harbor Industrial Lands Study Part Two Page 82
Conversion of riverfront land to non-river-dependent industrial use will commit the landto this use for a significant period of time, but not in perpetuity. Depending on theanticipated useful and depreciable life of the investment made, these sites would likelybecome available for reconversion to river-dependent uses – if demand materializes –over a 20-50 year time period.
A minority of interviewees would support mixed use at selected high amenity sites andsome would like more commercial services to area firms (such as dining) situated withinthe industrial sanctuary. For example, maintaining river-dependent industry in Linntonmay prove problematic due to narrow depth of industrial land, nearby adjoiningresidential use, and closure/curtailment of some of the more dominant historical industrialuses.
C. UPLAND INDUSTRIES
Upland industries are defined as those firms located on sites without direct frontage or immediatesite access to the Willamette and Columbia Rivers. Issues and needs associated with uplandindustries are not as central to Portland’s River Plan process, but are important to understandbecause of the interconnected nature of river-dependent with upland industrial activity. Harborarea industries are also somewhat unique in the metro area – because they are located on thelargest repository of land designated for heavy industrial activity not readily accommodatedelsewhere in the region.
1. What are the land needs, policies and priorities for upland (non-river) sites?
• Should industrial sanctuary policy in Portland’s harbor area be revisited? Should mixeduse including commercial/residential activity be allowed? Under what conditions?There appears to be general consensus from those interviewed that residential and largescale commercial retail should not be allowed in an industrial sanctuary. There is lessagreement as to how broadly the term “industrial” should be construed – particularly inan era when many businesses are blurring the traditional boundary between industrial andcommercial functions.
Some would favor more zoning flexibility for related commercial employment functions,including corporate office, creative services/information technology and businesspark/flex space applications. Others prefer maintaining existing distinctions, fearing thatmore flexibility will compromise the ability for some existing businesses to continueindustrial operations in the manner to which they have been accustomed. If greaterflexibility is desired, broadening employment uses could occur as transition elementsalong the fringes of the district where industrial and non-industrial uses abut.
• What transportation network improvements are important to upland industries?As with riverfront industries, upland firms are interested in improved transportation –particularly roadway improvements both for freight and employees. This includes I-5Trade Corridor and other congestion relief to the region's freeway and arterial network.There is perhaps surprisingly strong interest in obtaining better transit service for firmssituated in locations ranging from NW Portland to Rivergate. An increasing proportion of
E.D. Hovee & Company
Portland Harbor Industrial Lands Study Part Two Page 83
the industrial labor force – especially entry level including shift workers – is dependenton transit.
D. PORTLAND HARBOR’S FUTURE
Both business leaders and public policy makers will play a vital role in shaping the harbor’seconomic future. A significant number of the business leaders interviewed indicated they areuncertain about the economic/financial outlook of their companies and industry. Theseuncertainties stem from forces external and internal to the city of Portland.
Other than promoting a favorable business environment, local policy makers may have fewmeans to assist companies in coping with external forces (e.g. condition of the nationaleconomy, globalization, federal policies, etc.). However, local policy makers can directlyinfluence the effect of internal forces by forging partnerships with the private sector to developmutually beneficial harbor area economic development strategies.
Based on the industry-driven interview and focus group discussion process utilized for this PartTwo industrial lands study, a variety of alternative development permutations are viewed aspossible. The development alternative that actually emerges will depend on how the PortlandHarbor area is positioned to encourage on-going and future economic activity.
A continuation of current industry trends coupled with no significant change in the public policyand regulatory environment could result in limited re-investment or disinvestment in waterfrontsites, with resolution of Superfund and related harbor planning and regulatory issues being amajor factor. Continuation of the status quo could result in more non-maritime activity andperhaps a shift over time from manufacturing to wholesale-distribution.
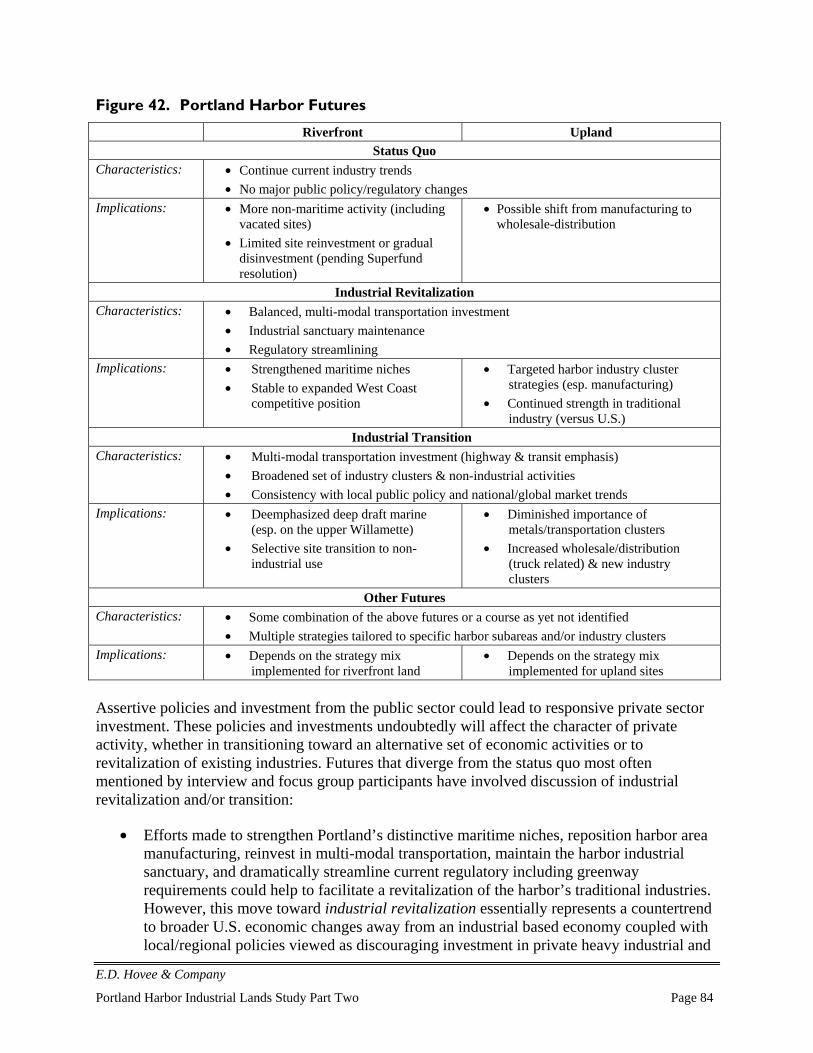
E.D. Hovee & Company
Portland Harbor Industrial Lands Study Part Two Page 84
Figure 42. Portland Harbor Futures
Riverfront UplandStatus Quo
Characteristics: • Continue current industry trends• No major public policy/regulatory changes
Implications: • More non-maritime activity (includingvacated sites)
• Limited site reinvestment or gradualdisinvestment (pending Superfundresolution)
• Possible shift from manufacturing towholesale-distribution
Industrial RevitalizationCharacteristics: • Balanced, multi-modal transportation investment
• Industrial sanctuary maintenance• Regulatory streamlining
Implications: • Strengthened maritime niches• Stable to expanded West Coast
competitive position
• Targeted harbor industry clusterstrategies (esp. manufacturing)
• Continued strength in traditionalindustry (versus U.S.)
Industrial TransitionCharacteristics: • Multi-modal transportation investment (highway & transit emphasis)
• Broadened set of industry clusters & non-industrial activities• Consistency with local public policy and national/global market trends
Implications: • Deemphasized deep draft marine(esp. on the upper Willamette)
• Selective site transition to non-industrial use
• Diminished importance ofmetals/transportation clusters
• Increased wholesale/distribution(truck related) & new industryclusters
Other FuturesCharacteristics: • Some combination of the above futures or a course as yet not identified
• Multiple strategies tailored to specific harbor subareas and/or industry clustersImplications: • Depends on the strategy mix
implemented for riverfront land• Depends on the strategy mix
implemented for upland sites
Assertive policies and investment from the public sector could lead to responsive private sectorinvestment. These policies and investments undoubtedly will affect the character of privateactivity, whether in transitioning toward an alternative set of economic activities or torevitalization of existing industries. Futures that diverge from the status quo most oftenmentioned by interview and focus group participants have involved discussion of industrialrevitalization and/or transition:
• Efforts made to strengthen Portland’s distinctive maritime niches, reposition harbor areamanufacturing, reinvest in multi-modal transportation, maintain the harbor industrialsanctuary, and dramatically streamline current regulatory including greenwayrequirements could help to facilitate a revitalization of the harbor’s traditional industries.However, this move toward industrial revitalization essentially represents a countertrendto broader U.S. economic changes away from an industrial based economy coupled withlocal/regional policies viewed as discouraging investment in private heavy industrial and
E.D. Hovee & Company
Portland Harbor Industrial Lands Study Part Two Page 85
marine terminal investment. The Portland region has successfully resisted the nationaltrend toward deindustrialization, and continued success could prove challenging evenwith recovery from the current recession.
• Transitioning toward (or incorporating) a different set of industries/activities, whileperhaps consistent with recent public policy and national market trends, would representmore of a departure from the status quo for Portland’s harbor industrial area. Anindustrial transition approach involves consideration of multiple strategic choices such asde-emphasizing marine cargo (except barge and shallow draft ship activity) within theupper Willamette (south of the St. Johns Bridge), diminishing importance ofmetals/transportation manufacturing clusters, increasing wholesale/distribution activity(primarily truck-related), and/or transitioning selected river sites to non-industrial use(with some combination of commercial, residential, mixed use and openspace/recreation).
These potential futures are not necessarily mutually exclusive. One approach could be taken forone portion of the harbor area, another for a different portion. Whether the course selected leadsto status quo, industrial revitalization, industrial transition, or some other alternative, decisionsmade by both policy makers and private industry will be instrumental to shape the long-termeconomic future of the harbor area. In deciding the appropriate course, the harbor’s short andlong-term economic importance both to the region and rest of Oregon should be activelyconsidered.
E. SUMMARY OBSERVATIONS
Five concluding observations are suggested by this preliminary review of public policyquestions:
1. The future of Portland’s harbor industrial area is less certain today than in even the recentpast – due to the confluence of changing global market conditions and public policy. Marketconditions of importance center on extreme global competitive pressures that will extendbeyond the recent economic downturn. Globalization affects traditional bulwarks of theharbor area ranging from metals, transportation equipment and printing manufacturing toship calls for grain, breakbulk and dry-bulk cargo, autos and petro-chemicals. Public policyissues are wide-ranging – including questions related to deepening of the Columbia Riverchannel, maintenance dredging of the Willamette, uncertain resolution of harbor Superfundissues, and growing requirements renewed multi-modal transportation infrastructureinvestment.
2. What happens in the harbor area is of profound importance to the economic vitality ofPortland and the entire metro area. This is for two reasons: a) high wages of harbor areaindustries; and b) interconnectedness of harbor industries and transportation functions of theharbor area to businesses and industries located throughout the metro area. No other place inthe Portland region or the state of Oregon has the ability to provide the multi-modaltransportation capacity of Portland’s harbor; no other place can readily accommodate theheavy industries which have been engines of growth and economic vitality – even duringperiods of economic downturn.
E.D. Hovee & Company
Portland Harbor Industrial Lands Study Part Two Page 86
3. The future that happens can and will be strongly influenced by local public policy andinvestment decisions yet to be made. Planning activities of particular importance at presentare the Portland River Plan, city-wide economic development strategy, and Port of Portlandharbor facilities planning now underway. An important threshold question is whether tocontinue to actively support maintenance of the harbor area’s competitive position for river-dependent and upland industry that can not readily be accommodated elsewhere in theregion, or to seek a new vision for some or all of Portland’s harbor area.
4. An appropriate starting point for multi-agency public planning is to determine the maritimefuture of the Willamette River (below the Steel Bridge) and the Columbia River, followed byevaluation of Portland’s realistic and desired future for traditional industries includingtransportation equipment and metals manufacturing. If the community prioritizes investmentin a strong maritime future, there are multiple options as to where that maritime sector is bestaccommodated. However, the level of public-private investment and the risk is substantiallyincreased if the decision is to transition deep-draft and/or other river-dependent/industrialuses north of the St. Johns Bridge. Introduction of mixed use concepts along the Willamettenorth of the Steel/Fremont Bridges also substantially complicates the task of maintaining aviable competitive position for maritime commerce and upland industrial.
5. Whatever course is selected has the best opportunity for successful realization with activepublic/private sector collaboration. Private market interests for river-dependent industry canbe substantially thwarted by perceived or real lack of public policy support – as the currentharbor Superfund uncertainty demonstrates. Similarly, an aggressive public planningapproach to change the face of some or all of the Willamette riverfront will be compromisedif not perceived to be in the economic interests of current riverfront owners and industrialusers – as demonstrated by continued presence of grain elevators in immediate proximity tothe Central City Rose Quarter. Recommended hallmarks of a public-private approach shouldinclude clear public policy objectives, regulatory certainty, significant new infrastructureinvestment, and corresponding private commitment for reinvestment consistent withmutually acceptable planning objectives.
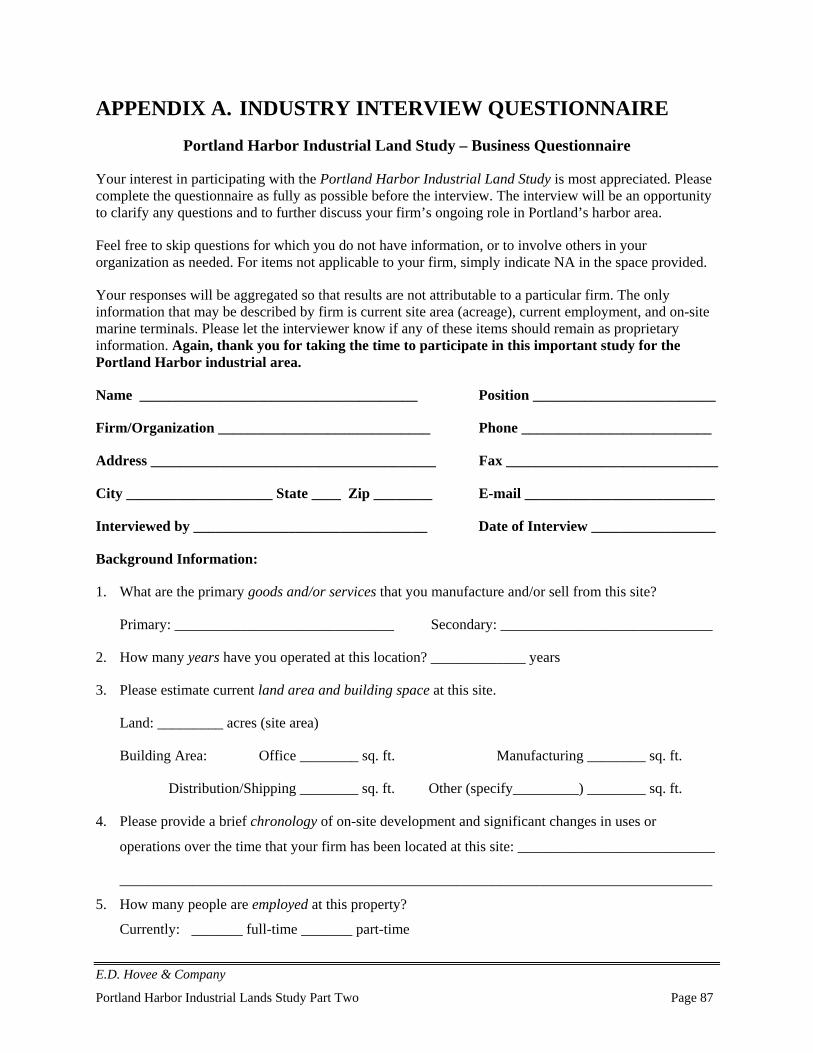
E.D. Hovee & Company
Portland Harbor Industrial Lands Study Part Two Page 87
APPENDIX A. INDUSTRY INTERVIEW QUESTIONNAIRE
Portland Harbor Industrial Land Study – Business Questionnaire
Your interest in participating with the Portland Harbor Industrial Land Study is most appreciated. Pleasecomplete the questionnaire as fully as possible before the interview. The interview will be an opportunityto clarify any questions and to further discuss your firm’s ongoing role in Portland’s harbor area.
Feel free to skip questions for which you do not have information, or to involve others in yourorganization as needed. For items not applicable to your firm, simply indicate NA in the space provided.
Your responses will be aggregated so that results are not attributable to a particular firm. The onlyinformation that may be described by firm is current site area (acreage), current employment, and on-sitemarine terminals. Please let the interviewer know if any of these items should remain as proprietaryinformation. Again, thank you for taking the time to participate in this important study for thePortland Harbor industrial area.
Name ______________________________________ Position _________________________
Firm/Organization _____________________________ Phone __________________________
Address _______________________________________ Fax _____________________________
City ____________________ State ____ Zip ________ E-mail __________________________
Interviewed by ________________________________ Date of Interview _________________
Background Information:
1. What are the primary goods and/or services that you manufacture and/or sell from this site?
Primary: ______________________________ Secondary: _____________________________
2. How many years have you operated at this location? _____________ years
3. Please estimate current land area and building space at this site.
Land: _________ acres (site area)
Building Area: Office ________ sq. ft. Manufacturing ________ sq. ft.
Distribution/Shipping ________ sq. ft. Other (specify_________) ________ sq. ft.
4. Please provide a brief chronology of on-site development and significant changes in uses or
operations over the time that your firm has been located at this site: ___________________________
_________________________________________________________________________________
5. How many people are employed at this property?
Currently: _______ full-time _______ part-time
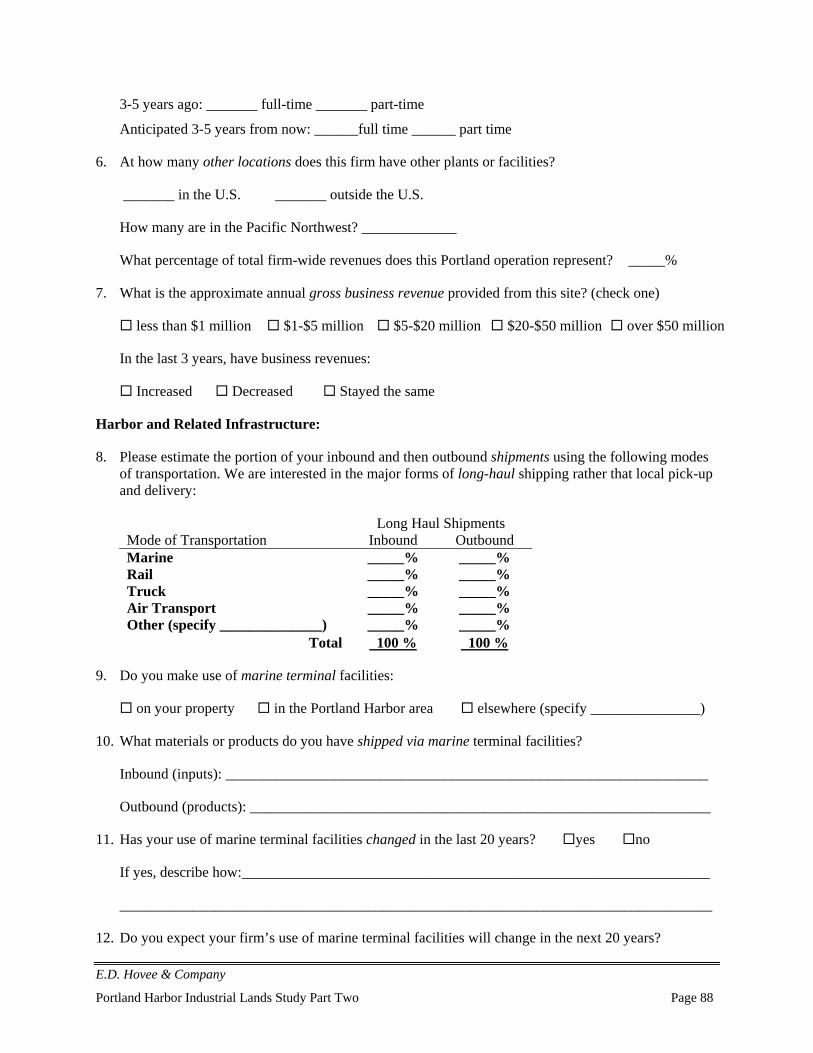
E.D. Hovee & Company
Portland Harbor Industrial Lands Study Part Two Page 88
3-5 years ago: _______ full-time _______ part-time
Anticipated 3-5 years from now: ______full time ______ part time
6. At how many other locations does this firm have other plants or facilities?
_______ in the U.S. _______ outside the U.S.
How many are in the Pacific Northwest? _____________
What percentage of total firm-wide revenues does this Portland operation represent? _____%
7. What is the approximate annual gross business revenue provided from this site? (check one)
less than $1 million $1-$5 million $5-$20 million $20-$50 million over $50 million
In the last 3 years, have business revenues:
Increased Decreased Stayed the same
Harbor and Related Infrastructure:
8. Please estimate the portion of your inbound and then outbound shipments using the following modesof transportation. We are interested in the major forms of long-haul shipping rather that local pick-upand delivery:
Long Haul ShipmentsMode of Transportation Inbound OutboundMarine _____% _____%Rail _____% _____%Truck _____% _____%Air Transport _____% _____%Other (specify ______________) _____% _____%
Total 100 % 100 %
9. Do you make use of marine terminal facilities:
on your property in the Portland Harbor area elsewhere (specify _______________)
10. What materials or products do you have shipped via marine terminal facilities?
Inbound (inputs): __________________________________________________________________
Outbound (products): _______________________________________________________________
11. Has your use of marine terminal facilities changed in the last 20 years? yes no
If yes, describe how:________________________________________________________________
_________________________________________________________________________________
12. Do you expect your firm’s use of marine terminal facilities will change in the next 20 years?
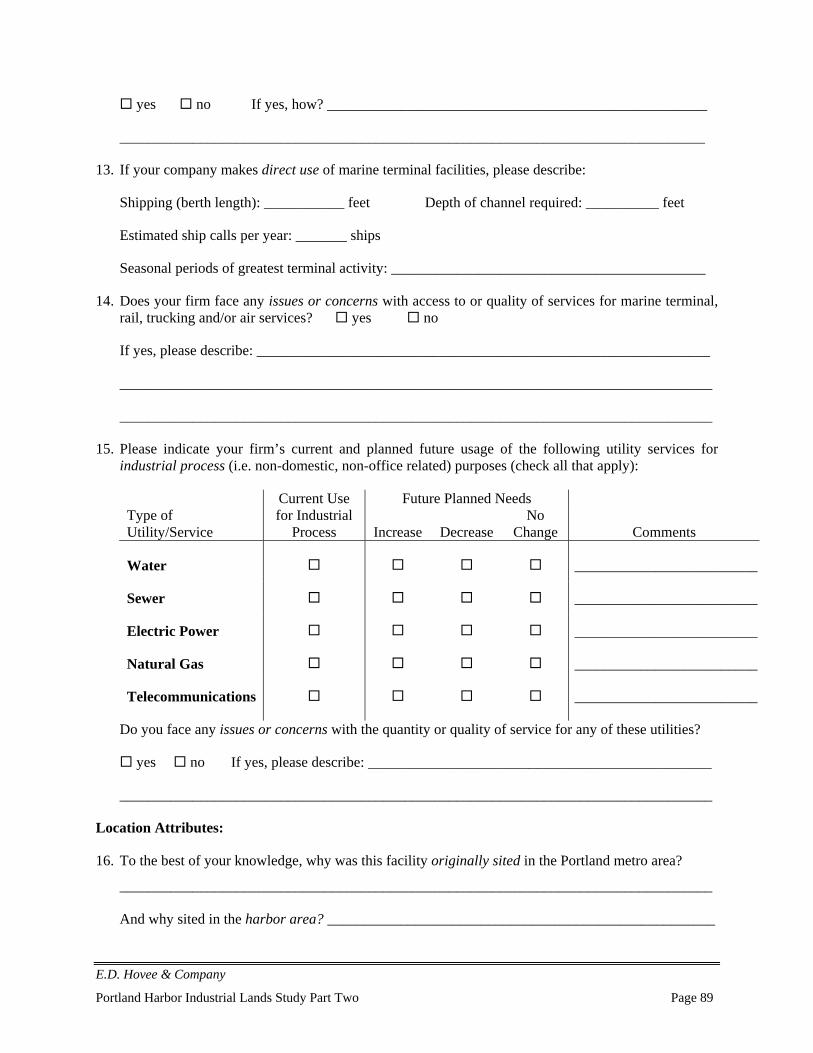
E.D. Hovee & Company
Portland Harbor Industrial Lands Study Part Two Page 89
yes no If yes, how? ____________________________________________________
________________________________________________________________________________
13. If your company makes direct use of marine terminal facilities, please describe:
Shipping (berth length): ___________ feet Depth of channel required: __________ feet
Estimated ship calls per year: _______ ships
Seasonal periods of greatest terminal activity: ___________________________________________
14. Does your firm face any issues or concerns with access to or quality of services for marine terminal,rail, trucking and/or air services? yes no
If yes, please describe: ______________________________________________________________
_________________________________________________________________________________
_________________________________________________________________________________
15. Please indicate your firm’s current and planned future usage of the following utility services forindustrial process (i.e. non-domestic, non-office related) purposes (check all that apply):
Current Use Future Planned NeedsType ofUtility/Service
for IndustrialProcess Increase Decrease
NoChange Comments
Water _________________________
Sewer _________________________
Electric Power _________________________
Natural Gas _________________________
Telecommunications _________________________
Do you face any issues or concerns with the quantity or quality of service for any of these utilities?
yes no If yes, please describe: _______________________________________________
_________________________________________________________________________________
Location Attributes:
16. To the best of your knowledge, why was this facility originally sited in the Portland metro area?
_________________________________________________________________________________
And why sited in the harbor area? _____________________________________________________
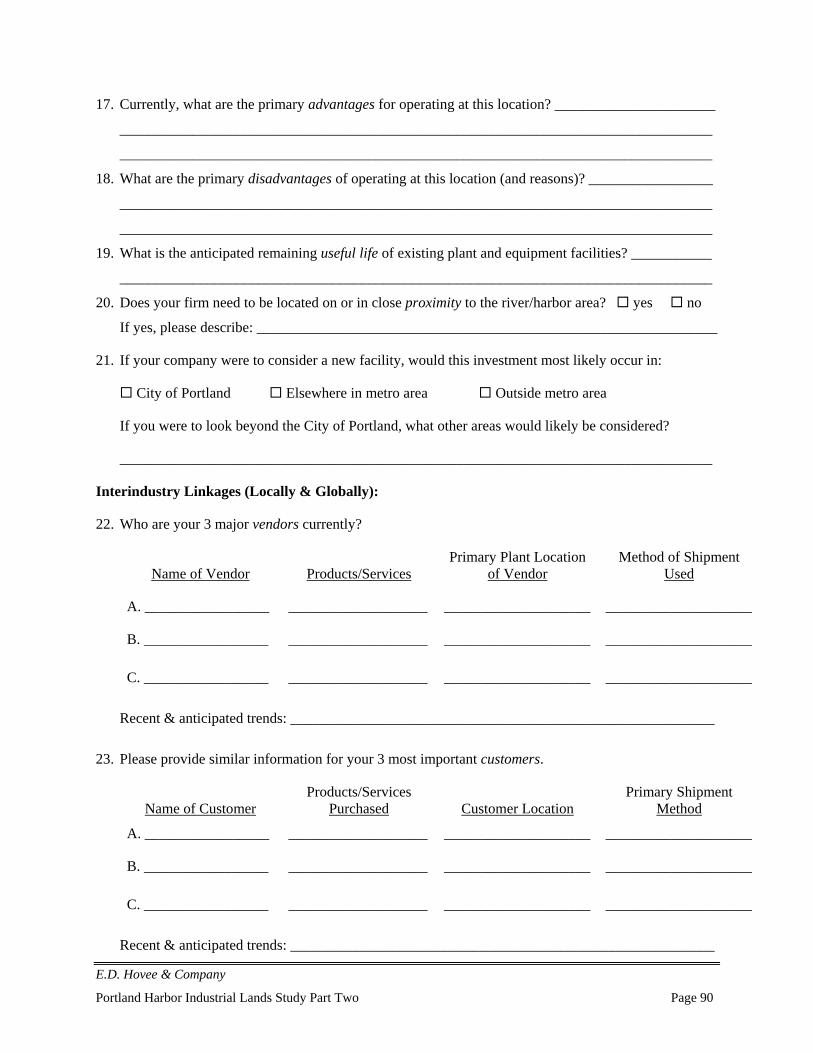
E.D. Hovee & Company
Portland Harbor Industrial Lands Study Part Two Page 90
17. Currently, what are the primary advantages for operating at this location? ______________________
_________________________________________________________________________________
_________________________________________________________________________________
18. What are the primary disadvantages of operating at this location (and reasons)? _________________
_________________________________________________________________________________
_________________________________________________________________________________
19. What is the anticipated remaining useful life of existing plant and equipment facilities? ___________
_________________________________________________________________________________
20. Does your firm need to be located on or in close proximity to the river/harbor area? yes no
If yes, please describe: _______________________________________________________________
21. If your company were to consider a new facility, would this investment most likely occur in:
City of Portland Elsewhere in metro area Outside metro area
If you were to look beyond the City of Portland, what other areas would likely be considered?
_________________________________________________________________________________
Interindustry Linkages (Locally & Globally):
22. Who are your 3 major vendors currently?
Name of Vendor Products/ServicesPrimary Plant Location
of VendorMethod of Shipment
Used
A. _________________ ___________________ ____________________ ____________________
B. _________________ ___________________ ____________________ ____________________
C. _________________ ___________________ ____________________ ____________________
Recent & anticipated trends: __________________________________________________________
23. Please provide similar information for your 3 most important customers.
Name of CustomerProducts/Services
Purchased Customer LocationPrimary Shipment
Method
A. _________________ ___________________ ____________________ ____________________
B. _________________ ___________________ ____________________ ____________________
C. _________________ ___________________ ____________________ ____________________
Recent & anticipated trends: __________________________________________________________
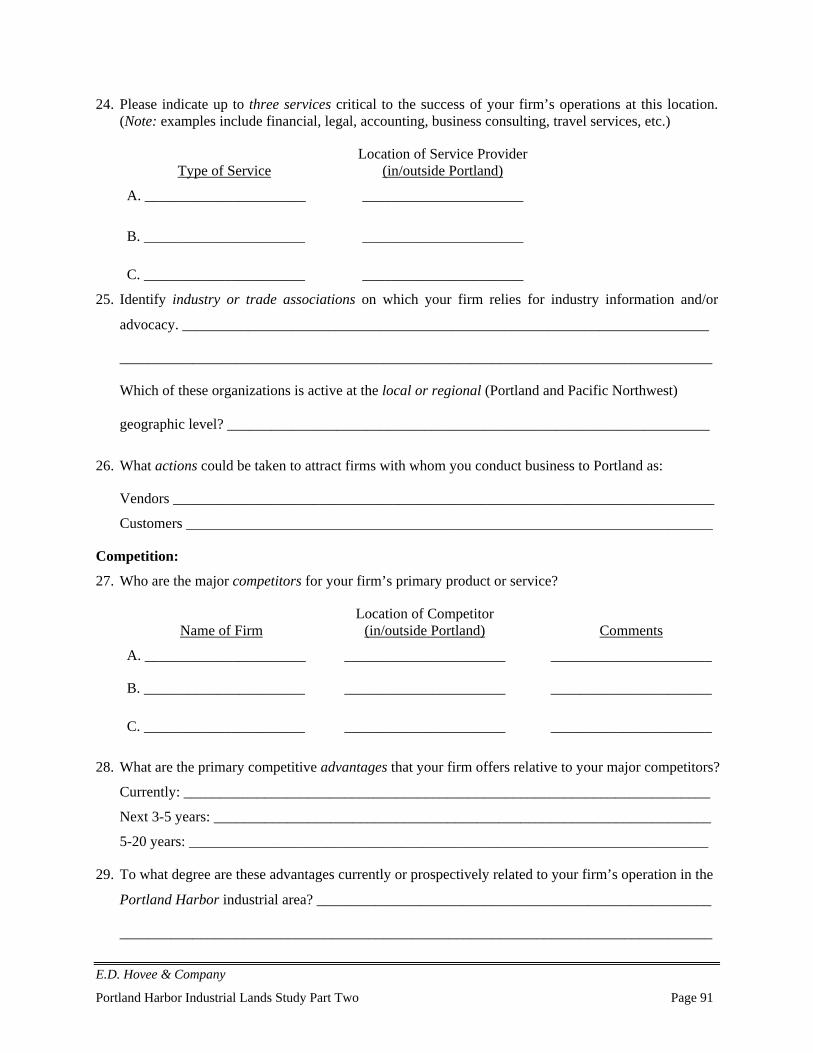
E.D. Hovee & Company
Portland Harbor Industrial Lands Study Part Two Page 91
24. Please indicate up to three services critical to the success of your firm’s operations at this location.(Note: examples include financial, legal, accounting, business consulting, travel services, etc.)
Type of ServiceLocation of Service Provider
(in/outside Portland)
A. ______________________ ______________________
B. ______________________ ______________________
C. ______________________ ______________________
25. Identify industry or trade associations on which your firm relies for industry information and/or
advocacy. ________________________________________________________________________
_________________________________________________________________________________
Which of these organizations is active at the local or regional (Portland and Pacific Northwest)
geographic level? __________________________________________________________________
26. What actions could be taken to attract firms with whom you conduct business to Portland as:
Vendors __________________________________________________________________________
Customers ________________________________________________________________________
Competition:
27. Who are the major competitors for your firm’s primary product or service?
Name of FirmLocation of Competitor
(in/outside Portland) Comments
A. ______________________ ______________________ ______________________
B. ______________________ ______________________ ______________________
C. ______________________ ______________________ ______________________
28. What are the primary competitive advantages that your firm offers relative to your major competitors?
Currently: ________________________________________________________________________
Next 3-5 years: ____________________________________________________________________
5-20 years: _______________________________________________________________________
29. To what degree are these advantages currently or prospectively related to your firm’s operation in the
Portland Harbor industrial area? ______________________________________________________
_________________________________________________________________________________
E.D. Hovee & Company
Portland Harbor Industrial Lands Study Part Two Page 92
30. What are the principal disadvantages that your firm faces relative to its major competition?
Currently: ________________________________________________________________________
Next 3-5 years: ____________________________________________________________________
5-20 years: _______________________________________________________________________
31. To what degree are these disadvantages related to your firm’s current operations or location within
Portland Harbor industrial area?
_________________________________________________________________________________
Industry Trends & Emerging Issues:
32. Please describe any significant trends on the horizon that might affect your industry and/or firmrelated to:
Customer and client markets __________________________________________________________
Vendor sourcing ___________________________________________________________________
Transportation & distribution _________________________________________________________
Labor (availability, skills & productivity) _______________________________________________
Capital Investment _________________________________________________________________
Technology _______________________________________________________________________
Other (please specify) _______________________________________________________________
Challenges, Opportunities and Plans:
33. What is the most important challenge presently facing your firm’s operation at this location? ______
_________________________________________________________________________________
_________________________________________________________________________________
34. What is the most important opportunity currently available for your firm at this location? _________
_________________________________________________________________________________
_________________________________________________________________________________
35. Please describe any plans that your company presently anticipates for this location (e.g. expansion,contraction, relocation, and reconfiguration) together with anticipated job, building and landrequirements.
Timeframe Type of Change# of Jobs
Added/LostBuilding Space
Square FeetLand Area
(Acres)
Next 3-5 yrs ____________________ ___________ _____________ ___________
5-20 yrs ____________________ ___________ _____________ ___________
Comments: ________________________________________________________________________
E.D. Hovee & Company
Portland Harbor Industrial Lands Study Part Two Page 93
_________________________________________________________________________________
36. Is the site at which this firm operates adequate to accommodate expanded or reconfigured operations?
Next 3-5 years: yes no uncertain
5-20 years: yes no uncertain
If no or uncertain, please describe any issues that limit suitability of your current site: ____________
_________________________________________________________________________________
37. If your firm’s operations were to relocate from this site, what would be your land and location needs?
_________________________________________________________________________________
How could these needs be accommodated by other property located:
In the Portland harbor area ___________________________________________________________
Elsewhere in the metro area __________________________________________________________
38. If this operation is being considered for downsizing, are there opportunities to sell or lease portions of
your site for other purposes? Please describe: _____________________________________________
_________________________________________________________________________________
39. What governmental actions could help facilitate your firm’s existing operations and/or future plans?
_________________________________________________________________________________
40. Please provide any additional information pertinent to your future operations including anticipatedland and building needs at this location. Specific information or examples are appreciated.
_________________________________________________________________________________
_________________________________________________________________________________
41. The City of Portland and the region currently are facing a number of harbor issues that could affectPortland harbor area industries. Based on information currently available to you, please give us yourassessment of the anticipated effects from each of the following issues on your firm’s ability tomaintain competitive operations or expand in the harbor area:
IssuePositiveEffect
NegativeEffect
NoEffect Uncertain Examples or Comments
Portland HarborSuperfund _____________________________
Columbia ChannelDeepening _____________________________
E.D. Hovee & Company
Portland Harbor Industrial Lands Study Part Two Page 94
WillametteMaintenanceDredging
_____________________________
I-5 Trade CorridorImprovements _____________________________
Endangered Speciesand Clean WaterActs
_____________________________
Recreational boatingand trail access _____________________________
Transitioning harborsites to housing, parkor commercial uses
_____________________________
Reserving harborindustrial riverfrontfor maritimeindustries
_____________________________
Other(specify____________________________)
_____________________________
Other Comments and Suggestions:
42. Are there any critical messages that you would like us to communicate back to the sponsors of thestudy (City of Portland, Portland Development Commission, Port of Portland)?
_________________________________________________________________________________
_________________________________________________________________________________
43. Do you have any further suggestions for uses of this Portland Harbor Industrial Land Study?
44. Please identify anyone else that you recommend we contact: ________________________________
45. At the completion of the interview process, we anticipate conducting two focus groups to reviewresults, as well as discuss findings and policy implications for Portland’s industrial harbor area.Would you be interested in participating in an approximately 90-minute focus group session?
yes no If yes, identify person to be contacted:
Name __________________________ Phone ___________________ E-mail ___________________
E.D. Hovee & Company
Portland Harbor Industrial Lands Study Part Two Page 95
APPENDIX B. FOCUS GROUP DISCUSSION
As part of the Portland Harbor Industrial Lands Study (PHILS), two focus group discussionswere conducted. Focus Group #1 was conducted on September 4, 2002, with representatives ofharbor area industries. Focus Group #2 was held with the River Economic Advisory Group andinterested industry representatives on September 19.
FOCUS GROUP PURPOSES
Purposes of the focus group sessions were to: (a) present and discuss results of what was learnedto date from the industry interviews and associated analysis and (b) discuss policy implicationsfor Willamette River planning initiatives.
PARTICIPANTS
Participants in the two focus group sessions are listed as noted below.
Person OrganizationFocus Group #1:
Carol Grant Northwest PipeWayne Thomas SulzerRon Corbin ToyotaSteve Barrager Grubb & EllisBob Short Lower Albina Council/Glacier NorthwestSteven Shain and Bill Gobel ZidellDebbie Deetz Oregon Steel and Columbia Corridor AssociationWayne Cozad Cascade General
Focus Group #2:Tom Wright Group Mackenzie, North Macadam Business Assn.Wayne Kingsley Portland Spirit, Central Eastside Industrial
CouncilRod McDowell OMSI, Central Eastside Industrial CouncilCindy Cato Associated General ContractorsHoward Werth GundersonGreg Peden Portland Business AllianceDon Grigg Parsons BrinckerhoffBrian Campbell PortElissa Gertler, Fred Wearn PDCDeborah Stein, SallieEdmunds, Barb Grover,Barbara Hart, SteveKountz
Bureau of Planning
Both focus groups were facilitated by John White and Eric Hovee. At the second session,introductory comments and wrap-up items were covered by Steve Kountz, Bureau ofPlanning.
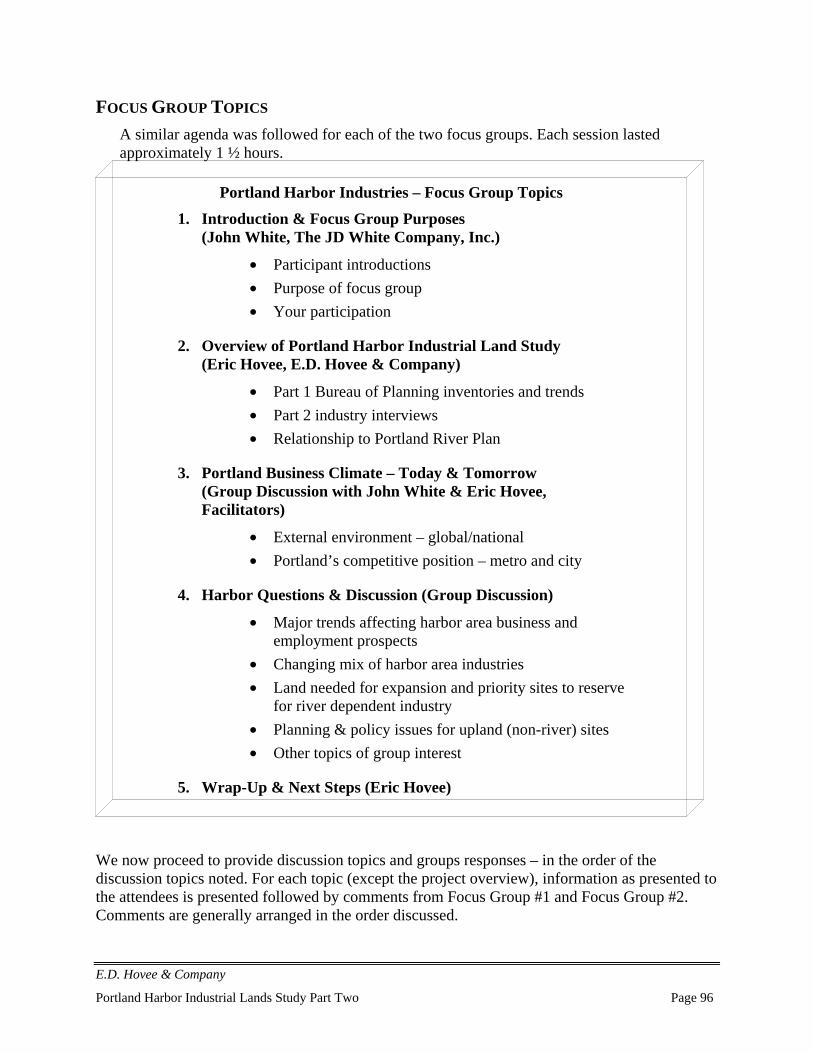
E.D. Hovee & Company
Portland Harbor Industrial Lands Study Part Two Page 96
FOCUS GROUP TOPICS
A similar agenda was followed for each of the two focus groups. Each session lastedapproximately 1 ½ hours.
We now proceed to provide discussion topics and groups responses – in the order of thediscussion topics noted. For each topic (except the project overview), information as presented tothe attendees is presented followed by comments from Focus Group #1 and Focus Group #2.Comments are generally arranged in the order discussed.
Portland Harbor Industries – Focus Group Topics
1. Introduction & Focus Group Purposes(John White, The JD White Company, Inc.)
• Participant introductions• Purpose of focus group• Your participation
2. Overview of Portland Harbor Industrial Land Study(Eric Hovee, E.D. Hovee & Company)
• Part 1 Bureau of Planning inventories and trends• Part 2 industry interviews• Relationship to Portland River Plan
3. Portland Business Climate – Today & Tomorrow(Group Discussion with John White & Eric Hovee,Facilitators)
• External environment – global/national• Portland’s competitive position – metro and city
4. Harbor Questions & Discussion (Group Discussion)
• Major trends affecting harbor area business andemployment prospects
• Changing mix of harbor area industries• Land needed for expansion and priority sites to reserve
for river dependent industry• Planning & policy issues for upland (non-river) sites• Other topics of group interest
5. Wrap-Up & Next Steps (Eric Hovee)
E.D. Hovee & Company
Portland Harbor Industrial Lands Study Part Two Page 97
OVERVIEW OF PORTLAND HARBOR INDUSTRIAL LANDS STUDY
The following background information was briefly presented in outline format:
Purpose – Assess industry dynamics and future land needs for thePortland Harbor area, focusing on:
River-dependent Freight-related Other concentrated industries
Participation – City of Portland Bureau of PlanningPortland Development CommissionPort of Portland
Part 1 – Bureau of Planning prepared:
Inventories of industries & land uses Job, land use & freight distribution trends Location needs & regional role of harbor industries
Part Two – E.D. Hovee & Company with Parsons Brinckerhoff & The JDWhite Company, Inc.:
Industry interviews – profile, trends & uses Harbor industry dynamics, sites & land use Policy questions – river-dependent & upland
Next Steps – Industrial Lands Study a key background document for (a)Portland River Plan; (b) Port Marine Terminals Master Plan;(c) PDC’s Economic Development Strategy.
PORTLAND BUSINESS CLIMATE – TODAY & TOMORROW
The purpose of the first topic was to encourage participants to begin talking about big pictureissues and opportunities affecting Portland’s overall business climate. Comments were solicitedregarding the external environment (global/national) and Portland’s competitive position (withinthe metro area).
Focus Group #1 Discussion:
• Competitiveness is a critical issue for Portland businesses. Industrial land can beanywhere – in Portland or suburban locales. There is some concern that more businessesmay move to Vancouver. There is concern with the environmental overlay zoneconstraints in Portland especially the Columbia Corridor.
E.D. Hovee & Company
Portland Harbor Industrial Lands Study Part Two Page 98
• There is a perception that the City and Port have adopted the attitude that if companiesmove anywhere in the region, it’s good for the region – even if they don’t stay in the Cityof Portland.
• The River Plan can be a step in the right direction.• One focus group participant has issues with DEQ. A ship ties up sometimes using a
waterfront moorage on a lease basis but not directly serving this firm’s needs as awaterfront industry.
• Environmental regulatory encroachment is voiced as a growing concern.• There seems to be a “so what” public agency mind set – exemplified by the City’s
handling of the Columbia Sportswear corporate headquarters office relocation.• A key question: does Portland want to continue to be aggressively in the business of
being a major West Coast port?• A related question is posed as to whether Portland wants environmental protection zones
or industry. The answer does not need to be either or but could be both and……However, the emphasis is currently perceived as unbalanced toward environmentalcontrol.
• Vacancies for industrial use are up in Portland but there is still strong demand foravailable land because of the tight urban growth boundary. However, this also means thatthe cost of the land base is increasingly high compared to other alternative locations. Forexample, does it make more sense for medium/heavy industry to relocate to Centralia,Washington?
• The now-vacant Alcatel site has an approximately $8.5 million building. It was statedthat the Port will not provide a quoted ground lease rate until there is a serious inquiry.The ability for Alcatel to sign its lease depends upon Port approval of the specific user.
• Portland’s harbor area is “out of the mainstream” and receives little visibility or publicinterest. There is no branding of the harbor image or product. Worse, there is very littleunderstanding of the contributions that the harbor industries make to the general economyand to business. For example, one does not see signage on packages if this is a product“delivered by Zidell barge.” Another example: there is a disconnect from the need for thepetroleum tank farm and the gas with which somebody fills their SUV.
• For an industry such as ship repair, on-going industry viability is clearly linked to thelabor market. It is not possible to compete with Singapore which has wage rates of $8 perday.
• For another metals manufacturer, availability of skilled labor is crucial. “It's real work,”which deters many young people from entering a more physically demanding occupation.
• Another long-time company currently needs 75 workers but can only get about 52. Itused to be that the firm would attract and retain second and third generation workers butno longer because this is not viewed as a valued occupation.
• Gravel and cement have been cheap but won’t be when the readily accessible Santooshdeposits run out. For example, in Puget Sound, sand & gravel is now being barged infrom Canada.
E.D. Hovee & Company
Portland Harbor Industrial Lands Study Part Two Page 99
• Another industry representative noted that Portland is not perceived as a highest costlocation but is in fact a high cost location. The term perceived is too generous.
Focus Group #2 Discussion:
• John White observed that considerable difficulty was experienced in obtainingcommitments from businesses to be interviewed for this study. Part of the reason wasuncertainty over how the results would be used.
• A focus group participant noted that this uncertainty as to how the results were to be usedgave them pause to participate. However, this firm decided to go ahead after attending theAugust meeting. It was stated there is a desire that they did “not want the information tobe used against us.”
• A part of the resistance to participation stems from City and Metro planning approachesthat appear to be leading to greater restrictions on industries within the harbor industrialarea. The Columbia Corridor sited was an example of environmental issues such asincreased animal habitat. The “list of exactions is long.” Also there are certaindisagreements about whether an industry should be considered as “river-dependent.”
• Noted by one participant is a sense of “hostility” between planners and business people.“Do you really need that?”
• Portland has a reputation of having no land to build on. On the west side, Intel can notobtain land needed for additional employee housing. Within the harbor area, Freightlinerhas opened a new production facility in North Carolina because of difficulties in dealingwith the City of Portland.
• Certainly Title 33 exacerbates the situation including the provision that you can’t developjust one portion of a parcel.
• Elissa Gertler with PDC commented that the citywide economic development strategywill address constrained sites and improvements in the harbor area. Deborah Stein withthe Bureau of Planning noted that the Bureau is currently involved in a regulatoryimprovement project.
• A company representative with Gunderson stated that the firm has expanded in Portlandbut not elsewhere in Oregon. They have experienced considerably more of a partnershiprelationship with facilities in Texas and Nova Scotia, but this has yet to occur in Oregon.However, the Oregon Economic Development Department did help Gunderson with itsrail car maintenance facility in Springfield in the early 1990s. In Texas, assistance hasbeen provided to lead the company through the state agency requirements and alsoidentify grant funding opportunities.
• There was a comment that “there is nothing like a good recession to get people’sattention.” Another participant questioned whether this is just “palliative” and short-termuntil the current recession ends.
HARBOR QUESTIONS & DISCUSSION
The remainder of each focus group session was organized to provide background informationand obtain participant input on four harbor area questions. Each question is presented, followed
E.D. Hovee & Company
Portland Harbor Industrial Lands Study Part Two Page 100
by preliminary findings from interviews completed to date (about 50) and then participantcomments with each focus group.
Question: What Are the Major Trends & Issues Affecting Prospects forPortland’s Harbor Area Industries?
Preliminary Findings:
• Stable through recession but limited job growth anticipated with economic recovery.• Even with expansion, existing medium-larger firms anticipate minimal need for added
industrial land.• Remaining cost competitive emerges as the #1 issue – extending beyond the current
economic downturn; Portland increasingly is perceived as a high cost place to dobusiness.
• Long time manufacturers will reinvent their business model and operations over the next10-20 years.
• Local issues affecting business investment:
Superfund uncertainty & competitive multi-modal transport – for riverfrontowners
Regional congestion (freight/employee) non-industrial encroachment, permitting,public policy & community support – for riverfront and upland firms.
Focus Group #1 Discussion:
• For one focus group participant, even Denver is perceived as a less expensive location.Currently this firm is in the process of changing much of its order process to Kansaswhere from which the freight is cheaper.
• With environmental regulations there are “so many entities that want a piece of the pie.”It is noted that high tech companies have more “bad stuff” from an environmentalperspective on their sites than many more traditional heavy industries these days.
• The closure of Consolidated Freightways may hurt transportation competitiveness fromPortland. The “fallout is just starting.”
• A company owned by one of the participants makes pipe fittings, a commodity product.This company is faced with global pressures and dumping issues and is difficult to becompetitive from Portland. This firm buys plate from a local manufacturer but structuralsteel is imported.
Focus Group #2 Discussion:
• One participant noted that they have a plant in the harbor area and are questioningwhether to keep that location.
E.D. Hovee & Company
Portland Harbor Industrial Lands Study Part Two Page 101
• Environmental labor and energy issues are noted as concerns for their operation. Medicalcoverage costs in Portland have now surpassed comparable cost in other areas of thecountry.
• Regulatory and permitting fees are not too high in Portland but the Port process “is toolong.” In North Macadam, there is the question of what is the setback? Uncertainties withquestions such as these create project delays. The sentiment expressed is that agenciessuch as the City Planning Bureau don’t operate with an understanding of the privatesector concept that “time is money.”
• Gunderson is fearful the superfund will affect its marine operations. Already there is acost of hundreds of thousands of dollars per year for a study without any particularimplementation. Part of Gunderson’s problem is created by the nearby BES outfall.Overall, the superfund issue represents a “huge black hole” although the firm has tried tobe proactive in dealing with this and other environmental issues. EPA has helped tofacilitate by providing answers within a two-week period, but the City has taken longer.”Fortunately, however, these issues have not yet affected ongoing operations.
• Don Grigg with the consultant team (Parson Brinckerhoff) described somewhat differentissues for marine-oriented distribution firms. A main priority is rail. More freight isshifting to unit trains that require separated facilities. Businesses need the right locationthat can accept these more expanded rail operations. Cost is not as much a driver,although, for auto importers improved service and related BES drainage cost all havebecome an issue. Longshore labor and work rules historically have been represented acost disadvantage for Portland and this continues.
Question: Will the Mix of Harbor Industries Change?
Preliminary Findings for Existing Harbor Industries:
• River-Dependent – need multi-modal access including 20+ foot depth barges, 30-40+ foot deep draft. Suppliers and transporters to entire metro area and state. Littlenear-term expansion except auto imports.
• Wholesale Distribution – separated between (a) serving Central City & metro areafrom central location and (b) markets beyond metro area– with demand moreuncertain depending on comparative cost of business and inter-modal transportaccessibility
• Manufacturing: Chemical & electronics – suppliers to regional industrial base Printing/publishing – Central City proximity & interaction Metals & transportation – inter-industry linkages led by Freightliner, Esco, and
Gunderson
Mid/large manufacturer land needs modest; growth needs linked to desire/capacity toaccommodate smaller firms.
E.D. Hovee & Company
Portland Harbor Industrial Lands Study Part Two Page 102
Other Sectors Potentially Suited to Harbor Area:
Regional distribution High tech/bio tech Transportation/metals Creative Services/information technology Wood/plastics/fiber materials Corporate headquarters & business parks
Focus Group #1 Discussion:
• A City Commissioner reportedly is unfavorable toward our firm since receiving a taxbreak.
• Six to seven metal fabs in the Portland area are not making a profit currently. China is“kicking our butt daily.” This industry is likely to increasingly go off shore for leadorders.
• Also noted is that it is increasingly difficult to get metals-related labor in Portland.• Portland has no Fortune 500 companies. Nike should not be counted because it is not
headquartered in Portland but in Beaverton.• Corporate headquarters and business parks make sense in North Macadam but not in
Albina. It is noted that the Triangle Park vacant property below the University ofPortland was the location for the filming of “The Hunted.”
• There currently is a more optimistic picture for autos. Containers are more profitable forports and require less footprint area of land. The Columbia River looks increasinglycompetitive for the auto business; however, Portland does not have a lot ofupland/dockside space. The 30-foot draft is not an issue for this type of cargo. Portland iscompetitive for auto imports except to serve the southern U.S. for which entry in southernCalifornia is more competitive. Auto imports can expect to be stable over the next 15years but with potential market shift from other west coast cities to Portland.
• It will prove challenging for Portland to overcome its reputation as a city that is “difficultto deal with.” On the plus side, Portland is probably the most competitive west coast city“cost wise” for auto import activity.
• Metal companies are “working so hard to make so little.” Very little, if any, substantialexpansion can be expected.
• There currently is a potential client for a 400,000 sq. ft. distribution center. Portland canbe competitive if the client can come to grips with the Port of Portland. The Port doesnot have the vested interest that a private owner would have to make the deal happen.
• Swan Island has seen sustained growth in distribution from companies like FederalExpress; however, there is only one way in and out to Mocks Landing over the UnionPacific rail line.
• An estimated $2.5 million of infrastructure is required to upgrade the Mocks Landingover cross into seismic standards. This includes an extra $1 million dollars needed toassure that there will be no disruption to the railroad. This may be funded through an LIDas no City participation is expected for this type of project.
• Outside the Port areas, industries are noted to be not as well connected to the region’sfreeways.
E.D. Hovee & Company
Portland Harbor Industrial Lands Study Part Two Page 103
Focus Group #2 Discussion:
• Portland wants “sustainable” industry. But what does this mean? Portland metals firms doconsiderable recycling. The system could almost be considered as a “closed loop” but thiscontribution gets little recognition elsewhere in the community.
• Gunderson is spending capital to maintain its operations and cut costs. The competitionnow is really with Canada and Mexico rather than only other plants sites due to NAFTA(the North America Free Trading Agreement).
• Oregon Steel has one of the most automated facilities in the world based upon purchase,reuse and recycled steel. However, the plant is now reportedly doing less melting andmore rolling.
• It was noted that Freightliner has an office 75 feet from the river’s edge but in NorthMacadam the greenway setback proposal is now for 150 feet. Uncertainties with zoningand planning affect the ability to proceed with development. This issue “shouldn’t bedebated forever.”
• While the City is actively recruiting Vestas, this is still an industry that involves a typicalindustrial production process to manufacture a “long pipe and blade.”
• The national trucking company, JB Hunt, is making greater use of train car facilities.• Don Grigg observed that there is potential for major rail yards to move eventually to the
fringe of the Metro area as has occurred elsewhere in the country. Burlington Northern isalso considering a mega rail yard located between Portland and Seattle. If there were tobe a new regional facility outside the City, some firms that rely heavily on rail freightmight relocate as well. Example would be UPS.
• Three grain elevators on the Upper Willamette are now under one common ownershipand could potentially look to relocate to a consolidated facility. This could be in Portland,for example, the vicinity of Terminal 4, or it could be elsewhere on Lower ColumbiaRiver at a site that offers unit train and barge as well as deep draft access.
Question: What Are the Needs & Issues Facing River-Dependent Industries &Sites?
Preliminary Findings:
• From existing operations, greatest demand (100+ acres) by marine terminals.• Approximately 9% of 3,130 acres of riverfront property classified as vacant (and within
top two tiers of buildable land inventory) by Metro.• Only 153 acres of tier A/B vacant riverfront land north of the St. Johns Bridge.• Site constraints evaluation focuses on threshold criteria of appropriate zoning and
minimum depth barge access. Other criteria considered include deep draft shipping,rail/street access, lot depth, environmental contamination, compatible neighbors,wetlands, trail easements, flood plain, and scenic overlay.
• Capital investment may be deferred pending Superfund resolution.• Interest in reserving riverfront sites for industrial use (whether marine dependent or not)
E.D. Hovee & Company
Portland Harbor Industrial Lands Study Part Two Page 104
• Reserving riverfront land for future generations – even if demand is not readilyforeseeable today.
Focus Group #1 Discussion:
• One Rivergate firm has recently purchased two new plants – both outside the State ofOregon in part because it is easier to do business in those locations. This is an indicationof their future direction.
• For an auto importer, superfund uncertainties are posing a major issue in reaching a leasewith the Port that will be acceptable to the firm. This example illustrates the potentiallywidening impact on the ability to effectively market Portland sites. This firm might wellreconsider its choice to be in Portland if it were made again today.
• Oregon Steel is an example of a firm that is not water-dependent for marine terminal usebut is water-dependent from the standpoint that the company uses Willamette River waterin their industrial process and also has a discharge permit. In other words, being river-dependent does not mean just ship access.
• To be competitive it will be more important to be able use more river land in a timelyfashion.
• Otherwise, Portland can easily miss the “business window” of a particular company forinvestment.
• The Freightliner wind-tunnel issue was “too drawn out.” The approval process provedextremely expensive. It makes no sense to require planting the trees where ships arebeing tied up which the City has requested.
• How will Metro Goal 5 setbacks affect industry location and viability along the river?There is concern that Metro may not be coordinating well with the City. It is going to beimpossible to preserve river-dependent land if it’s impossible to actually locate, build orexpand industry along the river.
• Portland needs the continued job base of a major company like Freightliner. A morebusiness-friendly approach might have helped to keep the manufacturing in Portlandrather than having the plant shut and the business shifted to North Carolina. This isaffecting regional metal fabrication activity. For example, one firm in Oregon City was60 percent dependent upon Freightliner business.
• There is concern that the City has been approaching Freightliner on a piece-meal basiswith no sense of priority to the significance of the employment base that this companyrepresents and its extensive local subcontractor supplier relationships.
• The upcoming St. Johns Bridge closure is a concern although it is expected to be of shortduration. The notion of a bicycle path on this bridge does not make sense since the bridgeis not wide enough to accommodate bicycles plus vehicular traffic. This was cited asanother example of the City making decisions that result in it being harder to do businesshere.
• There was discussion of planning to redo Russell Street in the Lower Albina industrialarea. A comment was made that the people want the road to be “cute and boutiquey.”This does not make sense in an industrial area. Portland needs to look at the big picture asto what priority improvement make the most sense for the funding available.
E.D. Hovee & Company
Portland Harbor Industrial Lands Study Part Two Page 105
Focus Group #2 Discussion:
• Portland has vacant sites on the river, not elsewhere. Eric Hovee noted that there is notmuch other heavy industrially-zoned land elsewhere in the Portland Metro area. Asignificant portion of the heavy industrial land base is situated directly within Portland’sharbor industrial area.
• It was suggested that the solution is to provide additional vacant buildable industrialinventory elsewhere, including the possibility of expansion to the suburbs.
• Fewer ships call on the Port of Portland. An example cited is that Gunderson has 1,100foot long dock that has been used in past for rental berthage, for example, by shipswaiting in the Harbor. There is less need for short-term rental moorage now, althoughGunderson uses this also for its own barge building purposes.
• What’s the plan to revitalize marine terminal use in the Portland waterfront? It isimportant to try to stop and prevent a “dying waterfront.”
• There do not appear to be many surprises with the draft map showing river industrial siteconstraints. However, it was noted that some Port sites indicated as no constraints do infact have some land constraints. While the Port’s master planning focuses on direct cargofacilities, a key question is how much land is needed for other river-dependent non-cargo-related activities?
• Brian Campbell with the Port of Portland indicated that the industrial harbor is expectedto remain a working harbor. The Port will support land expansion also in the metro area.The region needs a “more sophisticated” way of looking at riverfront land including themarine needs of occasional users.
• Don Grigg suggested a similar need for more sophisticated criteria for riverfront sites.One option would be to do more clustering of sites.
• A major question is what do we want our industrial base to be? The strategy that resultsneeds to reflect Portland’s answer to that question. Prioritize industries to be targeted plussupport what is here now.
• It was noted that new large marine water-dependent industries locating in the region(such as U.S. Gypsum) in Rainier are finding sites elsewhere on the Lower Columbia outof the metro area. This is for reasons including lower cost of land and labor and moreconducive permitting processes.
• Even if a regional rail yard is built, Albina yard would likely be retained as part of rail totruck distribution center.
• Railroads nationally are shedding equipment (like phone companies). They aremaintaining a core fleet with other operations increasingly contracted to third parties.Real estate property managers for the rail companies are focused on industries thatgenerate rail traffic. Repair functions such as previously existing at Albina Yards havebeen relocated to more rural communities such as Hermiston.
E.D. Hovee & Company
Portland Harbor Industrial Lands Study Part Two Page 106
Question: What Are the Needs & Issues Facing Upland Industries & Sites?
Preliminary Findings:
• General consensus to continue exclusion of residential and large scale commercial fromthe industrial sanctuary
• Less agreement on how broadly “industrial” should be construed with flexibility for Corporate office Support retail/service Creative services/information technology Business park/flex space
• Priority emphasis on roadway improvements for freight and employee commutes• Shift from manufacturing to transportation dependent firms• Strong interest in improved transit – including shift workers• Desired public support for improved, faster, lower-cost permitting and addressing labor
issues including workers comp/health care costs• Pro-active public support desired for (a) more interaction with policy makers; and (b)
policy/investment decisions making a difference
Focus Group #1 Discussion:
• Portland’s future is not manufacturing but rather distribution to the Pacific Rim.However, there seems to be no city or state desire to create the road infrastructure neededto accommodate this shift in industrial activity.
• City government needs to decide what it wants the Portland Harbor area to be in thefuture. There is virtually no direction right now. It was suggested that the City wants jobswithout industries.
• Is it the City’s goal to determine future business and marketplace activity or to supportbusinesses that are here? The City could have a priority both to serve existing businessesand attract a more select set of target industries.
• Bio-tech may look good 50 years from now but is not likely to deliver much in the way ofnet new employment short-term.
• A City priority should be to work with who is here or to pursue knowledge-basedindustries. But, what is the education system capable of turning out?
• There is clear interest in more interaction with elected officials. Currently, the sense is theCity “over regulates and under interacts.” The opposite approach should be taken – moreof a broader policy focus but accompanied by more interaction with policy makerslooking at the specific issues and opportunities associated with individual property andbusiness opportunities.
E.D. Hovee & Company
Portland Harbor Industrial Lands Study Part Two Page 107
Focus Group #2 Discussion:
• The first participant comment – many of the problems would fall away if we can“generate love” especially between the City and private business community.
• Portland should have been addressing the problem of its harbor-related industries backwhen times were good in 1997-1998. There were warning signs on the horizon even then.An example was the issues that the aluminum industries faced that affected Portland’smetals complex.
• A focus group participant noted in their 75-80 years in business in Portland, only once inthe last ten years did a public sector representative come calling on us and that was in thelast few weeks.
• Portland should “have a calling program” with regular visits to businesses and industriesto see what their needs and issues are.
• It was suggested that the “code maintenance” program be shifted to “code change” forconsideration.
• A final suggestion – make more effort for us to get policy makers inside our Portlandharbor industrial plants.

E.D. Hovee & Company
Portland Harbor Industrial Lands Study Part Two Page 108
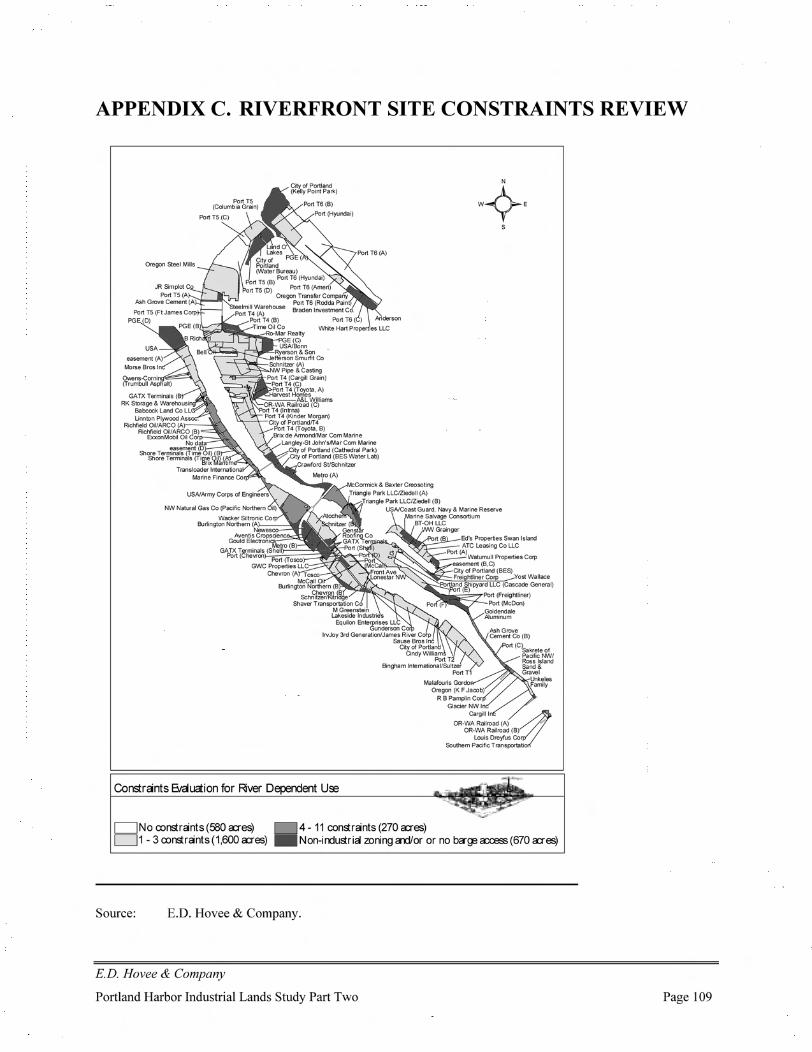
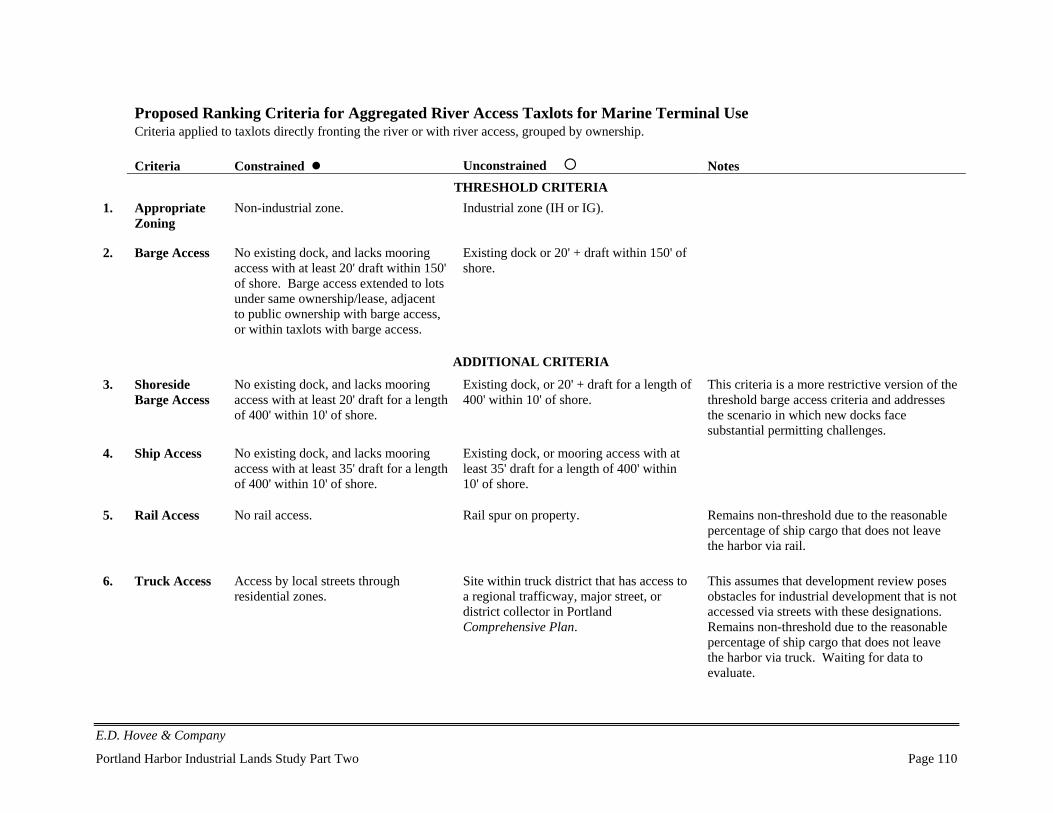
E.D. Hovee & Company
Portland Harbor Industrial Lands Study Part Two Page 110
Proposed Ranking Criteria for Aggregated River Access Taxlots for Marine Terminal UseCriteria applied to taxlots directly fronting the river or with river access, grouped by ownership.
Criteria Constrained Unconstrained NotesTHRESHOLD CRITERIA
1. AppropriateZoning
Non-industrial zone. Industrial zone (IH or IG).
2. Barge Access No existing dock, and lacks mooringaccess with at least 20' draft within 150'of shore. Barge access extended to lotsunder same ownership/lease, adjacentto public ownership with barge access,or within taxlots with barge access.
Existing dock or 20' + draft within 150' ofshore.
ADDITIONAL CRITERIA
3. ShoresideBarge Access
No existing dock, and lacks mooringaccess with at least 20' draft for a lengthof 400' within 10' of shore.
Existing dock, or 20' + draft for a length of400' within 10' of shore.
This criteria is a more restrictive version of thethreshold barge access criteria and addressesthe scenario in which new docks facesubstantial permitting challenges.
4. Ship Access No existing dock, and lacks mooringaccess with at least 35' draft for a lengthof 400' within 10' of shore.
Existing dock, or mooring access with atleast 35' draft for a length of 400' within10' of shore.
5. Rail Access No rail access. Rail spur on property. Remains non-threshold due to the reasonablepercentage of ship cargo that does not leavethe harbor via rail.
6. Truck Access Access by local streets throughresidential zones.
Site within truck district that has access toa regional trafficway, major street, ordistrict collector in PortlandComprehensive Plan.
This assumes that development review posesobstacles for industrial development that is notaccessed via streets with these designations.Remains non-threshold due to the reasonablepercentage of ship cargo that does not leavethe harbor via truck. Waiting for data toevaluate.
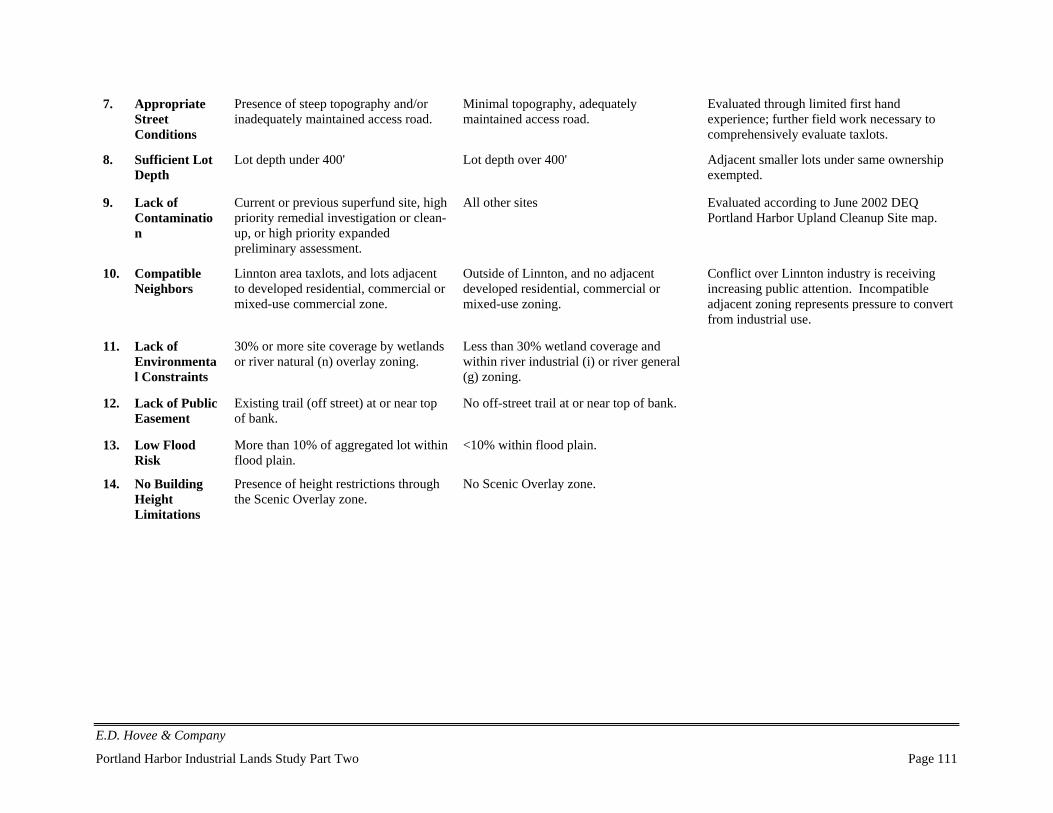
E.D. Hovee & Company
Portland Harbor Industrial Lands Study Part Two Page 111
7. AppropriateStreetConditions
Presence of steep topography and/orinadequately maintained access road.
Minimal topography, adequatelymaintained access road.
Evaluated through limited first handexperience; further field work necessary tocomprehensively evaluate taxlots.
8. Sufficient LotDepth
Lot depth under 400' Lot depth over 400' Adjacent smaller lots under same ownershipexempted.
9. Lack ofContamination
Current or previous superfund site, highpriority remedial investigation or clean-up, or high priority expandedpreliminary assessment.
All other sites Evaluated according to June 2002 DEQPortland Harbor Upland Cleanup Site map.
10. CompatibleNeighbors
Linnton area taxlots, and lots adjacentto developed residential, commercial ormixed-use commercial zone.
Outside of Linnton, and no adjacentdeveloped residential, commercial ormixed-use zoning.
Conflict over Linnton industry is receivingincreasing public attention. Incompatibleadjacent zoning represents pressure to convertfrom industrial use.
11. Lack ofEnvironmental Constraints
30% or more site coverage by wetlandsor river natural (n) overlay zoning.
Less than 30% wetland coverage andwithin river industrial (i) or river general(g) zoning.
12. Lack of PublicEasement
Existing trail (off street) at or near topof bank.
No off-street trail at or near top of bank.
13. Low FloodRisk
More than 10% of aggregated lot withinflood plain.
<10% within flood plain.
14. No BuildingHeightLimitations
Presence of height restrictions throughthe Scenic Overlay zone.
No Scenic Overlay zone.
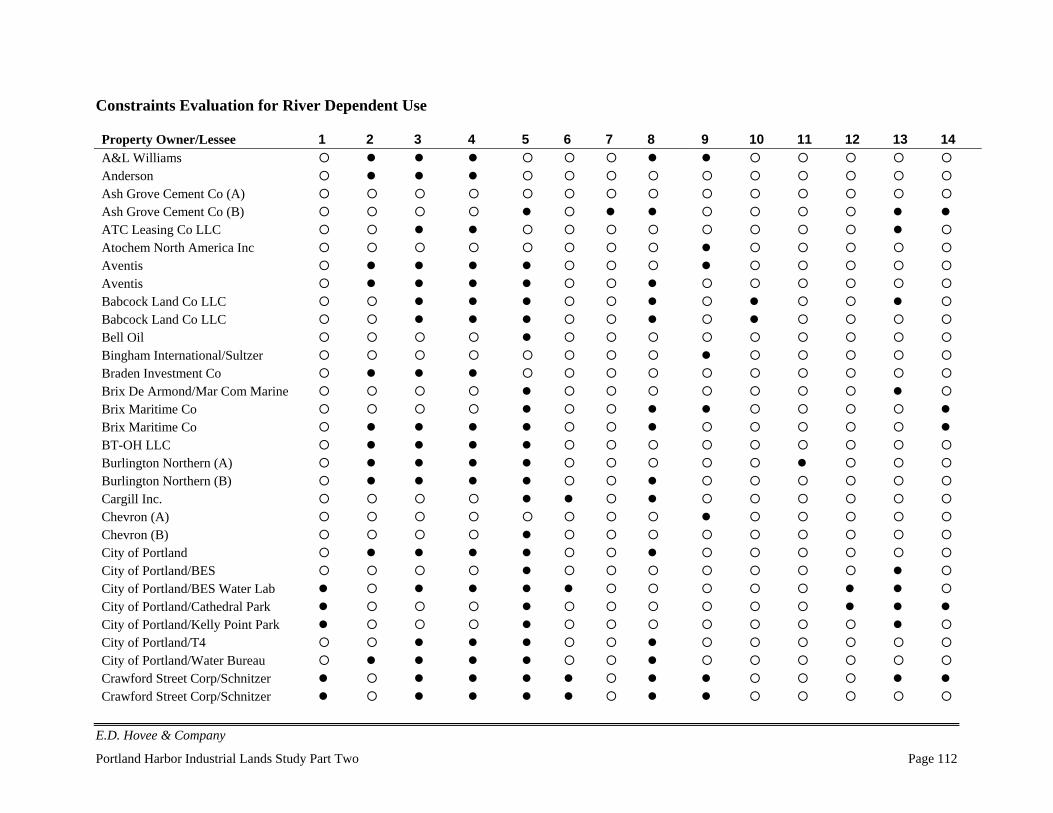
E.D. Hovee & Company
Portland Harbor Industrial Lands Study Part Two Page 112
Constraints Evaluation for River Dependent Use
Property Owner/Lessee 1 2 3 4 5 6 7 8 9 10 11 12 13 14A&L WilliamsAndersonAsh Grove Cement Co (A)Ash Grove Cement Co (B)ATC Leasing Co LLCAtochem North America IncAventisAventisBabcock Land Co LLCBabcock Land Co LLCBell OilBingham International/SultzerBraden Investment CoBrix De Armond/Mar Com MarineBrix Maritime CoBrix Maritime CoBT-OH LLCBurlington Northern (A)Burlington Northern (B)Cargill Inc.Chevron (A)Chevron (B)City of PortlandCity of Portland/BESCity of Portland/BES Water LabCity of Portland/Cathedral ParkCity of Portland/Kelly Point ParkCity of Portland/T4City of Portland/Water BureauCrawford Street Corp/SchnitzerCrawford Street Corp/Schnitzer
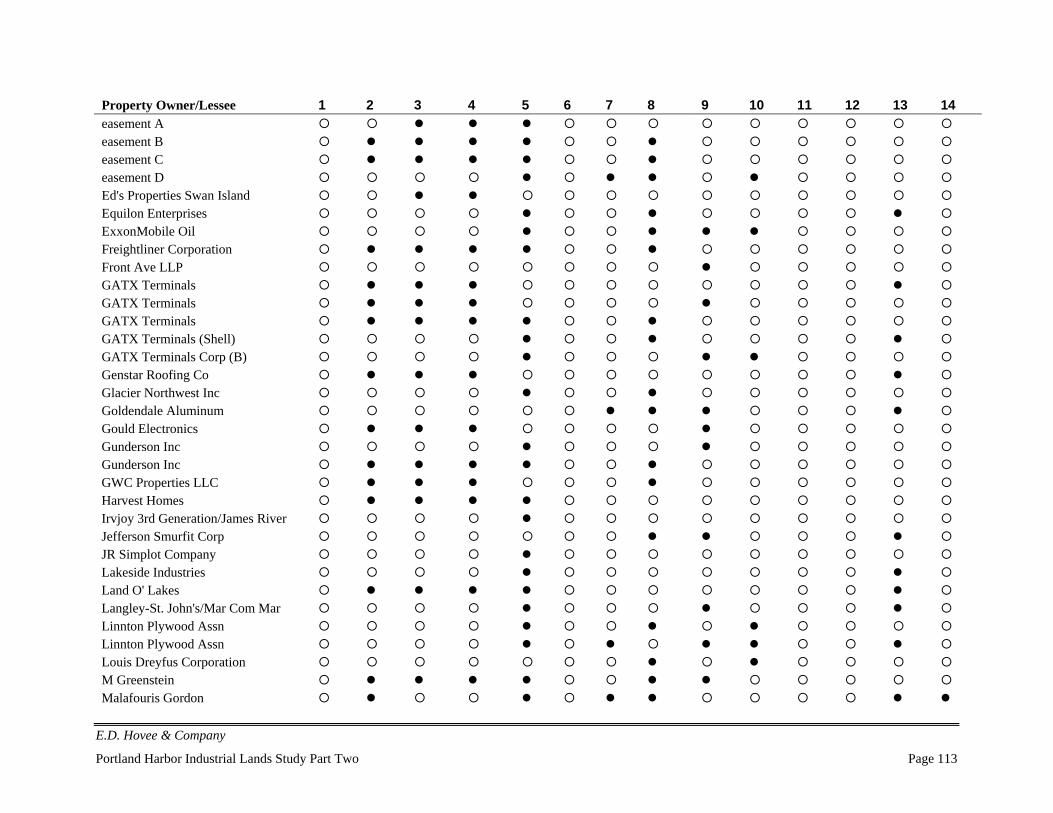
E.D. Hovee & Company
Portland Harbor Industrial Lands Study Part Two Page 113
Property Owner/Lessee 1 2 3 4 5 6 7 8 9 10 11 12 13 14easement Aeasement Beasement Ceasement DEd's Properties Swan IslandEquilon EnterprisesExxonMobile OilFreightliner CorporationFront Ave LLPGATX TerminalsGATX TerminalsGATX TerminalsGATX Terminals (Shell)GATX Terminals Corp (B)Genstar Roofing CoGlacier Northwest IncGoldendale AluminumGould ElectronicsGunderson IncGunderson IncGWC Properties LLCHarvest HomesIrvjoy 3rd Generation/James RiverJefferson Smurfit CorpJR Simplot CompanyLakeside IndustriesLand O' LakesLangley-St. John's/Mar Com MarLinnton Plywood AssnLinnton Plywood AssnLouis Dreyfus CorporationM GreensteinMalafouris Gordon
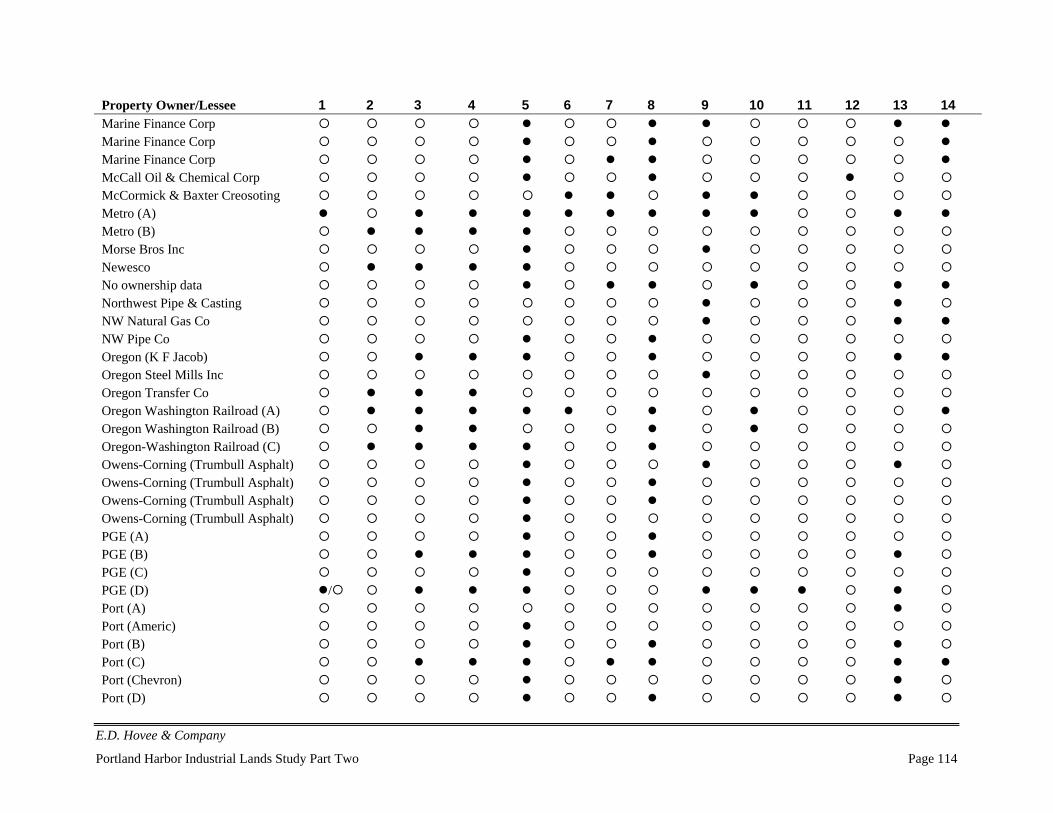
E.D. Hovee & Company
Portland Harbor Industrial Lands Study Part Two Page 114
Property Owner/Lessee 1 2 3 4 5 6 7 8 9 10 11 12 13 14Marine Finance CorpMarine Finance CorpMarine Finance CorpMcCall Oil & Chemical CorpMcCormick & Baxter CreosotingMetro (A)Metro (B)Morse Bros IncNewescoNo ownership dataNorthwest Pipe & CastingNW Natural Gas CoNW Pipe CoOregon (K F Jacob)Oregon Steel Mills IncOregon Transfer CoOregon Washington Railroad (A)Oregon Washington Railroad (B)Oregon-Washington Railroad (C)Owens-Corning (Trumbull Asphalt)Owens-Corning (Trumbull Asphalt)Owens-Corning (Trumbull Asphalt)Owens-Corning (Trumbull Asphalt)PGE (A)PGE (B)PGE (C)PGE (D) /Port (A)Port (Americ)Port (B)Port (C)Port (Chevron)Port (D)
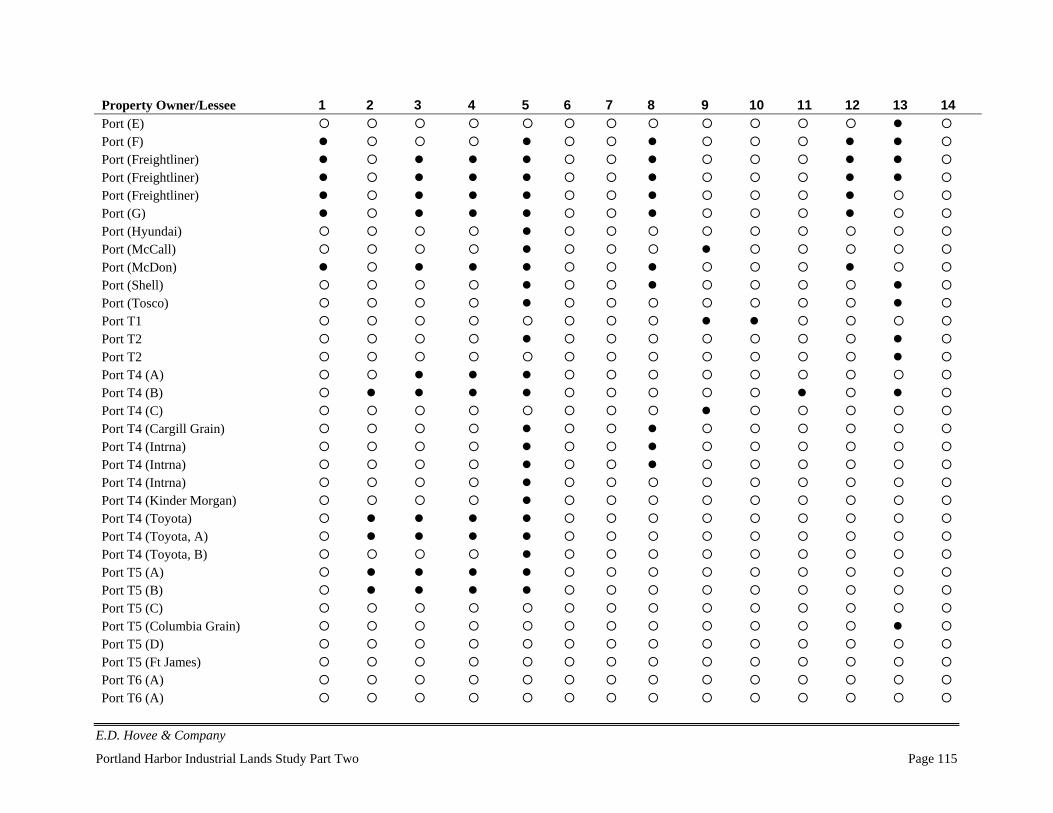
E.D. Hovee & Company
Portland Harbor Industrial Lands Study Part Two Page 115
Property Owner/Lessee 1 2 3 4 5 6 7 8 9 10 11 12 13 14Port (E)Port (F)Port (Freightliner)Port (Freightliner)Port (Freightliner)Port (G)Port (Hyundai)Port (McCall)Port (McDon)Port (Shell)Port (Tosco)Port T1Port T2Port T2Port T4 (A)Port T4 (B)Port T4 (C)Port T4 (Cargill Grain)Port T4 (Intrna)Port T4 (Intrna)Port T4 (Intrna)Port T4 (Kinder Morgan)Port T4 (Toyota)Port T4 (Toyota, A)Port T4 (Toyota, B)Port T5 (A)Port T5 (B)Port T5 (C)Port T5 (Columbia Grain)Port T5 (D)Port T5 (Ft James)Port T6 (A)Port T6 (A)
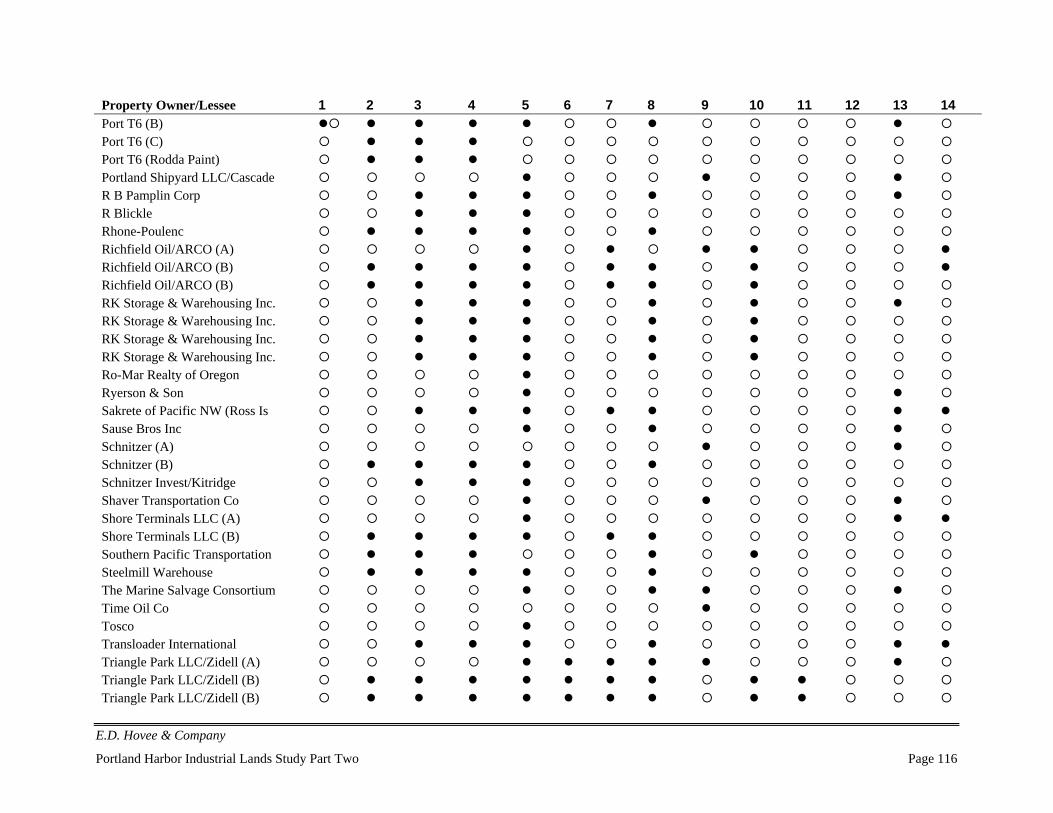
E.D. Hovee & Company
Portland Harbor Industrial Lands Study Part Two Page 116
Property Owner/Lessee 1 2 3 4 5 6 7 8 9 10 11 12 13 14Port T6 (B)Port T6 (C)Port T6 (Rodda Paint)Portland Shipyard LLC/CascadeR B Pamplin CorpR BlickleRhone-PoulencRichfield Oil/ARCO (A)Richfield Oil/ARCO (B)Richfield Oil/ARCO (B)RK Storage & Warehousing Inc.RK Storage & Warehousing Inc.RK Storage & Warehousing Inc.RK Storage & Warehousing Inc.Ro-Mar Realty of OregonRyerson & SonSakrete of Pacific NW (Ross IsSause Bros IncSchnitzer (A)Schnitzer (B)Schnitzer Invest/KitridgeShaver Transportation CoShore Terminals LLC (A)Shore Terminals LLC (B)Southern Pacific TransportationSteelmill WarehouseThe Marine Salvage ConsortiumTime Oil CoToscoTransloader InternationalTriangle Park LLC/Zidell (A)Triangle Park LLC/Zidell (B)Triangle Park LLC/Zidell (B)
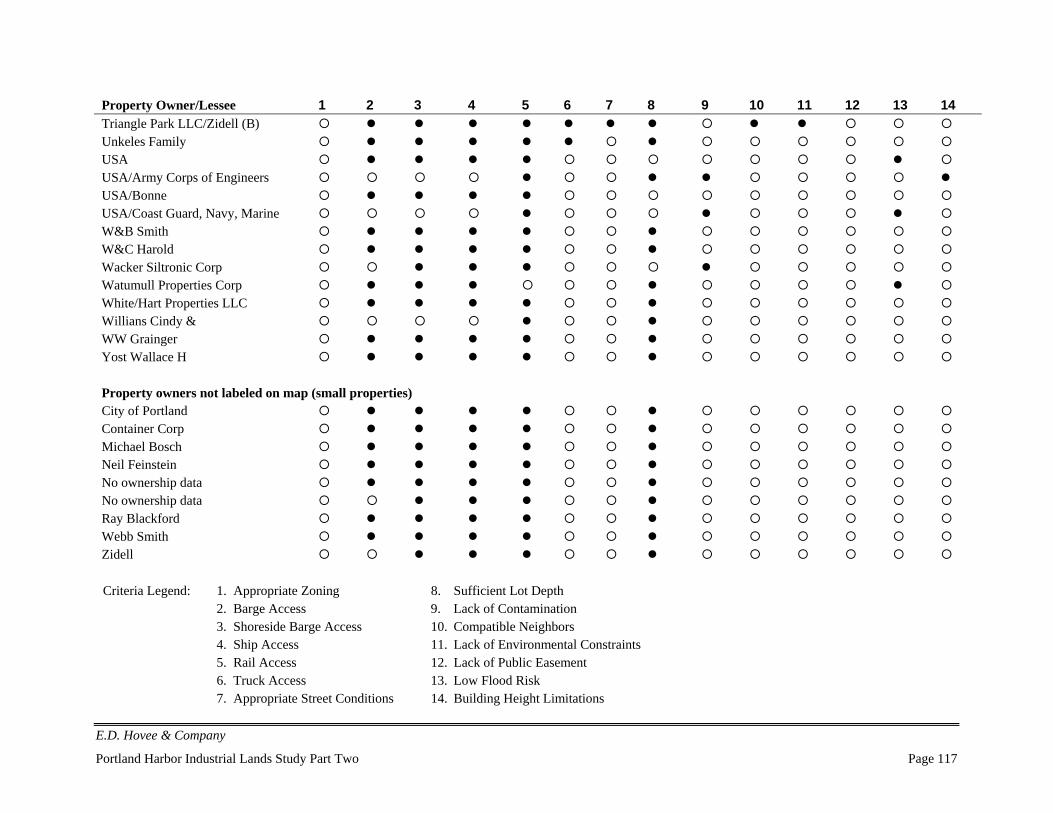
E.D. Hovee & Company
Portland Harbor Industrial Lands Study Part Two Page 117
Property Owner/Lessee 1 2 3 4 5 6 7 8 9 10 11 12 13 14Triangle Park LLC/Zidell (B)Unkeles FamilyUSAUSA/Army Corps of EngineersUSA/BonneUSA/Coast Guard, Navy, MarineW&B SmithW&C HaroldWacker Siltronic CorpWatumull Properties CorpWhite/Hart Properties LLCWillians Cindy &WW GraingerYost Wallace H
Property owners not labeled on map (small properties)City of PortlandContainer CorpMichael BoschNeil FeinsteinNo ownership dataNo ownership dataRay BlackfordWebb SmithZidell
Criteria Legend: 1. Appropriate Zoning 8. Sufficient Lot Depth2. Barge Access 9. Lack of Contamination3. Shoreside Barge Access 10. Compatible Neighbors4. Ship Access 11. Lack of Environmental Constraints5. Rail Access 12. Lack of Public Easement6. Truck Access 13. Low Flood Risk7. Appropriate Street Conditions 14. Building Height Limitations

E.D. Hovee & Company
Portland Harbor Industrial Lands Study Part 2 Page 118
E.D. Hovee & Company
Portland Harbor Industrial Lands Study Part 2 Page 119
ENDNOTES
i E.D. Hovee & Company maintains proprietary software of the IMPLAN input-output economic model
developed by the University of Minnesota and USDA Forest Service. Harbor-wide results may be extrapolatedfrom survey findings matched to Bureau of Planning provided data (employment) for the harbor industrial area.
ii Metro has forecast 10,460 more jobs within the Portland Harbor Area over the next 20 years. Rivergate isprojected to become the largest employment center within the Portland Harbor area, adding 6,590 jobs –capturing nearly 65% of the harbor study area’s job growth. Guild’s Lake and Swan Island, the study area’slargest employment centers, are forecast to add only 880 and 670 jobs respectively.
iii Interviews with key petroleum industry businesses suggests a somewhat different trend which is discussed in alater section of this PHILS Part 2 report.
iv Interviews should not be construed as representing a statistically valid sample due to the sample size of 80 firmsand focus on industry leaders. The cross-section approach is useful to identify major trends and issues, withmore emphasis on qualitative observations than quantitative or statistical sample reliability.
v Assuring confidentiality of results has been pivotal in obtaining responses from a number of those interviewedfor either (or both) of two reasons:
• Non-disclosure of proprietary information to potential competitors• Opinions that may be perceived as incompatible with those of sponsoring public agencies (e.g.
Columbia channel deepening)vi There are additional firms that may rely on the river, for example, for water rights or use but that are classified
in other sectors if they do not engage in on-site marine transportation. From this survey, firms not classified asriver-dependent have indicated other important relationships to the river including water rights for processwater/fire protection.
vii Employment data utilized in this section includes proprietors and others not typically covered by unemploymentinsurance. Conversely, the City’s Part 1 analysis only included covered workers.
viii IMPLAN is an economic model providing information that identifies the relationships between multipleeconomic sectors at the county level. The model was developed for the USDA Forest Service and draws on anational database from the U.S. Bureau of Economic Analysis and provides data for 528 economic sectors.
ix The IMPLAN database provides information for 528 industries. These industries have been aggregated intoemployment sectors by two-digit SIC. Employment sectors are clustered into industries that have similaractivities (i.e. produce-related goods, perform similar services, or naturally link to one another). The samedefinitions used for the Portland-Vancouver metro area have been applied to the U.S. in order to accuratelyassess the region’s performance against nationwide activities.
x Value-added is important because it measures the amount of local processing (or value-added) to goodsproduced and/or services provided by the industry. The higher the level of value-added, the more wealth beingcreated within the local economy.
xi For this analysis, the threshold for a high employment multiplier is set at 2.00, that is, at least two jobs createddirectly and indirectly in the region for every direct new job in the sector considered.
xii See Markusen, Ann, “Sticky Places in Slippery Space: A Typology of Industrial District,” EconomicGeography, Volume 72, Issue 3 (Jul., 1996), 293-313.
xiii These criteria have been reviewed with representatives of PDC, the Port of Portland, and City Bureau ofPlanning – and were further reviewed in two focus group sessions.
xiv Tire A are tax lots greater than one acre that have no identified constraints. Tier B sites are tax lots greater than2 acres constrained by “land banked” corporate ownership, access, or unstable soils.