Embed Size (px)
Citation preview

Saudi Arabia
Executive Summary
This country fact sheet provides key trade and investment related statistics for Saudi Arabia. Specifically, it shows
Saudi Arabia’s trade and investment flows including an analysis of top markets and products with South Africa and
the Western Cape highlighting the largest and fastest growing products and subsectors. The key highlights in the
Saudi Arabia country fact sheet are provided below:
Economy In 2015, Saudi Arabia’s GDP (PPP) was estimated at USD1.7trn, making Saudi Arabia the world's 15th
largest economy.
In 2015, Saudi Arabia’s GDP growth was at 3.4%.
Trade Global exports from Saudi Arabia in 2014 were valued at ZAR3.8trn compared to ZAR3.6trn in 2013,
increasing by 6.6%.
China was the leading import market in 2014 valued at ZAR223bn.
South Africa exported goods to Saudi Arabia valued at ZAR4.8bn in 2014 compared to ZAR2.6bn in
2013, representing an increase of 83%
The leading export product to Saudi Arabia from South Africa was motor vehicles for the transport of
goods and valued at ZAR819m, followed by citrus fruit (ZAR754m)
The province exported goods to Saudi Arabia valued at ZAR893m in 2014
Citrus fruit was the leading export product category to Saudi Arabia from the Western Cape in 2014,
valued at ZAR398m. This is followed by flat-rolled products of iron or non-alloy steel, valued at
ZAR160m.
Investment Between January 2003 and July 2015 a total of 1,217 FDI projects were recorded into Saudi Arabia.
These projects represent a total capital investment of ZAR1,785.79bn
Between January 2003 and July 2015 a total of 534 FDI projects were recorded from Saudi Arabia.
These projects represent a total capital investment of ZAR487.47bn
Between January 2003 and July 2015 a total of 2 FDI projects were recorded from South Africa to Saudi
Arabia. These projects represent a total capital investment of ZAR399.55m
Between January 2003 and July 2015 a total of 5 FDI projects were recorded from Saudi Arabia to
South Africa. These projects represent a total capital investment of ZAR20.70bn
Tourism Outbound tourism is expected to increase significantly over the next five years through to 2020 with
outbound travel increasing from 11.7mn in 2016 to 14.8mn in 2020.
Saudi Arabian tourist arrivals into South Africa increased by 5% from 6 251 tourists in 2013 to 6 545
tourists in 2014.

2
Table of Contents
1. General Information ....................................................................................................... 3
2. Economic Overview ....................................................................................................... 3
2.1 Doing Business in Saudi Arabia .............................................................................. 6
3. Trade ............................................................................................................................. 7
3.1 Saudi Arabia’s Global Trade in Services ................................................................. 7
3.2 Saudi Arabia’s Global Trade in Products ................................................................. 8
3.3 Trade with South Africa ......................................................................................... 11
3.4 Trade with the Western Cape ............................................................................... 12
3.5 Saudi Arabia’s Trade Agreements ........................................................................ 13
3.6 Port to Port ........................................................................................................... 14
3.7 Tariffs.................................................................................................................... 14
4. FDI ............................................................................................................................... 17
4.1 Inward FDI to Saudi Arabia ................................................................................... 17
4.2 Outward FDI from Saudi Arabia ............................................................................ 20
4.3 South African FDI with Saudi Arabia ..................................................................... 24
5. Tourism ........................................................................................................................ 25
5.1 Saudi Arabia Trends and Travel Patterns ............................................................. 25
5.2 Saudi Arabian Tourist Arrivals into South Africa .................................................... 25

3
1. General Information
Saudi Arabia is the largest Arab state in Western Asia by land area (approximately 2,150,000 km2 and the second-
largest in the Arab world after Algeria). It is bordered by Jordan and Iraq to the north, Kuwait to the northeast,
Qatar, Bahrain and the United Arab Emirates to the east, Oman to the southeast, and Yemen in the south. It is the
only nation with both a Red Sea coast and a Persian Gulf coast.
Saudi Arabia is an absolute monarchy and the king combines legislative, executive, and judicial functions. It is an
active member of the Organisation of Islamic Cooperation, Arab League, Gulf Cooperation Council, Organisation
of Islamic Cooperation and OPEC.
GENERAL INFORMATION
Population 27,752,316
Capital Riyadh
Chief of state King and Prime Minister SALMAN bin Abd
al-Aziz Al Saud
Official language(s) Arabic (official)
Ethnic group(s) Arab 90%, Afro-Asian 10%
Religion(s)
Muslim (official; citizens are 85-90% Sunni
and 10-15% Shia), other (includes Eastern
Orthodox, Protestant, Roman Catholic,
Jewish, Hindu, Buddhist, and Sikh
Life expectancy 75.05 years
Literacy rate 94.7%
HDI (2015) 0.837 (Ranked 39th)
Source: CIA World Factbook, 2016
2. Economic Overview
Saudi Arabia has an oil-based economy with strong government controls over major economic activities. It
possesses about 16% of the world's proven petroleum reserves, ranks as the largest exporter of petroleum, and
plays a leading role in OPEC. The petroleum sector accounts for roughly 80% of budget revenues, 45% of GDP,
and 90% of export earnings. Saudi Arabia officially has about 260 billion barrels (4.1×10¹⁰m3) of oil reserves,
comprising about one-fifth of the world's proven total petroleum reserves.
Saudi Arabia is encouraging the growth of the private sector in order to diversify its economy and to employ more
Saudi nationals. Diversification efforts are focusing on power generation, telecommunications, natural gas
exploration, and petrochemical sectors.
In 2015, Saudi Arabia’s GDP (PPP) was estimated at USD1.7trn, making Saudi Arabia the world's 15th largest
economy. In 2015, Saudi Arabia’s GDP growth was at 3.4%. On a per capita income basis, Saudi Arabia’s is ranked
21st with a GDP per capita of USD54,600 according to the International Monetary Fund (IMF).
ECONOMIC INFORMATION
GDP (PPP) (2015 est.) USD1.681trn
GDP growth (2015 est.) 3.4%
GDP per capita (2015 est.) USD54,600
Inflation (2015 est.) 2.3%
Interest rate (31 December 2015 est.) 6.7%
Unemployment rate (2015 est.) 11.4%
Exports (2014) ZAR3.8trn
Imports (2014) ZAR1.7trn
Doing Business in...(2016 ranking) 82
Source: Ease of Doing Business, 2016; CIA World Factbook, 2016

4
The figure below illustrates the GDP value and growth for Saudi Arabia’s economy for the period 2012 to 2020.
The economy will experience a steady increase in GDP value during the forecast period with GDP increasing from
SAR2.3trn in 2012 to SAR2.9trn in 2020. Growth in Saudi Arabia will slow sharply over the next couple of years as
the government embarks on fiscal consolidation and oil production flattens. GDP average annual growth is forecast
at 2.9% for 2016 to 2020.
Source: IMF, 2016
According to the figure below, Saudi Arabia’s largest sector was crude petroleum and natural gas sector at 46%
share of GDP in 2014. Manufacturing accounted for 13% share of GDP, followed by finance insurance real estate
and business services with 11% share of GDP.
Key industries: in Saudi Arabia the key industries are crude oil production, petroleum refining, basic
petrochemicals, ammonia, industrial gases, sodium hydroxide (caustic soda), cement, fertilizer, plastics, metals,
commercial ship repair, commercial aircraft repair and construction. The main agricultural products produced in
Saudi Arabia are wheat, barley, tomatoes, melons, dates, citrus; mutton, chickens, eggs, milk.
Some key sectors in Saudi Arabia are highlighted below:
Petroleum: Saudi oil reserves are the 2nd largest in the world, and Saudi Arabia is the world's leading oil producer
and exporter. Oil accounts for more than 90% of the country's exports and nearly 75% of government revenues.
The petrochemicals sector is the largest non-oil sector in Saudi Arabia. Saudi Arabia is the world’s 11th largest
petrochemicals supplier, accounting for 7-8% of total supply. While the nation’s current strengths lie in the
production of basic petrochemical building blocks such as ethylene and methanol, there are plans to diversify its
petrochemical portfolio into more complex, distinctive products such as specialty chemicals and engineering
thermoplastics.
ICT: With over 27 million consumers and a number of global enterprises, Saudi Arabia is the largest ICT market by
far in the Middle East. For example, the Saudi Arabian telecommunications and information technology industries
represent over 55% and 51% of the total Middle East markets, respectively.
Transport and logistics: Saudi Arabia’s strategic location and large-scale infrastructure development will position
KSA as one of the world’s leading transport and logistics hubs. The transport and logistics sector in Saudi is
supporting a population of 27.14 million (2010), and within only 3 hours flying radius, this sector can serve both
cargo and passengers of more than 250 million inhabitants in neighbouring countries
2012 2013 2014 2015 2016f 2017f 2018f 2019f 2020f
Value (SARbn) 2 289 2 350 2 432 2 515 2 571 2 645 2 725 2 809 2 898
Growth 5.4% 2.7% 3.5% 3.4% 2.2% 2.9% 3.0% 3.1% 3.2%
0.0%
1.0%
2.0%
3.0%
4.0%
5.0%
6.0%
0
500
1 000
1 500
2 000
2 500
3 000
3 500
Gro
wth
Valu
e (
SA
Rbn)
SAUDIA ARABIAN GDP, 2012-2020

5
Source: Central Department of Statistics & Information, 2016
The table below lists Saudi Arabia’s top 20 companies on the Forbes List in 2015.
TOP 10 SAUDI ARABIAN COMPANIES ON FORBES TOP 2000 COMPANIES IN THE WORLD, 2015
FORBES RANK
COMPANY SECTOR SALES
(USDbn) PROFITS (USDbn)
ASSETS (USDbn)
MARKET VALUE
(USDbn)
#116 Saudi Basic Industries Chemicals 50.4 6.2 90.9 64
#405 Saudi Telecom Telecommunications 12.3 2.9 24.2 32.8
#474 Saudi Electricity Energy 10.3 0.963 84.7 18.8
#488 National Commercial Bank
Banking 5 2.3 115.9 31.9
#597 Al Rajhi Bank Banking 3.7 1.8 82 24.5
#754 Samba Financial Group Banking 2.1 1.3 57.9 13.4
#771 Riyad Bank Banking 2.4 1.2 57.2 13.5
#782 Saudi British Bank Banking 1.9 1.1 50 13.1
#849 Banque Saudi Fransi Banking 1.7 0.938 50.3 11
#971 Arab National Bank Banking 1.6 0.767 43.9 8.7
#1289 Savola Group Food processing 7.3 0.553 7.1 9.7
#1290 Saudi Arabian Mining Minerals & mining 2.9 0.362 22.5 11.7
#1311 Saudi Arabian Fertilizers Chemicals 1.2 0.846 2.4 13.3
#1412 Saudi Hollandi Bank Banking 0.987 0.486 25.7 6.2
#1495 Alinma Bank Banking 0.755 0.337 21.5 8.6
#1527 Kingdom Holding Investment Services 0.896 0.232 12.5 19.6
#1554 Almarai Food processing 3.4 0.446 6.4 13.6
#1641 Petro Rabigh Chemicals 14.5 0.182 10.9 4.8
#1672 Saudi Investment Bank Banking 842 0.383 25 3.8
#1826 Jabal Omar Development Banking 0.197 0.154 5 18.8
Source: Forbes 2000, 2016
Agriculture , Forestry & Fishing2.4%
Crude Petroleum & Natural Gas
46.1%
Other mining & quarry0.4%
Manufacturing13.4%
Electricity , Gas and Water1.5%
Construction5.8%
Wholesale & Retail Trade, Restaurants &
hotels10.8%
Transport , Storage & Communication
6.5%
Finance , Insurance , Real Estate &
business services 10.8%
Community , Social & Personal Services
2.3%
SAUDI ARABIA SECTOR CONTRIBUTION TO GDP, 2014

6
2.1 Doing Business in Saudi Arabia
According to the World Bank’s Doing Business 2016 report, Saudi Arabia is ranked 82 out of 189 countries in
terms of ease of doing business. Saudi Arabia’s ease of doing business is evident in terms of paying taxes (3rd);
dealing with Construction Permits (17th) and getting electricity (24th).
SAUDI ARABIA EASE OF DOING BUSINESS, 2016
TOPIC RANKING RANKING OUT OF 189
COUNTRIES, 2016
Starting a Business 130
Dealing with Construction Permits 17
Getting Electricity 24
Registering Property 31
Getting Credit 79
Protecting Investors 99
Paying Taxes 3
Trading Across Borders 150
Enforcing Contracts 86
Resolving Insolvency 189
Doing Business 2016 82
Source: Cost of Doing Business, 2016
2.2 Saudi Arabia Risk Ratings
The table below shows Saudi Arabia’s sovereign risk and it indicates very strong capacity to meet financial
commitments. The decline in oil prices will have a marked and lasting impact on Saudi Arabia's fiscal and economic
indicators given its high dependence on oil. According to Moodys, Saudi Arabia's (Aa3 stable) fiscal position is
weakening but is still relatively strong. Volatile oil prices will continue to weigh on the government's balance sheet.
It expects that lower oil revenues will result in continued large budget deficits, a drawdown in reserves, and
increased sovereign debt issuance
Saudi Arabia is currently facing a huge budget deficit which is expected to reach USD87bn in 2016 according
official government numbers. However, the actual figure is expected to be much higher as the IMF estimated last
year's deficit at USD140bn. The kingdom’s oil sales account for almost 80% of the country’s revenues.
SAUDI ARABIA’S COUNTRY RATINGS
STANDARD & POORS SOVEREIGN RATINGS FITCH RATING MOODY'S RATINGS
Local Currency
Rating
Foreign Currency
Rating T&C Assessment Credit Rating Credit Rating
A- A- A- AA Aa3
Source: Standard & Poors, 2016
The table below shows Saudi Arabia’s risk assessment in terms of export transactions and direct investments.
Ratings are between 1 and 7, and between A and C, with 7 and C being the maximum risk indicators. The political
risk in Saudi Arabia is low in the short term and medium to long-term. Special transaction risk is moderate together
with some categories of direct investment risk, i.e. risk of expropriation and government action(3) and transfer
risk(3).
SAUDI ARABIA RISK ASSESSMENT
EXPORT TRANSACTIONS
Political Risks
Short Term 2
Medium-Long term 2
Special Transactions 2
Commercial Risk B
DIRECT INVESTMENTS
War risk 4
Risk of expropriation and government action 3
Transfer risk 3
Source: ONDD, 2016

7
3. Trade
3.1 Saudi Arabia’s Global Trade in Services
In 2014 Saudi Arabia experienced the highest trade in services both in terms of exports and imports over the ten
year period. Saudi Arabia’s exports of services increased by 16% in 2014 to reach ZAR132bn, while imports
increased by 43% in 2014 to reach ZAR1trn. From 2005 to 2014 a negative trade balance was experienced by
Saudi Arabia.
Source: TradeMap, 2016
The table below shows Saudi Arabia’s trade in services for the period 2014. Travel was the largest services export
valued at ZAR89bn followed by transportation valued at ZAR30bn. Government services was the largest import
service into Saudi Arabia valued at ZAR410bn followed by travel and transport services valued at ZAR261bn and
ZAR216bn respectively.
SAUDI ARABIA’S TOP 10 EXPORTS OF SERVICES, 2014 SAUDI ARABIA’S TOP 10 IMPORTS OF SERVICES, 2014
Code SERVICE VALUE
2014 (ZARbn)
% GROWTH 2010-2014
Code SERVICE VALUE
2014 (ZARbn)
% GROWTH 2010-2014
'4 Travel 89.2 12.99% '12 Government goods and services n.i.e.
410 16.20%
'3 Transport 29.7 14.47% '4 Travel 261 11.89%
'12 Government goods and services n.i.e. 6.0 19.09% '3 Transport 216 18.54%
'7 Financial services 2.3 11.13% '10 Other business services 72 9.52%
'9 Telecommunications, computer, and information services
2.2 7.78% '5 Construction 34 8.27%
'6 Insurance and pension services 1.9 2.92% '9 Telecommunications, computer, and information services
24 10.04%
'10 Other business services 1.0 16.99% '6 Insurance and pension services 22 13.45%
TOTAL EXPORTS 132.3 10.79% TOTAL IMPORTS 1 049 12.48%
Source: TradeMap, 2016
2005 2006 2007 2008 2009 2010 2011 2012 2013 2014
Exports (ZARbn) 72 95 115 76 81 78 83 90 114 132
Imports (ZARbn) 210 332 443 610 622 560 561 600 736 1 049
Trade balance (ZARbn) -137 -237 -328 -534 -541 -482 -478 -510 -622 -917
-1 500
-1 000
-500
0
500
1 000
1 500
Valu
e (
ZA
Rbn)
SAUDI ARABIA SERVICES TRADE, 2005-2014

8
3.2 Saudi Arabia’s Global Trade in Products
In 2014 Saudi Arabia experienced the highest trade value both in terms of exports and imports over the ten year
period. Global exports from Saudi Arabia in 2014 were valued at ZAR3.8trn compared to ZAR3.6trn in 2013,
increasing by 6.6%. Global imports into Saudi Arabia were valued at ZAR1.7trn in 2014 compared to ZAR1.5trn in
2013, increasing by 15%. The trade balance over the period has been consistently positive as Saudi Arabia is a
net exporter.
Source: TradeMap, 2016
China was the leading export market for Saudi Arabia with a value of ZAR525bn. Japan and the United States
ranked second and third valued at ZAR513bn and ZAR509bn respectively. Other top destination markets were
Republic of Korea (ZAR398bn); India (ZAR354bn) and Singapore (ZAR158bn).
TOP 10 DESTINATION MARKETS FOR EXPORTS FROM
SAUDI ARABIA, 2014
RANK MARKET
VALUE
2014
(ZARbn)
%
GROWTH
2010-2014
%
SHARE
2014
1 China 525 22.73% 13.87%
2 Japan 513 16.89% 13.56%
3 United States 509 22.58% 13.45%
4 Korea, Republic
of 398 19.78% 10.50%
5 India 354 24.83% 9.35%
6 Singapore 158 20.70% 4.18%
7 Taipei, Chinese 148 15.86% 3.91%
8 France 102 33.67% 2.69%
9 Bahrain 91 561.53% 2.39%
10 Thailand 85 21.00% 2.24%
11 South Africa 77 29.24% 2.04%
TOTAL EXPORTS 3 786 20.92% 100%
Source: TradeMap, 2016
2005 2006 2007 2008 2009 2010 2011 2012 2013 2014
Exports (ZARbn) 1 049 1 381 1 545 2 654 1 503 1 755 2 529 3 087 3 553 3 786
Imports (ZARbn) 330 415 565 821 679 690 834 1 134 1 466 1 684
Trade balance (ZARbn) 719 966 980 1 832 824 1 065 1 695 1 953 2 088 2 102
0
500
1 000
1 500
2 000
2 500
3 000
3 500
4 000
Valu
e (
ZA
Rbn)
GLOBAL FDI INTO SAUDI ARABIA, 2005-2014

9
China was the leading import market in 2014 valued at ZAR223bn. The United States and India were ranked
second and third valued at ZAR203bn and ZAR141bn respectively. Other top import markets were Germany
(ZAR129bn); the Republic of Korea (ZAR90bn) and Japan (ZAR82bn).
TOP 10 SOURCE MARKETS FOR IMPORTS TO SAUDI ARABIA, 2014
RANK MARKET VALUE
2014 (ZARbn)
% GROWTH 2010-2014
% SHARE
2014
1 China 223 25.43% 13.23%
2 United States 203 18.97% 12.03%
3 India 141 38.63% 8.40%
4 Germany 129 18.89% 7.65%
5 Korea, Republic of 90 24.60% 5.33%
6 Japan 82 14.32% 4.89%
7 United Kingdom 74 17.91% 4.42%
8 Italy 69 21.15% 4.11%
9 Switzerland 54 42.78% 3.22%
10 France 42 9.35% 2.52%
47 South Africa 4.8 17.97% 0.28%
TOTAL IMPORTS 1 684 20.51% 100.00%
Source: TradeMap, 2016
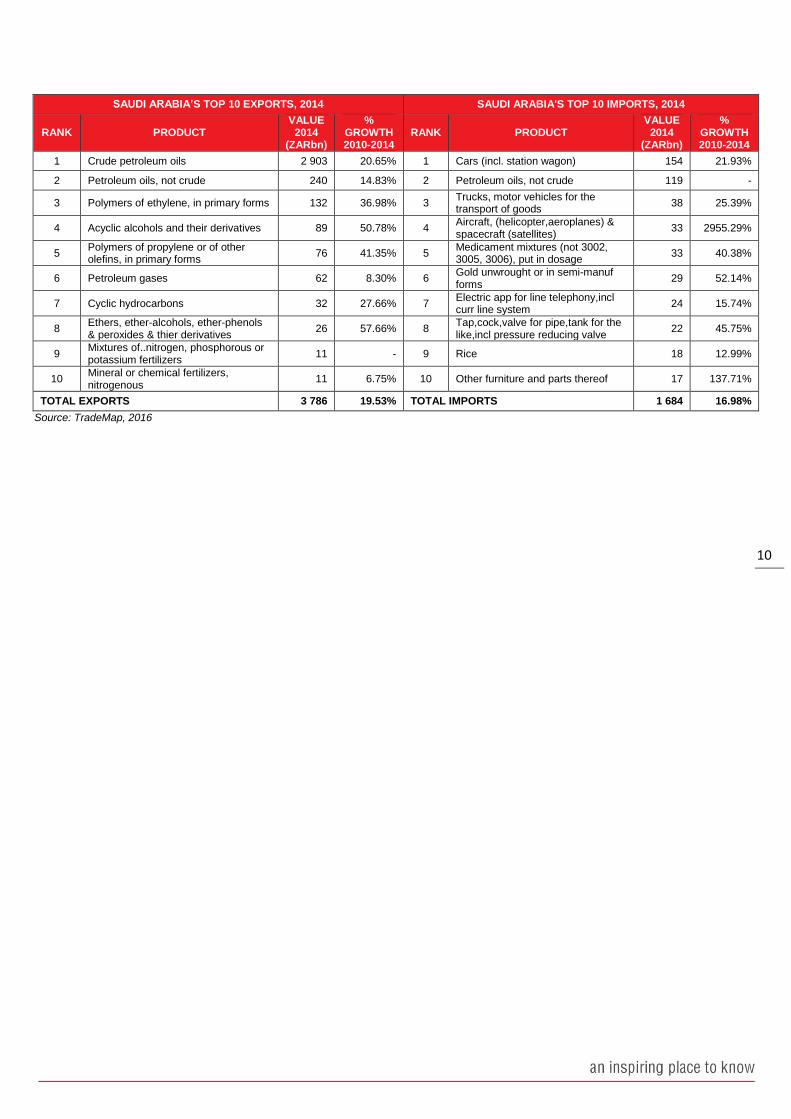
In 2014 Saudi Arabia was the 16th largest exporter of
global goods at ZAR3.8trn and the 30th largest importer of
global goods at ZAR1.7trn.
Crude petroleum was the leading export product valued at ZAR2.9trn. Refined petroleum (ZAR240bn) and
polymers of ethylene, in primary forms (ZAR132bn) were ranked second and third respectively. Other top exports
were acyclic alcohols and their derivatives (ZAR89bn); petroleum gases (ZAR62bn) and cyclic hydrocarbons
(ZAR32bn).
In 2014, cars was the leading import product by Saudi Arabia, valued at ZAR154bn. Refined petroleum and trucks
were ranked second and third at ZAR119bn and ZAR38bn respectively. Other top imports aircraft (ZAR33bn) and
medicaments (ZAR33m).
2nd Global Exporter of
Mineral fuels, oils, distillation products
5thGlobal Importer for
Cereals
9th Global Exporter of Fertilizers
2nd Global Importer for Arms and
ammunition, parts and
accessories
6th Global Importer for
Ceramic products
8th Global Exporter
Plastics and articles thereof
10
SAUDI ARABIA’S TOP 10 EXPORTS, 2014 SAUDI ARABIA'S TOP 10 IMPORTS, 2014
RANK PRODUCT VALUE
2014 (ZARbn)
% GROWTH 2010-2014
RANK PRODUCT VALUE
2014 (ZARbn)
% GROWTH 2010-2014
1 Crude petroleum oils 2 903 20.65% 1 Cars (incl. station wagon) 154 21.93%
2 Petroleum oils, not crude 240 14.83% 2 Petroleum oils, not crude 119 -
3 Polymers of ethylene, in primary forms 132 36.98% 3 Trucks, motor vehicles for the transport of goods
38 25.39%
4 Acyclic alcohols and their derivatives 89 50.78% 4 Aircraft, (helicopter,aeroplanes) & spacecraft (satellites)
33 2955.29%
5 Polymers of propylene or of other olefins, in primary forms
76 41.35% 5 Medicament mixtures (not 3002, 3005, 3006), put in dosage
33 40.38%
6 Petroleum gases 62 8.30% 6 Gold unwrought or in semi-manuf forms
29 52.14%
7 Cyclic hydrocarbons 32 27.66% 7 Electric app for line telephony,incl curr line system
24 15.74%
8 Ethers, ether-alcohols, ether-phenols & peroxides & thier derivatives
26 57.66% 8 Tap,cock,valve for pipe,tank for the like,incl pressure reducing valve
22 45.75%
9 Mixtures of..nitrogen, phosphorous or potassium fertilizers
11 - 9 Rice 18 12.99%
10 Mineral or chemical fertilizers, nitrogenous
11 6.75% 10 Other furniture and parts thereof 17 137.71%
TOTAL EXPORTS 3 786 19.53% TOTAL IMPORTS 1 684 16.98%
Source: TradeMap, 2016

11
3.3 Trade with South Africa
South Africa exported goods to Saudi Arabia valued at ZAR4.8bn in 2014 compared to ZAR2.6bn in 2013,
representing an increase of 83%, while imported goods were valued at ZAR77.3bn in 2014 compared to ZAR77.4bn
in 2013, decreasing by 0.15%. South Africa had a constant trade deficit with Saudi Arabia, with imports exceeding
exports over the ten year period.
Source: Quantec, 2016
The leading export product to Saudi Arabia from South Africa was motor vehicles for the transport of goods valued
at ZAR819m, followed by citrus fruit (ZAR754m) and aluminium plates (ZAR410m). Flat-rolled products of iron or
non-alloy steel was the fastest growing export product over the five year period.
The leading imported product from Saudi Arabia into South Africa was crude petroleum valued at ZAR67bn,
followed by refined petroleum (ZAR4.5bn) and Polymers of ethylene, in primary forms (ZAR1.2bn). The import of
Sulphur was the fastest growing import into South Africa from Saudi Arabia over the five year period.
SOUTH AFRICA'S TOP 10 EXPORTS TO SAUDI ARABIA’S, 2014 SOUTH AFRICA'S TOP 10 IMPORTS FROM SAUDI ARABIA’S, 2014
RANK PRODUCT VALUE
2014 (ZARm)
% GROWTH 2010-2014
RANK PRODUCT VALUE
2014 (ZARm)
% GROWTH 2010-2014
1 Motor vehicles for the transport of goods.
819 - 1 Crude petroleum oils 66 976 30.83%
2 Citrus fruit, fresh or dried. 754 19.7% 2 Refined Petroleum oils 4 505 173.94%
3 Aluminium plates, sheets and strip, of a thickness exceeding 0.2 mm.
410 18.5% 3 Polymers of ethylene, in primary forms.
1 229 20.99%
4 Titanium ores and concentrates. 313 - 4 Acyclic alcohols and their halogenated, sulphonated, nitrated or nitrosated derivatives.
780 34.13%
5 Manganese ores and concentrates, 251 42.4% 5 Mineral or chemical fertilisers, nitrogenous.
748 4.87%
6 Iron ores and concentrates, including roasted iron pyrites.
175 - 6 Cyclic hydrocarbons. 690 40.80%
7 Flat-rolled products of other alloy steel, of a width of 600 mm or more.
168 - 7 Acyclic hydrocarbons. 549 31.74%
8 Flat-rolled products of iron or non-alloy steel, of a width of 600 mm or more
160 195.6% 8 Mixed alkylbenzenes and mixed alkylnaphthalenes
393 44.94%
9 Copper powders and flakes. 115 - 9 Sulphur of all kinds, other than sublimed sulphur
222 1058.38%
10 Maize (corn). 104 - 10
Mineral or chemical fertilisers containing two or three of the fertilising elements nitrogen, phosphorus and potassium
175 -
TOTAL EXPORTS 4 789 17.9% TOTAL IMPORTS 77 327 29.14%
Source: Quantec, 2016
2004 2005 2006 2007 2008 2009 2010 2011 2012 2013 2014
Exports (ZARm) 1 496 1 715 1 651 2 279 2 720 2 488 2 653 2 588 2 919 2 620 4 789
Imports (ZARm) 17 086 19 408 24 545 25 360 45 958 26 651 23 674 32 295 65 148 77 440 77 327
Trade balance (ZARm) -15 590-17 693-22 894-23 081-43 237-24 163-21 022-29 707-62 229-74 820-72 539
-100 000
-80 000
-60 000
-40 000
-20 000
0
20 000
40 000
60 000
80 000
100 000
Valu
e (
ZA
Rm
)
SOUTH AFRICA TRADE WITH SAUDI ARABIA, 2004-2014

12
3.4 Trade with the Western Cape
The province exported goods to the value of ZAR893m in 2014 compared to ZAR718m in 2013, representing a
decrease of 24%, while imported goods were valued at ZAR46bn in 2014 compared to ZAR49bn in 2013,
increasing by 6.1%.
Source: Quantec, 2016
Citrus fruit was the leading export product category to Saudi Arabia from the Western Cape in 2014, valued at
ZAR398m. This is followed by flat-rolled products of iron or non-alloy steel, valued at ZAR160m. Half of the top ten
products exported by the Western Cape include agro-processing products revealing a high demand for these
products. The leading import products into the Western Cape from Saudi Arabia include crude petroleum valued
at ZAR43bn, followed by refined petroleum valued at ZAR2.2bn.
WESTERN CAPE’S TOP 10 EXPORTS TO SAUDI ARABIA’S, 2014 WESTERN CAPE’S TOP 10 IMPORTS FROM SAUDI ARABIA’S, 2014
RANK PRODUCT VALUE
2014 (ZARm)
% GROWTH 2010-2014
RANK PRODUCT VALUE,
2014 (ZARm)
% GROWTH 2010-2014
1 Citrus fruit, fresh or dried. 397.8 9.78% 1 Crude Petroleum oils 42 725.6 33.66%
2 Flat-rolled products of iron or non-alloy steel
160.3 - 2 Refined Petroleum oils 2 157.8 229.66%
3 Apples, pears and quinces, fresh. 72.1 27.86% 3 Acyclic alcohols and their halogenated, sulphonated, nitrated
574.6 -
4 Apricots, cherries, peaches (including nectarines), plums and sloes, fresh.
59.9 23.23% 4 Mixed alkylbenzenes and mixed alkylnaphthalenes.
393.2 -
5 Grapes, fresh or dried. 52.4 22.49% 5 Cyclic hydrocarbons. 51.2 -
6 Transfers (decalcomanias). 42.1 20.43% 6 Coal; briquettes, ovoids and similar solid fuels manufactured from coal.
26.3 -
7 Other plates, sheets, film, foil and strip, of plastics, non-cellular
23.9 10.50% 7 Saturated acyclic monocarboxylic acids
14.6 -
8 Parts suitable for use solely or principally with the machinery of headings 84.25 to 84.30.
12.9 - 8 Polyacetals, other polyethers and epoxide resins, in primary forms
8.3 -
9 Fruit, nuts and other edible parts of plants
11.0 - 9 Carboys, bottles, flasks, jars, pots, phials, ampoules and other containers, of glass
7.0 -22.21%
10 Other live plants (including their roots), cuttings and slips; mushroom spawn.
6.9 - 10 Polymers of ethylene, in primary forms.
6.2 -
2004 2005 2006 2007 2008 2009 2010 2011 2012 2013 2014
Exports (ZARm) 4.5 396 351 396 446 520 622 750 1 094 718 893
Imports (ZARm) 11 526 13 507 17 134 15 882 26 454 13 677 12 476 17 154 38 682 48 855 45 978
Trade balance (ZARm) -11 521 -13 111 -16 783 -15 486 -26 008 -13 157 -11 854 -16 403 -37 589 -48 137 -45 085
-60 000
-40 000
-20 000
0
20 000
40 000
60 000
Valu
e (
ZA
Rm
)
SAUDI ARABIA FDI TO WESTERN CAPE, 2004-2014

13
WESTERN CAPE’S TOP 10 EXPORTS TO SAUDI ARABIA’S, 2014 WESTERN CAPE’S TOP 10 IMPORTS FROM SAUDI ARABIA’S, 2014
RANK PRODUCT VALUE
2014 (ZARm)
% GROWTH 2010-2014
RANK PRODUCT VALUE,
2014 (ZARm)
% GROWTH 2010-2014
TOTAL EXPORTS 893.2 15.19% TOTAL IMPORTS 45 978.4 34.93%
Source: Quantec, 2016
Western Cape trade with Saudi Arabia by sector is shown below. The largest share of exports to Saudi Arabia
were:
Printing, publishing & recorded media sector accounting for 24%,
Machinery and equipment (21%),
Plastic products (13%) and
Basic iron and steel (9%).
Source: Quantec, 2014
3.5 Saudi Arabia’s Trade Agreements
Saudi Arabia is a member of the key trade agreements below:
International Economic Cooperation: Saudi Arabia is a main player in the commercial life around the world. By
signing agreements with world trade organizations and many European and Asian countries, Saudi Arabia has
created a powerful cooperation within the world economy.
0.1%
0.1%
0.2%
0.2%
0.6%
0.8%
1.1%
1.6%
2.1%
2.1%
2.8%
6.6%
7.7%
8.2%
8.6%
12.8%
20.8%
23.5%
0% 5% 10% 15% 20% 25%
Furniture
Coke & refined petroleum products
Textiles
Electrical machinery
Metal products excluding machinery
Tobacco
Other transport equipment
Wearing apparel
Television, radio & communication equipment
Basic chemicals
Motor vehicles, parts & accessories
Other chemicals & man-made fibres
Food
Professional & scientific equipment
Basic iron & steel
Plastic products
Machinery & equipment
Printing, publishing & recorded media
WESTERN CAPE EXPORTS SAUDI ARABIA BY SECTOR, (% SHARE), 2013
% share

14
Gulf Cooperation Council : The Gulf Cooperation Council (GCC) was founded in May 1981, by the leaders of the
United Arab Emirates, the Kingdom of Bahrain, the Kingdom of Saudi Arabia, the Sultanate of Oman, the State of
Qatar and the State of Kuwait. The GCC Charter documents the special relations of the six states, their common
qualities and similar systems founded on the creed of Islam, and their faith in a common destiny.
3.6 Port to Port
The table below shows the distance and time it takes goods to travel from Cape Town Port terminal to Saudi Arabia:
CAPE TOWN PORT TERMINAL TO SAUDI ARABIA’S MAIN SEA PORTS
SEA PORTS DISTANCE TRANSIT TIME
Dammam Terminal 9388.15km 15 days 2 hours
Dhuba 9464.47km 15 days 5 hours
Dhuba Bulk Plant Terminal 9444.08km 15 days 4 hours
Gizan 8170.51km 13 days 3 hours
Jeddah Terminal 8793.88km 14 days 3 hours
Jubail Terminal 9450.76km 15 days 4 hours
Qadhimah 8895.86km 14 days 7 hours
Rabigh 8941.34km 14 days 8 hours
Ras al Mishab 9572.02km 15 days 9 hours
Ras Tanura 9391.26km 15 days 2 hours
Source: Sea-Rates, 2016
3.7 Tariffs
Saudi Arabia’s tariffs imposed on South Africa’s export products (HS2) are shown in the table below.
SAUDI ARABIA’S TARIFF IMPOSED ON SOUTH AFRICAN EXPORTS (HS2), 2014
HS CODE
PRODUCT
Total ad valorem
equivalent tariff (%)
HS CODE
PRODUCT
Total ad valorem
equivalent tariff (%)
HS CODE
PRODUCT
Total ad valorem
equivalent tariff (%)
01 Live animals 0 34 Soaps, lubricants, waxes, candles, modelling pastes
5 67 Bird skin, feathers, artificial flowers, human hair
5
02 Meat and edible meat offal 4.3 35 Albuminoidal substances; modified starches; glues; enzymes
5 68 Stone, plaster, cement, asbestos, mica, articles
5
03 Fish, crustaceans, molluscs, aquatic invertebrates
2.9 36 Explosives, pyrotechnics, matches, pyrophorics
5 69 Ceramic products 5
04 Dairy products, eggs, honey, edible animal product
4.9 37 Photographic or cinematographic goods
5 70 Glass and glassware 5
05 Products of animal origin, not elsewhere specified or included
5 38 Miscellaneous chemical products
4.7 71 Pearls, precious stones, metals, coins
3.7
06 Live trees, plants, bulbs, roots, cut flowers
3.5 39 Plastics and articles thereof 5 72 Iron and steel 5
07 Edible vegetables and certain roots and tubers
2.4 40 Rubber and articles thereof 5 73 Articles of iron or steel 5
08 Edible fruit and nuts; peel of citrus fruits or melons
1.4 41 Raw hides and skins (other than furskins) and leather
5 74 Copper and articles thereof
5
09 Coffee, tea, maté and spices
1.2 42 Articles of leather, animal gut, harness, travel goods
5 75 Nickel and articles thereof
5
10 Cereals 0 43 Furskins and artificial fur; manufactures thereof
5 76 Aluminium and articles thereof
5
11 Products of the milling industry; malt; starches; inulin; wheat gluten
2.3 44 Wood and articles of wood; wood charcoal
5 78 Lead and articles thereof
5
12 Oil seed, oleagic fruits, grain, seed, fruit
2 45 Cork and articles of cork 5 79 Zinc and articles thereof
5

15
SAUDI ARABIA’S TARIFF IMPOSED ON SOUTH AFRICAN EXPORTS (HS2), 2014
HS CODE
PRODUCT
Total ad valorem
equivalent tariff (%)
HS CODE
PRODUCT
Total ad valorem
equivalent tariff (%)
HS CODE
PRODUCT
Total ad valorem
equivalent tariff (%)
13 Lac; gums, resins and other vegetable saps and extracts
5 46 Manufactures of plaiting material, basketwork,
5 80 Tin and articles thereof
5
14 Vegetable plaiting materials, vegetable products
5 47 Pulp of wood, fibrous cellulosic material, waste
5 81 Other base metals; cermets; articles thereof
5
15 Animal, vegetable fats and oils, cleavage products
5 48 Paper and paperboard; articles of paper pulp, of paper or of paperboard
5 82 Tools, implements, cutlery, of base metal
5
16 Meat, fish and seafood food preparations
5 49 Printed books, newspapers, pictures
5 83 Miscellaneous articles of base metal
5
17 Sugars and sugar confectionery
0.4 50 Silk 5 84
Nuclear reactors, boilers, machinery and mechanical appliances; parts thereof
4.1
18 Cocoa and cocoa preparations
5 51 Wool, fine or coarse animal hair; horsehair yarn and woven fabric
5 85 Electrical, electronic equipment
2.6
19 Preparations of cereals, flour, starch or milk; pastrycooks' products
3.5 52 Cotton 4.7 86 Railway, tramway locomotives, rolling stock, equipment
5
20 Preparations of vegetables, fruit, nuts or other parts of plants
5 53 Other vegetable textile fibres; paper yarn and woven fabrics of paper yarn
5 87 Vehicles other than railway, tramway
5
21 Miscellaneous edible preparations
4.8 54 Man-made filaments 5 88 Aircraft, spacecraft, and parts thereof
2.1
22 Beverages, spirits and vinegar
4.9 55 Man-made staple fibres 5 89 Ships, boats and floating structures
0.3
23 Residues and waste from the food industries; prepared animal fodder
1.6 56 Wadding, felt, nonwovens, yarns, twine, cordage
5 90 Optical, photo, technical, medical, apparatus
4.1
24 Tobacco and manufactured tobacco substitutes
115.7 57 Carpets and other textile floor coverings
5 91 Clocks and watches and parts thereof
5
25 Salt; sulphur; earths and stone; plastering materials, lime and cement
5 58 Special woven or tufted fabric, lace, tapestry
5 92 Musical instruments; parts and accessories of such articles
5
26 Ores, slag and ash 5 59 Impregnated, coated or laminated textile fabric
5 93 Arms and ammunition; parts and accessories thereof
-
27 Mineral fuels, oils, distillation products
5 60 Knitted or crocheted fabrics 5 94 Furniture, lighting, signs, prefabricated buildings
5
28 Inorganic chemicals, precious metal compound, isotopes
5 61 Articles of apparel and clothing accessories, knitted or crocheted
5 95 Toys, games, sports requisites
5
29 Organic chemicals 3.4 62 Articles of apparel and clothing accessories, not knitted or crocheted
5 96 Miscellaneous manufactured articles
5
30 Pharmaceutical products 0 63 Other made textile articles, sets, worn clothing
5 97 Works of art, collectors' pieces and antiques
5
31 Fertilizers 5 64 Footwear, gaiters and the like; parts of such articles
5 - -
32 Tanning, dyeing extracts, tannins, derivatives, pigments
5 65 Headgear and parts thereof 5 - -
33 Essential oils, perfumes, cosmetics, toiletries
5 66 Umbrellas, walking-sticks, seat-sticks, whips
4.7 - -
Source: Market Access Map, 2016
NOTE: Exporters should not take the HS2 tariff as conclusive and as the actual tariff that will be applied to the exported product.
The tariffs indicated above are average tariffs and for products within the category it may be higher or lower than indicated. Where
the tariff is zero it can be assumed that there is zero tariff applicable to all products within that HS code. Tariffs are determined
according to the importing country’s national tariff line from the HS6 level and upwards. Exporters are advised to visit
www.macmap.org to determine the exact tariff applicable to the product at HS6.

16
3.8 Trade regulations, Customs and Standards
Import Requirements and Documentation
Under its WTO obligations, Saudi Arabia has committed to implement a transparent and predictable import
licensing system. The following documents are required for exporting goods to Saudi Arabia:
certificate of origin;
commercial invoice (in triplicate) which must state the country of origin, name of the carrier, brand and
number of goods, and description of the goods including weight and value;
a clean bill of lading or airway bill;
documents indicating compliance with health regulations, if applicable;
insurance documents, if shipments are sent CIF;
packing list; and
certificate of conformity with applicable Saudi Arabian standards, if available.
The original documents must be accompanied by an Arabic translation of a radiation certificate, if applicable.
Labelling and Marking
Labelling and marking requirements are compulsory for any products exported to Saudi Arabia. Labelling is
particularly important for companies marketing food products, personal care products, health care products, and
pharmaceuticals. Labels must be in Arabic for any imported foodstuff item, which should basically reveal the same
information on the container as in the foreign language.
The product(s) must have a label or sticker showing the statutory information such as
product name,
country of origin,
producer’s name and address,
production and expiry/use by dates,
in Arabic and English languages (samples imported must be labelled at least in English).
Product Certification
The Saudi Arabian Standards Organization SASO has its own certification organization for locally manufactured
products, as several SASO employees have been certified to work as professional auditors in conformance with
ISO 9000 series standards. For imported products, the Ministry of Commerce and Industry will implement the CoC
program, which should be abolished under Saudi Arabia’s WTO accession commitments.
Prohibited and Restricted Imports
There are health and sanitation regulations for all imported foods. Importing the following products requires special
approval by Saudi Arabian authorities: agriculture seeds, live animals, books, periodicals, movies, and tapes;
religious books and tapes; chemicals and harmful materials; pharmaceutical products; wireless equipment, and
radio controlled model airplanes; horses; products containing alcohol (e.g., perfume); natural asphalt; and
archaeological artifacts.
Saudi law prohibits importation of the following products:
weapons,
alcohol,
narcotics,
pork,
pornographic materials,
distillery equipment,
retreaded or used tires,
used clothing and
certain sculptures.

17
4. FDI
4.1 Inward FDI to Saudi Arabia
Between January 2003 and July 2015 a total of 1,217 FDI projects were recorded into Saudi Arabia. These projects
represent a total capital investment of ZAR1,785.79bn which is an average investment of ZAR1,466.98m per
project. During the period, a total of 169,392 jobs were created.
Source: FDI Intelligence, 2016
The figures below shows Saudi Arabia’s sector global inward FDI for the period 2003 to July 2015 by number of
projects and capex. In terms of sectors by projects most investments were in the following:
Business services sector received the largest share in terms of projects accounting for 11%,
Financial services sector 9% of projects and,
Textiles accounting for 8.7% of projects.
In terms of sectors capex most investments were in the following:
Chemicals sector received the largest share in terms of capex accounting for 31%,
Coal, oil and natural gas sector accounting for 25%, and
Real estate accounting for 13% capex.
2003 2004 2005 2006 2007 2008 2009 2010 2011 2012 2013 2014 2015
Capex (ZARm) 21 223 160 09 36 312 226 36 99 748 435 43 170 85 97 430 189 25 91 911 74 535 116 85 65 776
Projects 31 35 58 95 56 109 144 120 167 138 127 88 49
20
40
60
80
100
120
140
160
180
0
50 000
100 000
150 000
200 000
250 000
300 000
350 000
400 000
450 000
500 000
Pro
jects
Valu
e (
ZA
Rm
)
INWARD FDI INTO SAUDI ARABIA, 2003-JULY 2015

18
Source: FDI Intelligence, 2016
The United States was the largest source market for inward FDI into Saudi Arabia in terms of projects, with 232
investment projects, accounting for 19% between 2003 and July 2015. The UAE and the United Kingdom were
ranked second and third accounting for 212% and 90% respectively. Other top markets are France, India and
Japan.
TOP SOURCE MARKETS FOR FDI TO SAUDI ARABIA’S, 2003-JULY 2015
RANK SOURCE
COUNTRY PROJECTS
% PROJECTS
CAPEX (ZARm)
% CAPEX COMPANIES % COMPANIES
1 United States 232 19.06% 452 519.7 25.3% 182 20.16%
2 UAE 212 17.42% 158 981.7 8.9% 138 15.28%
3 UK 90 7.40% 36 259.6 2.0% 75 8.31%
4 France 69 5.67% 236 697.4 13.3% 44 4.87%
5 India 63 5.18% 73 460.1 4.1% 52 5.76%
6 Japan 47 3.86% 186 460.5 10.4% 37 4.10%
7 Germany 42 3.45% 45 662.5 2.6% 35 3.88%
8 Netherlands 37 3.04% 91 605.1 5.1% 20 2.21%
9 Spain 36 2.96% 3 790.5 0.2% 26 2.88%
10 Switzerland 35 2.88% 22 169.8 1.2% 24 2.66%
TOTAL 1 217 100.00% 1 785 791.7 100.00% 903 100.00%
Source: FDI Intelligence, 2014
Business Services11.3% Financial
Services9.2%
Textiles8.7%
Industrial Machinery,
Equipment & Tools7.9%
Hotels & Tourism
6.4%
Software & IT services
5.8%
Consumer Products
5.6%
Real Estate5.3%
Communications
4.4%
Chemicals4.3%
Other sectors31.1%
INWARD FDI INTO SAUDI ARABIA SECTORS BY PROJECTS, 2003-JULY 2015
Chemicals30.7%
Coal, Oil and Natural Gas
25.3%Real Estate
12.7%
Hotels & Tourism
8.0%
Metals7.9%
Automotive OEM2.2%
Plastics1.7%
Financial Services
1.3%
Industrial Machinery, Equipment & Tools
1.1%
Building & Construction
Materials1.0%
Other sectors8.1%
INWARD FDI INTO SAUDI ARABIA SECTORS BY CAPEX, 2003-JULY 2015
19
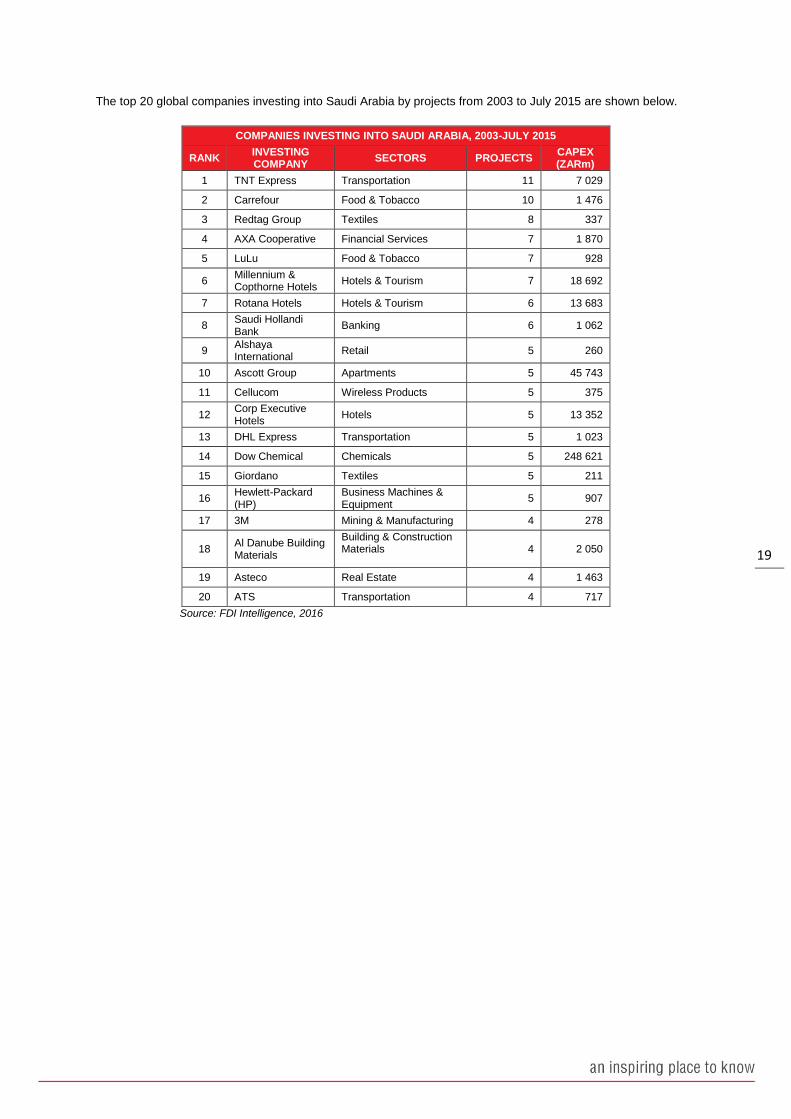
The top 20 global companies investing into Saudi Arabia by projects from 2003 to July 2015 are shown below.
COMPANIES INVESTING INTO SAUDI ARABIA, 2003-JULY 2015
RANK INVESTING COMPANY
SECTORS PROJECTS CAPEX (ZARm)
1 TNT Express Transportation 11 7 029
2 Carrefour Food & Tobacco 10 1 476
3 Redtag Group Textiles 8 337
4 AXA Cooperative Financial Services 7 1 870
5 LuLu Food & Tobacco 7 928
6 Millennium & Copthorne Hotels
Hotels & Tourism 7 18 692
7 Rotana Hotels Hotels & Tourism 6 13 683
8 Saudi Hollandi Bank
Banking 6 1 062
9 Alshaya International
Retail 5 260
10 Ascott Group Apartments 5 45 743
11 Cellucom Wireless Products 5 375
12 Corp Executive Hotels
Hotels 5 13 352
13 DHL Express Transportation 5 1 023
14 Dow Chemical Chemicals 5 248 621
15 Giordano Textiles 5 211
16 Hewlett-Packard (HP)
Business Machines & Equipment
5 907
17 3M Mining & Manufacturing 4 278
18 Al Danube Building Materials
Building & Construction Materials
4 2 050
19 Asteco Real Estate 4 1 463
20 ATS Transportation 4 717
Source: FDI Intelligence, 2016

20
4.2 Outward FDI from Saudi Arabia
Between January 2003 and July 2015 a total of 534 FDI projects were recorded from Saudi Arabia. These projects
represent a total capital investment of ZAR487.47bn which is an average investment of ZAR912.76m per project.
During the period, a total of 97,525 jobs were created.
Source: FDI Intelligence, 2016
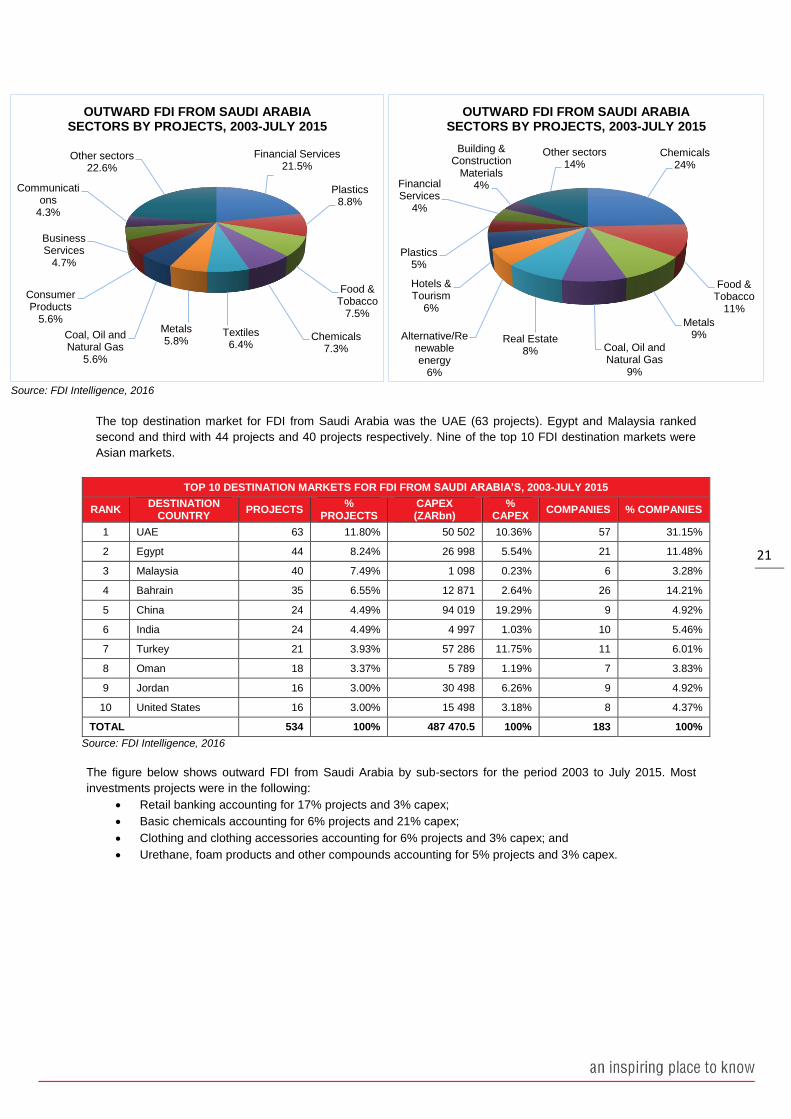
The figure below shows Saudi Arabia’s global outward FDI by sector for the period 2003 to July 2015. In terms of
projects the most investments were in the following:
Financial services sector received the largest share accounting for 21%,
Plastics 9% of projects,
Food and tobacco sector accounting for 8% projects.
In terms of capex, the most investments were in the following:
Chemicals sector received the largest share in terms of capex accounting for 24%,
Food and tobacco accounting for 11% of capex,
Coal, oil and natural gas sector accounting for 9% of capex.
2003 2004 2005 2006 2007 2008 2009 2010 2011 2012 2013 2014 2015
Capex (ZARm) 10 663 65 593 21 474 62 768 22 047 57 371 69 671 16 814 65 928 23 817 32 235 22 571 16 519
Projects 15 22 17 60 55 52 32 39 70 80 39 43 10
10
20
30
40
50
60
70
80
90
0
10 000
20 000
30 000
40 000
50 000
60 000
70 000
80 000
Pro
jects
Valu
e (
ZA
Rm
)
OUTWARD FDI FROM SAUDI ARABIA, 2003-JULY 2015
21
Source: FDI Intelligence, 2016
The top destination market for FDI from Saudi Arabia was the UAE (63 projects). Egypt and Malaysia ranked
second and third with 44 projects and 40 projects respectively. Nine of the top 10 FDI destination markets were
Asian markets.
TOP 10 DESTINATION MARKETS FOR FDI FROM SAUDI ARABIA’S, 2003-JULY 2015
RANK DESTINATION
COUNTRY PROJECTS
% PROJECTS
CAPEX (ZARbn)
% CAPEX
COMPANIES % COMPANIES
1 UAE 63 11.80% 50 502 10.36% 57 31.15%
2 Egypt 44 8.24% 26 998 5.54% 21 11.48%
3 Malaysia 40 7.49% 1 098 0.23% 6 3.28%
4 Bahrain 35 6.55% 12 871 2.64% 26 14.21%
5 China 24 4.49% 94 019 19.29% 9 4.92%
6 India 24 4.49% 4 997 1.03% 10 5.46%
7 Turkey 21 3.93% 57 286 11.75% 11 6.01%
8 Oman 18 3.37% 5 789 1.19% 7 3.83%
9 Jordan 16 3.00% 30 498 6.26% 9 4.92%
10 United States 16 3.00% 15 498 3.18% 8 4.37%
TOTAL 534 100% 487 470.5 100% 183 100%
Source: FDI Intelligence, 2016
The figure below shows outward FDI from Saudi Arabia by sub-sectors for the period 2003 to July 2015. Most
investments projects were in the following:
Retail banking accounting for 17% projects and 3% capex;
Basic chemicals accounting for 6% projects and 21% capex;
Clothing and clothing accessories accounting for 6% projects and 3% capex; and
Urethane, foam products and other compounds accounting for 5% projects and 3% capex.
Financial Services21.5%
Plastics8.8%
Food & Tobacco
7.5%
Chemicals7.3%
Textiles6.4%
Metals5.8%
Coal, Oil and Natural Gas
5.6%
Consumer Products
5.6%
Business Services
4.7%
Communications
4.3%
Other sectors22.6%
OUTWARD FDI FROM SAUDI ARABIA SECTORS BY PROJECTS, 2003-JULY 2015
Chemicals24%
Food & Tobacco
11%
Metals9%
Coal, Oil and Natural Gas
9%
Real Estate8%
Alternative/Renewable energy
6%
Hotels & Tourism
6%
Plastics5%
Financial Services
4%
Building & Construction
Materials4%
Other sectors14%
OUTWARD FDI FROM SAUDI ARABIA SECTORS BY PROJECTS, 2003-JULY 2015

22
Source: FDI Intelligence, 2016
The top 20 global companies investing from Saudi Arabia by projects from 2003 to 2013 are shown below.
COMPANIES INVESTING FROM SAUDI ARABIA, 2003-2013
RANK INVESTING COMPANY
SECTOR PROJECTS CAPEX (ZARm)
1 Saudi Basic Industries (SABIC)
Plastics 42 57 764
2 Fawaz Alhokair Group Textiles 38 525
3 Al Rajhi Bank Financial Services 33 9 299
4 SABIC Innovative Plastics
Plastics 19 6 238
5 Albaraka Banking Group (ABG)
Financial Services 13 2 016
6 Albaraka Turk Financial Services
13 8 895
7 Saudi Aramco Coal, Oil and Natural Gas
12 2 107
8 Shifa Al Jazeera Medical Group
Medical 11 7 045
9 Construction Products Holding Company (CPC)
Construction 11 60
10 E-Holidays Hotels & Tourism 9 1 729
11 Islamic Development Bank (IDB)
Banking 8 601.3
12 Albaraka Bank Egypt Financial Services
8 5 262.00
17.8%
6.4%
6.2%
5.1%
4.1%
3.2%
2.6%
2.2%
2.2%
2.2%
2.1%
1.9%
1.5%
3.1%
20.6%
3.4%
3.1%
1.3%
1.0%
0.5%
1.2%
1.0%
1.4%
0.3%
0.4%
4.9%
0.0% 5.0% 10.0% 15.0% 20.0% 25.0%
Retail banking
Basic chemicals
Clothing & clothing accessories
Urethane, foam products & other compounds
Other petroleum & coal products
Corporate & investment banking
Travel arrangement & reservation services
Architectural & structured metals
Cosmetics, perfume, personal care & householdproducts
Wireless telecommunication carriers
Sporting goods, hobby, books & music
Food & Beverage Stores (Food & Tobacco)
Accommodation
SAUDI ARABIA OUTWARD FDI BY SUBSECTORS (% SHARE), 2003-JULY 2015
% Capex % Projects

23
COMPANIES INVESTING FROM SAUDI ARABIA, 2003-2013
RANK INVESTING COMPANY
SECTOR PROJECTS CAPEX (ZARm)
13 Al-Tuwairqi Group (ATG)
Metals 8 2 183.80
14 Amouage (Oman Perfumery)
Consumer Products 8 3 715.00
15 Aramco Overseas Coal, Oil and Natural Gas
8 18 110.60
16 Savola Financial Services 7 2 016.40
17 Bintel Communications 6 4 576.00
18 Al Hokair Food & Tobacco 5 393.6
19 Albaraka Bank Algeria Financial Services 5 597.2
20 Amiantit Materials 5 2 323.20
Total 477 261 549
Source: FDI Intelligence, 2016

24
4.3 South African FDI with Saudi Arabia
Between January 2003 and July 2015 a total of 2 FDI projects were recorded from South Africa to Saudi Arabia.
These projects represent a total capital investment of ZAR399.55m which is an average investment of ZAR200.36m
per project. During the period, a total of 39 jobs were created.
SOUTH AFRICA FDI TO SAUDI ARABIA, 2003-JULY 2015
DATE INVESTING
COMPANY
SOURCE
STATE INDUSTRY SECTOR
SUB-SECTOR INDUSTRY
ACTIVITY
CAPEX
(ZARm) JOBS
Nov 2007 Dimension Data
Holdings (DiData) Gauteng
Software & IT services
Computer facilities
management services
Sales, Marketing &
Support 68 21
Jul 2006 Gensec Property
Services Gauteng Real Estate Real estate services
Sales, Marketing &
Support 332 18
TOTAL 400 39
Source: FDI Intelligence, 2016
Between January 2003 and July 2015 a total of 5 FDI projects were recorded from Saudi Arabia to South Africa.
These projects represent a total capital investment of ZAR20.70bn which is an average investment of
ZAR4,140.81m per project. During the period, a total of 385 jobs were created.
In 2010 - Saudi Basic Industries (SABIC) a plastics manufacturer from Saudi Arabia invested in the city of Cape
Town in the plastics sector in a sales, marketing and support project valued at ZAR23bn.The facility will allow the
company to strengthen its existing operations locally and improve its sales in neighbouring countries, bringing
SABIC closer to its customers. It will also support the company's existing distribution centre in the country.
SAUDI ARABIA FDI TO SOUTH AFRICA, 2003-JULY 2015
DATE INVESTING
COMPANY
DESTINATION
STATE INDUSTRY SECTOR SUB-SECTOR
INDUSTRY
ACTIVITY
CAPEX
(ZARm) JOBS
Jan 2015 ACWA Power
International Northern Cape
Alternative/Renewable energy
Solar electric power Electricity 14 060 216
Jun 2014
Altaaqa Global
CAT Rental
Power
Gauteng Industrial Machinery, Equipment & Tools
Power transmission
equipment
Sales, Marketing &
Support 34 17
Sep 2013 ACWA Power International
Northern Cape Alternative/Renewable energy
Solar electric power Electricity 6 151 60
Sep 2010 Saudi Basic Industries (SABIC)
Western Cape Plastics Urethane, foam products & other compounds
Sales, Marketing & Support
23 12
Apr 2008 I2 (IICC) Gauteng
Communications Wireless telecommunication carriers
Headquarters
432 80
TOTAL 20 702 385
Source: FDI Intelligence, 2016

25
5. Tourism
5.1 Saudi Arabia Trends and Travel Patterns
Saudi Arabia has a relatively large population of around 27.7 million and there is a strong tradition of domestic
travel in the country. Saudi travellers are lauded as amongst the highest spending globally, with government reports
stating that Saudi travellers spend over USD14bn overseas annually. The government is keen to keep more of this
spending at home and has some USD11.6bn of tourist projects planned or underway in order to encourage more
local travel.
Outbound tourism is expected to increase significantly over the next five years through to 2020 with outbound travel
increasing from 11.7mn in 2016 to 14.8mn in 2020.
5.2 Saudi Arabian Tourist Arrivals into South Africa
The graph below depicts total tourist arrivals from Saudi Arabia into South Africa from 2013 to 2014. Saudi Arabia
tourist arrivals into South Africa increased by 5% from 6251 tourists in 2013 to 6 545 tourists in 2014. No data is
available for Saudi Arabian tourist arrivals into the Western Cape due to an insufficient sample size.
Source: SATourism, 2016
*Note: Statistics SA made changes to the release of its Tourism & Migration reports in 2014 and now no longer report on transit
arrivals. As a result of this change, the weighting methodology has been revised and the results are now not comparable to
data prior to 2013. 2014 represents the beginning of a new series of data.
For more information on this publication and other Wesgro publications please contact [email protected]. For more
publications like this visit the Wesgro publications portal on our website at http://wesgro.co.za/publications
2013 2014
Tourist Arrivals 6 251 6 545
6 100
6 150
6 200
6 250
6 300
6 350
6 400
6 450
6 500
6 550
6 600
Tourist A
rriv
als
SAUDI ARABIA TOURIST ARRIVALS TO SOUTH AFRICA, 2013-2014