Embed Size (px)
Citation preview
Satellite Observations of Ocean Winds and Waves
Alexander Babanin, Ian Young*, Stefan Zieger and Qingxiang Liu
Centre for Ocean Engineering, Science and Technology Swinburne University, Melbourne, Australia *Australian National University
Satellite Oceanography Users Workshop Melbourne, Australia
9 November 2015

Motivation
• Satellite-borne devices can measure the global wind, wave, ice and other air-sea interaction properties with global coverage and accuracy comparable to buoy observations
• They have been flown for decades and allow to investigate trends and long-term oscillations
• Waves, ocean winds, sea ice can serve as climate proxies, their means and extremes change
• Problems: invalid measurements must be removed first – land, rain, ice

Young, I.R., Babanin, A.V., “A global satellite altimeter database for ocean engineering applications”, ARC Linkage and RPS MetOcean (WA)
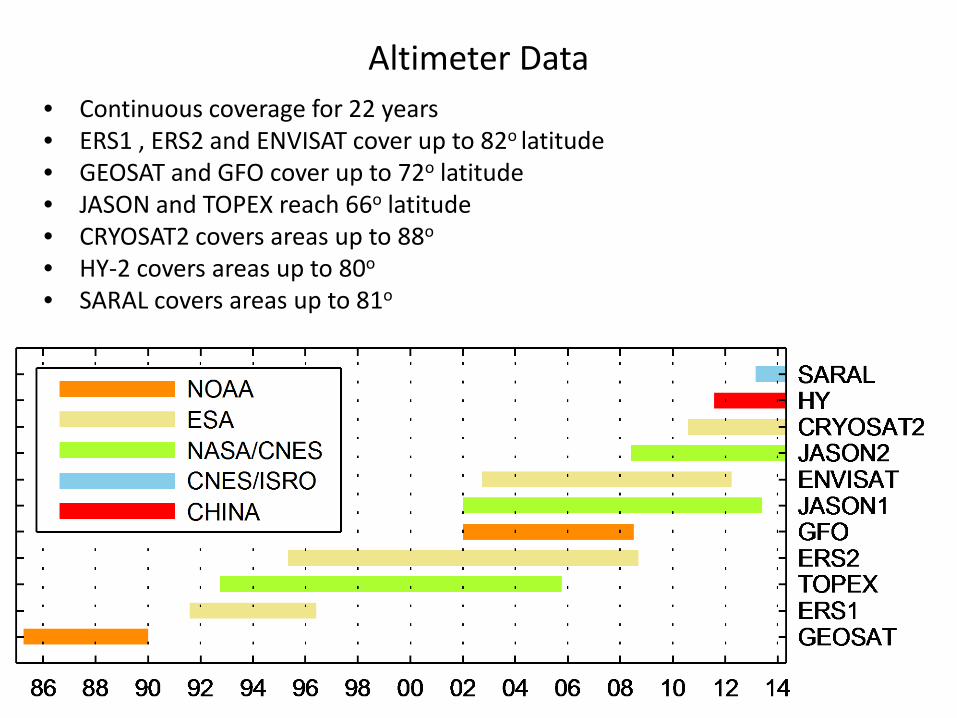
Altimeter Data • Continuous coverage for 22 years • ERS1 , ERS2 and ENVISAT cover up to 82o latitude • GEOSAT and GFO cover up to 72o latitude • JASON and TOPEX reach 66o latitude • CRYOSAT2 covers areas up to 88o
• HY-2 covers areas up to 80o
• SARAL covers areas up to 81o

Young, Zieger, Babanin, 2011, Science

Swell attenuation Young, Babanin, Zieger, 2013, JPO
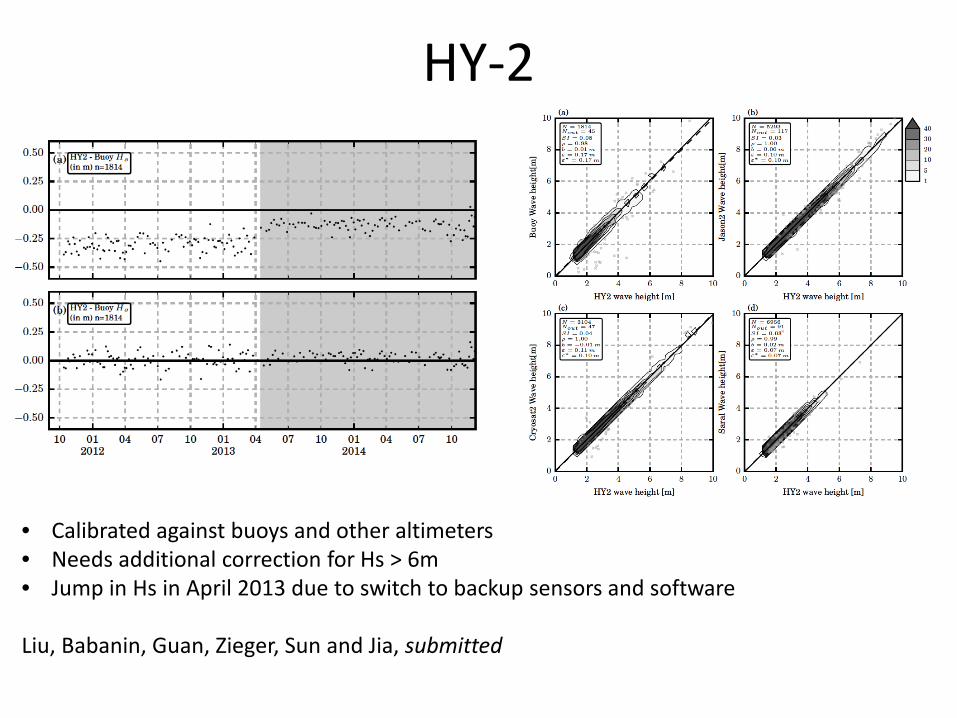
HY-2
• Calibrated against buoys and other altimeters • Needs additional correction for Hs > 6m • Jump in Hs in April 2013 due to switch to backup sensors and software Liu, Babanin, Guan, Zieger, Sun and Jia, submitted
Young, I.R., Babanin, A.V., Hemer, M.A. (CSIRO), Aster, R.C. (New Mexico Institute of Mining and Technology, USA), “Global trends in oceanic wind speed and wave height”, ARC Discovery DP130100215

Aims: • Compile global database from all platforms • Wind and wave conditions • Fully calibrated and independently validated • Cross-validated between platforms
Uses • Global climatology • Long terms trends (30 years) • Extreme value estimation (1:100 year
estimates) • Trends in extremes?

Altimeter
• Nadir looking • Hs and U10 from waveform
Radiometer
• U10 from brightness temp • 1000 km swath at 25 km resolution

Scatterometer
• U10 direction from multiple
looks • 1000km swath at 25km
resolution
SAR
• Imaging radar • Full spectrum at 200km
spacing

Satellite data set over 30 years
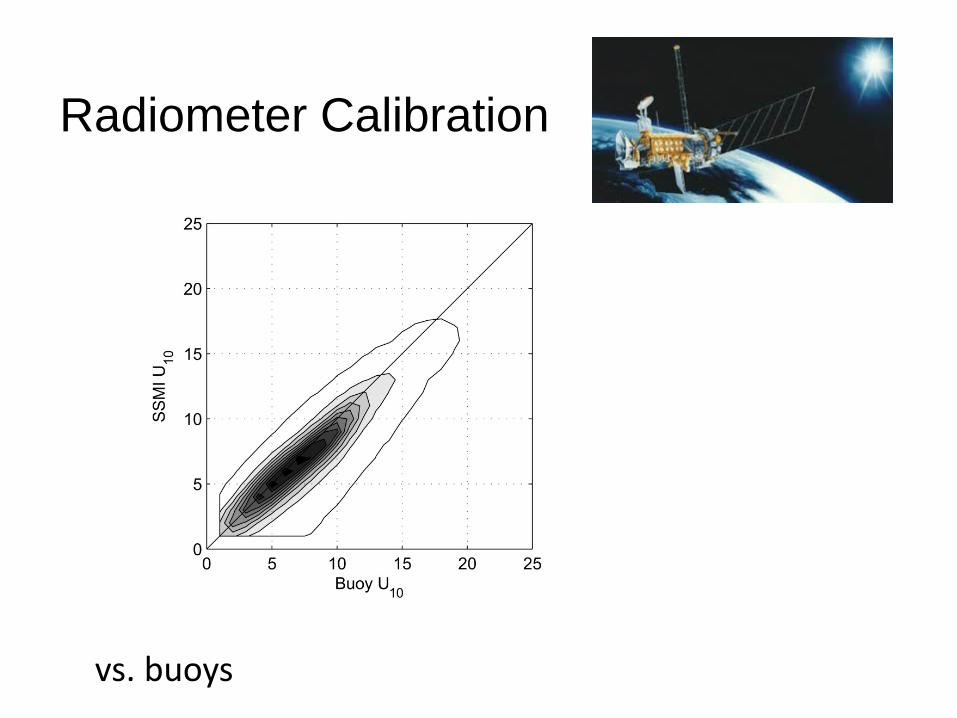
Radiometer Calibration
vs. buoys

Other evidence of a global increase in wind speed and wave height
Altimeter
SSMI
Global average trend in U10
Young, Babanin, Zieger, 2011, Science

Wind Trends, by month (SSM/I)
Zieger, Babanin, Young, 2014, DSR1

Babanin, A.V., Young. I.R., Zieger, S., “Wave climate in the marginal ice zones of Arctic Seas, observations and modelling”, Office of Naval Research Grant Number N00014-13-1-0278, USA

Motivation • Sea ice has been retreating in summer months
in the Arctic (since 2006?) • Waves become an issue: navigation, air-sea
interactions, coastal erosion etc. • Wave climate and trends unknown • Wave modelling is problematic • Notably, ice cover is extending in Antarctic • At high latitudes, winds have been shifting
polarwards
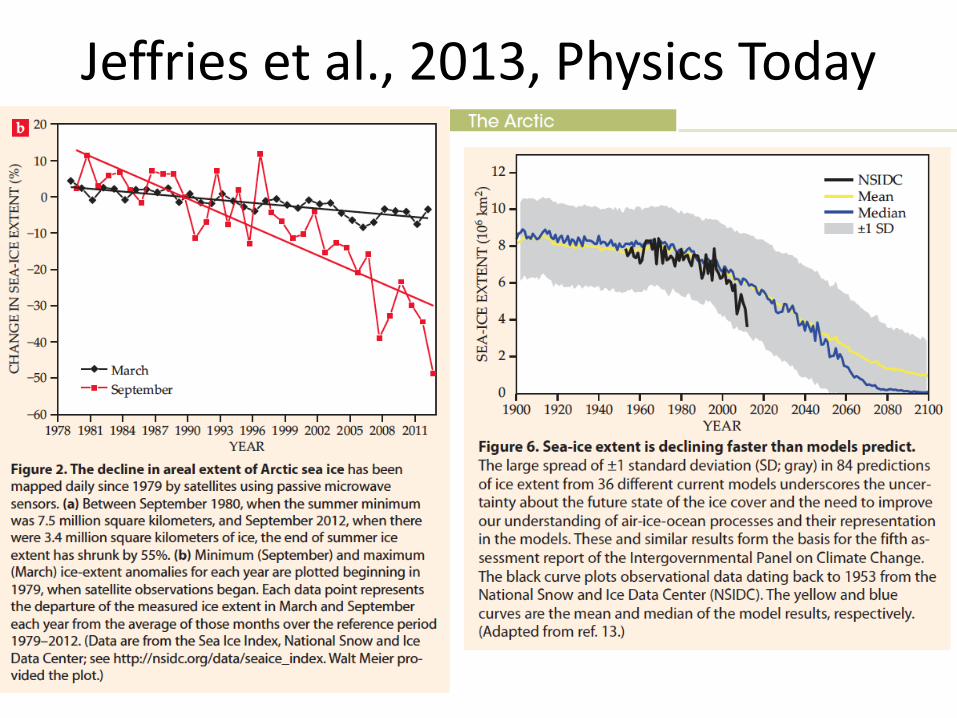
Jeffries et al., 2013, Physics Today

September. Simulated relative changes (%) in mean wind speed at 10 m height (normalized to mean climatological for 1980-1999) and (m) in significant wave height , for the period 2046-2065 with respect to reference period 1980-1999. Contours indicate mean climatological values of for 1980-1999. Coupled climate, ice and wave models
Khon, Mokhov, Pogarskiy, Babanin, Dethloff, Rinke, Matthes, 2013, GRL

Sea/Ice Classification • needs to be based on altimeter measurements • Tran et al. 2009 suggested a three-parameter cluster
algorithm to brightness temperature data and backscatter data
• brightness data are not always available • Laxon (1990) and Rinne and Skourup (2012) is
approach is a one-parameter classification algorithm March 2004
September 2007

• CRYOSAT2 L2 product contains no wave height when altimeter in SAR/SARIN mode
• Use waveform retracking from L1b FDM products
mean wave height (m) September 2014
CRYOSAT2 modes: LRM (low rate mode, or conventional altimeter mode), SAR (synthetic aperture radar), and SARIN (SAR interferometry)
Sea State DRI CRYOSAT2

Ice trends Sea State DRI

Waves, 99th, 2002-2014 Sea State DRI

Waves, 99th, 2002-2006 Sea State DRI

Waves, 99th, 2006-2014 Sea State DRI


27
Conclusions • Satellite data can clearly give global
• Climatology • Trends • Extremes
• This is for wind speed, wave height, ice cover
and various related metocean properties