Embed Size (px)
DESCRIPTION
Satellite Imagery Interpretation. The SKY. Biggest lab in the world. Available to everyone. We view from below. Satellite views from above. Why Are Satellites Important?. Monitor atmosphere, land surface, and oceans at multiple scales using a single instrument. - PowerPoint PPT Presentation
Citation preview
1
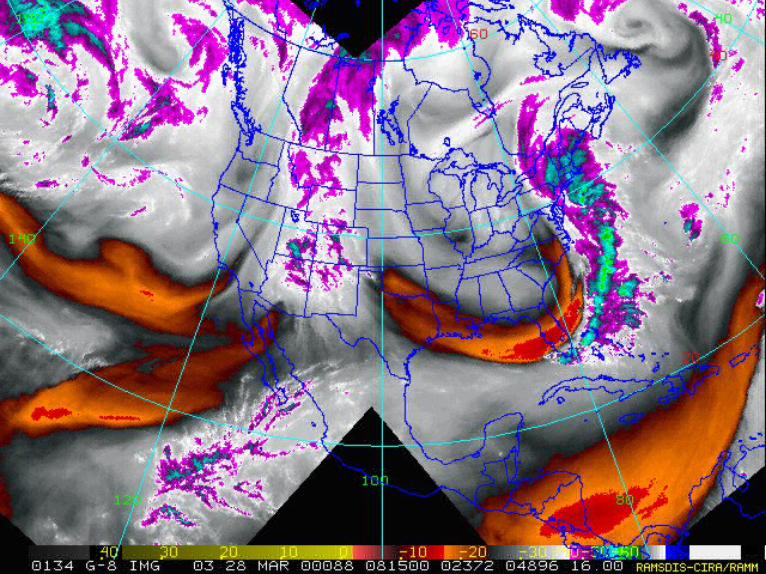
Satellite Imagery Interpretation
2
The SKY
• Biggest lab in the world.
• Available to everyone.
• We view from below.
• Satellite views from above.
3
4
Why Are Satellites Important?
• Monitor atmosphere, land surface, and oceans at multiple scales using a single instrument.
• Consistent global, high-resolution coverage over oceans, rugged terrain, and sparsely populated regions.
• Another observed data set in forecasters toolbox to help solve meteorology and hydrology problems.
5
Satellite Types• Geostationary:
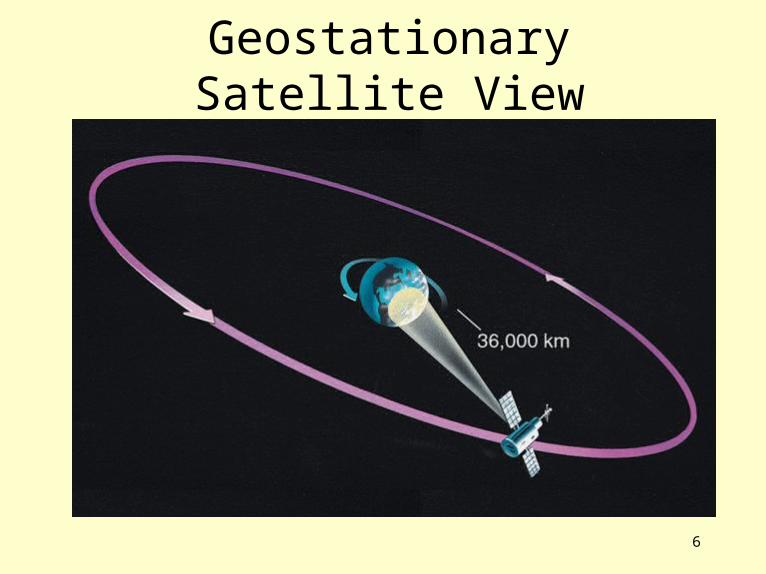
Same position near equator – same rotation speed as earth. Constant height – 36000 km (22,400 mi). Resolution - 1 km visible to 4-8 km IR and H2O channels.
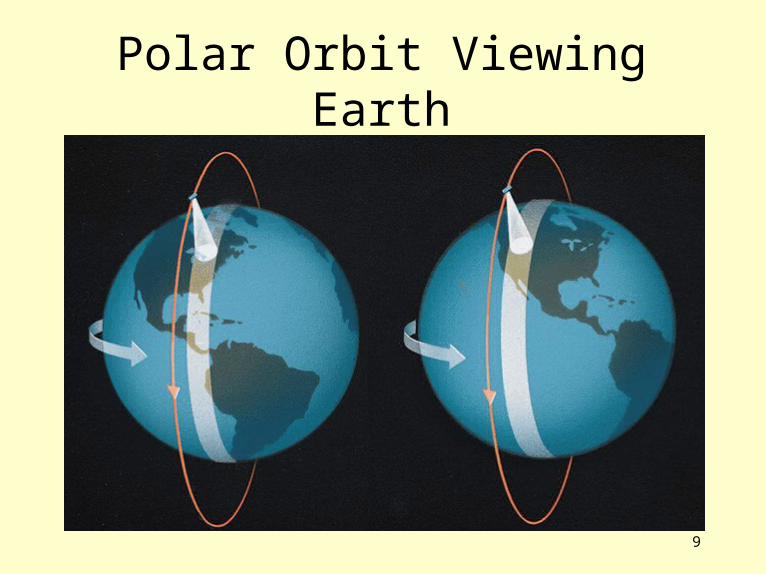
• Polar Orbiting: Every orbit passes over the poles. Height around 850 km Scan earth in 2600 km wide swaths View same location twice at equator; overlaps toward
converging longitudes at poles. Resolution – 250 m (4 times more detail than GOES).
6
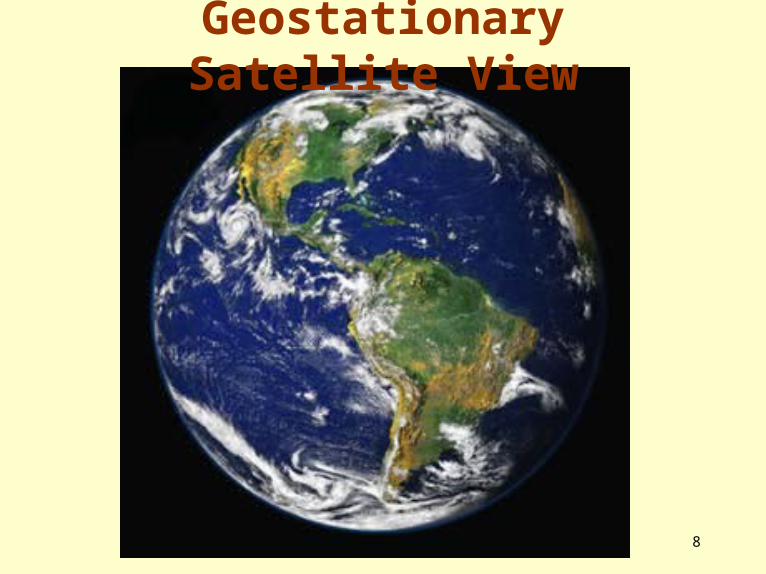
Geostationary Satellite View
7
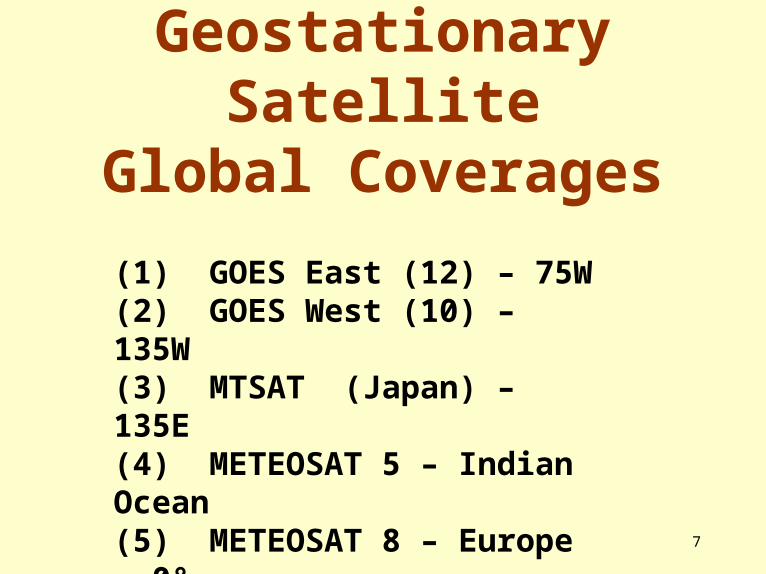
Geostationary SatelliteGlobal Coverages
(1) GOES East (12) – 75W(2) GOES West (10) – 135W(3) MTSAT (Japan) – 135E(4) METEOSAT 5 – Indian Ocean(5) METEOSAT 8 – Europe - 0°
8
Geostationary Satellite View
9
Polar Orbit Viewing Earth
10
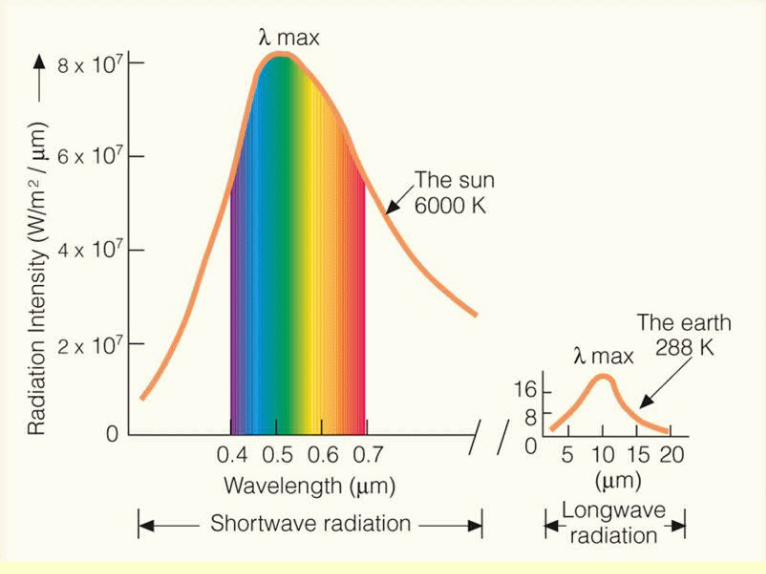
Satellite Radiometers
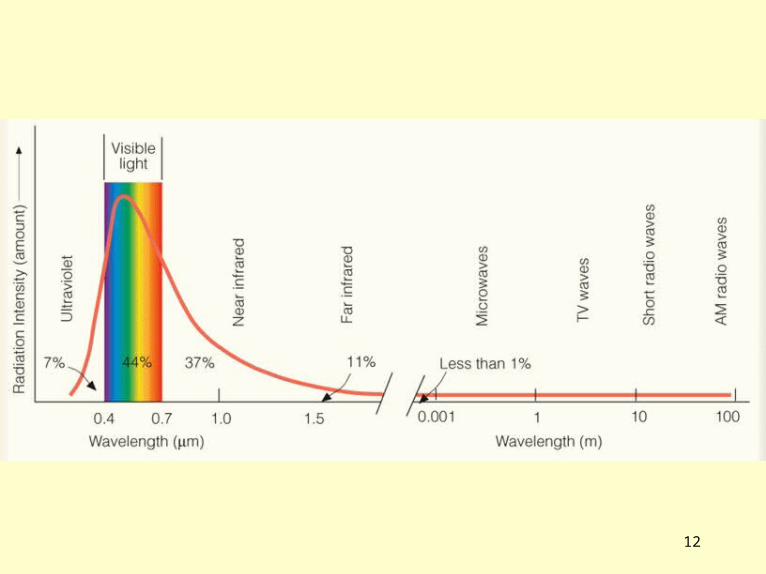
• Measure radiation of different wavelengths in discrete intervals
• Intervals are called windows, channels or spectral bands
• GOES measures five spectral bands; one visible and four IR
• Use mirrors to scan a region• Transmit digital data to earth for processing
11
12
13
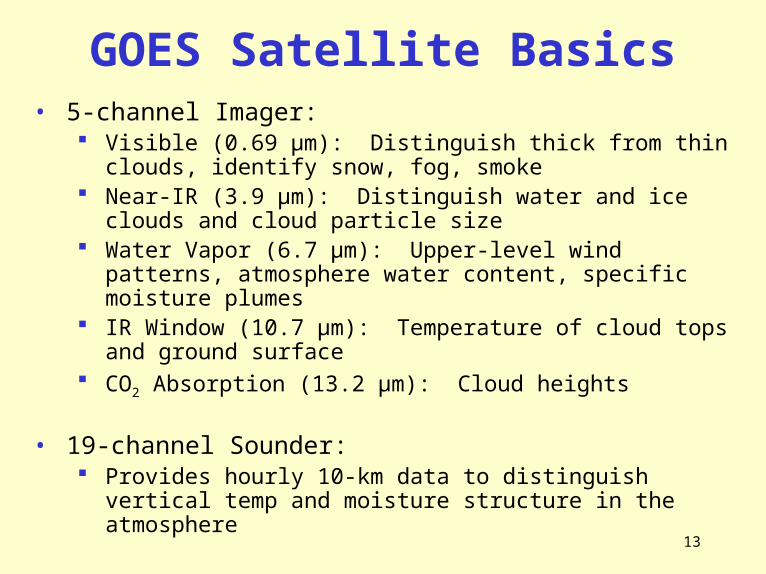
GOES Satellite Basics• 5-channel Imager:
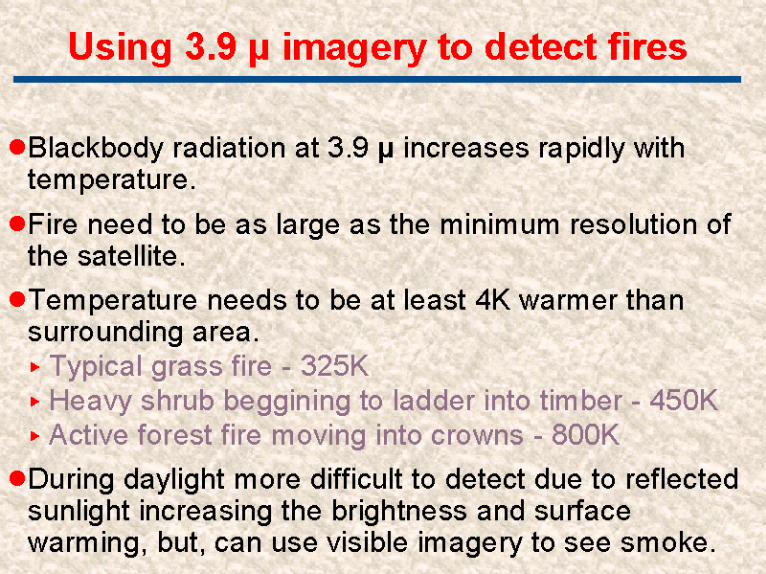
Visible (0.69 μm): Distinguish thick from thin clouds, identify snow, fog, smoke
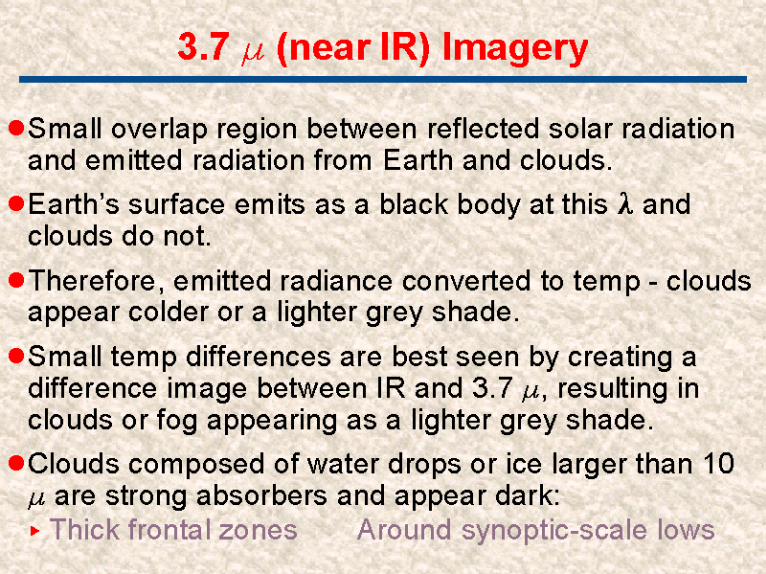
Near-IR (3.9 μm): Distinguish water and ice clouds and cloud particle size
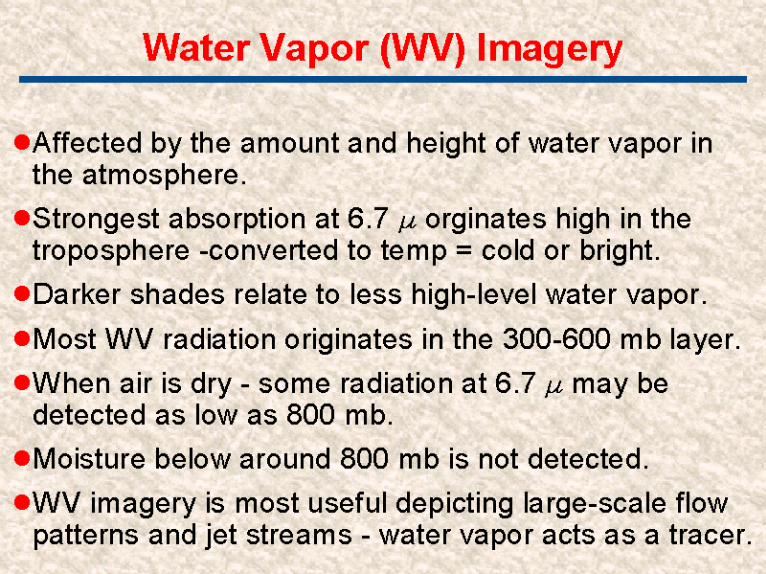
Water Vapor (6.7 μm): Upper-level wind patterns, atmosphere water content, specific moisture plumes
IR Window (10.7 μm): Temperature of cloud tops and ground surface
CO2 Absorption (13.2 μm): Cloud heights
• 19-channel Sounder: Provides hourly 10-km data to distinguish vertical temp and
moisture structure in the atmosphere
14
15
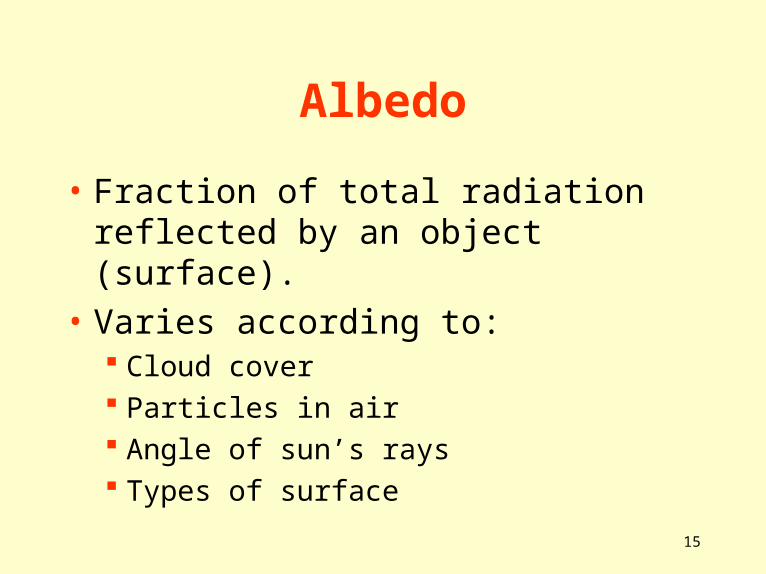
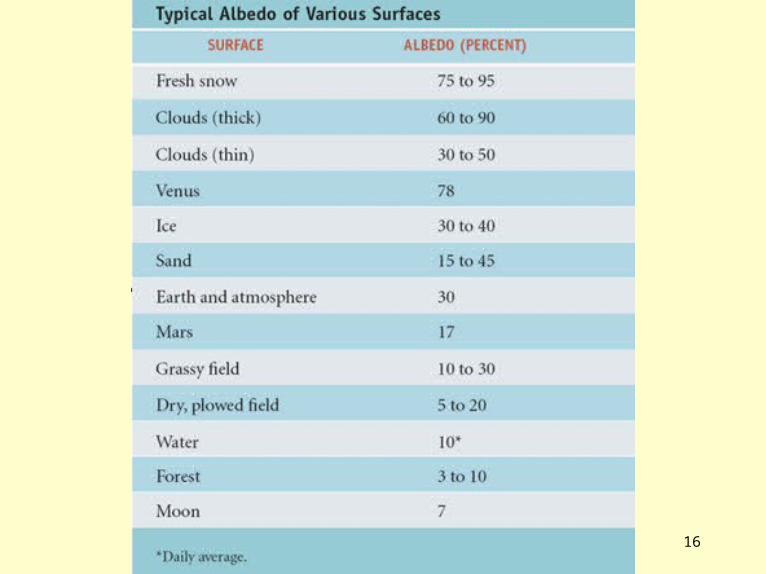
Albedo
• Fraction of total radiation reflected by an object (surface).
• Varies according to: Cloud cover Particles in air Angle of sun’s rays Types of surface
16
17
18
19
20
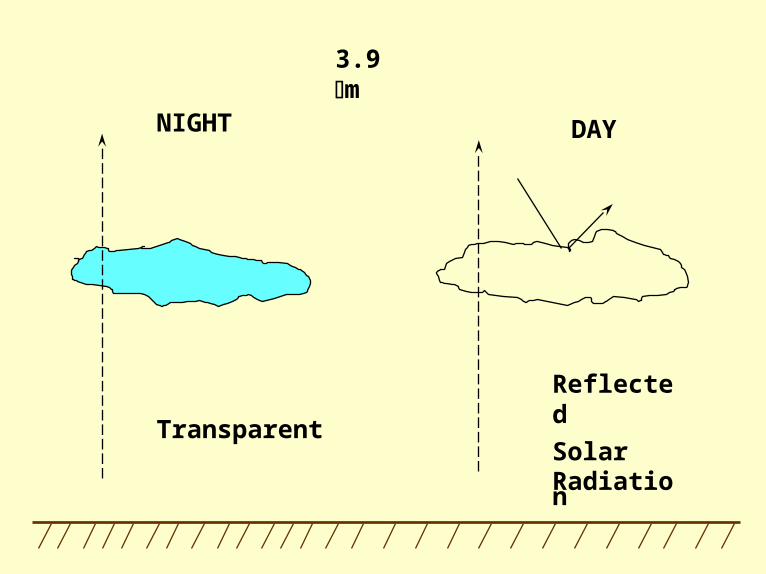
3.9 m
NIGHT DAY
Transparent
Reflected SolarRadiation
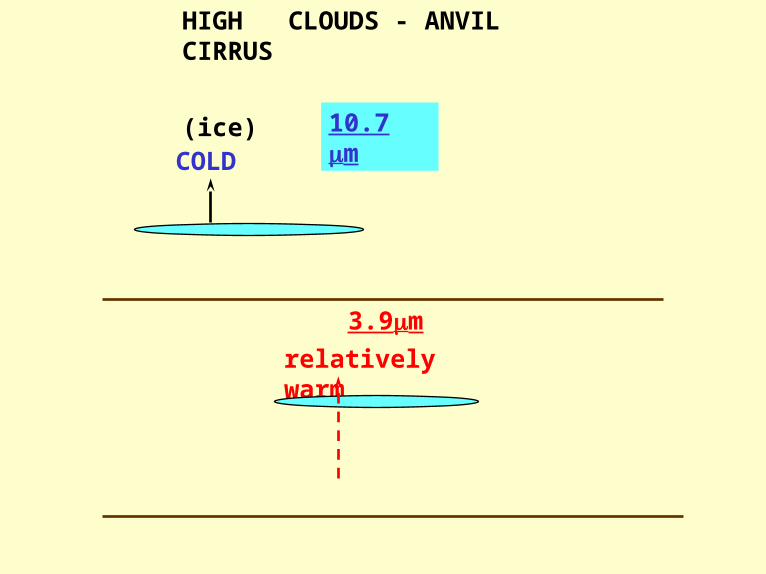
HIGH CLOUDS - ANVIL CIRRUS
(ice)
10.7 m
COLD
3.9m
relatively warm
23
24
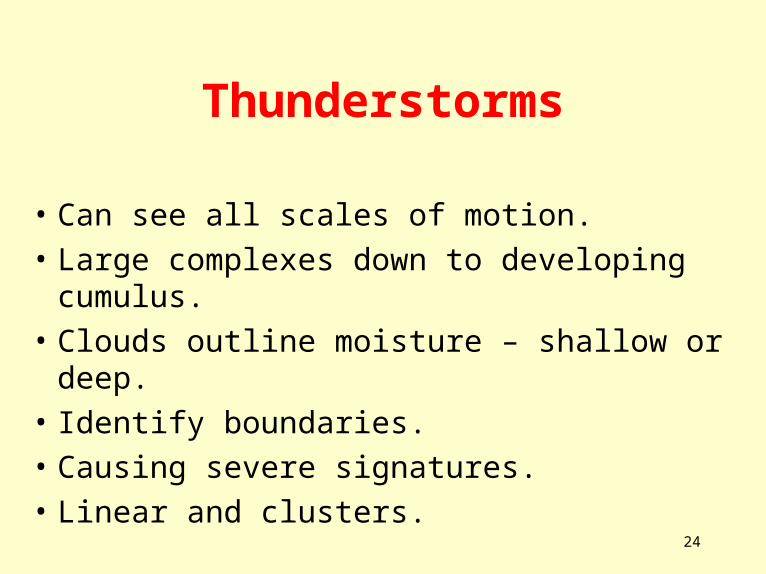
Thunderstorms
• Can see all scales of motion.
• Large complexes down to developing cumulus.
• Clouds outline moisture – shallow or deep.
• Identify boundaries.
• Causing severe signatures.
• Linear and clusters.

25
Three biggest tornadoes inKiowa county. 2nd formedjust east of Greensburg and quickly grew to 2 mi in width!At least 2 smaller "satellite“tornadoes with the 1st tornadothat formed S of Greensburg.
26
27
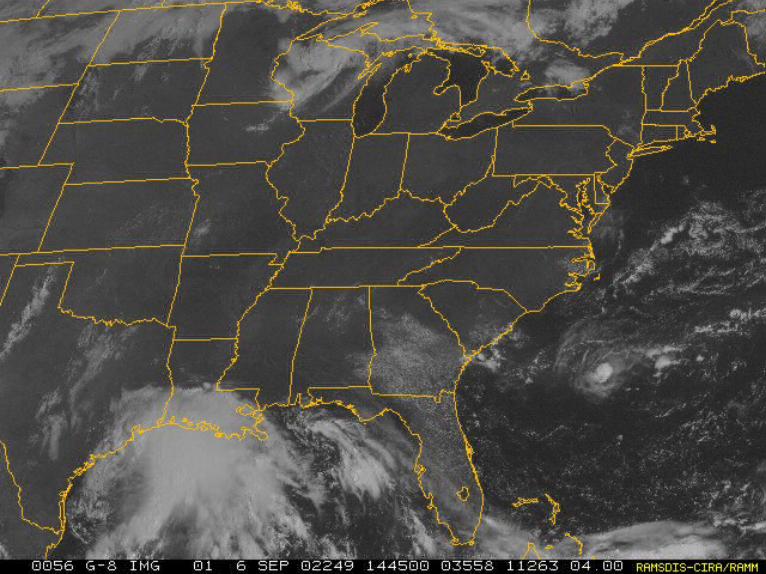
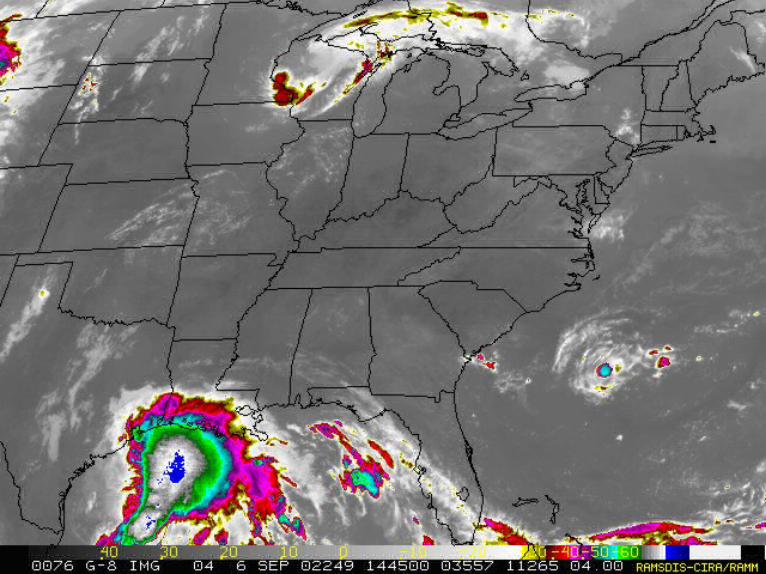
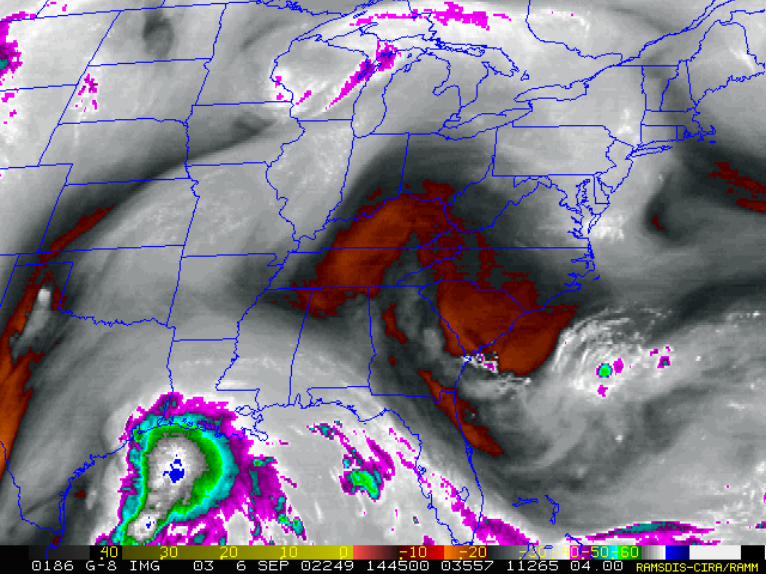
Steve Leach
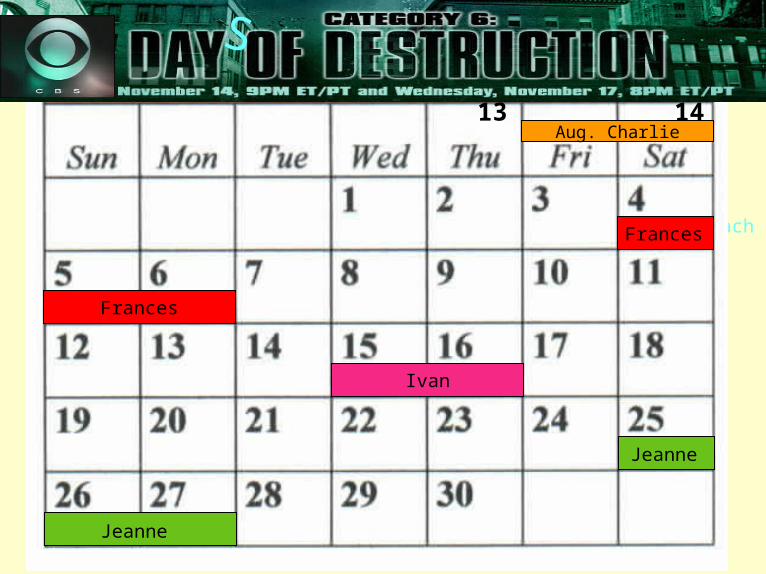
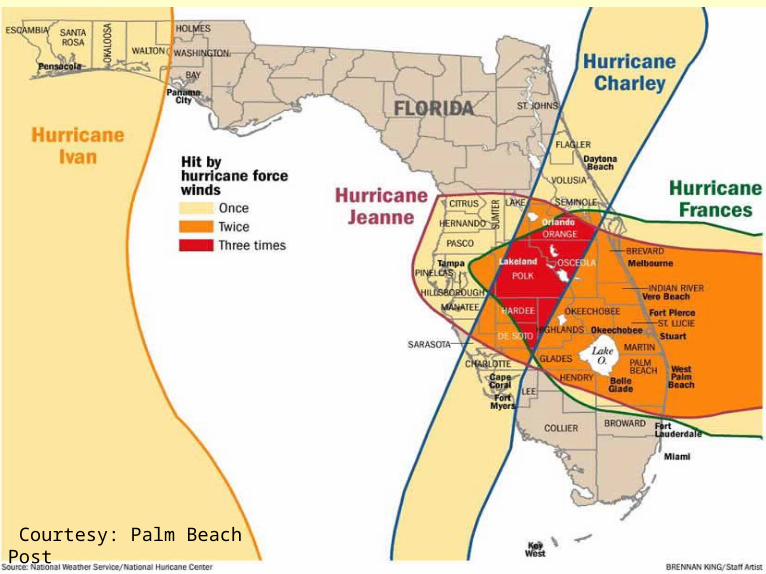
Frances
13 14Aug. Charlie
Frances
Ivan
Jeanne
Jeanne
Florida’s Furiously Full Calendar!S
28
Steve Leach
Courtesy: Palm Beach Post
Blowing Dust
• Hazard to visibility and breathing.
• Reveal wind patterns.
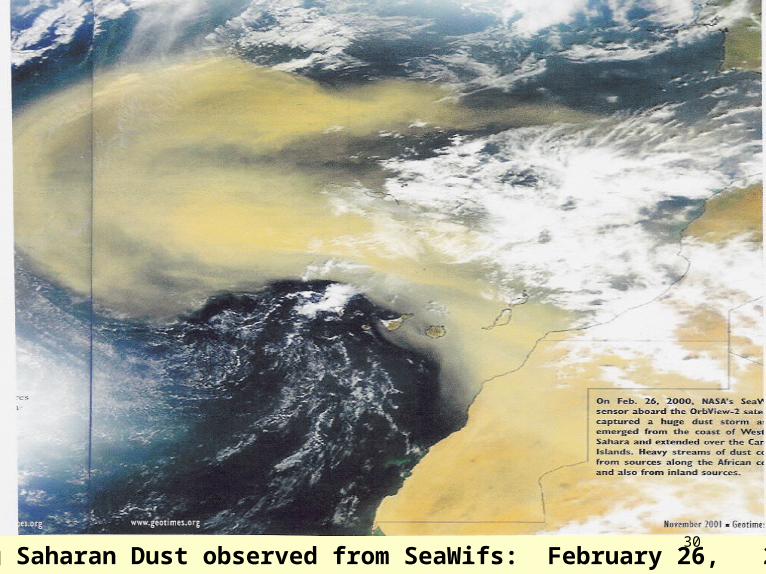
30Blowing Saharan Dust observed from SeaWifs: February 26, 2000
31
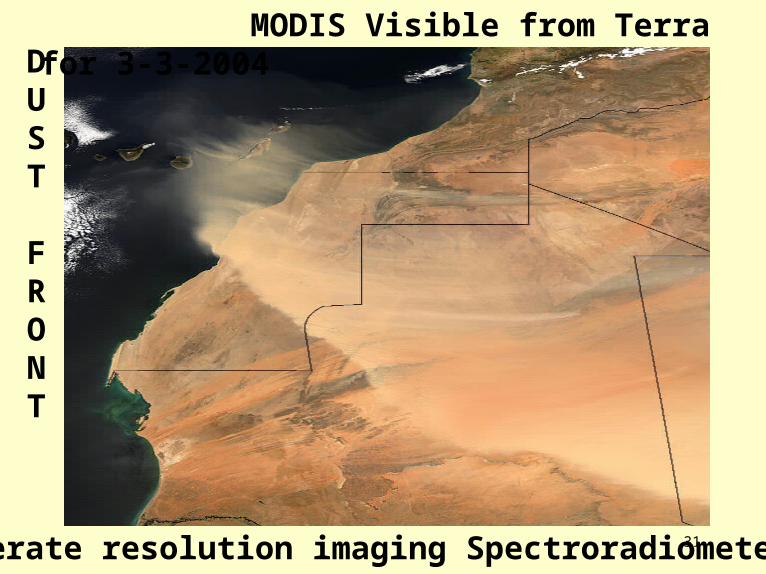
MODIS Visible from Terra for 3-3-2004
moderate resolution imaging Spectroradiometer
DUST
FRONT
32
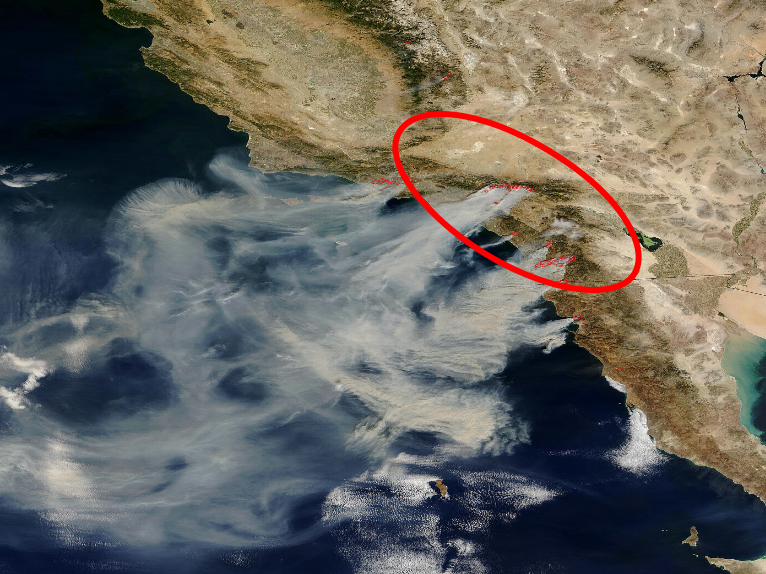
Florida Fires
• Drought provided conditions.
• Several fires grew out of control.
• Several plumes caused Interstates to close.
• A close-up Ch2 (3.9 μm) shows “hotspots” from numerous fires.
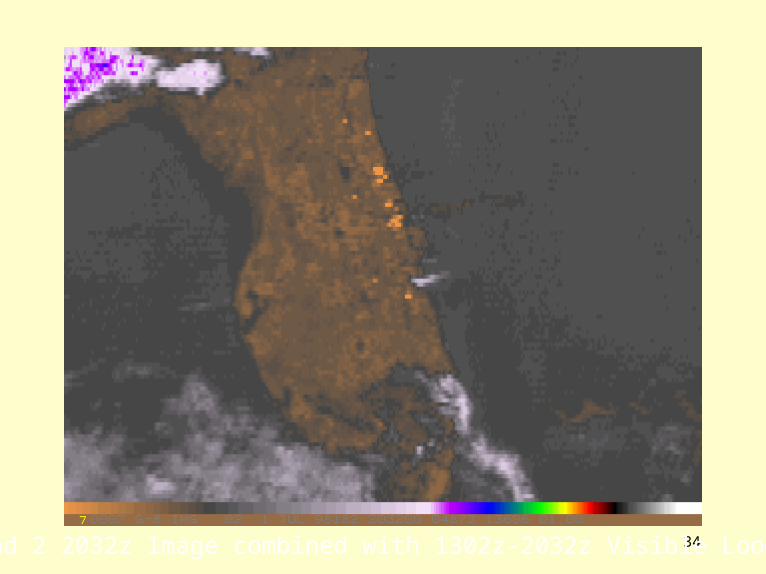
34Band 2 2032z Image combined with 1302z-2032z Visible Loop
35
36
37
38
39
Summary
• Satellite imagery is the “real world”, not model “fantasy” world.
• We see all atmospheric scales of motion in a single image.
• Satellite imagery interpretation is an art.• The imagery can help explain weather events.• We cannot start too soon (in school) educating
people in identifying features in the imagery.
40
Local Visible Loops:http://www.rap.ucar.edu/weather/satellite/Geostationary Satellite Server:http://www.goes.noaa.gov/RAMSDIS online:http://www.cira.colostate.edu/RAMM/Rmsdsol/main.htmlNASA Global Hydrology and Climate Center:http://wwwghcc.msfc.nasa.gov/GOES/Space, Science and Engineering Center, U of Wisconsin, Madison:http://www.ssec.wisc.edu/data/GOES Status:http://www.oso.noaa.gov/goesstatus/POES Status:http://www.oso.noaa.gov/poesstatus/Sam Beckman web site:http://home.earthlink.net/~weateach/wxforecast.htm
Satellite Links


![Satellite Imagery Product Specificationslps16.esa.int/posterfiles/paper1213/[RD16]_RE_Product... · 2016-04-22 · Satellite Imagery Product Specifications 6 2 RAPIDEYE SATELLITE](https://img.pdfslide.us/doc/110x75/5eba16697328255ddd5746a8/satellite-imagery-product-rd16reproduct-2016-04-22-satellite-imagery-product.jpg)