Embed Size (px)
Citation preview
SASOL LIMITED FINANCIAL RESULTS
for the period ended 30 June 2017
JSE: SOL NYSE: SSL
2
Forward-looking statements
Sasol may, in this document, make certain statements that are not historical facts and relate to analyses and other information
which are based on forecasts of future results and estimates of amounts not yet determinable. These statements may also relate
to our future prospects, developments and business strategies. Examples of such forward-looking statements include, but are
not limited to, statements regarding exchange rate fluctuations, volume growth, increases in market share, total shareholder
return, executing our growth projects, (including LCCP), oil and gas reserves and cost reductions, including in connection with
our BPEP, RP and our business performance outlook. Words such as “believe”, “anticipate”, “expect”, “intend", “seek”, “will”,
“plan”, “could”, “may”, “endeavour”, “target”, “forecast” and “project” and similar expressions are intended to identify such
forward-looking statements, but are not the exclusive means of identifying such statements. By their very nature, forward-looking
statements involve inherent risks and uncertainties, both general and specific, and there are risks that the predictions, forecasts,
projections and other forward-looking statements will not be achieved. If one or more of these risks materialise, or should
underlying assumptions prove incorrect, our actual results may differ materially from those anticipated. You should understand
that a number of important factors could cause actual results to differ materially from the plans, objectives, expectations,
estimates and intentions expressed in such forward-looking statements. These factors are discussed more fully in our most
recent annual report on Form 20-F filed on 27 September 2016 and in other filings with the United States Securities and
Exchange Commission. The list of factors discussed therein is not exhaustive; when relying on forward-looking statements to
make investment decisions, you should carefully consider both these factors and other uncertainties and events. Forward-
looking statements apply only as of the date on which they are made, and we do not undertake any obligation to update or
revise any of them, whether as a result of new information, future events or otherwise.
Please note: A billion is defined as one thousand million. All references to years refer to the financial year 30 June.
Any reference to a calendar year is prefaced by the word “calendar”.
Comprehensive additional information is available on our website: www.sasol.com
INTRODUCTION
Bongani Nqwababa and Stephen Cornell
Joint Presidents and Chief Executive Officers
JSE: SOL NYSE: SSL
4
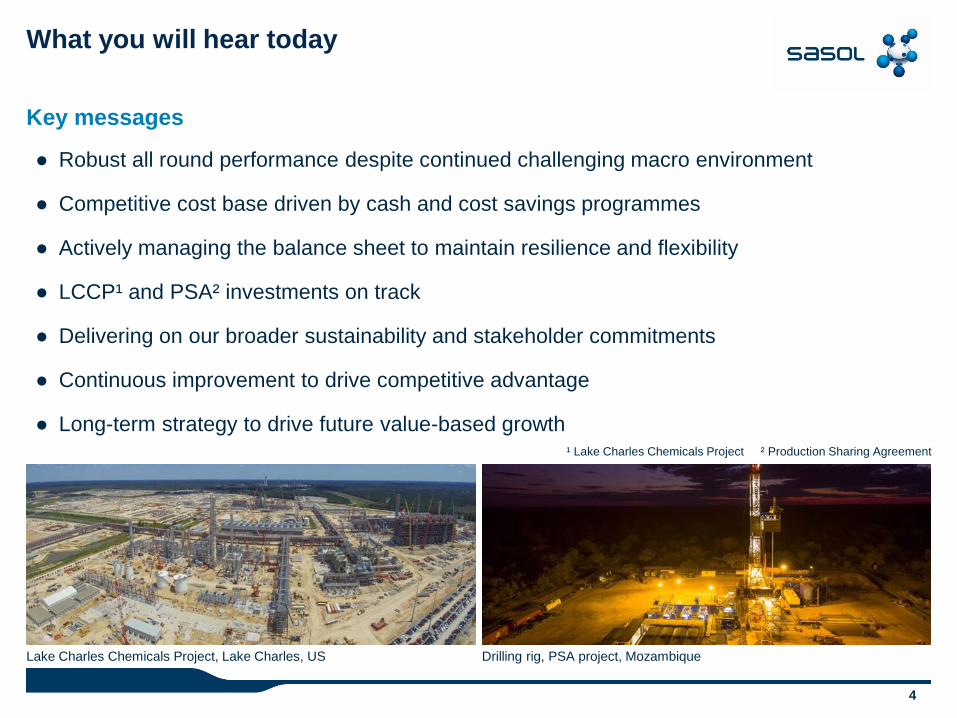
Key messages
● Robust all round performance despite continued challenging macro environment
● Competitive cost base driven by cash and cost savings programmes
● Actively managing the balance sheet to maintain resilience and flexibility
● LCCP¹ and PSA² investments on track
● Delivering on our broader sustainability and stakeholder commitments
● Continuous improvement to drive competitive advantage
● Long-term strategy to drive future value-based growth
Lake Charles Chemicals Project, Lake Charles, US Drilling rig, PSA project, Mozambique
What you will hear today
¹ Lake Charles Chemicals Project ² Production Sharing Agreement
5
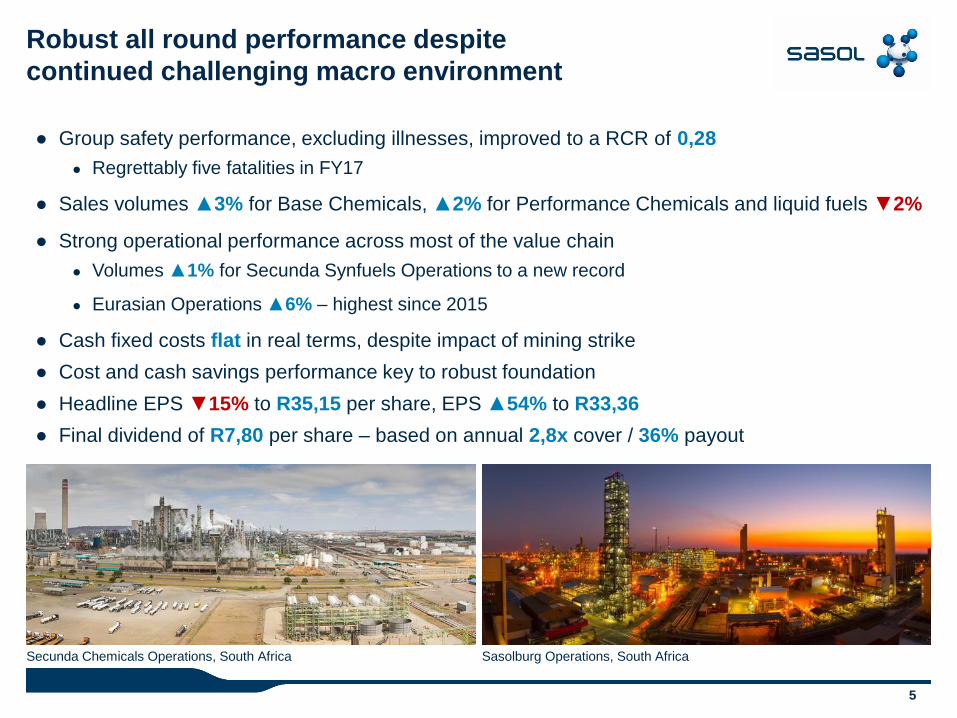
● Group safety performance, excluding illnesses, improved to a RCR of 0,28
● Regrettably five fatalities in FY17
● Sales volumes ▲3% for Base Chemicals, ▲2% for Performance Chemicals and liquid fuels ▼2%
● Strong operational performance across most of the value chain
● Volumes ▲1% for Secunda Synfuels Operations to a new record
● Eurasian Operations ▲6% – highest since 2015
● Cash fixed costs flat in real terms, despite impact of mining strike
● Cost and cash savings performance key to robust foundation
● Headline EPS ▼15% to R35,15 per share, EPS ▲54% to R33,36
● Final dividend of R7,80 per share – based on annual 2,8x cover / 36% payout
Secunda Chemicals Operations, South Africa Sasolburg Operations, South Africa
Robust all round performance despite
continued challenging macro environment
6
FY14 FY15 FY16 FY17
Ran
d
Project implementation cost Actual savings
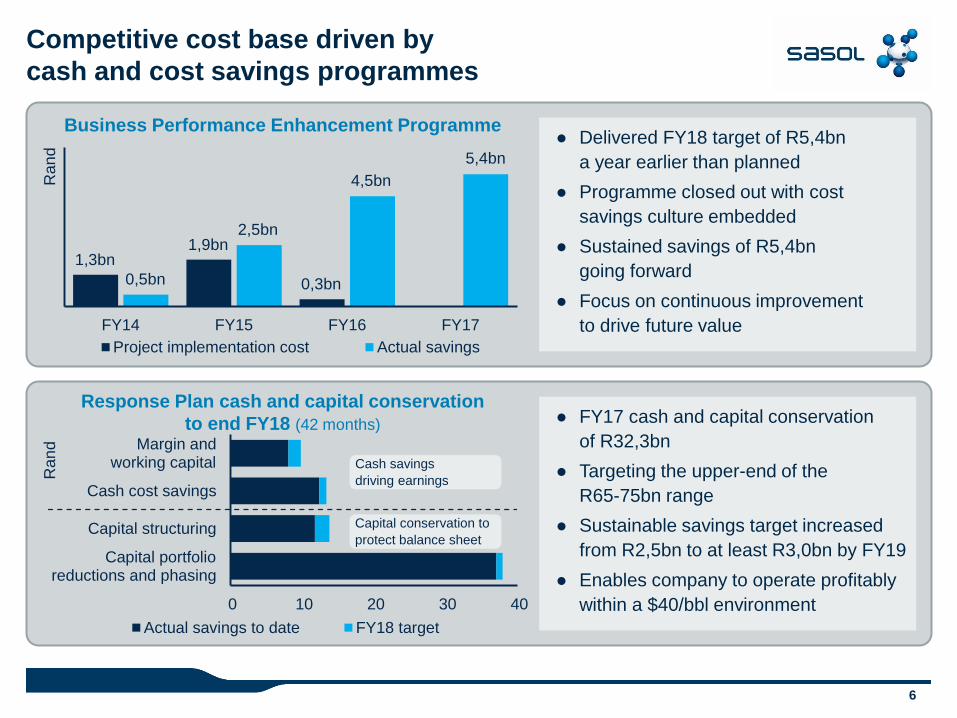
Competitive cost base driven by
cash and cost savings programmes
● Delivered FY18 target of R5,4bn
a year earlier than planned
● Programme closed out with cost
savings culture embedded
● Sustained savings of R5,4bn
going forward
● Focus on continuous improvement
to drive future value
● FY17 cash and capital conservation
of R32,3bn
● Targeting the upper-end of the
R65-75bn range
● Sustainable savings target increased
from R2,5bn to at least R3,0bn by FY19
● Enables company to operate profitably
within a $40/bbl environment
1,3bn
0,5bn
1,9bn 2,5bn
0,3bn
4,5bn
5,4bn
Business Performance Enhancement Programme
0 10 20 30 40
Capital portfolioreductions and phasing
Capital structuring
Cash cost savings
Margin andworking capital
Ran
d
Actual savings to date FY18 target
Response Plan cash and capital conservation
to end FY18 (42 months)
Cash savings
driving earnings
Capital conservation to
protect balance sheet
7
● Maintain a prudent approach in managing the impact of macro-economic volatility
to ultimately protect and strengthen our balance sheet
● Proactively executed our hedging policy to mitigate specific financial risks
● Sufficient liquidity and funding plans in place to enable strategy execution
● Ongoing efforts to create further headroom while managing gearing below guidance
● Investment grade credit ratings maintained and remain a priority
Sasol Mining, Secunda, South Africa CTRG, Mozambique
Actively managing the balance sheet
to maintain resilience and flexibility
8
● Overall project 74% complete with construction execution at 42%
● Remain on track for start-up of first units in 2nd half of calendar year 2018
● Capital expenditure to date of US$7,5 billion – tracking revised $11bn estimate
● First quintile construction productivity performance
● Sufficient contingency to complete project to beneficial operation within revised budget
● Commissioning and marketing plans well developed
● Project returns reduced to approximately 7-8% due to lower pricing assumptions
● Returns based on 4th quarter FY2017 spot pricing approximately 8-8,5%
Lake Charles Chemicals Project, Lake Charles, US
Lake Charles Chemicals Project, Lake Charles, US
LCCP on track and progressing well
9
● Progressing field development plan with 4 oil and 2 gas wells drilled
● Capital expenditure to date of US$384 million on PSA license
● Gas reserves in line with expectations but oil production expected in mid to lower end of range
● Optimising surface facilities design to meet revised expectations and drive improved economics
with lower capital
● PSA is key to our integrated gas monetisation strategy in Mozambique and South Africa
Drilling rig, Temane, Mozambique
Loop Line 2, Mozambique
PSA – Sasol remains committed
whilst optimising our development plan
10
● Invested R1,6 billion in skills and socio-economic development programmes globally
● Increased access to healthcare services for over 270 000 people living in fence-line communities
● Improved local government service delivery to our fence-line communities with over R128 million
invested working in partnership with local government
● Over 6 million learners impacted by our R330 million investment in science, technology,
engineering and mathematics education in Southern Africa
● Continued funding of SMMEs sustainably employing over 4 000 people
● Over R7 billion preferential procurement from black-owned enterprises in South Africa
eMbalenhle Extension 14 clinic, Secunda, South Africa Nhamacunda housing village, Inhambane, Mozambique
Delivering on our broader sustainability
and stakeholder commitments
11
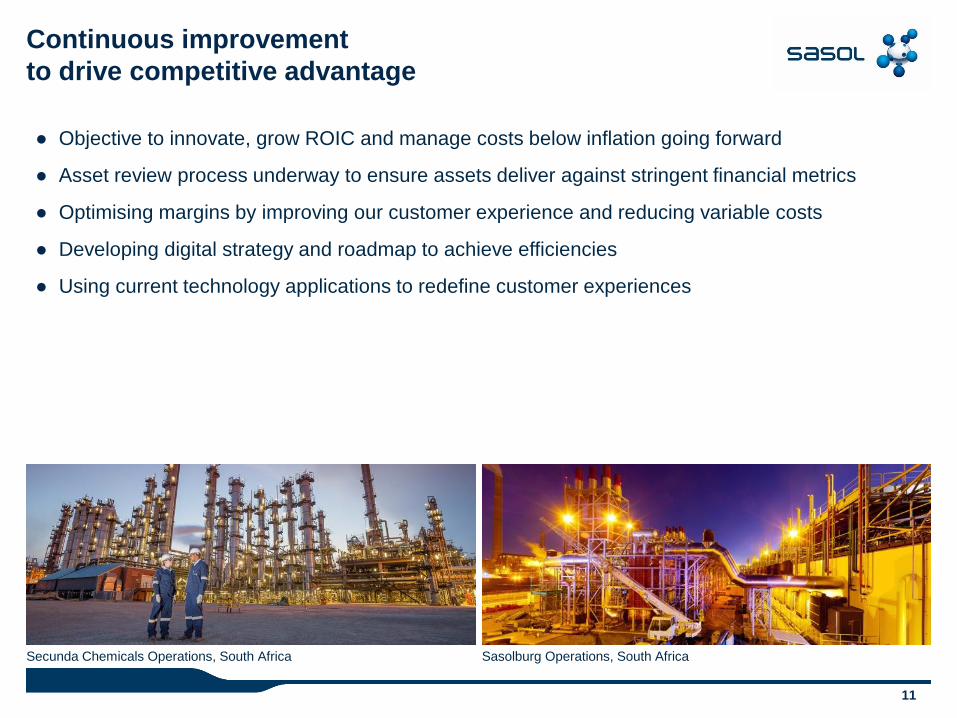
● Objective to innovate, grow ROIC and manage costs below inflation going forward
● Asset review process underway to ensure assets deliver against stringent financial metrics
● Optimising margins by improving our customer experience and reducing variable costs
● Developing digital strategy and roadmap to achieve efficiencies
● Using current technology applications to redefine customer experiences
Secunda Chemicals Operations, South Africa Sasolburg Operations, South Africa
Continuous improvement
to drive competitive advantage
12
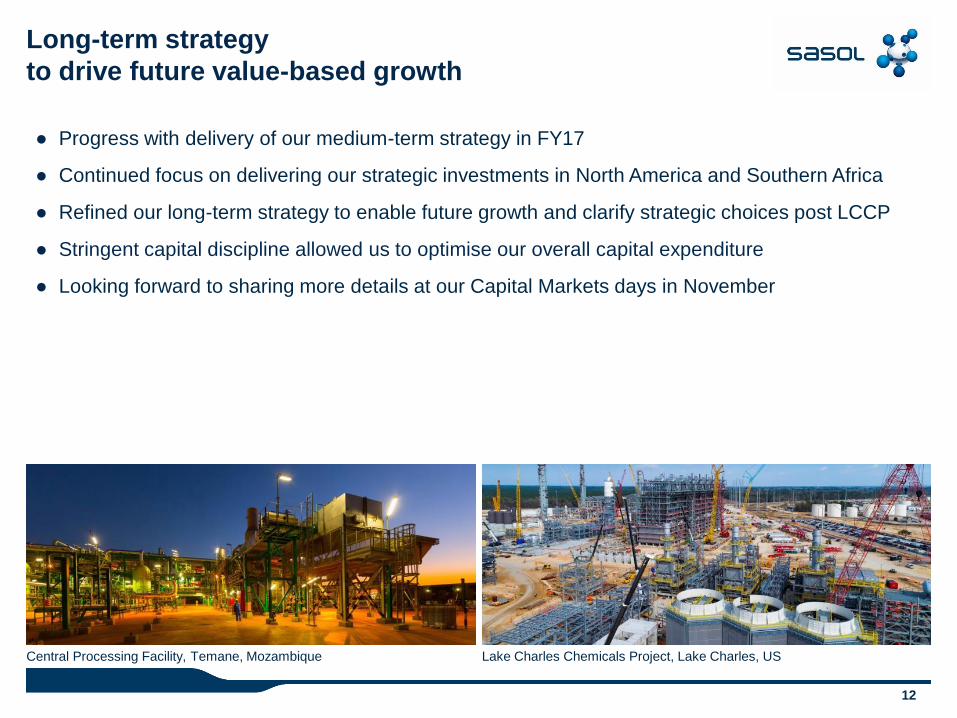
● Progress with delivery of our medium-term strategy in FY17
● Continued focus on delivering our strategic investments in North America and Southern Africa
● Refined our long-term strategy to enable future growth and clarify strategic choices post LCCP
● Stringent capital discipline allowed us to optimise our overall capital expenditure
● Looking forward to sharing more details at our Capital Markets days in November
Central Processing Facility, Temane, Mozambique Lake Charles Chemicals Project, Lake Charles, US
Long-term strategy
to drive future value-based growth
FINANCIAL AND OPERATIONAL
PERFORMANCE
Paul Victor
Chief Financial Officer
JSE: SOL NYSE: SSL
14
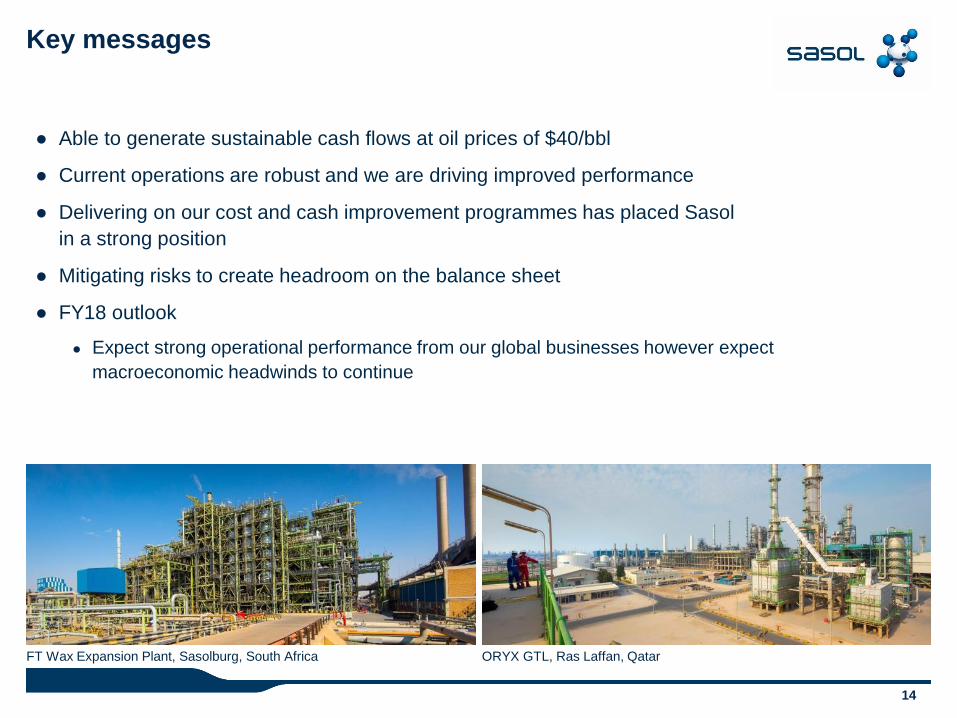
● Able to generate sustainable cash flows at oil prices of $40/bbl
● Current operations are robust and we are driving improved performance
● Delivering on our cost and cash improvement programmes has placed Sasol
in a strong position
● Mitigating risks to create headroom on the balance sheet
● FY18 outlook
● Expect strong operational performance from our global businesses however expect
macroeconomic headwinds to continue
FT Wax Expansion Plant, Sasolburg, South Africa ORYX GTL, Ras Laffan, Qatar
Key messages
15
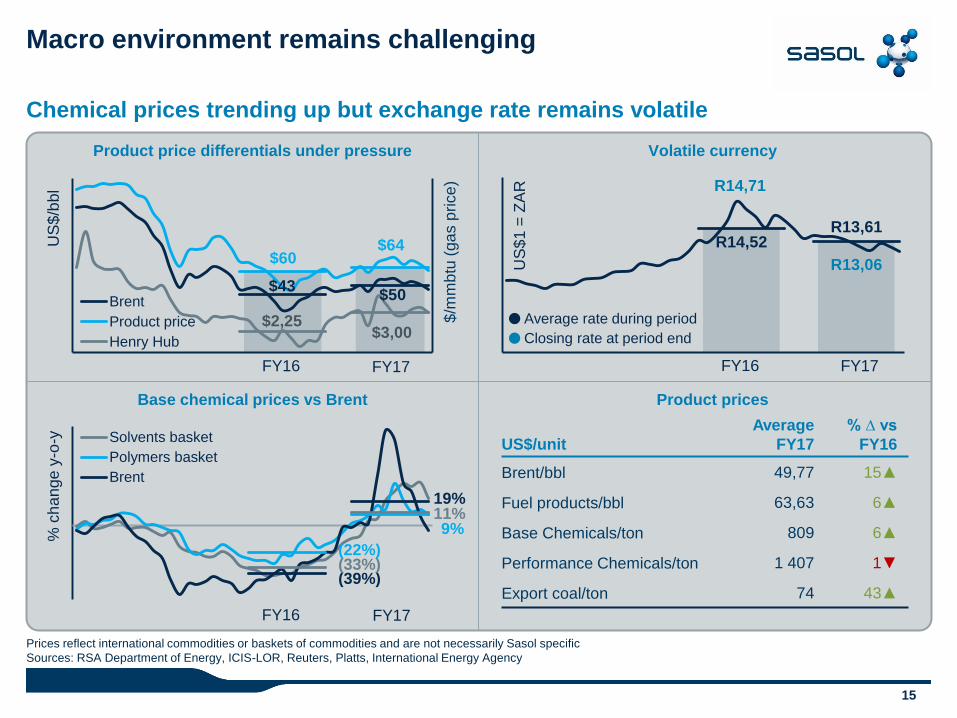
Macro environment remains challenging
Chemical prices trending up but exchange rate remains volatile
Prices reflect international commodities or baskets of commodities and are not necessarily Sasol specific
Sources: RSA Department of Energy, ICIS-LOR, Reuters, Platts, International Energy Agency
% c
ha
nge
y-o
-y
Solvents basket
Polymers basket
Brent
(39%) (33%) (22%)
$/m
mb
tu (
ga
s p
rice
)
US
$/b
bl
Brent
Product price
Henry Hub
Product price differentials under pressure
US
$1
= Z
AR
Volatile currency
Base chemical prices vs Brent
$2,25 $3,00
$43
$64 $60
$50
FY16
9% 11% 19%
R14,52 R13,61
FY17
US$/unit
Average
FY17
% ∆ vs
FY16
Brent/bbl 49,77 15▲
Fuel products/bbl 63,63 6▲
Base Chemicals/ton 809 6▲
Performance Chemicals/ton 1 407 1▼
Export coal/ton 74 43▲
Product prices
R14,71
R13,06
FY16 FY17 FY16 FY17
Average rate during period
Closing rate at period end
16
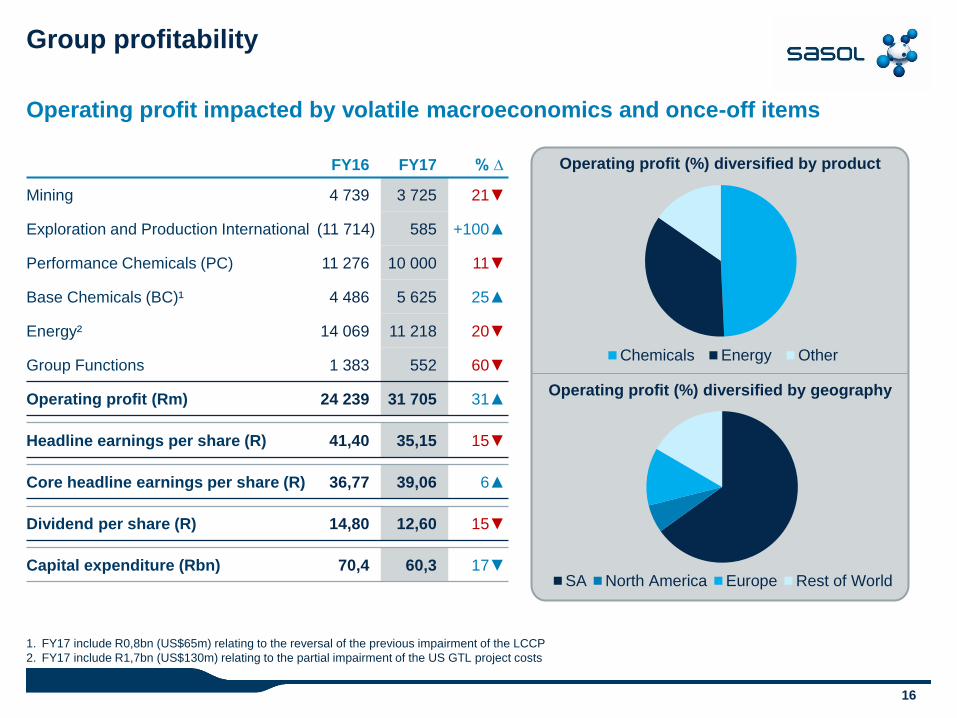
Group profitability
Operating profit impacted by volatile macroeconomics and once-off items
1. FY17 include R0,8bn (US$65m) relating to the reversal of the previous impairment of the LCCP
2. FY17 include R1,7bn (US$130m) relating to the partial impairment of the US GTL project costs
FY16 FY17 % ∆
Mining 4 739 3 725 21▼
Exploration and Production International (11 714) 585 +100▲
Performance Chemicals (PC) 11 276 10 000 11▼
Base Chemicals (BC)¹ 4 486 5 625 25▲
Energy² 14 069 11 218 20▼
Group Functions 1 383 552 60▼
Operating profit (Rm) 24 239 31 705 31▲
Headline earnings per share (R) 41,40 35,15 15▼
Core headline earnings per share (R) 36,77 39,06 6▲
Dividend per share (R) 14,80 12,60 15▼
Capital expenditure (Rbn) 70,4 60,3 17▼
Chemicals Energy Other
SA North America Europe Rest of World
Operating profit (%) diversified by product
Operating profit (%) diversified by geography
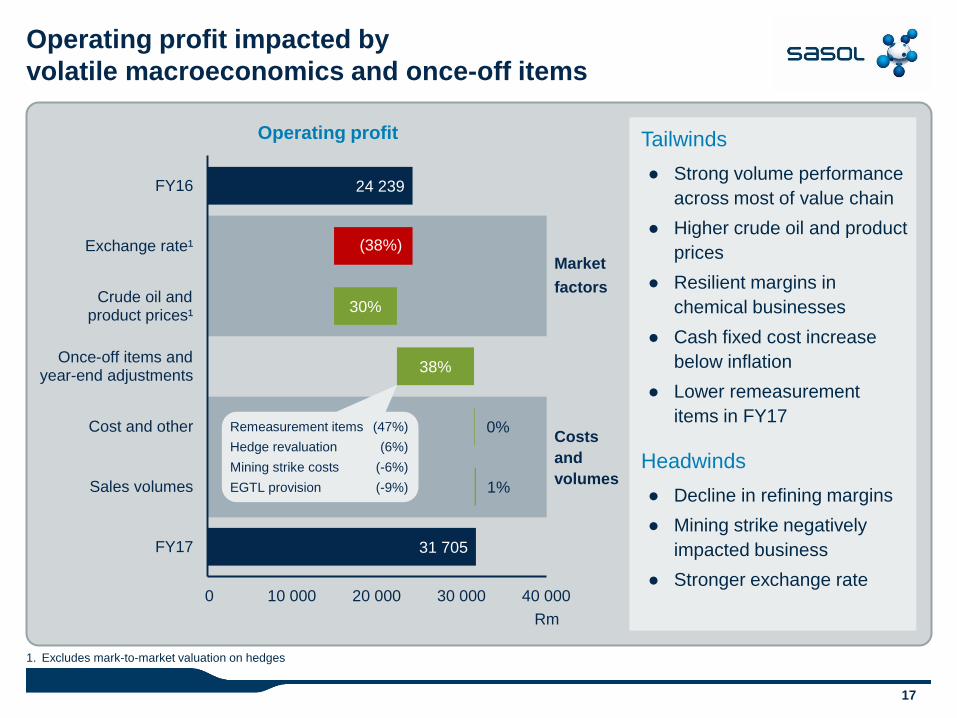
17
Operating profit impacted by
volatile macroeconomics and once-off items
1. Excludes mark-to-market valuation on hedges
Tailwinds
● Strong volume performance
across most of value chain
● Higher crude oil and product
prices
● Resilient margins in
chemical businesses
● Cash fixed cost increase
below inflation
● Lower remeasurement
items in FY17
Headwinds
● Decline in refining margins
● Mining strike negatively
impacted business
● Stronger exchange rate
31 705
24 239
1%
0%
38%
30%
(38%)
0 10 000 20 000 30 000 40 000
FY17
Sales volumes
Cost and other
Once-off items andyear-end adjustments
Crude oil andproduct prices¹
Exchange rate¹
FY16
Rm
Market
factors
Costs
and
volumes
Remeasurement items (47%)
Hedge revaluation (6%)
Mining strike costs (-6%)
EGTL provision (-9%)
Operating profit
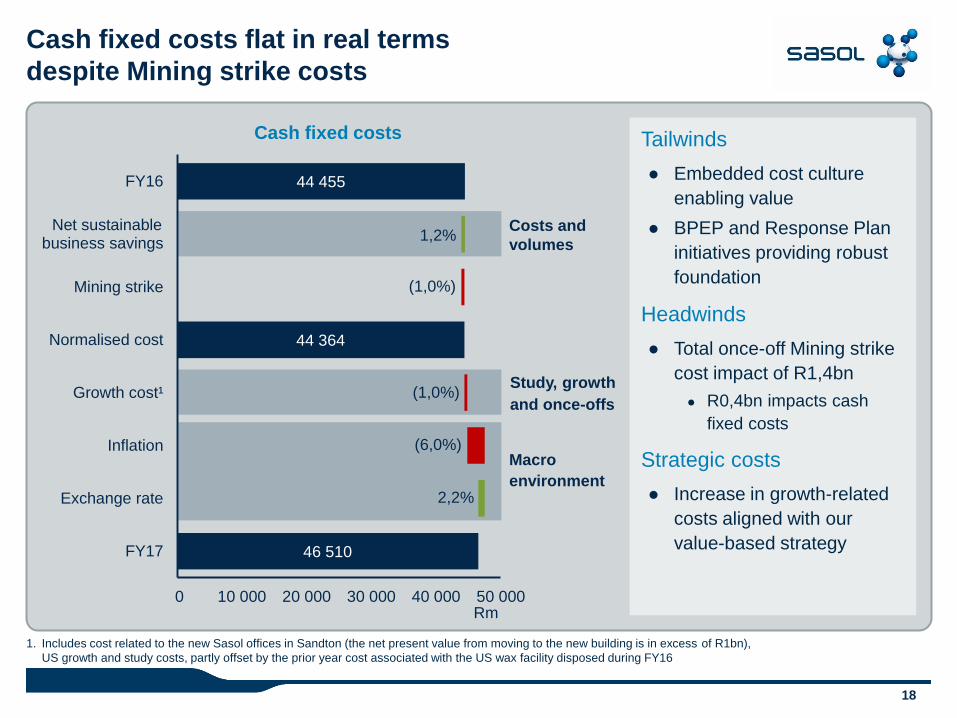
18
Cash fixed costs flat in real terms
despite Mining strike costs
1. Includes cost related to the new Sasol offices in Sandton (the net present value from moving to the new building is in excess of R1bn),
US growth and study costs, partly offset by the prior year cost associated with the US wax facility disposed during FY16
Tailwinds
● Embedded cost culture
enabling value
● BPEP and Response Plan
initiatives providing robust
foundation
Headwinds
● Total once-off Mining strike
cost impact of R1,4bn
● R0,4bn impacts cash
fixed costs
Strategic costs
● Increase in growth-related
costs aligned with our
value-based strategy 46 510
44 364
44 455
0 10 000 20 000 30 000 40 000 50 000
FY17
Exchange rate
Inflation
Growth cost¹
Normalised cost
Mining strike
Net sustainablebusiness savings
FY16
Rm
1,2%
(1,0%)
(1,0%)
(6,0%)
2,2%
Costs and
volumes
Study, growth
and once-offs
Macro
environment
Cash fixed costs
19
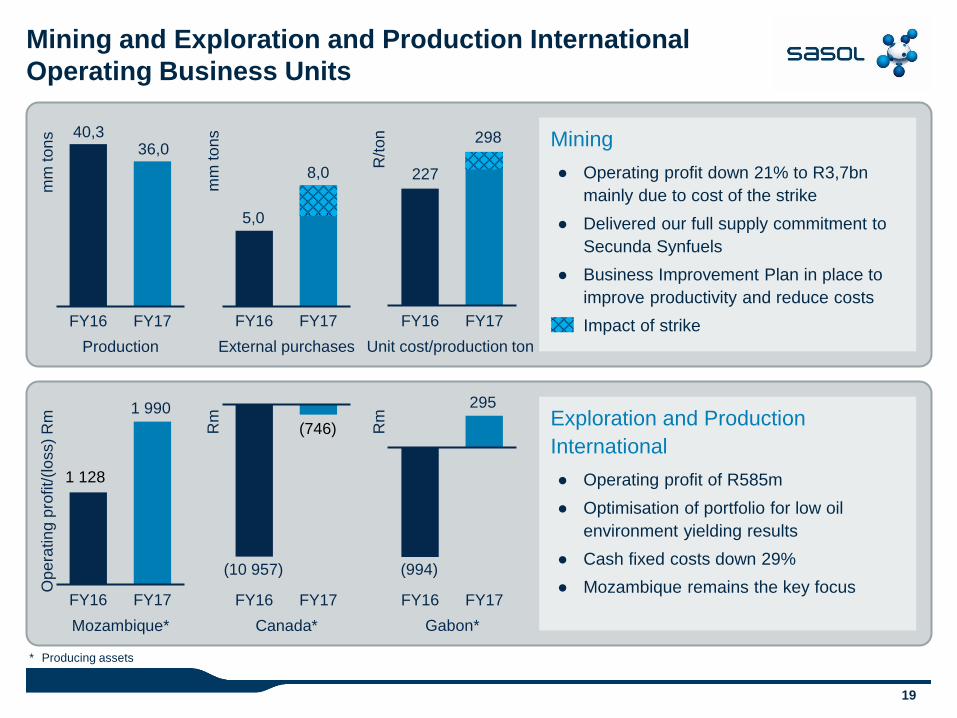
Mining and Exploration and Production International
Operating Business Units
* Producing assets
Mining
● Operating profit down 21% to R3,7bn
mainly due to cost of the strike
● Delivered our full supply commitment to
Secunda Synfuels
● Business Improvement Plan in place to
improve productivity and reduce costs
● Impact of strike
Exploration and Production
International
● Operating profit of R585m
● Optimisation of portfolio for low oil
environment yielding results
● Cash fixed costs down 29%
● Mozambique remains the key focus
FY16 FY17
mm
to
ns
Production
FY16 FY17
mm
to
ns
External purchases
227
298
FY16 FY17
R/to
n
Unit cost/production ton
FY16 FY17
Rm
(746)
Mozambique*
FY16 FY17
Op
era
tin
g p
rofit/(lo
ss)
Rm
1 990
1 128
Canada*
FY16 FY17
Rm
(994)
Gabon*
(10 957)
5,0
8,0
40,3 36,0
295
20
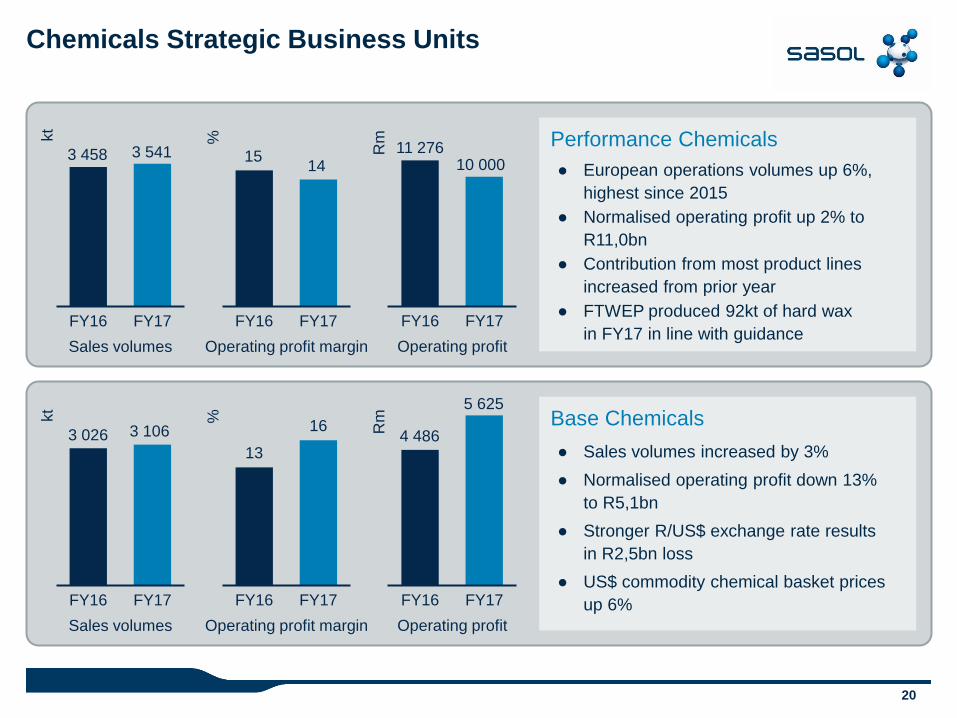
Chemicals Strategic Business Units
Performance Chemicals
● European operations volumes up 6%,
highest since 2015
● Normalised operating profit up 2% to
R11,0bn
● Contribution from most product lines
increased from prior year
● FTWEP produced 92kt of hard wax
in FY17 in line with guidance
Base Chemicals
● Sales volumes increased by 3%
● Normalised operating profit down 13%
to R5,1bn
● Stronger R/US$ exchange rate results
in R2,5bn loss
● US$ commodity chemical basket prices
up 6% FY16 FY17
kt
Sales volumes
13
16
FY16 FY17
%
Operating profit margin
FY16 FY17
Rm
Operating profit
FY16 FY17
kt
Sales volumes
FY16 FY17
%
15 14
Operating profit margin
FY16 FY17
Rm
Operating profit
3 541 3 458 11 276
3 026 3 106 4 486
10 000
5 625
21
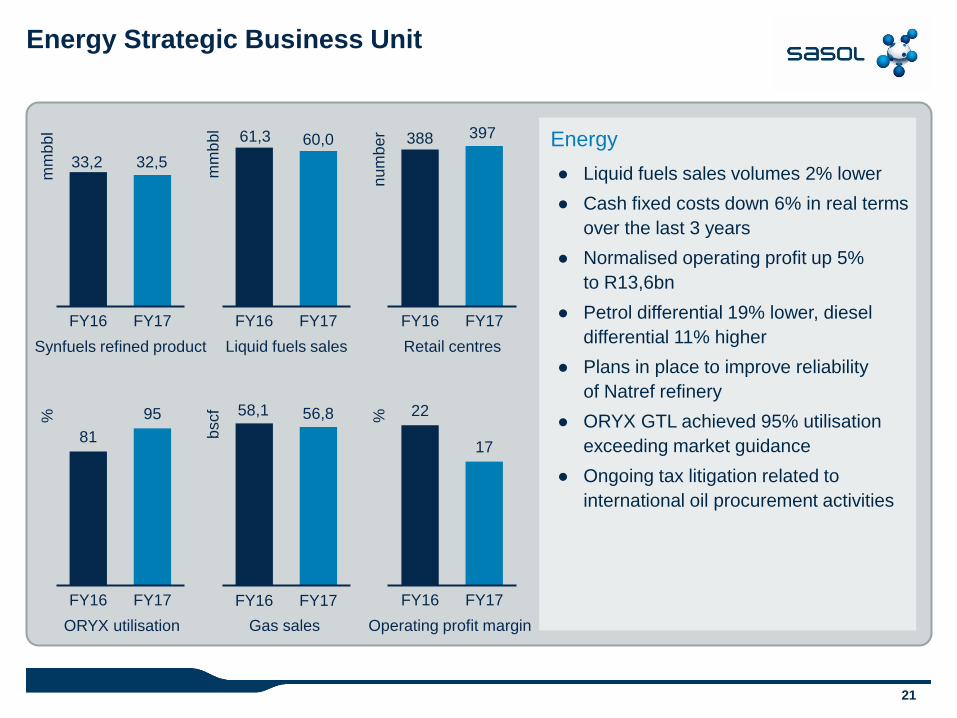
Energy Strategic Business Unit
Energy
● Liquid fuels sales volumes 2% lower
● Cash fixed costs down 6% in real terms
over the last 3 years
● Normalised operating profit up 5%
to R13,6bn
● Petrol differential 19% lower, diesel
differential 11% higher
● Plans in place to improve reliability
of Natref refinery
● ORYX GTL achieved 95% utilisation
exceeding market guidance
● Ongoing tax litigation related to
international oil procurement activities
Synfuels refined product Retail centres Liquid fuels sales
FY16 FY17
mm
bb
l
33,2
FY16 FY17
nu
mb
er
FY16 FY17
bscf
81
95
FY16 FY17
% 22
17
FY16 FY17
%
FY16 FY17
mm
bb
l
Operating profit margin Gas sales ORYX utilisation
60,0
32,5
58,1 56,8
61,3 388 397
22
66
60 60 59
37
0
20
40
60
80
FY17 act FY18 est FY19 est
Rbn
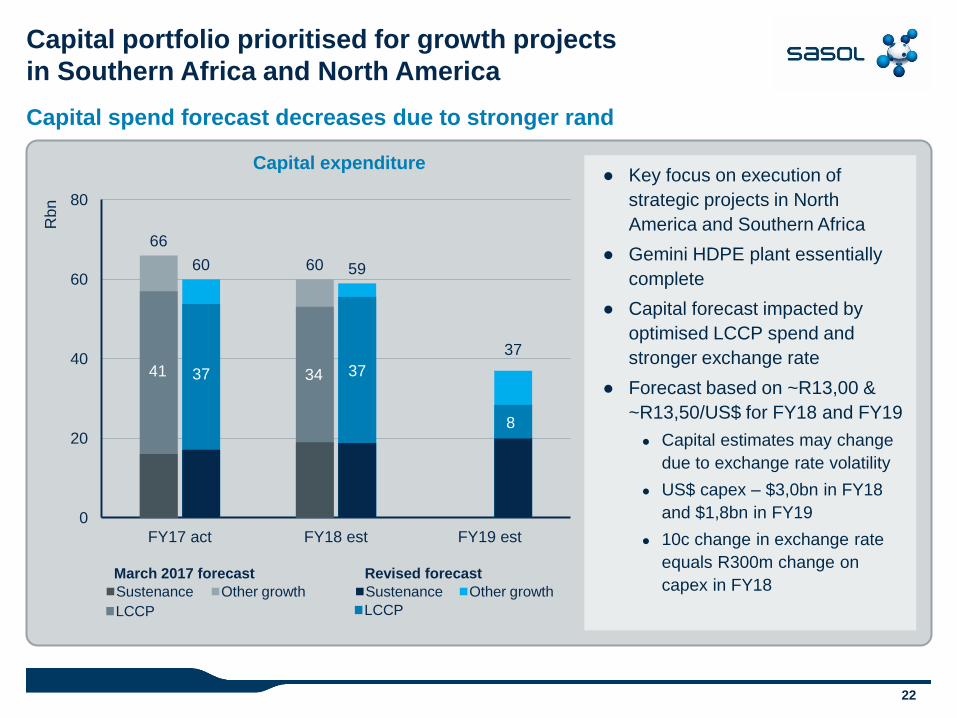
Capital portfolio prioritised for growth projects
in Southern Africa and North America
Capital spend forecast decreases due to stronger rand
● Key focus on execution of
strategic projects in North
America and Southern Africa
● Gemini HDPE plant essentially
complete
● Capital forecast impacted by
optimised LCCP spend and
stronger exchange rate
● Forecast based on ~R13,00 &
~R13,50/US$ for FY18 and FY19
● Capital estimates may change
due to exchange rate volatility
● US$ capex – $3,0bn in FY18
and $1,8bn in FY19
● 10c change in exchange rate
equals R300m change on
capex in FY18 March 2017 forecast
Other growth Sustenance
Revised forecast
Sustenance Other growth
LCCP LCCP
Capital expenditure
41 37 34 37
8
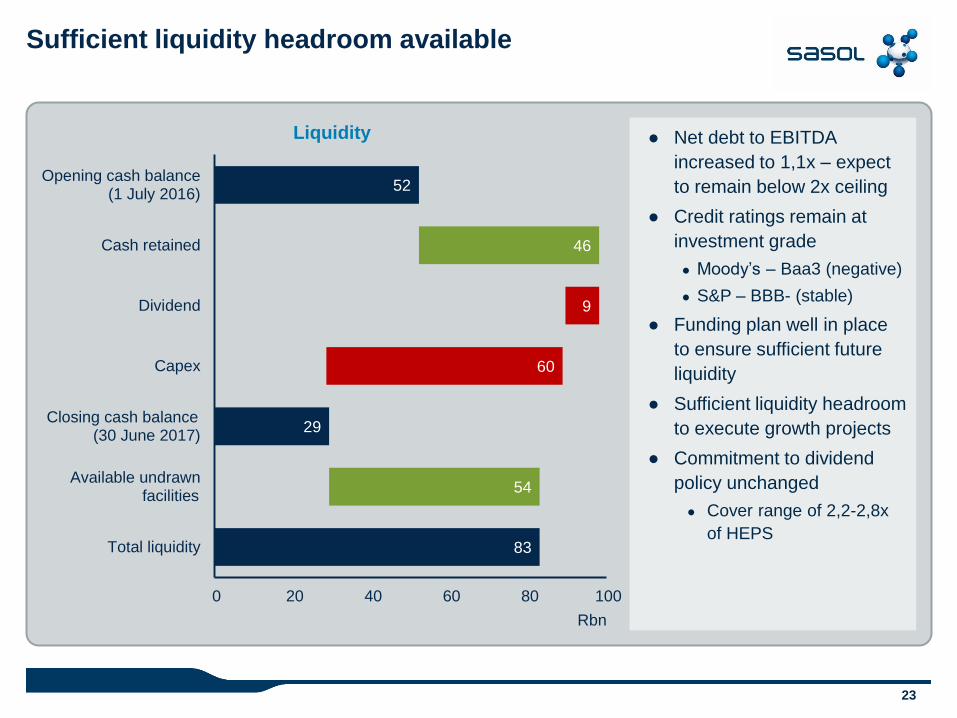
23
83
29
52
54
46
60
9
0 20 40 60 80 100
Total liquidity
Available undrawn facilities
Closing cash balance (30 June 2017)
Capex
Dividend
Cash retained
Opening cash balance (1 July 2016)
Rbn
Sufficient liquidity headroom available
● Net debt to EBITDA
increased to 1,1x – expect
to remain below 2x ceiling
● Credit ratings remain at
investment grade
● Moody’s – Baa3 (negative)
● S&P – BBB- (stable)
● Funding plan well in place
to ensure sufficient future
liquidity
● Sufficient liquidity headroom
to execute growth projects
● Commitment to dividend
policy unchanged
● Cover range of 2,2-2,8x
of HEPS
Liquidity
24
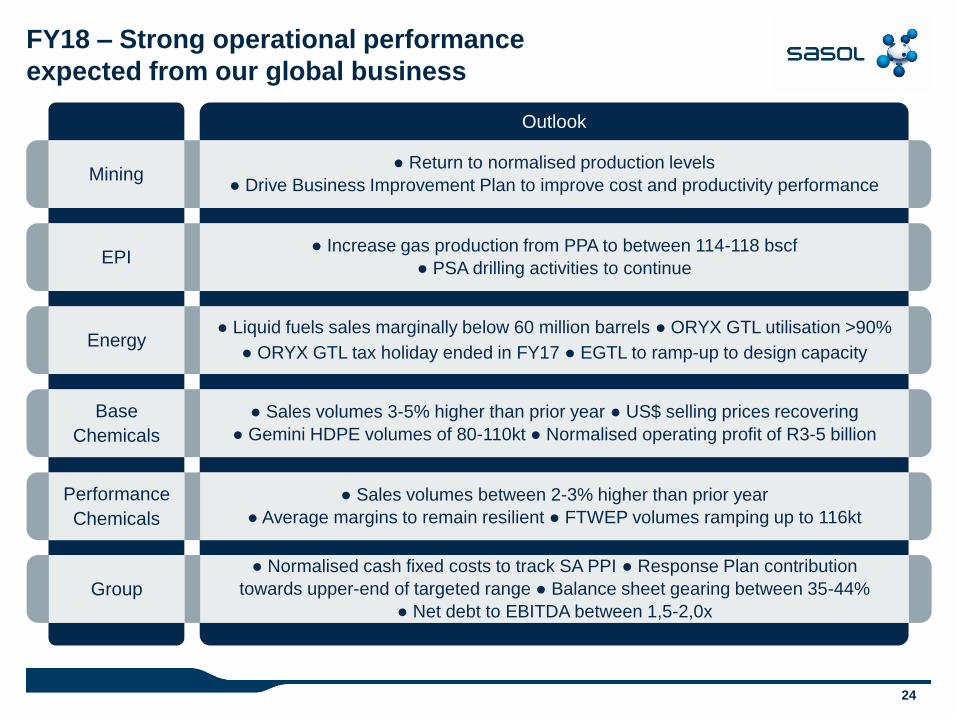
FY18 – Strong operational performance
expected from our global business
Outlook
Mining ● Return to normalised production levels
● Drive Business Improvement Plan to improve cost and productivity performance
EPI ● Increase gas production from PPA to between 114-118 bscf
● PSA drilling activities to continue
Energy ● Liquid fuels sales marginally below 60 million barrels ● ORYX GTL utilisation >90%
● ORYX GTL tax holiday ended in FY17 ● EGTL to ramp-up to design capacity
Base
Chemicals
● Sales volumes 3-5% higher than prior year ● US$ selling prices recovering
● Gemini HDPE volumes of 80-110kt ● Normalised operating profit of R3-5 billion
Performance
Chemicals
● Sales volumes between 2-3% higher than prior year
● Average margins to remain resilient ● FTWEP volumes ramping up to 116kt
Group
● Normalised cash fixed costs to track SA PPI ● Response Plan contribution
towards upper-end of targeted range ● Balance sheet gearing between 35-44%
● Net debt to EBITDA between 1,5-2,0x
QUESTIONS AND ANSWERS
Bongani Nqwababa and Stephen Cornell
Joint Presidents and Chief Executive Officers
JSE: SOL NYSE: SSL