Embed Size (px)
Citation preview
1
Paper HW-06
SAS® to Publishable Excel... Seamlessly – Using ODS, XML, and Other Tricks Harry Droogendyk, Stratia Consulting Inc.
Marje Fecht, Prowerk Consulting Ltd
ABSTRACT Do you have legacy "listing" reports that you want to publish easily in Excel? Do you currently output to Excel but dislike having to massage the output to get things just right? This hands-on workshop will introduce you to XML, and show you how to leverage the strengths of ODS to generate custom-formatted output in Excel. Topics include:
• creating Excel files using DATA _NULL_ • using SAS’s ODS ExcelXP tagsets to easily customize Excel document properties • using SAS to create CSV and XML data to feed Excel pivot tables
This workshop will prepare you to use ODS for creating Excel reports that are ready to publish with minimal (or no) post-processing.
INTRODUCTION There are an abundance of tools and approaches to moving data from SAS into Excel. Each approach has an intended purpose along with a long list of advantages and disadvantages. Since the authors understand and recognize (from personal experience) that time and resources don’t always permit a total rewrite of production code that is working just fine, the focus of this paper is to help you take existing legacy code and make the additions and alterations necessary to publish your results in Excel. Further, our goal is to avoid much of the post-processing sometimes required to make the Excel output acceptable to the information consumer. Most of the Excel content created by the examples in this paper is accessible in Excel 2000 or later. However, where features are only available in Excel 2002 or Excel 2003, they will be noted in the paper.
GOOD OLE DATA _NULL_ I bet you have DATA _NULL_ code lurking in some of your production processes, and it has probably been running for years to produce reports that are widely used throughout your organization. I bet you have also occasionally tweaked the code to make the output just a little more functional and a little bit prettier. Perhaps your DATA _NULL_ began as a paper report many moons ago (if you are as old as the authors, you will recall that is the only kind of report we used to produce). However, since our user community requires their reports in Excel, you now open the .txt file in Excel, define the columnar input and tweak the fonts, colors, etc. to improve the data presentation. Perhaps you even wrote an Excel macro to carry out some of the post processing. If you recognize this scenario, then it’s likely you now have a multi-step process in place that runs the DATA _NULL_ step, opens the file in Excel, runs an Excel macro, saves the file in Excel format, and publishes. Let’s look at a simple example of the legacy code and then examine some additions to enhance the Excel output directly from SAS and hopefully avoid most, if not all, of the post processing.
EXAMPLE 1A: LEGACY CODE Consider this simple data step to create a listing report. You had to figure out proper columns for column headings and data, so that everything lined up nicely, which meant anticipating future data as well. Your legacy code likely has a lot of computations, formatting, and complexity but for illustrative purposes, our focus is simply on the output.
filename out 'c:\temp\HOW_1a_legacy.txt'; data _null_; file out; if _n_ = 1 then /*title and Column Hdgs*/ put @8 'Legacy Code - Text File Output' // @1 'Name' @20 'Gender' @30 'Age' @40 'Height';
2
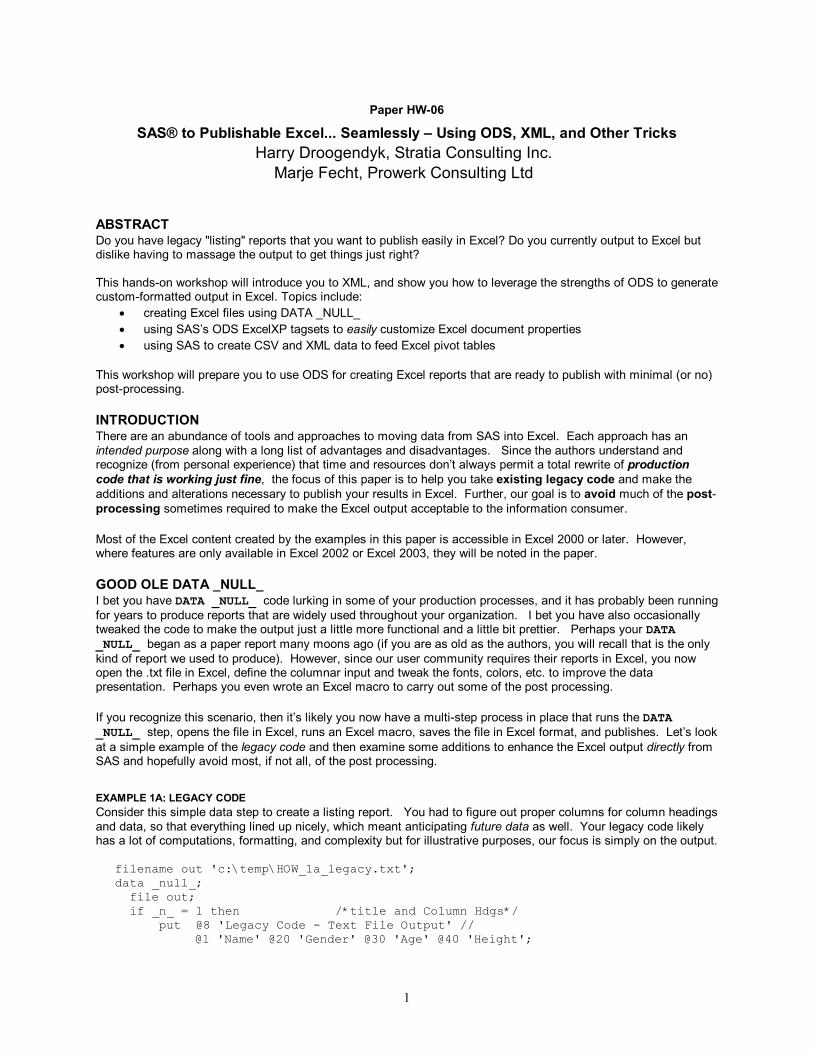
set sashelp.class; format height 5.1; put @1 name @23 sex @30 age @40 height; run;
Partial Output – TXT file contents
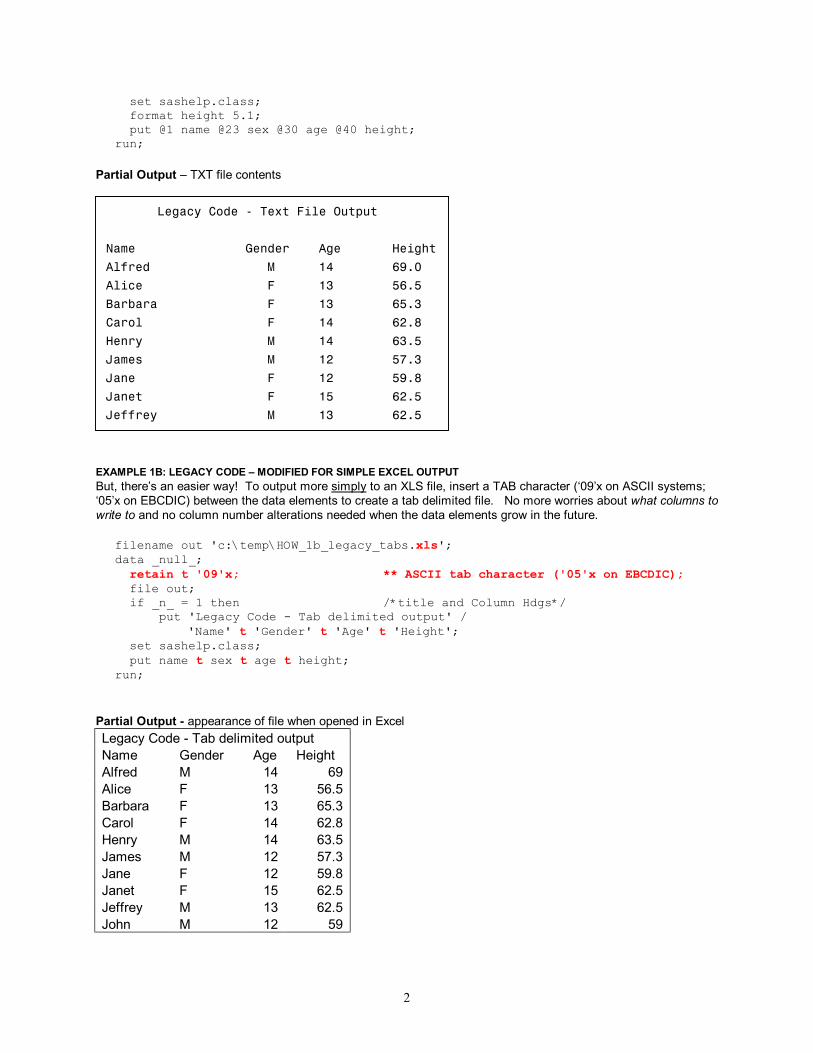
EXAMPLE 1B: LEGACY CODE – MODIFIED FOR SIMPLE EXCEL OUTPUT But, there’s an easier way! To output more simply to an XLS file, insert a TAB character (‘09’x on ASCII systems; ‘05’x on EBCDIC) between the data elements to create a tab delimited file. No more worries about what columns to write to and no column number alterations needed when the data elements grow in the future.
filename out 'c:\temp\HOW_1b_legacy_tabs.xls'; data _null_; retain t '09'x; ** ASCII tab character ('05'x on EBCDIC); file out; if _n_ = 1 then /*title and Column Hdgs*/ put 'Legacy Code - Tab delimited output' / 'Name' t 'Gender' t 'Age' t 'Height'; set sashelp.class; put name t sex t age t height; run;
Partial Output - appearance of file when opened in Excel Legacy Code - Tab delimited output Name Gender Age Height Alfred M 14 69 Alice F 13 56.5 Barbara F 13 65.3 Carol F 14 62.8 Henry M 14 63.5 James M 12 57.3 Jane F 12 59.8 Janet F 15 62.5 Jeffrey M 13 62.5 John M 12 59
Legacy Code - Text File Output Name Gender Age Height Alfred M 14 69.0 Alice F 13 56.5 Barbara F 13 65.3 Carol F 14 62.8 Henry M 14 63.5 James M 12 57.3 Jane F 12 59.8 Janet F 15 62.5 Jeffrey M 13 62.5
3
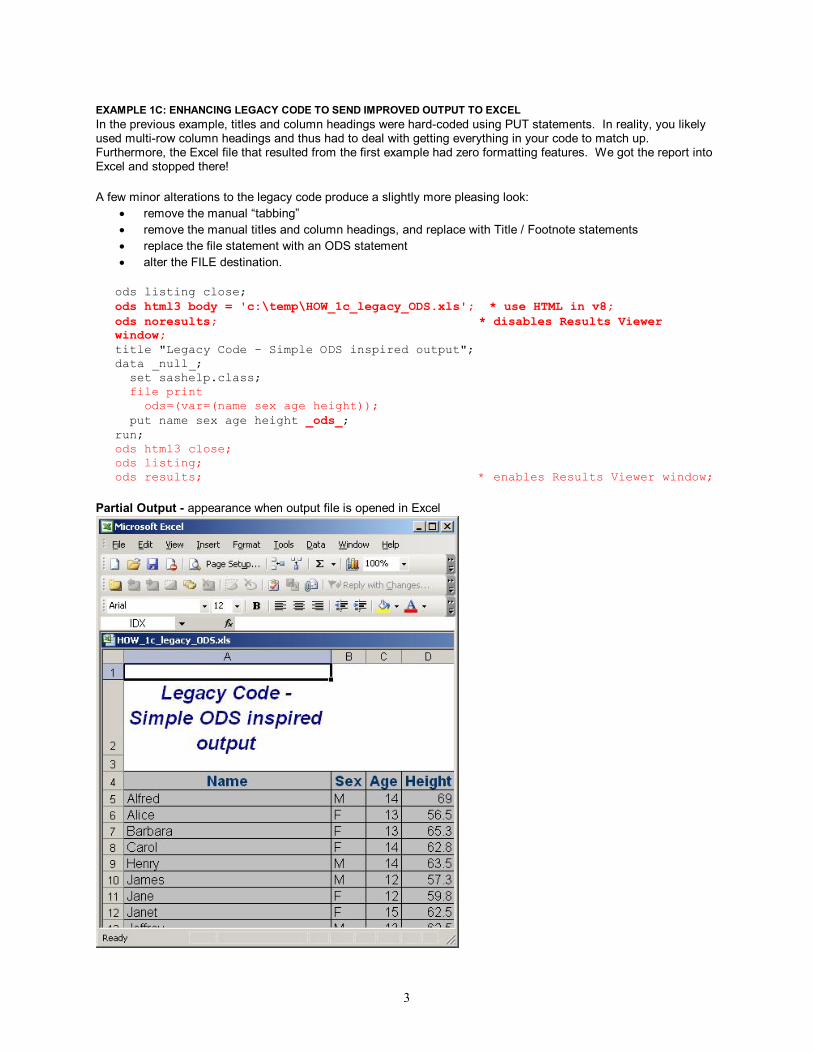
EXAMPLE 1C: ENHANCING LEGACY CODE TO SEND IMPROVED OUTPUT TO EXCEL In the previous example, titles and column headings were hard-coded using PUT statements. In reality, you likely used multi-row column headings and thus had to deal with getting everything in your code to match up. Furthermore, the Excel file that resulted from the first example had zero formatting features. We got the report into Excel and stopped there! A few minor alterations to the legacy code produce a slightly more pleasing look:
• remove the manual “tabbing” • remove the manual titles and column headings, and replace with Title / Footnote statements • replace the file statement with an ODS statement • alter the FILE destination.
ods listing close; ods html3 body = 'c:\temp\HOW_1c_legacy_ODS.xls'; * use HTML in v8; ods noresults; * disables Results Viewer window; title "Legacy Code - Simple ODS inspired output"; data _null_; set sashelp.class; file print ods=(var=(name sex age height)); put name sex age height _ods_; run; ods html3 close; ods listing; ods results; * enables Results Viewer window;
Partial Output - appearance when output file is opened in Excel
4
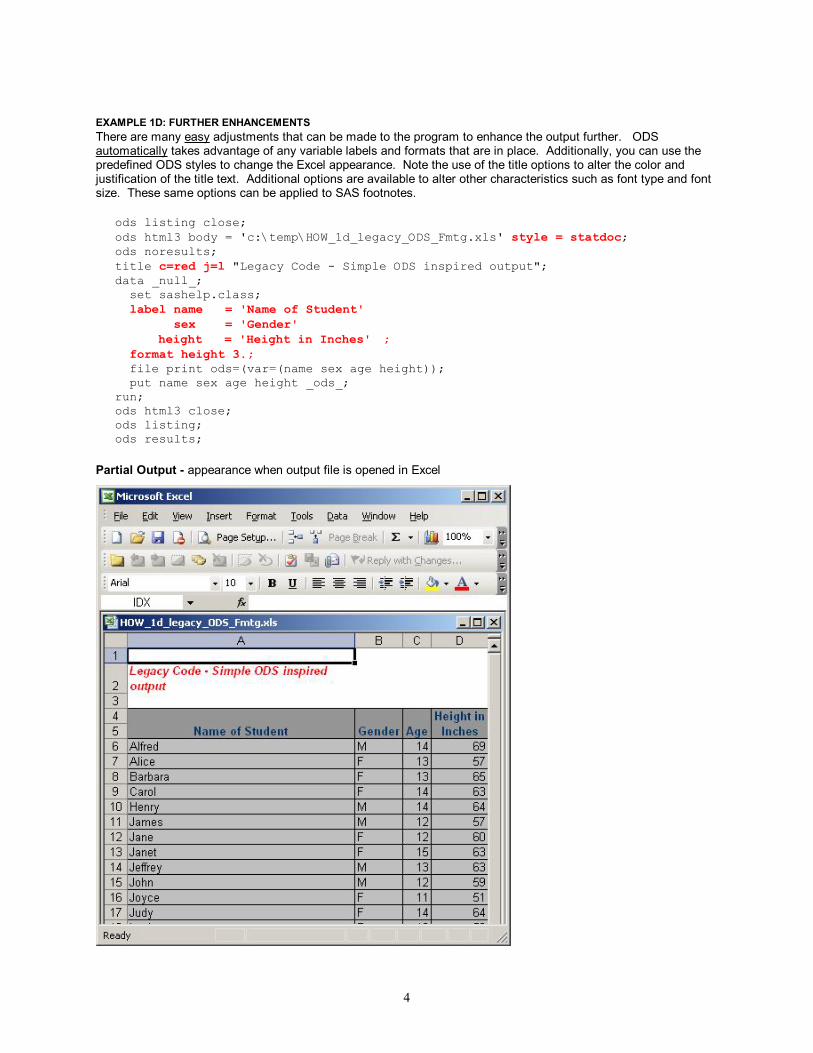
EXAMPLE 1D: FURTHER ENHANCEMENTS There are many easy adjustments that can be made to the program to enhance the output further. ODS automatically takes advantage of any variable labels and formats that are in place. Additionally, you can use the predefined ODS styles to change the Excel appearance. Note the use of the title options to alter the color and justification of the title text. Additional options are available to alter other characteristics such as font type and font size. These same options can be applied to SAS footnotes.
ods listing close; ods html3 body = 'c:\temp\HOW_1d_legacy_ODS_Fmtg.xls' style = statdoc; ods noresults; title c=red j=l "Legacy Code - Simple ODS inspired output"; data _null_; set sashelp.class; label name = 'Name of Student' sex = 'Gender' height = 'Height in Inches' ; format height 3.; file print ods=(var=(name sex age height)); put name sex age height _ods_; run; ods html3 close; ods listing; ods results;
Partial Output - appearance when output file is opened in Excel
5
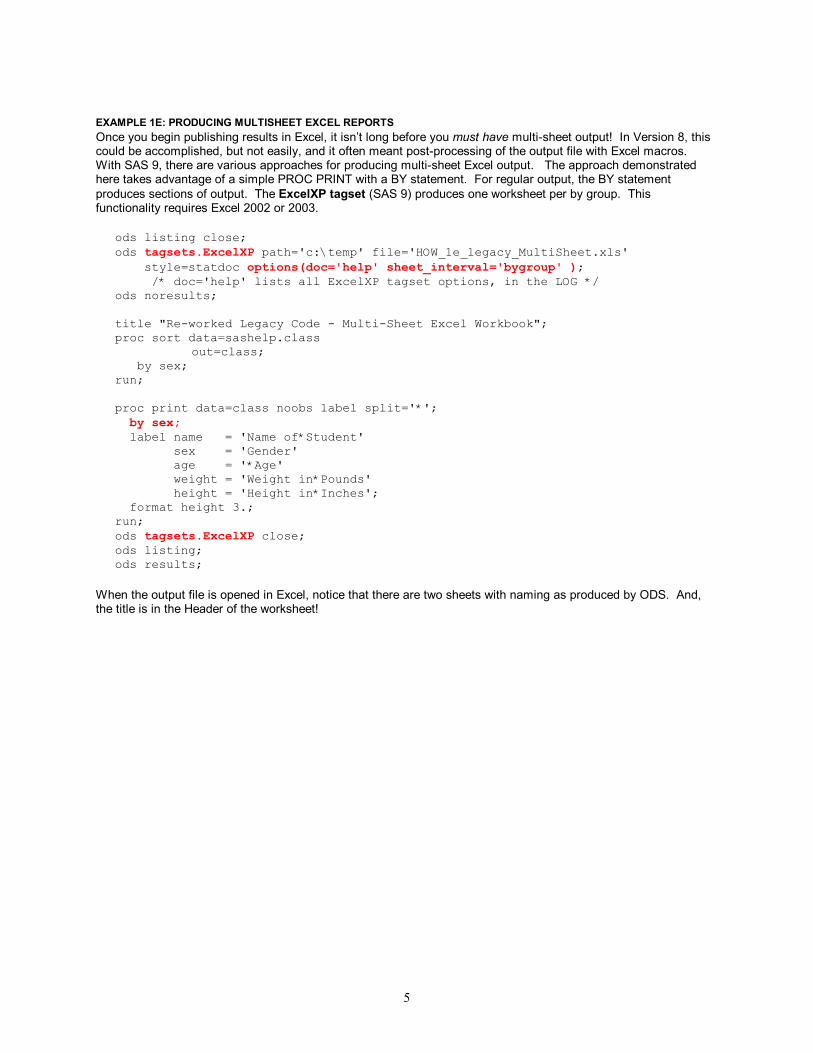
EXAMPLE 1E: PRODUCING MULTISHEET EXCEL REPORTS Once you begin publishing results in Excel, it isn’t long before you must have multi-sheet output! In Version 8, this could be accomplished, but not easily, and it often meant post-processing of the output file with Excel macros. With SAS 9, there are various approaches for producing multi-sheet Excel output. The approach demonstrated here takes advantage of a simple PROC PRINT with a BY statement. For regular output, the BY statement produces sections of output. The ExcelXP tagset (SAS 9) produces one worksheet per by group. This functionality requires Excel 2002 or 2003.
ods listing close; ods tagsets.ExcelXP path='c:\temp' file='HOW_1e_legacy_MultiSheet.xls' style=statdoc options(doc='help' sheet_interval='bygroup' ); /* doc='help' lists all ExcelXP tagset options, in the LOG */ ods noresults; title "Re-worked Legacy Code - Multi-Sheet Excel Workbook"; proc sort data=sashelp.class
out=class; by sex; run; proc print data=class noobs label split='*'; by sex; label name = 'Name of*Student' sex = 'Gender' age = '*Age' weight = 'Weight in*Pounds' height = 'Height in*Inches'; format height 3.; run; ods tagsets.ExcelXP close; ods listing; ods results;
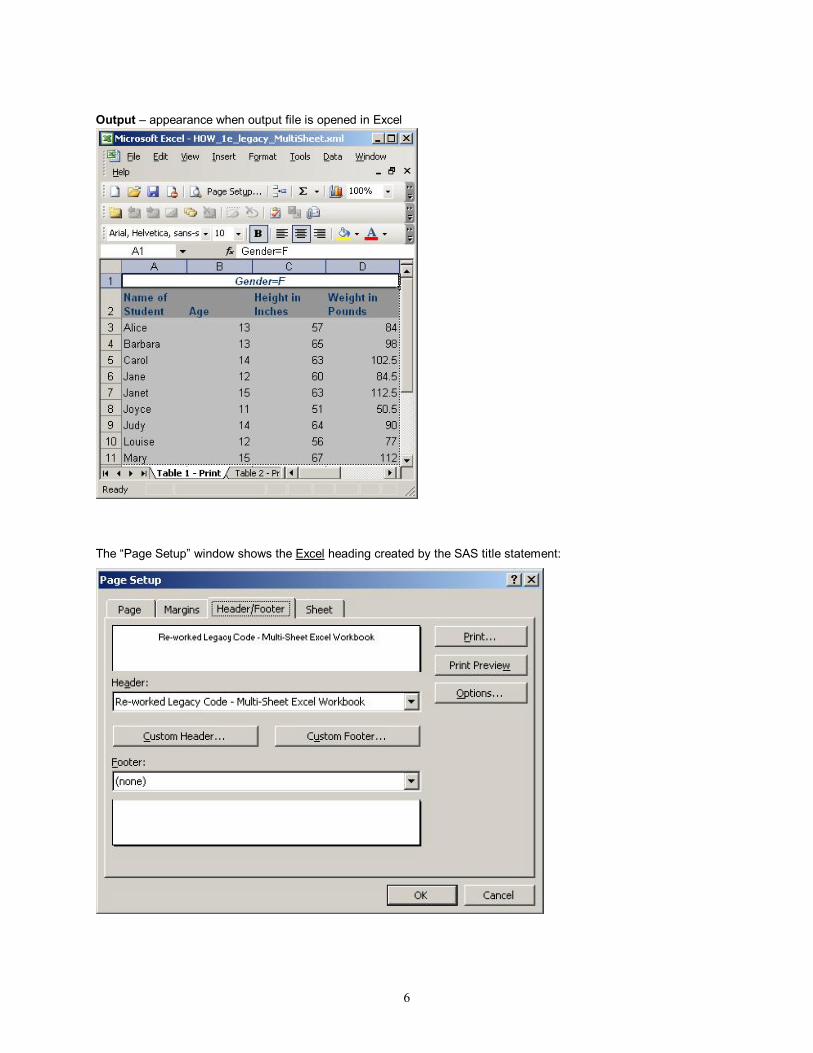
When the output file is opened in Excel, notice that there are two sheets with naming as produced by ODS. And, the title is in the Header of the worksheet!
6
Output – appearance when output file is opened in Excel
The “Page Setup” window shows the Excel heading created by the SAS title statement:
7
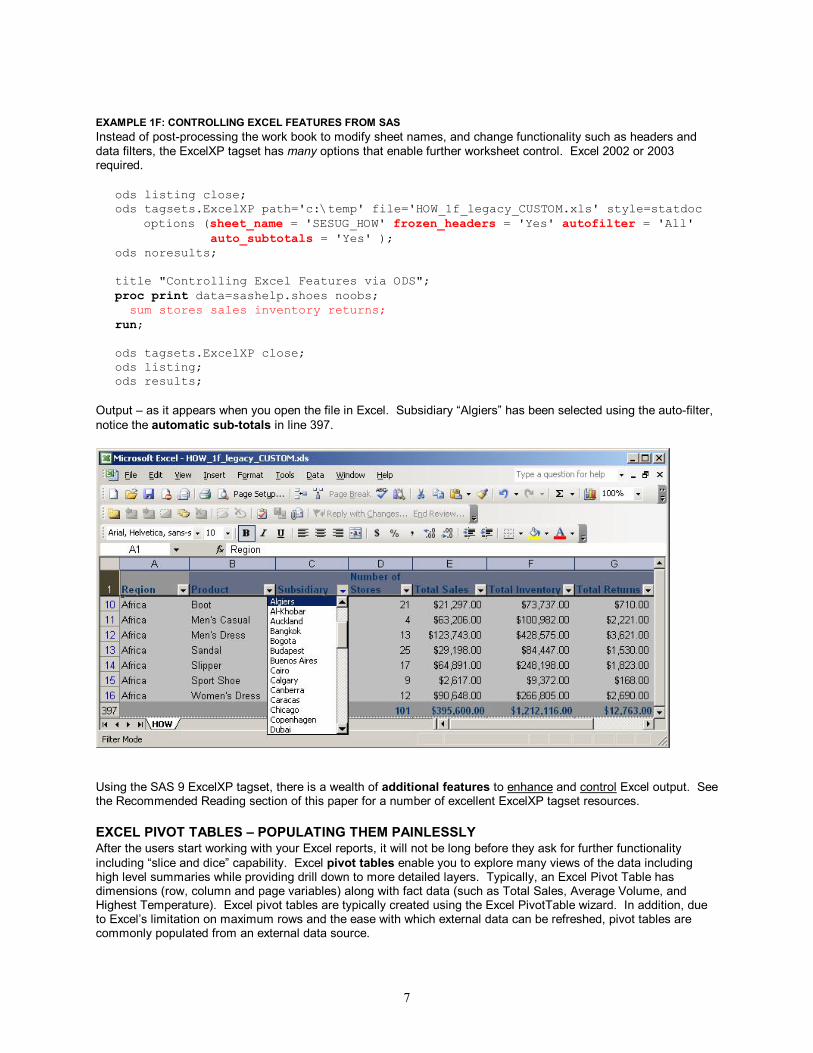
EXAMPLE 1F: CONTROLLING EXCEL FEATURES FROM SAS Instead of post-processing the work book to modify sheet names, and change functionality such as headers and data filters, the ExcelXP tagset has many options that enable further worksheet control. Excel 2002 or 2003 required.
ods listing close; ods tagsets.ExcelXP path='c:\temp' file='HOW_1f_legacy_CUSTOM.xls' style=statdoc options (sheet_name = 'SESUG_HOW' frozen_headers = 'Yes' autofilter = 'All' auto_subtotals = 'Yes' ); ods noresults; title "Controlling Excel Features via ODS"; proc print data=sashelp.shoes noobs; sum stores sales inventory returns; run; ods tagsets.ExcelXP close; ods listing; ods results;
Output – as it appears when you open the file in Excel. Subsidiary “Algiers” has been selected using the auto-filter, notice the automatic sub-totals in line 397.
Using the SAS 9 ExcelXP tagset, there is a wealth of additional features to enhance and control Excel output. See the Recommended Reading section of this paper for a number of excellent ExcelXP tagset resources.
EXCEL PIVOT TABLES – POPULATING THEM PAINLESSLY After the users start working with your Excel reports, it will not be long before they ask for further functionality including “slice and dice” capability. Excel pivot tables enable you to explore many views of the data including high level summaries while providing drill down to more detailed layers. Typically, an Excel Pivot Table has dimensions (row, column and page variables) along with fact data (such as Total Sales, Average Volume, and Highest Temperature). Excel pivot tables are typically created using the Excel PivotTable wizard. In addition, due to Excel’s limitation on maximum rows and the ease with which external data can be refreshed, pivot tables are commonly populated from an external data source.
8
When you publish your pivot table report, you must have a strategy for easily refreshing the data. This also means you need a reliable and consistent mechanism for feeding source data into Excel. Two candidates are CSV and XML files, both of which are easily produced by SAS. Unless drill down capability to detail data is required, pivot tables work best if they’re sourced from a summarized cube rather than a large detail file. PROC summary is great at producing cubes. The sample data used in the following example is from the summarized data in SASHELP.PRDSALE: proc export data=sashelp.prdsale outfile='c:\temp\PrdSale_dataInExcel.xls'; run; After opening c:\temp\PrdSale_dataInExcel.xls:
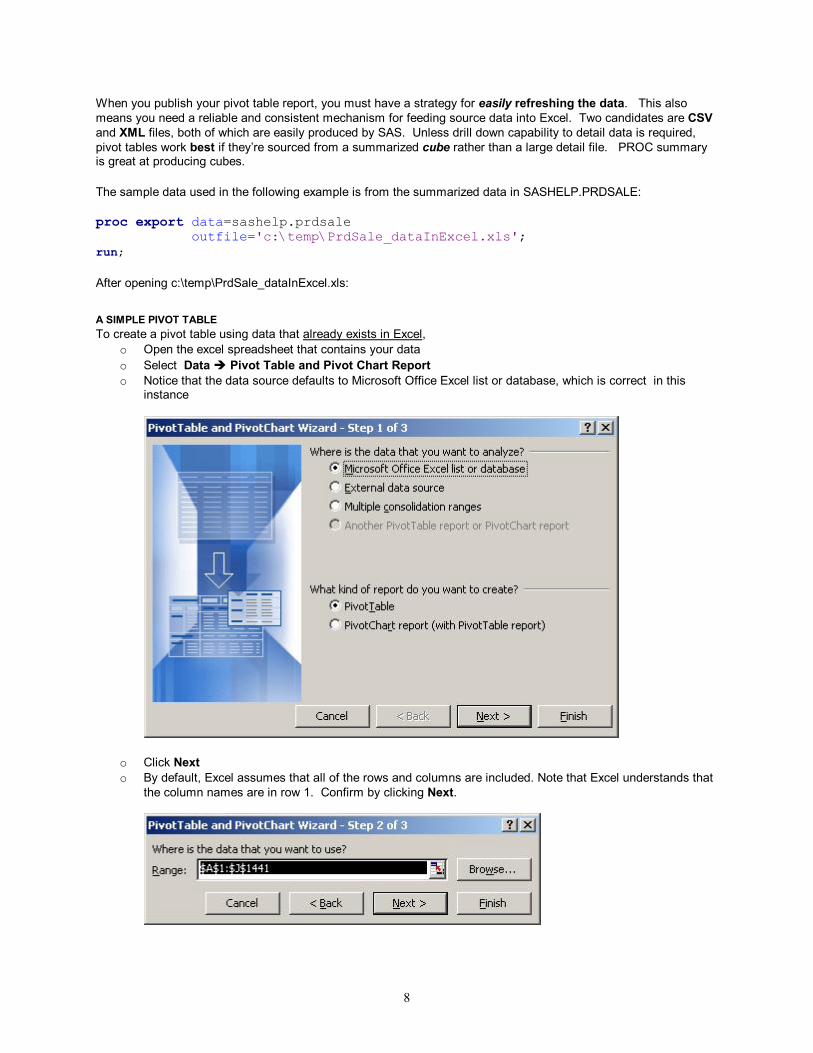
A SIMPLE PIVOT TABLE To create a pivot table using data that already exists in Excel,
o Open the excel spreadsheet that contains your data o Select Data è Pivot Table and Pivot Chart Report o Notice that the data source defaults to Microsoft Office Excel list or database, which is correct in this
instance
o Click Next o By default, Excel assumes that all of the rows and columns are included. Note that Excel understands that
the column names are in row 1. Confirm by clicking Next.
9
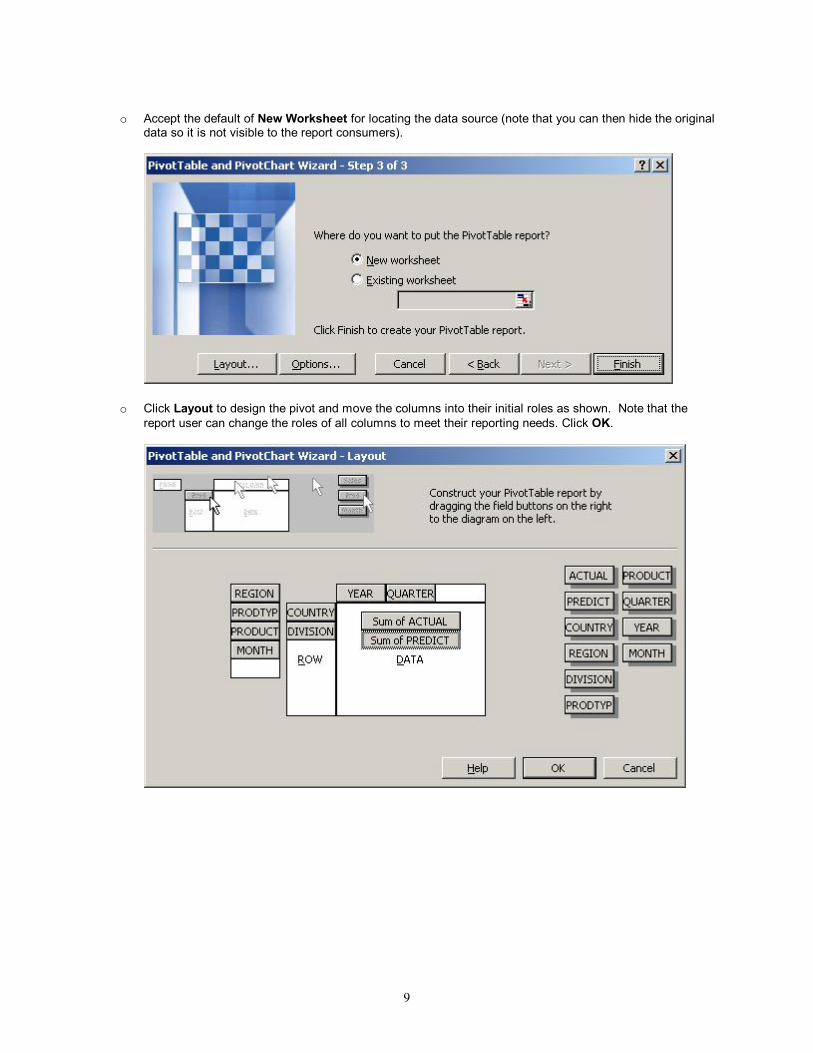
o Accept the default of New Worksheet for locating the data source (note that you can then hide the original
data so it is not visible to the report consumers).
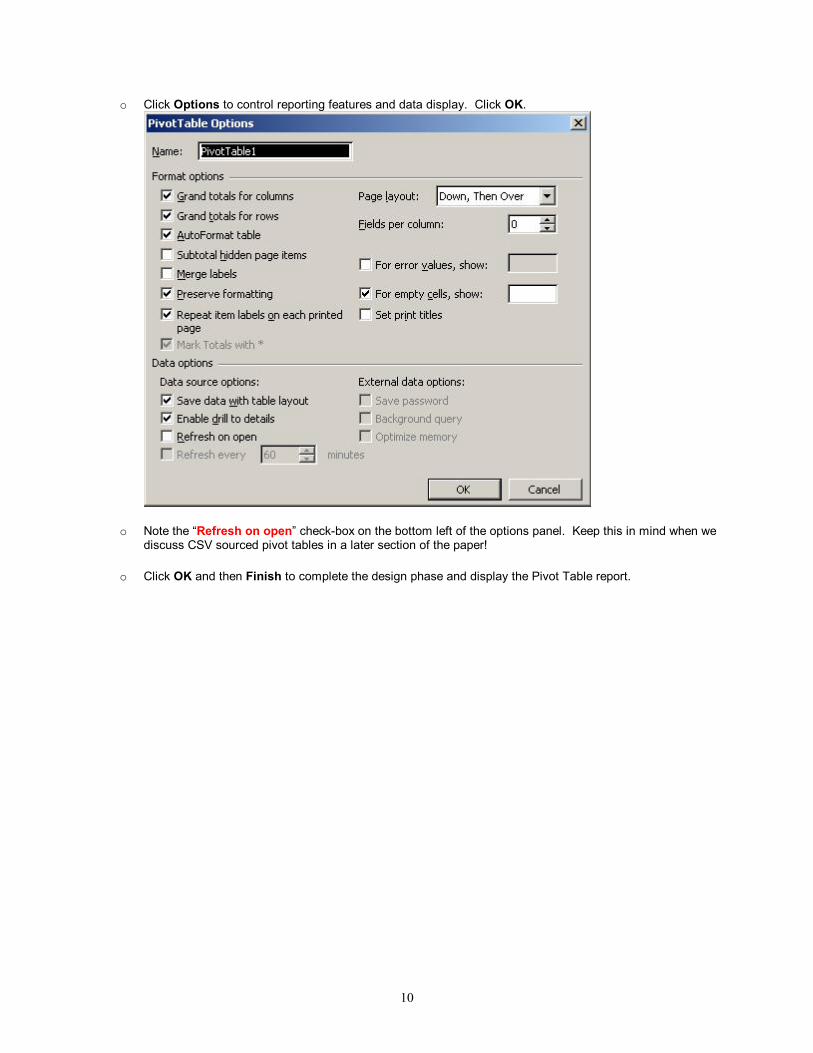
o Click Layout to design the pivot and move the columns into their initial roles as shown. Note that the
report user can change the roles of all columns to meet their reporting needs. Click OK.
10
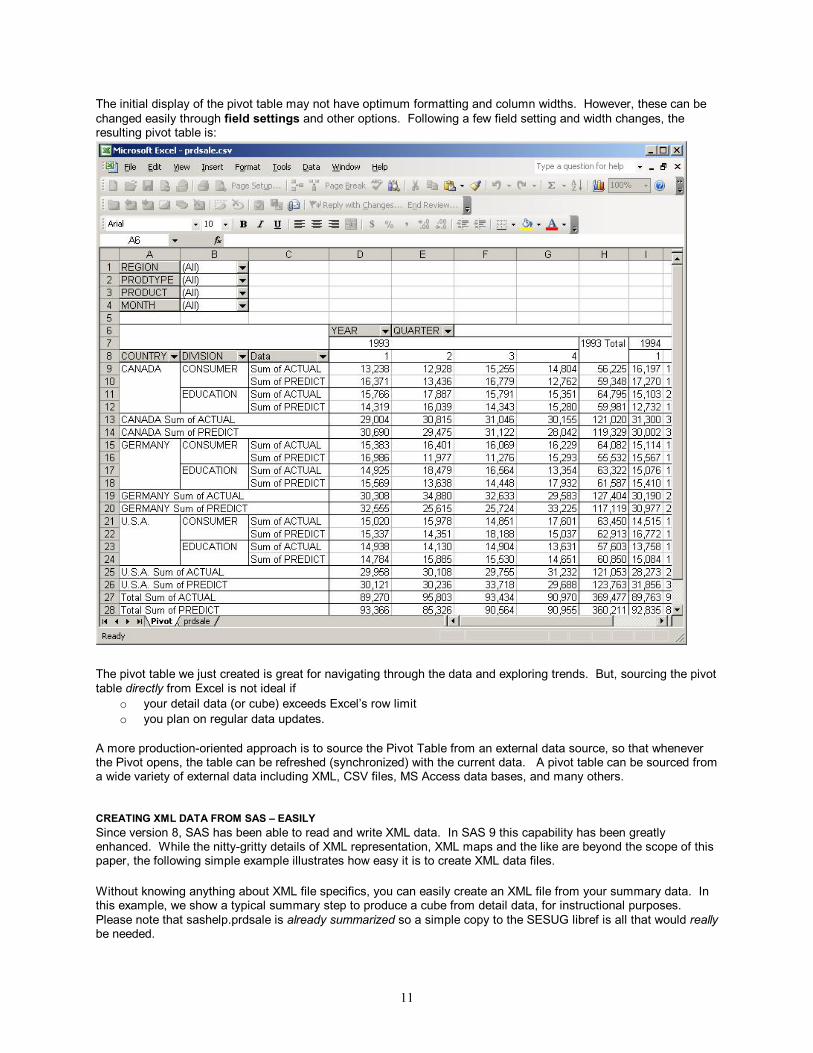
o Click Options to control reporting features and data display. Click OK.
o Note the “Refresh on open” check-box on the bottom left of the options panel. Keep this in mind when we
discuss CSV sourced pivot tables in a later section of the paper!
o Click OK and then Finish to complete the design phase and display the Pivot Table report.
11
The initial display of the pivot table may not have optimum formatting and column widths. However, these can be changed easily through field settings and other options. Following a few field setting and width changes, the resulting pivot table is:
The pivot table we just created is great for navigating through the data and exploring trends. But, sourcing the pivot table directly from Excel is not ideal if
o your detail data (or cube) exceeds Excel’s row limit o you plan on regular data updates.
A more production-oriented approach is to source the Pivot Table from an external data source, so that whenever the Pivot opens, the table can be refreshed (synchronized) with the current data. A pivot table can be sourced from a wide variety of external data including XML, CSV files, MS Access data bases, and many others.
CREATING XML DATA FROM SAS – EASILY Since version 8, SAS has been able to read and write XML data. In SAS 9 this capability has been greatly enhanced. While the nitty-gritty details of XML representation, XML maps and the like are beyond the scope of this paper, the following simple example illustrates how easy it is to create XML data files. Without knowing anything about XML file specifics, you can easily create an XML file from your summary data. In this example, we show a typical summary step to produce a cube from detail data, for instructional purposes. Please note that sashelp.prdsale is already summarized so a simple copy to the SESUG libref is all that would really be needed.
12
libname sesug xml 'C:\temp\Prdsale_xml.xml'; ** available in V8 and SAS 9; /* these data are already summarized - code illustrates "creating the cube" */ proc summary data=sashelp.prdsale nway; class country region division prodtype product year quarter month; var actual predict; output out=sesug.pivot(drop = _type_ _freq_) sum=; run;
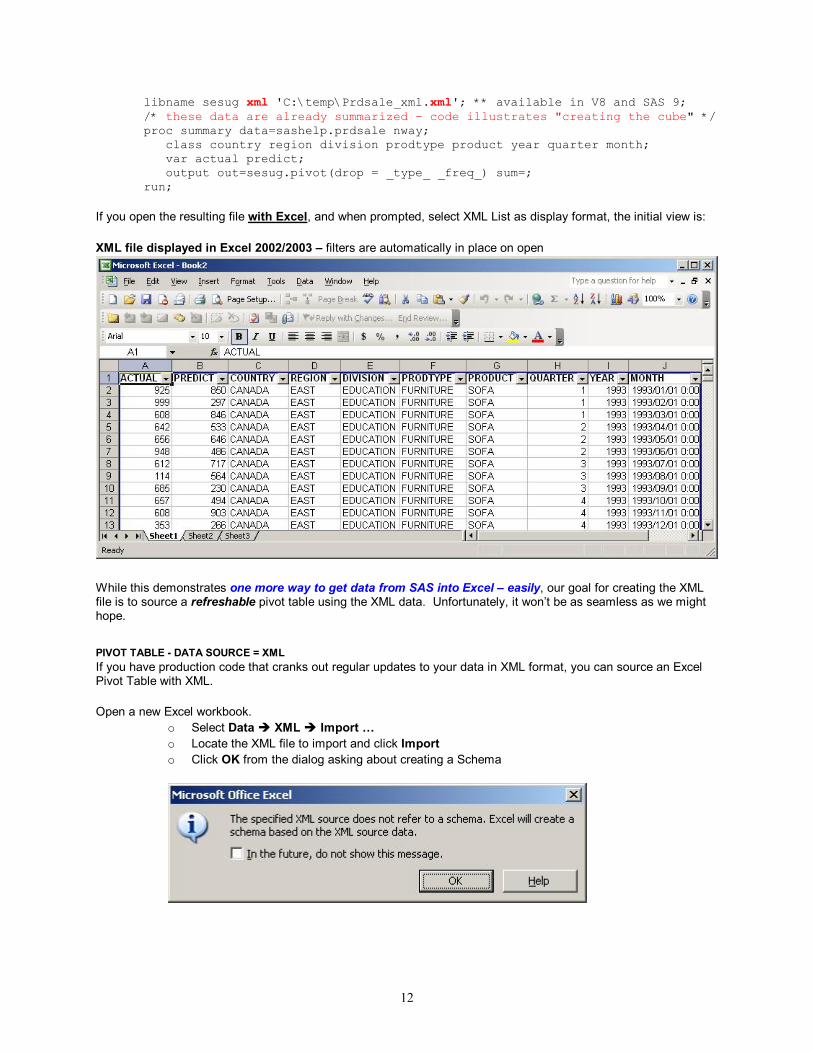
If you open the resulting file with Excel, and when prompted, select XML List as display format, the initial view is: XML file displayed in Excel 2002/2003 – filters are automatically in place on open
While this demonstrates one more way to get data from SAS into Excel – easily, our goal for creating the XML file is to source a refreshable pivot table using the XML data. Unfortunately, it won’t be as seamless as we might hope.
PIVOT TABLE - DATA SOURCE = XML If you have production code that cranks out regular updates to your data in XML format, you can source an Excel Pivot Table with XML. Open a new Excel workbook.
o Select Data è XML è Import … o Locate the XML file to import and click Import o Click OK from the dialog asking about creating a Schema
13
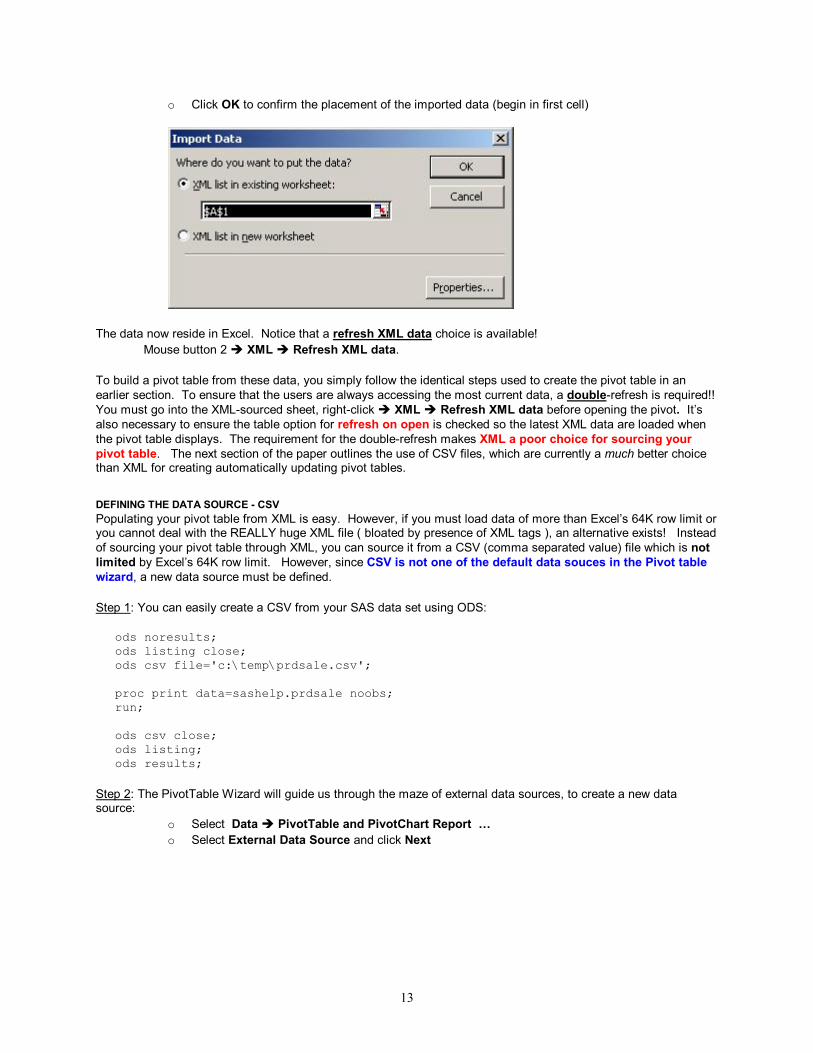
o Click OK to confirm the placement of the imported data (begin in first cell)
The data now reside in Excel. Notice that a refresh XML data choice is available!
Mouse button 2 è XML è Refresh XML data. To build a pivot table from these data, you simply follow the identical steps used to create the pivot table in an earlier section. To ensure that the users are always accessing the most current data, a double-refresh is required!! You must go into the XML-sourced sheet, right-click è XML è Refresh XML data before opening the pivot. It’s also necessary to ensure the table option for refresh on open is checked so the latest XML data are loaded when the pivot table displays. The requirement for the double-refresh makes XML a poor choice for sourcing your pivot table. The next section of the paper outlines the use of CSV files, which are currently a much better choice than XML for creating automatically updating pivot tables.
DEFINING THE DATA SOURCE - CSV Populating your pivot table from XML is easy. However, if you must load data of more than Excel’s 64K row limit or you cannot deal with the REALLY huge XML file ( bloated by presence of XML tags ), an alternative exists! Instead of sourcing your pivot table through XML, you can source it from a CSV (comma separated value) file which is not limited by Excel’s 64K row limit. However, since CSV is not one of the default data souces in the Pivot table wizard, a new data source must be defined. Step 1: You can easily create a CSV from your SAS data set using ODS:
ods noresults; ods listing close; ods csv file='c:\temp\prdsale.csv'; proc print data=sashelp.prdsale noobs; run; ods csv close; ods listing; ods results;
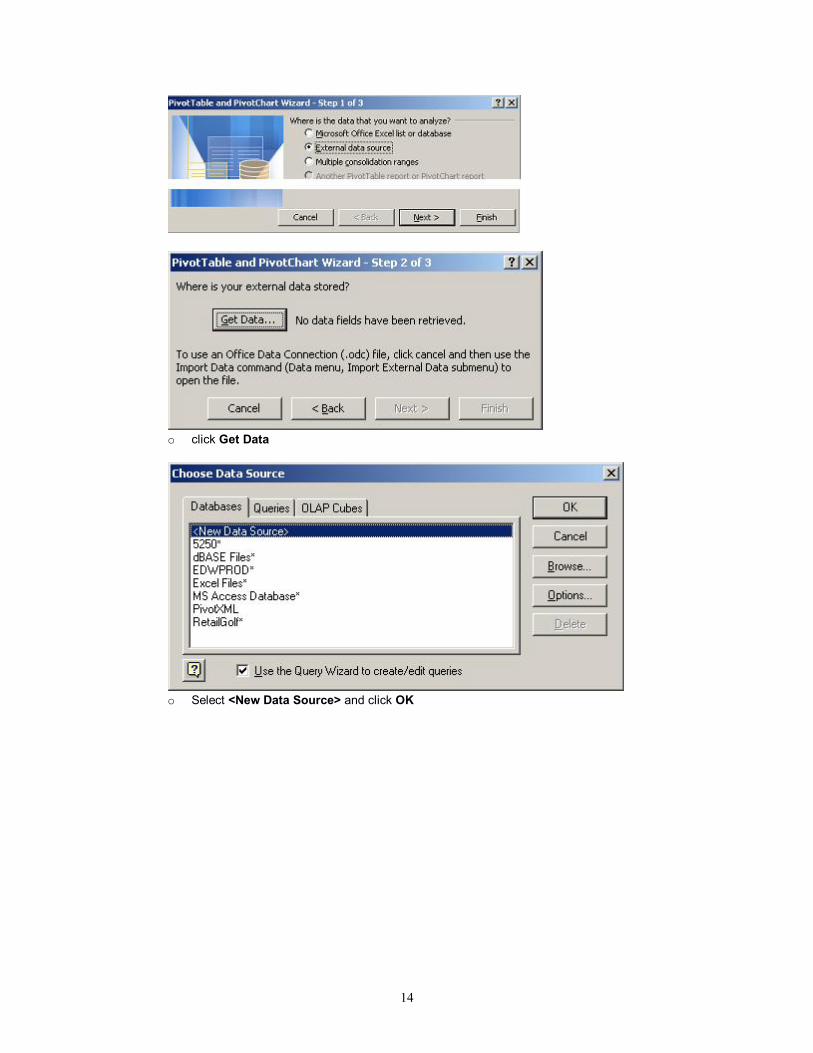
Step 2: The PivotTable Wizard will guide us through the maze of external data sources, to create a new data source:
o Select Data è PivotTable and PivotChart Report … o Select External Data Source and click Next
14
o click Get Data
o Select <New Data Source> and click OK
15
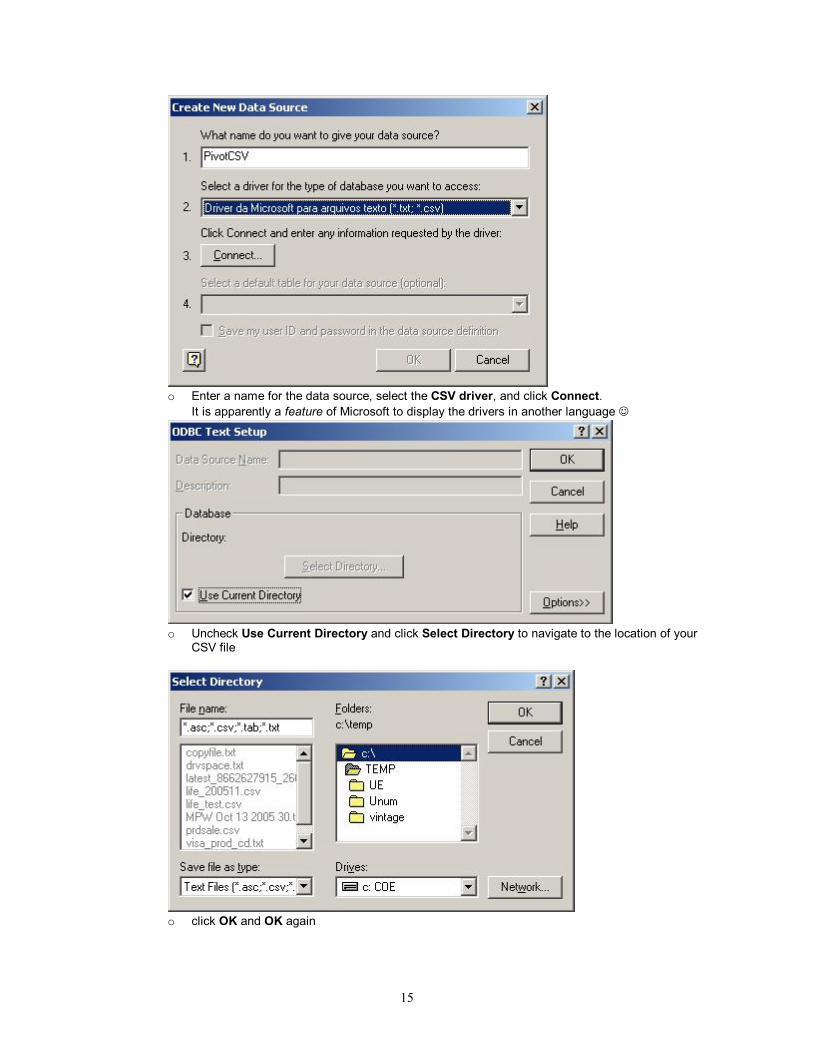
o Enter a name for the data source, select the CSV driver, and click Connect.
It is apparently a feature of Microsoft to display the drivers in another language ☺
o Uncheck Use Current Directory and click Select Directory to navigate to the location of your
CSV file
o click OK and OK again
16
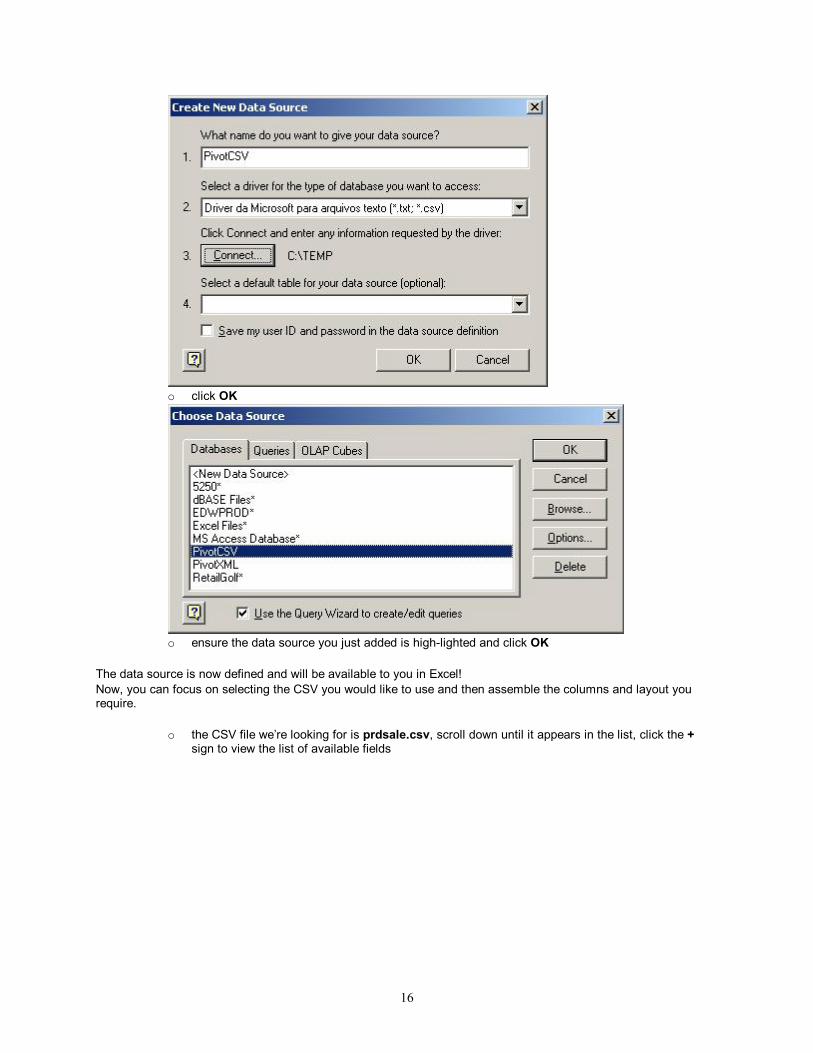
o click OK
o ensure the data source you just added is high-lighted and click OK
The data source is now defined and will be available to you in Excel! Now, you can focus on selecting the CSV you would like to use and then assemble the columns and layout you require.
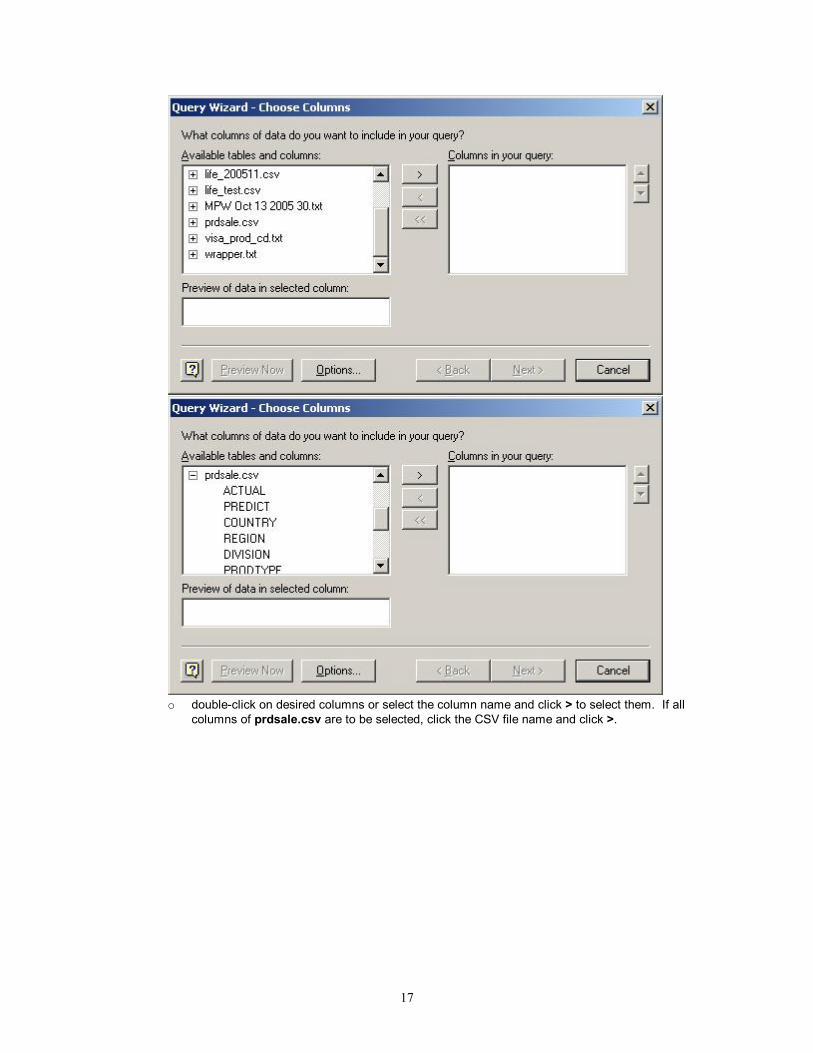
o the CSV file we’re looking for is prdsale.csv, scroll down until it appears in the list, click the +
sign to view the list of available fields
17
o double-click on desired columns or select the column name and click > to select them. If all
columns of prdsale.csv are to be selected, click the CSV file name and click >.
18
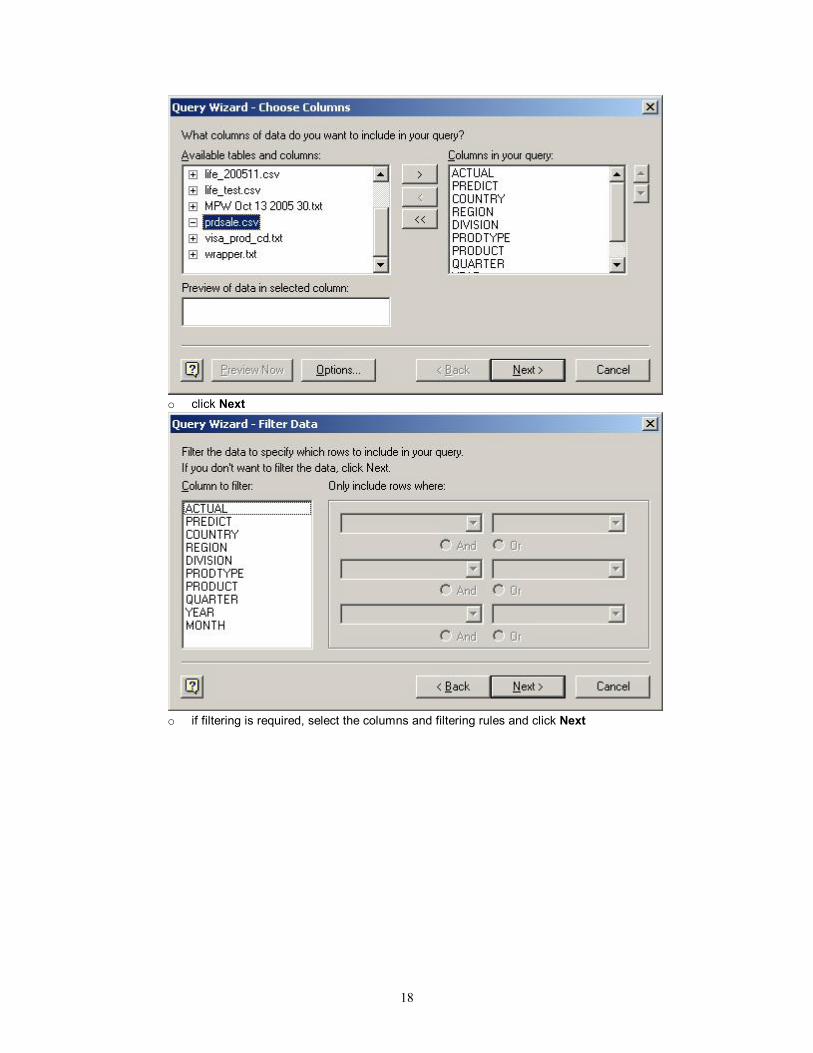
o click Next
o if filtering is required, select the columns and filtering rules and click Next
19
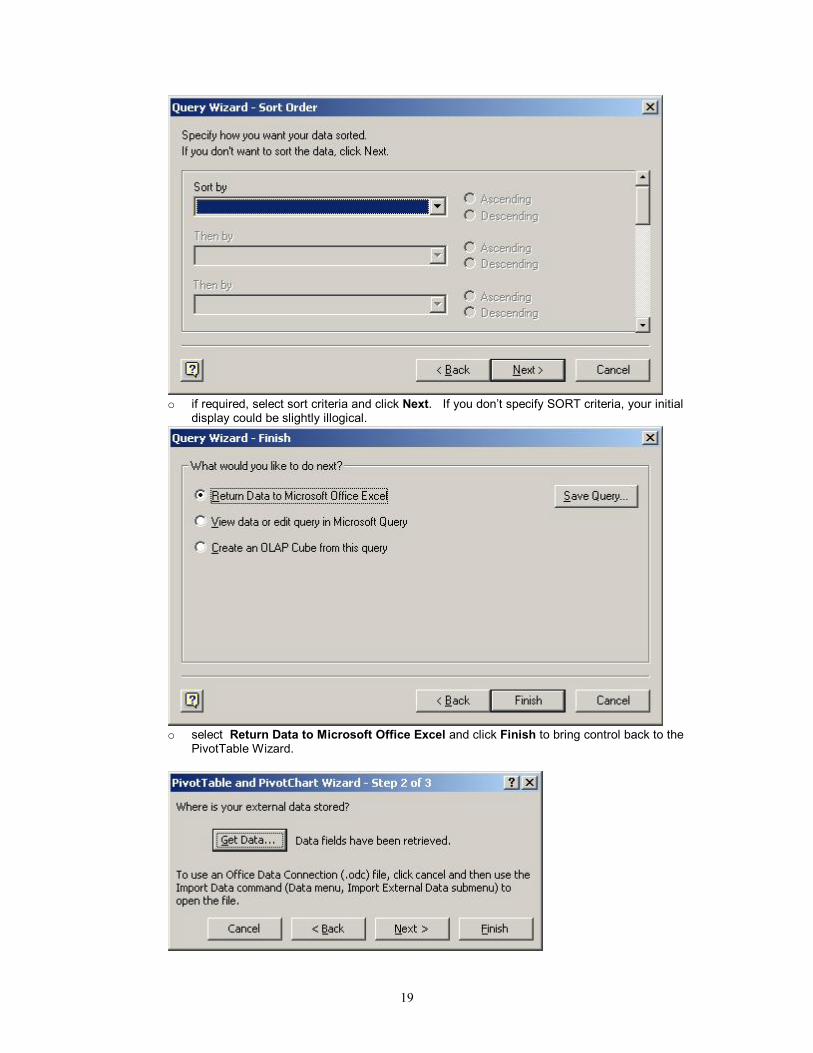
o if required, select sort criteria and click Next. If you don’t specify SORT criteria, your initial
display could be slightly illogical.
o select Return Data to Microsoft Office Excel and click Finish to bring control back to the
PivotTable Wizard.
20
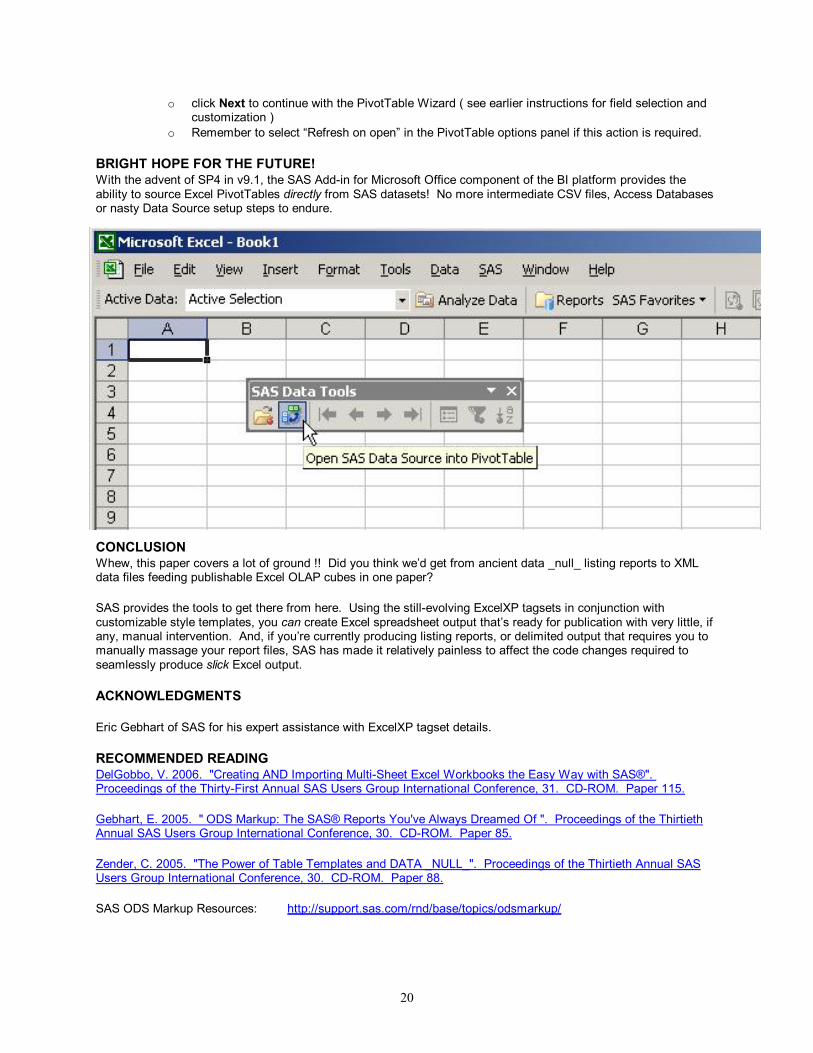
o click Next to continue with the PivotTable Wizard ( see earlier instructions for field selection and customization )
o Remember to select “Refresh on open” in the PivotTable options panel if this action is required.
BRIGHT HOPE FOR THE FUTURE! With the advent of SP4 in v9.1, the SAS Add-in for Microsoft Office component of the BI platform provides the ability to source Excel PivotTables directly from SAS datasets! No more intermediate CSV files, Access Databases or nasty Data Source setup steps to endure.
CONCLUSION Whew, this paper covers a lot of ground !! Did you think we’d get from ancient data _null_ listing reports to XML data files feeding publishable Excel OLAP cubes in one paper? SAS provides the tools to get there from here. Using the still-evolving ExcelXP tagsets in conjunction with customizable style templates, you can create Excel spreadsheet output that’s ready for publication with very little, if any, manual intervention. And, if you’re currently producing listing reports, or delimited output that requires you to manually massage your report files, SAS has made it relatively painless to affect the code changes required to seamlessly produce slick Excel output.
ACKNOWLEDGMENTS Eric Gebhart of SAS for his expert assistance with ExcelXP tagset details.
RECOMMENDED READING DelGobbo, V. 2006. "Creating AND Importing Multi-Sheet Excel Workbooks the Easy Way with SAS®". Proceedings of the Thirty-First Annual SAS Users Group International Conference, 31. CD-ROM. Paper 115. Gebhart, E. 2005. " ODS Markup: The SAS® Reports You've Always Dreamed Of ". Proceedings of the Thirtieth Annual SAS Users Group International Conference, 30. CD-ROM. Paper 85. Zender, C. 2005. "The Power of Table Templates and DATA _NULL_". Proceedings of the Thirtieth Annual SAS Users Group International Conference, 30. CD-ROM. Paper 88. SAS ODS Markup Resources: http://support.sas.com/rnd/base/topics/odsmarkup/

21
CONTACT INFORMATION Your comments and questions are valued and encouraged. Contact the authors at:
Marje Fecht Prowerk Consulting [email protected] www.prowerk.com Harry Droogendyk Stratia Consulting Inc. [email protected]
SAS and all other SAS Institute Inc. product or service names are registered trademarks or trademarks of SAS Institute Inc. in the USA and other countries. ® indicates USA registration. Other brand and product names are trademarks of their respective companies.