Embed Size (px)
Citation preview
Sartorius Stedim Biotech Group First-Half Financial Report from January to June 2015
2015
2
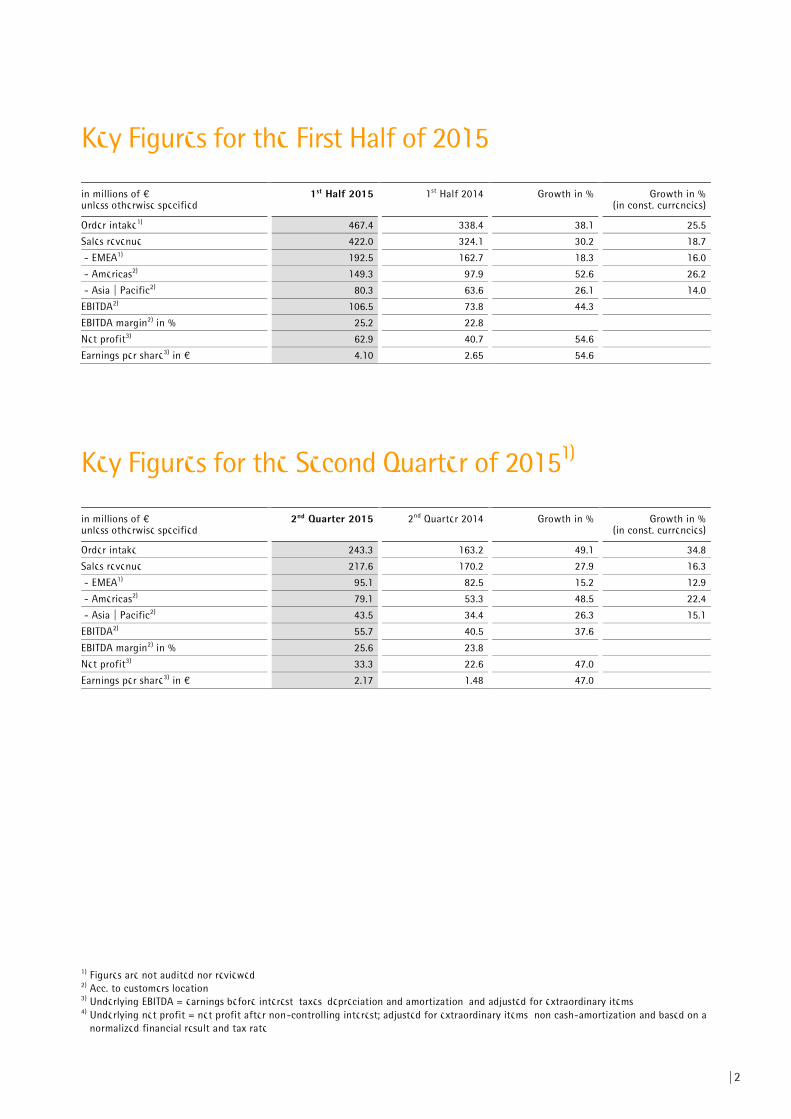
in millions of € unless otherwise specified
1st Half 2015
1st Half 2014
Growth in %
Growth in % (in const. currencies)
Order intake1) 467.4 338.4 38.1 25.5
Sales revenue 422.0 324.1 30.2 18.7
- EMEA1) 192.5 162.7 18.3 16.0
- Americas2) 149.3 97.9 52.6 26.2
- Asia | Pacific2) 80.3 63.6 26.1 14.0
EBITDA2) 106.5 73.8 44.3
EBITDA margin2) in % 25.2 22.8
Net profit3) 62.9 40.7 54.6
Earnings per share3) in € 4.10 2.65 54.6
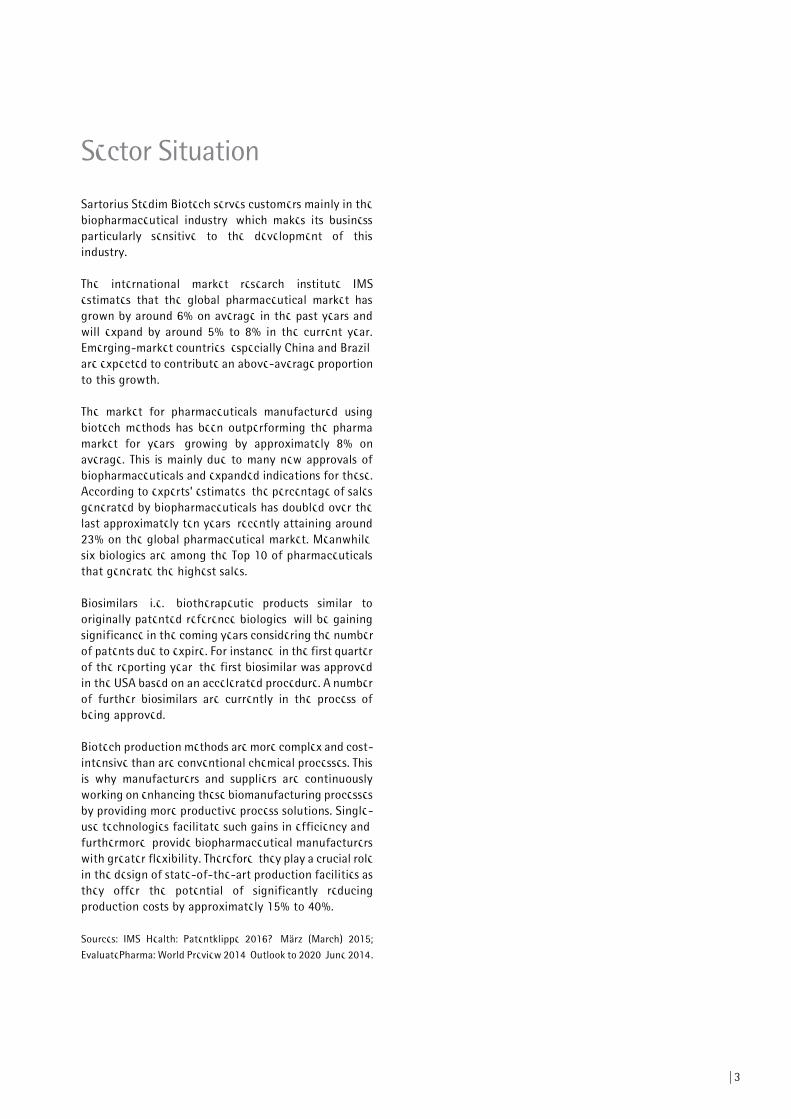
Key Figures for the Second Quarter of 20151)
in millions of € unless otherwise specified
2nd Quarter 2015
2nd Quarter 2014
Growth in %
Growth in % (in const. currencies)
Order intake 243.3 163.2 49.1 34.8
Sales revenue 217.6 170.2 27.9 16.3
- EMEA1) 95.1 82.5 15.2 12.9
- Americas2) 79.1 53.3 48.5 22.4
- Asia | Pacific2) 43.5 34.4 26.3 15.1
EBITDA2) 55.7 40.5 37.6
EBITDA margin2) in % 25.6 23.8
Net profit3) 33.3 22.6 47.0
Earnings per share3) in € 2.17 1.48 47.0
1) Figures are not audited nor reviewed
2) Acc. to customers location 3) Underlying EBITDA = earnings before interest, taxes, depreciation and amortization, and adjusted for extraordinary items 4) Underlying net profit = net profit after non-controlling interest; adjusted for extraordinary items, non cash-amortization and based on a
normalized financial result and tax rate
Key Figures for the First Half of 2015
3
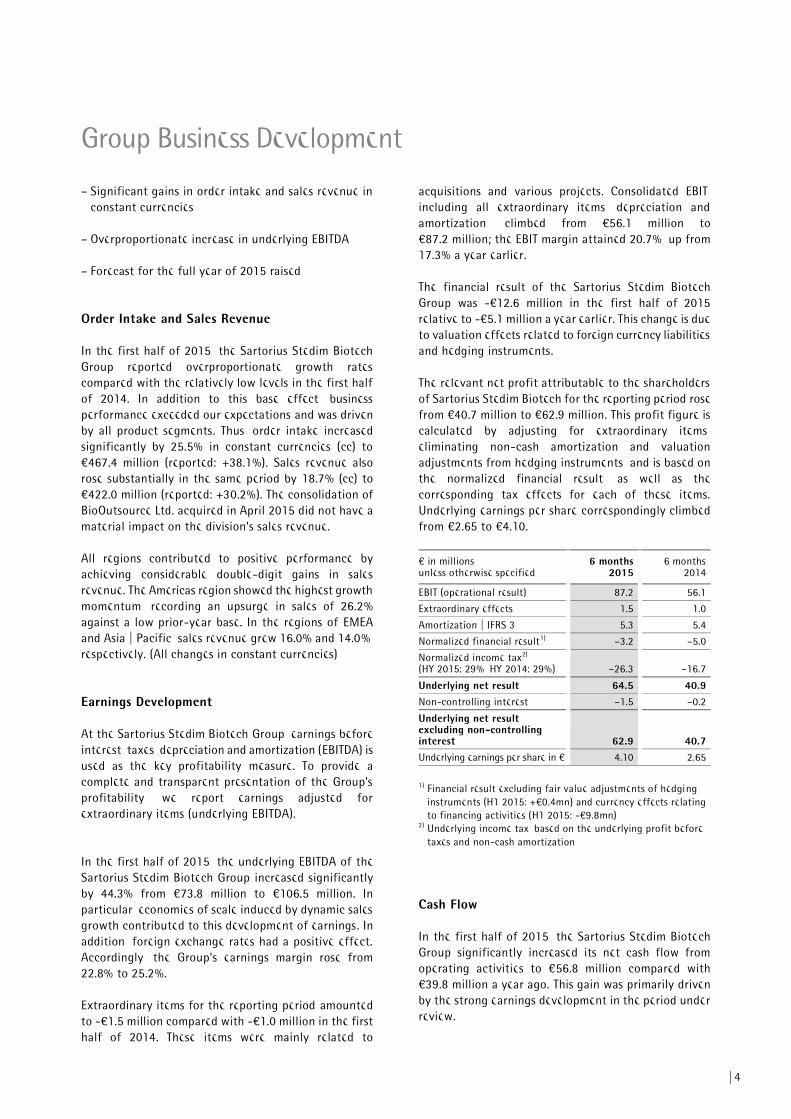
Sector Situation
Sartorius Stedim Biotech serves customers mainly in the biopharmaceutical industry, which makes its business particularly sensitive to the development of this industry.
The international market research institute IMS estimates that the global pharmaceutical market has grown by around 6% on average in the past years and will expand by around 5% to 8% in the current year. Emerging-market countries, especially China and Brazil, are expected to contribute an above-average proportion to this growth.
The market for pharmaceuticals manufactured using biotech methods has been outperforming the pharma market for years, growing by approximately 8% on average. This is mainly due to many new approvals of biopharmaceuticals and expanded indications for these. According to experts’ estimates, the percentage of sales generated by biopharmaceuticals has doubled over the last approximately ten years, recently attaining around 23% on the global pharmaceutical market. Meanwhile, six biologics are among the Top 10 of pharmaceuticals that generate the highest sales.
Biosimilars, i.e., biotherapeutic products similar to originally patented reference biologics, will be gaining significance in the coming years considering the number of patents due to expire. For instance, in the first quarter of the reporting year, the first biosimilar was approved in the USA based on an accelerated procedure. A number of further biosimilars are currently in the process of being approved.
Biotech production methods are more complex and cost-intensive than are conventional chemical processes. This is why manufacturers and suppliers are continuously working on enhancing these biomanufacturing processes by providing more productive process solutions. Single-use technologies facilitate such gains in efficiency and, furthermore, provide biopharmaceutical manufacturers with greater flexibility. Therefore, they play a crucial role in the design of state-of-the-art production facilities as they offer the potential of significantly reducing production costs by approximately 15% to 40%.
Sources: IMS Health: Patentklippe 2016?, März (March) 2015;
EvaluatePharma: World Preview 2014, Outlook to 2020, June 2014.
4
– Significant gains in order intake and sales revenue in constant currencies
– Overproportionate increase in underlying EBITDA
– Forecast for the full year of 2015 raised
Order Intake and Sales Revenue
In the first half of 2015, the Sartorius Stedim Biotech Group reported overproportionate growth rates compared with the relatively low levels in the first half of 2014. In addition to this base effect, business performance exceeded our expectations and was driven by all product segments. Thus, order intake increased significantly by 25.5% in constant currencies (cc) to €467.4 million (reported: +38.1%). Sales revenue also rose substantially in the same period by 18.7% (cc) to €422.0 million (reported: +30.2%). The consolidation of BioOutsource Ltd. acquired in April 2015 did not have a material impact on the division’s sales revenue. All regions contributed to positive performance by achieving considerable double-digit gains in sales revenue. The Americas region showed the highest growth momentum, recording an upsurge in sales of 26.2% against a low prior-year base. In the regions of EMEA and Asia | Pacific, sales revenue grew 16.0% and 14.0%, respectively. (All changes in constant currencies)
Earnings Development
At the Sartorius Stedim Biotech Group, earnings before interest, taxes, depreciation and amortization (EBITDA) is used as the key profitability measure. To provide a complete and transparent presentation of the Group’s profitability, we report earnings adjusted for extraordinary items (underlying EBITDA).
In the first half of 2015, the underlying EBITDA of the Sartorius Stedim Biotech Group increased significantly by 44.3% from €73.8 million to €106.5 million. In particular, economies of scale induced by dynamic sales growth contributed to this development of earnings. In addition, foreign exchange rates had a positive effect. Accordingly, the Group’s earnings margin rose from 22.8% to 25.2%.
Extraordinary items for the reporting period amounted to -€1.5 million compared with -€1.0 million in the first half of 2014. These items were mainly related to
acquisitions and various projects. Consolidated EBIT, including all extraordinary items, depreciation and amortization, climbed from €56.1 million to €87.2 million; the EBIT margin attained 20.7%, up from 17.3% a year earlier.
The financial result of the Sartorius Stedim Biotech Group was -€12.6 million in the first half of 2015 relative to -€5.1 million a year earlier. This change is due to valuation effects related to foreign currency liabilities and hedging instruments.
The relevant net profit attributable to the shareholders of Sartorius Stedim Biotech for the reporting period rose from €40.7 million to €62.9 million. This profit figure is calculated by adjusting for extraordinary items, eliminating non-cash amortization and valuation adjustments from hedging instruments, and is based on the normalized financial result, as well as the corresponding tax effects for each of these items. Underlying earnings per share correspondingly climbed from €2.65 to €4.10.
€ in millions unless otherwise specified
6 months 2015
6 months 2014
EBIT (operational result) 87.2 56.1
Extraordinary effects 1.5 1.0
Amortization | IFRS 3 5.3 5.4
Normalized financial result1) –3.2 –5.0
Normalized income tax2) (HY 2015: 29%, HY 2014: 29%) –26.3 –16.7
Underlying net result 64.5 40.9 Non-controlling interest –1.5 –0.2
Underlying net result excluding non-controlling interest 62.9 40.7 Underlying earnings per share in € 4.10 2.65
1) Financial result excluding fair value adjustments of hedging instruments (H1 2015: +€0.4mn) and currency effects relating to financing activities (H1 2015: -€9.8mn)
2) Underlying income tax, based on the underlying profit before taxes and non-cash amortization
Cash Flow
In the first half of 2015, the Sartorius Stedim Biotech Group significantly increased its net cash flow from operating activities to €56.8 million compared with €39.8 million a year ago. This gain was primarily driven by the strong earnings development in the period under review.
Group Business Development
5
Net cash flow from investing activities and disposal of consolidated subsidiaries was -€20.9 million, up from the year-earlier figure of -€16.3 million as planned.
Acquisition activities in the reporting period accounted for -€29.3 million compared with the previous year’s figure of -€4.3 million and were essentially related to the takeover of BioOutsource.
Accordingly, net cash flow from investing activities was -€50.1 million relative to -€20.6 million in the first half of 2014. Thus, the Sartorius Stedim Biotech Group financed its investments entirely from operating cash flows.
Consolidated Statement of Financial Position
The balance sheet total for the Sartorius Stedim Biotech Group rose to €1,016.3 million as of the period ended June 30, 2015, from €907.3 million as of December 31, 2014. This rise was primarily due to seasonal buildup of working capital and the acquisition of BioOutsource.
Equity edged up from €539.1 million to €589.9 million between December 31, 2014, and the reporting date. At 58.0%, the equity ratio continued to stay at a comfortable level compared to 59.4% as of December 31, 2014.
Gross debt rose from €106.0 million as of December 31, 2014, to €140.7 million as of June 30, 2015. In addition to the seasonal buildup in net working capital, dividend payments and the acquisition of BioOutsource are reflected in this figure. Net debt amounted to €111.3 million relative to €87.4 million as of December 31, 2014.
The ratio of net debt to underlying EBITDA based on the past 12 months stood at 0.6 as of June 30, 2015, compared with 0.5 at the end of 2014.
Employees
As of June 30, 2015, the Sartorius Stedim Biotech Group employed a total of 3,925 people worldwide. Compared with December 31, 2014, headcount thus rose by 228 or around 6%. From a regional perspective, the dominant portion of this increase was attributed to the EMEA region, where the Group employed 222 additional staff. This gain was largely due to our recent acquisition of BioOutsource with a headcount of around 85 and to the extension of the workforce at various production units.
6
The opportunities and risk situation of the Sartorius Stedim Biotech Group has not materially changed since the publication of its 2014 Annual Report. For this reason, please refer to a detailed description of the opportunities and risks as well as the risk management system for the Sartorius Stedim Biotech Group on pp. 46 et seq. of the annual report called Reference Document 2014.
Forecast Report
Future Sector Environment
The trends described on pages 54-56 of our Reference Document 2014 continue to remain unchanged with respect to their impacts on the development of the Sartorius Stedim Biotech Group.
Based on the most recent estimates, the global phar-maceutical market is projected to grow on average 4% to 7% per year in the period of 2014 through 2018. Market observers forecast that the compound average growth rate of the biopharma subsegment will be around 8% in view of the further market penetration of biopharmaceuticals already approved, their extended areas of indication and strong research and development pipelines.
Sources: IMS Health: Patentklippe 2016?, March 2015; Evaluate
Pharma: World Preview 2014, Outlook To 2020, June 2014.
Future Business Development
Based on its strong first-half business performance and its two recent acquisitions, the Sartorius Stedim Biotech Group upgraded its full-year guidance:
Sales growth in constant currencies is now forecasted to reach approx. 15%, which includes around 1.5 percentage points of growth related to the acquisitions of BioOutsource and Cellca. The previous guidance without acquisitions was approx. 7% to 10%.
The company’s underlying EBITDA margin is expected to rise to around 25.0% to 25.5% (previous guidance: around 24.5% to 25.0%) without any currency effects considered.
For 2015, the Sartorius Stedim Biotech Group continues to plan on investing about 6% to 8% of sales revenue mainly in the expansion of production capacities.
Regarding its financial position, the Group had expected that, without acquisitions, the ratio of net debt to underlying EBITDA would edge down by the end of 2015. Due to the takeovers of BioOutsource and Cellca, Sartorius Stedim Biotech now expects this ratio to be slightly below the level of year-end 2014.
Report on Material Events
On July 1, 2015, the Sartorius Stedim Biotech Group acquired Cellca GmbH based in Laupheim, Germany. Founded in 2005, this company specializes in process development services for pharma and biopharma companies. With approximately 30 employees, Cellca GmbH generated sales revenue of around €6 million in the past fiscal year.
Opportunity and Risk Report
7
2nd quarter 2015
¤ in mn1)
2nd quarter 2014
€ in mn1)
6 months 2015
¤ in mn
6 months 2014
€ in mn
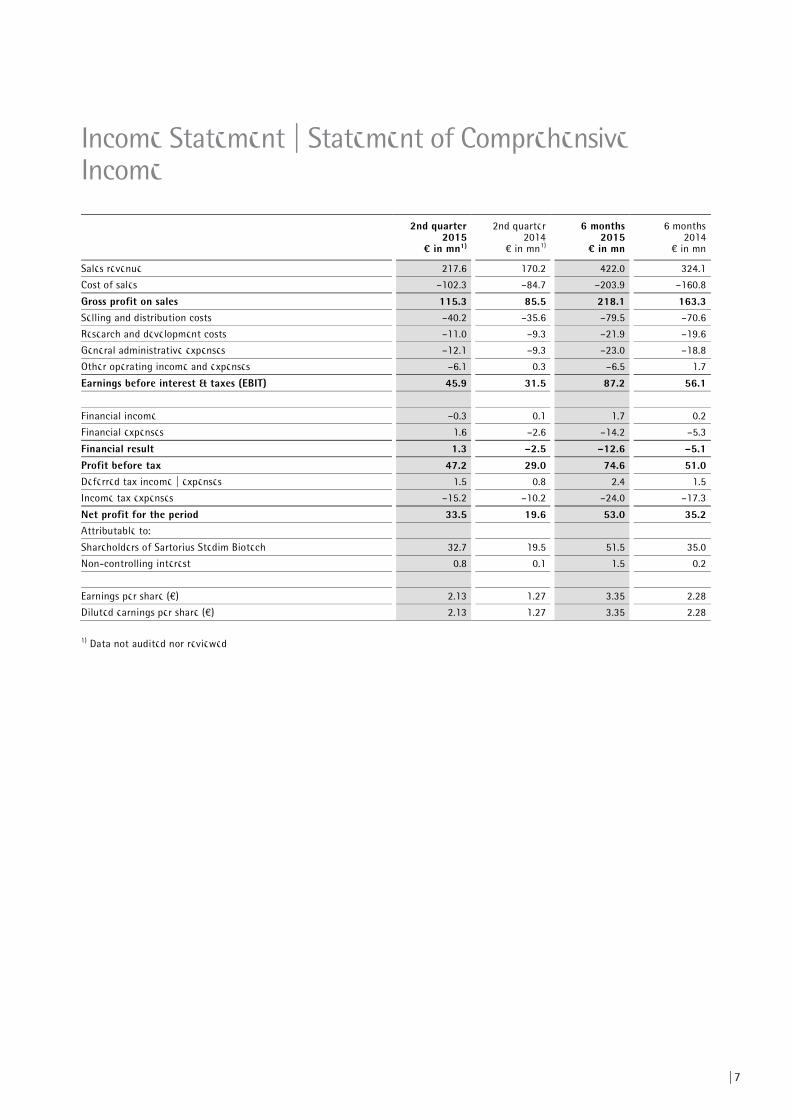
Sales revenue 217.6 170.2 422.0 324.1
Cost of sales –102.3 –84.7 –203.9 –160.8
Gross profit on sales 115.3 85.5 218.1 163.3 Selling and distribution costs –40.2 –35.6 –79.5 –70.6
Research and development costs –11.0 –9.3 –21.9 –19.6
General administrative expenses –12.1 –9.3 –23.0 –18.8
Other operating income and expenses –6.1 0.3 –6.5 1.7
Earnings before interest & taxes (EBIT) 45.9 31.5 87.2 56.1
Financial income –0.3 0.1 1.7 0.2
Financial expenses 1.6 –2.6 –14.2 –5.3
Financial result 1.3 –2.5 –12.6 –5.1 Profit before tax 47.2 29.0 74.6 51.0 Deferred tax income | expenses 1.5 0.8 2.4 1.5
Income tax expenses –15.2 –10.2 –24.0 –17.3
Net profit for the period 33.5 19.6 53.0 35.2 Attributable to:
Shareholders of Sartorius Stedim Biotech 32.7 19.5 51.5 35.0
Non-controlling interest 0.8 0.1 1.5 0.2
Earnings per share (€) 2.13 1.27 3.35 2.28
Diluted earnings per share (€) 2.13 1.27 3.35 2.28
1) Data not audited nor reviewed
Income Statement | Statement of Comprehensive Income
8
2nd quarter 2015
¤ in mn1)
2nd quarter 2014
€ in mn1)
6 months 2015
¤ in mn
6 months 2014
€ in mn
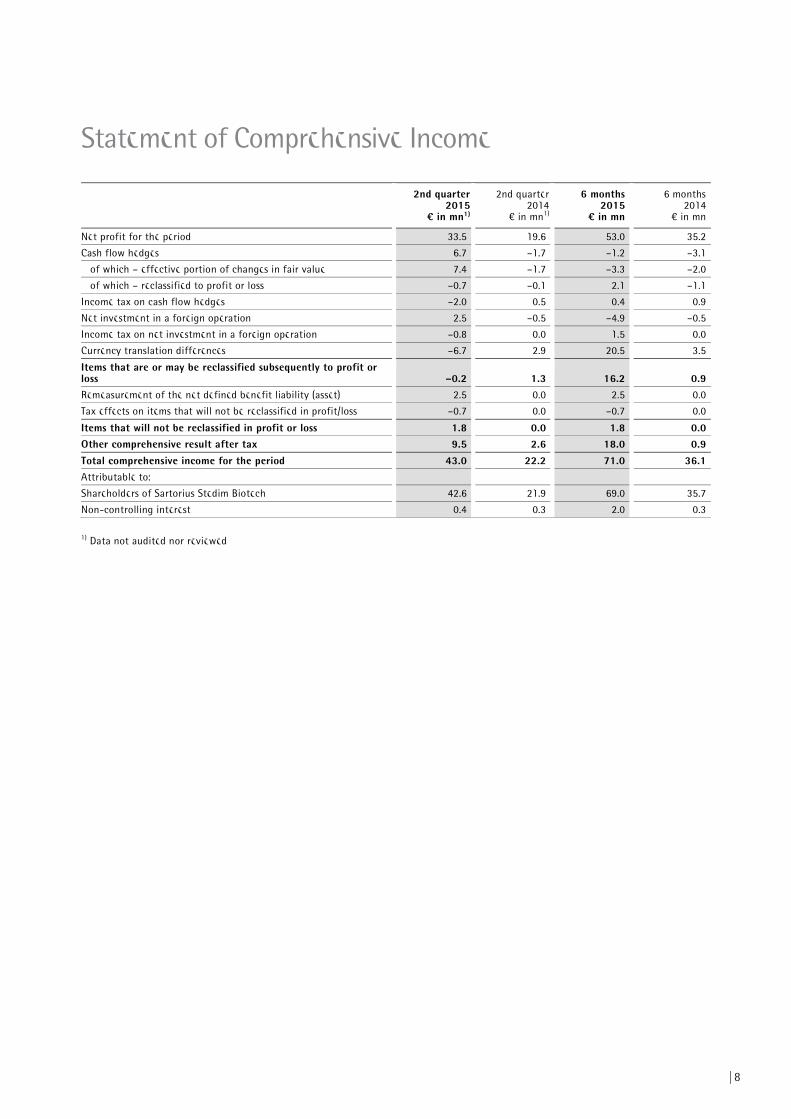
Net profit for the period 33.5 19.6 53.0 35.2
Cash flow hedges 6.7 –1.7 –1.2 –3.1
of which – effective portion of changes in fair value 7.4 –1.7 –3.3 –2.0
of which – reclassified to profit or loss –0.7 –0.1 2.1 –1.1
Income tax on cash flow hedges –2.0 0.5 0.4 0.9
Net investment in a foreign operation 2.5 –0.5 –4.9 –0.5
Income tax on net investment in a foreign operation –0.8 0.0 1.5 0.0
Currency translation differences –6.7 2.9 20.5 3.5
Items that are or may be reclassified subsequently to profit or loss –0.2 1.3 16.2 0.9 Remeasurement of the net defined benefit liability (asset) 2.5 0.0 2.5 0.0
Tax effects on items that will not be reclassified in profit/loss –0.7 0.0 –0.7 0.0
Items that will not be reclassified in profit or loss 1.8 0.0 1.8 0.0 Other comprehensive result after tax 9.5 2.6 18.0 0.9 Total comprehensive income for the period 43.0 22.2 71.0 36.1 Attributable to:
Shareholders of Sartorius Stedim Biotech 42.6 21.9 69.0 35.7
Non-controlling interest 0.4 0.3 2.0 0.3
1) Data not audited nor reviewed
Statement of Comprehensive Income
9
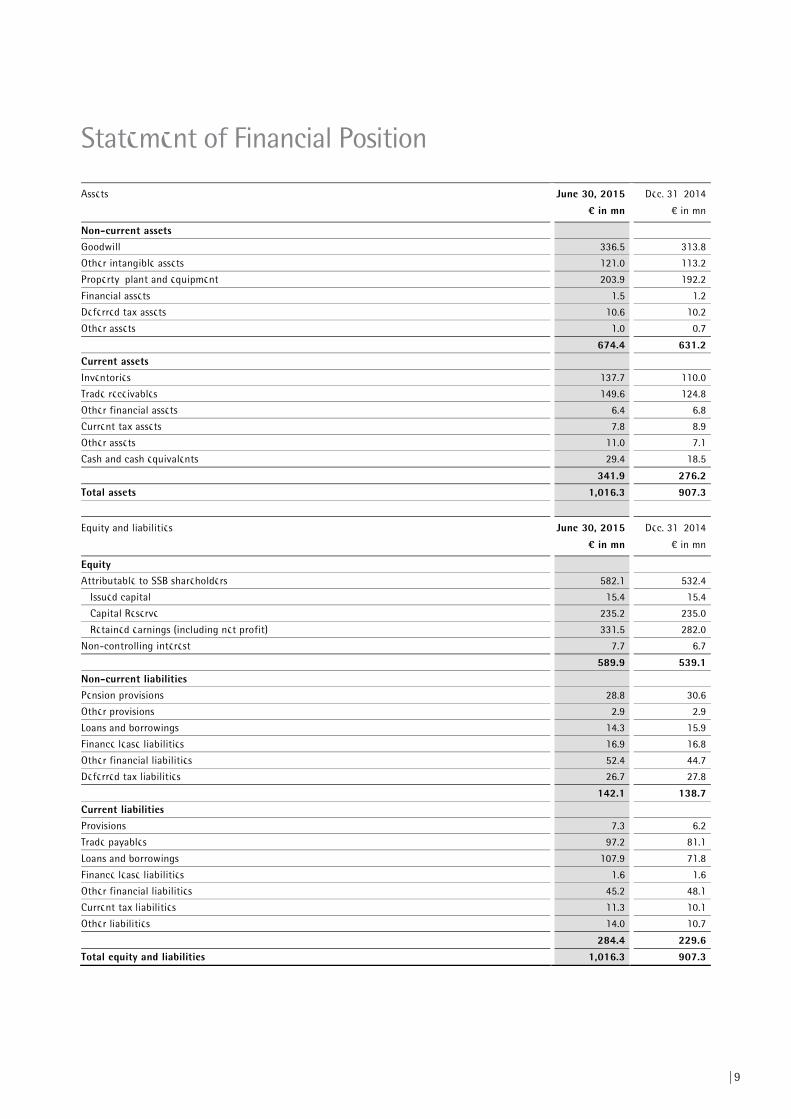
Assets June 30, 2015 Dec. 31, 2014
¤ in mn € in mn
Non-current assets Goodwill 336.5 313.8
Other intangible assets 121.0 113.2
Property, plant and equipment 203.9 192.2
Financial assets 1.5 1.2
Deferred tax assets 10.6 10.2
Other assets 1.0 0.7
674.4 631.2 Current assets Inventories 137.7 110.0
Trade receivables 149.6 124.8
Other financial assets 6.4 6.8
Current tax assets 7.8 8.9
Other assets 11.0 7.1
Cash and cash equivalents 29.4 18.5
341.9 276.2 Total assets 1,016.3 907.3
Equity and liabilities June 30, 2015 Dec. 31, 2014
¤ in mn € in mn
Equity Attributable to SSB shareholders 582.1 532.4
Issued capital 15.4 15.4
Capital Reserve 235.2 235.0
Retained earnings (including net profit) 331.5 282.0
Non-controlling interest 7.7 6.7
589.9 539.1 Non-current liabilities Pension provisions 28.8 30.6
Other provisions 2.9 2.9
Loans and borrowings 14.3 15.9
Finance lease liabilities 16.9 16.8
Other financial liabilities 52.4 44.7
Deferred tax liabilities 26.7 27.8
142.1 138.7 Current liabilities Provisions 7.3 6.2
Trade payables 97.2 81.1
Loans and borrowings 107.9 71.8
Finance lease liabilities 1.6 1.6
Other financial liabilities 45.2 48.1
Current tax liabilities 11.3 10.1
Other liabilities 14.0 10.7
284.4 229.6 Total equity and liabilities 1,016.3 907.3
Statement of Financial Position
10
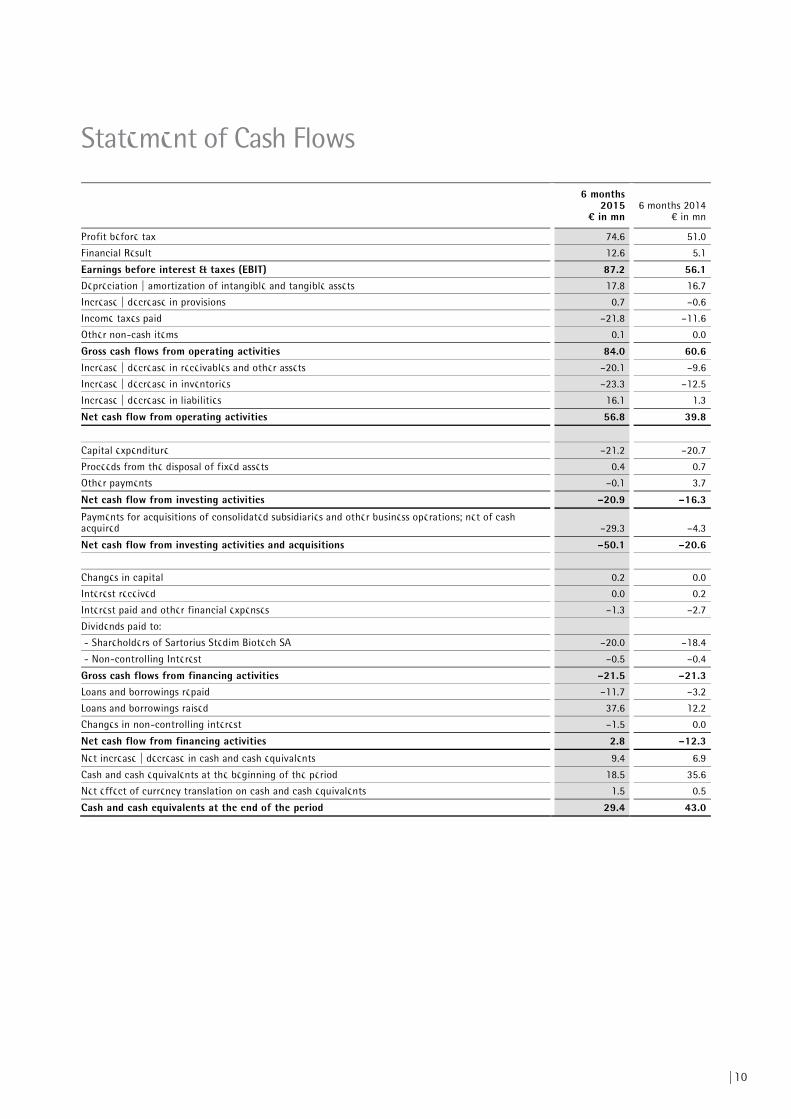
6 months 2015
¤ in mn 6 months 2014
€ in mn
Profit before tax 74.6 51.0
Financial Result 12.6 5.1
Earnings before interest & taxes (EBIT) 87.2 56.1 Depreciation | amortization of intangible and tangible assets 17.8 16.7
Increase | decrease in provisions 0.7 –0.6
Income taxes paid –21.8 –11.6
Other non-cash items 0.1 0.0
Gross cash flows from operating activities 84.0 60.6 Increase | decrease in receivables and other assets –20.1 –9.6
Increase | decrease in inventories –23.3 –12.5
Increase | decrease in liabilities 16.1 1.3
Net cash flow from operating activities 56.8 39.8
Capital expenditure –21.2 –20.7
Proceeds from the disposal of fixed assets 0.4 0.7
Other payments –0.1 3.7
Net cash flow from investing activities –20.9 –16.3
Payments for acquisitions of consolidated subsidiaries and other business operations; net of cash acquired –29.3 –4.3
Net cash flow from investing activities and acquisitions –50.1 –20.6
Changes in capital 0.2 0.0
Interest received 0.0 0.2
Interest paid and other financial expenses –1.3 –2.7
Dividends paid to:
- Shareholders of Sartorius Stedim Biotech SA –20.0 –18.4
- Non-controlling Interest –0.5 –0.4
Gross cash flows from financing activities –21.5 –21.3 Loans and borrowings repaid –11.7 –3.2
Loans and borrowings raised 37.6 12.2
Changes in non-controlling interest –1.5 0.0
Net cash flow from financing activities 2.8 –12.3
Net increase | decrease in cash and cash equivalents 9.4 6.9
Cash and cash equivalents at the beginning of the period 18.5 35.6
Net effect of currency translation on cash and cash equivalents 1.5 0.5
Cash and cash equivalents at the end of the period 29.4 43.0
Statement of Cash Flows
11
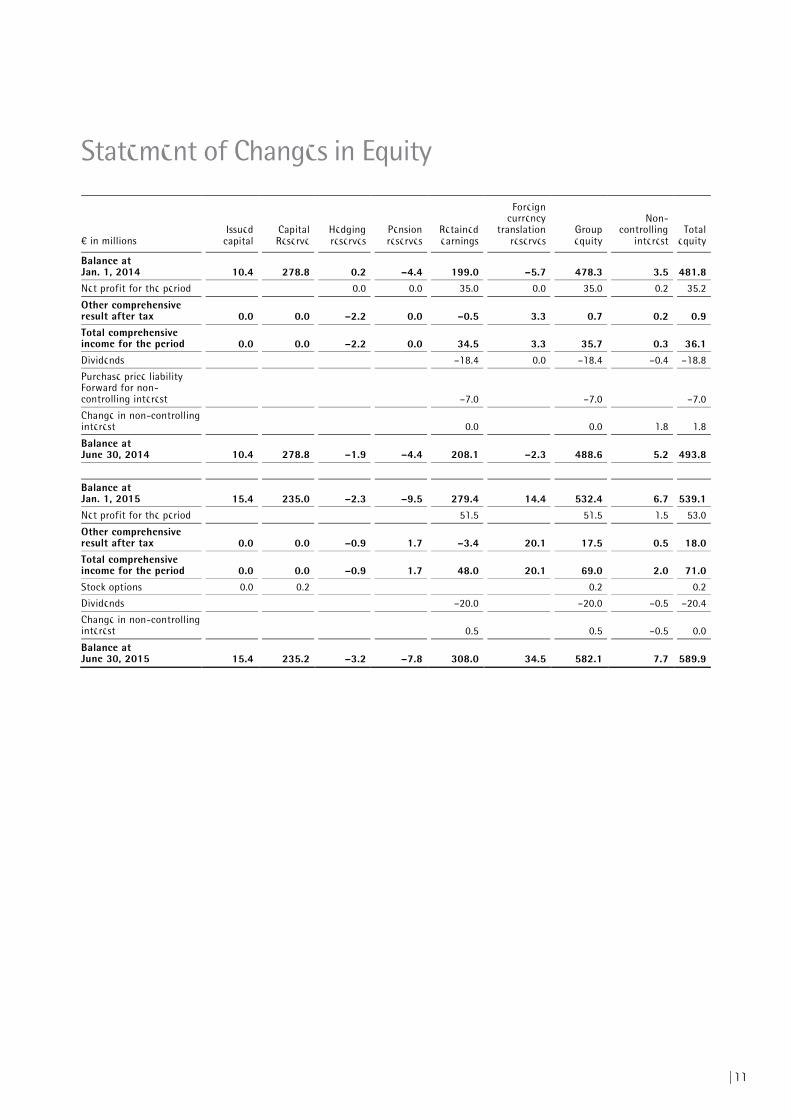
Statement of Changes in Equity
€ in millions Issued
capital Capital Reserve
Hedging reserves
Pension reserves
Retained earnings
Foreign currency
translation reserves
Group equity
Non-controlling
interest Total
equity
Balance at Jan. 1, 2014 10.4 278.8 0.2 –4.4 199.0 –5.7 478.3 3.5 481.8 Net profit for the period 0.0 0.0 35.0 0.0 35.0 0.2 35.2
Other comprehensive result after tax 0.0 0.0 –2.2 0.0 –0.5 3.3 0.7 0.2 0.9 Total comprehensive income for the period 0.0 0.0 –2.2 0.0 34.5 3.3 35.7 0.3 36.1 Dividends –18.4 0.0 –18.4 –0.4 –18.8
Purchase price liability Forward for non-controlling interest –7.0 –7.0 –7.0
Change in non-controlling interest 0.0 0.0 1.8 1.8
Balance at June 30, 2014 10.4 278.8 –1.9 –4.4 208.1 –2.3 488.6 5.2 493.8
Balance at Jan. 1, 2015 15.4 235.0 –2.3 –9.5 279.4 14.4 532.4 6.7 539.1 Net profit for the period 51.5 51.5 1.5 53.0
Other comprehensive result after tax 0.0 0.0 –0.9 1.7 –3.4 20.1 17.5 0.5 18.0 Total comprehensive income for the period 0.0 0.0 –0.9 1.7 48.0 20.1 69.0 2.0 71.0 Stock options 0.0 0.2 0.2 0.2
Dividends –20.0 –20.0 –0.5 –20.4
Change in non-controlling interest 0.5 0.5 –0.5 0.0
Balance at June 30, 2015 15.4 235.2 –3.2 –7.8 308.0 34.5 582.1 7.7 589.9
12
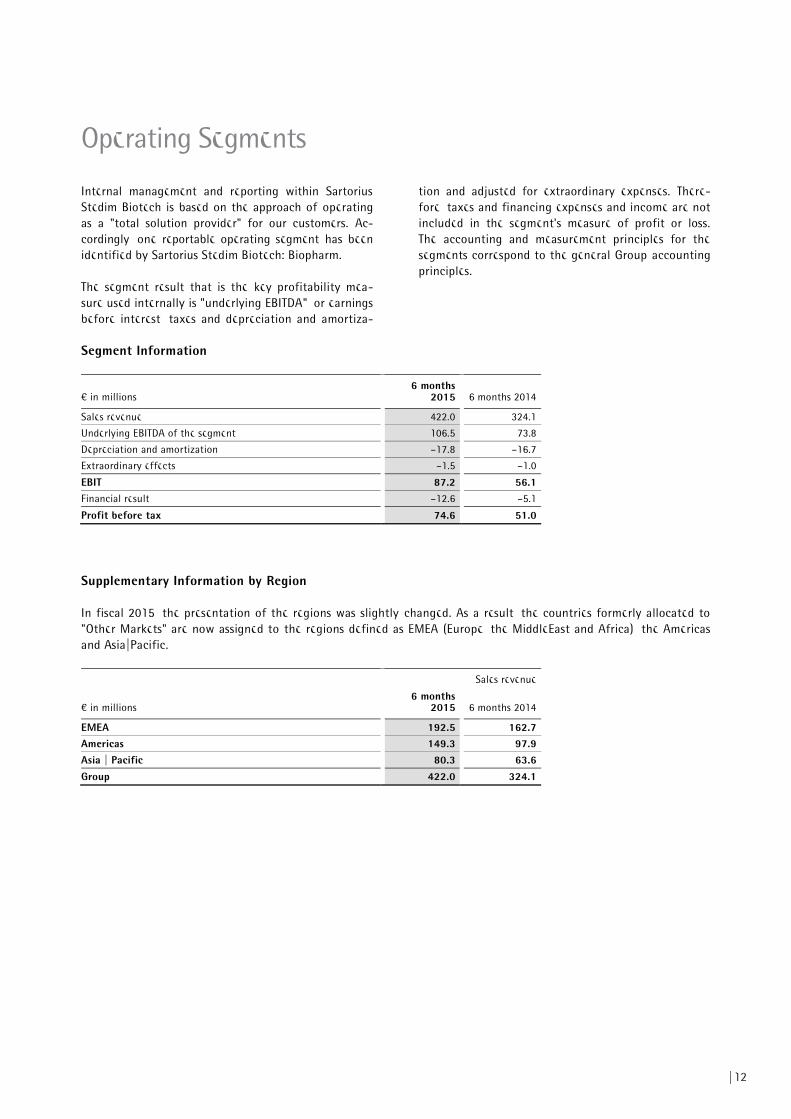
Internal management and reporting within Sartorius Stedim Biotech is based on the approach of operating as a "total solution provider" for our customers. Ac-cordingly, one reportable operating segment has been identified by Sartorius Stedim Biotech: Biopharm.
The segment result that is the key profitability mea-sure used internally is "underlying EBITDA", or earnings before interest, taxes and depreciation and amortiza-
tion and adjusted for extraordinary expenses. There-fore, taxes and financing expenses and income are not included in the segment's measure of profit or loss. The accounting and measurement principles for the segments correspond to the general Group accounting principles.
Segment Information
€ in millions 6 months
2015 6 months 2014
Sales revenue 422.0 324.1
Underlying EBITDA of the segment 106.5 73.8
Depreciation and amortization –17.8 –16.7
Extraordinary effects –1.5 –1.0
EBIT 87.2 56.1 Financial result –12.6 –5.1
Profit before tax 74.6 51.0
Supplementary Information by Region
In fiscal 2015, the presentation of the regions was slightly changed. As a result, the countries formerly allocated to "Other Markets" are now assigned to the regions defined as EMEA (Europe, the MiddleEast and Africa), the Americas and Asia|Pacific.
Sales revenue
€ in millions 6 months
2015 6 months 2014
EMEA 192.5 162.7 Americas 149.3 97.9 Asia | Pacific 80.3 63.6 Group 422.0 324.1
Operating Segments
13
1. Reporting Entity
Sartorius Stedim Biotech is a leading provider of cutting-edge equipment and services for the development, quality assurance and production processes of the pharmaceutical industry. Its integrated solutions covering fermentation, filtration, purification, fluid manage-ment, cell culture media and lab technologies are supporting the biopharmaceutical industry around the world to develop and produce drugs safely, timely and economically. For next-generation processes, Sartorius Stedim Biotech focuses on single-use technologies and added-value services to meet and define the rapidly changing technology requirements of the industry it serves. Strongly rooted in the scientific community and closely allied with customers and technology partners, the company is dedicated to its philosophy of “Turning science into solutions.”
Headquartered in Aubagne, France, Sartorius Stedim Biotech is listed on the Euronext Paris (ISIN code: FR 0000053266).
The interim condensed consolidated financial statements of the Group for the period from January 1, 2015, to June 30, 2015, were authorized for issue by the Board of Directors on July 16, 2015.
2. Basis of Accounting
The interim consolidated financial statements of the Sartorius Stedim Biotech Group for the period ended June 30, 2015, were prepared in accordance with IAS 34 "Interim financial reporting .” They do not in-clude all the information required for a complete set of IFRS financial statements and must be read in rela-tion to the consolidated annual financial statements of the Sartorius Stedim Biotech Group for the year ended December 31, 2014. However, selected explana-tory notes are included to explain events and transac-tions that are significant to an understanding of the changes in the Group's financial position and perfor-mance since the last annual consolidated financial statement as at and for the year ended December 31, 2014.
The accounting principles retained for preparing the consolidated half-year statements are in conformance with the IFRS Standards and Interpretations as adopted by the European Union on June 30, 2015, and are available on the website:
http://ec.europa.eu/internal_market/accounting/ias/index_fr.htm
The accounting principles applied are identical to those used to prepare the annual consolidated financial statements for the year ended December 31, 2014.
The Reference Document 2014 presents the list of subsidiaries (see page 118). The company BioOutsource Ltd. was included in the scope of consolidation in 2015 (interest percentage: 100%; full consolidation).
For calculation of income tax expenses, the provisions of IAS 34.30c) were adopted; i.e., the best estimate of the weighted average annual income tax rate expected for the full financial year was applied (29%).
3. Use of Judgments and Estimates
In preparing these interim financial statements, man-agement has made judgments, estimates and assump-tions that affect the application of accounting policies and the reported amounts of assets and liabilities, income and expenses. Actual results may differ from these estimates.
The significant judgments made by management in applying the Group's accounting policies and the key sources of estimation uncertainty were the same as those that applied to the consolidated financial state-ment as at and for the year ended December 31, 2014.
Notes to the Interim Financial Statements
14
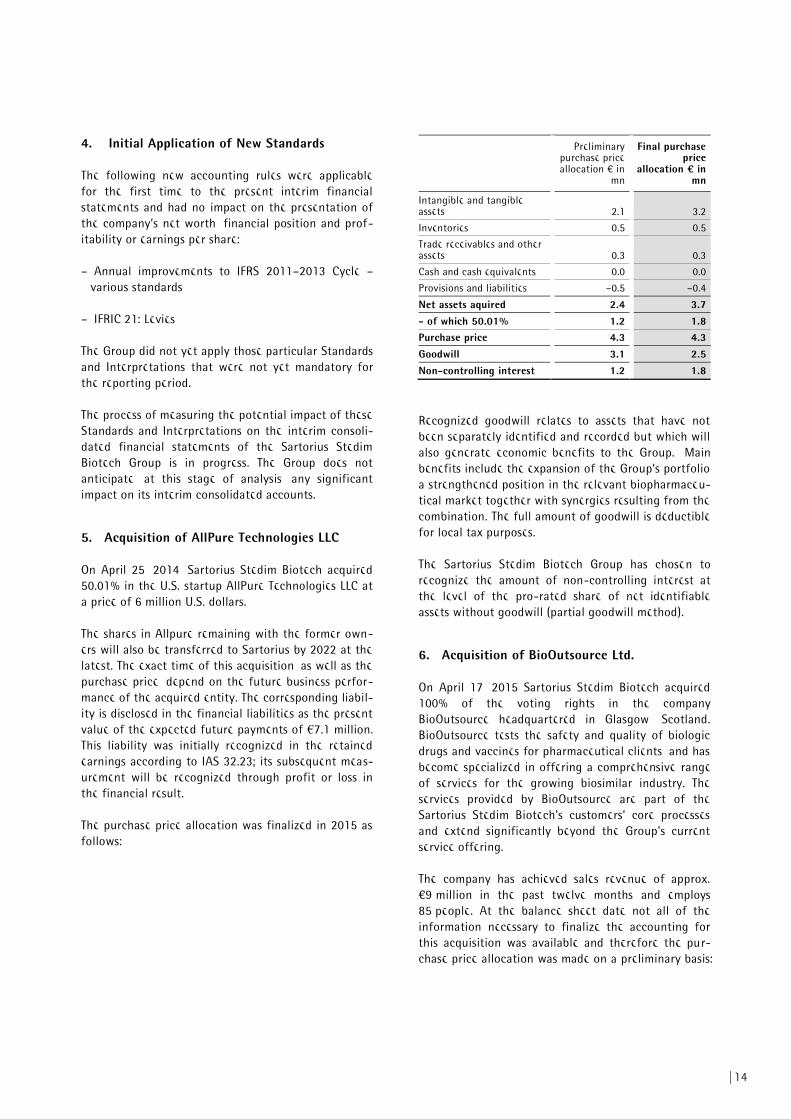
4. Initial Application of New Standards
The following new accounting rules were applicable for the first time to the present interim financial statements and had no impact on the presentation of the company’s net worth, financial position and prof-itability or earnings per share:
– Annual improvements to IFRS 2011–2013 Cycle – various standards
– IFRIC 21: Levies
The Group did not yet apply those particular Standards and Interpretations that were not yet mandatory for the reporting period.
The process of measuring the potential impact of these Standards and Interpretations on the interim consoli-dated financial statements of the Sartorius Stedim Biotech Group is in progress. The Group does not anticipate, at this stage of analysis, any significant impact on its interim consolidated accounts.
5. Acquisition of AllPure Technologies LLC
On April 25, 2014, Sartorius Stedim Biotech acquired 50.01% in the U.S. startup AllPure Technologies LLC at a price of 6 million U.S. dollars.
The shares in Allpure remaining with the former own-ers will also be transferred to Sartorius by 2022 at the latest. The exact time of this acquisition, as well as the purchase price, depend on the future business perfor-mance of the acquired entity. The corresponding liabil-ity is disclosed in the financial liabilities as the present value of the expected future payments of €7.1 million. This liability was initially recognized in the retained earnings according to IAS 32.23; its subsequent meas-urement will be recognized through profit or loss in the financial result.
The purchase price allocation was finalized in 2015 as follows:
Preliminary purchase price allocation € in
mn
Final purchase price
allocation ¤ in mn
Intangible and tangible assets 2.1 3.2
Inventories 0.5 0.5
Trade receivables and other assets 0.3 0.3
Cash and cash equivalents 0.0 0.0
Provisions and liabilities –0.5 –0.4
Net assets aquired 2.4 3.7 - of which 50.01% 1.2 1.8 Purchase price 4.3 4.3 Goodwill 3.1 2.5 Non-controlling interest 1.2 1.8
Recognized goodwill relates to assets that have not been separately identified and recorded but which will also generate economic benefits to the Group. Main benefits include the expansion of the Group’s portfolio, a strengthened position in the relevant biopharmaceu-tical market together with synergies resulting from the combination. The full amount of goodwill is deductible for local tax purposes.
The Sartorius Stedim Biotech Group has chosen to recognize the amount of non-controlling interest at the level of the pro-rated share of net identifiable assets without goodwill (partial goodwill method).
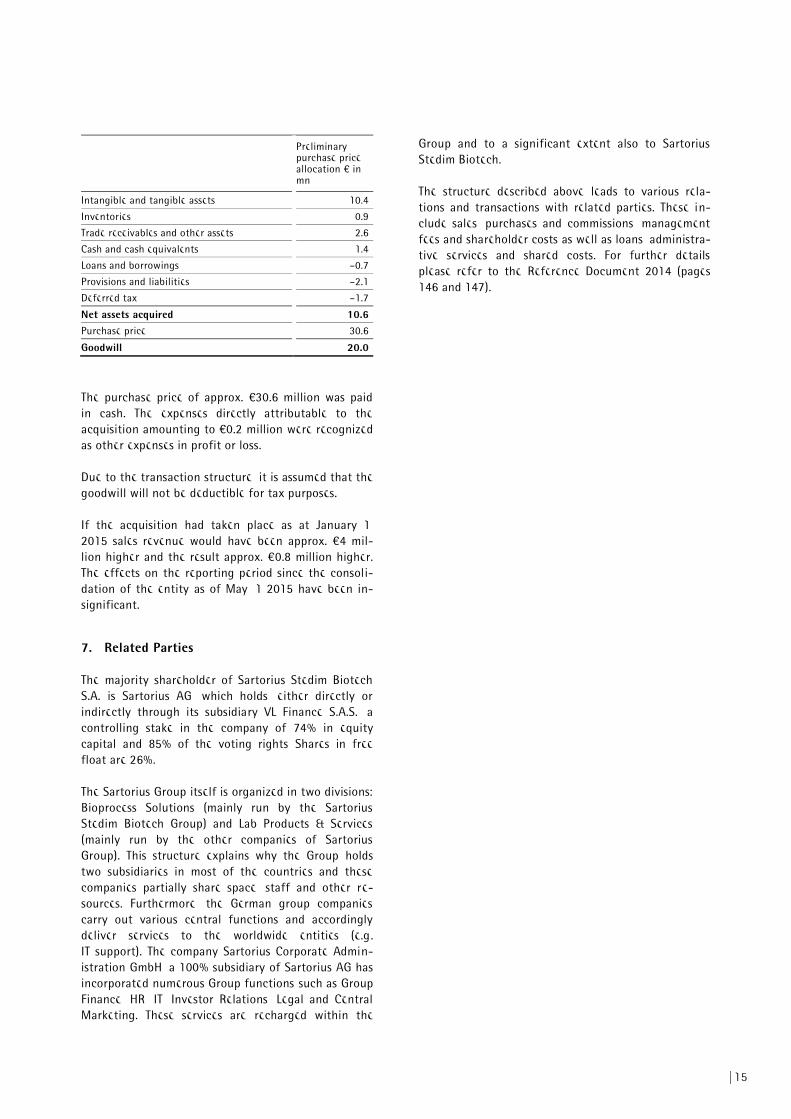
6. Acquisition of BioOutsource Ltd.
On April 17, 2015 Sartorius Stedim Biotech acquired 100% of the voting rights in the company BioOutsource headquartered in Glasgow, Scotland. BioOutsource tests the safety and quality of biologic drugs and vaccines for pharmaceutical clients, and has become specialized in offering a comprehensive range of services for the growing biosimilar industry. The services provided by BioOutsource are part of the Sartorius Stedim Biotech's customers’ core processes and extend significantly beyond the Group's current service offering.
The company has achieved sales revenue of approx. €9 million in the past twelve months and employs 85 people. At the balance sheet date not all of the information necessary to finalize the accounting for this acquisition was available and therefore the pur-chase price allocation was made on a preliminary basis:
15
Preliminary purchase price allocation € in mn
Intangible and tangible assets 10.4
Inventories 0.9
Trade receivables and other assets 2.6
Cash and cash equivalents 1.4
Loans and borrowings –0.7
Provisions and liabilities –2.1
Deferred tax –1.7
Net assets acquired 10.6 Purchase price 30.6
Goodwill 20.0
The purchase price of approx. €30.6 million was paid in cash. The expenses directly attributable to the acquisition amounting to €0.2 million were recognized as other expenses in profit or loss.
Due to the transaction structure, it is assumed that the goodwill will not be deductible for tax purposes.
If the acquisition had taken place as at January 1, 2015 sales revenue would have been approx. €4 mil-lion higher and the result approx. €0.8 million higher. The effects on the reporting period since the consoli-dation of the entity as of May, 1 2015 have been in-significant.
7. Related Parties
The majority shareholder of Sartorius Stedim Biotech S.A. is Sartorius AG, which holds, either directly or indirectly through its subsidiary VL Finance S.A.S., a controlling stake in the company of 74% in equity capital and 85% of the voting rights Shares in free float are 26%.
The Sartorius Group itself is organized in two divisions: Bioprocess Solutions (mainly run by the Sartorius Stedim Biotech Group) and Lab Products & Services (mainly run by the other companies of Sartorius Group). This structure explains why the Group holds two subsidiaries in most of the countries and these companies partially share space, staff and other re-sources. Furthermore, the German group companies carry out various central functions and accordingly deliver services to the worldwide entities (e.g. IT support). The company Sartorius Corporate Admin-istration GmbH, a 100% subsidiary of Sartorius AG has incorporated numerous Group functions such as Group Finance, HR, IT, Investor Relations, Legal and Central Marketing. These services are recharged within the
Group and to a significant extent also to Sartorius Stedim Biotech.
The structure described above leads to various rela-tions and transactions with related parties. These in-clude sales, purchases and commissions, management fees and shareholder costs as well as loans, administra-tive services and shared costs. For further details please refer to the Reference Document 2014 (pages 146 and 147).
16
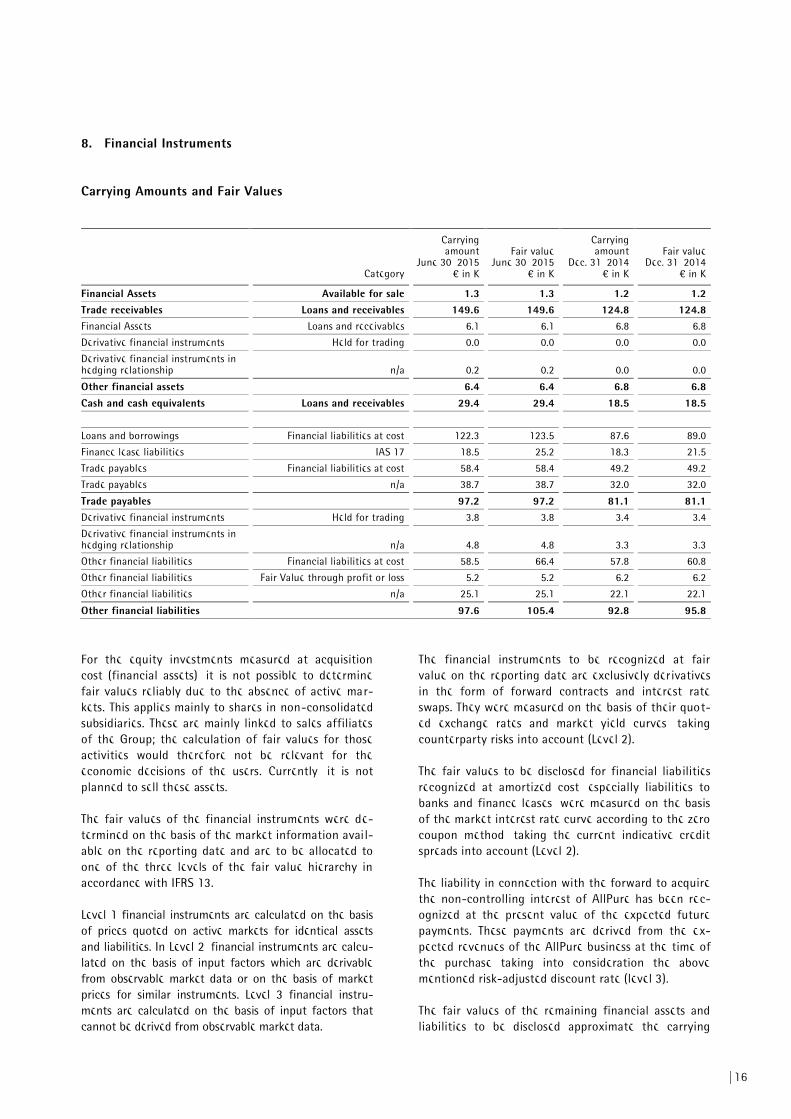
8. Financial Instruments
Carrying Amounts and Fair Values
Category
Carrying amount
June 30, 2015 € in K
Fair value June 30, 2015
€ in K
Carrying amount
Dec. 31, 2014 € in K
Fair value Dec. 31, 2014
€ in K
Financial Assets Available for sale 1.3 1.3 1.2 1.2 Trade receivables Loans and receivables 149.6 149.6 124.8 124.8 Financial Assets Loans and receivables 6.1 6.1 6.8 6.8
Derivative financial instruments Held for trading 0.0 0.0 0.0 0.0
Derivative financial instruments in hedging relationship n/a 0.2 0.2 0.0 0.0
Other financial assets 6.4 6.4 6.8 6.8 Cash and cash equivalents Loans and receivables 29.4 29.4 18.5 18.5
Loans and borrowings Financial liabilities at cost 122.3 123.5 87.6 89.0
Finance lease liabilities IAS 17 18.5 25.2 18.3 21.5
Trade payables Financial liabilities at cost 58.4 58.4 49.2 49.2
Trade payables n/a 38.7 38.7 32.0 32.0
Trade payables 97.2 97.2 81.1 81.1 Derivative financial instruments Held for trading 3.8 3.8 3.4 3.4
Derivative financial instruments in hedging relationship n/a 4.8 4.8 3.3 3.3
Other financial liabilities Financial liabilities at cost 58.5 66.4 57.8 60.8
Other financial liabilities Fair Value through profit or loss 5.2 5.2 6.2 6.2
Other financial liabilities n/a 25.1 25.1 22.1 22.1
Other financial liabilities 97.6 105.4 92.8 95.8
For the equity investments measured at acquisition cost (financial assets), it is not possible to determine fair values reliably due to the absence of active mar-kets. This applies mainly to shares in non-consolidated subsidiaries. These are mainly linked to sales affiliates of the Group; the calculation of fair values for those activities would therefore not be relevant for the economic decisions of the users. Currently, it is not planned to sell these assets.
The fair values of the financial instruments were de-termined on the basis of the market information avail-able on the reporting date and are to be allocated to one of the three levels of the fair value hierarchy in accordance with IFRS 13.
Level 1 financial instruments are calculated on the basis of prices quoted on active markets for identical assets and liabilities. In Level 2, financial instruments are calcu-lated on the basis of input factors which are derivable from observable market data or on the basis of market prices for similar instruments. Level 3 financial instru-ments are calculated on the basis of input factors that cannot be derived from observable market data.
The financial instruments to be recognized at fair value on the reporting date are exclusively derivatives in the form of forward contracts and interest rate swaps. They were measured on the basis of their quot-ed exchange rates and market yield curves, taking counterparty risks into account (Level 2).
The fair values to be disclosed for financial liabilities recognized at amortized cost, especially liabilities to banks and finance leases, were measured on the basis of the market interest rate curve according to the zero coupon method, taking the current indicative credit spreads into account (Level 2).
The liability in connection with the forward to acquire the non-controlling interest of AllPure has been rec-ognized at the present value of the expected future payments. These payments are derived from the ex-pected revenues of the AllPure business at the time of the purchase taking into consideration the above mentioned risk-adjusted discount rate (level 3).
The fair values of the remaining financial assets and liabilities to be disclosed approximate the carrying
17
amounts on account of their predominantly short-term maturity.
Measurement of Fair Values
The Group recognizes transfers between the levels of the fair value hierarchies at the end of the reporting period during which the change has occurred. In the current reporting period there were no transfers be-tween the levels.
The valuation of the level 3 liability is based on a dis-counted cash flow technique, taking into considera-tion the expected future payments discounted using a risk-adjusted discount rate. The expected payments are determined by considering possible developments of future revenue and the amounts to be paid under each scenario. The significant unobservable input in this calculation is the future revenue which was considered at a growth rate of approximately €5 million per year on average.
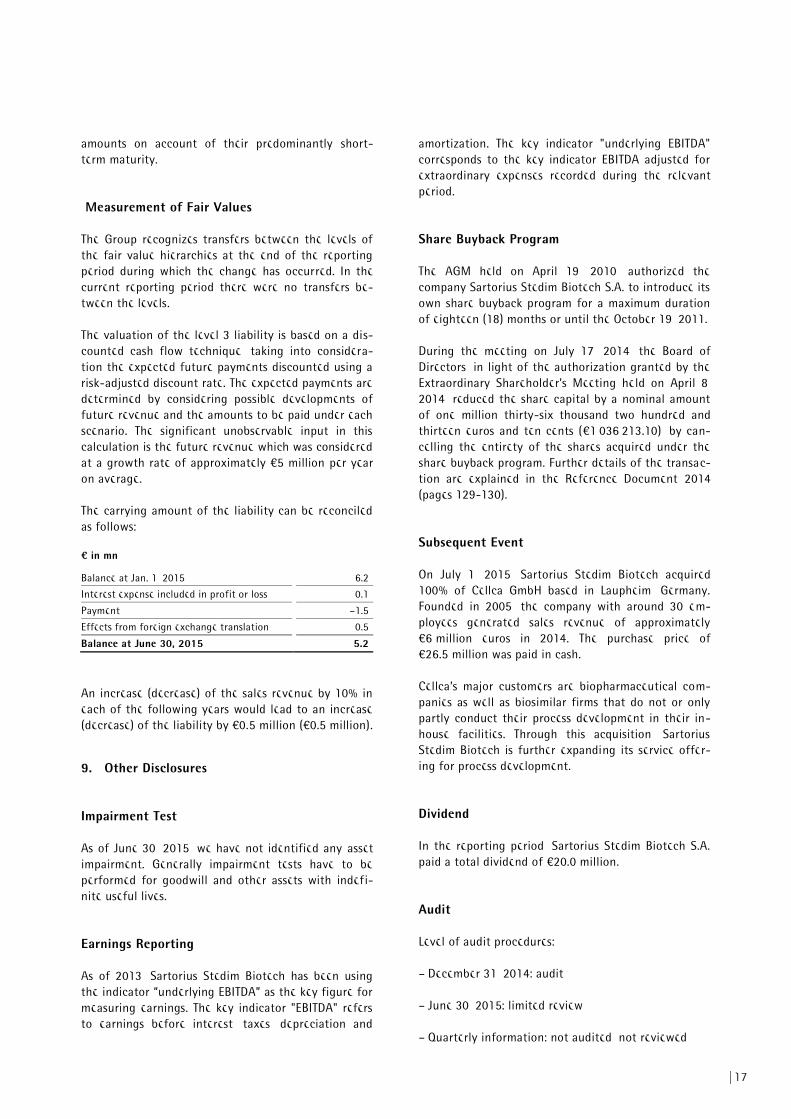
The carrying amount of the liability can be reconciled as follows:
¤ in mn
Balance at Jan. 1, 2015 6.2
Interest expense included in profit or loss 0.1
Payment –1.5
Effects from foreign exchange translation 0.5
Balance at June 30, 2015 5.2
An increase (decrease) of the sales revenue by 10% in each of the following years would lead to an increase (decrease) of the liability by €0.5 million (€0.5 million).
9. Other Disclosures
Impairment Test
As of June 30, 2015, we have not identified any asset impairment. Generally impairment tests have to be performed for goodwill and other assets with indefi-nite useful lives.
Earnings Reporting
As of 2013, Sartorius Stedim Biotech has been using the indicator “underlying EBITDA” as the key figure for measuring earnings. The key indicator "EBITDA" refers to earnings before interest, taxes, depreciation and
amortization. The key indicator "underlying EBITDA" corresponds to the key indicator EBITDA adjusted for extraordinary expenses recorded during the relevant period.
Share Buyback Program
The AGM held on April 19, 2010, authorized the company Sartorius Stedim Biotech S.A. to introduce its own share buyback program for a maximum duration of eighteen (18) months or until the October 19, 2011.
During the meeting on July 17, 2014, the Board of Directors, in light of the authorization granted by the Extraordinary Shareholder’s Meeting held on April 8, 2014, reduced the share capital by a nominal amount of one million thirty-six thousand two hundred and thirteen euros and ten cents (€1,036,213.10), by can-celling the entirety of the shares acquired under the share buyback program. Further details of the transac-tion are explained in the Reference Document 2014 (pages 129-130).
Subsequent Event
On July 1, 2015, Sartorius Stedim Biotech acquired 100% of Cellca GmbH based in Laupheim, Germany. Founded in 2005, the company with around 30 em-ployees generated sales revenue of approximately €6 million euros in 2014. The purchase price of €26.5 million was paid in cash.
Cellca’s major customers are biopharmaceutical com-panies as well as biosimilar firms that do not or only partly conduct their process development in their in-house facilities. Through this acquisition, Sartorius Stedim Biotech is further expanding its service offer-ing for process development.
Dividend
In the reporting period, Sartorius Stedim Biotech S.A. paid a total dividend of €20.0 million.
Audit
Level of audit procedures:
– December 31, 2014: audit
– June 30, 2015: limited review
– Quarterly information: not audited, not reviewed
18
This is a free translation into English of the statutory auditors’
review report on the half-yearly financial information issued in
French and is provided solely for the convenience of English-
speaking users. This report includes information relating to the
specific verification of information given in the Group’s half-
yearly management report. This report should be read in con-
junction with, and construed in accordance with, French law and
professional standards applicable in France.
Sartorius Stedim Biotech S.A.
Registered office: Z.I. Les Paluds - Avenue de Jouques - C.S. 91051 - 13781 Aubagne cedex
Share capital: €.15.364.238
Statutory Auditors’ Review Report on the Half-yearly Financial Information
For the period from January 1 to June 30, 2015
To the Shareholders,
In compliance with the assignment entrusted to us by your Shareholders’ and in accordance with the requirements of article L. 451-1-2 III of the French Monetary and Financial Code ("Code monétaire et financier"), we hereby report to you on:
- the review of the accompanying condensed half-yearly consolidated financial statements of Sartorius Stedim Biotech S.A., for the period from January 1 to June 30, 2015,
- the verification of the information presented in the half-yearly management report.
These condensed half-yearly consolidated financial statements are the responsibility of the Board of Directors. Our role is to express a conclusion on these financial statements based on our review.
I. Conclusion on the financial statements
We conducted our review in accordance with profes-sional standards applicable in France. A review of interim financial information consists of making in-quiries, primarily of persons responsible for financial and accounting matters, and applying analytical and
other review procedures. A review is substantially less in scope than an audit conducted in accordance with professional standards applicable in France and conse-quently does not enable us to obtain assurance that we would become aware of all significant matters that might be identified in an audit. Accordingly, we do not express an audit opinion.
Based on our review, nothing has come to our atten-tion that causes us to believe that the accompanying condensed half-yearly consolidated financial state-ments are not prepared, in all material respects, in accordance with IAS 34 - standard of the IFRSs as adopted by the European Union applicable to interim financial information.
II. Specific verification
We have also verified the information presented in the half-yearly management report on the condensed half-yearly consolidated financial statements subject to our review. We have no matters to report as to its fair presentation and consistency with the condensed half-yearly consolidated financial statements.
Marseille, July 20, 2015
KPMG Deloitte John Evans Christophe Perrau
Statutory Auditors' Review Report on the Half-yearly Financial Information
19
Declaration of Responsibility for the First-Half Financial Report
I certify, to the best of my knowledge, that the con-densed financial statements for the first half ended June 30, 2015, have been prepared in accordance with the applicable accounting standards and give a fair view of the assets, the financial position and the re-sults of the company and of the group of companies included in the consolidation, and that the first-half financial report on pages 2 to 14 presents a fair review of the important events that occurred during the first six months of the financial year, including their effects on the accounts, and of the major transactions between the related parties as well as of the description of the main risks and uncertainties for the remaining six months of the financial year.
Joachim Kreuzburg CEO of the Sartorius Stedim Biotech Group
Information on the First-Half Financial Report
17
Sartorius Stedim Biotech S.A. Z.I. Les Paluds Avenue de Jouques C.S. 91051 13781 Aubagne Cedex, France Phone +33.442.84 56.00 Fax +33.442.84 56.19 www.sartorius-stedim.com
Corporate Communications
Petra Kirchhoff Vice President Phone +49.551.308 1686 [email protected]
Investor Relations
Andreas Theisen Director Phone +49.551.308 1668 [email protected]
October 20, 2015
Publication of nine-month figures for 2015
January 2016
Publication of preliminary figures for fiscal 2015
April 5 2016
Annual General Shareholders' Meeting in Aubagne, France
April 2016
Publication of first-quarter figures for 2016
This is a translation of the original French-language first-half financial report "Rapport financier semestriel." Sartorius Stedim Biotech
S.A. shall not assume any liability for the correctness of this translation. The original French interim report is the legally binding version.
Furthermore, Sartorius Stedim Biotech S.A. reserves the right not to be responsible for the topicality, correctness, complete ness or
quality of the information provided. Liability claims regarding damage caused by the use of any information provided, including any
kind of information which is incomplete or incorrect, will therefore be rejected.
Forward-looking Statements Contain Risks
This report contains various statements concerning the Sartorius Stedim Biotech Group’s future performance. These statements are
based on assumptions and estimates. Although we are convinced that these forward-looking statements are realistic, we cannot guar-
antee that they will actually apply. This is because our assumptions harbor risks and uncertainties that could lead to actual results
diverging substantially from the expected ones. It is not planned to update our forward-looking statements.
Throughout the entire report, differences may be apparent as a result of rounding during addition.
Contacts Financial Schedule