Embed Size (px)
Citation preview
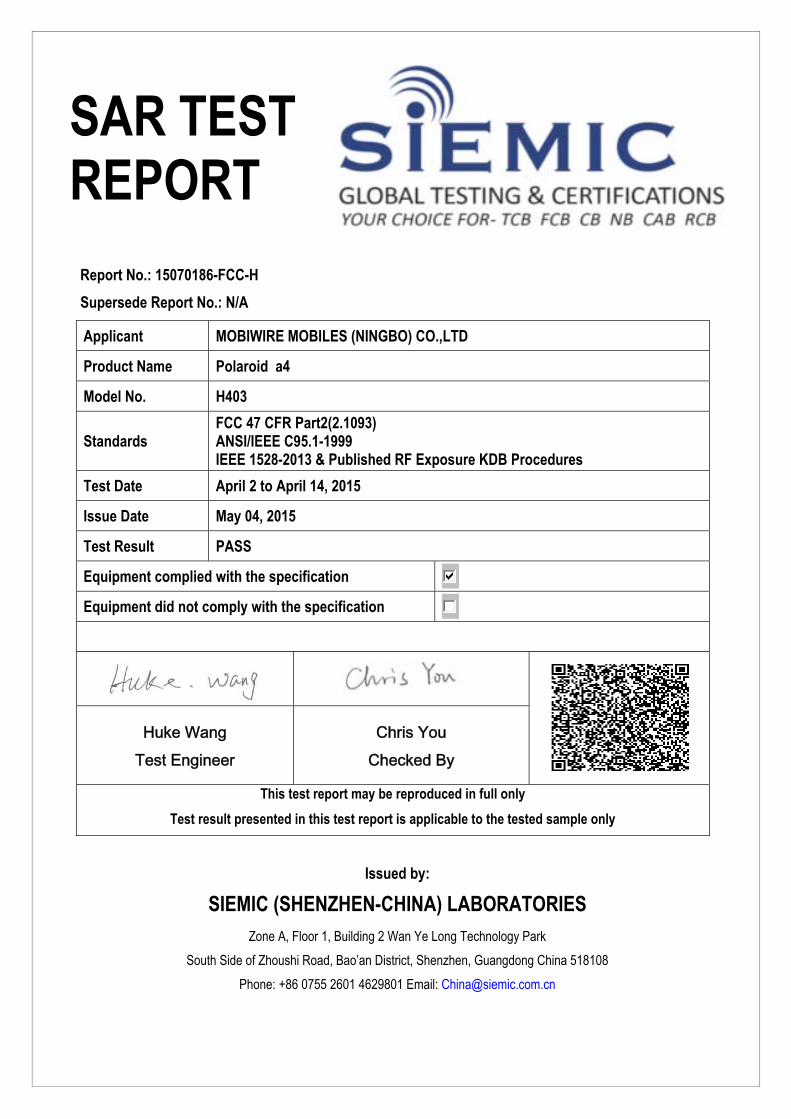
SAR TEST REPORT
Report No.: 15070186-FCC-H
Supersede Report No.: N/A
Applicant MOBIWIRE MOBILES (NINGBO) CO.,LTD
Product Name Polaroid a4
Model No. H403
Standards FCC 47 CFR Part2(2.1093) ANSI/IEEE C95.1-1999 IEEE 1528-2013 & Published RF Exposure KDB Procedures
Test Date April 2 to April 14, 2015
Issue Date May 04, 2015
Test Result PASS
Equipment complied with the specification
Equipment did not comply with the specification
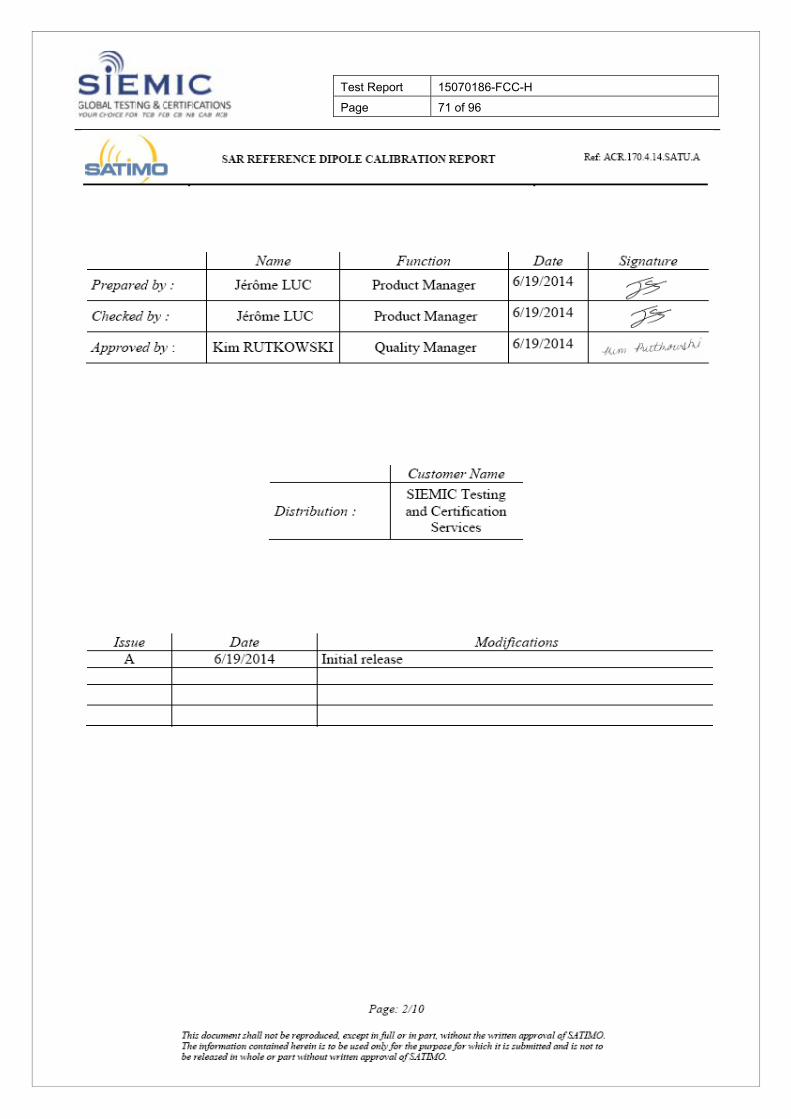
Huke Wang Test Engineer
Chris You Checked By
This test report may be reproduced in full only
Test result presented in this test report is applicable to the tested sample only
Issued by:
SIEMIC (SHENZHEN-CHINA) LABORATORIES Zone A, Floor 1, Building 2 Wan Ye Long Technology Park
South Side of Zhoushi Road, Bao’an District, Shenzhen, Guangdong China 518108
Phone: +86 0755 2601 4629801 Email: [email protected]
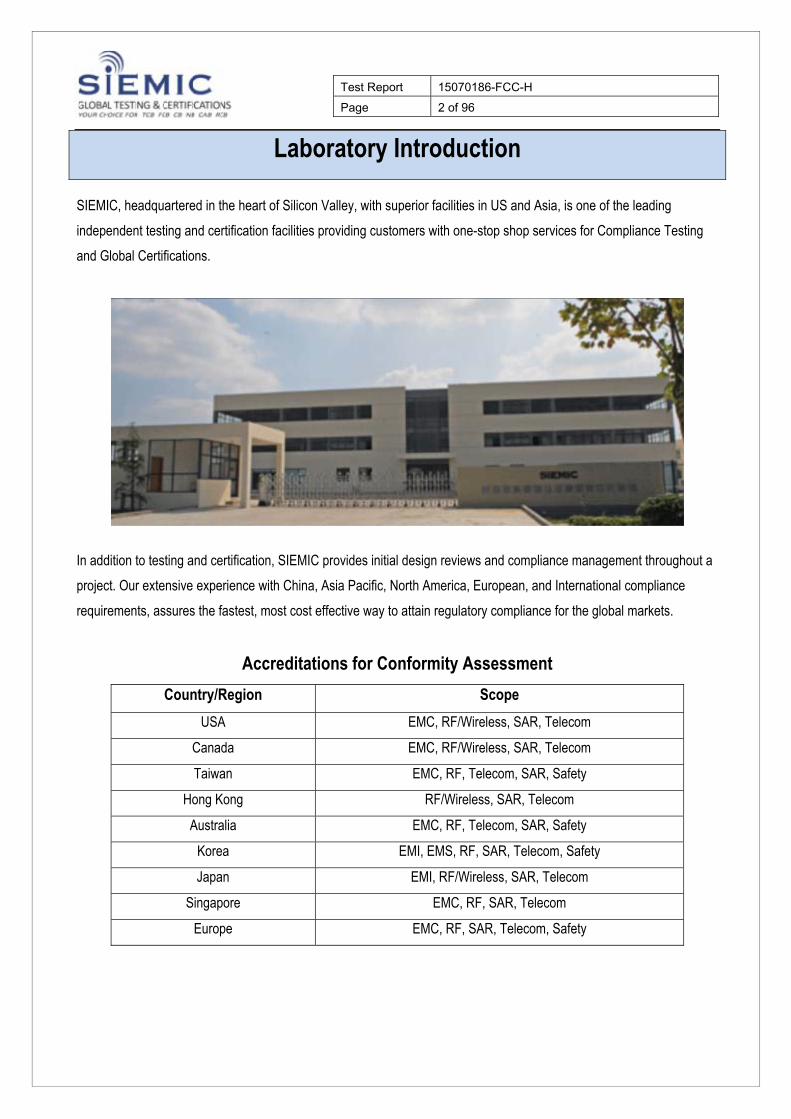
Test Report 15070186-FCC-H Page 2 of 96
Laboratory Introduction
SIEMIC, headquartered in the heart of Silicon Valley, with superior facilities in US and Asia, is one of the leading
independent testing and certification facilities providing customers with one-stop shop services for Compliance Testing
and Global Certifications.
In addition to testing and certification, SIEMIC provides initial design reviews and compliance management throughout a
project. Our extensive experience with China, Asia Pacific, North America, European, and International compliance
requirements, assures the fastest, most cost effective way to attain regulatory compliance for the global markets.
Accreditations for Conformity Assessment
Country/Region Scope
USA EMC, RF/Wireless, SAR, Telecom
Canada EMC, RF/Wireless, SAR, Telecom
Taiwan EMC, RF, Telecom, SAR, Safety
Hong Kong RF/Wireless, SAR, Telecom
Australia EMC, RF, Telecom, SAR, Safety
Korea EMI, EMS, RF, SAR, Telecom, Safety
Japan EMI, RF/Wireless, SAR, Telecom
Singapore EMC, RF, SAR, Telecom
Europe EMC, RF, SAR, Telecom, Safety
Test Report 15070186-FCC-H Page 3 of 96
This page has been left blank intentionally.
Test Report 15070186-FCC-H Page 4 of 96
CONTENTS
1 EUT IMFORMATION ...................................................................................................................................................... 5
2 TECHNICAL DETAILS ................................................................................................................................................... 6
3 INTRODUCTION ........................................................................................................................................................... 7
4 SAR MEASUREMENT SETUP ....................................................................................................................................... 8
5 ANSI/IEEE C95.1 – 1999 RF EXPOSURE LIMIT ............................................................................................................ 19
6 SYSTEM AND LIQUID VERIFICATION ......................................................................................................................... 20
7 UNCERTAINTY ASSESSMENT .................................................................................................................................... 30
8 TEST INSTRUMENT .................................................................................................................................................... 33
9 OUTPUT POWER VERIFICATION ................................................................................................................................ 34
10 EXPOSURE CONDITIONS CONSIDERATION ............................................................................................................... 41
11 SAR TEST RESULTS .................................................................................................................................................. 42
12 SAR MEASUREMENT REFERENCES .......................................................................................................................... 47
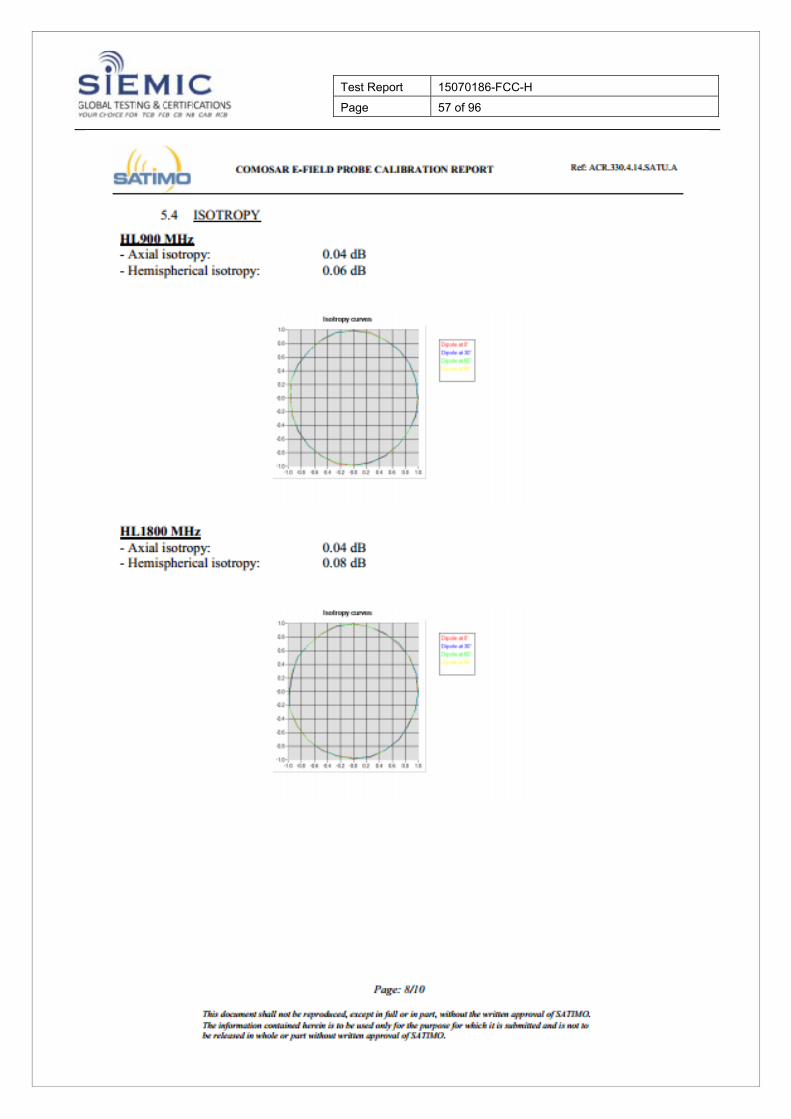
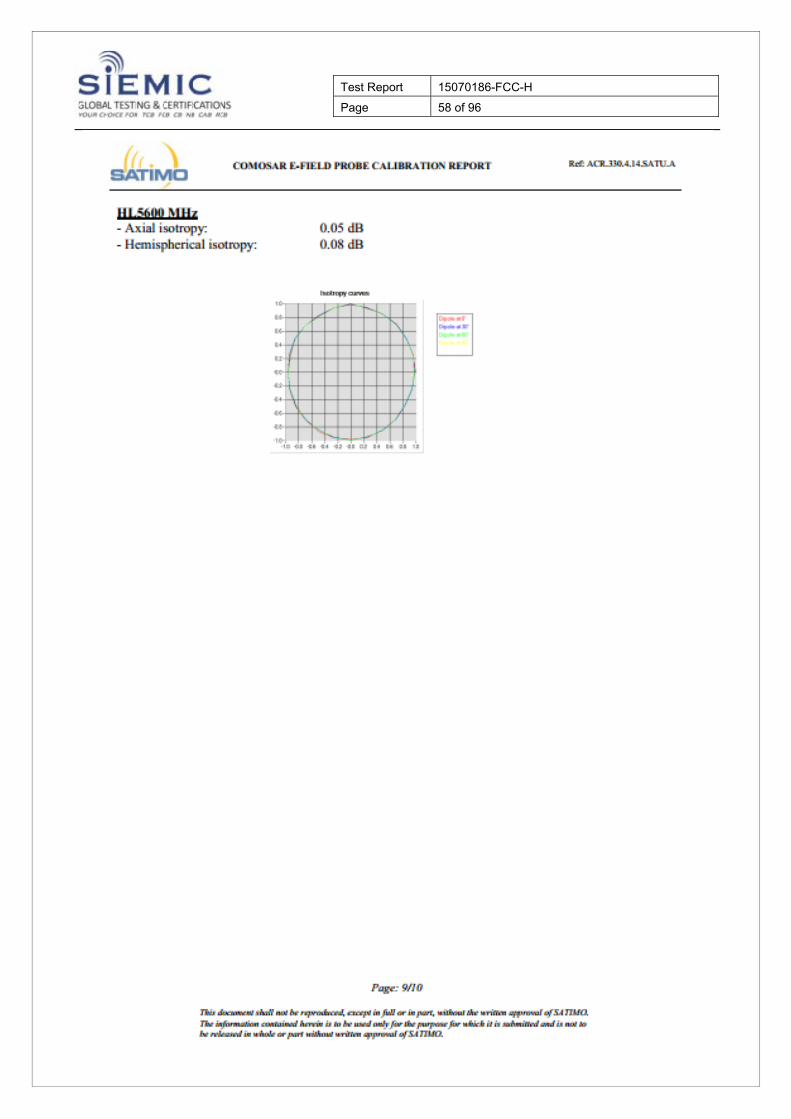
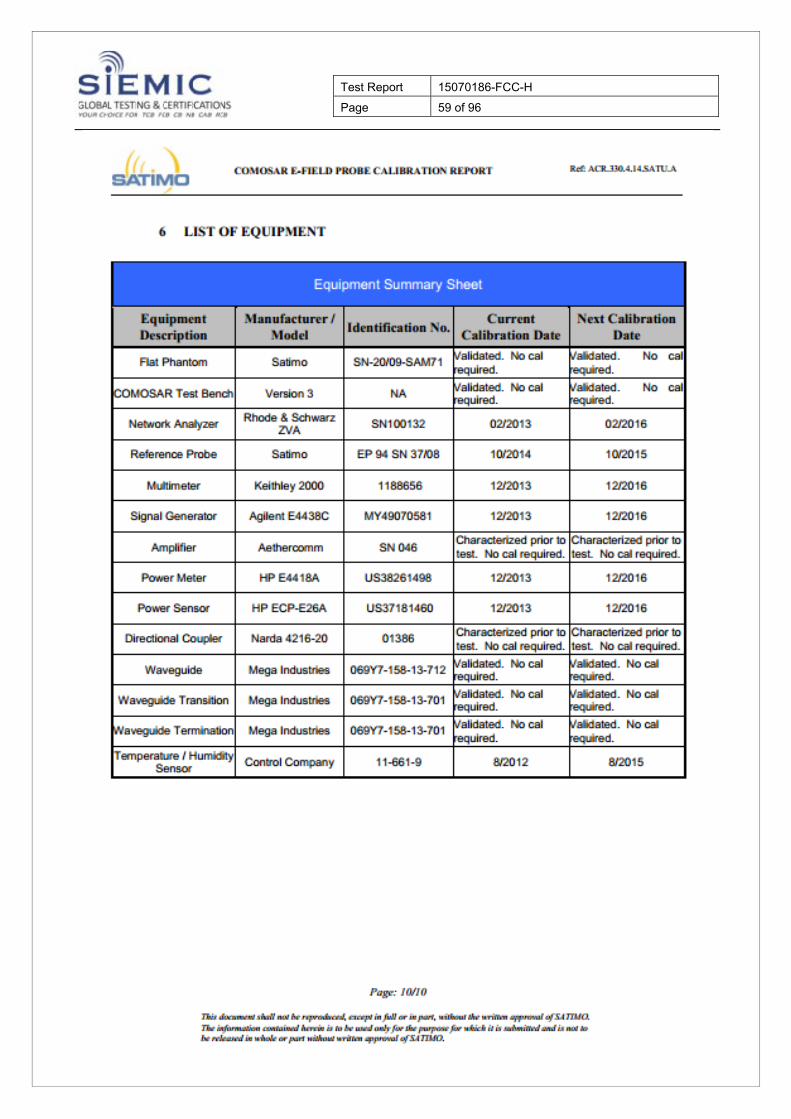
ANNEX A CALIBRATION REPORTS .................................................................................................................................. 50
ANNEX B SAR SYSTEM PHOTOGRAPHS .......................................................................................................................... 90
ANNEX C SETUP PHOTOGRAPHS .................................................................................................................................... 91
ANNEX D EUT PHOTOGRAPHS ........................................................................................................................................ 96
Test Report 15070186-FCC-H Page 5 of 96
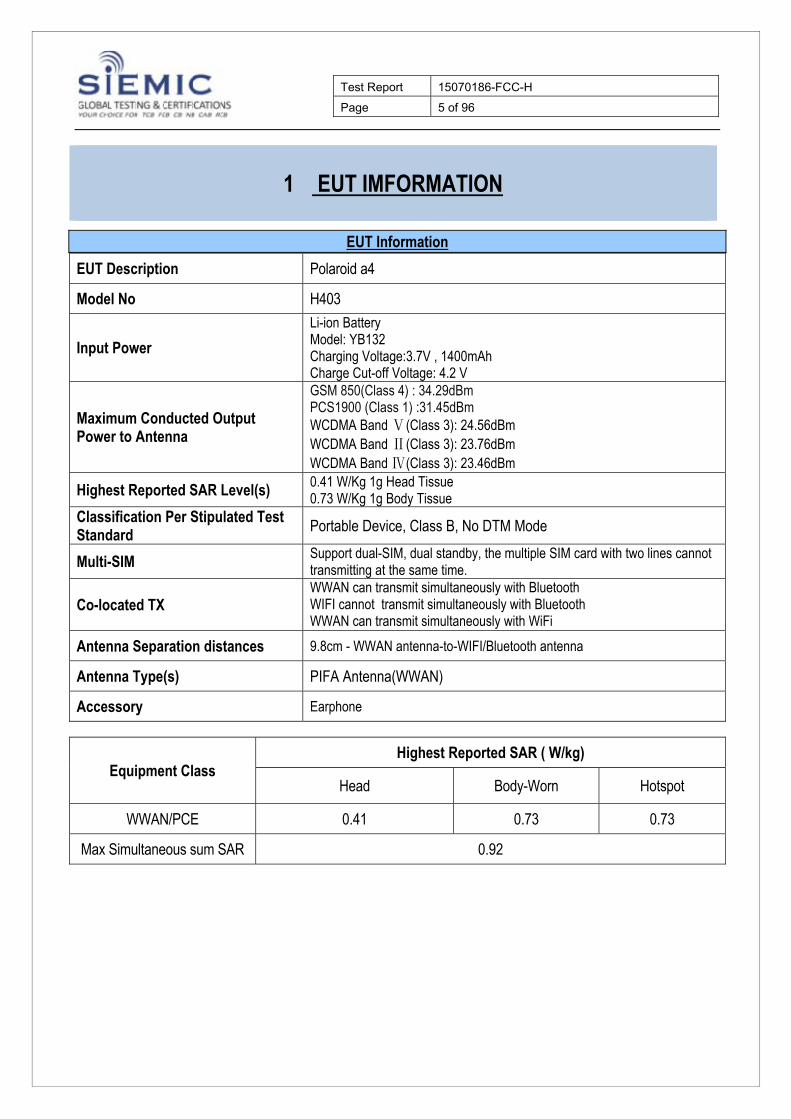
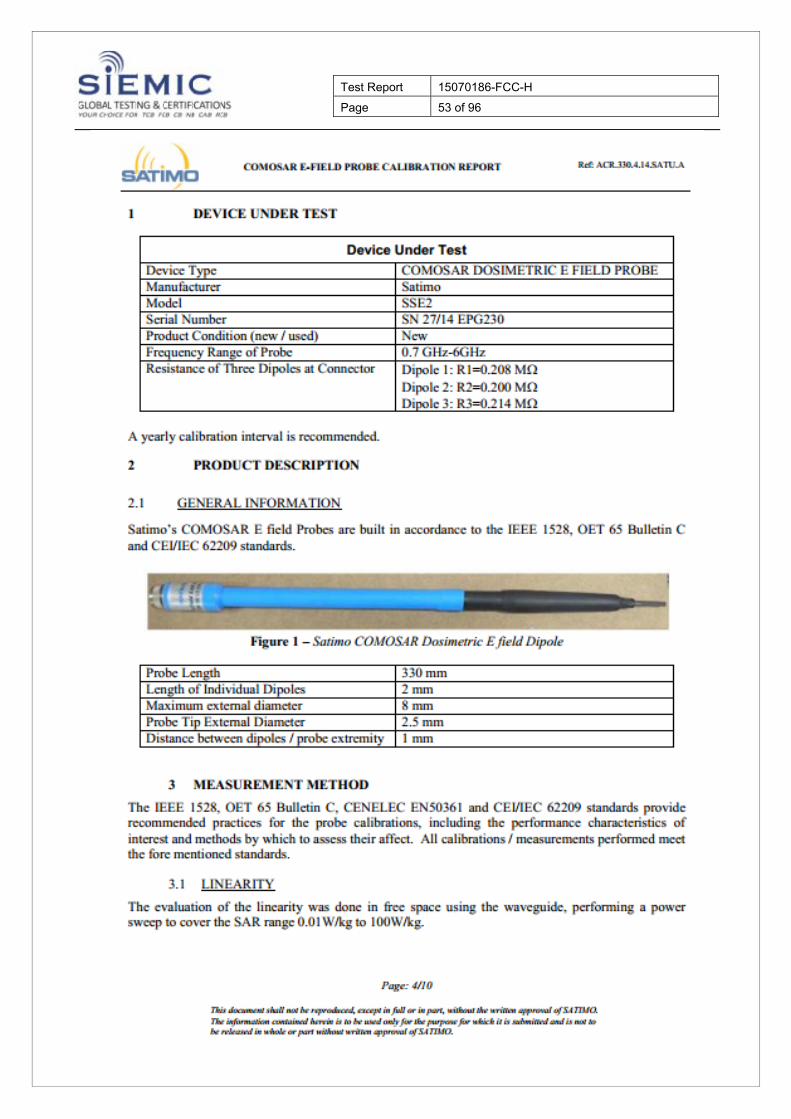
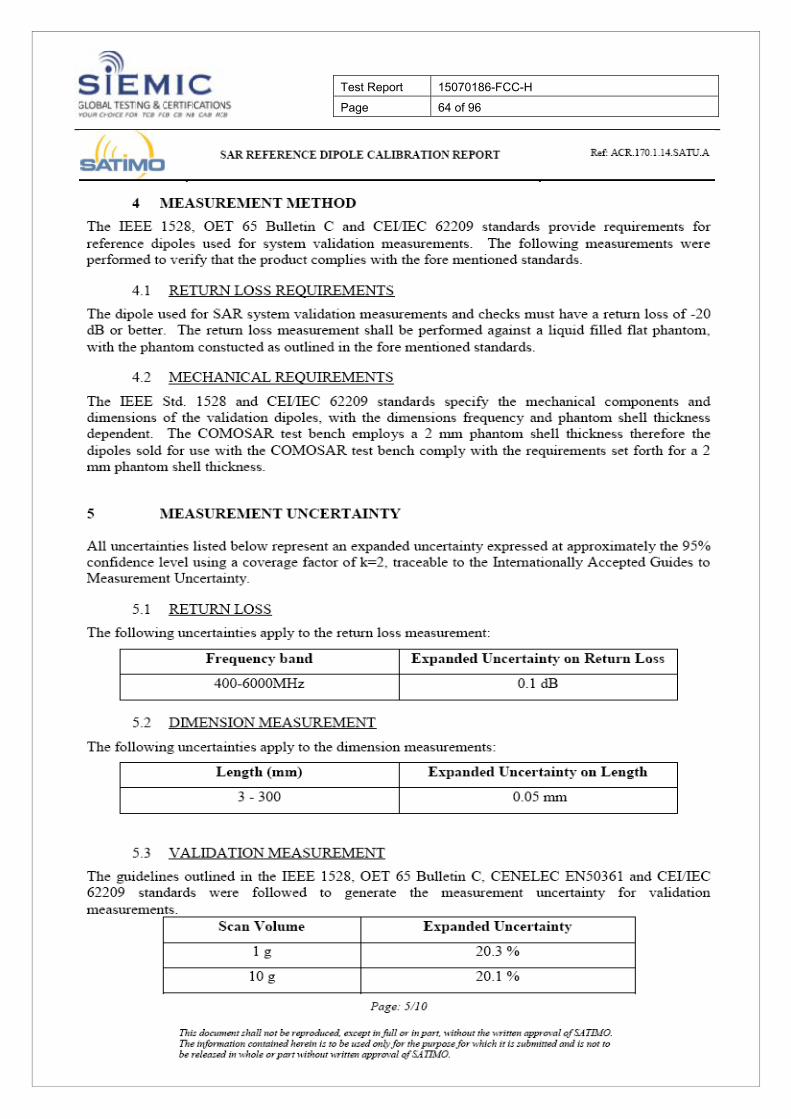
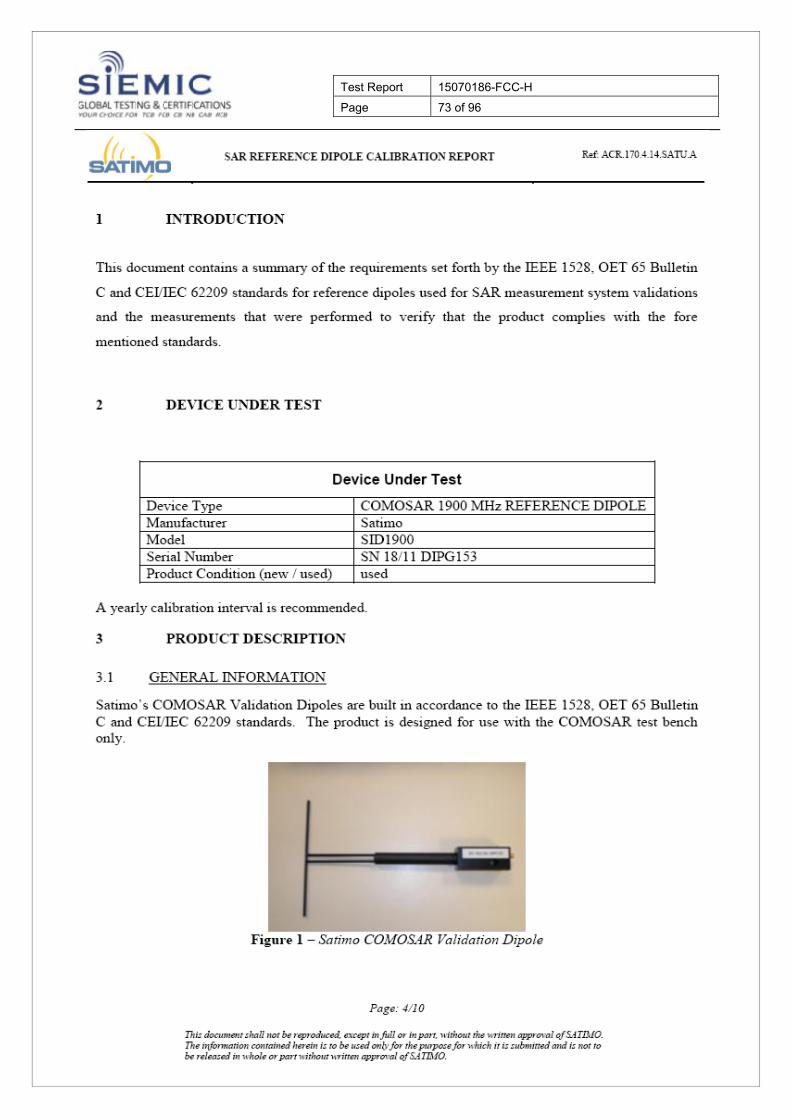
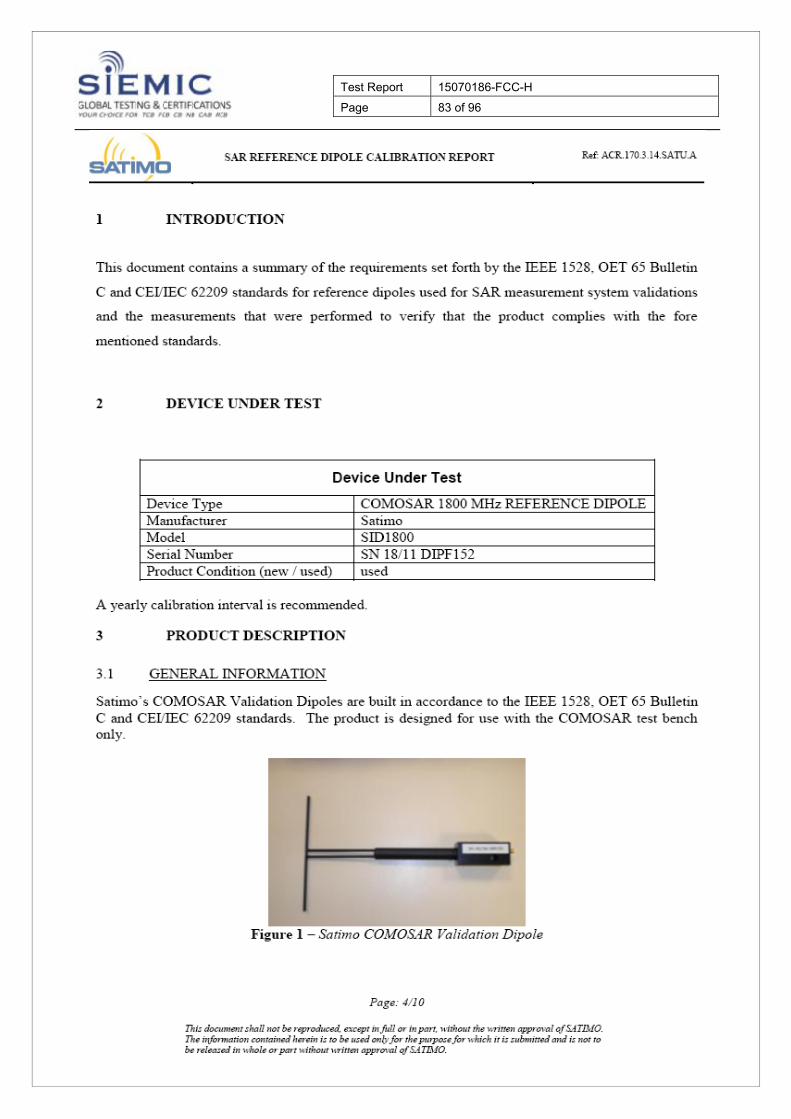
1 EUT IMFORMATION
EUT Information
EUT Description Polaroid a4
Model No H403
Input Power
Li-ion Battery Model: YB132 Charging Voltage:3.7V , 1400mAh Charge Cut-off Voltage: 4.2 V
Maximum Conducted Output Power to Antenna
GSM 850(Class 4) : 34.29dBm PCS1900 (Class 1) :31.45dBm WCDMA Band Ⅴ(Class 3): 24.56dBm WCDMA Band Ⅱ(Class 3): 23.76dBm WCDMA Band Ⅳ(Class 3): 23.46dBm
Highest Reported SAR Level(s) 0.41 W/Kg 1g Head Tissue 0.73 W/Kg 1g Body Tissue
Classification Per Stipulated Test Standard
Portable Device, Class B, No DTM Mode
Multi-SIM Support dual-SIM, dual standby, the multiple SIM card with two lines cannot transmitting at the same time.
Co-located TX WWAN can transmit simultaneously with Bluetooth WIFI cannot transmit simultaneously with Bluetooth WWAN can transmit simultaneously with WiFi
Antenna Separation distances 9.8cm - WWAN antenna-to-WIFI/Bluetooth antenna
Antenna Type(s) PIFA Antenna(WWAN)
Accessory Earphone
Equipment Class Highest Reported SAR ( W/kg)
Head Body-Worn Hotspot
WWAN/PCE 0.41 0.73 0.73
Max Simultaneous sum SAR 0.92
Test Report 15070186-FCC-H Page 6 of 96
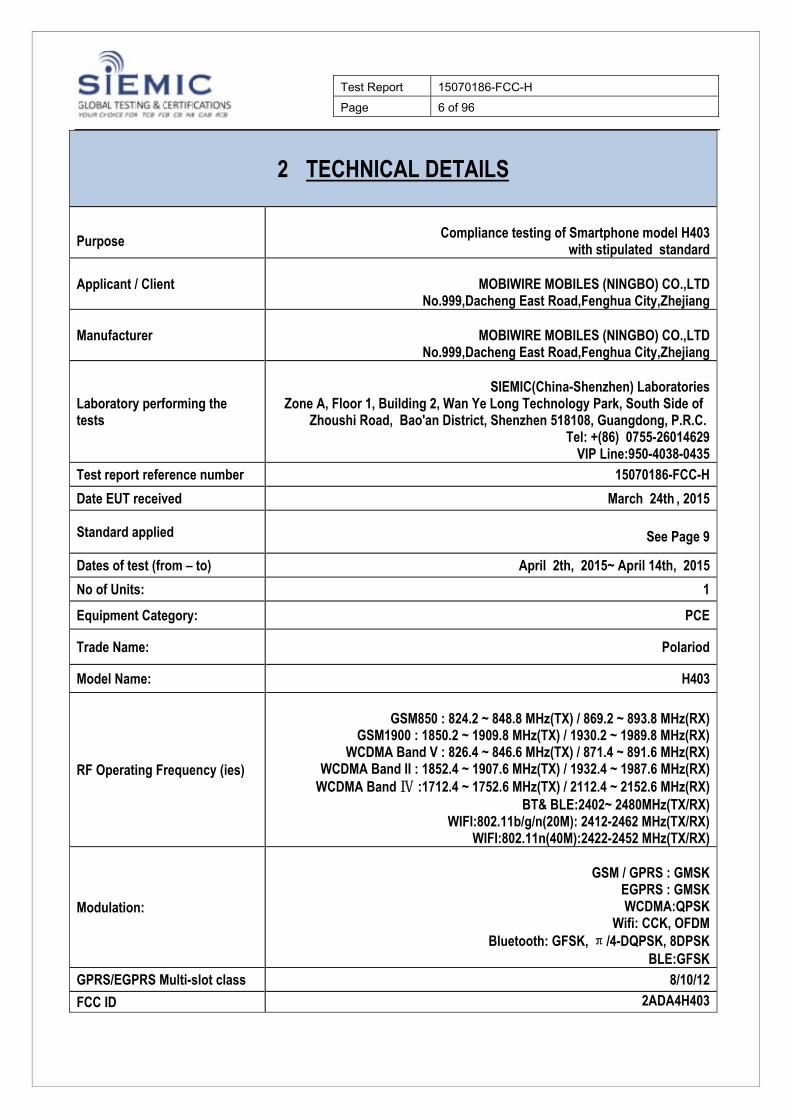
2 TECHNICAL DETAILS
Purpose
Compliance testing of Smartphone model H403
with stipulated standard
Applicant / Client
MOBIWIRE MOBILES (NINGBO) CO.,LTD No.999,Dacheng East Road,Fenghua City,Zhejiang
Manufacturer
MOBIWIRE MOBILES (NINGBO) CO.,LTD No.999,Dacheng East Road,Fenghua City,Zhejiang
Laboratory performing the tests
SIEMIC(China-Shenzhen) Laboratories
Zone A, Floor 1, Building 2, Wan Ye Long Technology Park, South Side of Zhoushi Road, Bao'an District, Shenzhen 518108, Guangdong, P.R.C.
Tel: +(86) 0755-26014629 VIP Line:950-4038-0435
Test report reference number 15070186-FCC-H
Date EUT received March 24th , 2015
Standard applied
See Page 9
Dates of test (from – to) April 2th, 2015~ April 14th, 2015
No of Units: 1
Equipment Category: PCE
Trade Name: Polariod
Model Name: H403
RF Operating Frequency (ies)
GSM850 : 824.2 ~ 848.8 MHz(TX) / 869.2 ~ 893.8 MHz(RX)
GSM1900 : 1850.2 ~ 1909.8 MHz(TX) / 1930.2 ~ 1989.8 MHz(RX) WCDMA Band V : 826.4 ~ 846.6 MHz(TX) / 871.4 ~ 891.6 MHz(RX)
WCDMA Band II : 1852.4 ~ 1907.6 MHz(TX) / 1932.4 ~ 1987.6 MHz(RX) WCDMA Band Ⅳ :1712.4 ~ 1752.6 MHz(TX) / 2112.4 ~ 2152.6 MHz(RX)
BT& BLE:2402~ 2480MHz(TX/RX) WIFI:802.11b/g/n(20M): 2412-2462 MHz(TX/RX)
WIFI:802.11n(40M):2422-2452 MHz(TX/RX)
Modulation:
GSM / GPRS : GMSK
EGPRS : GMSK WCDMA:QPSK
Wifi: CCK, OFDM Bluetooth: GFSK, π/4-DQPSK, 8DPSK
BLE:GFSK GPRS/EGPRS Multi-slot class 8/10/12
FCC ID 2ADA4H403
Test Report 15070186-FCC-H Page 7 of 96
3 INTRODUCTION
Introduction This measurement report shows compliance of the EUT with ANSI/IEEE C95.1-1999 and FCC 47 CFR Part2 (2.1093) . The test procedures, as described in IEEE 1528-2013 Standard for IEEE Recommended Practice for Determining the Peak Spatial-Average Specific Absorption Rate (SAR) in the Human Head from Wireless Communications Devices: Measurement Techniques(300MHz~6GHz) and Published RF Exposure KDB Procedures
SAR Definition
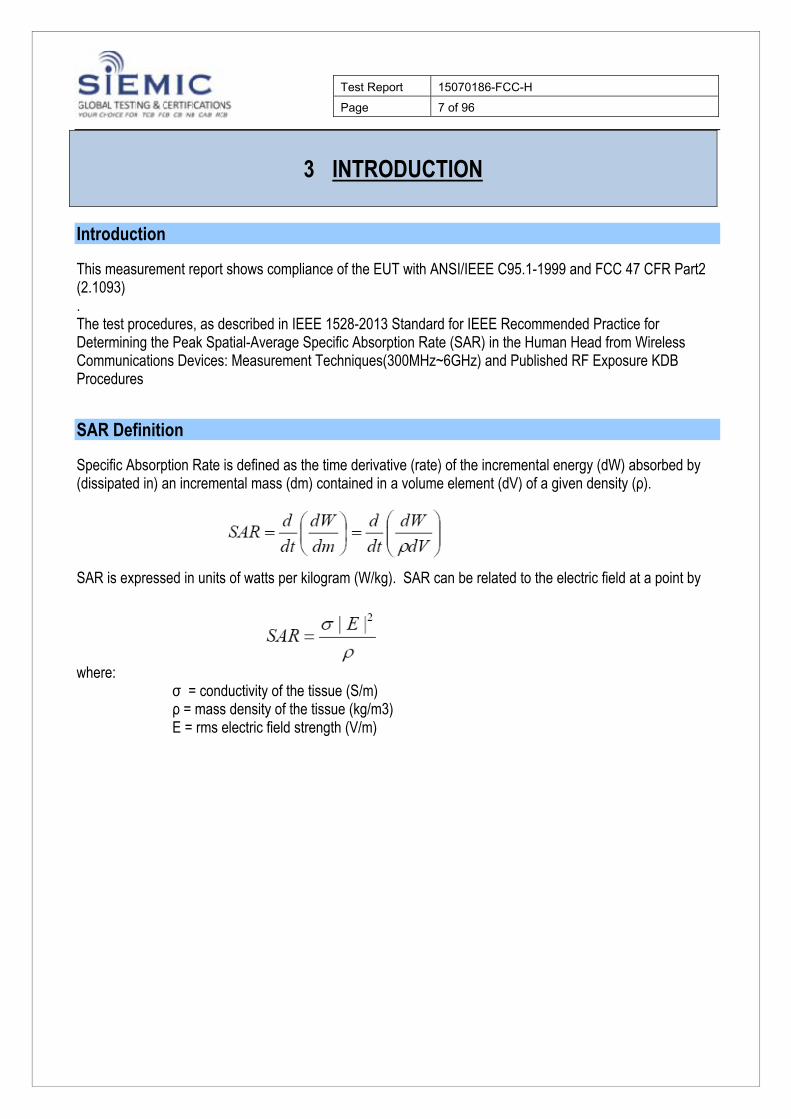
Specific Absorption Rate is defined as the time derivative (rate) of the incremental energy (dW) absorbed by (dissipated in) an incremental mass (dm) contained in a volume element (dV) of a given density (ρ). SAR is expressed in units of watts per kilogram (W/kg). SAR can be related to the electric field at a point by where: σ = conductivity of the tissue (S/m) ρ = mass density of the tissue (kg/m3) E = rms electric field strength (V/m)
Test Report 15070186-FCC-H Page 8 of 96
4 SAR MEASUREMENT SETUP
Dosimetric Assessment System
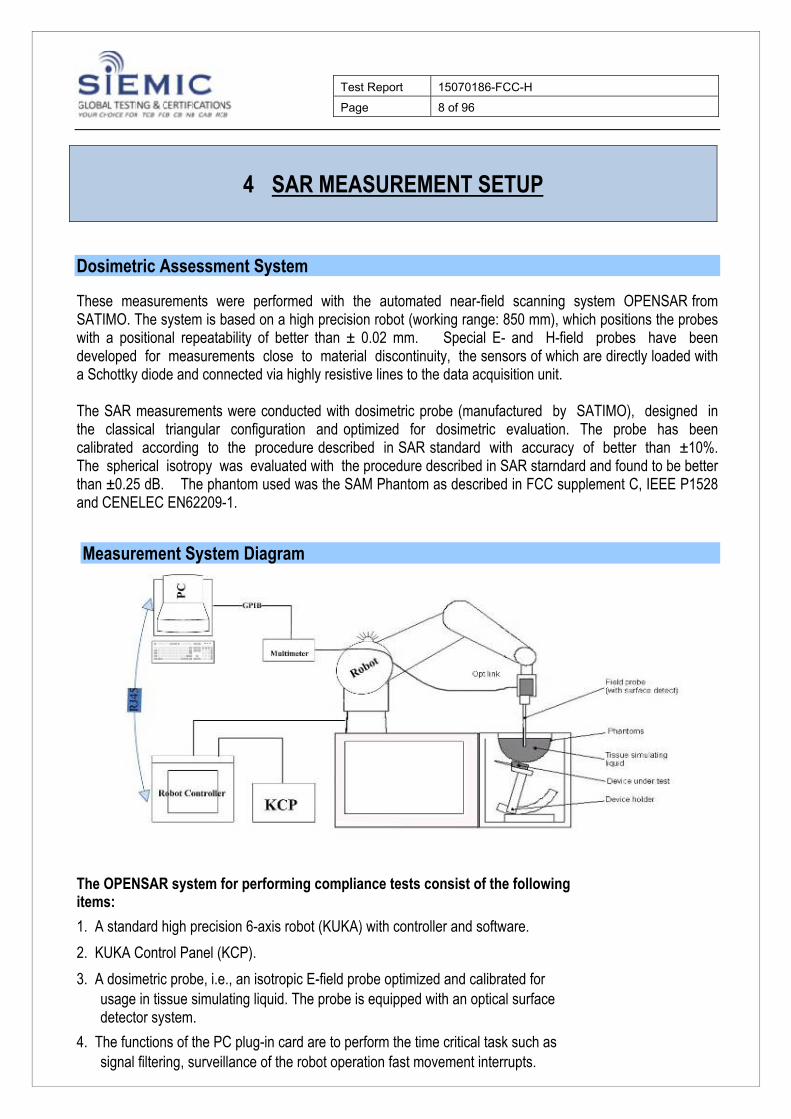
These measurements were performed with the automated near-field scanning system OPENSAR from SATIMO. The system is based on a high precision robot (working range: 850 mm), which positions the probes with a positional repeatability of better than ± 0.02 mm. Special E- and H-field probes have been developed for measurements close to material discontinuity, the sensors of which are directly loaded with a Schottky diode and connected via highly resistive lines to the data acquisition unit. The SAR measurements were conducted with dosimetric probe (manufactured by SATIMO), designed in the classical triangular configuration and optimized for dosimetric evaluation. The probe has been calibrated according to the procedure described in SAR standard with accuracy of better than ±10%. The spherical isotropy was evaluated with the procedure described in SAR starndard and found to be better than ±0.25 dB. The phantom used was the SAM Phantom as described in FCC supplement C, IEEE P1528 and CENELEC EN62209-1.
Measurement System Diagram
The OPENSAR system for performing compliance tests consist of the following items:
1. A standard high precision 6-axis robot (KUKA) with controller and software.
2. KUKA Control Panel (KCP).
3. A dosimetric probe, i.e., an isotropic E-field probe optimized and calibrated for usage in tissue simulating liquid. The probe is equipped with an optical surface detector system.
4. The functions of the PC plug-in card are to perform the time critical task such as signal filtering, surveillance of the robot operation fast movement interrupts.
Test Report 15070186-FCC-H Page 9 of 96
5. A computer operating Windows XP.
6. OPENSAR software.
7. Remote control with teaches pendant and additional circuitry for robot safety such as warning lamps, etc.
8. The SAM phantom enabling testing left-hand right-hand and body usage.
9. The Position device for handheld EUT.
10. Tissue simulating liquid mixed according to the given recipes (see Application Note).
11. System validation dipoles to validate the proper functioning of the system.
Test Report 15070186-FCC-H Page 10 of 96
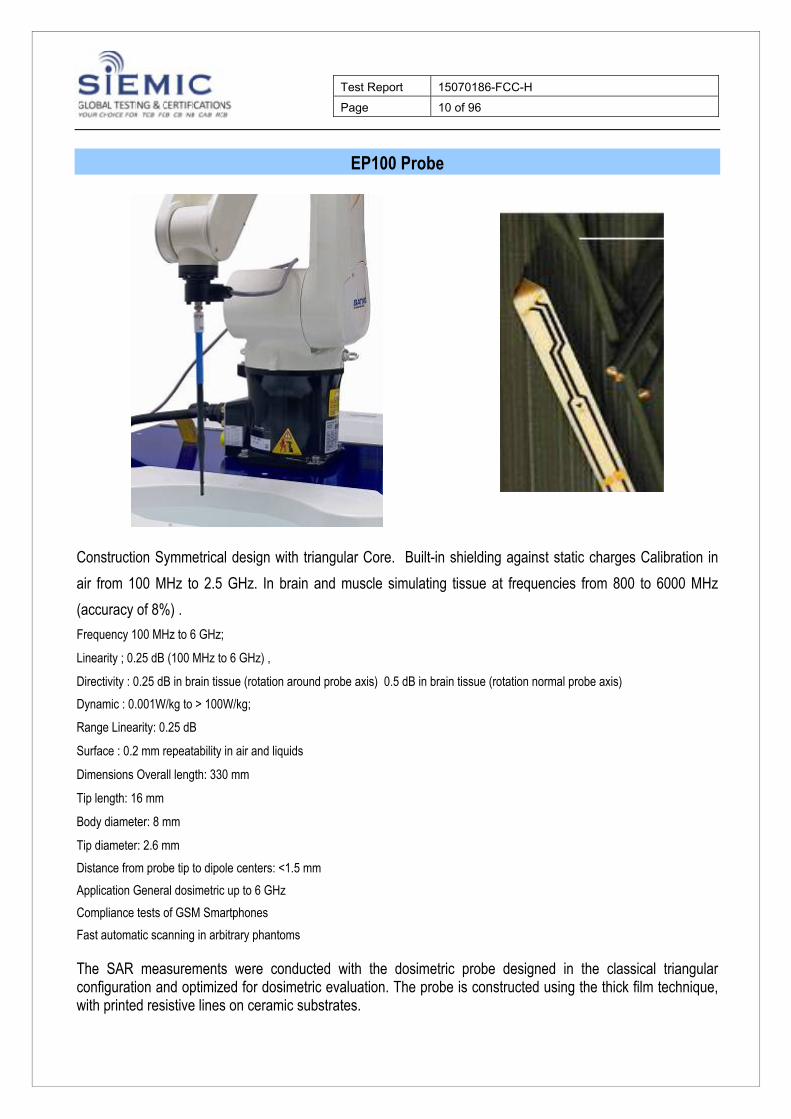
EP100 Probe
Construction Symmetrical design with triangular Core. Built-in shielding against static charges Calibration in
air from 100 MHz to 2.5 GHz. In brain and muscle simulating tissue at frequencies from 800 to 6000 MHz
(accuracy of 8%) .
Frequency 100 MHz to 6 GHz;
Linearity ; 0.25 dB (100 MHz to 6 GHz) ,
Directivity : 0.25 dB in brain tissue (rotation around probe axis) 0.5 dB in brain tissue (rotation normal probe axis)
Dynamic : 0.001W/kg to > 100W/kg;
Range Linearity: 0.25 dB
Surface : 0.2 mm repeatability in air and liquids
Dimensions Overall length: 330 mm
Tip length: 16 mm
Body diameter: 8 mm
Tip diameter: 2.6 mm
Distance from probe tip to dipole centers: <1.5 mm
Application General dosimetric up to 6 GHz
Compliance tests of GSM Smartphones
Fast automatic scanning in arbitrary phantoms The SAR measurements were conducted with the dosimetric probe designed in the classical triangular configuration and optimized for dosimetric evaluation. The probe is constructed using the thick film technique, with printed resistive lines on ceramic substrates.
Test Report 15070186-FCC-H Page 11 of 96
It is connected to the KRC box on the robot arm and provides an automatic detection of the phantom surface. The 3D file of the phantom is include in OpenSAR software. The Video Positioning System allow the system to take the automatic reference and to move the probe safely and accurately on the phantom.
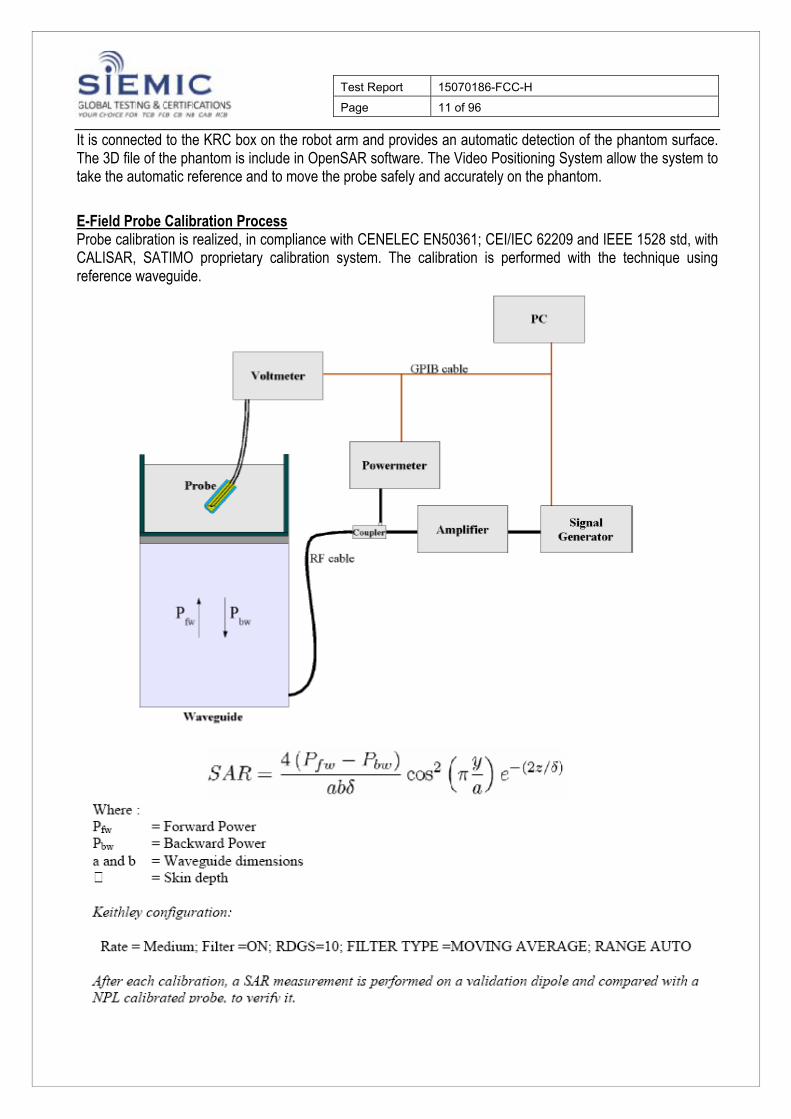
E-Field Probe Calibration Process Probe calibration is realized, in compliance with CENELEC EN50361; CEI/IEC 62209 and IEEE 1528 std, with CALISAR, SATIMO proprietary calibration system. The calibration is performed with the technique using reference waveguide.
Test Report 15070186-FCC-H Page 12 of 96
Each probe is calibrated according to a dosimetric assessment procedure described in SAR standard with accuracy better than +/- 10%. The spherical isotropy was evaluated with the procedure described in SAR standard and found to be better than +/-0.25dB. The sensitivity parameters (NormX, NormY, NormZ), the diode compression parameter (DCP) and the conversion factor (ConvF) of the probe are tested. The free space E-field from probe outputs is determined in a test chamber. This is performed in a TEM cell for frequencies bellow 0.8 GHz, and in a waveguide above 0.8 GHz for free space. For the free space calibration, the probe is placed in the volumetric center of the cavity and at the proper orientation with the field. E-field correlation calibration is performed in a flat phantom filled with the appropriate simulated brain tissue.
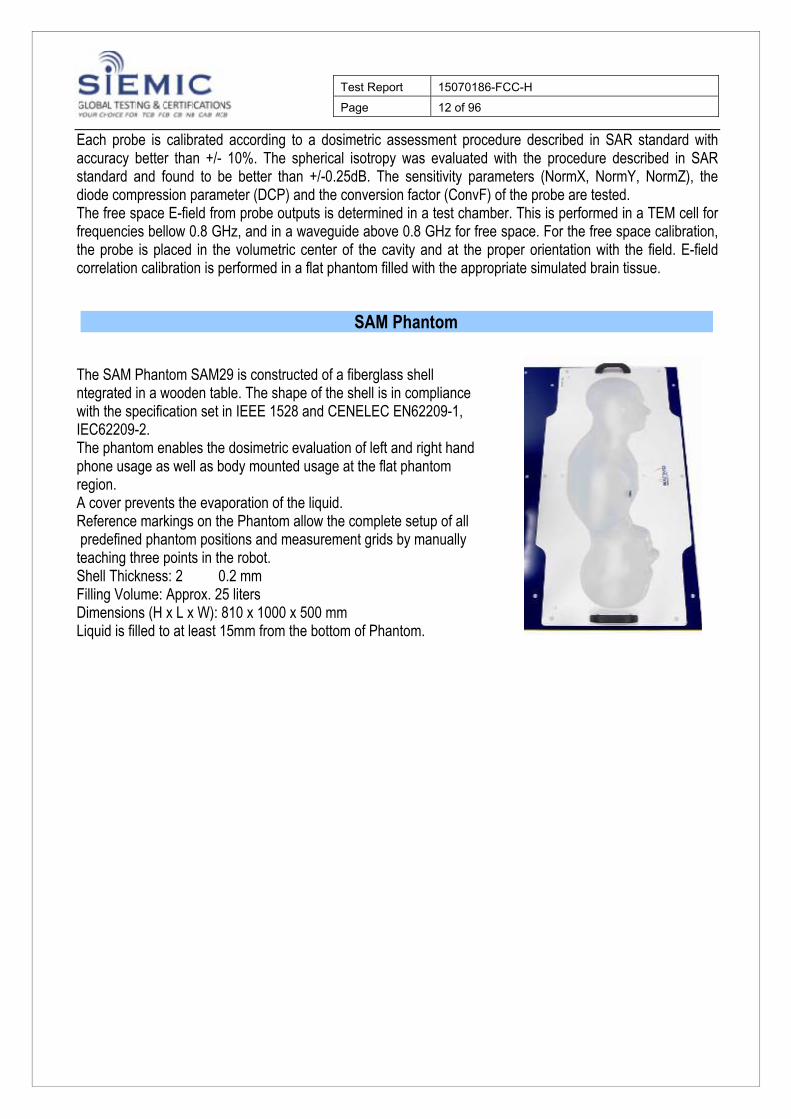
SAM Phantom
The SAM Phantom SAM29 is constructed of a fiberglass shell ntegrated in a wooden table. The shape of the shell is in compliance with the specification set in IEEE 1528 and CENELEC EN62209-1, IEC62209-2. The phantom enables the dosimetric evaluation of left and right hand phone usage as well as body mounted usage at the flat phantom region. A cover prevents the evaporation of the liquid. Reference markings on the Phantom allow the complete setup of all predefined phantom positions and measurement grids by manually teaching three points in the robot. Shell Thickness: 2 0.2 mm Filling Volume: Approx. 25 liters Dimensions (H x L x W): 810 x 1000 x 500 mm Liquid is filled to at least 15mm from the bottom of Phantom.
Test Report 15070186-FCC-H Page 13 of 96
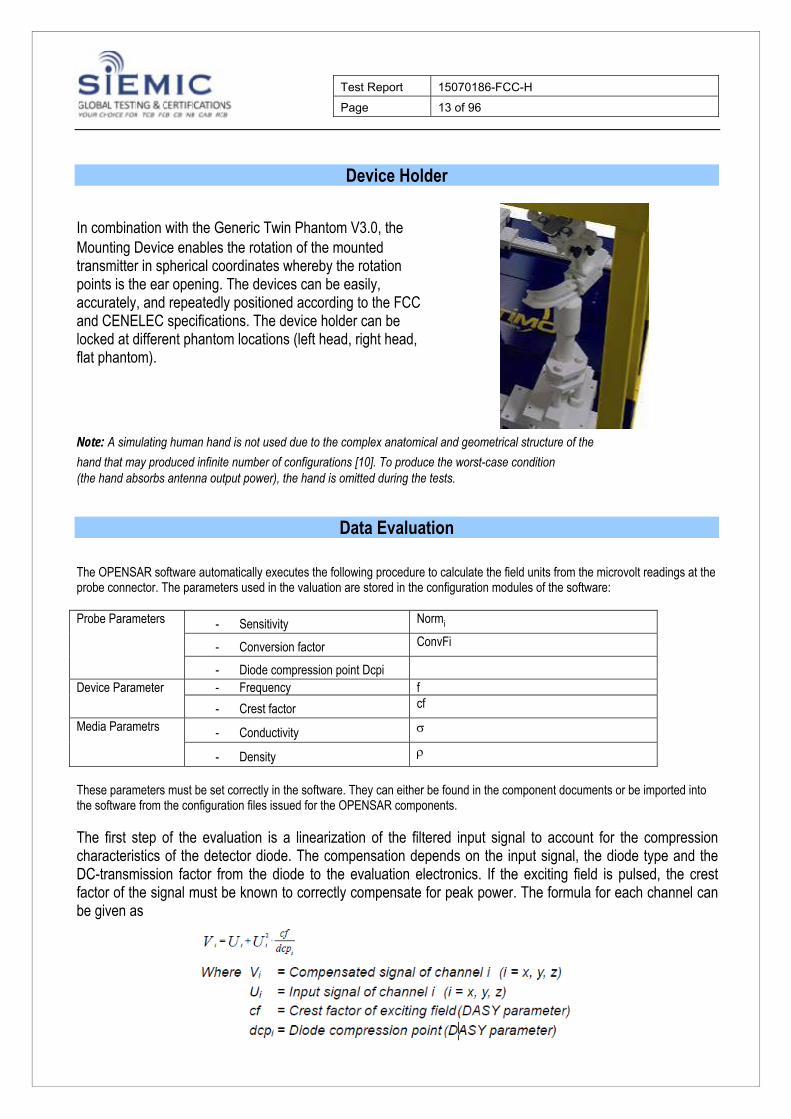
Device Holder
In combination with the Generic Twin Phantom V3.0, the Mounting Device enables the rotation of the mounted transmitter in spherical coordinates whereby the rotation points is the ear opening. The devices can be easily, accurately, and repeatedly positioned according to the FCC and CENELEC specifications. The device holder can be locked at different phantom locations (left head, right head, flat phantom).
Note: A simulating human hand is not used due to the complex anatomical and geometrical structure of the
hand that may produced infinite number of configurations [10]. To produce the worst-case condition (the hand absorbs antenna output power), the hand is omitted during the tests.
Data Evaluation The OPENSAR software automatically executes the following procedure to calculate the field units from the microvolt readings at the probe connector. The parameters used in the valuation are stored in the configuration modules of the software: Probe Parameters - Sensitivity Normi
- Conversion factor ConvFi
- Diode compression point Dcpi
Device Parameter - Frequency f
- Crest factor cf
Media Parametrs - Conductivity
- Density
These parameters must be set correctly in the software. They can either be found in the component documents or be imported into the software from the configuration files issued for the OPENSAR components. The first step of the evaluation is a linearization of the filtered input signal to account for the compression characteristics of the detector diode. The compensation depends on the input signal, the diode type and the DC-transmission factor from the diode to the evaluation electronics. If the exciting field is pulsed, the crest factor of the signal must be known to correctly compensate for peak power. The formula for each channel can be given as

Test Report 15070186-FCC-H Page 14 of 96
From the compensated input signals the primary field data for each channel can be evaluated:
Test Report 15070186-FCC-H Page 15 of 96
SAR Evaluation – Peak Spatial - Average
The procedure for assessing the peak spatial-average SAR value consists of the following steps • Power Reference Measurement
The reference and drift jobs are useful jobs for monitoring the power drift of the device under test in the batch process. Both
jobs measure the field at a specified reference position, at a selectable distance from the phantom surface. The reference
position can be either the selected section's grid reference point or a user point in this section. The reference job projects the
selected point onto the phantom surface, orients the probe perpendicularly to the surface, and approaches the surface using the selected detection method.
• Area Scan
The area scan is used as a fast scan in two dimensions to find the area of high field values, before doing a finer
measurement around the hot spot. The sophisticated interpolation routines implemented in OPENSAR software
can find the maximum locations even in relatively coarse grids. The scan area is defined by an editable grid. This grid
is anchored at the grid reference point of the selected section in the phantom. When the area scan's property sheet is
brought-up, grid was at to 15 mm by 15 mm and can be edited by a user. • Zoom Scan
Zoom scans are used to assess the peak spatial SAR values within a cubic averaging volume containing 1 g and 10 g of
simulated tissue. The default zoom scan measures 5 x 5 x 7 points within a cube whose base faces are centered around the
maximum found in a preceding area scan job within the same procedure. If the preceding Area Scan job indicates more then
one maximum, the number of Zoom Scans has to be enlarged accordingly (The default number inserted is 1). • Power Drift measurement
The drift job measures the field at the same location as the most recent reference job within the same procedure, and with the
same settings. The drift measurement gives the field difference in dB from the reading conducted within the last reference
measurement. Several drift measurements are possible for one reference measurement. This allows a user to monitor the
power drift of the device under test within a batch process. In the properties of the Drift job, the user can specify a limit for
the drift and have OPENSAR software stop the measurements if this limit is exceeded.
SAR Evaluation – Peak SAR The procedure for spatial peak SAR evaluation has been implemented according to the IEEE1529 standard. It can be conducted for 1 g and 10 g. The OPENSAR system allows evaluations that combine measured data and robot positions, such as:
• maximum search
• extrapolation
• boundary correction
• peak search for averaged SAR
During a maximum search, global and local maximum searches are automatically performed in 2-D after each Area Scan measurement with at least
6 measurement points. It is based on the evaluation of the local SAR gradient calculated by the Quadratic Shepard's method. The algorithm will
find the global maximum and all local maxima within -2 dB of the global maxima for all SAR distributions.
Test Report 15070186-FCC-H Page 16 of 96
Extrapolation
Extrapolation routines are used to obtain SAR values between the lowest measurement points and the inner phantom surface. The extrapolation distance is determined by the surface detection distance and the probe sensor offset. Several measurements at different distances are necessary for the extrapolation. They are used in the Cube Scan to obtain SAR values between the lowest measurement points and the inner phantom surface. The routine uses the fourth order least square polynomial method for extrapolation. For a grid using 5x5x7 measurement points with 5mm resolution amounting to 343 measurement points, the uncertainty of the extrapolation routines is less than 1% for 1 g and 10 g cubes.
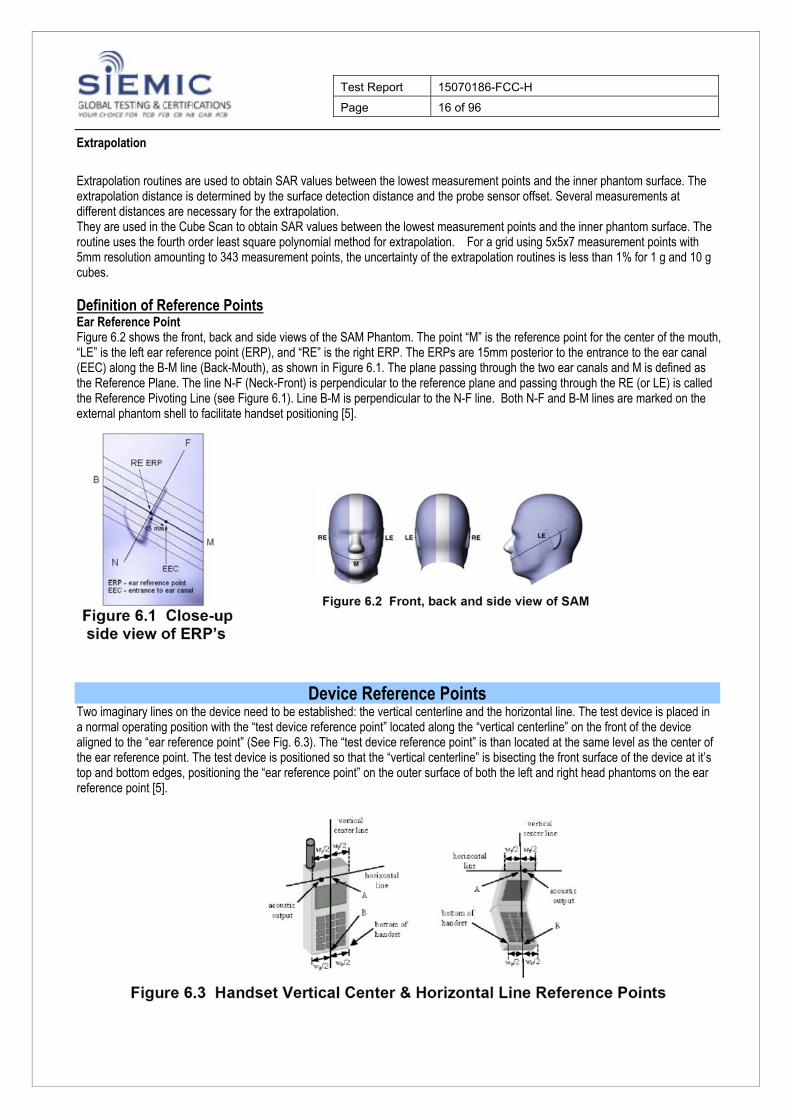
Definition of Reference Points Ear Reference Point Figure 6.2 shows the front, back and side views of the SAM Phantom. The point “M” is the reference point for the center of the mouth, “LE” is the left ear reference point (ERP), and “RE” is the right ERP. The ERPs are 15mm posterior to the entrance to the ear canal (EEC) along the B-M line (Back-Mouth), as shown in Figure 6.1. The plane passing through the two ear canals and M is defined as the Reference Plane. The line N-F (Neck-Front) is perpendicular to the reference plane and passing through the RE (or LE) is called the Reference Pivoting Line (see Figure 6.1). Line B-M is perpendicular to the N-F line. Both N-F and B-M lines are marked on the external phantom shell to facilitate handset positioning [5].
Device Reference Points Two imaginary lines on the device need to be established: the vertical centerline and the horizontal line. The test device is placed in a normal operating position with the “test device reference point” located along the “vertical centerline” on the front of the device aligned to the “ear reference point” (See Fig. 6.3). The “test device reference point” is than located at the same level as the center of the ear reference point. The test device is positioned so that the “vertical centerline” is bisecting the front surface of the device at it’s top and bottom edges, positioning the “ear reference point” on the outer surface of both the left and right head phantoms on the ear reference point [5].
Test Report 15070186-FCC-H Page 17 of 96
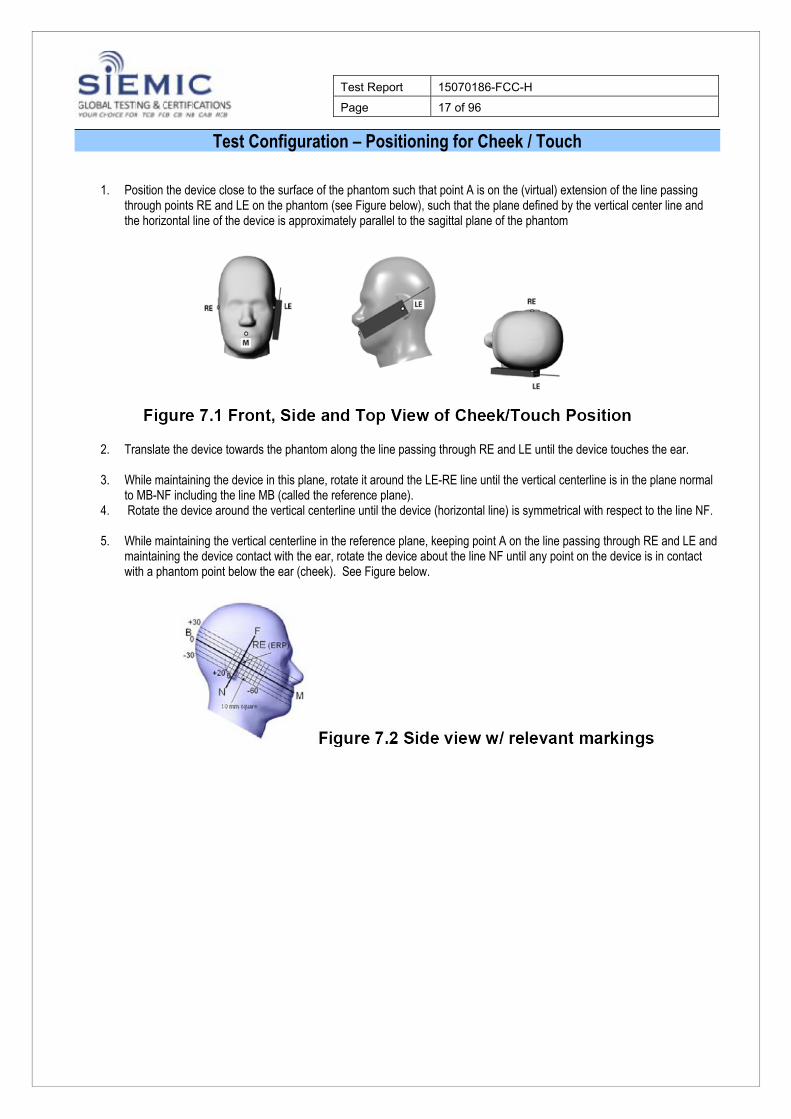
Test Configuration – Positioning for Cheek / Touch
1. Position the device close to the surface of the phantom such that point A is on the (virtual) extension of the line passing through points RE and LE on the phantom (see Figure below), such that the plane defined by the vertical center line and the horizontal line of the device is approximately parallel to the sagittal plane of the phantom
2. Translate the device towards the phantom along the line passing through RE and LE until the device touches the ear.
3. While maintaining the device in this plane, rotate it around the LE-RE line until the vertical centerline is in the plane normal to MB-NF including the line MB (called the reference plane).
4. Rotate the device around the vertical centerline until the device (horizontal line) is symmetrical with respect to the line NF.
5. While maintaining the vertical centerline in the reference plane, keeping point A on the line passing through RE and LE and maintaining the device contact with the ear, rotate the device about the line NF until any point on the device is in contact with a phantom point below the ear (cheek). See Figure below.
Test Report 15070186-FCC-H Page 18 of 96
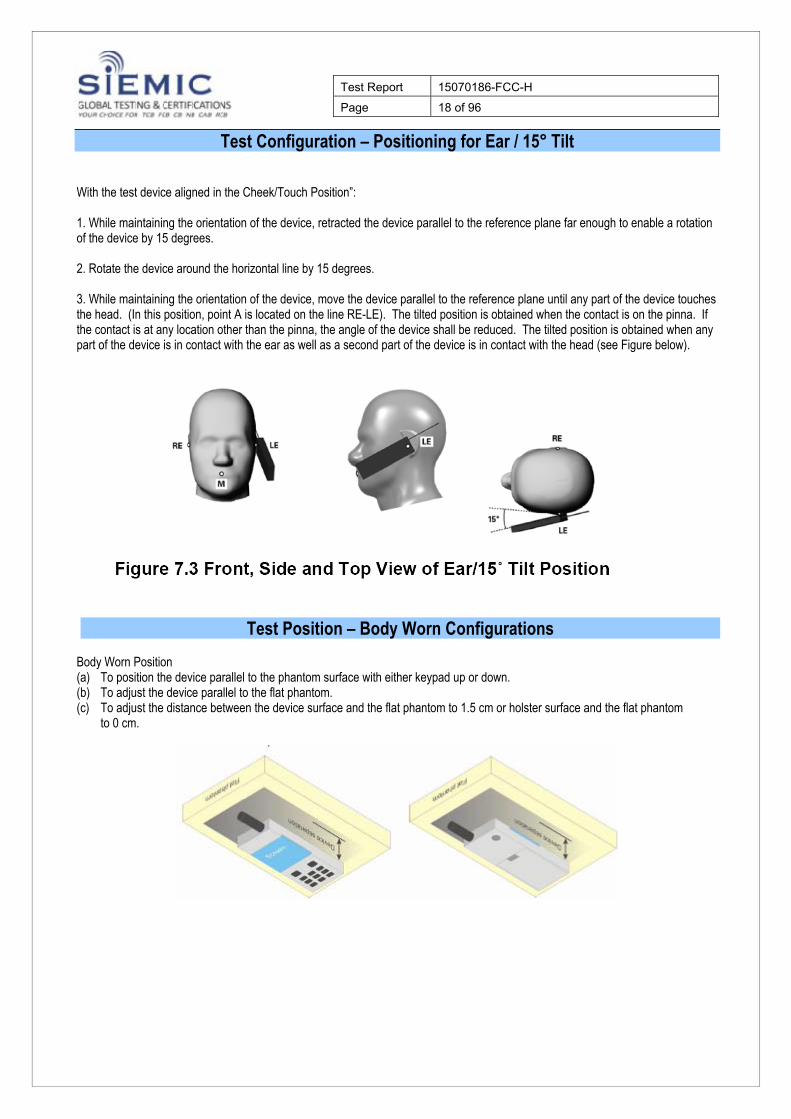
Test Configuration – Positioning for Ear / 15° Tilt
With the test device aligned in the Cheek/Touch Position”: 1. While maintaining the orientation of the device, retracted the device parallel to the reference plane far enough to enable a rotation of the device by 15 degrees. 2. Rotate the device around the horizontal line by 15 degrees. 3. While maintaining the orientation of the device, move the device parallel to the reference plane until any part of the device touches the head. (In this position, point A is located on the line RE-LE). The tilted position is obtained when the contact is on the pinna. If the contact is at any location other than the pinna, the angle of the device shall be reduced. The tilted position is obtained when any part of the device is in contact with the ear as well as a second part of the device is in contact with the head (see Figure below).
Test Position – Body Worn Configurations Body Worn Position (a) To position the device parallel to the phantom surface with either keypad up or down. (b) To adjust the device parallel to the flat phantom. (c) To adjust the distance between the device surface and the flat phantom to 1.5 cm or holster surface and the flat phantom
to 0 cm.
Test Report 15070186-FCC-H Page 19 of 96
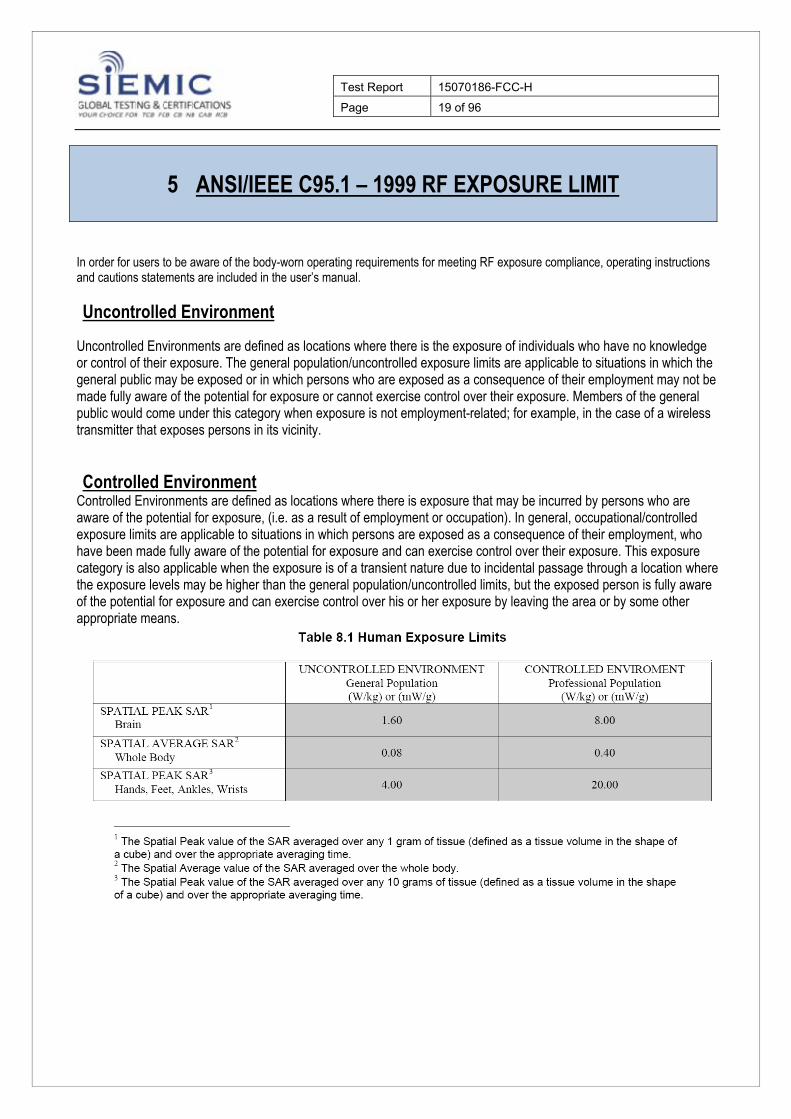
5 ANSI/IEEE C95.1 – 1999 RF EXPOSURE LIMIT
In order for users to be aware of the body-worn operating requirements for meeting RF exposure compliance, operating instructions and cautions statements are included in the user’s manual.
Uncontrolled Environment Uncontrolled Environments are defined as locations where there is the exposure of individuals who have no knowledge or control of their exposure. The general population/uncontrolled exposure limits are applicable to situations in which the general public may be exposed or in which persons who are exposed as a consequence of their employment may not be made fully aware of the potential for exposure or cannot exercise control over their exposure. Members of the general public would come under this category when exposure is not employment-related; for example, in the case of a wireless transmitter that exposes persons in its vicinity.
Controlled Environment Controlled Environments are defined as locations where there is exposure that may be incurred by persons who are aware of the potential for exposure, (i.e. as a result of employment or occupation). In general, occupational/controlled exposure limits are applicable to situations in which persons are exposed as a consequence of their employment, who have been made fully aware of the potential for exposure and can exercise control over their exposure. This exposure category is also applicable when the exposure is of a transient nature due to incidental passage through a location where the exposure levels may be higher than the general population/uncontrolled limits, but the exposed person is fully aware of the potential for exposure and can exercise control over his or her exposure by leaving the area or by some other appropriate means.
Test Report 15070186-FCC-H Page 20 of 96
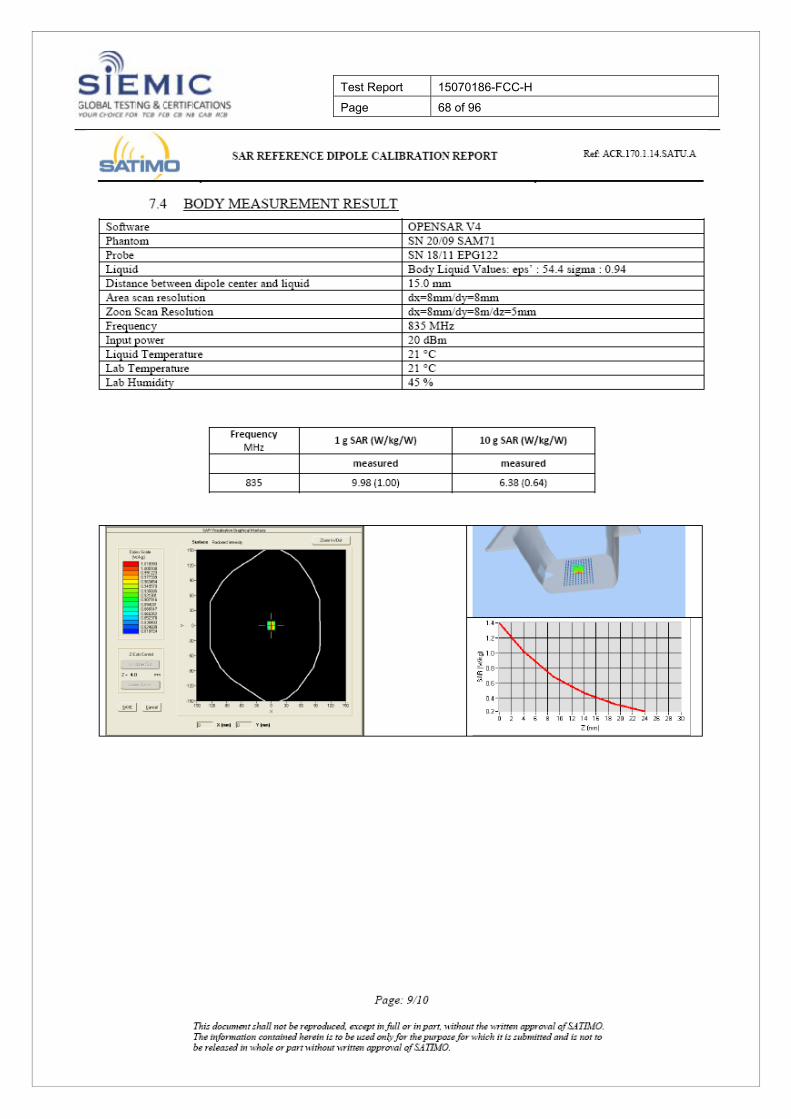
6 SYSTEM AND LIQUID VERIFICATION
Basic SAR system validation requirements The SAR system must be validated against its performance specifications before it is deployed. When SAR probes, system components or software are changed, upgraded or recalibrated, these must be validated with the SAR system(s) that operates with such components. Reference dipoles are used with the required tissue-equivalent media for system validation, The detailed system validation results are maintained by each test laboratory, which are normally not required for equipment approval. Only a tabulated summary of the system validation status, according to the validation date(s), measurement frequencies, SAR probes and tissue dielectric parameters is required in the SAR report.
System Setup The system performance check verifies that the system operates within its specifications. System and operator errors can be detected and corrected. It is recommended that the system performance check be performed prior to any usage of the system in order to guarantee reproducible results. The system performance check uses normal SAR measurements in a simplified setup with a well characterized source. This setup was selected to give a high sensitivity to all parameters that might fail or vary over time. The system check does not intend to replace the calibration of the components, but indicates situations where the system uncertainty is exceeded due to drift or failure. In the simplified setup for system evaluation, the DUT is replaced by a calibrated dipole and the power source is replaced by a continuous wave that comes from a signal generator. The calibrated dipole must be placed beneath the flat phantom section of the SAM twin phantom with the correct distance holder. The distance holder should touch the phantom surface with a light pressure at the reference marking and be oriented parallel to the long side of the phantom. The equipment setup is shown below: 1. Signal Generator 2. Amplifier 3. Directional Coupler 4. Power Meter 5. Calibrated Dipole
Note: The output power on dipole port must be calibrated to 30 dBm (1000 mW) before dipole is connected.
Test Report 15070186-FCC-H Page 21 of 96
System Verification Results Prior to SAR assessment, the system is verified to 10% of the SAR measurement on the reference dipole at the time of calibration by the calibration facility. Full system validation status and result summary can be found in ANNEX A
Target and measurement SAR after Normalized (1W):
Measurement
Date Frequency
(MHz) Liquid Type (head/body)
Target SAR1g (W/kg)
Measured SAR1g (W/kg)
Normalized SAR1g (W/kg)
Deviation (%)
April 13th, 2015 835 head 9.65 0.094 9.4 -2.6 April 13th, 2015 835 body 9.98 0.101 10.1 1.2 April 2th, 2015 1900 head 39.52 0.392 39.2 -0.8 April 2th, 2015 1900 body 42.88 0.437 43.7 1.9 April 14th, 2015 1800 head 38.44 0.381 38.1 -0.9 April 14th, 2015 1800 body 39.59 0.405 40.5 2.3
Note: system check input power: 10mW
Test Report 15070186-FCC-H Page 22 of 96
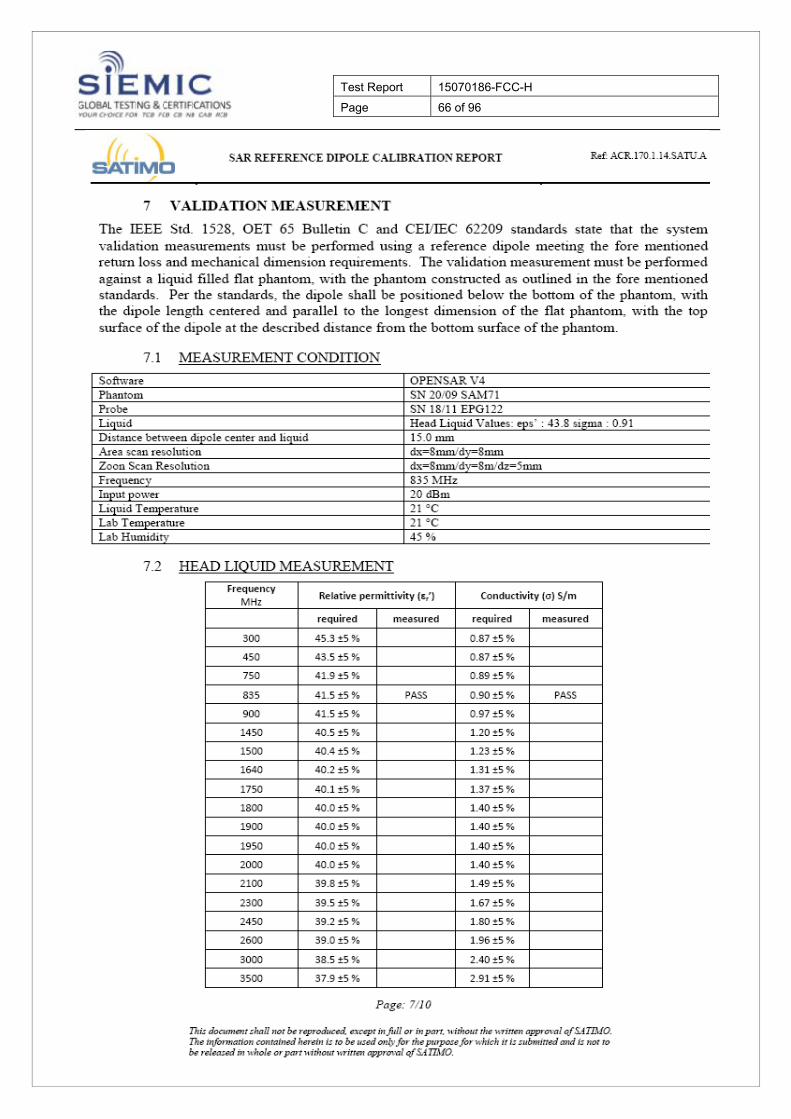
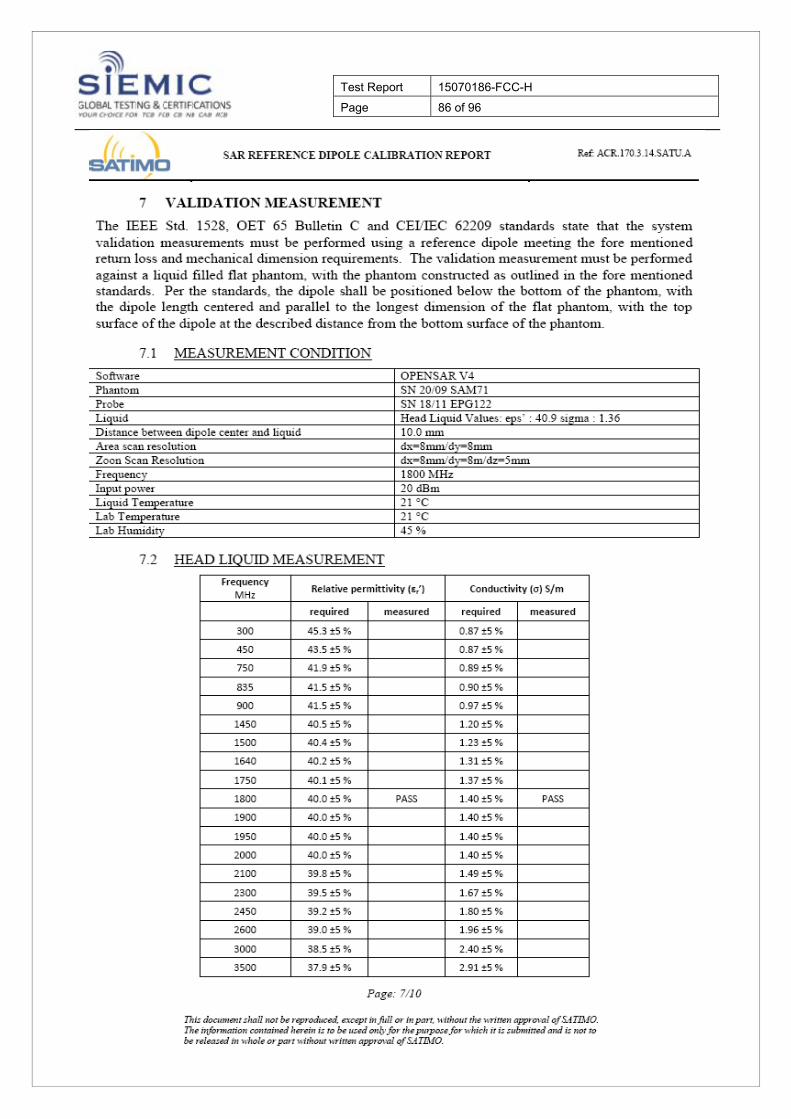
Liquid Verification The dielectric parameters were checked prior to assessment using the HP85070C dielectric probe kit. The dielectric parameters
measured are reported in each correspondent section.
KDB 865664 recommended Tissue Dielectric Parameters The head and body tissue parameters given in this below table should be used to measure the SAR of transmitters operating in 100
MHz to 6 GHz frequency range. The tissue dielectric parameters of the tissue medium at the test frequency should be within the
tolerance required in this document. The dielectric parameters should be linearly interpolated between the closest pair of target
frequencies to determine the applicable dielectric parameters corresponding to the device test frequency.
The head tissue dielectric parameters recommended by IEEE Std 1528-2003 have been incorporated in the following table. These
head parameters are derived from planar layer models simulating the highest expected SAR for the dielectric properties and tissue
thickness variations in a human head. Other head and body tissue parameters that have not been specified in 1528 are derived from
tissue dielectric parameters computed from the 4-Cole-Cole equations described above and extrapolated according to the head
parameters specified in 1528.
Liquid Confirmation Result:
Temperature: 21°C , Relative humidity: 57% , Measured Date: April 13th, 2015
835(MHz) Description Dielectric Parameters
εr σ(s/m)
Head
Target Value ±5% window
41.50 39.43 — 43.58
0.90 0.855 — 0.945
Measurement Value 41.58 0.91
Body
Target Value ±5% window
55.2 52.25 — 57.75
0.97 0.922 — 1.018
Measurement Value 55.47 0.95
Test Report 15070186-FCC-H Page 23 of 96
Temperature: 21°C , Relative humidity: 57% , Measured Date: April 2th, 2015
1900(MHz) Description Dielectric Parameters
εr σ(s/m)
Head
Target Value ±5% window
40.00 38.00 — 42.00
1.40 1.33 — 1.47
Measurement Value 40.12 1.42
Body
Target Value ±5% window
53.30 50.64 — 55.97
1.52 1.44 — 1.60
Measurement Value 53.12 1.51
Temperature: 21°C , Relative humidity: 57% , Measured Date: April 14th, 2015
1800(MHz) Description Dielectric Parameters
εr σ(s/m)
Head
Target Value ±5% window
40.00 38.00 — 42.00
1.40 1.33 — 1.47
Measurement Value 39.89 1.38
Body
Target Value ±5% window
53.30 50.64 — 55.97
1.52 1.44 — 1.60
Measurement Value 53.38 1.50
Test Report 15070186-FCC-H Page 24 of 96
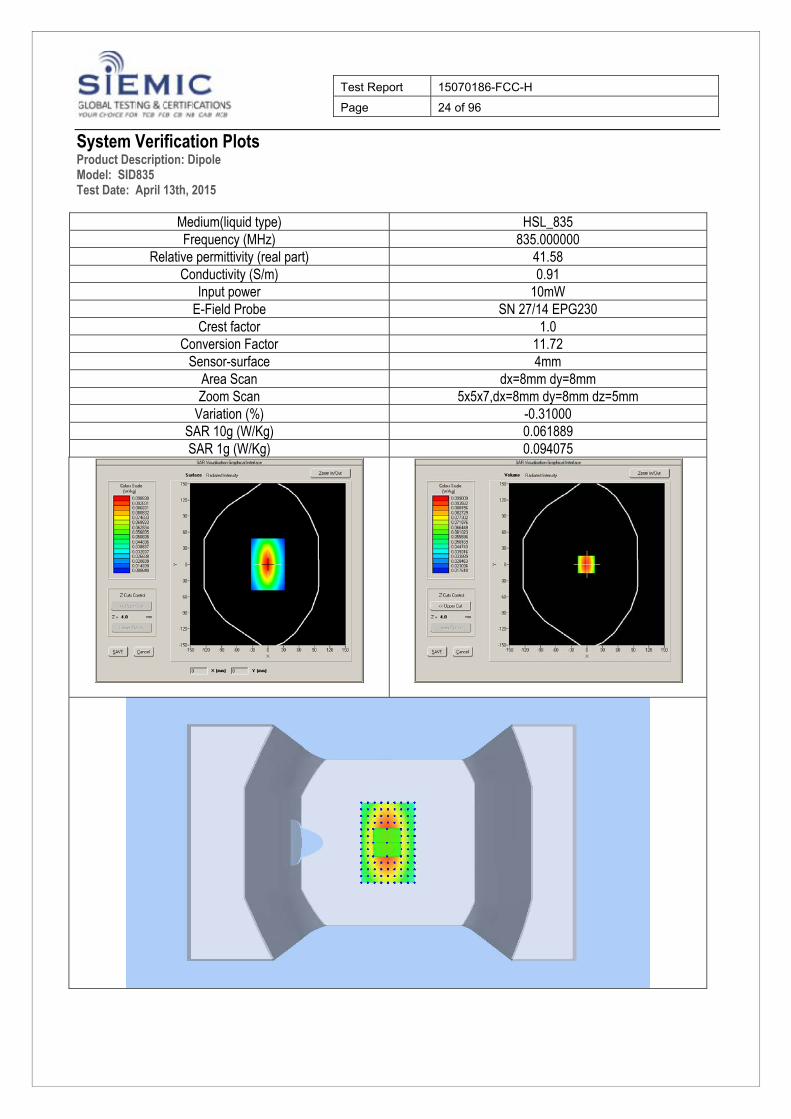
System Verification Plots Product Description: Dipole Model: SID835 Test Date: April 13th, 2015
Medium(liquid type) HSL_835 Frequency (MHz) 835.000000
Relative permittivity (real part) 41.58 Conductivity (S/m) 0.91
Input power 10mW E-Field Probe SN 27/14 EPG230 Crest factor 1.0
Conversion Factor 11.72 Sensor-surface 4mm
Area Scan dx=8mm dy=8mm Zoom Scan 5x5x7,dx=8mm dy=8mm dz=5mm
Variation (%) -0.31000 SAR 10g (W/Kg) 0.061889 SAR 1g (W/Kg) 0.094075
Test Report 15070186-FCC-H Page 25 of 96
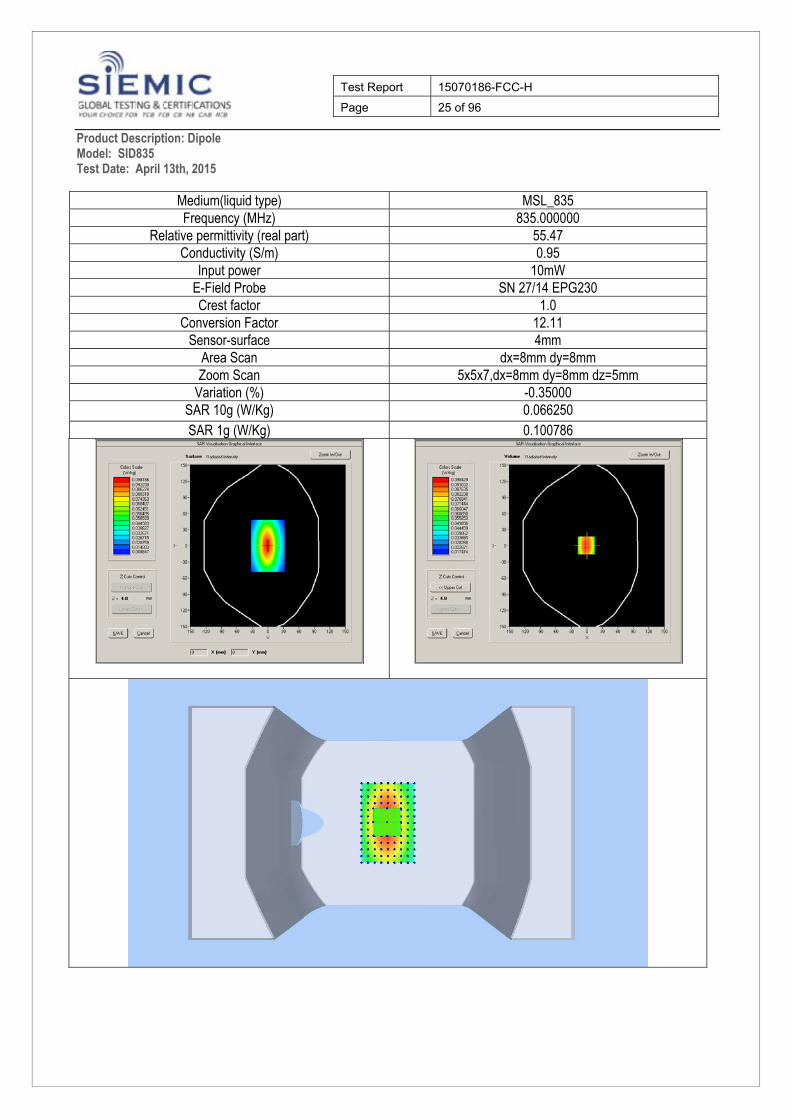
Product Description: Dipole Model: SID835 Test Date: April 13th, 2015
Medium(liquid type) MSL_835 Frequency (MHz) 835.000000
Relative permittivity (real part) 55.47 Conductivity (S/m) 0.95
Input power 10mW E-Field Probe SN 27/14 EPG230 Crest factor 1.0
Conversion Factor 12.11 Sensor-surface 4mm
Area Scan dx=8mm dy=8mm Zoom Scan 5x5x7,dx=8mm dy=8mm dz=5mm
Variation (%) -0.35000 SAR 10g (W/Kg) 0.066250 SAR 1g (W/Kg) 0.100786
Test Report 15070186-FCC-H Page 26 of 96
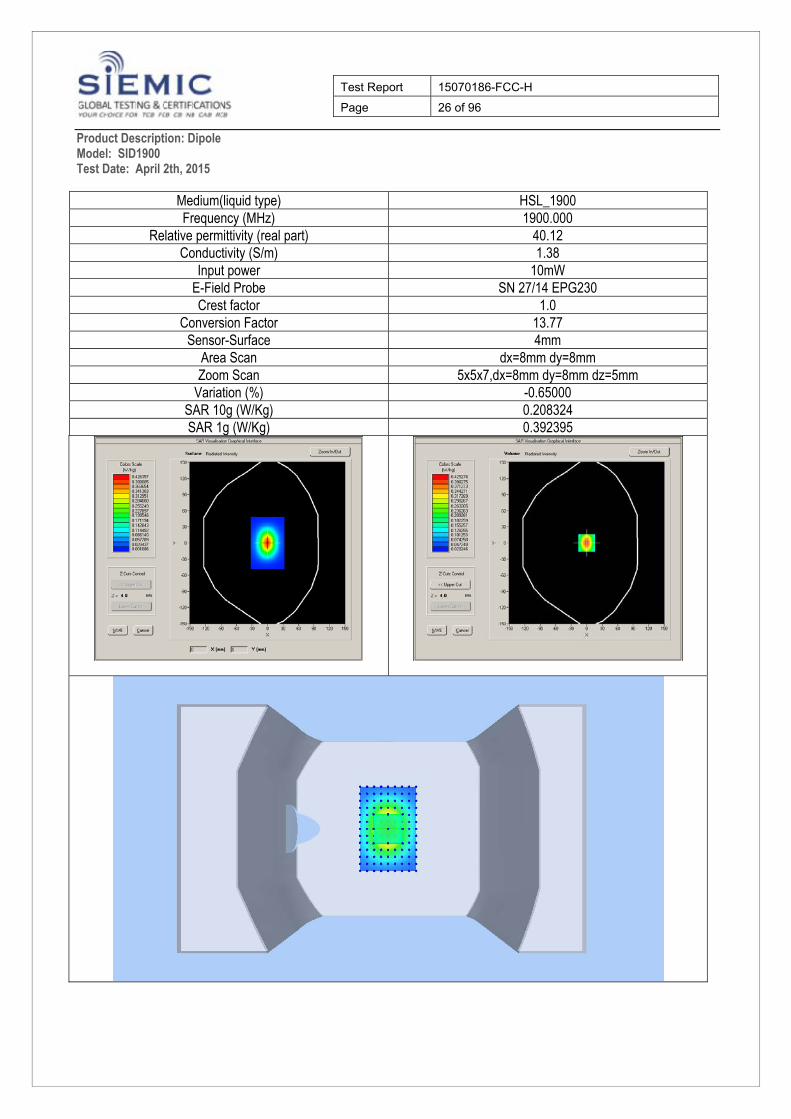
Product Description: Dipole Model: SID1900 Test Date: April 2th, 2015
Medium(liquid type) HSL_1900 Frequency (MHz) 1900.000
Relative permittivity (real part) 40.12 Conductivity (S/m) 1.38
Input power 10mW E-Field Probe SN 27/14 EPG230 Crest factor 1.0
Conversion Factor 13.77 Sensor-Surface 4mm
Area Scan dx=8mm dy=8mm Zoom Scan 5x5x7,dx=8mm dy=8mm dz=5mm
Variation (%) -0.65000 SAR 10g (W/Kg) 0.208324 SAR 1g (W/Kg) 0.392395
Test Report 15070186-FCC-H Page 27 of 96
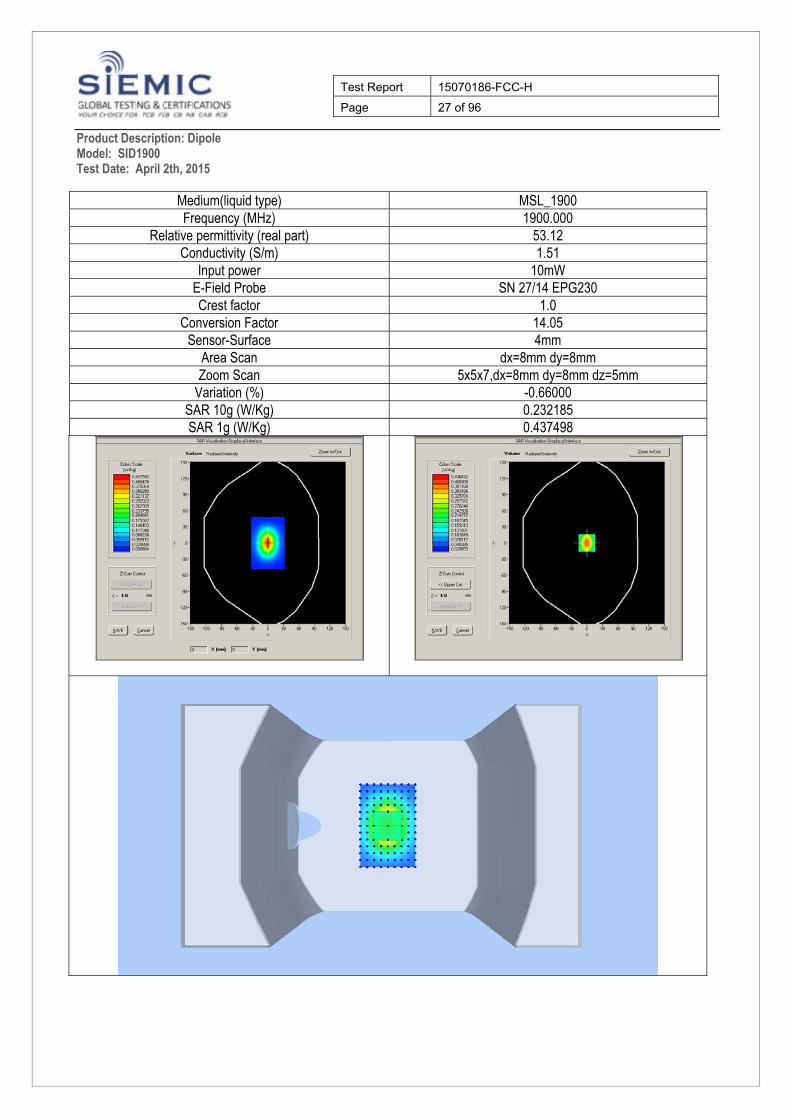
Product Description: Dipole Model: SID1900 Test Date: April 2th, 2015
Medium(liquid type) MSL_1900 Frequency (MHz) 1900.000
Relative permittivity (real part) 53.12 Conductivity (S/m) 1.51
Input power 10mW E-Field Probe SN 27/14 EPG230 Crest factor 1.0
Conversion Factor 14.05 Sensor-Surface 4mm
Area Scan dx=8mm dy=8mm Zoom Scan 5x5x7,dx=8mm dy=8mm dz=5mm
Variation (%) -0.66000 SAR 10g (W/Kg) 0.232185 SAR 1g (W/Kg) 0.437498

Test Report 15070186-FCC-H Page 28 of 96
Product Description: Dipole Model: SID1800 Test Date: April 14th, 2015
Medium(liquid type) HSL_1800 Frequency (MHz) 1800.000
Relative permittivity (real part) 39.89 Conductivity (S/m) 1.38
Input power 10mW E-Field Probe SN 27/14 EPG230 Crest factor 1.0
Conversion Factor 11.90 Sensor-Surface 4mm
Area Scan dx=8mm dy=8mm Zoom Scan 5x5x7,dx=8mm dy=8mm dz=5mm
Variation (%) -0.61000 SAR 10g (W/Kg) 0.206504 SAR 1g (W/Kg) 0.380992

Test Report 15070186-FCC-H Page 29 of 96
Product Description: Dipole Model: SID1800 Test Date: April 14th, 2015
Medium(liquid type) MSL_1800 Frequency (MHz) 1800.000
Relative permittivity (real part) 53.38 Conductivity (S/m) 1.50
Input power 10mW E-Field Probe SN 27/14 EPG230 Crest factor 1.0
Conversion Factor 12.37 Sensor-Surface 4mm
Area Scan dx=8mm dy=8mm Zoom Scan 5x5x7,dx=8mm dy=8mm dz=5mm
Variation (%) -0.51000 SAR 10g (W/Kg) 0.219638 SAR 1g (W/Kg) 0.405192
Test Report 15070186-FCC-H Page 30 of 96
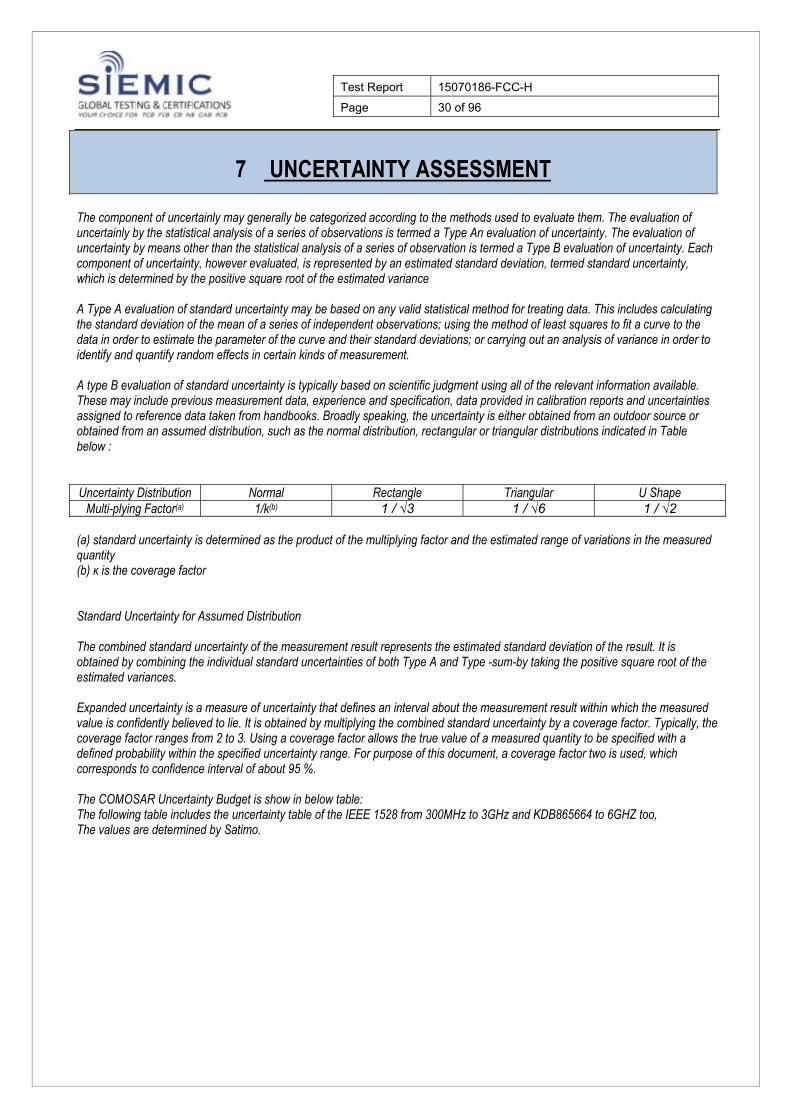
7 UNCERTAINTY ASSESSMENT The component of uncertainly may generally be categorized according to the methods used to evaluate them. The evaluation of uncertainly by the statistical analysis of a series of observations is termed a Type An evaluation of uncertainty. The evaluation of uncertainty by means other than the statistical analysis of a series of observation is termed a Type B evaluation of uncertainty. Each component of uncertainty, however evaluated, is represented by an estimated standard deviation, termed standard uncertainty, which is determined by the positive square root of the estimated variance
A Type A evaluation of standard uncertainty may be based on any valid statistical method for treating data. This includes calculating the standard deviation of the mean of a series of independent observations; using the method of least squares to fit a curve to the data in order to estimate the parameter of the curve and their standard deviations; or carrying out an analysis of variance in order to identify and quantify random effects in certain kinds of measurement. A type B evaluation of standard uncertainty is typically based on scientific judgment using all of the relevant information available. These may include previous measurement data, experience and specification, data provided in calibration reports and uncertainties assigned to reference data taken from handbooks. Broadly speaking, the uncertainty is either obtained from an outdoor source or obtained from an assumed distribution, such as the normal distribution, rectangular or triangular distributions indicated in Table below : Uncertainty Distribution Normal Rectangle Triangular U Shape
Multi-plying Factor(a) 1/k(b) 1 / √3 1 / √6 1 / √2
(a) standard uncertainty is determined as the product of the multiplying factor and the estimated range of variations in the measured quantity (b) κ is the coverage factor Standard Uncertainty for Assumed Distribution The combined standard uncertainty of the measurement result represents the estimated standard deviation of the result. It is obtained by combining the individual standard uncertainties of both Type A and Type -sum-by taking the positive square root of the estimated variances. Expanded uncertainty is a measure of uncertainty that defines an interval about the measurement result within which the measured value is confidently believed to lie. It is obtained by multiplying the combined standard uncertainty by a coverage factor. Typically, the coverage factor ranges from 2 to 3. Using a coverage factor allows the true value of a measured quantity to be specified with a defined probability within the specified uncertainty range. For purpose of this document, a coverage factor two is used, which corresponds to confidence interval of about 95 %. The COMOSAR Uncertainty Budget is show in below table: The following table includes the uncertainty table of the IEEE 1528 from 300MHz to 3GHz and KDB865664 to 6GHZ too, The values are determined by Satimo.
Test Report 15070186-FCC-H Page 31 of 96
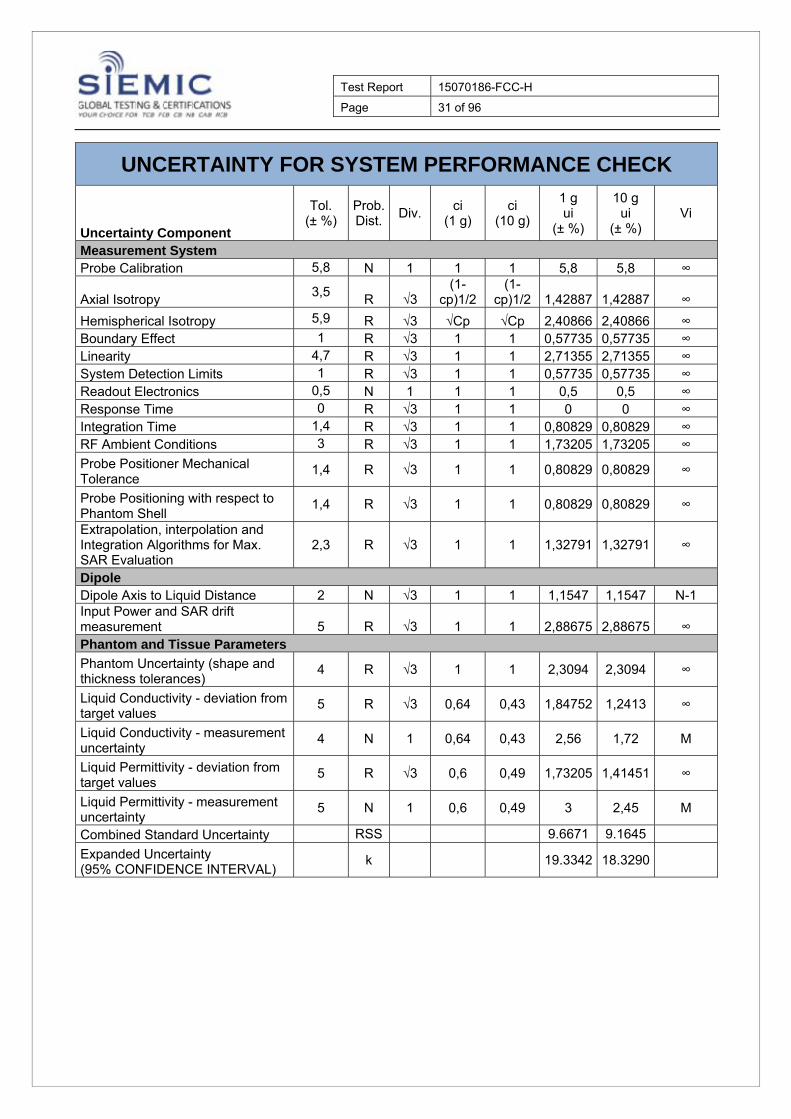
UNCERTAINTY FOR SYSTEM PERFORMANCE CHECK
Uncertainty Component
Tol. (± %)
Prob. Dist.
Div.ci
(1 g) ci
(10 g)
1 g ui
(± %)
10 g ui
(± %) Vi
Measurement System Probe Calibration 5,8 N 1 1 1 5,8 5,8 ∞
Axial Isotropy 3,5
R √3 (1-
cp)1/2(1-
cp)1/2 1,42887 1,42887 ∞
Hemispherical Isotropy 5,9 R √3 √Cp √Cp 2,40866 2,40866 ∞ Boundary Effect 1 R √3 1 1 0,57735 0,57735 ∞ Linearity 4,7 R √3 1 1 2,71355 2,71355 ∞ System Detection Limits 1 R √3 1 1 0,57735 0,57735 ∞ Readout Electronics 0,5 N 1 1 1 0,5 0,5 ∞ Response Time 0 R √3 1 1 0 0 ∞ Integration Time 1,4 R √3 1 1 0,80829 0,80829 ∞ RF Ambient Conditions 3 R √3 1 1 1,73205 1,73205 ∞
Probe Positioner Mechanical Tolerance
1,4 R √3 1 1 0,80829 0,80829 ∞
Probe Positioning with respect to Phantom Shell
1,4 R √3 1 1 0,80829 0,80829 ∞
Extrapolation, interpolation and Integration Algorithms for Max. SAR Evaluation
2,3 R √3 1 1 1,32791 1,32791 ∞
Dipole Dipole Axis to Liquid Distance 2 N √3 1 1 1,1547 1,1547 N-1 Input Power and SAR drift measurement 5 R √3 1 1 2,88675 2,88675 ∞ Phantom and Tissue Parameters
Phantom Uncertainty (shape and thickness tolerances)
4 R √3 1 1 2,3094 2,3094 ∞
Liquid Conductivity - deviation from target values
5 R √3 0,64 0,43 1,84752 1,2413 ∞
Liquid Conductivity - measurement uncertainty
4 N 1 0,64 0,43 2,56 1,72 M
Liquid Permittivity - deviation from target values
5 R √3 0,6 0,49 1,73205 1,41451 ∞
Liquid Permittivity - measurement uncertainty
5 N 1 0,6 0,49 3 2,45 M
Combined Standard Uncertainty RSS 9.6671 9.1645
Expanded Uncertainty (95% CONFIDENCE INTERVAL)
k 19.3342 18.3290
Test Report 15070186-FCC-H Page 32 of 96
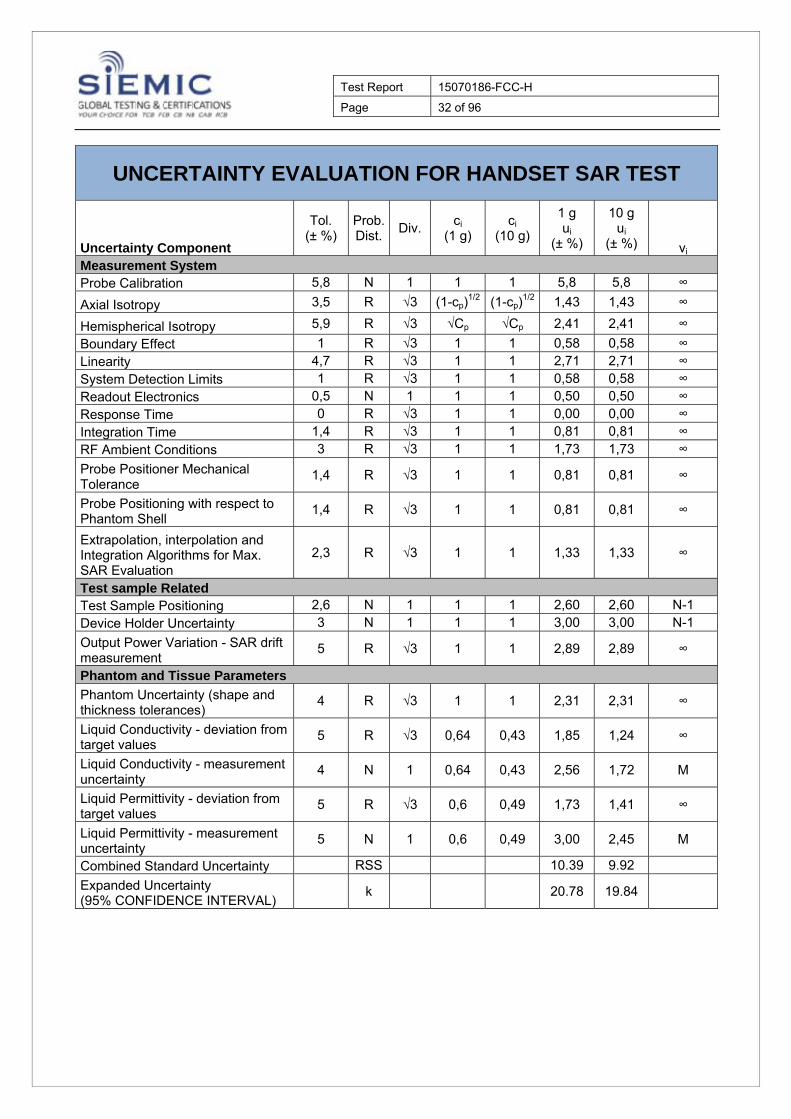
UNCERTAINTY EVALUATION FOR HANDSET SAR TEST
Uncertainty Component
Tol. (± %)
Prob. Dist.
Div.ci
(1 g) ci
(10 g)
1 g ui
(± %)
10 g ui
(± %) vi Measurement System Probe Calibration 5,8 N 1 1 1 5,8 5,8 ∞
Axial Isotropy 3,5 R √3 (1-cp)1/2 (1-cp)
1/2 1,43 1,43 ∞
Hemispherical Isotropy 5,9 R √3 √Cp √Cp 2,41 2,41 ∞
Boundary Effect 1 R √3 1 1 0,58 0,58 ∞ Linearity 4,7 R √3 1 1 2,71 2,71 ∞ System Detection Limits 1 R √3 1 1 0,58 0,58 ∞ Readout Electronics 0,5 N 1 1 1 0,50 0,50 ∞ Response Time 0 R √3 1 1 0,00 0,00 ∞ Integration Time 1,4 R √3 1 1 0,81 0,81 ∞ RF Ambient Conditions 3 R √3 1 1 1,73 1,73 ∞
Probe Positioner Mechanical Tolerance
1,4 R √3 1 1 0,81 0,81 ∞
Probe Positioning with respect to Phantom Shell
1,4 R √3 1 1 0,81 0,81 ∞
Extrapolation, interpolation and Integration Algorithms for Max. SAR Evaluation
2,3 R √3 1 1 1,33 1,33 ∞
Test sample Related Test Sample Positioning 2,6 N 1 1 1 2,60 2,60 N-1 Device Holder Uncertainty 3 N 1 1 1 3,00 3,00 N-1
Output Power Variation - SAR drift measurement
5 R √3 1 1 2,89 2,89 ∞
Phantom and Tissue Parameters
Phantom Uncertainty (shape and thickness tolerances)
4 R √3 1 1 2,31 2,31 ∞
Liquid Conductivity - deviation from target values
5 R √3 0,64 0,43 1,85 1,24 ∞
Liquid Conductivity - measurement uncertainty
4 N 1 0,64 0,43 2,56 1,72 M
Liquid Permittivity - deviation from target values
5 R √3 0,6 0,49 1,73 1,41 ∞
Liquid Permittivity - measurement uncertainty
5 N 1 0,6 0,49 3,00 2,45 M
Combined Standard Uncertainty RSS 10.39 9.92
Expanded Uncertainty (95% CONFIDENCE INTERVAL)
k 20.78 19.84
Test Report 15070186-FCC-H Page 33 of 96
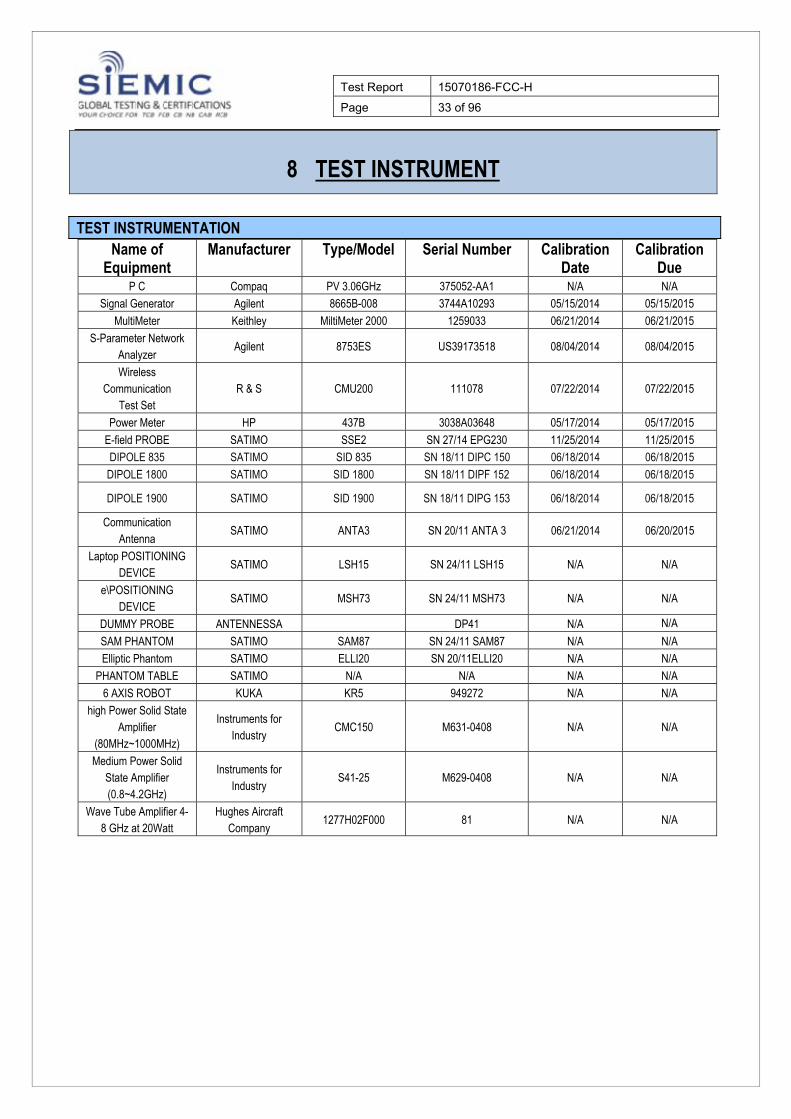
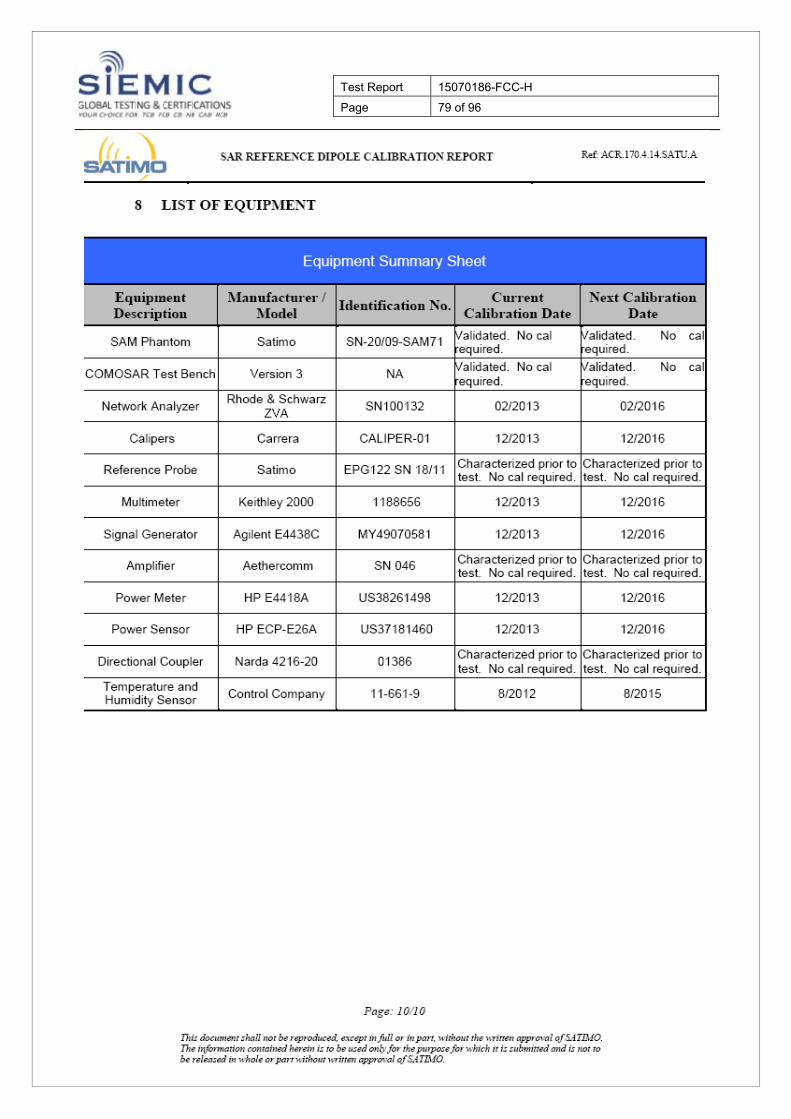
8 TEST INSTRUMENT
TEST INSTRUMENTATION Name of
Equipment Manufacturer Type/Model Serial Number Calibration
Date Calibration
Due P C Compaq PV 3.06GHz 375052-AA1 N/A N/A
Signal Generator Agilent 8665B-008 3744A10293 05/15/2014 05/15/2015
MultiMeter Keithley MiltiMeter 2000 1259033 06/21/2014 06/21/2015
S-Parameter Network Analyzer
Agilent 8753ES US39173518 08/04/2014 08/04/2015
Wireless Communication
Test Set R & S CMU200 111078 07/22/2014 07/22/2015
Power Meter HP 437B 3038A03648 05/17/2014 05/17/2015
E-field PROBE SATIMO SSE2 SN 27/14 EPG230 11/25/2014 11/25/2015
DIPOLE 835 SATIMO SID 835 SN 18/11 DIPC 150 06/18/2014 06/18/2015
DIPOLE 1800 SATIMO SID 1800 SN 18/11 DIPF 152 06/18/2014 06/18/2015
DIPOLE 1900 SATIMO SID 1900 SN 18/11 DIPG 153 06/18/2014 06/18/2015
Communication Antenna
SATIMO ANTA3 SN 20/11 ANTA 3 06/21/2014 06/20/2015
Laptop POSITIONING DEVICE
SATIMO LSH15 SN 24/11 LSH15 N/A N/A
e\POSITIONING DEVICE
SATIMO MSH73 SN 24/11 MSH73 N/A N/A
DUMMY PROBE ANTENNESSA DP41 N/A N/A
SAM PHANTOM SATIMO SAM87 SN 24/11 SAM87 N/A N/A
Elliptic Phantom SATIMO ELLI20 SN 20/11ELLI20 N/A N/A
PHANTOM TABLE SATIMO N/A N/A N/A N/A
6 AXIS ROBOT KUKA KR5 949272 N/A N/A
high Power Solid State Amplifier
(80MHz~1000MHz)
Instruments for Industry
CMC150 M631-0408 N/A N/A
Medium Power Solid State Amplifier (0.8~4.2GHz)
Instruments for Industry
S41-25 M629-0408 N/A N/A
Wave Tube Amplifier 4-8 GHz at 20Watt
Hughes Aircraft Company
1277H02F000 81 N/A N/A
Test Report 15070186-FCC-H Page 34 of 96
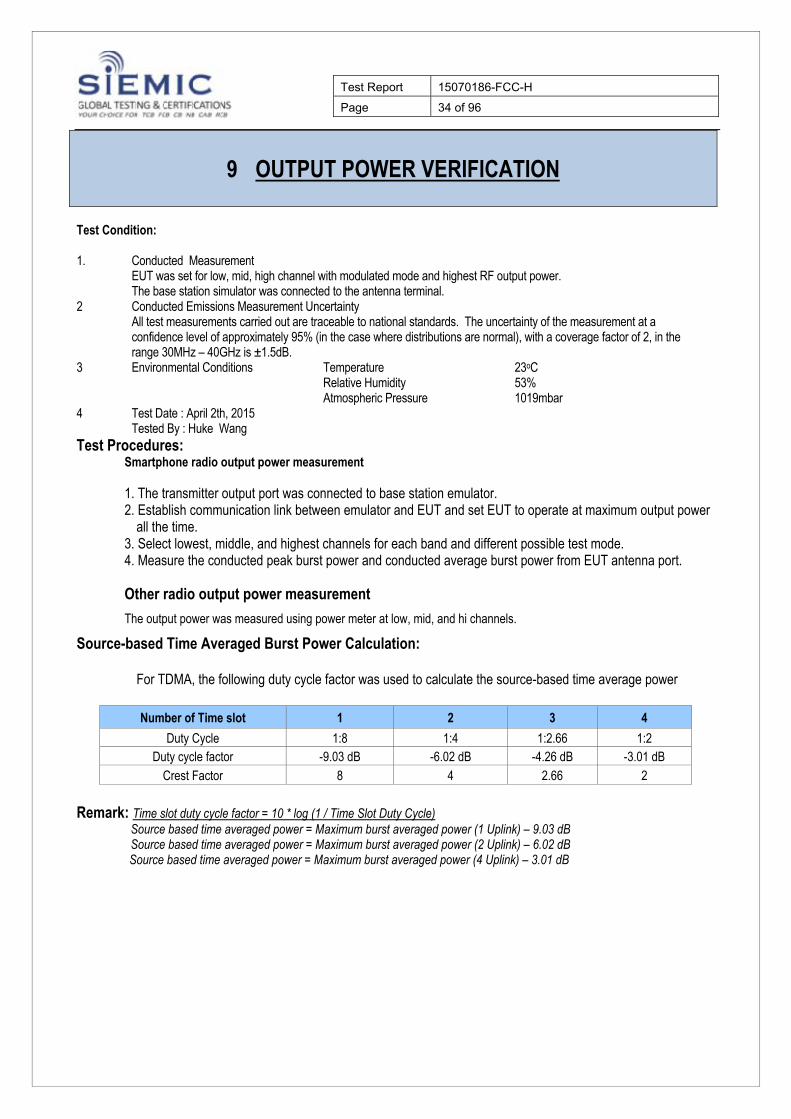
9 OUTPUT POWER VERIFICATION
Test Condition: 1. Conducted Measurement
EUT was set for low, mid, high channel with modulated mode and highest RF output power. The base station simulator was connected to the antenna terminal.
2 Conducted Emissions Measurement Uncertainty All test measurements carried out are traceable to national standards. The uncertainty of the measurement at a confidence level of approximately 95% (in the case where distributions are normal), with a coverage factor of 2, in the range 30MHz – 40GHz is ±1.5dB.
3 Environmental Conditions Temperature 23oC Relative Humidity 53% Atmospheric Pressure 1019mbar 4 Test Date : April 2th, 2015
Tested By : Huke Wang Test Procedures:
Smartphone radio output power measurement
1. The transmitter output port was connected to base station emulator. 2. Establish communication link between emulator and EUT and set EUT to operate at maximum output power
all the time. 3. Select lowest, middle, and highest channels for each band and different possible test mode. 4. Measure the conducted peak burst power and conducted average burst power from EUT antenna port.
Other radio output power measurement
The output power was measured using power meter at low, mid, and hi channels.
Source-based Time Averaged Burst Power Calculation:
For TDMA, the following duty cycle factor was used to calculate the source-based time average power Number of Time slot 1 2 3 4
Duty Cycle 1:8 1:4 1:2.66 1:2 Duty cycle factor -9.03 dB -6.02 dB -4.26 dB -3.01 dB
Crest Factor 8 4 2.66 2
Remark: Time slot duty cycle factor = 10 * log (1 / Time Slot Duty Cycle)
Source based time averaged power = Maximum burst averaged power (1 Uplink) – 9.03 dB Source based time averaged power = Maximum burst averaged power (2 Uplink) – 6.02 dB Source based time averaged power = Maximum burst averaged power (4 Uplink) – 3.01 dB
Test Report 15070186-FCC-H Page 35 of 96
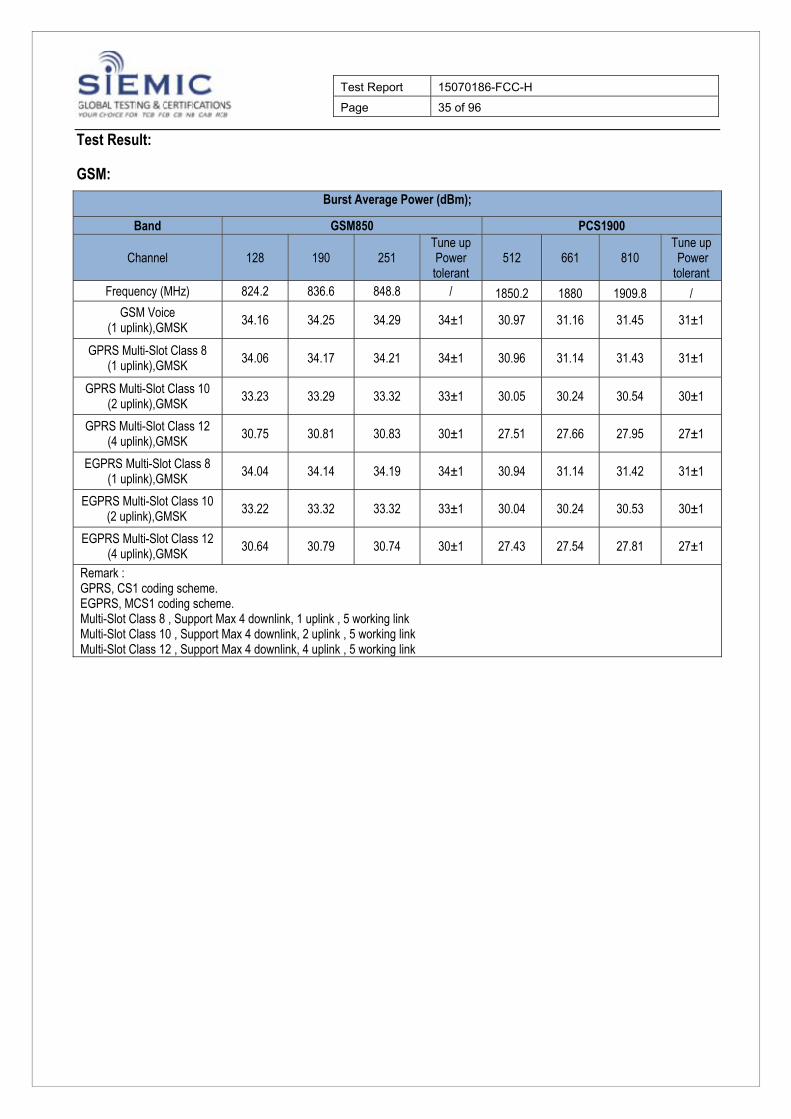
Test Result:
GSM:
Burst Average Power (dBm);
Band GSM850 PCS1900
Channel 128 190 251 Tune up Power tolerant
512 661 810 Tune up Power tolerant
Frequency (MHz) 824.2 836.6 848.8 / 1850.2 1880 1909.8 / GSM Voice
(1 uplink),GMSK 34.16 34.25 34.29 34±1 30.97 31.16 31.45 31±1
GPRS Multi-Slot Class 8 (1 uplink),GMSK 34.06 34.17 34.21 34±1 30.96 31.14 31.43 31±1
GPRS Multi-Slot Class 10 (2 uplink),GMSK 33.23 33.29 33.32 33±1 30.05 30.24 30.54 30±1
GPRS Multi-Slot Class 12 (4 uplink),GMSK 30.75 30.81 30.83 30±1 27.51 27.66 27.95 27±1
EGPRS Multi-Slot Class 8 (1 uplink),GMSK 34.04 34.14 34.19 34±1 30.94 31.14 31.42 31±1
EGPRS Multi-Slot Class 10 (2 uplink),GMSK 33.22 33.32 33.32 33±1 30.04 30.24 30.53 30±1
EGPRS Multi-Slot Class 12 (4 uplink),GMSK 30.64 30.79 30.74 30±1 27.43 27.54 27.81 27±1
Remark : GPRS, CS1 coding scheme. EGPRS, MCS1 coding scheme. Multi-Slot Class 8 , Support Max 4 downlink, 1 uplink , 5 working link Multi-Slot Class 10 , Support Max 4 downlink, 2 uplink , 5 working link Multi-Slot Class 12 , Support Max 4 downlink, 4 uplink , 5 working link
Test Report 15070186-FCC-H Page 36 of 96
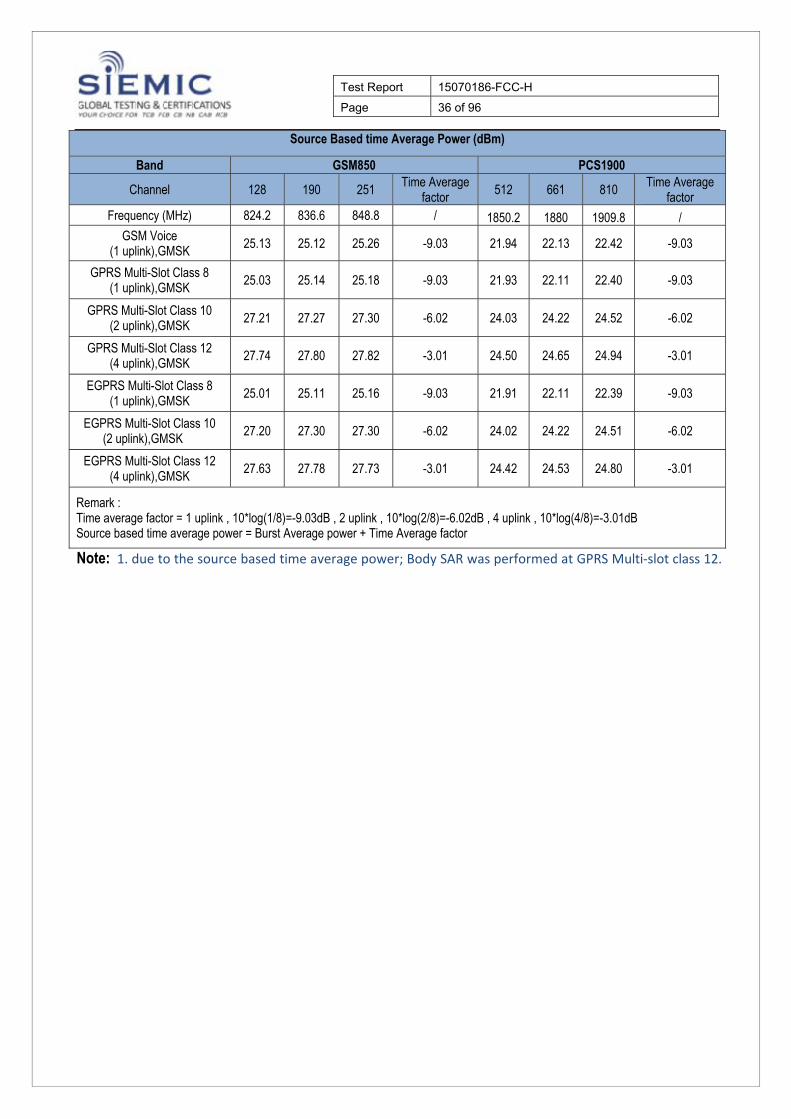
Source Based time Average Power (dBm)
Band GSM850 PCS1900
Channel 128 190 251 Time Average
factor 512 661 810
Time Average factor
Frequency (MHz) 824.2 836.6 848.8 / 1850.2 1880 1909.8 / GSM Voice
(1 uplink),GMSK 25.13 25.12 25.26 -9.03 21.94 22.13 22.42 -9.03
GPRS Multi-Slot Class 8 (1 uplink),GMSK 25.03 25.14 25.18 -9.03 21.93 22.11 22.40 -9.03
GPRS Multi-Slot Class 10 (2 uplink),GMSK 27.21 27.27 27.30 -6.02 24.03 24.22 24.52 -6.02
GPRS Multi-Slot Class 12 (4 uplink),GMSK
27.74 27.80 27.82 -3.01 24.50 24.65 24.94 -3.01
EGPRS Multi-Slot Class 8 (1 uplink),GMSK
25.01 25.11 25.16 -9.03 21.91 22.11 22.39 -9.03
EGPRS Multi-Slot Class 10 (2 uplink),GMSK 27.20 27.30 27.30 -6.02 24.02 24.22 24.51 -6.02
EGPRS Multi-Slot Class 12 (4 uplink),GMSK
27.63 27.78 27.73 -3.01 24.42 24.53 24.80 -3.01
Remark : Time average factor = 1 uplink , 10*log(1/8)=-9.03dB , 2 uplink , 10*log(2/8)=-6.02dB , 4 uplink , 10*log(4/8)=-3.01dB Source based time average power = Burst Average power + Time Average factor
Note: 1. due to the source based time average power; Body SAR was performed at GPRS Multi‐slot class 12.
Test Report 15070186-FCC-H Page 37 of 96
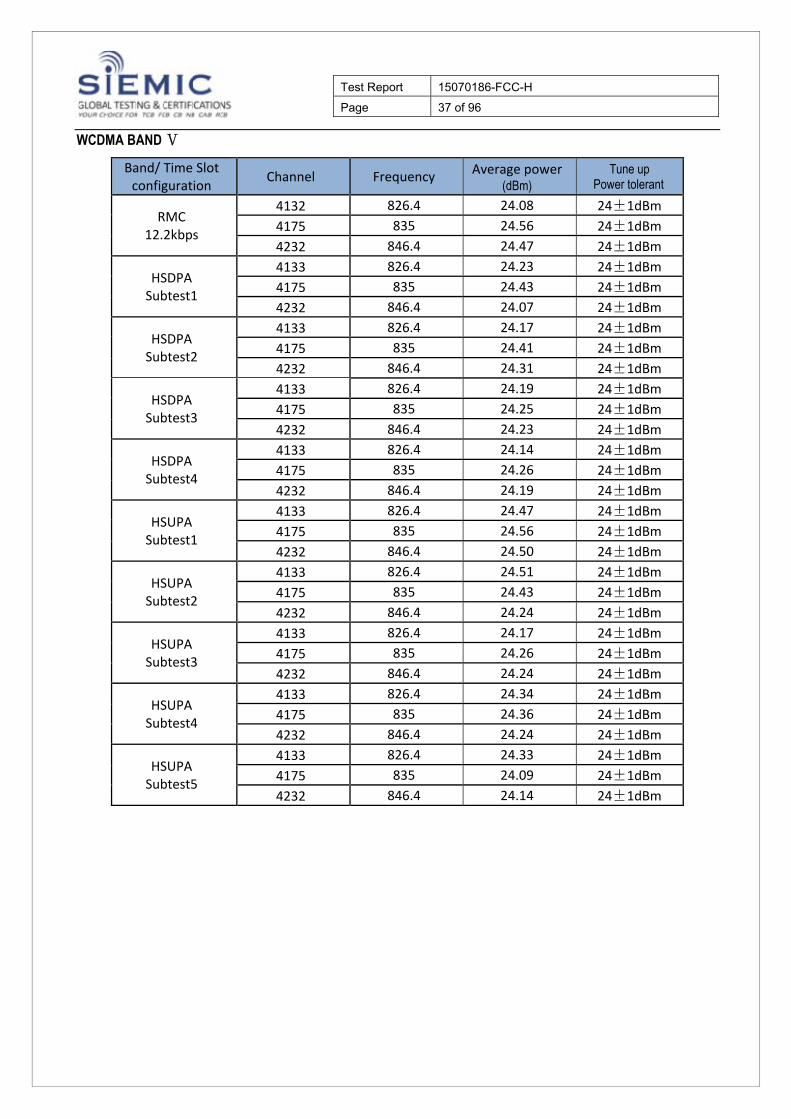
WCDMA BAND Ⅴ
Band/ Time Slot configuration
Channel Frequency Average power
(dBm) Tune up
Power tolerant
RMC 12.2kbps
4132 826.4 24.08 24±1dBm
4175 835 24.56 24±1dBm
4232 846.4 24.47 24±1dBm
HSDPA Subtest1
4133 826.4 24.23 24±1dBm
4175 835 24.43 24±1dBm
4232 846.4 24.07 24±1dBm
HSDPA Subtest2
4133 826.4 24.17 24±1dBm
4175 835 24.41 24±1dBm
4232 846.4 24.31 24±1dBm
HSDPA Subtest3
4133 826.4 24.19 24±1dBm
4175 835 24.25 24±1dBm
4232 846.4 24.23 24±1dBm
HSDPA Subtest4
4133 826.4 24.14 24±1dBm
4175 835 24.26 24±1dBm
4232 846.4 24.19 24±1dBm
HSUPA Subtest1
4133 826.4 24.47 24±1dBm
4175 835 24.56 24±1dBm
4232 846.4 24.50 24±1dBm
HSUPA Subtest2
4133 826.4 24.51 24±1dBm
4175 835 24.43 24±1dBm
4232 846.4 24.24 24±1dBm
HSUPA Subtest3
4133 826.4 24.17 24±1dBm
4175 835 24.26 24±1dBm
4232 846.4 24.24 24±1dBm
HSUPA Subtest4
4133 826.4 24.34 24±1dBm
4175 835 24.36 24±1dBm
4232 846.4 24.24 24±1dBm
HSUPA Subtest5
4133 826.4 24.33 24±1dBm
4175 835 24.09 24±1dBm
4232 846.4 24.14 24±1dBm
Test Report 15070186-FCC-H Page 38 of 96
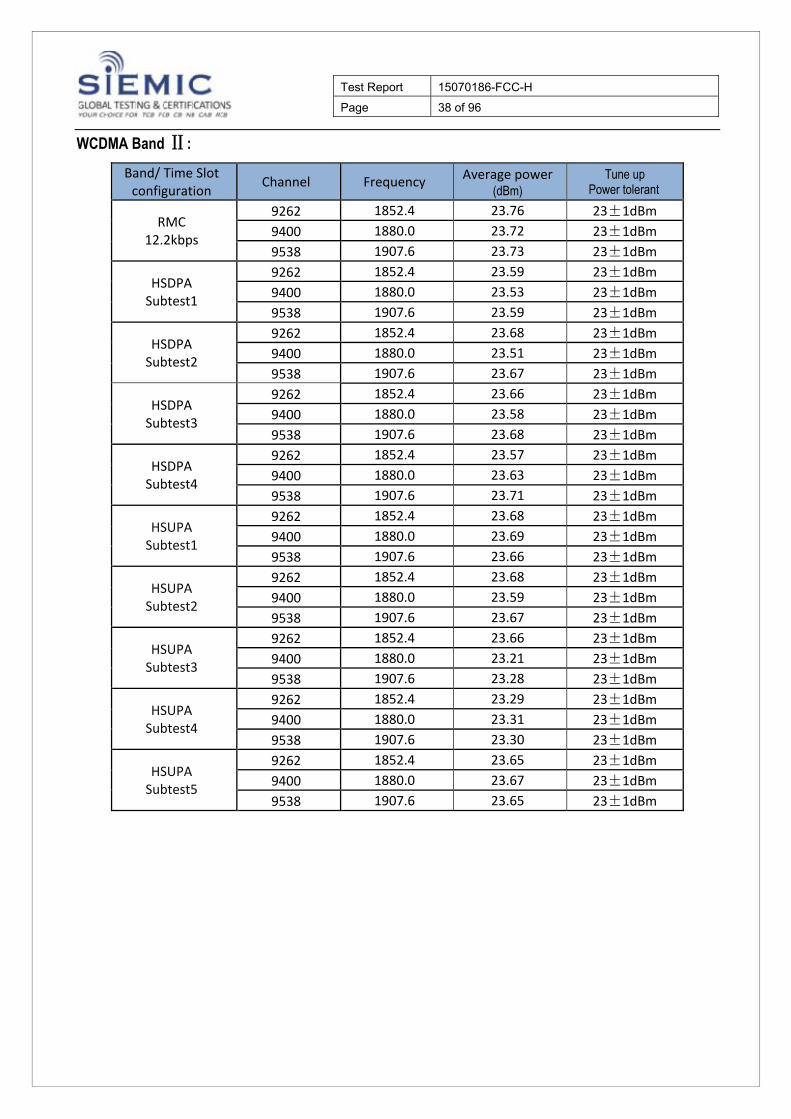
WCDMA Band Ⅱ:
Band/ Time Slot configuration
Channel Frequency Average power
(dBm) Tune up
Power tolerant
RMC 12.2kbps
9262 1852.4 23.76 23±1dBm
9400 1880.0 23.72 23±1dBm
9538 1907.6 23.73 23±1dBm
HSDPA Subtest1
9262 1852.4 23.59 23±1dBm
9400 1880.0 23.53 23±1dBm
9538 1907.6 23.59 23±1dBm
HSDPA Subtest2
9262 1852.4 23.68 23±1dBm
9400 1880.0 23.51 23±1dBm
9538 1907.6 23.67 23±1dBm
HSDPA Subtest3
9262 1852.4 23.66 23±1dBm
9400 1880.0 23.58 23±1dBm
9538 1907.6 23.68 23±1dBm
HSDPA Subtest4
9262 1852.4 23.57 23±1dBm
9400 1880.0 23.63 23±1dBm
9538 1907.6 23.71 23±1dBm
HSUPA Subtest1
9262 1852.4 23.68 23±1dBm
9400 1880.0 23.69 23±1dBm
9538 1907.6 23.66 23±1dBm
HSUPA Subtest2
9262 1852.4 23.68 23±1dBm
9400 1880.0 23.59 23±1dBm
9538 1907.6 23.67 23±1dBm
HSUPA Subtest3
9262 1852.4 23.66 23±1dBm
9400 1880.0 23.21 23±1dBm
9538 1907.6 23.28 23±1dBm
HSUPA Subtest4
9262 1852.4 23.29 23±1dBm
9400 1880.0 23.31 23±1dBm
9538 1907.6 23.30 23±1dBm
HSUPA Subtest5
9262 1852.4 23.65 23±1dBm
9400 1880.0 23.67 23±1dBm
9538 1907.6 23.65 23±1dBm

Test Report 15070186-FCC-H Page 39 of 96
WCDMA BandⅣ:
Band/ Time Slot configuration
Channel Frequency Average power
(dBm) Tune up
Power tolerant
RMC 12.2kbps
1313 1712.4 23.46 23±1dBm
1413 1732 23.36 23±1dBm
1512 1752.6 23.27 23±1dBm
HSDPA Subtest1
1313 1712.4 23.45 23±1dBm
1413 1732 23.37 23±1dBm
1512 1752.6 23.41 23±1dBm
HSDPA Subtest2
1313 1712.4 23.38 23±1dBm
1413 1732 23.27 23±1dBm
1512 1752.6 23.32 23±1dBm
HSDPA Subtest3
1313 1712.4 23.31 23±1dBm
1413 1732 23.26 23±1dBm
1512 1752.6 23.32 23±1dBm
HSDPA Subtest4
1313 1712.4 23.29 23±1dBm
1413 1732 23.35 23±1dBm
1512 1752.6 23.28 23±1dBm
HSUPA Subtest1
1313 1712.4 23.42 23±1dBm
1413 1732 23.34 23±1dBm
1512 1752.6 23.29 23±1dBm
HSUPA Subtest2
1313 1712.4 23.45 23±1dBm
1413 1732 23.34 23±1dBm
1512 1752.6 23.38 23±1dBm
HSUPA Subtest3
1313 1712.4 23.44 23±1dBm
1413 1732 23.32 23±1dBm
1512 1752.6 23.27 23±1dBm
HSUPA Subtest4
1313 1712.4 23.43 23±1dBm
1413 1732 23.31 23±1dBm
1512 1752.6 23.26 23±1dBm
HSUPA Subtest5
1313 1712.4 23.32 23±1dBm
1413 1732 23.38 23±1dBm
1512 1752.6 23.43 23±1dBm
Test Report 15070186-FCC-H Page 40 of 96
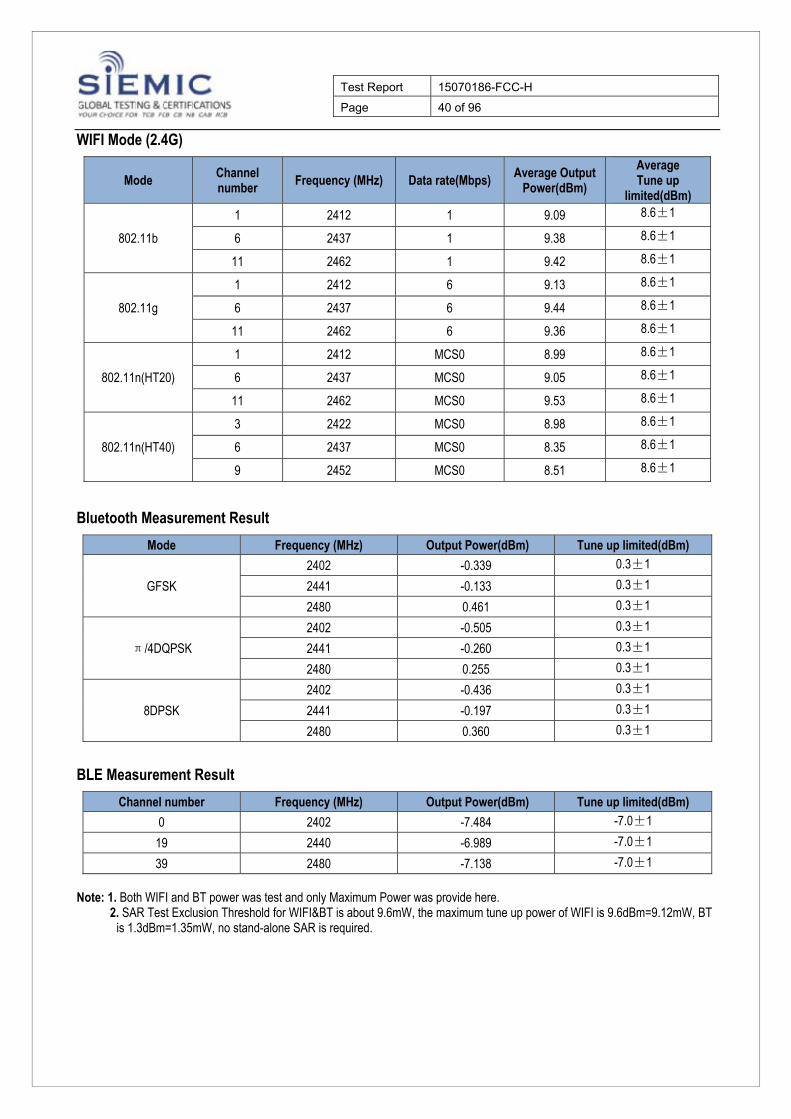
WIFI Mode (2.4G)
Mode Channel number
Frequency (MHz) Data rate(Mbps) Average Output Power(dBm)
Average Tune up
limited(dBm)
802.11b
1 2412 1 9.09 8.6±1
6 2437 1 9.38 8.6±1
11 2462 1 9.42 8.6±1
802.11g
1 2412 6 9.13 8.6±1
6 2437 6 9.44 8.6±1
11 2462 6 9.36 8.6±1
802.11n(HT20)
1 2412 MCS0 8.99 8.6±1
6 2437 MCS0 9.05 8.6±1
11 2462 MCS0 9.53 8.6±1
802.11n(HT40)
3 2422 MCS0 8.98 8.6±1
6 2437 MCS0 8.35 8.6±1
9 2452 MCS0 8.51 8.6±1
Bluetooth Measurement Result
Mode Frequency (MHz) Output Power(dBm) Tune up limited(dBm)
GFSK
2402 -0.339 0.3±1
2441 -0.133 0.3±1
2480 0.461 0.3±1
π/4DQPSK
2402 -0.505 0.3±1
2441 -0.260 0.3±1
2480 0.255 0.3±1
8DPSK
2402 -0.436 0.3±1
2441 -0.197 0.3±1
2480 0.360 0.3±1
BLE Measurement Result
Channel number Frequency (MHz) Output Power(dBm) Tune up limited(dBm)
0 2402 -7.484 -7.0±1
19 2440 -6.989 -7.0±1
39 2480 -7.138 -7.0±1
Note: 1. Both WIFI and BT power was test and only Maximum Power was provide here.
2. SAR Test Exclusion Threshold for WIFI&BT is about 9.6mW, the maximum tune up power of WIFI is 9.6dBm=9.12mW, BT is 1.3dBm=1.35mW, no stand-alone SAR is required.

Test Report 15070186-FCC-H Page 41 of 96
10 Exposure Conditions Consideration EUT antenna location:
Test position consideration:
Distance of EUT antenna-to-edge/surface(mm), Test distance:10mm
Antennas Back side Front side Left Edge Right Edge Top Edge Bottom Edge
WWAN 2 2 10 2 103 2 WLAN 2 2 42 4 2 105
Bluetooth 2 2 42 4 2 105
Test distance:10mm
Antennas Back side Front side Left Edge Right Edge Top Edge Bottom Edge
WWAN YES YES YES YES NO YES WLAN NO NO NO NO NO NO
Bluetooth NO NO NO NO NO NO
Note: 1. Head/Body-worn/Hotspot mode SAR assessments are required. 2. Referring to KDB 941225 D06v02, when the overall device length and width are ≥ 9cm * 5cm, the test distance is 10mm. SAR must be measured for all sides and surfaces with a transmitting antenna located within 25mm from that surface or edge. 3. Per KDB 447498 D01v05r02, for handsets the test separation distance is determined by the smallest distance between the outer surface of the device and the user, which is 0 mm for head SAR, 10 mm for hotspot SAR, and 10 mm for body-worn SAR. 4. WLAN/BT SAR is not required due to the low power.
5.2cm
Top Edge
Bottom Edge
Left
Front side of Device
WWAN Antenna
WiFi/BT Antenna
9.8cm
11.8cm
Right
Test Report 15070186-FCC-H Page 42 of 96
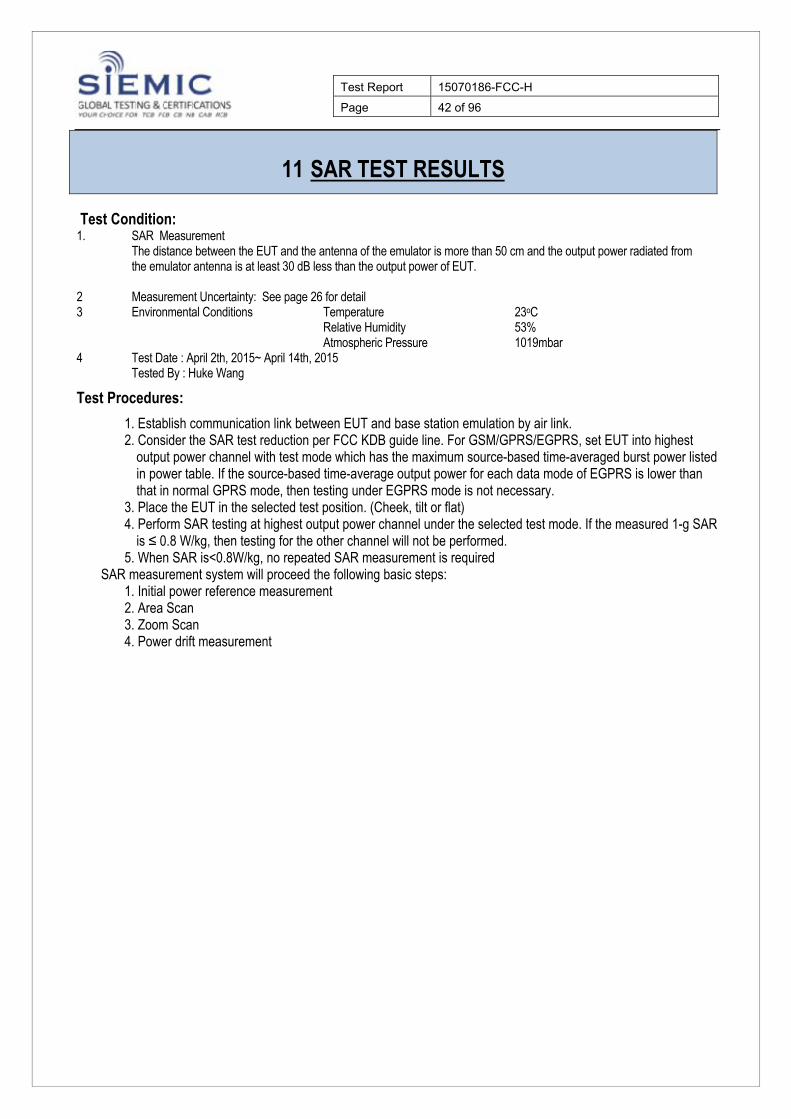
11 SAR TEST RESULTS Test Condition: 1. SAR Measurement
The distance between the EUT and the antenna of the emulator is more than 50 cm and the output power radiated from the emulator antenna is at least 30 dB less than the output power of EUT.
2 Measurement Uncertainty: See page 26 for detail 3 Environmental Conditions Temperature 23oC Relative Humidity 53% Atmospheric Pressure 1019mbar 4 Test Date : April 2th, 2015~ April 14th, 2015
Tested By : Huke Wang
Test Procedures:
1. Establish communication link between EUT and base station emulation by air link. 2. Consider the SAR test reduction per FCC KDB guide line. For GSM/GPRS/EGPRS, set EUT into highest
output power channel with test mode which has the maximum source-based time-averaged burst power listed in power table. If the source-based time-average output power for each data mode of EGPRS is lower than that in normal GPRS mode, then testing under EGPRS mode is not necessary.
3. Place the EUT in the selected test position. (Cheek, tilt or flat) 4. Perform SAR testing at highest output power channel under the selected test mode. If the measured 1-g SAR
is ≤ 0.8 W/kg, then testing for the other channel will not be performed. 5. When SAR is<0.8W/kg, no repeated SAR measurement is required
SAR measurement system will proceed the following basic steps: 1. Initial power reference measurement 2. Area Scan 3. Zoom Scan 4. Power drift measurement
Test Report 15070186-FCC-H Page 43 of 96
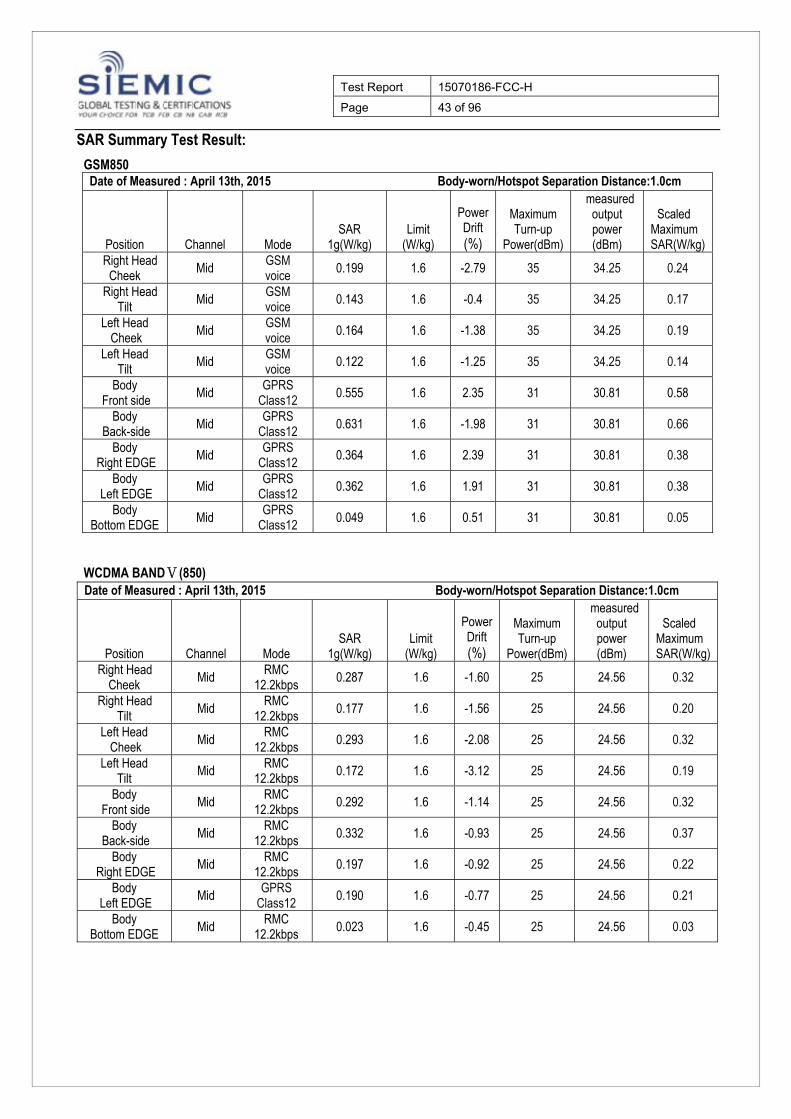
SAR Summary Test Result:
GSM850 Date of Measured : April 13th, 2015 Body-worn/Hotspot Separation Distance:1.0cm
Position Channel Mode SAR
1g(W/kg) Limit
(W/kg)
Power Drift (%)
Maximum Turn-up
Power(dBm)
measured output power (dBm)
Scaled Maximum SAR(W/kg)
Right Head Cheek
Mid GSM voice
0.199 1.6 -2.79 35 34.25 0.24
Right Head Tilt
Mid GSM voice
0.143 1.6 -0.4 35 34.25 0.17
Left Head Cheek Mid
GSM voice 0.164 1.6 -1.38 35 34.25 0.19
Left Head Tilt
Mid GSM voice
0.122 1.6 -1.25 35 34.25 0.14
Body Front side
Mid GPRS
Class12 0.555 1.6 2.35 31 30.81 0.58
Body Back-side Mid
GPRS Class12 0.631 1.6 -1.98 31 30.81 0.66
Body Right EDGE
Mid GPRS Class12
0.364 1.6 2.39 31 30.81 0.38
Body Left EDGE
Mid GPRS
Class12 0.362 1.6 1.91 31 30.81 0.38
Body Bottom EDGE Mid
GPRS Class12 0.049 1.6 0.51 31 30.81 0.05
WCDMA BANDⅤ(850) Date of Measured : April 13th, 2015 Body-worn/Hotspot Separation Distance:1.0cm
Position Channel Mode SAR
1g(W/kg) Limit
(W/kg)
Power Drift (%)
Maximum Turn-up
Power(dBm)
measured output power (dBm)
Scaled Maximum SAR(W/kg)
Right Head Cheek
Mid RMC
12.2kbps 0.287 1.6 -1.60 25 24.56 0.32
Right Head Tilt
Mid RMC
12.2kbps 0.177 1.6 -1.56 25 24.56 0.20
Left Head Cheek Mid
RMC 12.2kbps 0.293 1.6 -2.08 25 24.56 0.32
Left Head Tilt
Mid RMC
12.2kbps 0.172 1.6 -3.12 25 24.56 0.19
Body Front side
Mid RMC
12.2kbps 0.292 1.6 -1.14 25 24.56 0.32
Body Back-side Mid
RMC 12.2kbps 0.332 1.6 -0.93 25 24.56 0.37
Body Right EDGE
Mid RMC
12.2kbps 0.197 1.6 -0.92 25 24.56 0.22
Body Left EDGE
Mid GPRS
Class12 0.190 1.6 -0.77 25 24.56 0.21
Body Bottom EDGE Mid
RMC 12.2kbps 0.023 1.6 -0.45 25 24.56 0.03
Test Report 15070186-FCC-H Page 44 of 96
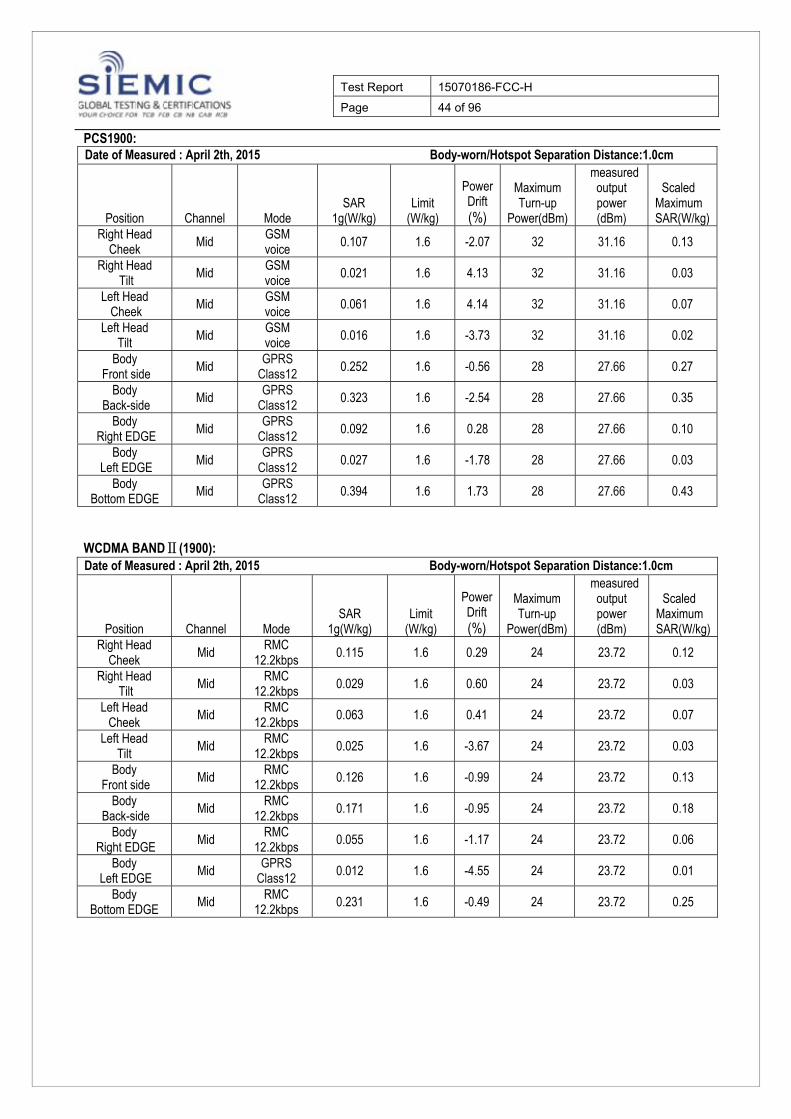
PCS1900: Date of Measured : April 2th, 2015 Body-worn/Hotspot Separation Distance:1.0cm
Position Channel Mode SAR
1g(W/kg) Limit
(W/kg)
Power Drift (%)
Maximum Turn-up
Power(dBm)
measured output power (dBm)
Scaled Maximum SAR(W/kg)
Right Head Cheek Mid
GSM voice 0.107 1.6 -2.07 32 31.16 0.13
Right Head Tilt Mid
GSM voice 0.021 1.6 4.13 32 31.16 0.03
Left Head Cheek
Mid GSM voice
0.061 1.6 4.14 32 31.16 0.07
Left Head Tilt Mid
GSM voice 0.016 1.6 -3.73 32 31.16 0.02
Body Front side Mid
GPRS Class12 0.252 1.6 -0.56 28 27.66 0.27
Body Back-side
Mid GPRS Class12
0.323 1.6 -2.54 28 27.66 0.35
Body Right EDGE Mid
GPRS Class12 0.092 1.6 0.28 28 27.66 0.10
Body Left EDGE Mid
GPRS Class12 0.027 1.6 -1.78 28 27.66 0.03
Body Bottom EDGE
Mid GPRS
Class12 0.394 1.6 1.73 28 27.66 0.43
WCDMA BANDⅡ(1900): Date of Measured : April 2th, 2015 Body-worn/Hotspot Separation Distance:1.0cm
Position Channel Mode SAR
1g(W/kg) Limit
(W/kg)
Power Drift (%)
Maximum Turn-up
Power(dBm)
measured output power (dBm)
Scaled Maximum SAR(W/kg)
Right Head Cheek
Mid RMC
12.2kbps 0.115 1.6 0.29 24 23.72 0.12
Right Head Tilt Mid
RMC 12.2kbps 0.029 1.6 0.60 24 23.72 0.03
Left Head Cheek
Mid RMC 12.2kbps
0.063 1.6 0.41 24 23.72 0.07
Left Head Tilt
Mid RMC
12.2kbps 0.025 1.6 -3.67 24 23.72 0.03
Body Front side Mid
RMC 12.2kbps 0.126 1.6 -0.99 24 23.72 0.13
Body Back-side
Mid RMC
12.2kbps 0.171 1.6 -0.95 24 23.72 0.18
Body Right EDGE
Mid RMC
12.2kbps 0.055 1.6 -1.17 24 23.72 0.06
Body Left EDGE Mid
GPRS Class12 0.012 1.6 -4.55 24 23.72 0.01
Body Bottom EDGE
Mid RMC
12.2kbps 0.231 1.6 -0.49 24 23.72 0.25
Test Report 15070186-FCC-H Page 45 of 96
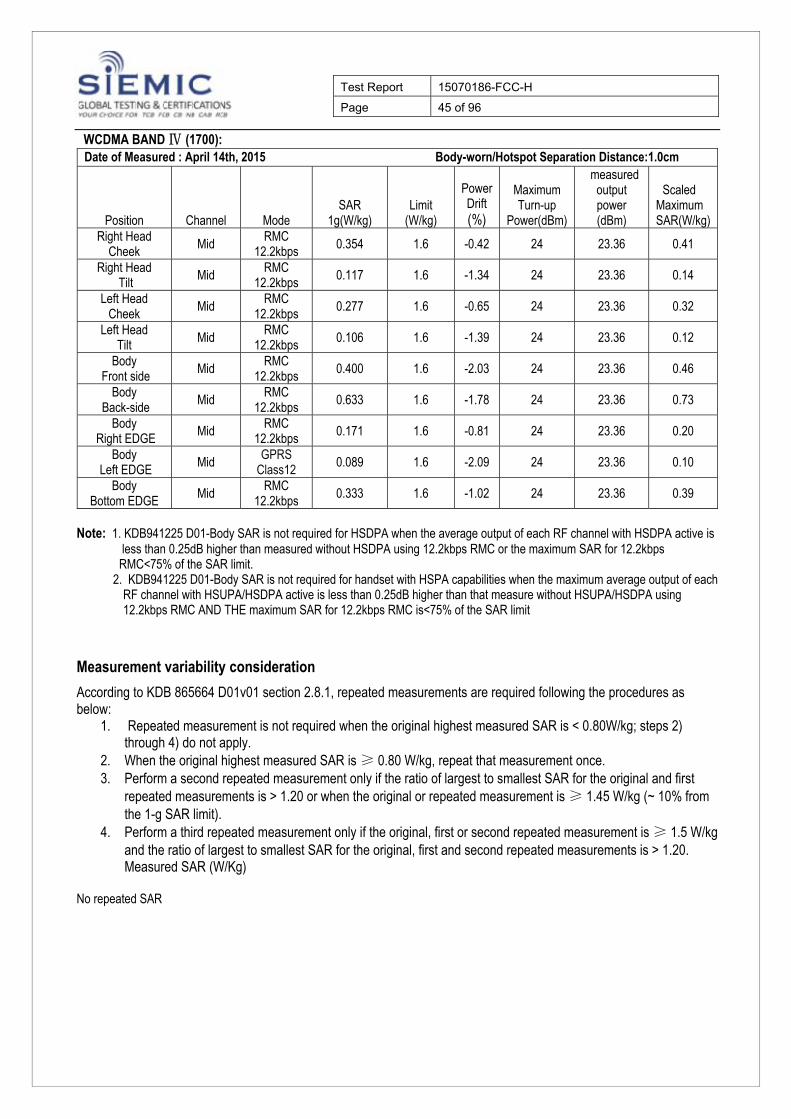
WCDMA BAND Ⅳ (1700): Date of Measured : April 14th, 2015 Body-worn/Hotspot Separation Distance:1.0cm
Position Channel Mode SAR
1g(W/kg) Limit
(W/kg)
Power Drift (%)
Maximum Turn-up
Power(dBm)
measured output power (dBm)
Scaled Maximum SAR(W/kg)
Right Head Cheek Mid
RMC 12.2kbps 0.354 1.6 -0.42 24 23.36 0.41
Right Head Tilt
Mid RMC
12.2kbps 0.117 1.6 -1.34 24 23.36 0.14
Left Head Cheek
Mid RMC
12.2kbps 0.277 1.6 -0.65 24 23.36 0.32
Left Head Tilt Mid
RMC 12.2kbps 0.106 1.6 -1.39 24 23.36 0.12
Body Front side
Mid RMC
12.2kbps 0.400 1.6 -2.03 24 23.36 0.46
Body Back-side
Mid RMC
12.2kbps 0.633 1.6 -1.78 24 23.36 0.73
Body Right EDGE Mid
RMC 12.2kbps 0.171 1.6 -0.81 24 23.36 0.20
Body Left EDGE
Mid GPRS Class12
0.089 1.6 -2.09 24 23.36 0.10
Body Bottom EDGE
Mid RMC
12.2kbps 0.333 1.6 -1.02 24 23.36 0.39
Note: 1. KDB941225 D01-Body SAR is not required for HSDPA when the average output of each RF channel with HSDPA active is less than 0.25dB higher than measured without HSDPA using 12.2kbps RMC or the maximum SAR for 12.2kbps RMC<75% of the SAR limit. 2. KDB941225 D01-Body SAR is not required for handset with HSPA capabilities when the maximum average output of each
RF channel with HSUPA/HSDPA active is less than 0.25dB higher than that measure without HSUPA/HSDPA using 12.2kbps RMC AND THE maximum SAR for 12.2kbps RMC is<75% of the SAR limit
Measurement variability consideration
According to KDB 865664 D01v01 section 2.8.1, repeated measurements are required following the procedures as below:
1. Repeated measurement is not required when the original highest measured SAR is < 0.80W/kg; steps 2) through 4) do not apply.
2. When the original highest measured SAR is ≥ 0.80 W/kg, repeat that measurement once. 3. Perform a second repeated measurement only if the ratio of largest to smallest SAR for the original and first
repeated measurements is > 1.20 or when the original or repeated measurement is ≥ 1.45 W/kg (~ 10% from the 1-g SAR limit).
4. Perform a third repeated measurement only if the original, first or second repeated measurement is ≥ 1.5 W/kg and the ratio of largest to smallest SAR for the original, first and second repeated measurements is > 1.20. Measured SAR (W/Kg)
No repeated SAR
Test Report 15070186-FCC-H Page 46 of 96
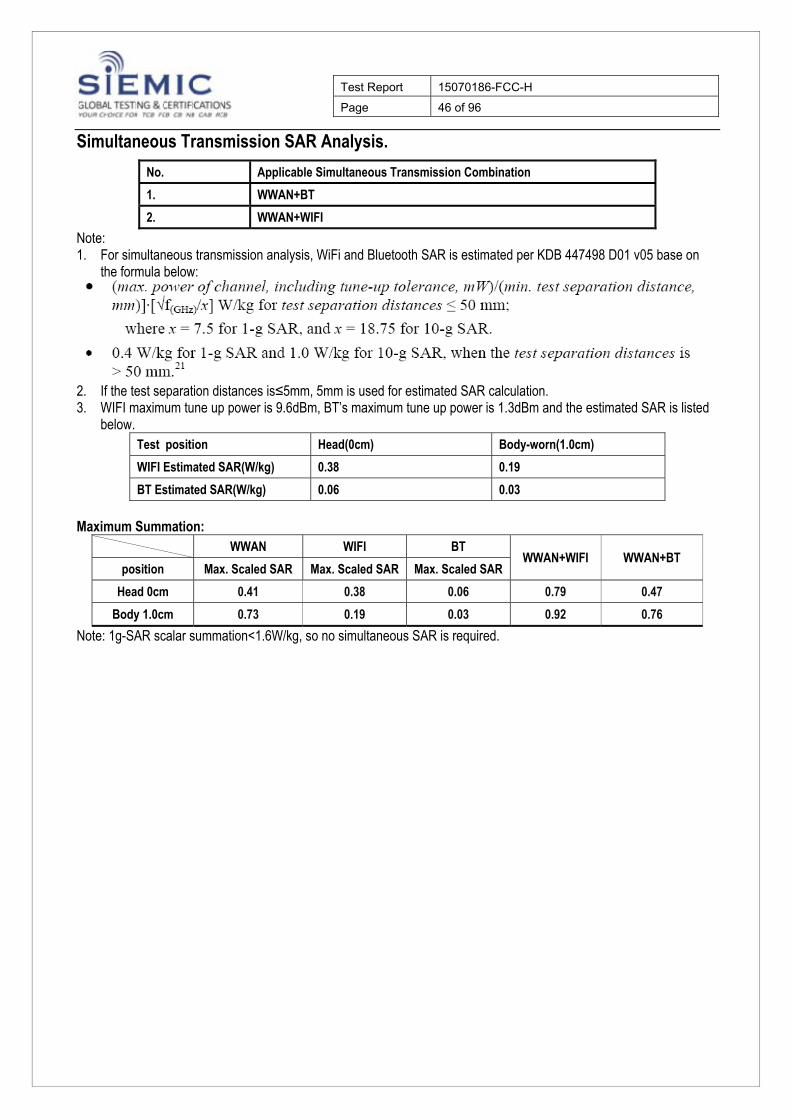
Simultaneous Transmission SAR Analysis.
No. Applicable Simultaneous Transmission Combination
1. WWAN+BT
2. WWAN+WIFI
Note: 1. For simultaneous transmission analysis, WiFi and Bluetooth SAR is estimated per KDB 447498 D01 v05 base on
the formula below:
2. If the test separation distances is≤5mm, 5mm is used for estimated SAR calculation. 3. WIFI maximum tune up power is 9.6dBm, BT’s maximum tune up power is 1.3dBm and the estimated SAR is listed
below. Test position Head(0cm) Body-worn(1.0cm)
WIFI Estimated SAR(W/kg) 0.38 0.19
BT Estimated SAR(W/kg) 0.06 0.03
Maximum Summation:
WWAN WIFI BT WWAN+WIFI WWAN+BT
position Max. Scaled SAR Max. Scaled SAR Max. Scaled SAR
Head 0cm 0.41 0.38 0.06 0.79 0.47
Body 1.0cm 0.73 0.19 0.03 0.92 0.76
Note: 1g-SAR scalar summation<1.6W/kg, so no simultaneous SAR is required.
Test Report 15070186-FCC-H Page 47 of 96
12 SAR MEASUREMENT REFERENCES
References
1. FCC 47 CFR Part 2 “Frequency Allocations and Radio Treaty Matters; General Rules and
Regulations”
2. IEEE Std. C95.1-1991, “IEEE Standard for Safety Levels with Respect to Human Exposure to Radio
Frequency Electromagnetic Fields, 3kHz to 300GHz”, 1991
3. IEEE Std. 1528-2013, “IEEE Recommended Practice for Determining the Peak Spatial-Average
Specific Absorption Rate (SAR) in the Human Head from Wireless Communications Devices:
Measurement Techniques”, June 2013
4. IEC 62209-2, “Human exposure to radio frequency fields from hand-held and body-mounted
wireless communication devices—Human models, instrumentation, and procedures – Part 2:
Procedure to determine the specific absorption rate(SAR) for wireless communication devices
used in close proximity to the human body(frequency range of 30MHz to 6GHz)”, April 2010
5. FCC KDB 447498 D01 v05r02, “Mobile and Portable Device RF Exposure Procedures and
Equipment Authorization Policies”, Feb 7th, 2014
6. FCC KDB 941225 D04 v01, “Evaluation SAR for GSM/(E)GPRS Dual Transfer Mode”, January 27
2010
7. FCC KDB 941225 D03 v01, “Evaluation SAR Test Reduction Procedures for GSM/GPRS/EDGE”,
December 2008
8. FCC KDB 865664 D01, “SAR Measurement Requirements 100MHz to 6GHz”, Feb 7th, 2014
9. FCC KDB648474 D04, SAR Evaluation Considerations for Wireless Handsets. Dec 4th, 2013
10. FCC KDB 941225 D06 V02, SAR Evaluation Procedures for Portable Devices with Wireless Router
Capabilities, Oct 16th, 2014.
Test Report 15070186-FCC-H Page 48 of 96
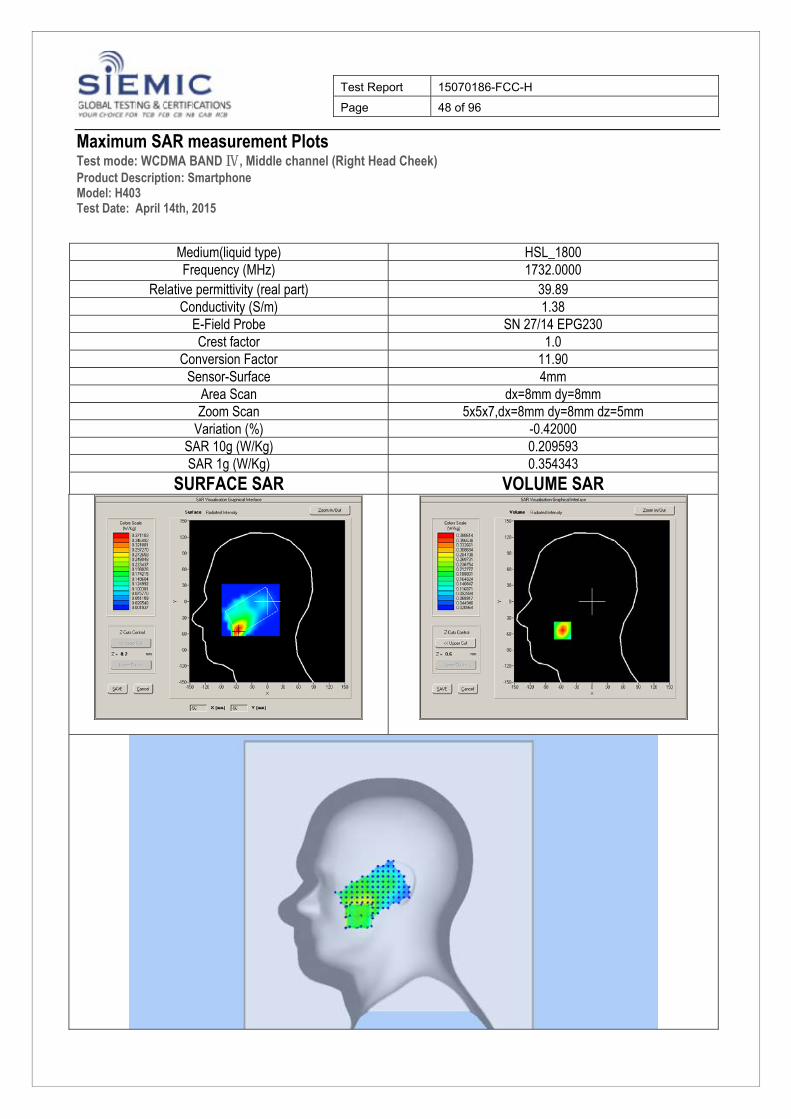
Maximum SAR measurement Plots Test mode: WCDMA BAND Ⅳ, Middle channel (Right Head Cheek) Product Description: Smartphone Model: H403 Test Date: April 14th, 2015
Medium(liquid type) HSL_1800 Frequency (MHz) 1732.0000
Relative permittivity (real part) 39.89 Conductivity (S/m) 1.38
E-Field Probe SN 27/14 EPG230 Crest factor 1.0
Conversion Factor 11.90 Sensor-Surface 4mm
Area Scan dx=8mm dy=8mm Zoom Scan 5x5x7,dx=8mm dy=8mm dz=5mm
Variation (%) -0.42000 SAR 10g (W/Kg) 0.209593 SAR 1g (W/Kg) 0.354343
SURFACE SAR VOLUME SAR
Test Report 15070186-FCC-H Page 49 of 96
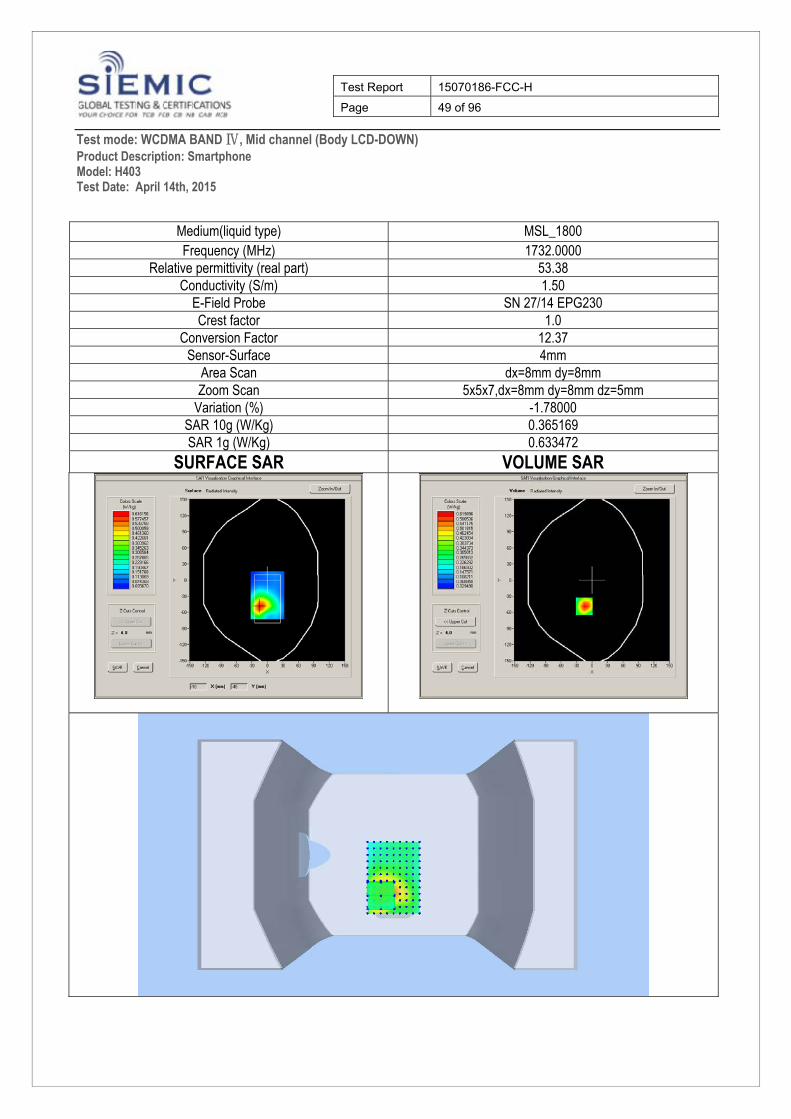
Test mode: WCDMA BAND Ⅳ, Mid channel (Body LCD-DOWN) Product Description: Smartphone Model: H403 Test Date: April 14th, 2015
Medium(liquid type) MSL_1800 Frequency (MHz) 1732.0000
Relative permittivity (real part) 53.38 Conductivity (S/m) 1.50
E-Field Probe SN 27/14 EPG230 Crest factor 1.0
Conversion Factor 12.37 Sensor-Surface 4mm
Area Scan dx=8mm dy=8mm Zoom Scan 5x5x7,dx=8mm dy=8mm dz=5mm
Variation (%) -1.78000 SAR 10g (W/Kg) 0.365169 SAR 1g (W/Kg) 0.633472
SURFACE SAR VOLUME SAR
Test Report 15070186-FCC-H Page 50 of 96
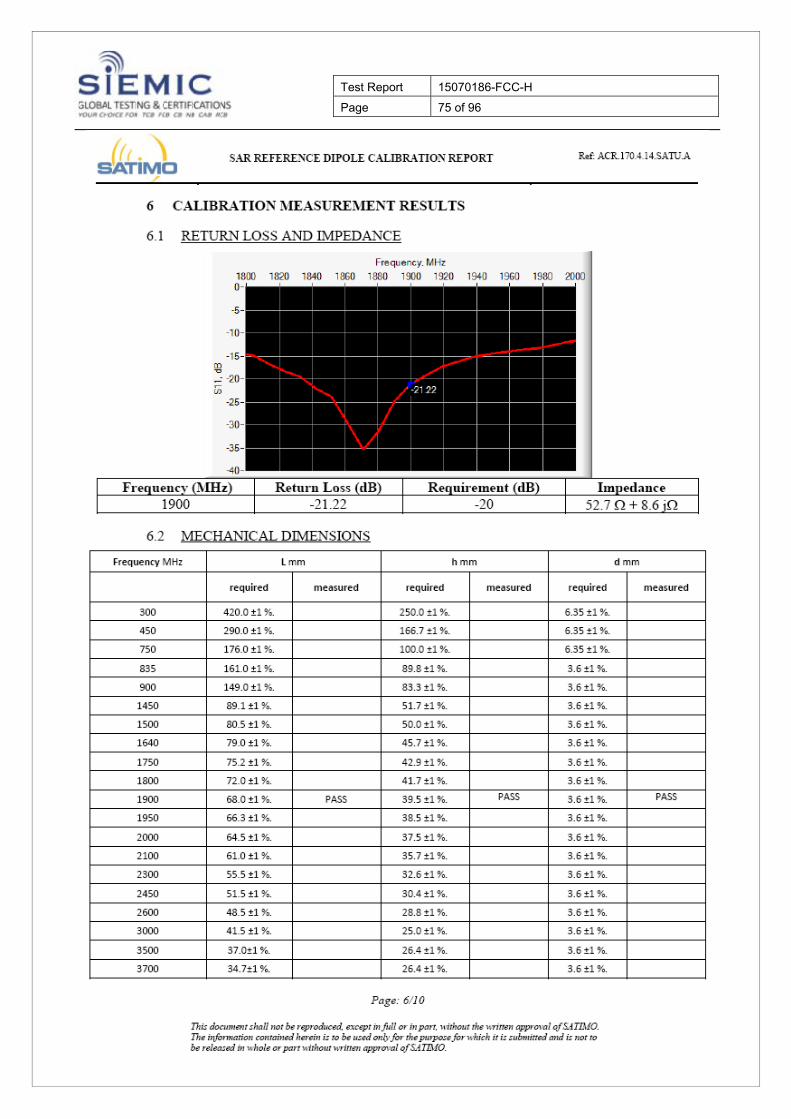
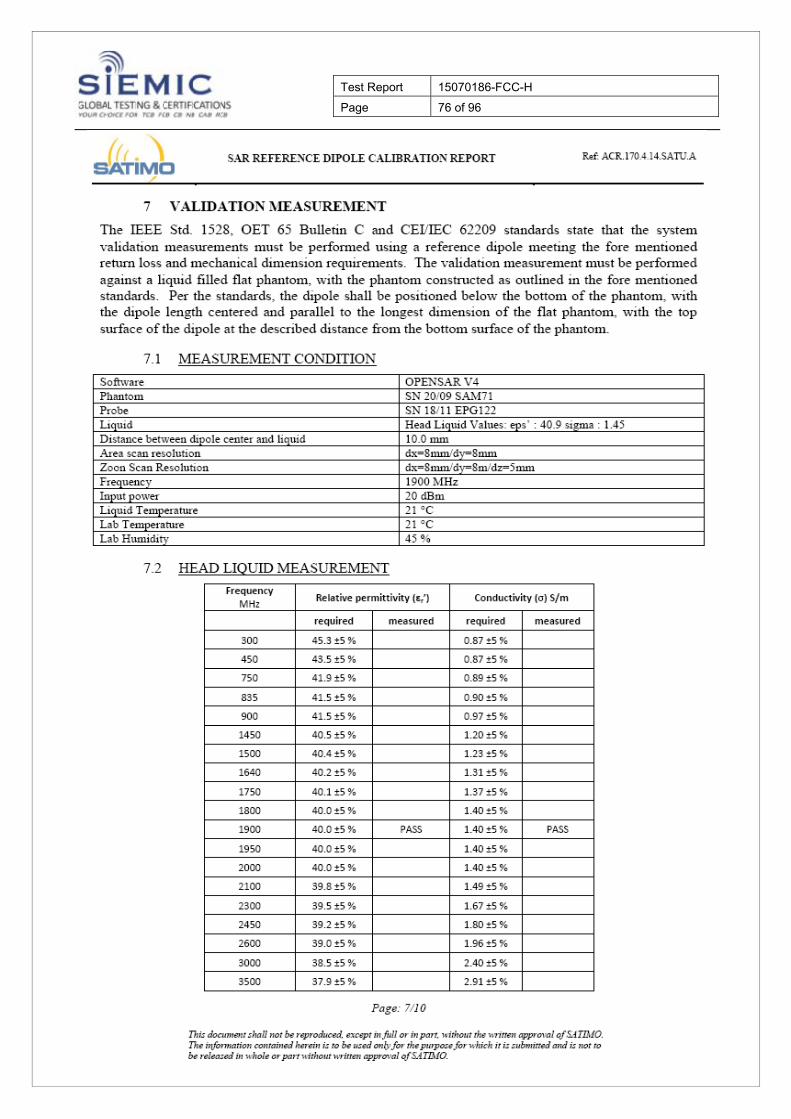
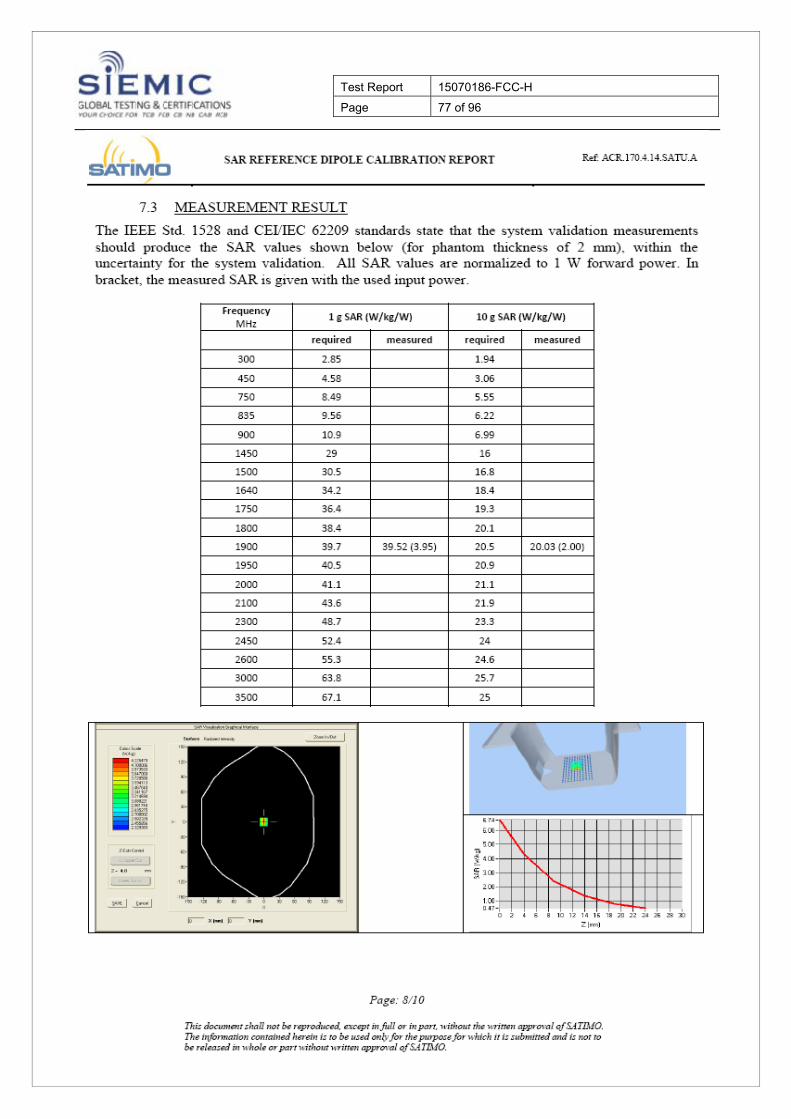
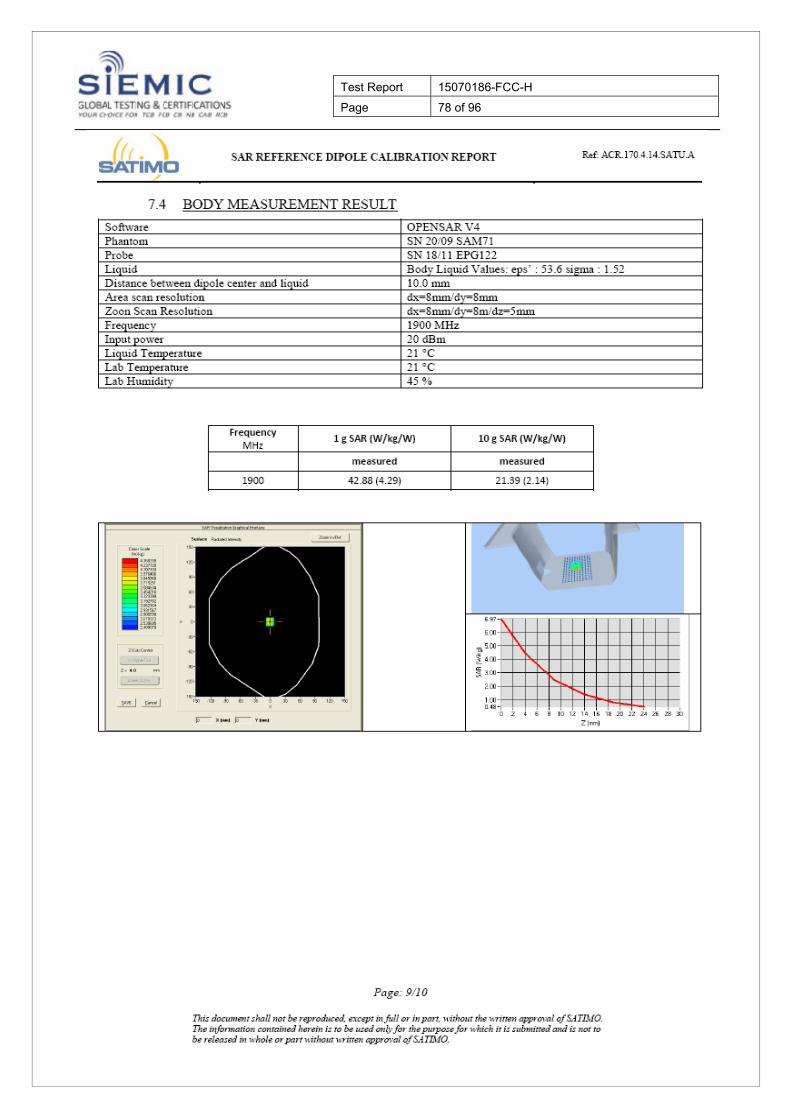
Annex A CALIBRATION REPORTS
Test Report 15070186-FCC-H Page 51 of 96
Test Report 15070186-FCC-H Page 52 of 96
Test Report 15070186-FCC-H Page 53 of 96

Test Report 15070186-FCC-H Page 54 of 96
Test Report 15070186-FCC-H Page 55 of 96
Test Report 15070186-FCC-H Page 56 of 96
Test Report 15070186-FCC-H Page 57 of 96
Test Report 15070186-FCC-H Page 58 of 96
Test Report 15070186-FCC-H Page 59 of 96
Test Report 15070186-FCC-H Page 60 of 96

Test Report 15070186-FCC-H Page 61 of 96
Test Report 15070186-FCC-H Page 62 of 96
Test Report 15070186-FCC-H Page 63 of 96
Test Report 15070186-FCC-H Page 64 of 96
Test Report 15070186-FCC-H Page 65 of 96
Test Report 15070186-FCC-H Page 66 of 96

Test Report 15070186-FCC-H Page 67 of 96
Test Report 15070186-FCC-H Page 68 of 96
Test Report 15070186-FCC-H Page 69 of 96
Test Report 15070186-FCC-H Page 70 of 96
Test Report 15070186-FCC-H Page 71 of 96
Test Report 15070186-FCC-H Page 72 of 96
Test Report 15070186-FCC-H Page 73 of 96
Test Report 15070186-FCC-H Page 74 of 96
Test Report 15070186-FCC-H Page 75 of 96
Test Report 15070186-FCC-H Page 76 of 96
Test Report 15070186-FCC-H Page 77 of 96
Test Report 15070186-FCC-H Page 78 of 96
Test Report 15070186-FCC-H Page 79 of 96
Test Report 15070186-FCC-H Page 80 of 96
Test Report 15070186-FCC-H Page 81 of 96
Test Report 15070186-FCC-H Page 82 of 96
Test Report 15070186-FCC-H Page 83 of 96

Test Report 15070186-FCC-H Page 84 of 96

Test Report 15070186-FCC-H Page 85 of 96
Test Report 15070186-FCC-H Page 86 of 96

Test Report 15070186-FCC-H Page 87 of 96
Test Report 15070186-FCC-H Page 88 of 96
Test Report 15070186-FCC-H Page 89 of 96
Test Report 15070186-FCC-H Page 90 of 96
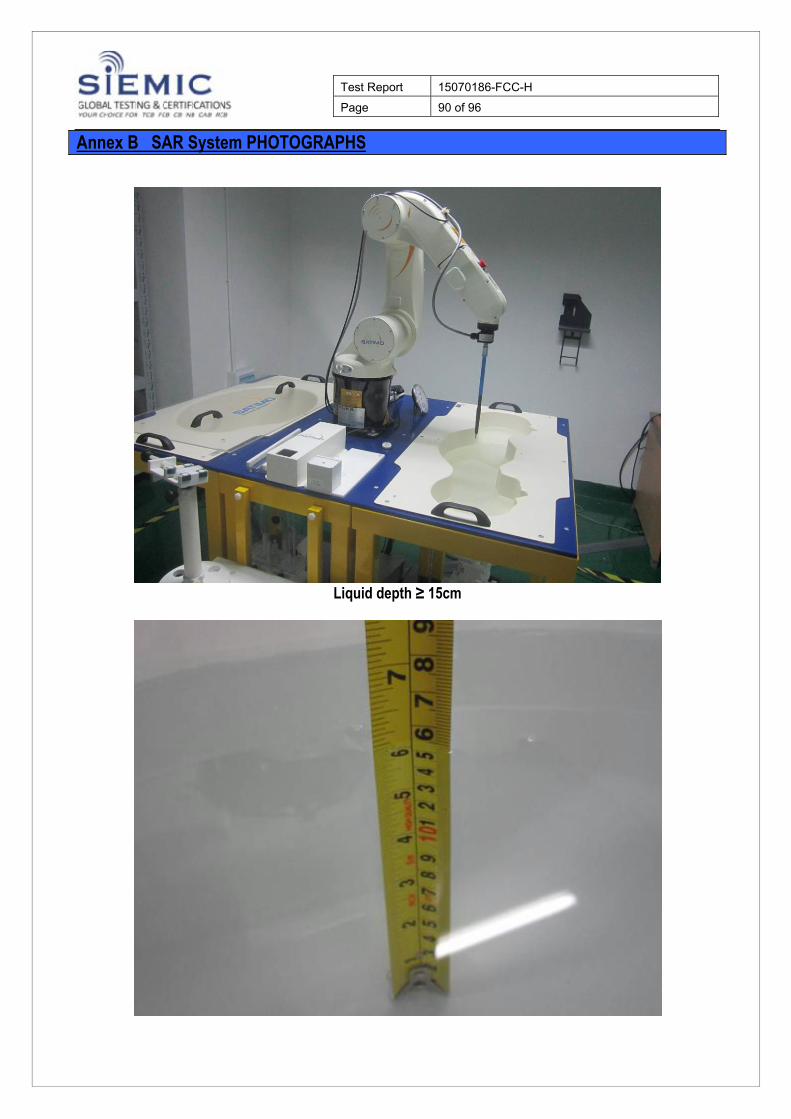
Annex B SAR System PHOTOGRAPHS
Liquid depth ≥ 15cm

Test Report 15070186-FCC-H Page 91 of 96
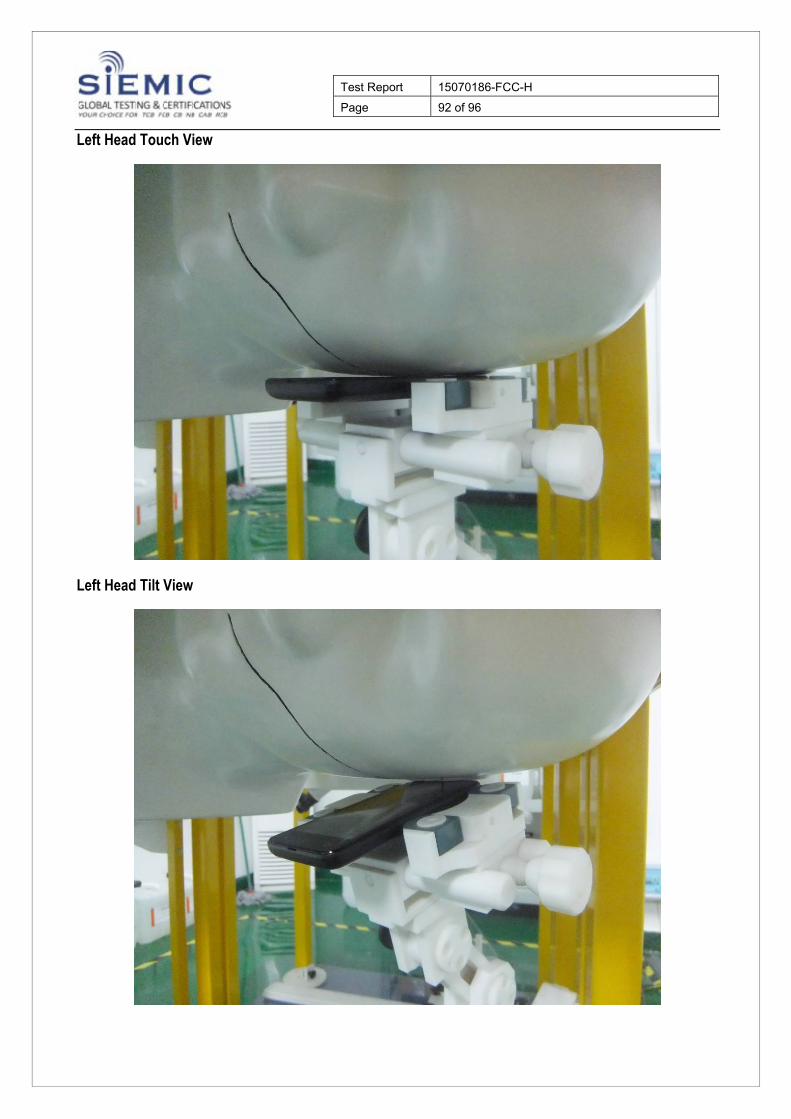
Annex C SETUP PHOTOGRAPHS Right Head Touch View Right Head Tilt View
Test Report 15070186-FCC-H Page 92 of 96
Left Head Touch View Left Head Tilt View
Test Report 15070186-FCC-H Page 93 of 96
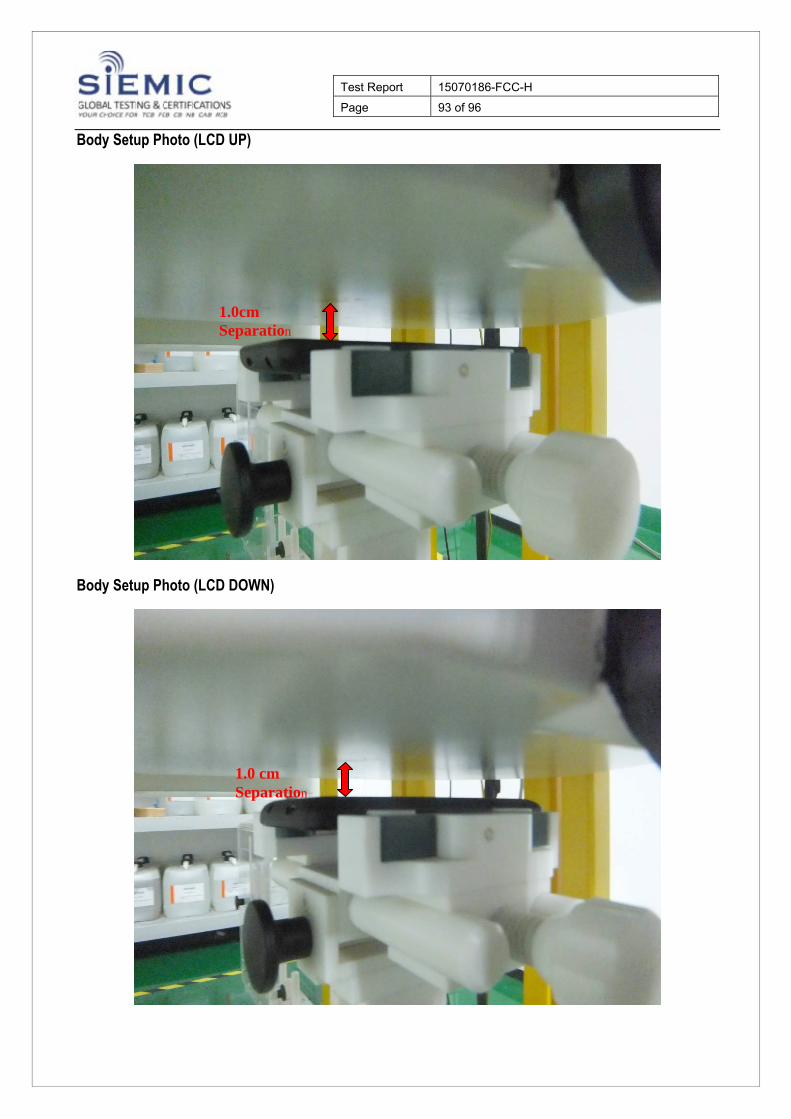
Body Setup Photo (LCD UP) Body Setup Photo (LCD DOWN)
1.0cm Separation
1.0 cm Separation
Test Report 15070186-FCC-H Page 94 of 96
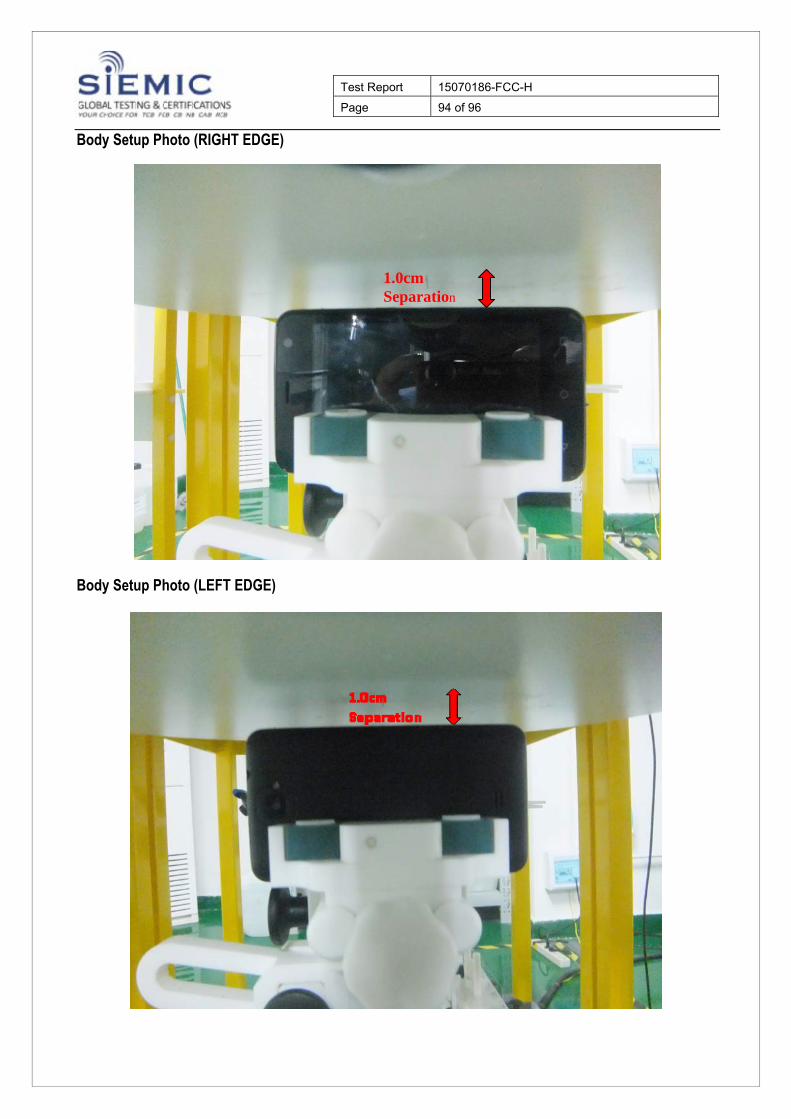
Body Setup Photo (RIGHT EDGE) Body Setup Photo (LEFT EDGE)
1.0cm Separation
Test Report 15070186-FCC-H Page 95 of 96
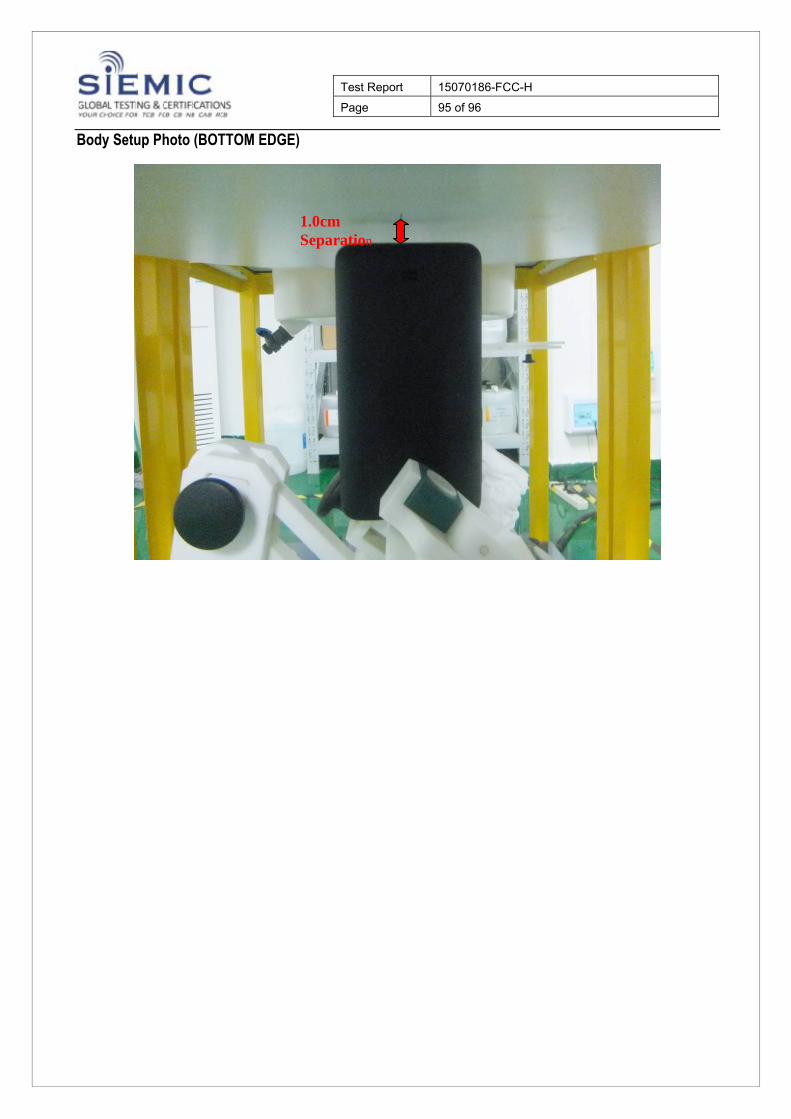
Body Setup Photo (BOTTOM EDGE)
1.0cm Separation
Test Report 15070186-FCC-H Page 96 of 96
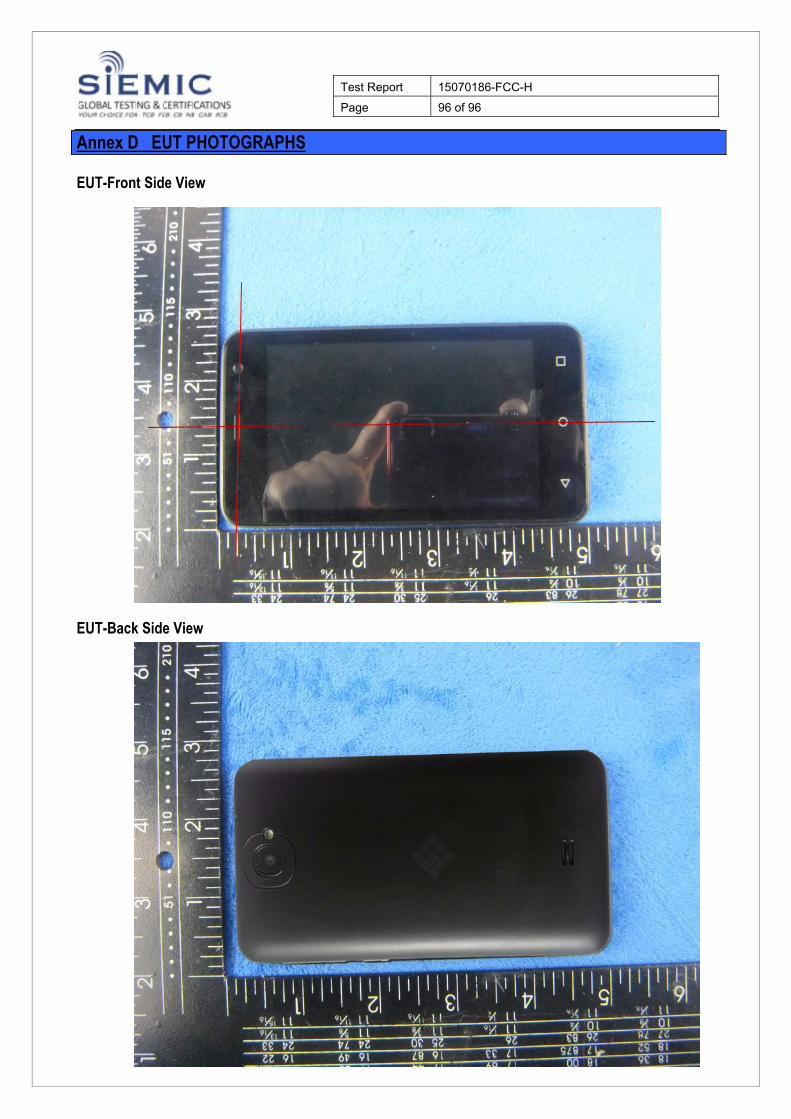
Annex D EUT PHOTOGRAPHS EUT-Front Side View EUT-Back Side View