Embed Size (px)
Citation preview
FCC ID: EMJCPM30W17
SAR EVALUATION REPORT Approved by:
Quality Manager
Document S/N: Test Dates: DUT Type: Page 1 of 19
1M1702160065.EMJC 02/15/2017 Wireless Power Transfer System
© 2017 PCTEST Engineering Laboratory, Inc. REV 18.3 M 01/30/2017 © 2017 PCTEST Engineering Laboratory, Inc. All rights reserved. Unless otherwise specified, no part of this report may be reproduced or utilized in any part, form or by any means, electronic or mechanical, including photocopying and microfilm, without permission in writing from PCTEST Engineering Laboratory, Inc. If you have any questions about this international copyright or have an enquiry about obtaining additional rights to this report or assembly of contents thereof, please contact [email protected].
Applicant Name: Date of Testing: WiTricity 02/15/17 57 Water Street Test Site/Location: Watertow, MA 02472 PCTEST Lab, Columbia, MD, USA Document Serial No.: 1M1702160065.EMJC
FCC ID: EMJCPM30W17
APPLICANT: WITRICITY
DUT Type: Wireless Power Transfer System Application Type: Certification
FCC Rule Part(s): CFR §2.1093
Model: PM30W17
I attest to the accuracy of data. All measurements reported herein were performed by me or were made under my supervision and are correct to the best of my knowledge and belief. I assume full responsibility for the completeness of these measurements and vouch for the qualifications of all persons taking them. Test results reported herein relate only to the item(s) tested.
The SAR Tick is an initiative of the Mobile Manufacturers Forum (MMF). While a product may be considered eligible, use of the SAR Tick logo requires an agreement with the MMF. Further details can be obtained by emailing: [email protected].
1 gm Body
(W/kg)
10 gm Extremity
(W/kg)
Airfuel Resonant 6.78 MHz <0.1 1.07
Technology Tx Frequency
SAR
PCTEST ENGINEERING LABORATORY, INC. 7185 Oakland Mills Road, Columbia, MD 21046 USA
Tel. +1.410.290.6652 / Fax +1.410.290.6654 http://www.pctestlab.com
SAR EVALUATION REPORT
FCC ID: EMJCPM30W17
SAR EVALUATION REPORT Approved by:
Quality Manager
Document S/N: Test Dates: DUT Type: Page 2 of 19
1M1702160065.EMJC 02/15/2017 Wireless Power Transfer System
© 2017 PCTEST Engineering Laboratory, Inc. REV 18.3 M 01/30/2017 © 2017 PCTEST Engineering Laboratory, Inc. All rights reserved. Unless otherwise specified, no part of this report may be reproduced or utilized in any part, form or by any means, electronic or mechanical, including photocopying and microfilm, without permission in writing from PCTEST Engineering Laboratory, Inc. If you have any questions about this international copyright or have an enquiry about obtaining additional rights to this report or assembly of contents thereof, please contact [email protected].
T A B L E O F C O N T E N T S
1 DEVICE UNDER TEST ................................................................................................................................ 3
2 INTRODUCTION .......................................................................................................................................... 4
3 SAR MEASUREMENT SETUP .................................................................................................................... 5
4 DASY E-FIELD PROBE SYSTEM ................................................................................................................ 7
5 DOSIMETRIC ASSESSMENT ..................................................................................................................... 8
6 TEST CONFIGURATION POSITIONS ........................................................................................................ 9
7 RF EXPOSURE LIMITS ............................................................................................................................. 10
8 SYSTEM VERIFICATION ........................................................................................................................... 11
9 SAR DATA SUMMARY .............................................................................................................................. 13
10 SAR MEASUREMENT VARIABILITY ........................................................................................................ 14
11 EQUIPMENT LIST ...................................................................................................................................... 15
12 MEASUREMENT UNCERTAINTIES .......................................................................................................... 16
13 CONCLUSION ............................................................................................................................................ 17
14 REFERENCES ........................................................................................................................................... 18
APPENDIX A: SAR TEST PLOTS APPENDIX B: SAR DIPOLE VERIFICATION PLOTS APPENDIX C: PROBE AND DIPOLE CALIBRATION CERTIFICATES APPENDIX D: SAR TISSUE SPECIFICATIONS
APPENDIX E: DUT ANTENNA DIAGRAM & SAR TEST SETUP PHOTOGRAPHS

FCC ID: EMJCPM30W17
SAR EVALUATION REPORT Approved by:
Quality Manager
Document S/N: Test Dates: DUT Type: Page 3 of 19
1M1702160065.EMJC 02/15/2017 Wireless Power Transfer System
© 2017 PCTEST Engineering Laboratory, Inc. REV 18.3 M 01/30/2017 © 2017 PCTEST Engineering Laboratory, Inc. All rights reserved. Unless otherwise specified, no part of this report may be reproduced or utilized in any part, form or by any means, electronic or mechanical, including photocopying and microfilm, without permission in writing from PCTEST Engineering Laboratory, Inc. If you have any questions about this international copyright or have an enquiry about obtaining additional rights to this report or assembly of contents thereof, please contact [email protected].
1 D E V I C E U N D E R T E S T
1.1 Device Overview
1.2 Guidance Applied
• FCC KDB Publication 447498 D01v06, Section 4.4 (General SAR Guidance)
• FCC KDB Publication 865664 D01v01r04 (SAR Measurements up to 6 GHz)
• FCC KDB Publication 680106 D01v02
• February 17th, 2016 TCB Conference Call
• April 2015 TCB Workshop RF Exposure
• April 2016 TCB Workshop Notes
1.3 Device Serial Numbers
The manufacturer has confirmed that the device tested have the same physical, mechanical and thermal characteristics and are within operational tolerances expected for production units.
Airfuel Resonant Power 6.78 MHz
Technology Tx FrequencyOperating Modes
Device
Serial
Number
Airfuel Resonant 0216-1

FCC ID: EMJCPM30W17
SAR EVALUATION REPORT Approved by:
Quality Manager
Document S/N: Test Dates: DUT Type: Page 4 of 19
1M1702160065.EMJC 02/15/2017 Wireless Power Transfer System
© 2017 PCTEST Engineering Laboratory, Inc. REV 18.3 M 01/30/2017 © 2017 PCTEST Engineering Laboratory, Inc. All rights reserved. Unless otherwise specified, no part of this report may be reproduced or utilized in any part, form or by any means, electronic or mechanical, including photocopying and microfilm, without permission in writing from PCTEST Engineering Laboratory, Inc. If you have any questions about this international copyright or have an enquiry about obtaining additional rights to this report or assembly of contents thereof, please contact [email protected].
2 I N T R O D U C T I O N
The FCC and Innovation, Science, and Economic Development Canada have adopted the guidelines for evaluating the environmental effects of radio frequency (RF) radiation in ET Docket 93-62 on Aug. 6, 1996 and Health Canada Safety Code 6 to protect the public and workers from the potential hazards of RF emissions due to FCC-regulated portable devices. [1] The safety limits used for the environmental evaluation measurements are based on the criteria published by the American National Standards Institute (ANSI) for localized specific absorption rate (SAR) in IEEE/ANSI C95.1-1992 Standard for Safety Levels with Respect to Human Exposure to Radio Frequency Electromagnetic Fields, 3 kHz to 300 GHz [3] and Health Canada RF Exposure Guidelines Safety Code 6 [22]. The measurement procedure described in IEEE/ANSI C95.3-2002 Recommended Practice for the Measurement of Potentially Hazardous Electromagnetic Fields - RF and Microwave [4] is used for guidance in measuring the Specific Absorption Rate (SAR) due to the RF radiation exposure from the Equipment Under Test (EUT). These criteria for SAR evaluation are similar to those recommended by the International Committee for Non-Ionizing Radiation Protection (ICNIRP) in Biological Effects and Exposure Criteria for Radiofrequency Electromagnetic Fields,” Report No. Vol 74. SAR is a measure of the rate of energy absorption due to exposure to an RF transmitting source. SAR values have been related to threshold levels for potential biological hazards.
2.1 SAR Definition
Specific Absorption Rate is defined as the time derivative (rate) of the incremental energy (dU) absorbed by
(dissipated in) an incremental mass (dm) contained in a volume element (dV) of a given density (ρ). It is also defined as the rate of RF energy absorption per unit mass at a point in an absorbing body (see Equation 2-1).
Equation 2-1 SAR Mathematical Equation
SARd
dt
dU
dm
d
dt
dU
dv=
=
ρ
SAR is expressed in units of Watts per Kilogram (W/kg).
ρσ 2E
SAR⋅
=
where:
σ = conductivity of the tissue-simulating material (S/m)
ρ = mass density of the tissue-simulating material (kg/m3)
E = Total RMS electric field strength (V/m) NOTE: The primary factors that control rate of energy absorption were found to be the wavelength of the incident field in relation to the dimensions and geometry of the irradiated organism, the orientation of the organism in relation to the polarity of field vectors, the presence of reflecting surfaces, and whether conductive contact is made by the organism with a ground plane.[6]
FCC ID: EMJCPM30W17
SAR EVALUATION REPORT Approved by:
Quality Manager
Document S/N: Test Dates: DUT Type: Page 5 of 19
1M1702160065.EMJC 02/15/2017 Wireless Power Transfer System
© 2017 PCTEST Engineering Laboratory, Inc. REV 18.3 M 01/30/2017 © 2017 PCTEST Engineering Laboratory, Inc. All rights reserved. Unless otherwise specified, no part of this report may be reproduced or utilized in any part, form or by any means, electronic or mechanical, including photocopying and microfilm, without permission in writing from PCTEST Engineering Laboratory, Inc. If you have any questions about this international copyright or have an enquiry about obtaining additional rights to this report or assembly of contents thereof, please contact [email protected].
3 S A R M E A S U R E M E N T S E T U P
3.1 Robotic System
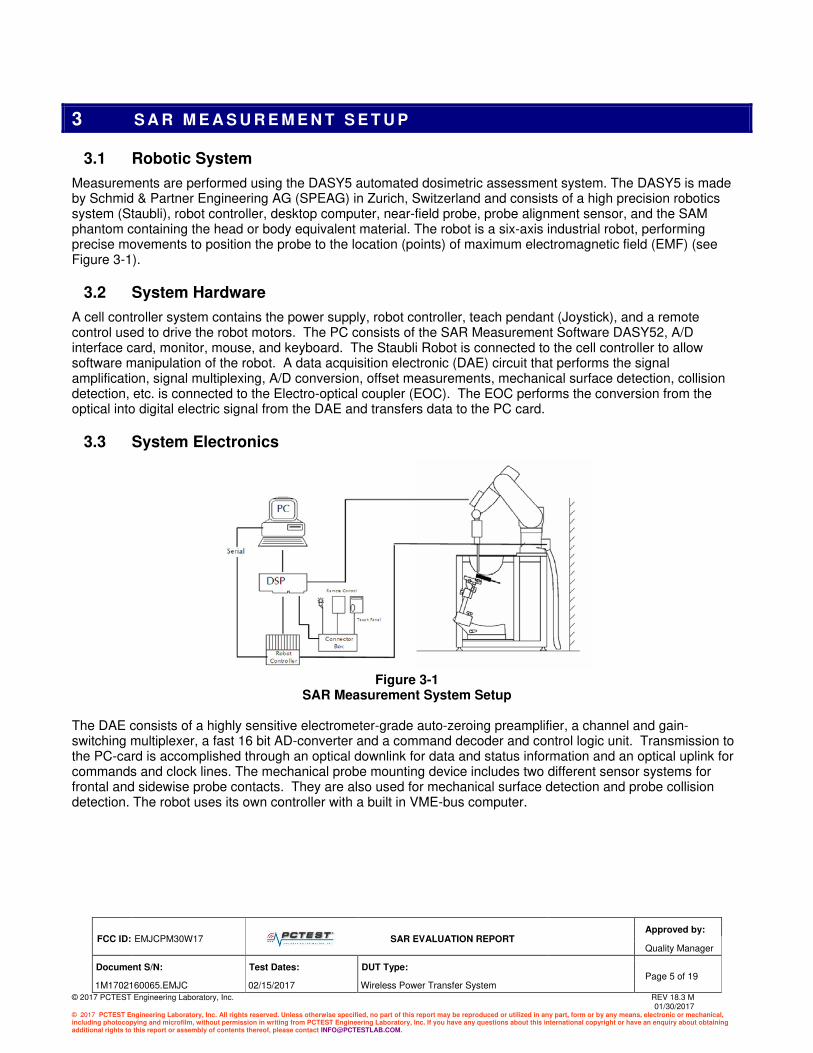
Measurements are performed using the DASY5 automated dosimetric assessment system. The DASY5 is made by Schmid & Partner Engineering AG (SPEAG) in Zurich, Switzerland and consists of a high precision robotics system (Staubli), robot controller, desktop computer, near-field probe, probe alignment sensor, and the SAM phantom containing the head or body equivalent material. The robot is a six-axis industrial robot, performing precise movements to position the probe to the location (points) of maximum electromagnetic field (EMF) (see Figure 3-1).
3.2 System Hardware
A cell controller system contains the power supply, robot controller, teach pendant (Joystick), and a remote control used to drive the robot motors. The PC consists of the SAR Measurement Software DASY52, A/D interface card, monitor, mouse, and keyboard. The Staubli Robot is connected to the cell controller to allow software manipulation of the robot. A data acquisition electronic (DAE) circuit that performs the signal amplification, signal multiplexing, A/D conversion, offset measurements, mechanical surface detection, collision detection, etc. is connected to the Electro-optical coupler (EOC). The EOC performs the conversion from the optical into digital electric signal from the DAE and transfers data to the PC card.
3.3 System Electronics
Figure 3-1
SAR Measurement System Setup The DAE consists of a highly sensitive electrometer-grade auto-zeroing preamplifier, a channel and gain-switching multiplexer, a fast 16 bit AD-converter and a command decoder and control logic unit. Transmission to the PC-card is accomplished through an optical downlink for data and status information and an optical uplink for commands and clock lines. The mechanical probe mounting device includes two different sensor systems for frontal and sidewise probe contacts. They are also used for mechanical surface detection and probe collision detection. The robot uses its own controller with a built in VME-bus computer.
FCC ID: EMJCPM30W17
SAR EVALUATION REPORT Approved by:
Quality Manager
Document S/N: Test Dates: DUT Type: Page 6 of 19
1M1702160065.EMJC 02/15/2017 Wireless Power Transfer System
© 2017 PCTEST Engineering Laboratory, Inc. REV 18.3 M 01/30/2017 © 2017 PCTEST Engineering Laboratory, Inc. All rights reserved. Unless otherwise specified, no part of this report may be reproduced or utilized in any part, form or by any means, electronic or mechanical, including photocopying and microfilm, without permission in writing from PCTEST Engineering Laboratory, Inc. If you have any questions about this international copyright or have an enquiry about obtaining additional rights to this report or assembly of contents thereof, please contact [email protected].
3.4 Automated Test System Specifications
Test Software: SPEAG DASY52 version 52.8 Measurement Software
Robot: Stäubli Unimation Corp. Robot RX60L, Robot TX90XL Repeatability: 0.02 mm
No. of Axes: 6 Data Acquisition Electronic System (DAE) Data Converter
Features: Signal Amplifier, multiplexer, A/D converter & control logic Software: SEMCAD X software
Connecting Lines: Optical Downlink for data and status info Optical upload for commands and clock PC Interface Card
Function: Link to DAE 16-bit A/D converter for surface detection system Two Serial & Ethernet link to robotics Direct emergency stop output for robot Phantom
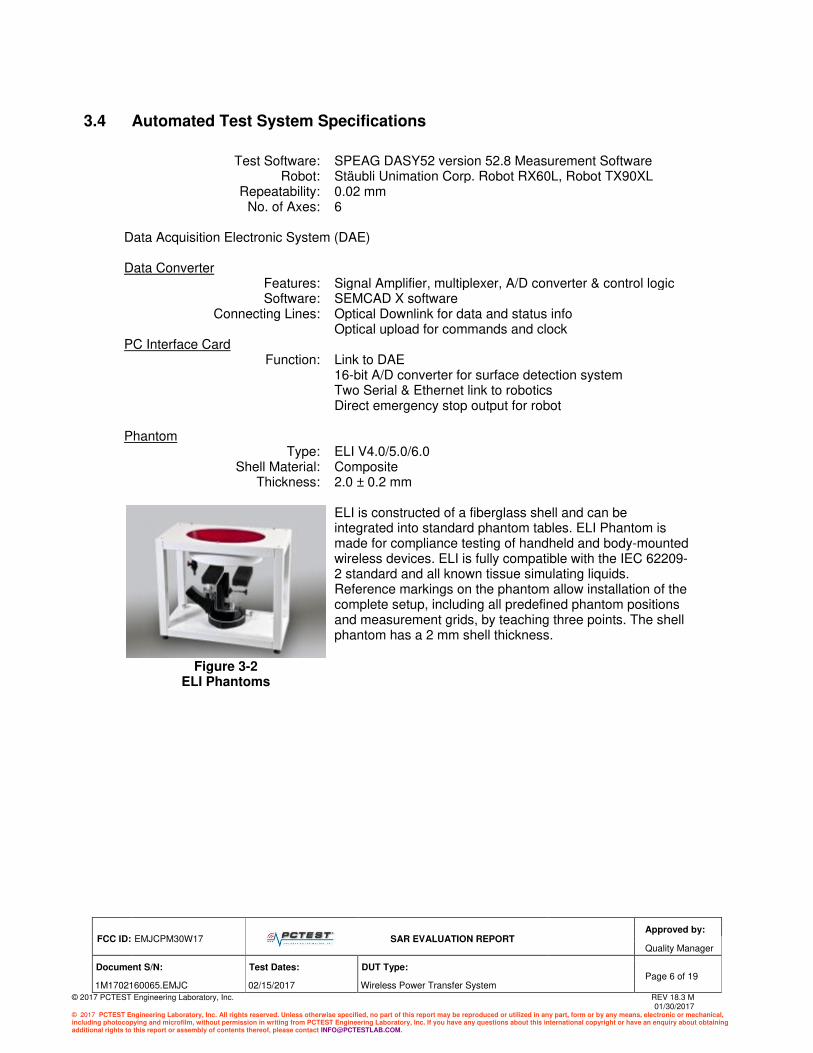
Type: ELI V4.0/5.0/6.0 Shell Material: Composite
Thickness: 2.0 ± 0.2 mm
Figure 3-2
ELI Phantoms
ELI is constructed of a fiberglass shell and can be integrated into standard phantom tables. ELI Phantom is made for compliance testing of handheld and body-mounted wireless devices. ELI is fully compatible with the IEC 62209-2 standard and all known tissue simulating liquids. Reference markings on the phantom allow installation of the complete setup, including all predefined phantom positions and measurement grids, by teaching three points. The shell phantom has a 2 mm shell thickness.
FCC ID: EMJCPM30W17
SAR EVALUATION REPORT Approved by:
Quality Manager
Document S/N: Test Dates: DUT Type: Page 7 of 19
1M1702160065.EMJC 02/15/2017 Wireless Power Transfer System
© 2017 PCTEST Engineering Laboratory, Inc. REV 18.3 M 01/30/2017 © 2017 PCTEST Engineering Laboratory, Inc. All rights reserved. Unless otherwise specified, no part of this report may be reproduced or utilized in any part, form or by any means, electronic or mechanical, including photocopying and microfilm, without permission in writing from PCTEST Engineering Laboratory, Inc. If you have any questions about this international copyright or have an enquiry about obtaining additional rights to this report or assembly of contents thereof, please contact [email protected].
4 D A S Y E - F I E L D P R O B E S Y S T E M
4.1 Probe Measurement System
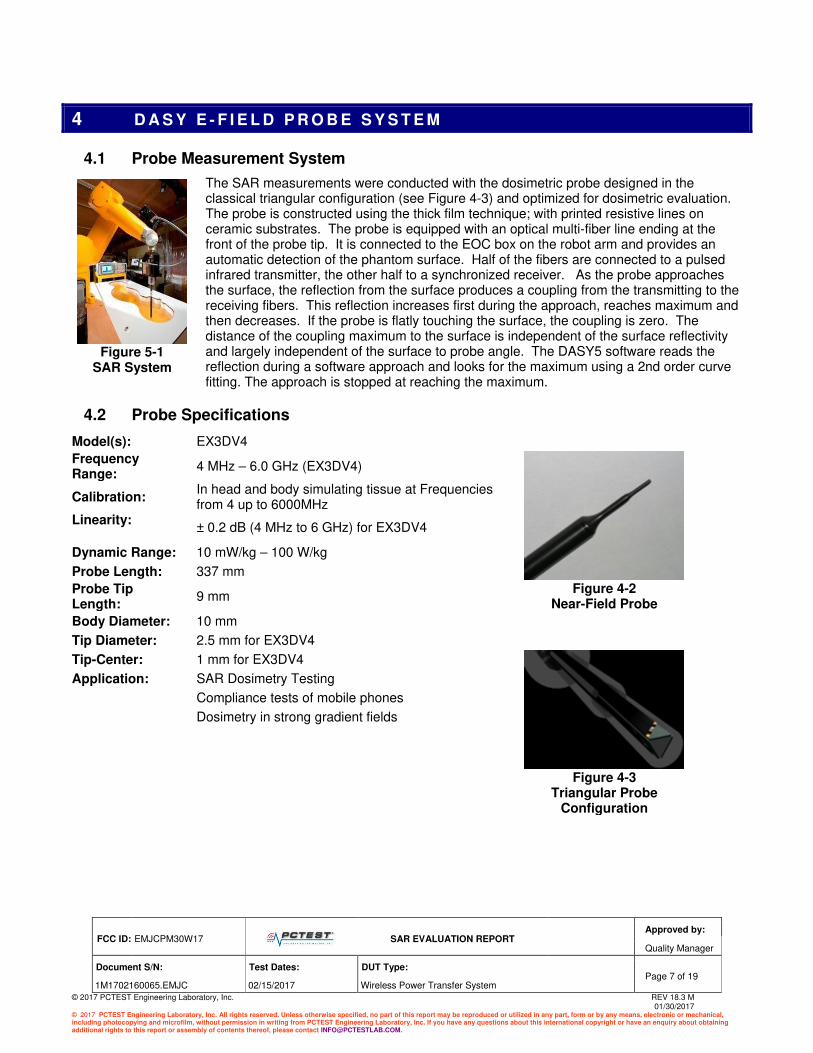
The SAR measurements were conducted with the dosimetric probe designed in the classical triangular configuration (see Figure 4-3) and optimized for dosimetric evaluation. The probe is constructed using the thick film technique; with printed resistive lines on ceramic substrates. The probe is equipped with an optical multi-fiber line ending at the front of the probe tip. It is connected to the EOC box on the robot arm and provides an automatic detection of the phantom surface. Half of the fibers are connected to a pulsed infrared transmitter, the other half to a synchronized receiver. As the probe approaches the surface, the reflection from the surface produces a coupling from the transmitting to the receiving fibers. This reflection increases first during the approach, reaches maximum and then decreases. If the probe is flatly touching the surface, the coupling is zero. The distance of the coupling maximum to the surface is independent of the surface reflectivity and largely independent of the surface to probe angle. The DASY5 software reads the reflection during a software approach and looks for the maximum using a 2nd order curve fitting. The approach is stopped at reaching the maximum.
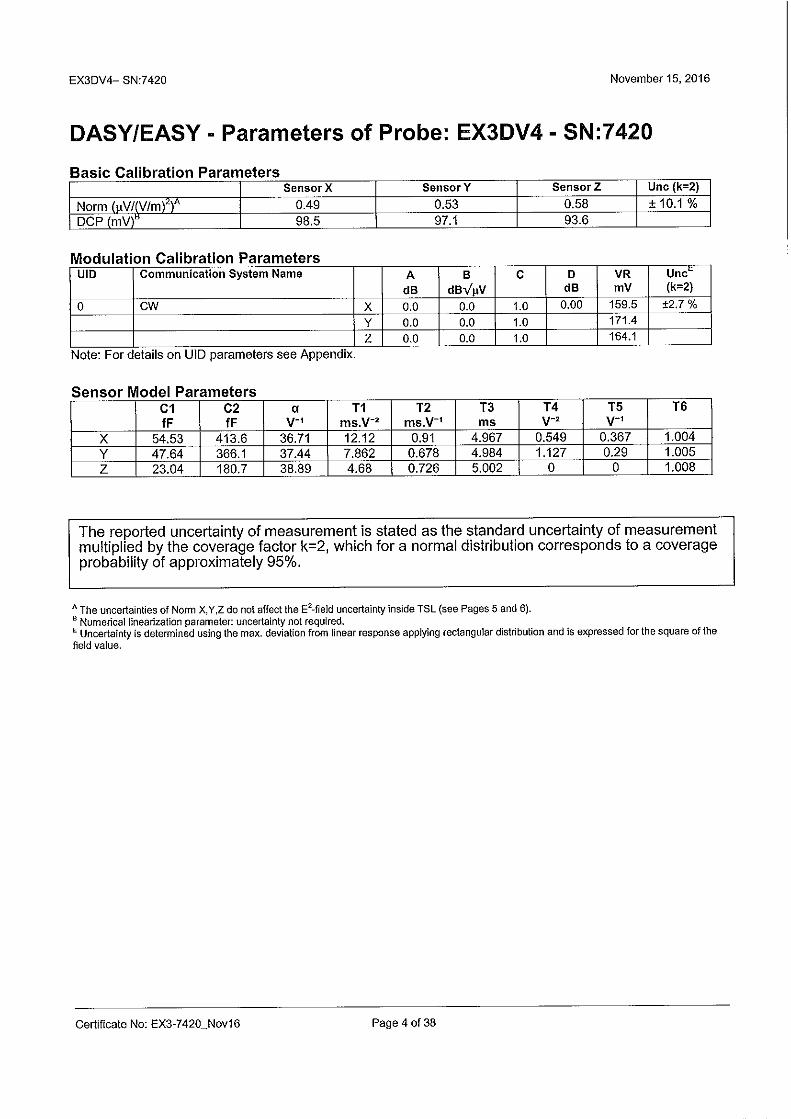
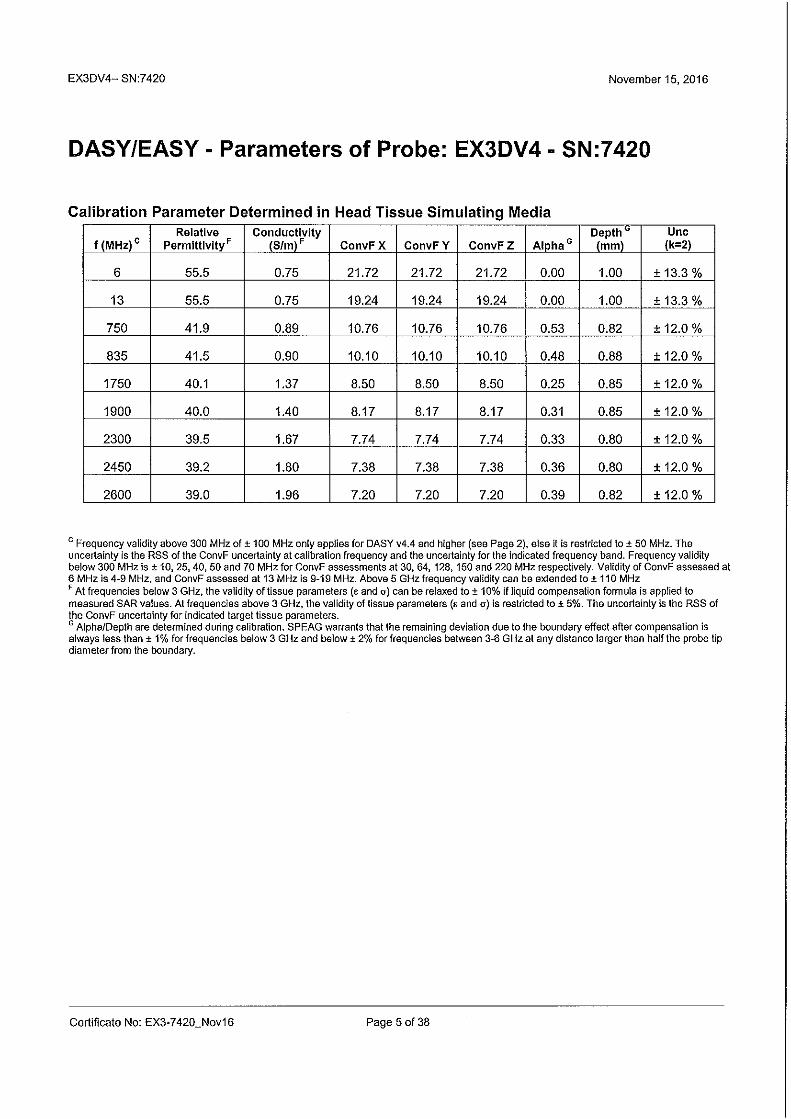
4.2 Probe Specifications
Model(s): EX3DV4
Frequency Range:
4 MHz – 6.0 GHz (EX3DV4)
Figure 4-2
Near-Field Probe
Calibration: In head and body simulating tissue at Frequencies from 4 up to 6000MHz
Linearity:
± 0.2 dB (4 MHz to 6 GHz) for EX3DV4
Dynamic Range: 10 mW/kg – 100 W/kg
Probe Length: 337 mm
Probe Tip Length:
9 mm
Body Diameter: 10 mm
Tip Diameter: 2.5 mm for EX3DV4
Tip-Center: 1 mm for EX3DV4
Figure 4-3
Triangular Probe Configuration
Application: SAR Dosimetry Testing
Compliance tests of mobile phones
Dosimetry in strong gradient fields
Figure 5-1
SAR System

FCC ID: EMJCPM30W17
SAR EVALUATION REPORT Approved by:
Quality Manager
Document S/N: Test Dates: DUT Type: Page 8 of 19
1M1702160065.EMJC 02/15/2017 Wireless Power Transfer System
© 2017 PCTEST Engineering Laboratory, Inc. REV 18.3 M 01/30/2017 © 2017 PCTEST Engineering Laboratory, Inc. All rights reserved. Unless otherwise specified, no part of this report may be reproduced or utilized in any part, form or by any means, electronic or mechanical, including photocopying and microfilm, without permission in writing from PCTEST Engineering Laboratory, Inc. If you have any questions about this international copyright or have an enquiry about obtaining additional rights to this report or assembly of contents thereof, please contact [email protected].
5 D O S I M E T R I C A S S E S S M E N T
5.1 Measurement Procedure
The evaluation was performed using the following procedure compliant to FCC KDB Publication 865664 D01v01r04 and IEEE 1528-2013:
1. The SAR distribution at the exposed side of the head or body was measured at a distance no greater than 5.0 mm from the inner surface of the shell. The area covered the entire dimension of the device-head and body interface and the horizontal grid resolution was determined per FCC KDB Publication 865664 D01v01r04 (See Table 5-1) and IEEE 1528-2013.
2. The point SAR measurement was taken at the maximum SAR region determined from Step 1 to enable the monitoring of SAR fluctuations/drifts during the 1g/10g cube evaluation. SAR at this fixed point was measured and used as a reference value.
3. Based on the area scan data, the peak of the region with maximum SAR was determined by spline interpolation. Around this point, a volume was assessed according to the measurement resolution and volume size requirements of FCC KDB Publication 865664 D01v01r04 (See Table 5-1) and IEEE 1528-2013. On the basis of this data set, the spatial peak SAR value was evaluated with the following procedure (see references or the DASY manual online for more details):
a. SAR values at the inner surface of the phantom are extrapolated from the measured values along the line away from the surface with spacing no greater than that in Table 5-1. The extrapolation was based on a least-squares algorithm. A polynomial of the fourth order was calculated through the points in the z-axis (normal to the phantom shell).
b. After the maximum interpolated values were calculated between the points in the cube, the SAR was averaged over the spatial volume (1g or 10g) using a 3D-Spline interpolation algorithm. The 3D-spline is composed of three one-dimensional splines with the “Not a knot” condition (in x, y, and z directions). The volume was then integrated with the trapezoidal algorithm. One thousand points (10 x 10 x 10) were obtained through interpolation, in order to calculate the averaged SAR.
c. All neighboring volumes were evaluated until no neighboring volume with a higher average value was found.
4. The SAR reference value, at the same location as step 2, was re-measured after the zoom scan was complete to calculate the SAR drift. If the drift deviated by more than 5%, the SAR test and drift measurements were repeated.
Table 5-1 Area and Zoom Scan Resolutions per FCC KDB Publication 865664 D01v01r04*
*Also compliant to IEEE 1528-2013 Table 6
Uniform Grid
∆zzoom(n) ∆zzoom(1)* ∆zzoom(n>1)*
≤ 2 GHz ≤ 15 ≤ 8 ≤ 5 ≤ 4 ≤ 1.5*∆zzoom(n-1) ≥ 302-3 GHz ≤ 12 ≤ 5 ≤ 5 ≤ 4 ≤ 1.5*∆zzoom(n-1) ≥ 303-4 GHz ≤ 12 ≤ 5 ≤ 4 ≤ 3 ≤ 1.5*∆zzoom(n-1) ≥ 284-5 GHz ≤ 10 ≤ 4 ≤ 3 ≤ 2.5 ≤ 1.5*∆zzoom(n-1) ≥ 255-6 GHz ≤ 10 ≤ 4 ≤ 2 ≤ 2 ≤ 1.5*∆zzoom(n-1) ≥ 22
Minimum Zoom Scan
Volume (mm)
(x,y,z)
Maximum Zoom Scan Spatial
Resolution (mm)
Graded GridFrequency
Maximum Area Scan
Resolution (mm)
(∆xarea, ∆yarea)
Maximum Zoom Scan
Resolution (mm)
(∆xzoom, ∆yzoom)
Figure 5-1 Sample SAR Area
Scan
FCC ID: EMJCPM30W17
SAR EVALUATION REPORT Approved by:
Quality Manager
Document S/N: Test Dates: DUT Type: Page 9 of 19
1M1702160065.EMJC 02/15/2017 Wireless Power Transfer System
© 2017 PCTEST Engineering Laboratory, Inc. REV 18.3 M 01/30/2017 © 2017 PCTEST Engineering Laboratory, Inc. All rights reserved. Unless otherwise specified, no part of this report may be reproduced or utilized in any part, form or by any means, electronic or mechanical, including photocopying and microfilm, without permission in writing from PCTEST Engineering Laboratory, Inc. If you have any questions about this international copyright or have an enquiry about obtaining additional rights to this report or assembly of contents thereof, please contact [email protected].
6 T E S T C O N F I G U R A T I O N P O S I T I O N S
6.1 Device Holder
The device holder is made out of low-loss POM material having the following dielectric parameters: relative permittivity ε = 3 and loss tangent δ = 0.02.
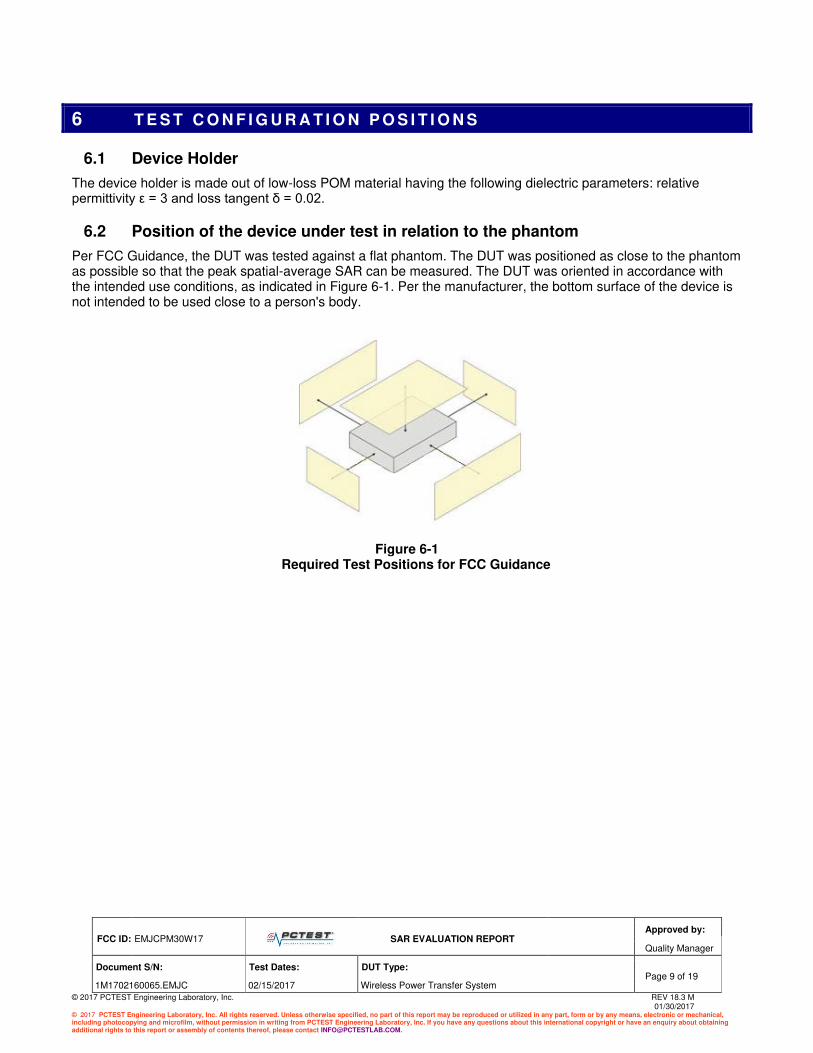
6.2 Position of the device under test in relation to the phantom
Per FCC Guidance, the DUT was tested against a flat phantom. The DUT was positioned as close to the phantom as possible so that the peak spatial-average SAR can be measured. The DUT was oriented in accordance with the intended use conditions, as indicated in Figure 6-1. Per the manufacturer, the bottom surface of the device is not intended to be used close to a person's body.
Figure 6-1 Required Test Positions for FCC Guidance

FCC ID: EMJCPM30W17
SAR EVALUATION REPORT Approved by:
Quality Manager
Document S/N: Test Dates: DUT Type: Page 10 of 19
1M1702160065.EMJC 02/15/2017 Wireless Power Transfer System
© 2017 PCTEST Engineering Laboratory, Inc. REV 18.3 M 01/30/2017 © 2017 PCTEST Engineering Laboratory, Inc. All rights reserved. Unless otherwise specified, no part of this report may be reproduced or utilized in any part, form or by any means, electronic or mechanical, including photocopying and microfilm, without permission in writing from PCTEST Engineering Laboratory, Inc. If you have any questions about this international copyright or have an enquiry about obtaining additional rights to this report or assembly of contents thereof, please contact [email protected].
7 R F E X P O S U R E L I M I T S
7.1 Uncontrolled Environment
UNCONTROLLED ENVIRONMENTS are defined as locations where there is the exposure of individuals who have no knowledge or control of their exposure. The general population/uncontrolled exposure limits are applicable to situations in which the general public may be exposed or in which persons who are exposed as a consequence of their employment may not be made fully aware of the potential for exposure or cannot exercise control over their exposure. Members of the general public would come under this category when exposure is not employment-related; for example, in the case of a wireless transmitter that exposes persons in its vicinity.
7.2 Controlled Environment
CONTROLLED ENVIRONMENTS are defined as locations where there is exposure that may be incurred by persons who are aware of the potential for exposure, (i.e. as a result of employment or occupation). In general, occupational/controlled exposure limits are applicable to situations in which persons are exposed as a consequence of their employment, who have been made fully aware of the potential for exposure and can exercise control over their exposure. This exposure category is also applicable when the exposure is of a transient nature due to incidental passage through a location where the exposure levels may be higher than the general population/uncontrolled limits, but the exposed person is fully aware of the potential for exposure and can exercise control over his or her exposure by leaving the area or by some other appropriate means.
Table 7-1 SAR Human Exposure Specified in ANSI/IEEE C95.1-1992 and Health Canada Safety Code 6
1. The Spatial Peak value of the SAR averaged over any 1 gram of tissue (defined as a tissue volume in the shape of a cube) and over the appropriate averaging time.
2. The Spatial Average value of the SAR averaged over the whole body. 3. The Spatial Peak value of the SAR averaged over any 10 grams of tissue (defined as a tissue volume in the shape of a cube) and
over the appropriate averaging time.

FCC ID: EMJCPM30W17
SAR EVALUATION REPORT Approved by:
Quality Manager
Document S/N: Test Dates: DUT Type: Page 11 of 19
1M1702160065.EMJC 02/15/2017 Wireless Power Transfer System
© 2017 PCTEST Engineering Laboratory, Inc. REV 18.3 M 01/30/2017 © 2017 PCTEST Engineering Laboratory, Inc. All rights reserved. Unless otherwise specified, no part of this report may be reproduced or utilized in any part, form or by any means, electronic or mechanical, including photocopying and microfilm, without permission in writing from PCTEST Engineering Laboratory, Inc. If you have any questions about this international copyright or have an enquiry about obtaining additional rights to this report or assembly of contents thereof, please contact [email protected].
8 S Y S T E M V E R I F I C A T I O N
8.1 Tissue Verification
Table 8-1 Measured Tissue Properties
The above measured tissue parameters were used in the DASY software. The DASY software was used to perform interpolation to determine the dielectric parameters at the SAR test device frequencies (per KDB Publication 865664 D01v01r04 and IEEE 1528-2013 6.6.1.2). The tissue parameters listed in the SAR test plots may slightly differ from the table above due to significant digit rounding in the software. Per the April 2016 TCB Workshop Slides, the desired average muscle dielectric parameters are ɛR = 211 and σ = 0.63 S/m at 6.78 MHz. However, numerical simulation results have determined that SAR is not sensitive to ɛR at 6.78 MHz for ɛR = 50~300 and σ = 0.63 S/m. Therefore, the IEC 30 MHz target values were used for the evaluation.
Calibrated for
Tests Performed
on:
Tissue
Type
Tissue Temp During
Calibration (˚C)
Measured
Frequency
(MHz)
Measured
Conductivity,
σ (S/m)
Measured
Dielectric
Constant, ε
TARGET
Conductivity,
σ (S/m)
TARGET
Dielectric
Constant, ε% dev σ % dev ε
6 0.717 57.517 0.750 55.500 -4.40% 3.63%
7 0.717 56.210 0.750 55.500 -4.40% 1.28%6 MHz2/15/2017 21.8
FCC ID: EMJCPM30W17
SAR EVALUATION REPORT Approved by:
Quality Manager
Document S/N: Test Dates: DUT Type: Page 12 of 19
1M1702160065.EMJC 02/15/2017 Wireless Power Transfer System
© 2017 PCTEST Engineering Laboratory, Inc. REV 18.3 M 01/30/2017 © 2017 PCTEST Engineering Laboratory, Inc. All rights reserved. Unless otherwise specified, no part of this report may be reproduced or utilized in any part, form or by any means, electronic or mechanical, including photocopying and microfilm, without permission in writing from PCTEST Engineering Laboratory, Inc. If you have any questions about this international copyright or have an enquiry about obtaining additional rights to this report or assembly of contents thereof, please contact [email protected].
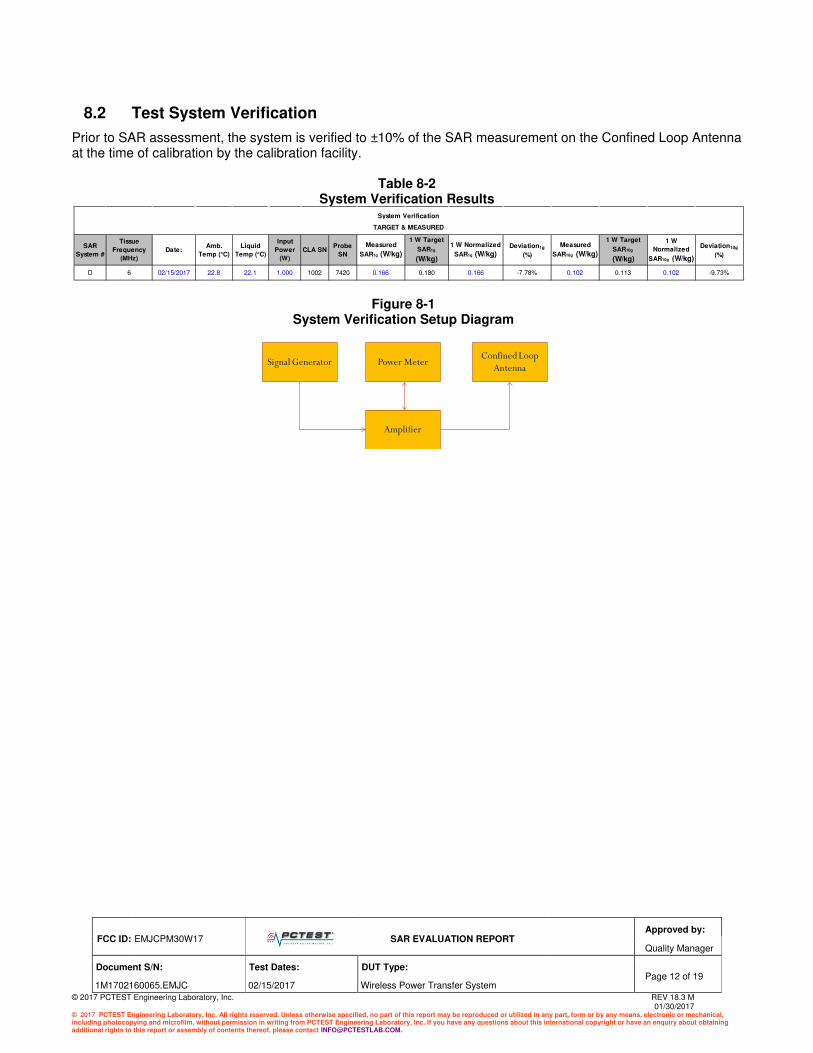
8.2 Test System Verification
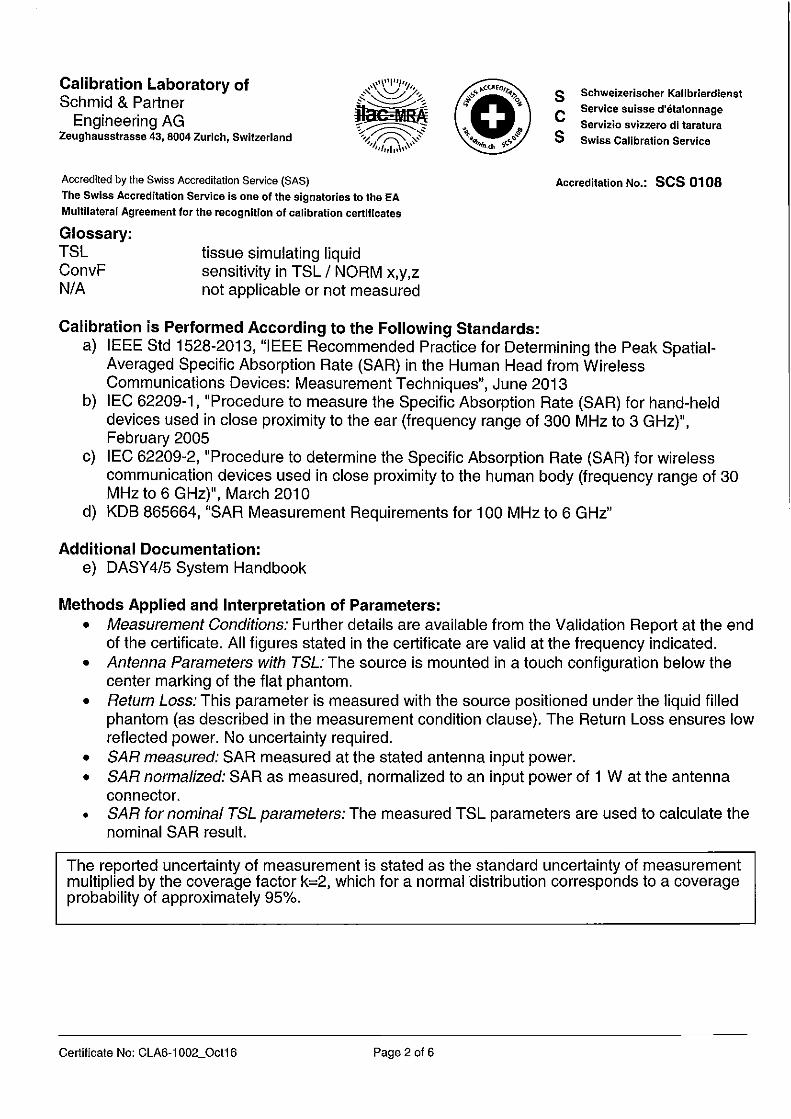
Prior to SAR assessment, the system is verified to ±10% of the SAR measurement on the Confined Loop Antenna at the time of calibration by the calibration facility.
Table 8-2 System Verification Results
Figure 8-1 System Verification Setup Diagram
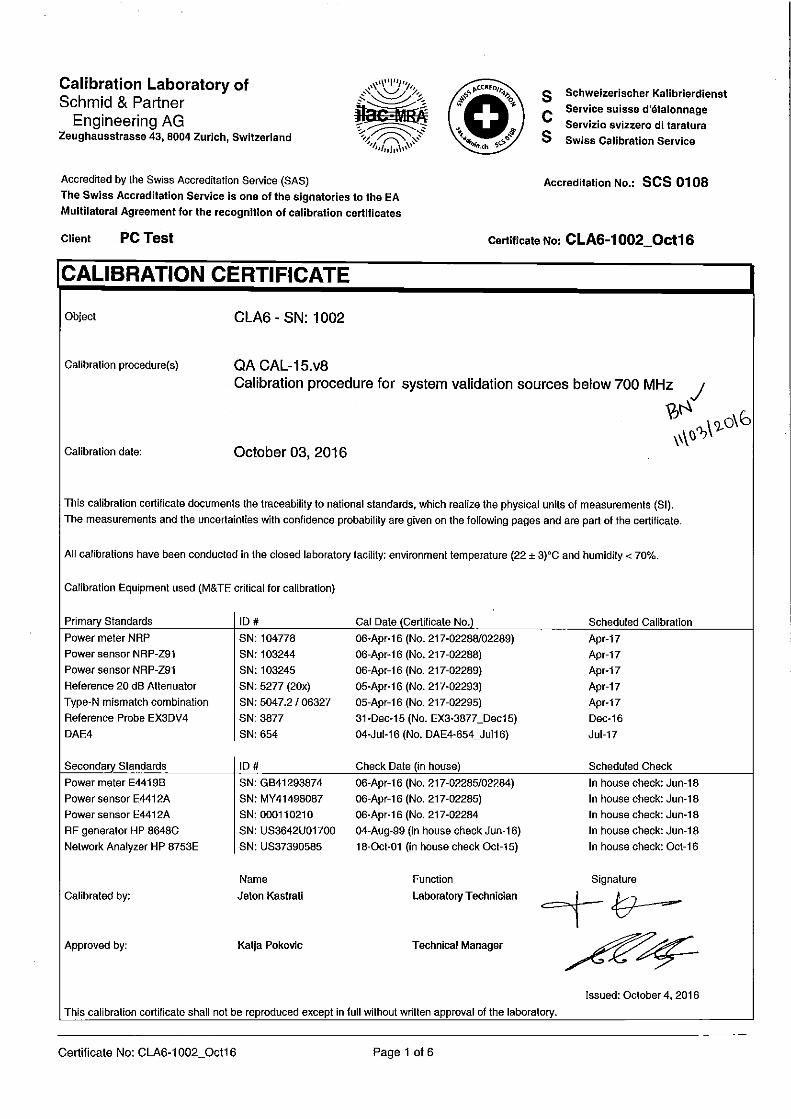
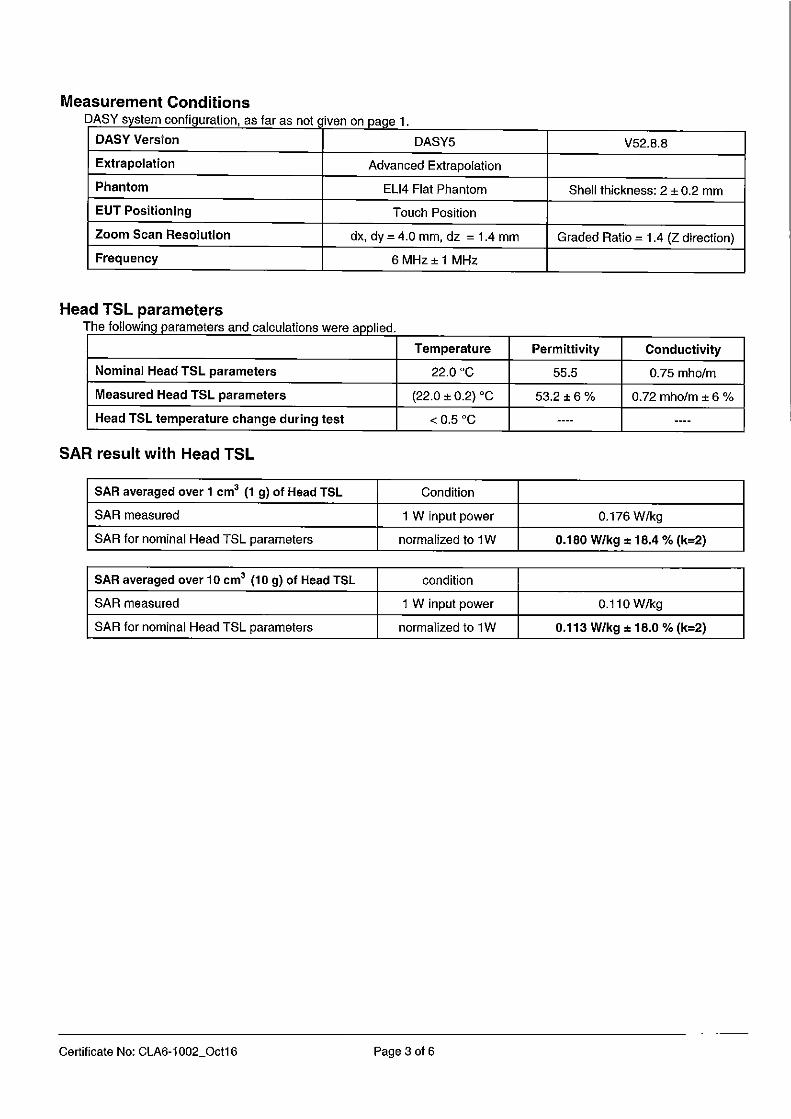
D 6 02/15/2017 22.8 22.1 1.000 1002 7420 0.166 0.180 0.166 -7.78% 0.102 0.113 0.102 -9.73%
1 W Normalized
SAR1g (W/kg)CLA SN
Probe
SNDate:
Amb.
Temp (°C)
Liquid
Temp (°C)
Measured
SAR10g (W/kg)
Input
Power
(W)
Measured
SAR1g (W/kg)Deviation1g
(%)
1 W Target
SAR1g
(W/kg)
System Verification
TARGET & MEASURED
1 W Target
SAR10g
(W/kg)
1 W
Normalized
SAR10g (W/kg)
Deviation10g
(%)
SAR
System #
Tissue
Frequency
(MHz)
Signal Generator
Amplifier
Power MeterConfined Loop
Antenna
FCC ID: EMJCPM30W17
SAR EVALUATION REPORT Approved by:
Quality Manager
Document S/N: Test Dates: DUT Type: Page 13 of 19
1M1702160065.EMJC 02/15/2017 Wireless Power Transfer System
© 2017 PCTEST Engineering Laboratory, Inc. REV 18.3 M 01/30/2017 © 2017 PCTEST Engineering Laboratory, Inc. All rights reserved. Unless otherwise specified, no part of this report may be reproduced or utilized in any part, form or by any means, electronic or mechanical, including photocopying and microfilm, without permission in writing from PCTEST Engineering Laboratory, Inc. If you have any questions about this international copyright or have an enquiry about obtaining additional rights to this report or assembly of contents thereof, please contact [email protected].
9 S A R D A T A S U M M A R Y
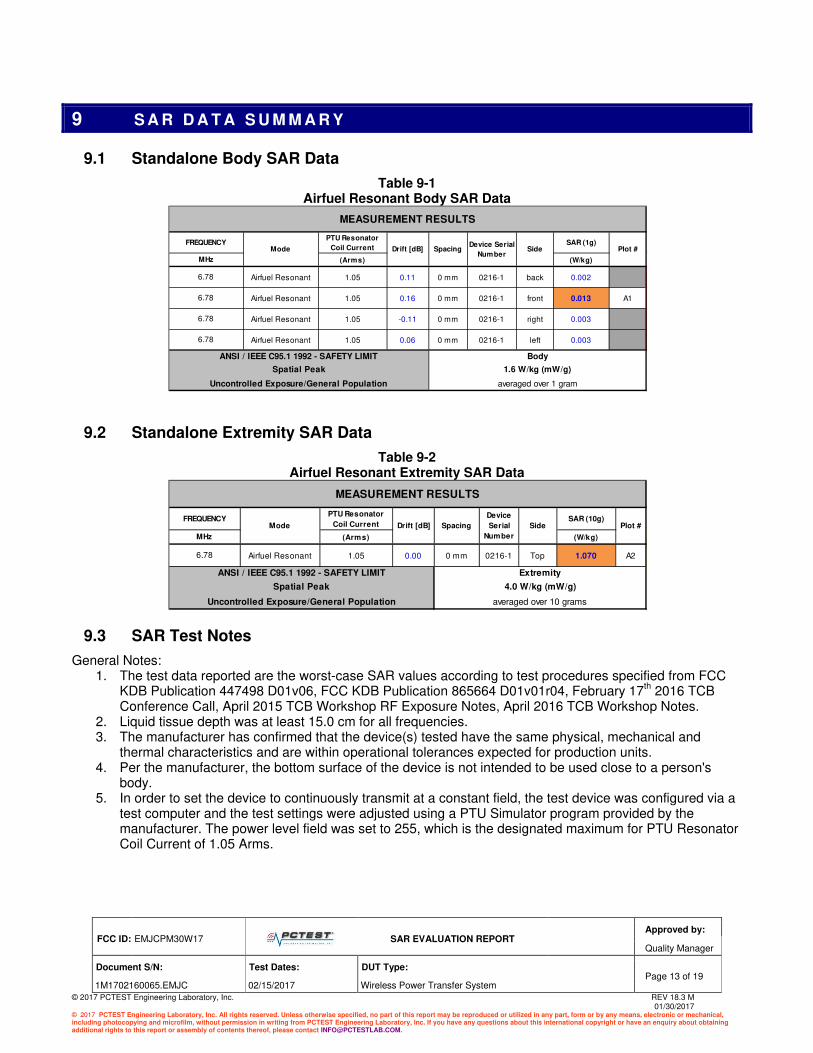
9.1 Standalone Body SAR Data
Table 9-1 Airfuel Resonant Body SAR Data
9.2 Standalone Extremity SAR Data
Table 9-2 Airfuel Resonant Extremity SAR Data
9.3 SAR Test Notes
General Notes: 1. The test data reported are the worst-case SAR values according to test procedures specified from FCC
KDB Publication 447498 D01v06, FCC KDB Publication 865664 D01v01r04, February 17th 2016 TCB
Conference Call, April 2015 TCB Workshop RF Exposure Notes, April 2016 TCB Workshop Notes. 2. Liquid tissue depth was at least 15.0 cm for all frequencies. 3. The manufacturer has confirmed that the device(s) tested have the same physical, mechanical and
thermal characteristics and are within operational tolerances expected for production units. 4. Per the manufacturer, the bottom surface of the device is not intended to be used close to a person's
body. 5. In order to set the device to continuously transmit at a constant field, the test device was configured via a
test computer and the test settings were adjusted using a PTU Simulator program provided by the manufacturer. The power level field was set to 255, which is the designated maximum for PTU Resonator Coil Current of 1.05 Arms.
PTU Resonator
Coil CurrentSAR (1g)
(Arms) (W/kg)
Airfuel Resonant 1.05 0.11 0 mm 0216-1 back 0.002
Airfuel Resonant 1.05 0.16 0 mm 0216-1 front 0.013 A1
Airfuel Resonant 1.05 -0.11 0 mm 0216-1 right 0.003
Airfuel Resonant 1.05 0.06 0 mm 0216-1 left 0.003
6.78
6.78
6.78
6.78
Device Serial
Number
FREQUENCYMode
MHz
averaged over 1 gram
Plot #
MEASUREMENT RESULTS
Body
1.6 W/kg (mW/g)
Drift [dB] Side
ANSI / IEEE C95.1 1992 - SAFETY LIMIT
Spatial Peak
Uncontrolled Exposure/General Population
Spacing
PTU Resonator
Coil CurrentSAR (10g)
(Arms) (W/kg)
Airfuel Resonant 1.05 0.00 0 mm 0216-1 Top 1.070 A26.78
MHz
MEASUREMENT RESULTS
FREQUENCYMode
Spatial Peak 4.0 W/kg (mW/g)
Uncontrolled Exposure/General Population averaged over 10 grams
Side Plot #
ANSI / IEEE C95.1 1992 - SAFETY LIMIT Extremity
Drift [dB] Spacing
Device
Serial
Number
FCC ID: EMJCPM30W17
SAR EVALUATION REPORT Approved by:
Quality Manager
Document S/N: Test Dates: DUT Type: Page 14 of 19
1M1702160065.EMJC 02/15/2017 Wireless Power Transfer System
© 2017 PCTEST Engineering Laboratory, Inc. REV 18.3 M 01/30/2017 © 2017 PCTEST Engineering Laboratory, Inc. All rights reserved. Unless otherwise specified, no part of this report may be reproduced or utilized in any part, form or by any means, electronic or mechanical, including photocopying and microfilm, without permission in writing from PCTEST Engineering Laboratory, Inc. If you have any questions about this international copyright or have an enquiry about obtaining additional rights to this report or assembly of contents thereof, please contact [email protected].
10 S A R M E A S U R E M E N T V A R I A B I L I T Y
10.1 Measurement Variability
Per FCC KDB Publication 865664 D01v01, SAR measurement variability was not assessed for any frequency band since all measured SAR values were less than 0.80 W/kg (1g) and 2.0 W/kg (10g).
10.2 Measurement Uncertainty
The measured 1g SAR was <1.5 W/kg and measured 10g SAR was <3.75 W/kg for all frequency bands. Therefore, per KDB Publication 865664 D01v01r04, the extended measurement uncertainty analysis per IEEE 1528-2013 was not required.

FCC ID: EMJCPM30W17
SAR EVALUATION REPORT Approved by:
Quality Manager
Document S/N: Test Dates: DUT Type: Page 15 of 19
1M1702160065.EMJC 02/15/2017 Wireless Power Transfer System
© 2017 PCTEST Engineering Laboratory, Inc. REV 18.3 M 01/30/2017 © 2017 PCTEST Engineering Laboratory, Inc. All rights reserved. Unless otherwise specified, no part of this report may be reproduced or utilized in any part, form or by any means, electronic or mechanical, including photocopying and microfilm, without permission in writing from PCTEST Engineering Laboratory, Inc. If you have any questions about this international copyright or have an enquiry about obtaining additional rights to this report or assembly of contents thereof, please contact [email protected].
11 E Q U I P M E N T L I S T
Note: CBT (Calibrated Before Testing). Prior to testing, the measurement paths containing a cable, amplifier, attenuator, coupler or filter were connected to a calibrated source (i.e. a signal generator) to determine the losses of the measurement path. The power meter offset was then adjusted to compensate for the measurement system losses. This level offset is stored within the power meter before measurements are made. This calibration verification procedure applies to the system verification and output power measurements. The calibrated reading is then taken directly from the power meter after compensation of the losses for all final power measurements.
Manufacturer Model Description Cal Date Cal Interval Cal Due Serial Number
Agilent 8594A (9kHz-2.9GHz) Spectrum Analyzer N/A N/A N/A 3051A00187 Narda 4772-3 Attenuator (3dB) CBT N/A CBT 9406SPEAG CLA-6 Confined Loop Antenna 10/3/2016 Annual 10/3/2017 1002SPEAG DAE4 Dasy Data Acquisition Electronics 1/16/2017 Annual 1/16/2018 1466
Mini-Circuits BW-N20W5+ DC to 18 GHz Precision Fixed 20 dB Attenuator CBT N/A CBT N/A
Mini-Circuits NLP-1200+ Low Pass Filter DC to 1000 MHz CBT N/A CBT N/A
Mini-Circuits NLP-2950+ Low Pass Filter DC to 2700 MHz CBT N/A CBT N/A
Mini-Circuits PWR-SENS-4RMS USB Power Sensor 3/4/2016 Annual 3/4/2017 11210140001Mini-Circuits PWR-SENS-4RMS USB Power Sensor 3/4/2016 Annual 3/4/2017 11210140001Mini-Circuits TVA-11-422 RF Power Amp CBT N/A CBT QA1303002
Agilent N9020A MXA Signal Analyzer 10/28/2016 Annual 10/28/2017 US46470561 Agilent N5182A MXG Vector Signal Generator 10/27/2016 Annual 10/27/2017 MY47420603 SPEAG DAK-12 Dielectric Assessment Kit 3/1/2016 Annual 3/1/2017 1102
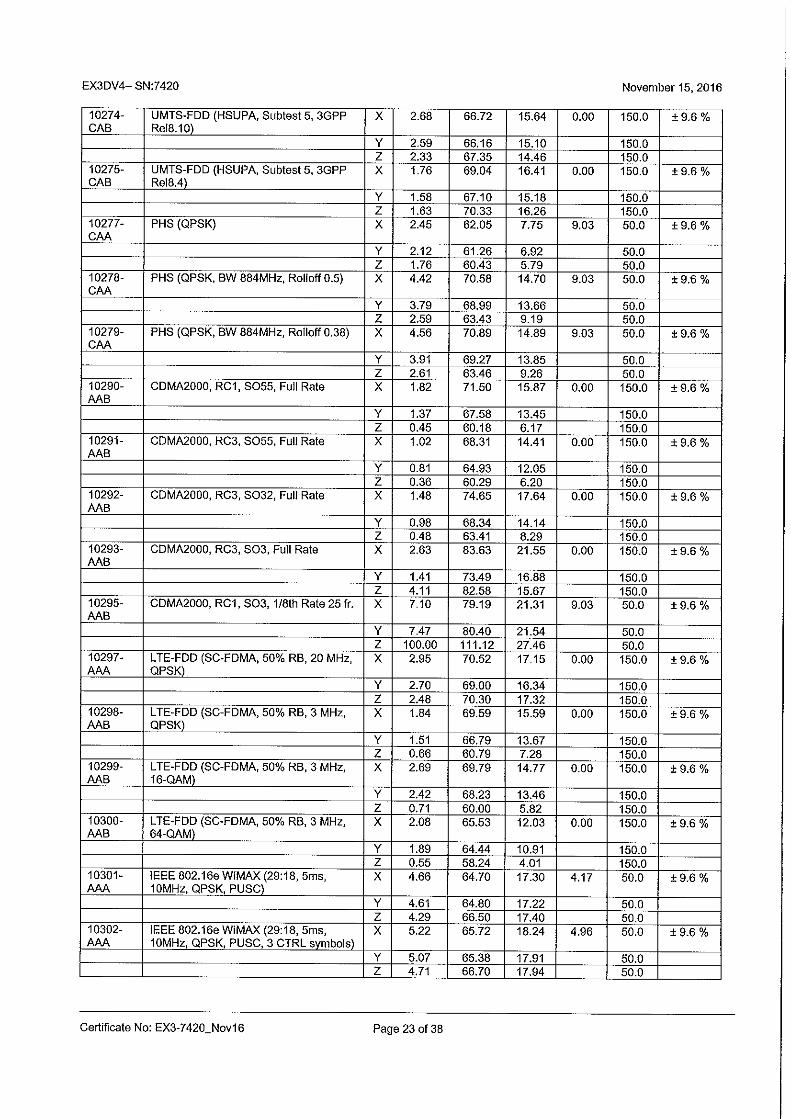
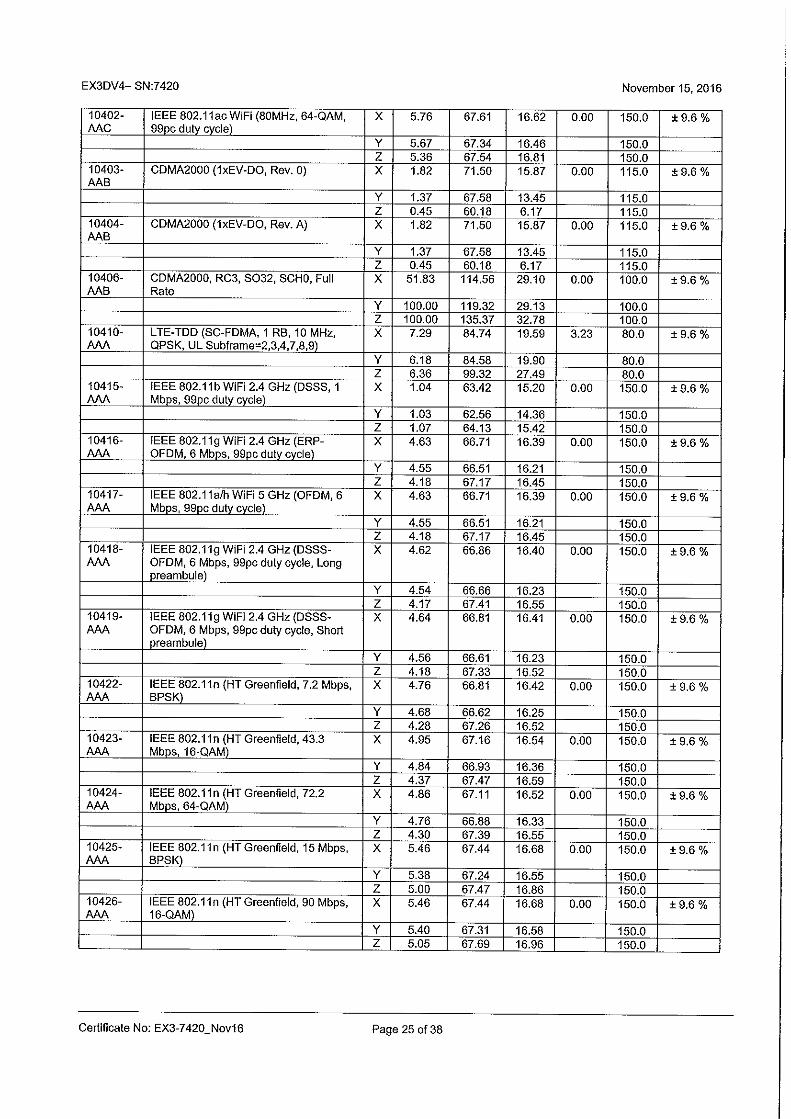
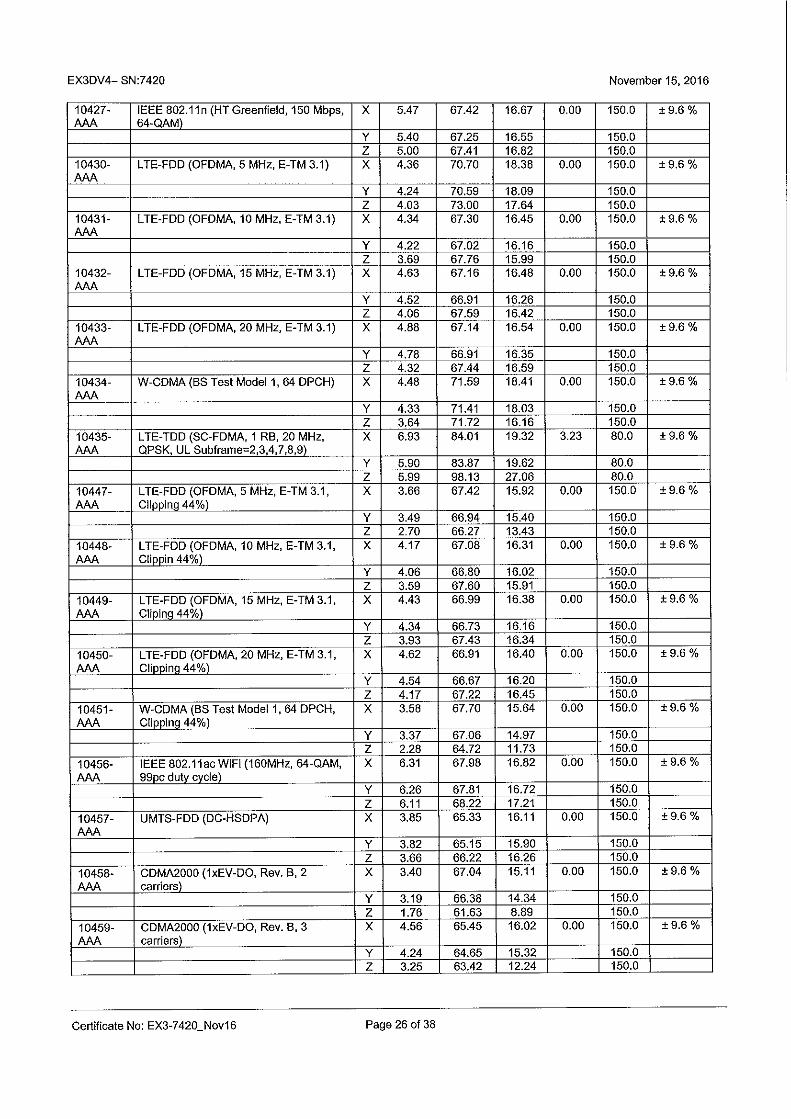
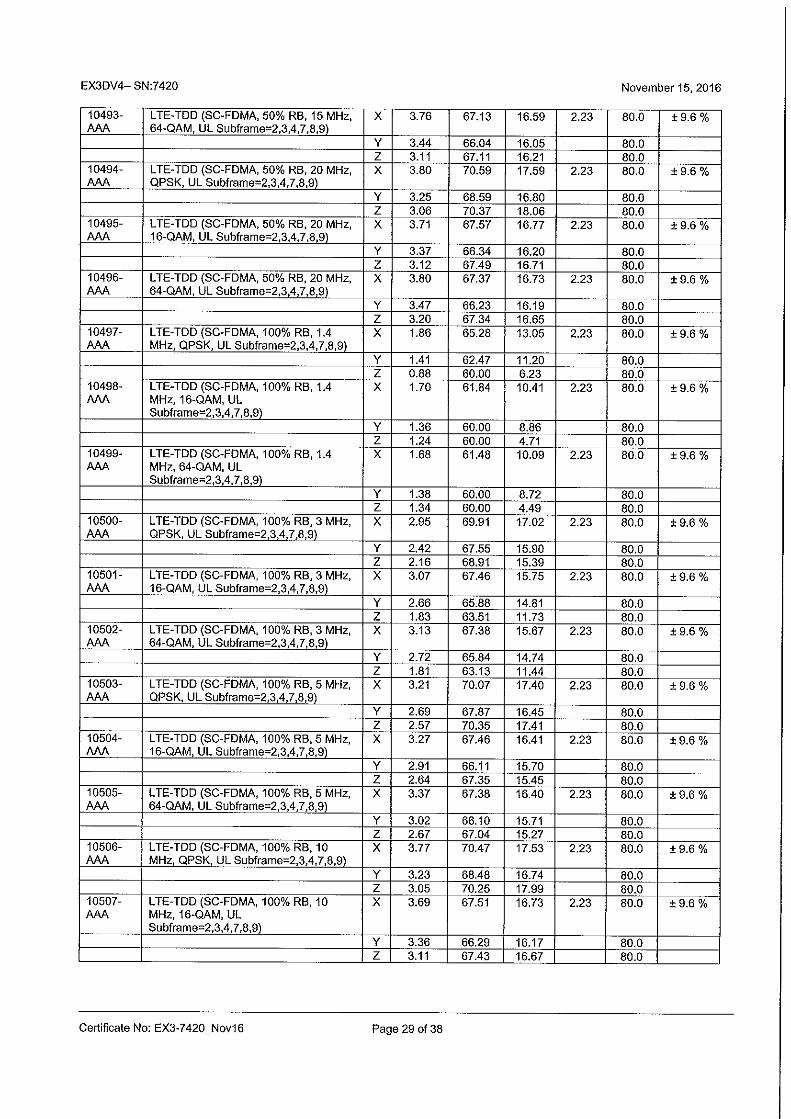
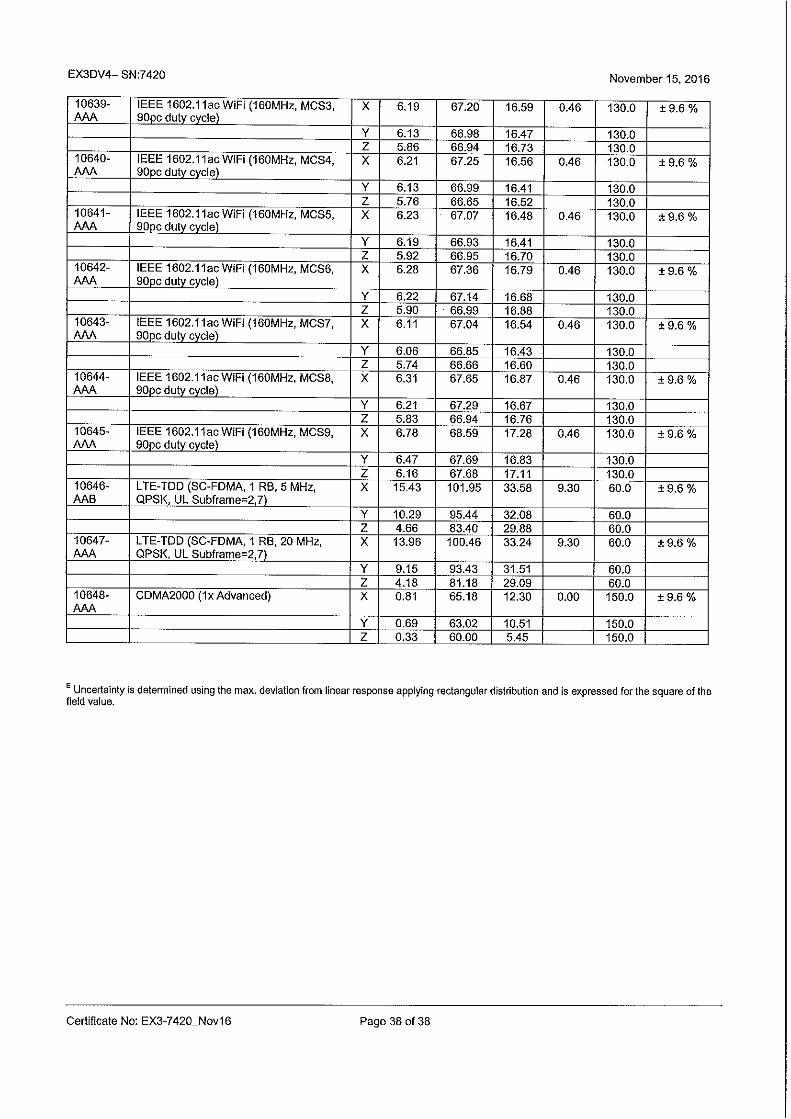
Mini-Circuits BW-N20W5 Power Attenuator CBT N/A CBT 1226SPEAG EX3DV4 SAR Probe 11/15/2016 Annual 11/15/2017 7420Agilent 8753ES S-Parameter Vector Network Analyzer 8/19/2016 Annual 8/19/2017 MY40003841
Pasternack NC-100 Torque Wrench 5/21/2015 Biennial 5/21/2017 N/A
Control Company 4352 Ultra Long Stem Thermometer 3/8/2016 Biennial 3/8/2018 160261701
FCC ID: EMJCPM30W17
SAR EVALUATION REPORT Approved by:
Quality Manager
Document S/N: Test Dates: DUT Type: Page 16 of 19
1M1702160065.EMJC 02/15/2017 Wireless Power Transfer System
© 2017 PCTEST Engineering Laboratory, Inc. REV 18.3 M 01/30/2017 © 2017 PCTEST Engineering Laboratory, Inc. All rights reserved. Unless otherwise specified, no part of this report may be reproduced or utilized in any part, form or by any means, electronic or mechanical, including photocopying and microfilm, without permission in writing from PCTEST Engineering Laboratory, Inc. If you have any questions about this international copyright or have an enquiry about obtaining additional rights to this report or assembly of contents thereof, please contact [email protected].
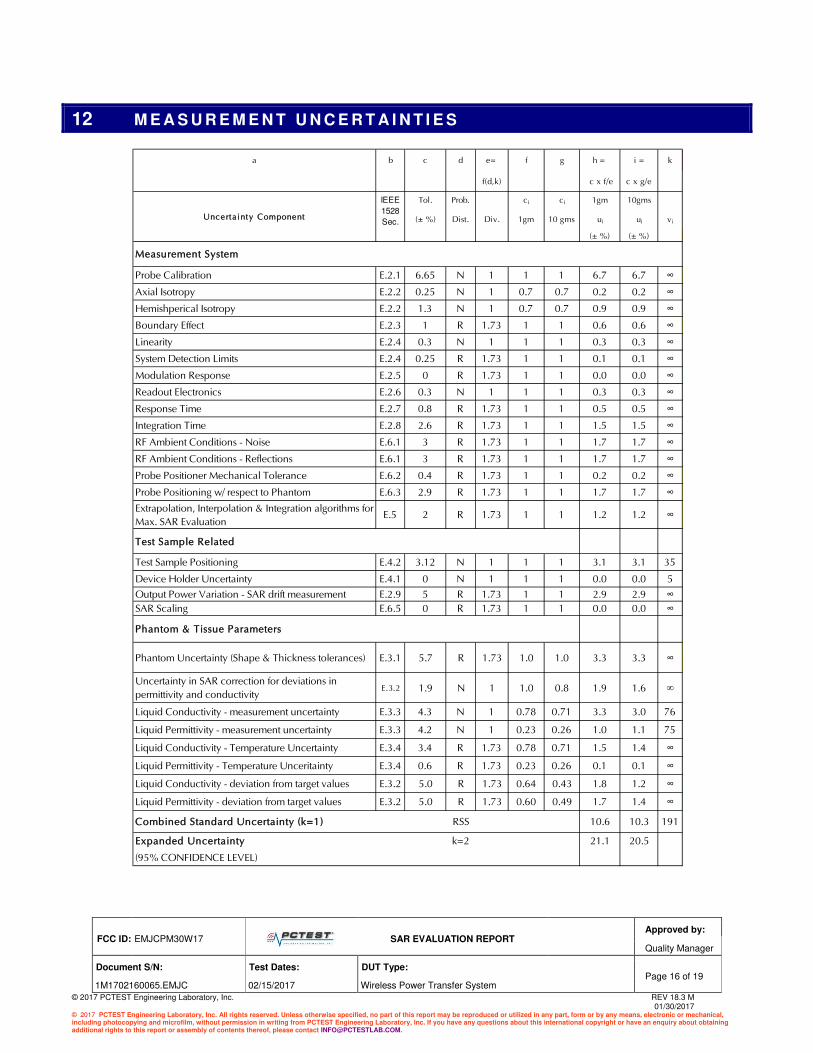
12 M E A S U R E M E N T U N C E R T A I N T I E S
a b c d e= f g h = i = k
f(d,k) c x f/e c x g/e
Tol. Prob. ci ci 1gm 10gms
(± %) Dist. Div. 1gm 10 gms ui ui vi
(± %) (± %)
Probe Calibration E.2.1 6.65 N 1 1 1 6.7 6.7 ∞Axial Isotropy E.2.2 0.25 N 1 0.7 0.7 0.2 0.2 ∞Hemishperical Isotropy E.2.2 1.3 N 1 0.7 0.7 0.9 0.9 ∞Boundary Effect E.2.3 1 R 1.73 1 1 0.6 0.6 ∞Linearity E.2.4 0.3 N 1 1 1 0.3 0.3 ∞System Detection Limits E.2.4 0.25 R 1.73 1 1 0.1 0.1 ∞Modulation Response E.2.5 0 R 1.73 1 1 0.0 0.0 ∞Readout Electronics E.2.6 0.3 N 1 1 1 0.3 0.3 ∞Response Time E.2.7 0.8 R 1.73 1 1 0.5 0.5 ∞Integration Time E.2.8 2.6 R 1.73 1 1 1.5 1.5 ∞RF Ambient Conditions - Noise E.6.1 3 R 1.73 1 1 1.7 1.7 ∞RF Ambient Conditions - Reflections E.6.1 3 R 1.73 1 1 1.7 1.7 ∞Probe Positioner Mechanical Tolerance E.6.2 0.4 R 1.73 1 1 0.2 0.2 ∞Probe Positioning w/ respect to Phantom E.6.3 2.9 R 1.73 1 1 1.7 1.7 ∞Extrapolation, Interpolation & Integration algorithms for
Max. SAR EvaluationE.5 2 R 1.73 1 1 1.2 1.2 ∞
Test Sample Related
Test Sample Positioning E.4.2 3.12 N 1 1 1 3.1 3.1 35
Device Holder Uncertainty E.4.1 0 N 1 1 1 0.0 0.0 5
Output Power Variation - SAR drift measurement E.2.9 5 R 1.73 1 1 2.9 2.9 ∞SAR Scaling E.6.5 0 R 1.73 1 1 0.0 0.0 ∞
Phantom & Tissue Parameters
Phantom Uncertainty (Shape & Thickness tolerances) E.3.1 5.7 R 1.73 1.0 1.0 3.3 3.3 ∞
Uncertainty in SAR correction for deviations in
permittivity and conductivityE.3.2 1.9 N 1 1.0 0.8 1.9 1.6 ∞
Liquid Conductivity - measurement uncertainty E.3.3 4.3 N 1 0.78 0.71 3.3 3.0 76
Liquid Permittivity - measurement uncertainty E.3.3 4.2 N 1 0.23 0.26 1.0 1.1 75
Liquid Conductivity - Temperature Uncertainty E.3.4 3.4 R 1.73 0.78 0.71 1.5 1.4 ∞
Liquid Permittivity - Temperature Unceritainty E.3.4 0.6 R 1.73 0.23 0.26 0.1 0.1 ∞
Liquid Conductivity - deviation from target values E.3.2 5.0 R 1.73 0.64 0.43 1.8 1.2 ∞
Liquid Permittivity - deviation from target values E.3.2 5.0 R 1.73 0.60 0.49 1.7 1.4 ∞
Combined Standard Uncertainty (k=1) RSS 10.6 10.3 191
Expanded Uncertainty k=2 21.1 20.5
(95% CONFIDENCE LEVEL)
Uncerta inty Component
IEEE
1528
Sec.
Measurement System
FCC ID: EMJCPM30W17
SAR EVALUATION REPORT Approved by:
Quality Manager
Document S/N: Test Dates: DUT Type: Page 17 of 19
1M1702160065.EMJC 02/15/2017 Wireless Power Transfer System
© 2017 PCTEST Engineering Laboratory, Inc. REV 18.3 M 01/30/2017 © 2017 PCTEST Engineering Laboratory, Inc. All rights reserved. Unless otherwise specified, no part of this report may be reproduced or utilized in any part, form or by any means, electronic or mechanical, including photocopying and microfilm, without permission in writing from PCTEST Engineering Laboratory, Inc. If you have any questions about this international copyright or have an enquiry about obtaining additional rights to this report or assembly of contents thereof, please contact [email protected].
13 C O N C L U S I O N
13.1 Measurement Conclusion
The SAR evaluation indicates that the EUT complies with the RF radiation exposure limits of the FCC and Innovation, Science, and Economic Development Canada, with respect to all parameters subject to this test. These measurements were taken to simulate the RF effects of RF exposure under worst-case conditions. Precise laboratory measures were taken to assure repeatability of the tests. The results and statements relate only to the item(s) tested. Please note that the absorption and distribution of electromagnetic energy in the body are very complex phenomena that depend on the mass, shape, and size of the body, the orientation of the body with respect to the field vectors, and the electrical properties of both the body and the environment. Other variables that may play a substantial role in possible biological effects are those that characterize the environment (e.g. ambient temperature, air velocity, relative humidity, and body insulation) and those that characterize the individual (e.g. age, gender, activity level, debilitation, or disease). Because various factors may interact with one another to vary the specific biological outcome of an exposure to electromagnetic fields, any protection guide should consider maximal amplification of biological effects as a result of field-body interactions, environmental conditions, and physiological variables. [3]
FCC ID: EMJCPM30W17
SAR EVALUATION REPORT Approved by:
Quality Manager
Document S/N: Test Dates: DUT Type: Page 18 of 19
1M1702160065.EMJC 02/15/2017 Wireless Power Transfer System
© 2017 PCTEST Engineering Laboratory, Inc. REV 18.3 M 01/30/2017 © 2017 PCTEST Engineering Laboratory, Inc. All rights reserved. Unless otherwise specified, no part of this report may be reproduced or utilized in any part, form or by any means, electronic or mechanical, including photocopying and microfilm, without permission in writing from PCTEST Engineering Laboratory, Inc. If you have any questions about this international copyright or have an enquiry about obtaining additional rights to this report or assembly of contents thereof, please contact [email protected].
14 R E F E R E N C E S
[1] Federal Communications Commission, ET Docket 93-62, Guidelines for Evaluating the Environmental Effects of
Radiofrequency Radiation, Aug. 1996.
[2] ANSI/IEEE C95.1-2005, American National Standard safety levels with respect to human exposure to radio frequency electromagnetic fields, 3kHz to 300GHz, New York: IEEE, 2006.
[3] ANSI/IEEE C95.1-1992, American National Standard safety levels with respect to human exposure to radio frequency electromagnetic fields, 3kHz to 300GHz, New York: IEEE, Sept. 1992.
[4] ANSI/IEEE C95.3-2002, IEEE Recommended Practice for the Measurement of Potentially Hazardous Electromagnetic Fields - RF and Microwave, New York: IEEE, December 2002.
[5] IEEE Standards Coordinating Committee 39 –Standards Coordinating Committee 34 – IEEE Std. 1528-2013, IEEE Recommended Practice for Determining the Peak Spatial-Average Specific Absorption Rate (SAR) in the Human Head from Wireless Communications Devices: Measurement Techniques.
[6] NCRP, National Council on Radiation Protection and Measurements, Biological Effects and Exposure Criteria for RadioFrequency Electromagnetic Fields, NCRP Report No. 86, 1986. Reprinted Feb. 1995.
[7] T. Schmid, O. Egger, N. Kuster, Automated E-field scanning system for dosimetric assessments, IEEE Transaction on Microwave Theory and Techniques, vol. 44, Jan. 1996, pp. 105-113.
[8] K. Pokovic, T. Schmid, N. Kuster, Robust setup for precise calibration of E-field probes in tissue simulating liquids at mobile communications frequencies, ICECOM97, Oct. 1997, pp. 1 -124.
[9] K. Pokovic, T. Schmid, and N. Kuster, E-field Probe with improved isotropy in brain simulating liquids, Proceedings of the ELMAR, Zadar, Croatia, June 23-25, 1996, pp. 172-175.
[10] Schmid & Partner Engineering AG, Application Note: Data Storage and Evaluation, June 1998, p2.
[11] V. Hombach, K. Meier, M. Burkhardt, E. Kuhn, N. Kuster, The Dependence of EM Energy Absorption upon Human Modeling at 900 MHz, IEEE Transaction on Microwave Theory and Techniques, vol. 44 no. 10, Oct. 1996, pp. 1865-1873.
[12] N. Kuster and Q. Balzano, Energy absorption mechanism by biological bodies in the near field of dipole antennas above 300MHz, IEEE Transaction on Vehicular Technology, vol. 41, no. 1, Feb. 1992, pp. 17-23.
[13] G. Hartsgrove, A. Kraszewski, A. Surowiec, Simulated Biological Materials for Electromagnetic Radiation Absorption Studies, University of Ottawa, Bioelectromagnetics, Canada: 1987, pp. 29-36.
[14] Q. Balzano, O. Garay, T. Manning Jr., Electromagnetic Energy Exposure of Simulated Users of Portable Cellular Telephones, IEEE Transactions on Vehicular Technology, vol. 44, no.3, Aug. 1995.
[15] W. Gander, Computermathematick, Birkhaeuser, Basel, 1992.
[16] W.H. Press, S.A. Teukolsky, W.T. Vetterling, and B.P. Flannery, Numerical Recipes in C, The Art of Scientific Computing, Second edition, Cambridge University Press, 1992.
[17] N. Kuster, R. Kastle, T. Schmid, Dosimetric evaluation of mobile communications equipment with known precision, IEEE Transaction on Communications, vol. E80-B, no. 5, May 1997, pp. 645-652.
FCC ID: EMJCPM30W17
SAR EVALUATION REPORT Approved by:
Quality Manager
Document S/N: Test Dates: DUT Type: Page 19 of 19
1M1702160065.EMJC 02/15/2017 Wireless Power Transfer System
© 2017 PCTEST Engineering Laboratory, Inc. REV 18.3 M 01/30/2017 © 2017 PCTEST Engineering Laboratory, Inc. All rights reserved. Unless otherwise specified, no part of this report may be reproduced or utilized in any part, form or by any means, electronic or mechanical, including photocopying and microfilm, without permission in writing from PCTEST Engineering Laboratory, Inc. If you have any questions about this international copyright or have an enquiry about obtaining additional rights to this report or assembly of contents thereof, please contact [email protected].
[18] CENELEC CLC/SC111B, European Prestandard (prENV 50166-2), Human Exposure to Electromagnetic Fields High-frequency: 10kHz-300GHz, Jan. 1995.
[19] Prof. Dr. Niels Kuster, ETH, Eidgenössische Technische Hoschschule Zürich, Dosimetric Evaluation of the Cellular Phone.
[20] IEC 62209-1, Human exposure to radio frequency fields from hand-held and body-mounted wireless communication devices - Human models, instrumentation, and procedures - Part 1: Procedure to determine the specific absorption rate (SAR) for hand-held devices used in close proximity to the ear (frequency range of 300 MHz to 3 GHz), Feb. 2005.
[21] Innovation, Science, Economic Development Canada RSS-102 Radio Frequency Exposure Compliance of Radiocommunication Apparatus (All Frequency Bands) Issue 5, March 2015.
[22] Health Canada Safety Code 6 Limits of Human Exposure to Radio Frequency Electromagnetic Fields in the Frequency Range from 3 kHz – 300 GHz, 2015
[23] FCC SAR Test Procedures for 2G-3G Devices, Mobile Hotspot and UMPC Devices KDB Publications 941225, D01-D07
[24] SAR Measurement Guidance for IEEE 802.11 Transmitters, KDB Publication 248227 D01
[25] FCC SAR Considerations for Handsets with Multiple Transmitters and Antennas, KDB Publications 648474 D03-D04
[26] FCC SAR Evaluation Considerations for Laptop, Notebook, Netbook and Tablet Computers, FCC KDB Publication 616217 D04
[27] FCC SAR Measurement and Reporting Requirements for 100MHz – 6 GHz, KDB Publications 865664 D01-D02
[28] FCC General RF Exposure Guidance and SAR Procedures for Dongles, KDB Publication 447498, D01-D02
[29] Anexo à Resolução No. 533, de 10 de Septembro de 2009.
[30] IEC 62209-2, Human exposure to radio frequency fields from hand-held and body-mounted wireless communication devices - Human models, instrumentation, and procedures - Part 2: Procedure to determine the specific absorption rate (SAR) for wireless communication devices used in close proximity to the human body (frequency range of 30 MHz to 6 GHz), Mar. 2010.
[31] February 17th
, 2016 TCB Conference Call
[32] April 2015 TCB Workshop RF Exposure
[33] April 2016 TCB Workshop Notes
© 2017 PCTEST Engineering Laboratory, Inc.
A P P E N D I X A : S A R T E S T D A T A
A1
PCTEST ENGINEERING LABORATORY, INC.
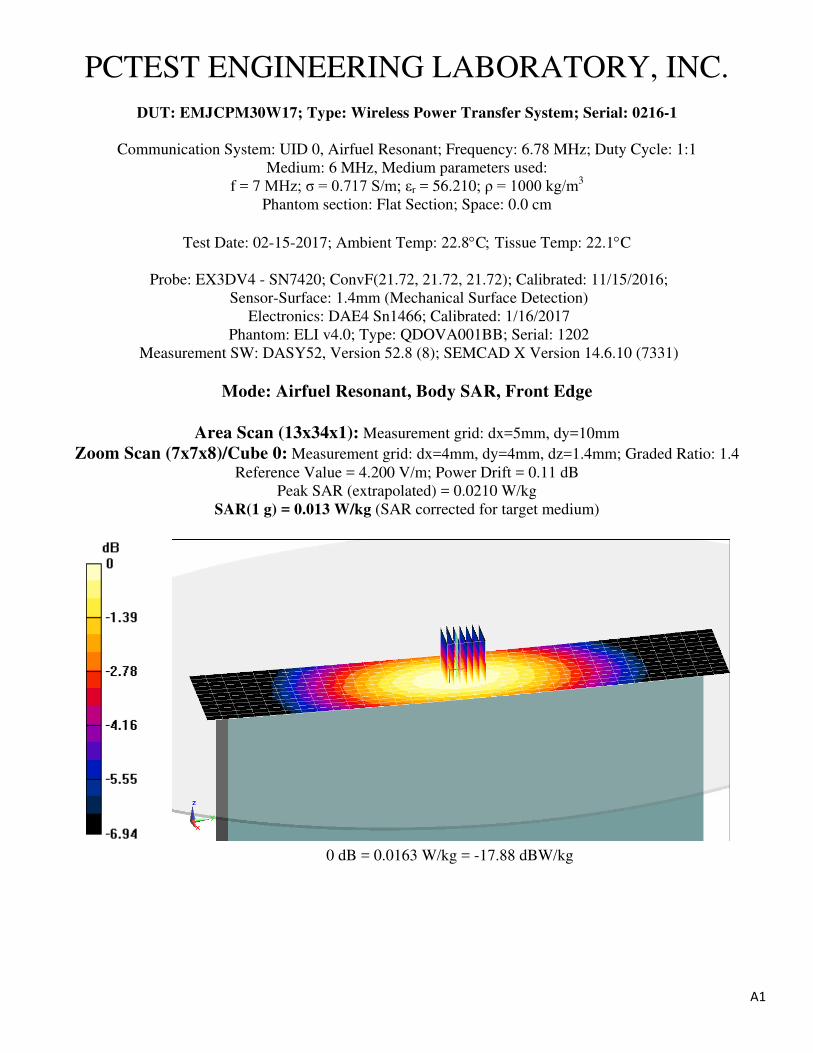
DUT: EMJCPM30W17; Type: Wireless Power Transfer System; Serial: 0216-1
Communication System: UID 0, Airfuel Resonant; Frequency: 6.78 MHz; Duty Cycle: 1:1
Medium: 6 MHz, Medium parameters used:
f = 7 MHz; σ = 0.717 S/m; εr = 56.210; ρ = 1000 kg/m3
Phantom section: Flat Section; Space: 0.0 cm
Test Date: 02-15-2017; Ambient Temp: 22.8°C; Tissue Temp: 22.1°C
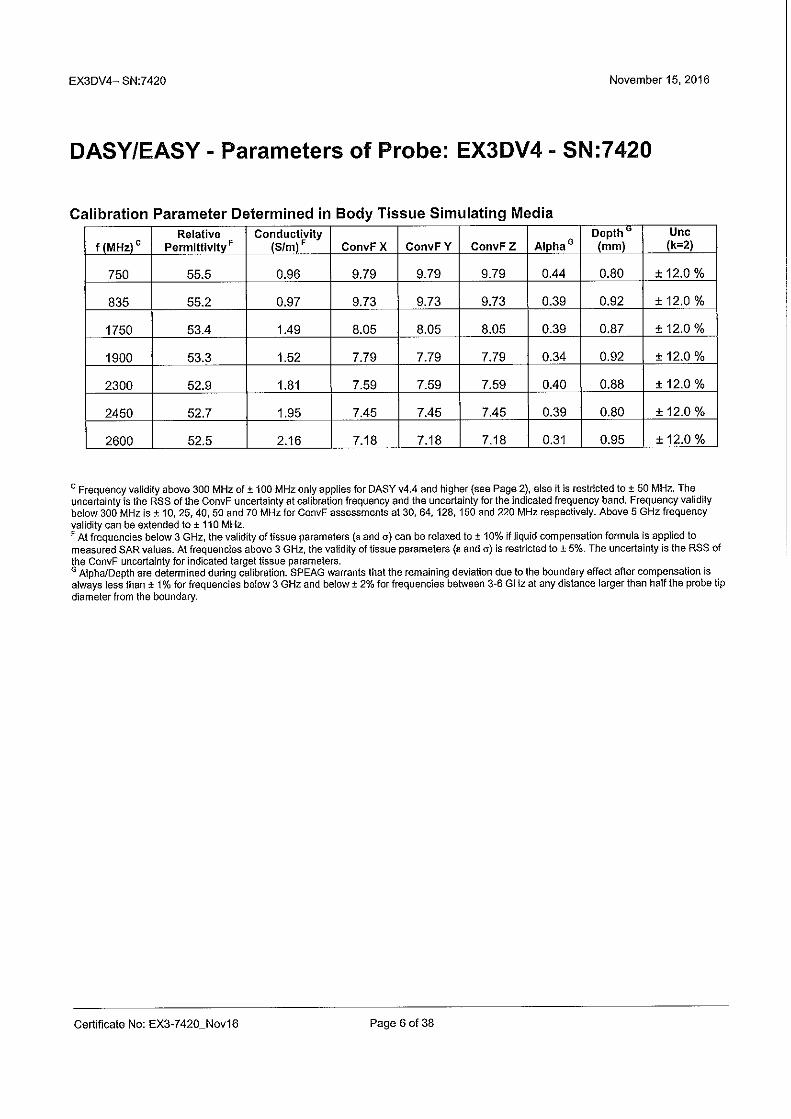
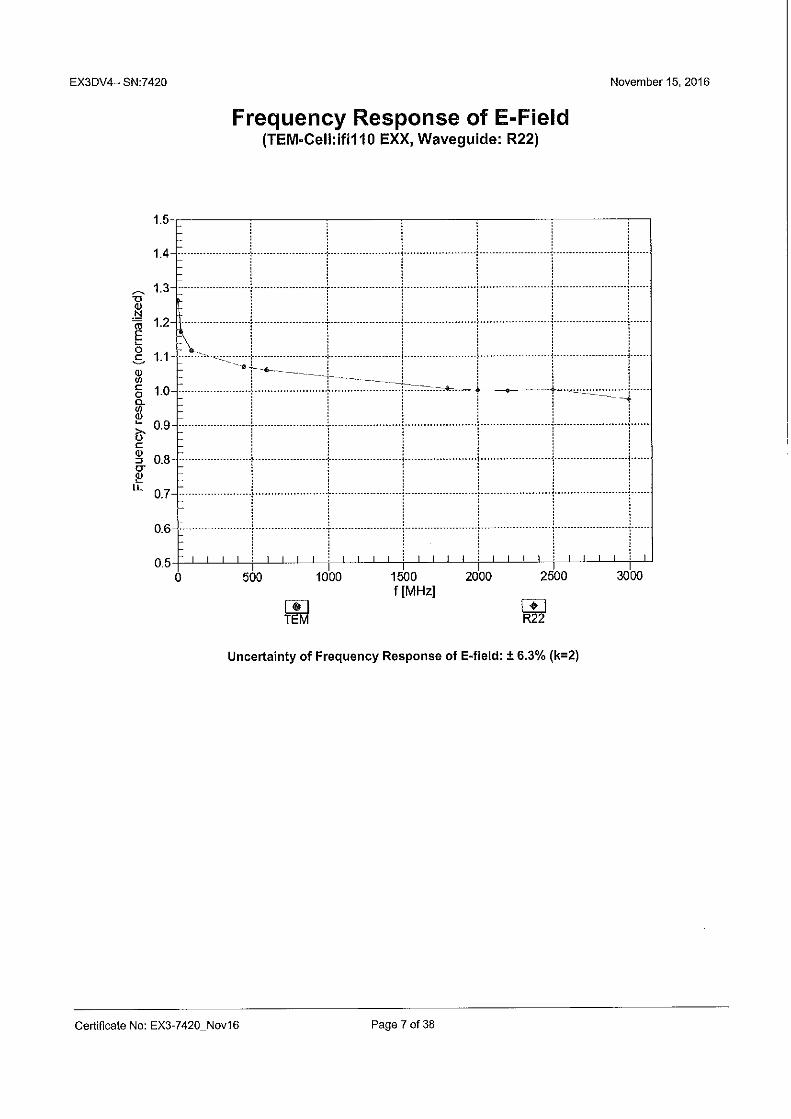
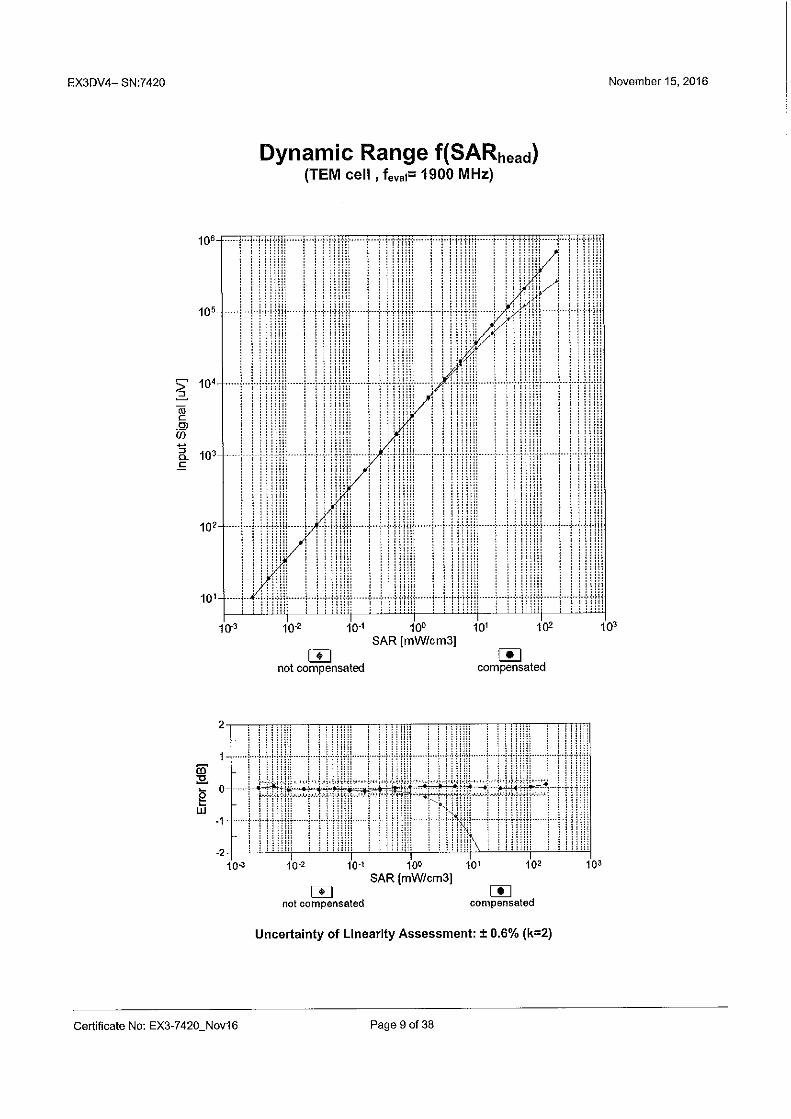
Probe: EX3DV4 - SN7420; ConvF(21.72, 21.72, 21.72); Calibrated: 11/15/2016;
Sensor-Surface: 1.4mm (Mechanical Surface Detection)
Electronics: DAE4 Sn1466; Calibrated: 1/16/2017
Phantom: ELI v4.0; Type: QDOVA001BB; Serial: 1202
Measurement SW: DASY52, Version 52.8 (8); SEMCAD X Version 14.6.10 (7331)
Mode: Airfuel Resonant, Body SAR, Front Edge
Area Scan (13x34x1): Measurement grid: dx=5mm, dy=10mm
Zoom Scan (7x7x8)/Cube 0: Measurement grid: dx=4mm, dy=4mm, dz=1.4mm; Graded Ratio: 1.4
Reference Value = 4.200 V/m; Power Drift = 0.11 dB
Peak SAR (extrapolated) = 0.0210 W/kg
SAR(1 g) = 0.013 W/kg (SAR corrected for target medium)
0 dB = 0.0163 W/kg = -17.88 dBW/kg
A2
PCTEST ENGINEERING LABORATORY, INC.
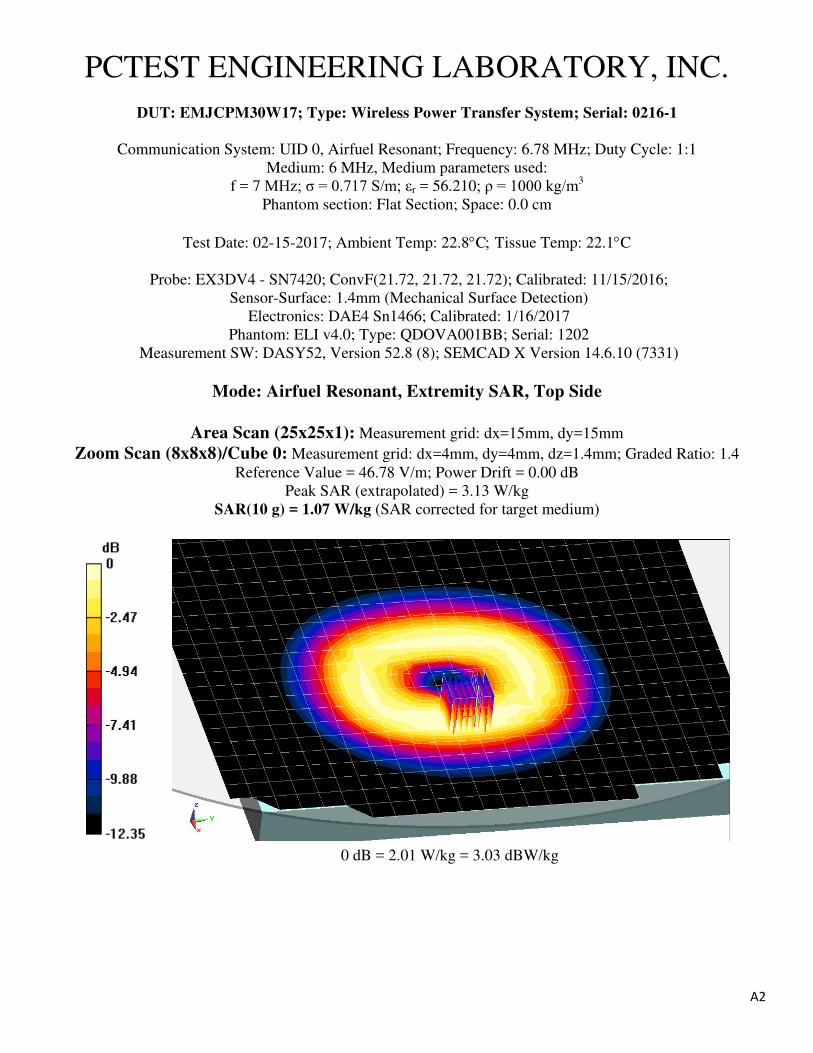
DUT: EMJCPM30W17; Type: Wireless Power Transfer System; Serial: 0216-1
Communication System: UID 0, Airfuel Resonant; Frequency: 6.78 MHz; Duty Cycle: 1:1
Medium: 6 MHz, Medium parameters used:
f = 7 MHz; σ = 0.717 S/m; εr = 56.210; ρ = 1000 kg/m3
Phantom section: Flat Section; Space: 0.0 cm
Test Date: 02-15-2017; Ambient Temp: 22.8°C; Tissue Temp: 22.1°C
Probe: EX3DV4 - SN7420; ConvF(21.72, 21.72, 21.72); Calibrated: 11/15/2016;
Sensor-Surface: 1.4mm (Mechanical Surface Detection)
Electronics: DAE4 Sn1466; Calibrated: 1/16/2017
Phantom: ELI v4.0; Type: QDOVA001BB; Serial: 1202
Measurement SW: DASY52, Version 52.8 (8); SEMCAD X Version 14.6.10 (7331)
Mode: Airfuel Resonant, Extremity SAR, Top Side
Area Scan (25x25x1): Measurement grid: dx=15mm, dy=15mm
Zoom Scan (8x8x8)/Cube 0: Measurement grid: dx=4mm, dy=4mm, dz=1.4mm; Graded Ratio: 1.4
Reference Value = 46.78 V/m; Power Drift = 0.00 dB
Peak SAR (extrapolated) = 3.13 W/kg
SAR(10 g) = 1.07 W/kg (SAR corrected for target medium)
0 dB = 2.01 W/kg = 3.03 dBW/kg
© 2017 PCTEST Engineering Laboratory, Inc.
A P P E N D I X B : S Y S T E M V E R I F I C A T I O N
B1
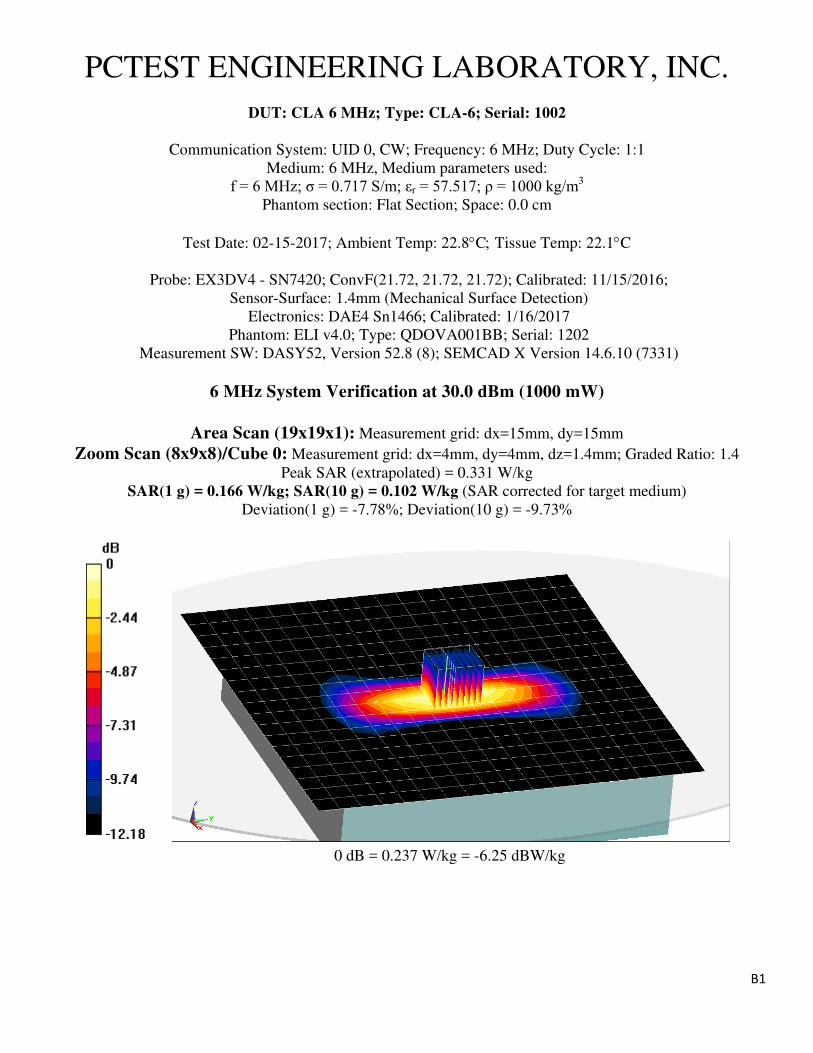
PCTEST ENGINEERING LABORATORY, INC.
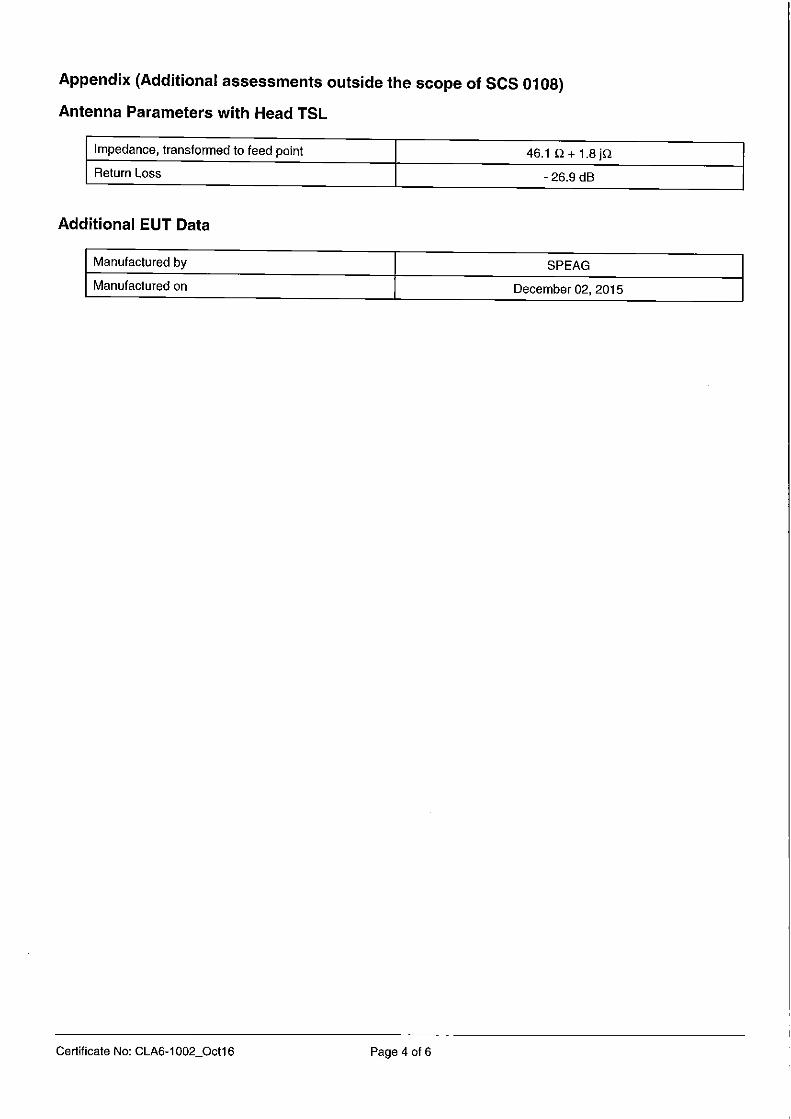
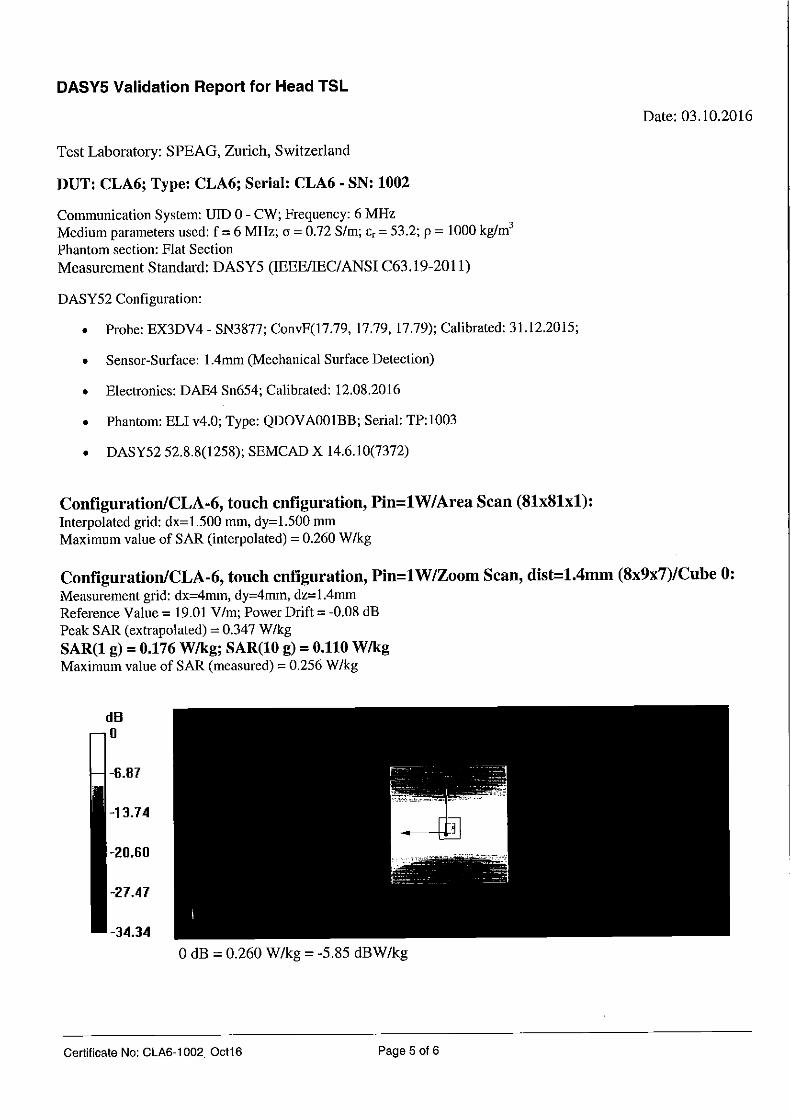
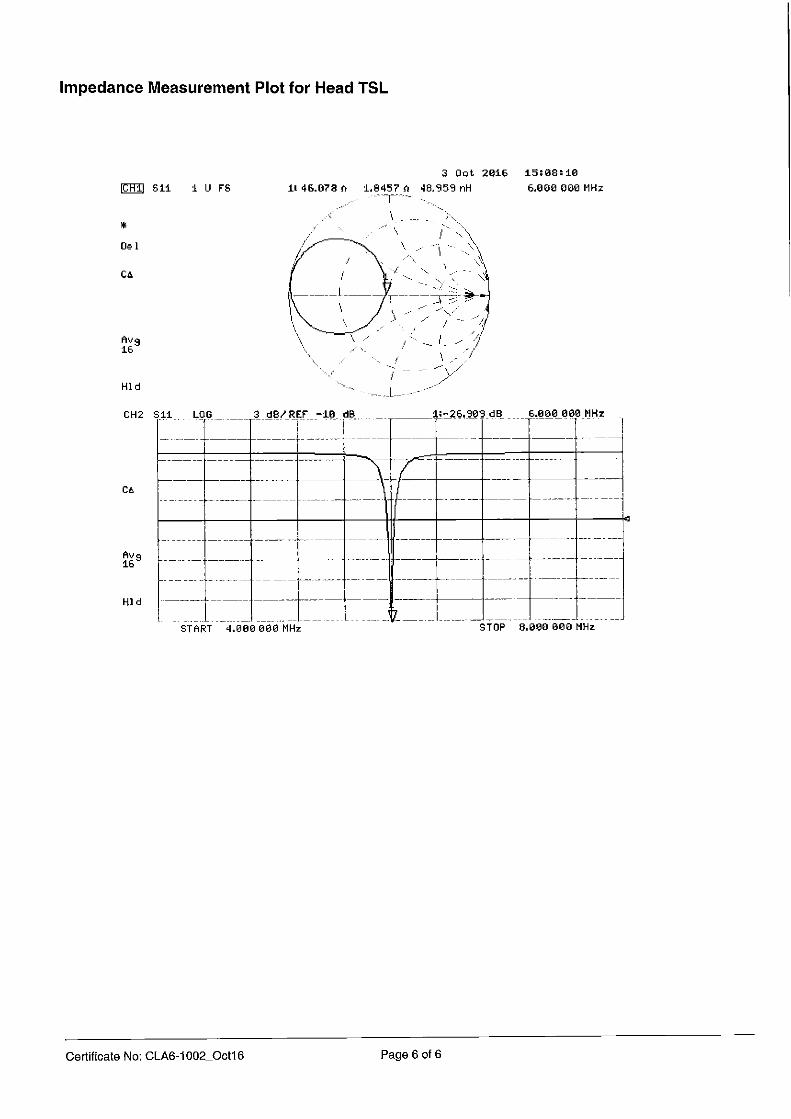
DUT: CLA 6 MHz; Type: CLA-6; Serial: 1002
Communication System: UID 0, CW; Frequency: 6 MHz; Duty Cycle: 1:1
Medium: 6 MHz, Medium parameters used:
f = 6 MHz; σ = 0.717 S/m; εr = 57.517; ρ = 1000 kg/m3
Phantom section: Flat Section; Space: 0.0 cm
Test Date: 02-15-2017; Ambient Temp: 22.8°C; Tissue Temp: 22.1°C
Probe: EX3DV4 - SN7420; ConvF(21.72, 21.72, 21.72); Calibrated: 11/15/2016;
Sensor-Surface: 1.4mm (Mechanical Surface Detection)
Electronics: DAE4 Sn1466; Calibrated: 1/16/2017
Phantom: ELI v4.0; Type: QDOVA001BB; Serial: 1202
Measurement SW: DASY52, Version 52.8 (8); SEMCAD X Version 14.6.10 (7331)
6 MHz System Verification at 30.0 dBm (1000 mW)
Area Scan (19x19x1): Measurement grid: dx=15mm, dy=15mm
Zoom Scan (8x9x8)/Cube 0: Measurement grid: dx=4mm, dy=4mm, dz=1.4mm; Graded Ratio: 1.4
Peak SAR (extrapolated) = 0.331 W/kg
SAR(1 g) = 0.166 W/kg; SAR(10 g) = 0.102 W/kg (SAR corrected for target medium)
Deviation(1 g) = -7.78%; Deviation(10 g) = -9.73%
0 dB = 0.237 W/kg = -6.25 dBW/kg

© 2017 PCTEST Engineering Laboratory, Inc.
A P P E N D I X C : P R O B E C A L I B R A T I O N


FCC ID: EMJCPM30W17
SAR EVALUATION REPORT Approved by:
Quality Manager
Test Dates: DUT Type: APPENDIX D: Page 1 of 2 02/15/2017 Wireless Power Transfer System
© 2017 PCTEST Engineering Laboratory, Inc. REV 18.3 M 01/30/2017
A P P E N D I X D : S A R T I S S U E S P E C I F I C A T I O N S
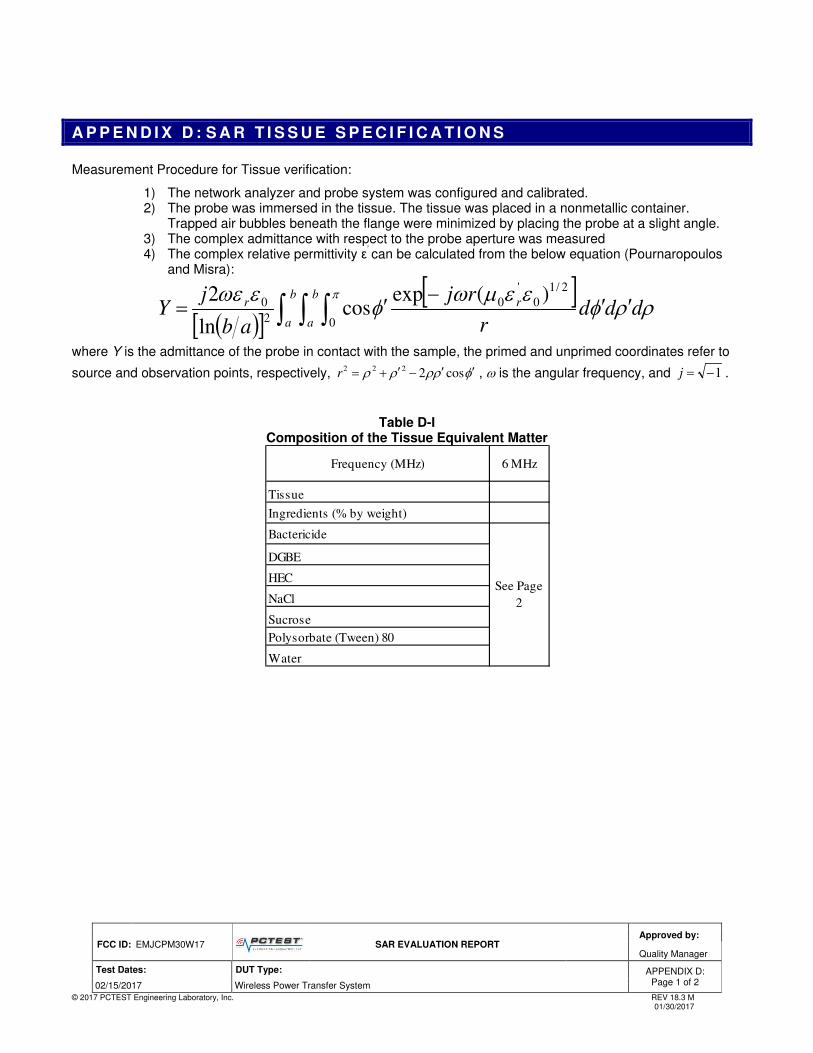
Measurement Procedure for Tissue verification:
1) The network analyzer and probe system was configured and calibrated. 2) The probe was immersed in the tissue. The tissue was placed in a nonmetallic container.
Trapped air bubbles beneath the flange were minimized by placing the probe at a slight angle. 3) The complex admittance with respect to the probe aperture was measured 4) The complex relative permittivity ε’
can be calculated from the below equation (Pournaropoulos and Misra):
( )[ ][ ]
∫ ∫ ∫ ′′−′=b
a
b
a
rr dddr
rj
ab
jY
πρρφ
εεµωφ
εωε0
2/1
0
'
0
2
0 )(expcos
ln
2
where Y is the admittance of the probe in contact with the sample, the primed and unprimed coordinates refer to
source and observation points, respectively, φρρρρ ′′−′+= cos2222r , ω is the angular frequency, and 1−=j .
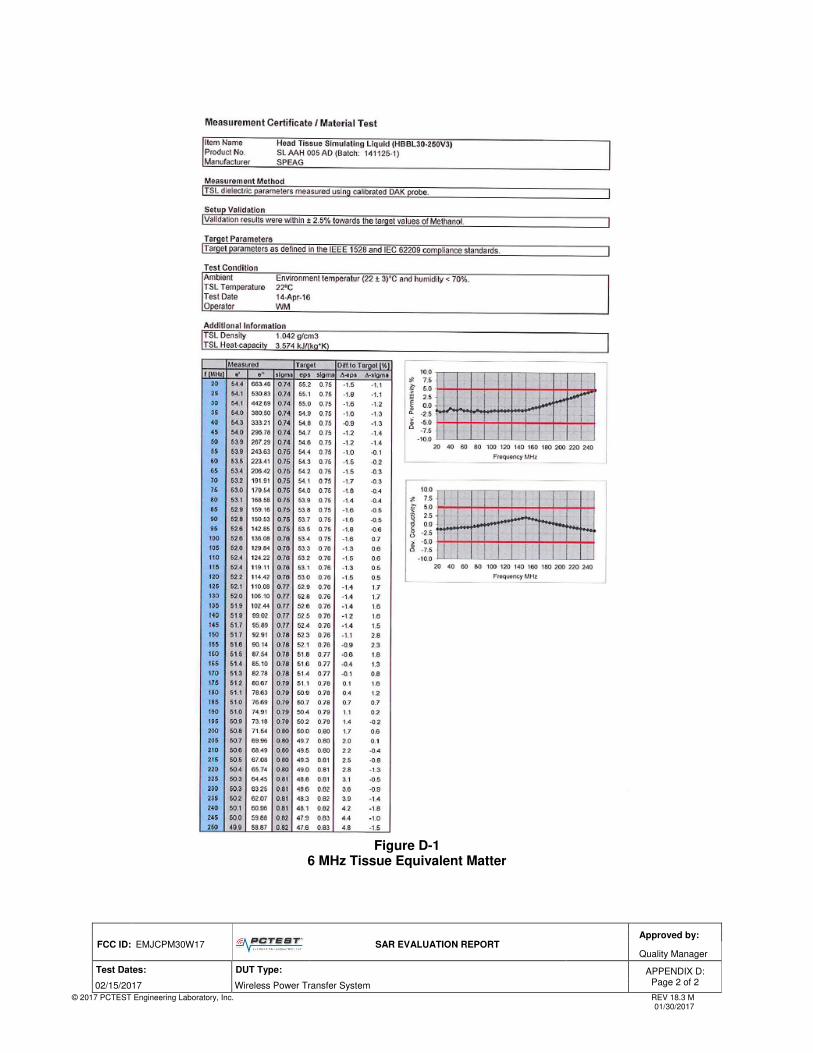
Table D-I Composition of the Tissue Equivalent Matter
Frequency (MHz) 6 MHz
Tissue
Ingredients (% by weight)
Bactericide
DGBE
HEC
NaCl
Sucrose
Polysorbate (Tween) 80
Water
See Page
2
FCC ID: EMJCPM30W17
SAR EVALUATION REPORT Approved by:
Quality Manager
Test Dates: DUT Type: APPENDIX D: Page 2 of 2 02/15/2017 Wireless Power Transfer System
© 2017 PCTEST Engineering Laboratory, Inc. REV 18.3 M 01/30/2017
Figure D-1
6 MHz Tissue Equivalent Matter