Embed Size (px)
Citation preview
Progress In Electromagnetics Research, Vol. 134, 209–226, 2013
SAR IMAGE DESPECKLING BY SELECTIVE 3DFILTERING OF MULTIPLE COMPRESSIVE RECON-STRUCTED IMAGES
Mahboob Iqbal, Jie Chen*, Wei Yang, Pengbo Wang, andBing Sun
School of Electronics and Information Engineering, Beihang University,Beijing 100191, China
Abstract—A despeckling technique based on multiple imagereconstruction and selective 3-dimensional filtering is proposed.Multiple SAR images are reconstructed from a single SAR imageby employing compressive sensing (CS) theory. In order to obtainmultiple images from single SAR image, multiple subsets of pixelsare selected from input SAR image by imposing restriction that eachsubset has at least 20% different pixels from any other subset. Thesesubsets are taken as measurement vectors in CS framework to obtainmultiple SAR images. A despeckled image is obtained by employingselective 3-dimensional filtering to multiple reconstructed SAR image.The proposed technique is tested on single look complex TerraSAT-Xdata set, and experimental results exhibit that the proposed techniqueoutperformed benchmark despekling methods in terms of visual qualityand despeckling quality metrics.
1. INTRODUCTION
Synthetic aperture radar (SAR) system is all-time and all-weatherimaging system used for earth surveying. SAR systems transmitelectromagnetic waves, and produce images by coherent integrationof received pulses. In coherent systems, backscatter signals add toeach other coherently, and random interference of electromagneticsignals causes the speckle noise [1]. Speckling is multiplicativenoise which deteriorates the image quality. Recently, SARsystems have employed for several remote sensing applicationssuch as environmental monitoring [2], surveillance [3, 4], target
Received 15 September 2012, Accepted 5 November 2012, Scheduled 24 November 2012* Corresponding author: Jie Chen ([email protected]).
210 Iqbal et al.
identification [5], navigation [6], homeland security [7, 8] and targetrecognition [9]. The speckle noise in SAR images reduces the potentialof SAR images to be utilized as effective data in remote sensingapplications [10]. Therefore, despeckling (removal of speckle noise)is one of the more important tasks in SAR imaging.
The despeckling of SAR image has been a hot research areaduring last two decades. Classical despeckling methods such Lee [11],Frost [12] and Gamma-MAP [13] use a priori statistical informationof speckle noise. These filters may over-smooth the textures.With the development of multi-resolution analysis theory, wavelettransformation methods are often used for despeckling [14, 15]. InWavelet shrinkage techniques, wavelet transform coefficients arethresholded. The texture preservation in multi-resolution techniquesis better compared to statistical techniques such as [11] and Frost [12],but performance of wavelet shrinkage techniques are quite sensitive tothreshold limit. Non-local mean (NLM) approach has also been appliedfor despeckling of SAR images [16, 17]. NLM approaches are based onthe observation that most images are comprised of self-similar patches.After identifying the self-similar patches, noise filtering is carried outin those patches. Block matching 3D (BM3D) [18] combines NLMand wavelet shrinkage. In BM3D, wavelet shrinkage is followed bycollection of group of similar patches. In probabilistic patch based(PPB) algorihtm [19], a similarity criterion based on noise distributionmethod is considered and filtering weights are obtained through aniteration process which takes into account the similarity betweenrestored patches.
The compressive sensing (CS) theory [20] proved that any sparsesignal or image can be reconstructed from samples fewer than numberof elements in a signal or image. Recently, CS theory has beenused in SAR signal processing and image formation [21–24]. Inthis paper, we exploit CS theory for despeckling of SAR image. Itis a well-known fact that multiple noisy images can be combinedstatistically to obtain cleaner image. Taking motivation from thisphenomenon, we employ CS to obtain multiple SAR images from asingle SAR image. A number of subsets of pixels are selected frominput SAR image by imposing restriction that each subset has atleast 20% different pixels than any other subset. These subsets aretaken as measurement vectors in CS framework to obtain multipleSAR images by solving convex optimization problem. The pixel-wiseaveraging of multiple compressive reconstructed images would lead tobetter results compared to conventional despeckling techniques [25].In this work, employ selective 3 dimensional (3D) filtering of multiplereconstructed images to further improve despeckling results. The
Progress In Electromagnetics Research, Vol. 134, 2013 211
experimental results on single look SAR data set exhibited thatthe proposed technique outperformed benchmark as well as recentdespeckling techniques in terms of qualitative and quantitative results.
The rest of the paper is organized as follows. A brief introductionof compressive sensing is given in Section 3. The proposed despecklingframework is described in Section 3 and experimental results are givenin Section 4. Finally we conclude this paper in Section 5.
2. COMPRESSIVE SENSING FRAMEWORK
CS theory proved that a signal, which is sparse in some basis can bereconstructed from incomplete information, i.e., number of samplesor measurements is less than the number of elements in the signal.Let x be an N × 1 signal which is sparse in an orthonormal basisΨ = [ψ1, ψ2, . . . , ψN]. If M (¿ N) number of samples are acquiredfrom signal by using M × N sampling matrix S, the resulting vector(containing samples) can be written as [20]
y = Sx (1)
The representation of x in sparse domain Ψ can be given as
xw = Ψx (2)
where xw is N × 1 vector with K (K < M) non-zero entries and Ψ isN ×N sparse basis matrix. Using (2), the measurement vector can bewritten as
y = SΨ−1xw (3)
where Θ = SΨ−1 is an M×N matrix called measurement matrix. Theproblem of finding xw from y is highly under-determined, as numberof unknown N , is higher than the number of equations which is equalto M (¿ N). But if measurement matrix, Θ satisfies RestrictedIsometery Property (RIP), (3) can be solved by emplying efficientreconstruction techniques. RIP states for any vector ν sharing thesame K non-zero entries as v and for some ε > 0 [20]
1− ε ≤ ‖Θv‖2
‖v‖2≤ 1 + ε (4)
If (4) is satisfied, signal xw can be reconstructed from (3) by solvingfollowing l1 optimization problem [20]
x̂w = min ‖xw‖1 subject to y = Θxw (5)
(5) can be solved by employing a convex optimization algorithm,such as gradient point sparse reconstruction (GPSR) [26] or regularizedorthogonal matching pursuit (ROMP) [27]. The convex optimization
212 Iqbal et al.
algorithm requires y ∈ RM and measurement matrix, Θ = SΨ−1 toreconstruct x̂w ∈ RN . The x is obtained by taking inverse Ψ transformof x̂w.
Conventional CS sampling matrices takes information fromseveral randomly selected sensors in one measurement [28]. In thisproposed despeckling framework, this conventional CS sampling matrixcannot be used, as the proposed despeckling technique is aimed atreconstructing multiple SAR images using different subsets of pixelsfrom SAR image. The point sampling matrix proposed by Sen andDarabi [29] collects information from one pixel in one sample. Asubset of M pixels selected from original SAR image can be arrangedas M × 1 vector y to serve as input for (5). The M × N samplingmatrix corresponding to y will be comprised of only one ‘1’ in eachrow corresponding to locations of selected pixels within SAR image.
3. PROPOSED DESPECKLING TECHNIQUE
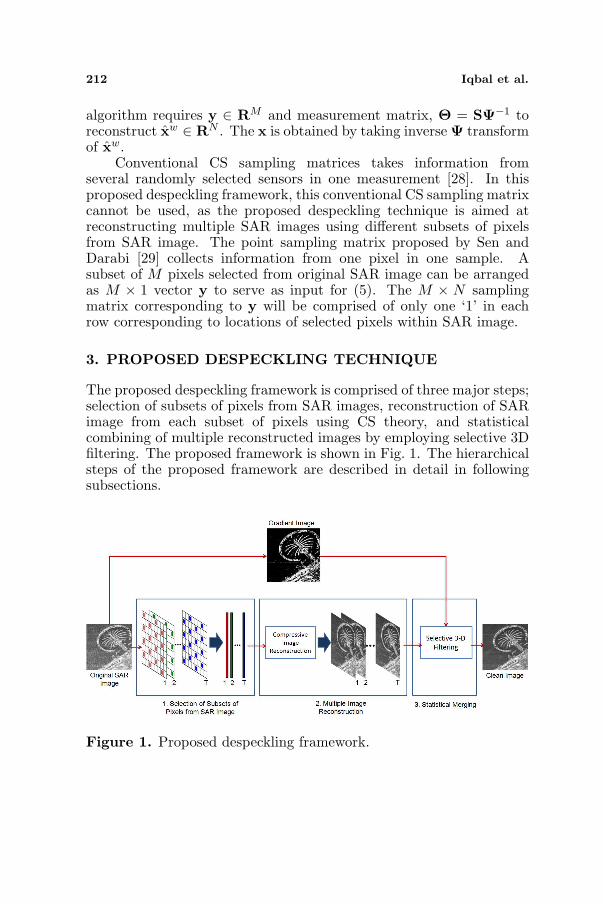
The proposed despeckling framework is comprised of three major steps;selection of subsets of pixels from SAR images, reconstruction of SARimage from each subset of pixels using CS theory, and statisticalcombining of multiple reconstructed images by employing selective 3Dfiltering. The proposed framework is shown in Fig. 1. The hierarchicalsteps of the proposed framework are described in detail in followingsubsections.
Figure 1. Proposed despeckling framework.
Progress In Electromagnetics Research, Vol. 134, 2013 213
3.1. Selection of Multiple Subsets
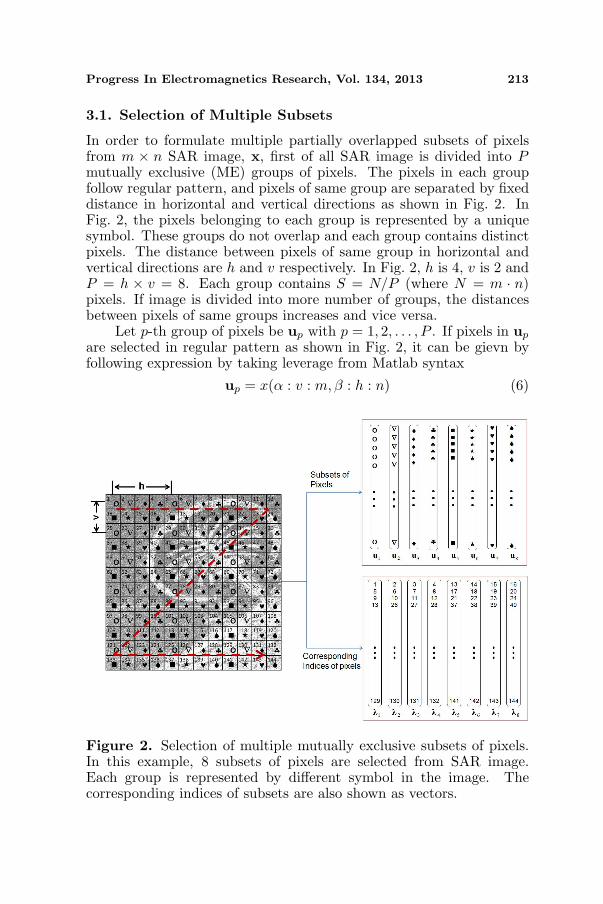
In order to formulate multiple partially overlapped subsets of pixelsfrom m × n SAR image, x, first of all SAR image is divided into Pmutually exclusive (ME) groups of pixels. The pixels in each groupfollow regular pattern, and pixels of same group are separated by fixeddistance in horizontal and vertical directions as shown in Fig. 2. InFig. 2, the pixels belonging to each group is represented by a uniquesymbol. These groups do not overlap and each group contains distinctpixels. The distance between pixels of same group in horizontal andvertical directions are h and v respectively. In Fig. 2, h is 4, v is 2 andP = h × v = 8. Each group contains S = N/P (where N = m · n)pixels. If image is divided into more number of groups, the distancesbetween pixels of same groups increases and vice versa.
Let p-th group of pixels be up with p = 1, 2, . . . , P . If pixels in up
are selected in regular pattern as shown in Fig. 2, it can be gievn byfollowing expression by taking leverage from Matlab syntax
up = x(α : v : m,β : h : n) (6)
Figure 2. Selection of multiple mutually exclusive subsets of pixels.In this example, 8 subsets of pixels are selected from SAR image.Each group is represented by different symbol in the image. Thecorresponding indices of subsets are also shown as vectors.
214 Iqbal et al.
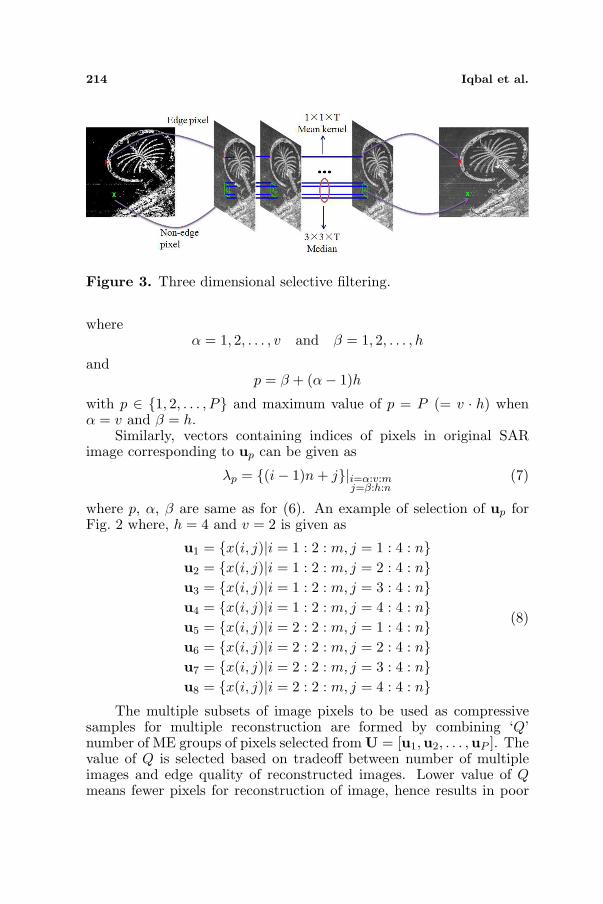
Figure 3. Three dimensional selective filtering.
whereα = 1, 2, . . . , v and β = 1, 2, . . . , h
andp = β + (α− 1)h
with p ∈ {1, 2, . . . , P} and maximum value of p = P (= v · h) whenα = v and β = h.
Similarly, vectors containing indices of pixels in original SARimage corresponding to up can be given as
λp = {(i− 1)n + j}|i=α:v:mj=β:h:n
(7)
where p, α, β are same as for (6). An example of selection of up forFig. 2 where, h = 4 and v = 2 is given as
u1 = {x(i, j)|i = 1 : 2 : m, j = 1 : 4 : n}u2 = {x(i, j)|i = 1 : 2 : m, j = 2 : 4 : n}u3 = {x(i, j)|i = 1 : 2 : m, j = 3 : 4 : n}u4 = {x(i, j)|i = 1 : 2 : m, j = 4 : 4 : n}u5 = {x(i, j)|i = 2 : 2 : m, j = 1 : 4 : n}u6 = {x(i, j)|i = 2 : 2 : m, j = 2 : 4 : n}u7 = {x(i, j)|i = 2 : 2 : m, j = 3 : 4 : n}u8 = {x(i, j)|i = 2 : 2 : m, j = 4 : 4 : n}
(8)
The multiple subsets of image pixels to be used as compressivesamples for multiple reconstruction are formed by combining ‘Q’number of ME groups of pixels selected from U = [u1,u2, . . . ,uP ]. Thevalue of Q is selected based on tradeoff between number of multipleimages and edge quality of reconstructed images. Lower value of Qmeans fewer pixels for reconstruction of image, hence results in poor
Progress In Electromagnetics Research, Vol. 134, 2013 215
image quality of reconstructed images, but we can get higher numberof reconstructed images. On the contrary, higher value of Q willproduce sharp high quality reconstructed images, but the number ofreconstructed images will be fewer. Experimental results show that50% pixels would be able to produce sufficiently high quality sharpimage, hence empirical value of Q = P/2. If Q number of ME groupsof pixels are selected from P number of ME groups, total number ofall possible subsets can be found by following expression
T =(
P
Q
)=
P !Q!(P −Q)!
(9)
where symbol ‘!’ represents factorial. From (9), T distinctcombinations of Q groups out P groups will be obtained. Let Ct ={c1
t , c2t , . . . , c
Qt } be the t-th combination, where {c1
t , c2t , . . . , c
Qt } are non-
repeating integers between 1 and T . For t-th distinct combination ofQ groups of pixels out of P groups, subset yt can be given as
yt =⋃
(uc|c ∈ Ct) (10)
where Ct is a vector comprising of non-repeating integers between1 and P . Similarly, vector comprising of indices of selected pixelscorresponding to yt is written as
Λt =⋃
(λc|c ∈ Ct) (11)
3.2. Multiple Compressive Image Reconstruction
Once multiple subsets of pixels have been selected from original SARimage, the next step is to reconstruct SAR image for each subset ofpixels. The yt is M × 1 vector where M = QS. The SAR imagecan be reconstructed from each subset yt, t ∈ {1, T} using CS theorydescribed in Section 2 by considering yt as compressive samples. Thecompressive sampling Equation (1) becomes
yt = Stxt = StΨ−1x̂wt = Θtx̂w
t (12)
where Θt = StΨ−1 is measurement matrix and x̂wt a vector containing
coefficients of x̂t in wavelet domain. In (12), Ψ−1 represent inversewavelet transform. St is t-th sampling matrix corresponding to yt. Itis M ×N matrix produced by taking exactly one ‘1’ in each of M rowscorresponding to the location of pixel of yt within SAR image. Thesampling matrix for t-th subset is determined by using (11)
St(τ, ξ) ={
1 if Λ(τ) = ξ,
0 otherwise.(13)
216 Iqbal et al.
The point sampling matrix is not sufficiently incoherent withsparse basis [29], so a blurring filter is incorporated into measurementmatrix as proposed by [29] and measurement matrix becomes
Θt = StΓ−1Ψ−1 (14)
The blur introduced by blurring filter is removed by introducing aWeiner sharpening filter [30] in inverse measurement matrix [29]. Theinverse measurement matrix is Θ∗
t = ΨΓS−1t . A SAR image, xt is
reconstructed for each sampled vectors, yt by solving following convexoptimization problem
minx̂w
t ∈RN‖x̂w
t ‖1 subject to yt = Θtx̂wt (15)
(15) is solved for each yt using gradient projection for sparsereconstruction (GPRS) [26] followed by inverse wavelet transform toobtain t-th image x̂t.
T number of SAR images are reconstructed corresponding toT subsets by using (15). The speckle noise is located in highfrequency component of image so sparse reconstruction of imagewould help eliminate noise in the reconstructed image. Therefore,all reconstructed images obtained by solving (15) have lower specklenoise compared to source image. In the final step, these multiplereconstructed images are statistically combined by employing selective3D filtering as discussed in Section 3.3.
3.3. Selective 3-D Filtering
Multiple reconstructed images obtained using (15) are similar in globalperspective but statistically different in local perspective as all theseimages are reconstructed by using different sets of pixels. It is wellknown that statistical processing of multiple observations of samescene help reduce additive and multiplicative noise. Moreover, spatialfiltering such as low-pass filtering or median filtering also reduces noise.In order to exploit the availability of multiple images from single image,we propose a selective 3D filtering in this paper. In order to betterpreserve the edges in final despeckled image, the kernel for 3D filteringis selected as a function of image gradient.
To identify the presence of edges in an image, the image gradientis an important tool. The gradient of source SAR image x in horizontaland vertical directions can be given as
Gh = ∂x∂h ≈ fh ∗ x Gv = ∂x
∂v ≈ fv ∗ x (16)
where ‘∗’ denotes 2 dimensional convolution; Gh and Gv are gradientapproximations in horizontal and vertical directions respectively.
Progress In Electromagnetics Research, Vol. 134, 2013 217
In (16), fh and fv are filter kernels in horizontal and vertical directionsrespectively given as follows
fh =
( −1 0 +1−2 0 +2−1 0 +1
), fv =
( −1 −2 −10 0 0
+1 +2 +1
)(17)
The gradient approximations in horizontal and vertical directionscan be combined to give the gradient magnitude, using
G =√
G2h + G2
v (18)
G will have higher values at locations where edges are present andlower values in smoother areas. In the proposed technique, 3D filter isselected based on the value of gradient approximation at the centralpixel location as shown in Fig. 3. If value of gradient approximation atany pixel x(i, j) is less than TH = % ·Gmax (where Gmax is maximumvalue at any pixel in G and % is a positive constant), R × R windowcentered at subject pixel is selected for all T images, and median valueof all selected pixels is returned as pixel at (i, j) location of despeckledSAR image. If gradient approximation is greater than the TH, thepixels at (i, j) location of all reconstructed images are averaged. Inmathematical form, despeckled image, x̂ can be written as
x̂(i, j)=
MEDIAN
({xt(k1, k2)};
t ∈ {1, T}k1∈{i−R, i+R}k2∈{j−R, j+R}
)if G(i, j)<TH,
1T
∑Tt=1 xt(i, j) otherwise.
(19)where MEDIAN represents the median operation, T is the numberof reconstructed images, and 2R + 1 is the size of selected windowfor each image. The image obtained by employing (19) is despeckledimage. In the proposed framework speckle is reduced by imposingdual mechanisms; through inherent noise reduction via compressivereconstruction (15) and selective 3D filtering (19). Therefore, theproposed framework leads to better speckle reduction compared tobenchmark despeckling algorithms.
4. IMPLEMENTATION AND EXPERIMENTALRESULTS
4.1. Despeckled Image Quality Metrics
In order to measure the performance of despeckling techniques,following metrics are used.
218 Iqbal et al.
4.1.1. ENL
Equivalent number of looks (ENL) [31] is one of the commonly usedmetric used to quantify the quality of despeckled SAR images. ENL iscalculated by using following expression
ENL =(
µx̂H
σx̂H
)2
(20)
where µx̂Hand σx̂H
are mean and standard deviation of homogeneousarea, (x̂H) in despeckled image. The higher the value of ENL, betterthe performance of despeckling technique.
4.1.2. Speckle Suppression Index
The ratio of standard deviation to mean (also called coefficient ofvariance) is used to measure the speckle strength in an image. Letx and x̂ be original and speckle reduced SAR images respectively. Thespeckle suppression index (SSI) is defined as the ratio of coefficientof variance of speckle resorter image to the coefficient of variance oforiginal image as given below [32]
SSI =
√V AR(x̂)
Mean(x̂)Mean(x)√
V AR(x)(21)
SSI is less than 1. The smaller values of SSI means highersuppression of speckle noise [32].
4.1.3. Speckle Suppression and Mean Preservation Index
ENL and SSI are not considered as reliable measures when thedespeckling algorithm overestimates the mean value. Therefore,speckle suppression and mean preservation index (SMPI) is used forsimultaneous estimation of speckle suppression and mean preservationcapabilities of despeckling technique. SMPI is given as [33]
SMPI = Q×√
V AR(x̂)√V AR(x)
(22)
whereQ = K + |Mean(x̂)−Mean(x)|
andK =
max(Mean(x̂))−min(Mean(x̂))Mean(x)
Progress In Electromagnetics Research, Vol. 134, 2013 219
4.1.4. Correlation Coefficient
The correlation coefficient (CC) for original image, x, and despeckledimage x̂ is calculated as follows
ρx,x̂ =E[(x− µx)(x̂− µx̂)]
σxσx̂(23)
where µx and µx̂ are mean values of original and despeckled SARimages respectively and σx and σx̂ are standard deviations of originaland despeckled images respectively.
4.1.5. Edge Save Index
Edge save index (ESI) reflects the edge preservation capability ofdespeckling technique. ESI is measured in both horizontal and verticaldirections. ESI in horizontal direction for m × n SAR image iscomputed as [34]
ESIh =
∑mi=1
∑n−1j=1 |x̂(i, j + 1)− x̂(i, j)|
∑mi=1
∑n−1j=1 |x(i, j + 1)− x(i, j)| (24)
where x̂ is despeckled SAR image; x is original SAR image; m is thenumber of rows in SAR image; n is the number of columnsin SARimage. Similarly, ESI in vertical direction is given as
ESIv =
∑nj=1
∑m−1i=1 |x̂(i + 1, j)− x̂(i, j)|
∑nj=1
∑m−1i=1 |x(i + 1, j)− x(i, j)| (25)
4.2. Experimental Results
The proposed despeckling technique was implemented in MATLABand tested on TerraSAR-X [35] data set. In our implementation, weconsider 8 non-overlapping subsets of pixels as shown in Fig. 2. Forbetter preservation of edges, 50% pixels are used for reconstruction ofimage using GPSR algorithm [26]. In order to select 50% pixels, 4subsets of pixels are selected out of 8 subsets leading to 70 samplingmatrices. The obtained 70 images are combined by employing selective3D filtering discussed in Section 3.3. The value of ρ to determine forthreshold for (19) is taken as 0.01 to determine the value of TH in (19).Haar wavelets with decomposition level of 3 are used as sparse basisfor solving (15).
The proposed despeckling technique is compared with benchmarkand recent despeckling techniques such as Lee [11], Frost [36],Gamma-MAP [13], wavelets shrinkage [14], probabilistic patch based
220 Iqbal et al.
(a) (b) (c) (d)
(e) (f) (g) (h)
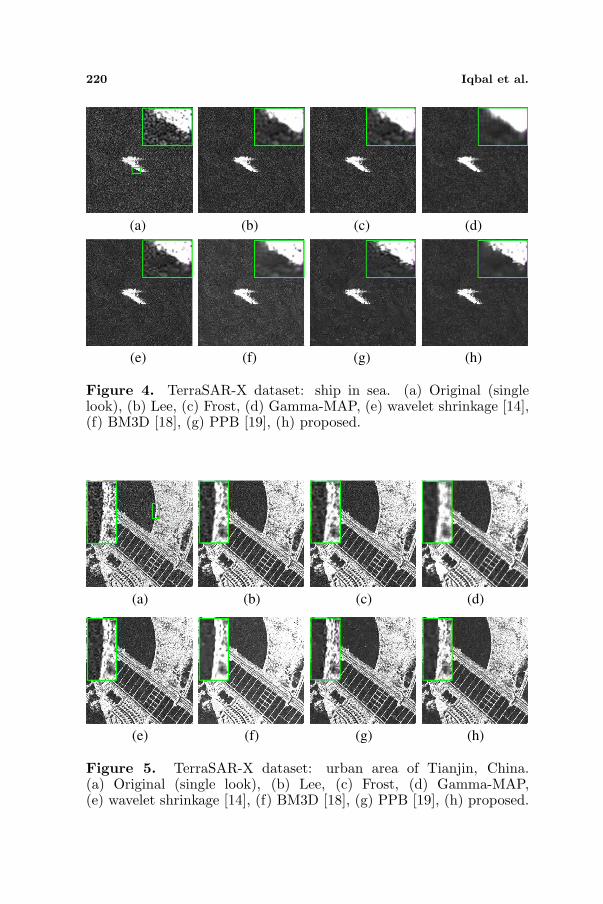
Figure 4. TerraSAR-X dataset: ship in sea. (a) Original (singlelook), (b) Lee, (c) Frost, (d) Gamma-MAP, (e) wavelet shrinkage [14],(f) BM3D [18], (g) PPB [19], (h) proposed.
(a) (b) (c) (d)
(e) (f) (g) (h)
Figure 5. TerraSAR-X dataset: urban area of Tianjin, China.(a) Original (single look), (b) Lee, (c) Frost, (d) Gamma-MAP,(e) wavelet shrinkage [14], (f) BM3D [18], (g) PPB [19], (h) proposed.
Progress In Electromagnetics Research, Vol. 134, 2013 221
technique [19] and block matching 3D (BM3D) [18]. Three patches areselected from single look complex (SLC) data of TerraSAR-X. The testTerraSAR-x images includes; ship in sea near Dubai coastal area, andurban/rural areas of Tianjin province, China. The despeckling resultsof the proposed technique and comparison methods for these three realSAR images are given in Fig. 4 to Fig. 6.
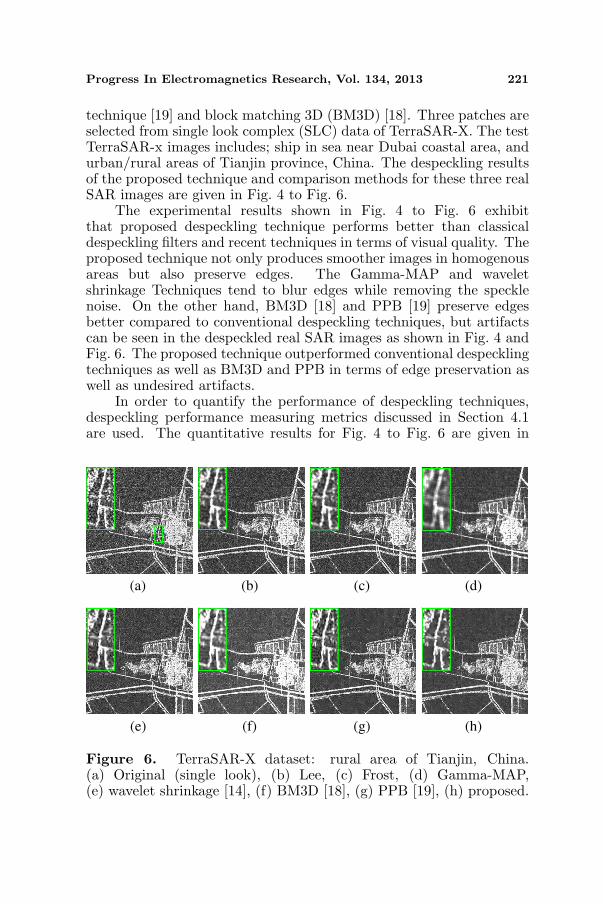
The experimental results shown in Fig. 4 to Fig. 6 exhibitthat proposed despeckling technique performs better than classicaldespeckling filters and recent techniques in terms of visual quality. Theproposed technique not only produces smoother images in homogenousareas but also preserve edges. The Gamma-MAP and waveletshrinkage Techniques tend to blur edges while removing the specklenoise. On the other hand, BM3D [18] and PPB [19] preserve edgesbetter compared to conventional despeckling techniques, but artifactscan be seen in the despeckled real SAR images as shown in Fig. 4 andFig. 6. The proposed technique outperformed conventional despecklingtechniques as well as BM3D and PPB in terms of edge preservation aswell as undesired artifacts.
In order to quantify the performance of despeckling techniques,despeckling performance measuring metrics discussed in Section 4.1are used. The quantitative results for Fig. 4 to Fig. 6 are given in
(a) (b) (c) (d)
(e) (f) (g) (h)
Figure 6. TerraSAR-X dataset: rural area of Tianjin, China.(a) Original (single look), (b) Lee, (c) Frost, (d) Gamma-MAP,(e) wavelet shrinkage [14], (f) BM3D [18], (g) PPB [19], (h) proposed.
222 Iqbal et al.
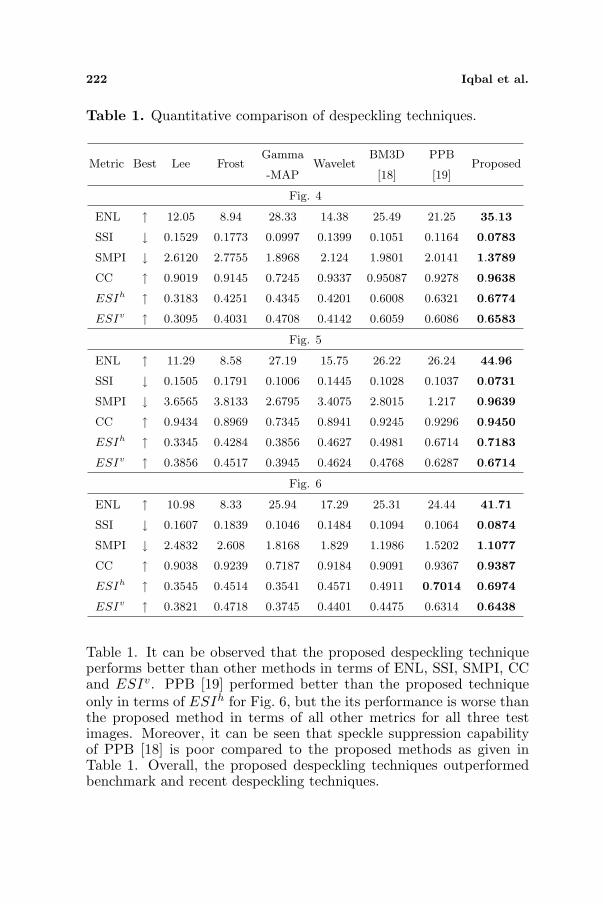
Table 1. Quantitative comparison of despeckling techniques.
Metric Best Lee FrostGamma
-MAPWavelet
BM3D
[18]
PPB
[19]Proposed
Fig. 4
ENL ↑ 12.05 8.94 28.33 14.38 25.49 21.25 35.13
SSI ↓ 0.1529 0.1773 0.0997 0.1399 0.1051 0.1164 0.0783
SMPI ↓ 2.6120 2.7755 1.8968 2.124 1.9801 2.0141 1.3789
CC ↑ 0.9019 0.9145 0.7245 0.9337 0.95087 0.9278 0.9638
ESIh ↑ 0.3183 0.4251 0.4345 0.4201 0.6008 0.6321 0.6774
ESIv ↑ 0.3095 0.4031 0.4708 0.4142 0.6059 0.6086 0.6583
Fig. 5
ENL ↑ 11.29 8.58 27.19 15.75 26.22 26.24 44.96
SSI ↓ 0.1505 0.1791 0.1006 0.1445 0.1028 0.1037 0.0731
SMPI ↓ 3.6565 3.8133 2.6795 3.4075 2.8015 1.217 0.9639
CC ↑ 0.9434 0.8969 0.7345 0.8941 0.9245 0.9296 0.9450
ESIh ↑ 0.3345 0.4284 0.3856 0.4627 0.4981 0.6714 0.7183
ESIv ↑ 0.3856 0.4517 0.3945 0.4624 0.4768 0.6287 0.6714
Fig. 6
ENL ↑ 10.98 8.33 25.94 17.29 25.31 24.44 41.71
SSI ↓ 0.1607 0.1839 0.1046 0.1484 0.1094 0.1064 0.0874
SMPI ↓ 2.4832 2.608 1.8168 1.829 1.1986 1.5202 1.1077
CC ↑ 0.9038 0.9239 0.7187 0.9184 0.9091 0.9367 0.9387
ESIh ↑ 0.3545 0.4514 0.3541 0.4571 0.4911 0.7014 0.6974
ESIv ↑ 0.3821 0.4718 0.3745 0.4401 0.4475 0.6314 0.6438
Table 1. It can be observed that the proposed despeckling techniqueperforms better than other methods in terms of ENL, SSI, SMPI, CCand ESIv. PPB [19] performed better than the proposed techniqueonly in terms of ESIh for Fig. 6, but the its performance is worse thanthe proposed method in terms of all other metrics for all three testimages. Moreover, it can be seen that speckle suppression capabilityof PPB [18] is poor compared to the proposed methods as given inTable 1. Overall, the proposed despeckling techniques outperformedbenchmark and recent despeckling techniques.
Progress In Electromagnetics Research, Vol. 134, 2013 223
5. CONCLUSION
A SAR despeckling technique has been proposed using multiplecompressive reconstructed images and selective 3D filtering. MultipleSAR images are obtained from single SAR image by using compressivesensing framework. The multiple SAR images are reconstructed insparse domain by considering partially overlapped subsets of pixels ascompressive samples, and employing convex optimization algorithm.The proposed scheme enforces two-fold noise-removal mechanism;noise elimination while reconstruction of image in sparse domainand statistical combining of multiple reconstructed images through3D filtering. The experimental results on single look TerraSAR-xdata set demonstrated the superiority of the proposed technique overbenchmark despeckling techniques in terms of visual quality as well asdespeckling image quality metrics.
ACKNOWLEDGMENT
This work is supported in part by the National Key Basic ResearchProgram Project (973 Program) under Grant 2010CB731902, and inpart by National Natural Science Foundation of China under GrantNo. 61132006.
REFERENCES
1. Saevarsson, B. B., J. R. Sveinsson, and J. A. Benediktsson, “Com-bined wavelet and curvelet denoising of SAR images,” Geoscienceand Remote Sensing Symposium, 2004 IEEE International Pro-ceedings, IGARSS’04, Vol. 6, 4235–4238, Sept. 2004.
2. Koo, V. C., Y. K. Chan, V. Gobi, M. Y. Chua, C. H. Lim, C.-S. Lim, C. C. Thum, T. S. Lim, Z. Bin Ahmad, K. A. Mahmood,M. H. Bin Shahid, C. Y. Ang, W. Q. Tan, P. N. Tan, K. S. Yee,W. G. Cheaw, H. S. Boey, A. L. Choo, and B. C. Sew,“A new unmanned aerial vehicle synthetic aperture radarfor environmental monitoring,” Progress In ElectromagneticsResearch, Vol. 122, 245–268, 2012.
3. Mohammadpoor, M., R. S. A. Raja Abdullah, A. Ismail, andA. F. Abas, “A circular synthetic aperture radar for on-the-ground object detection,” Progress In Electromagnetics Research,Vol. 122, 269–292, 2012.
4. Brusch, S., S. Lehner, T. Fritz, M. Soccorsi, A. Soloviev,and B. van Schie, “Ship surveillance with TerraSAR-X,” IEEE
224 Iqbal et al.
Transactions on Geoscience and Remote Sensing, Vol. 49, No. 3,1092–1103, Mar. 2011.
5. Park, J.-I. and K.-T. Kim, “A comparative study on isarimaging algorithms for radar target identification,” Progress InElectromagnetics Research, Vol. 108, 155–175, 2010.
6. Ren, S., W. Chang, T. Jin, and Z. Wang, “AutomatedSAR reference image preparation for navigation,” Progress InElectromagnetics Research, Vol. 121, 535–555, 2011.
7. Eineder, M., C. Minet, P. Steigenberger, X. Cong, and T. Fritz,“Imaging geodesy-toward centimeter-level ranging accuracy withTerraSAR-X,” IEEE Transactions on Geoscience and RemoteSensing, Vol. 49, No. 2, 661–671, Feb. 2011.
8. Martnez-Lorenzo, J. A., F. Quivira, and C. M. Rappaport, “SARimaging of suicide bombers wearing concealed explosive threats,”Progress In Electromagnetics Research, Vol. 125, 255–172, 2012.
9. Chang, Y.-L., C.-Y. Chiang, and K.-S. Chen, “SAR IMAsimulation with application to target recognition,” Progress InElectromagnetics Research, Vol. 119, 35–57, 2011.
10. Lee, J.-S. and E. Pottier, Polarimetric Radar Imaging from Basicsto Applications, CRC Press, 2009.
11. Lee, J. S., L. Jurkevich, P. Dewaele, P. Wambacq, andA. Oosterlinck, “Speckle filtering of synthetic aperture radarimages: A review,” Remote Sensing Reviews, Vol. 8, No. 4, 313–340, 1994.
12. Frost, V. S., J. A. Stiles, K. S. Shanmugan, and J. C. Holtzman,“A model for radar images and its application to adaptivedigital filtering of multiplicative noise,” IEEE Transactions onPattern Analysis and Machine Intelligence, Vol. 4, No. 2, 157–166, Mar. 1982.
13. Baraldi, A. and F. Parmiggiani, “A refined gamma mapSAR speckle filter with improved geometrical adaptivity,” IEEETransactions on Geoscience and Remote Sensing, Vol. 33, No. 5,1245–1257, Sept. 1995.
14. Dai, M., C. Peng, A. K. Chan, and D. Loguinov, “Bayesianwavelet shrinkage with edge detection for SAR image despeck-ling,” IEEE Transactions on Geoscience and Remote Sensing,Vol. 42, No. 8, 1642–1648, Aug. 2004.
15. Gleich, D., M. Kseneman, and M. Datcu, “Despeckling of terrasar-x data using second-generation wavelets,” IEEE Geoscience andRemote Sensing Letters, Vol. 7, No. 1, 68–72, Jan. 2010.
16. Xu, J., H. Zhong, and L. Jiao, “Classification based non-
Progress In Electromagnetics Research, Vol. 134, 2013 225
local means despeckling for SAR image,” Proceedings of SPIE,Vol. 7495, 2009.
17. Coupe, P., P. Hellier, C. Kervrann, and C. Barillot, “Bayesiannon local means-based speckle filtering,” 5th IEEE InternationalSymposium on Biomedical Imaging: From Nano to Macro, ISBI2008, 1291–1294, May 2008.
18. Parrilli, S., M. Poderico, C. V. Angelino, and L. Verdoliva,“A nonlocal SAR image denoising algorithm based on llmmsewavelet shrinkage,” IEEE Transactions on Geoscience and RemoteSensing, Vol. 50, No. 2, 606–616, Feb. 2012.
19. Deledalle, C.-A., L. Denis, and F. Tupin, “Iterative weightedmaximum likelihood denoising with probabilistic patch-basedweights,” IEEE Transactions on Image Processing, Vol. 18, No. 12,2661–2672, Dec. 2009.
20. Donoho, D. L., “Compressed sensing,” IEEE Transactions onInformation Theory, Vol. 52, No. 4, 1289–1306, Apr. 2006.
21. Chen, J., J. Gao, Y. Zhu, W. Yang, and P. Wang, “A novel imageformation algorithm for high-resolution wide-swath spaceborneSAR using compressed sensing on azimuth displacement phasecenter antenna,” Progress In Electromagnetics Research, Vol. 125,527–543, 2012.
22. Wei, S.-J., X.-L. Zhang, and J. Shi, “Linear array SAR imagingvia compressed sensing,” Progress In Electromagnetics Research,Vol. 117, 299–319, 2011.
23. Li, J., S. Zhang, and J. Chang, “Applications of compressedsensing for multiple transmitters multiple azimuth beams SARimaging,” Progress In Electromagnetics Research, Vol. 127, 259–275, 2012.
24. Xing, S., D. Dai, Y. Li, and X. Wang, “Polarimetric SARtomography using `2,1 mixed norm sparse reconstruction method,”Progress In Electromagnetics Research, Vol. 130, 105–130, 2012.
25. Iqbal, M. and J. Chen, “Despecking of SAR images usingcompressive imaging framework,” Geoscience and Remote SensingSymposium, 2012 IEEE International Proceedings, IGARSS’12,264–267, Jul. 2012.
26. Figueiredo, M. A. T., R. D. Nowak, and S. J. Wright, “Gradientprojection for sparse reconstruction: Application to compressedsensing and other inverse problems,” IEEE Journal of SelectedTopics in Signal Processing, Vol. 1, No. 4, 586–597, Dec. 2007.
27. Needell, D. and R. Vershynin, “Signal recovery from incompleteand inaccurate measurements via regularized orthogonal matching
226 Iqbal et al.
pursuit,” IEEE Journal of Selected Topics in Signal Processing,Vol. 4, No. 2, 310–316, Apr. 2010.
28. Wakin, M. B., J. N. Laska, M. F. Duarte, D. Baron, S. Sarvotham,D. Takhar, K. F. Kelly, and R. G. Baraniuk, “An architecture forcompressive imaging,” 2006 IEEE International Conference onImage Processing, 1273–1276, Oct. 2006.
29. Sen, P. and S. Darabi, “Compressive rendering: A renderingapplication of compressed sensing,” IEEE Transactions onVisualization and Computer Graphics, Vol. 17, No. 4, 487–499,Apr. 2011.
30. Gonzalez, R. C. and R. E. Woods, Digital Image Processing,Prentice Hall, New York, 2008.
31. Gagnon, L. and A. Jouan, “Speckle filtering of SAR images: Acomparative study between complex-wavelet-based and standardfilters,” Proceedings of SPIE, Vol. 3169, 1997.
32. Shen, Y. and Z.-G. Xia, “A comprehensive evaluation of filtersfor radar speckle suppression,” Geoscience and Remote SensingSymposium, 1996 IEEE International Proceedings, IGARSS’96,Vol. 3, 1559–1561, May 1996.
33. Shamsoddini, A. and J. C. Trinder, “Image texture preservationin speckle noise suppression,” ISPRS TC VII Symposium — 100Years ISPR, W. Wagner and B. Szkely (eds.), Vol. XXXVIII,Part 7A, 239–244, Vienna, Austria, Jul. 5–7, 2010.
34. Zhang, W., F. Liu, L. Jiao, B. Hou, S. Wang, and R. Shang, “SARimage despeckling using edge detection and feature clustering inbandelet domain,” IEEE Geoscience and Remote Sensing Letters,Vol. 7, No. 1, 131–135, Jan. 2010.
35. Breit, H., T. Fritz, U. Balss, M. Lachaise, A. Niedermeier, andM. Vonavka, “Terrasar-x SAR processing and products,” IEEETransactions on Geoscience and Remote Sensing, Vol. 48, No. 2,727–740, Feb. 2010.
36. Frost, V. S., J. A. Stiles, K. S. Shanmugan, and J. C. Holtzman,“A model for radar images and its application to adaptivedigital filtering of multiplicative noise,” IEEE Transactions onPattern Analysis and Machine Intelligence, Vol. 4, No. 2, 157–166, Mar. 1982.
![A new hybrid filtering technique for minimization of over ... · despeckling which preserves the contour and the texture areas that lead to increases visual effects. Kazubek [10]](https://img.pdfslide.us/doc/110x75/605e7b945099bd30205f3992/a-new-hybrid-filtering-technique-for-minimization-of-over-despeckling-which.jpg)


![sec5 form r.ppt [Read-Only] - unisi.itgarzelli/documenti/07-SAR-filtering-enhancement.pdf · Canada Centre for Remote Sensing, Natural Resources Canada Radiometric Enhancement-Outline-](https://img.pdfslide.us/doc/110x75/5b42c4d07f8b9a80388b4d31/sec5-form-rppt-read-only-unisiit-garzellidocumenti07-sar-filtering-.jpg)