Embed Size (px)
Citation preview
Plant, Cell and Environment (1978) 1, 131 -140.
Sapwood water storage: its contribution to transpirationand effect upon water conductance through the stems ofold-growth Douglas-firR. H. WARING* & S. W. RUNNINGt * School of Forestry, Oregon State University, Corvallis, Oregon 97331, andt Department of Forest and Wood Science, Colorado State University, Fort Collins, Colorado 80523, U.S.A.
Received 21 November 1977; accepted for publication 9 March 1978
Abstract. Enough water is stored in the sapwood of largeDouglas-fir to significantly contribute to transpiration.Sapwood water content falls through the season, causingthe wood's conductivity to fall. This leads to low leaf-water potentials, stomatal closure, and reduced photo-synthesis by the trees.
The amount of water stored in the sapwood of Douglas-fir 50-60 m tall, growing in the Cascade Mountains ofOregon, was estimated periodically over two seasonsfrom measurements of sapwood relative water content(R 5). The relationship between R s and volume of watercontained in the sapwood was determined in the labora-tory, and an equation describing the variation of relativeconductivity (K) with R s was derived from the literature.Stomatal conductance (ks) and leaf water potentialswere measured in the field.
The relative conductivity of the sapwood was calcu-lated from estimates of the flow rate through the treeand differences in water potential between dawn and thetime of comparison. Flow rate was assumed to equaltranspiration rate, calculated from the Penman-Monteithequation using measured k, values. A sixfold decrease inK during the summer was attributed to changes in Rs.The maximum observed diurnal variation in K wouldrequire a change in Rs estimated at 25%.
About 270 m 3 ha-1 (27 mm) of water were stored insapwood, and 75% of that was in the stemwood. With-drawal from this store reached 1.7 mm day - ' on cleardays after cloudy or rainy weather. Recharge could bealmost as fast (up to 1.6 mm day -1) after rain, but wasvery slow if the foliage remained wet.
IntroductionFrictional resistance to water flowing in the roots andstems of plants, together with the gravitational poten-tial in tall trees, substantially reduce pressure in thexylem of rapidly transpiring plants. The relationshipsbetween flow and resistance are frequently representedby an Ohm's law analogy (e.g. Richter, 1973), but evid-ence suggests that in many plants, particularly trees, theanalogy breaks down because of capacitance.
Correspondence: Dr R. H. Waring, School of Forestry,Oregon State University, Corvallis, Oregon 97331, U.S.A.0140-7791/78/0600-0131$02.00©1978 Blackwell Scientific Publications
The tissues in a plant may be considered as a numberof alternative sources of water linked in parallel witheach other and the soil (Jarvis, 1975). Thus the totalflux from the plant as transpiration (E) may be madeup of a number of partial flows within the plant:
E = q i + q 2 +q 3 + qn (1)
where q 1 is the flow from the soil and q 2 to q,., are flowsfrom storage. The flow from a particular store is:
qi ( 1-`i 41.3dern)fri (2)
where n is resistance of the tissue to water movementand xvi is a function of the tissue relative water content,Ri . The volume of water that can come from storage is:
Vi = Vi -ARi = q i -dt (3)ti
where Vi is the volume of water in the turgid tissue. AsWeatherley (1970) pointed out, the relative sizes of theflows out of storage at any one time and their relativephasing depend upon the resistances between the storesand xylem, ri , the capacity of the stores, Vi , and therelationships between and Ri , the tissue moisturecharacteristics.
Initially, water will move out of storage from tissueclosest to the evaporation sites, the leaves. Because thissource is quite small, potential will quickly drop, and themain sources of supply will be progressively lower downthe plant (Dobbs & Scott, 1971). If storage within theplant is adequate and the resistances between storagetissue and xylem are lower than between xylem and soil,sufficient water may be withdrawn from tissues to meettranspiration requirements for considerable periods.
When water is withdrawn from wood, cavitation ratherthan shrinkage occurs (Siau, 1971). In conifer sapwood,numerous bordered pits connect the tangential walls ofthe conducting tracheary elements to other tracheids.When the water column cavitates, a pressure gradientquickly develops between the affected tracheid and itsneighbours. In early wood, a pressure gradient of 0.3 X10 5 Pa (0.3 bar) will cause bordered pits to close, sealingoff gas bubbles from the rest of the conducting tissue(Gregory & Petty, 1973).
Cavitation in conifer tracheids is reversible because itaffects only individual conducting elements, not the
131
MAM
DN0
O2
AJ
275235
195
155115
7535
360
320
280
240
200
160120
2
7
A
■
132 R. H. WARING & S. W. RUNNING
entire conducting column. The time required to recoverfrom cavitation is important for, if recovery takes months,the water stored in the sapwood could make only a smallcontribution to transpiration. But if cavitation is rapidlyreversible, sapwood water could be an important com-ponent of transpiration.
When Thomas & Kringstad (1971) dried wood blocksto a moisture content of 4%, the major proportion ofpits reopened after soaking the blocks in water for only1 week. Field studies of seasonal changes in sapwoodrelative to water content (R s) in Great Britain (Chalk &Bigg, 1956) and in Canada (Clark & Gibbs, 1957) suggestrapid rates of withdrawal and low recharge of the sap-wood in a variety of conifers including Douglas-fir.
The aim of this study was to assess variation in therate of withdrawal and recharge from the sapwood ofold-growth Douglas-fir in the Pacific Northwest of NorthAmerica. There winters are wet but rarely freezing, andsummers are consistently dry; consequently, rates of sap-wood water depletion and resaturation should be high.Further, by measuring shoot water potential and trans-piration rate diurnally when the sapwood has differentrelative water contents, we sought to evaluate to whatextent cavitation affects stem conductance.
Study areaBecause the necessary biomass and climatic data werereadily available, we selected Coniferous Forest BiomeReference Stand 17 in the H. J. Andrews ExperimentalForest, an International Biological Programme site situ-ated 70 km east of Eugene, Oregon, in the west-centralCascade Mountains (latitude 44° N, longitude 122° W).
The research stand was dominated by Douglas-fir(Pseudotsuga menziesii) trees, 50-60 m tall with diametersup to 1.5 m at 1.3 m above ground. Most wood volumewas contributed by the overstory Douglas-fir; the under-story canopy was western hemlock (Tsuga heterophylla)and western red cedar (Thuja plicata). Biomass and waterstorage for the major structural components of theDouglas-fir in this stand are estimated in Table 1.
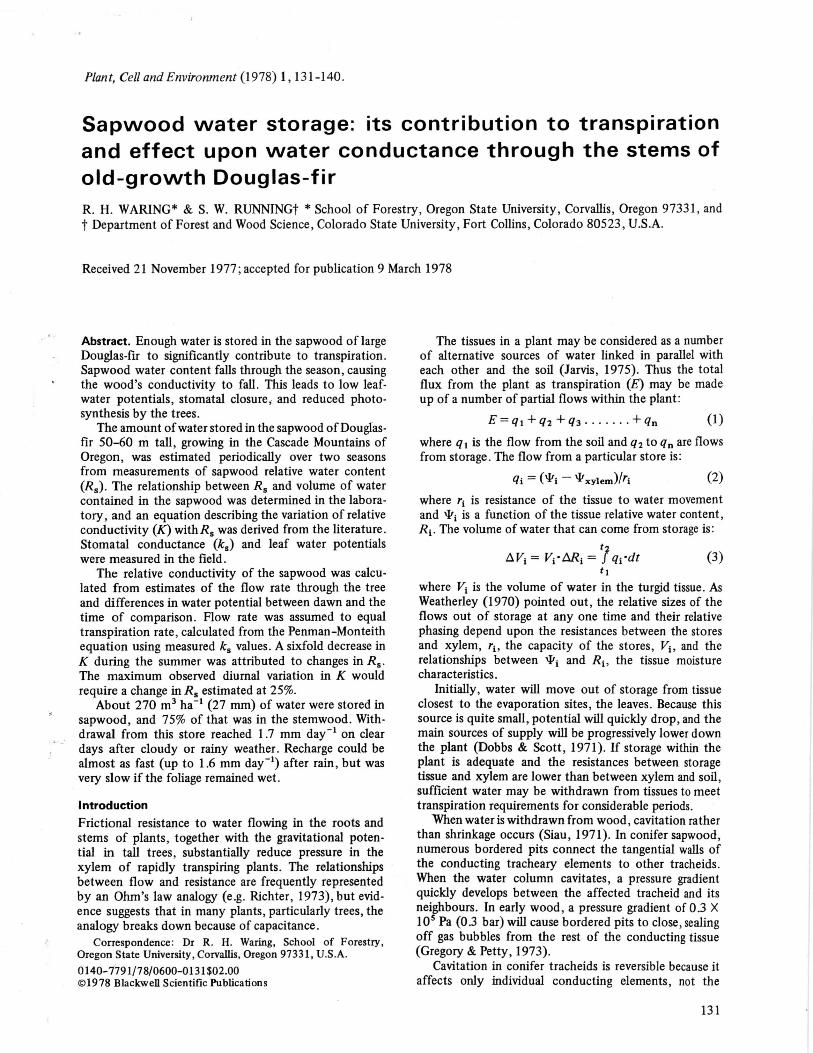
Note that mean monthly temperatures (Fig. 1)remained above freezing during the study period, even inDecember and January. Less than 5% of the 2454 mm ofprecipitation from July 1, 1975 to July 1, 1976 fellduring the summer. The patterns of precipitation andtemperature clearly indicate that the growing seasonfrom May through September was a time of high poten-tial evaporation; transpiration was generally low duringwinter.
Table 1. Biomass and water storage in old-growth Douglas-fir
Component Dry weight*(t ha')
Density(g cm')
Total volume(m 3 ha')
Sapwoodfraction
Sapwood volume(m3 ha')
Available waterfraction
Available watervolume (m' ha - ')
Foliage 9.9 1.00 1.5 0.20 0.3Living branches 36.7 0.60 61.2 0.50 30.6 0.49 15.0Stem wood 604.5 0.45 1343.3 0.26 349.3 0.57 199.0Roots > 5 mm dia. 140.0 0.45 311.1 0.30 93.3 0.57 53.2
Totals 791.1 1717.1 473.2 267.5
* From Grier & Logan (1977).
20 10 0 100 200 300 400TEMPERATURE (°C) MONTHLY PPT (mm)
Figure 1. Mean monthly day temperature and precipitation at the study site.

SAPWOOD WATER STORAGE 133
Methods
Transpiration rate (E)Throughout selected summer days when the trees haddifferent sapwood relative water contents (R e), the rateof transpiration from the canopy was estimated hourlyusing the Penman-Monteith combination equation(Monteith, 1965).
Based on studies of evaporation from Scots pine forestsin England (personal communication with J. B. Stewart,Institute of Hydrology, Wallingford, Oxon, England),the canopy was assumed wet when the vapour pressuredeficit remained below 100 Pa (1 mb). Thus transpira-tion, as distinct from evaporation, was estimated usingappropriate values of stomata! conductance (k 5) whenthe vapour pressure deficit (D) was larger than 100 Pa(1 mb). We assumed that the average values of ks forsamples of foliage at a height of 40-45 m representedthe entire canopy. The necessary climatic data were avail-able from a central meteorological station where airtemperature, dew point temperature, shortwave incom-ing radiation, and wind speed were averaged hourly(Waring, Holbo, Bueb, & Fredriksen, 1978). Net radia-tion in the canopy was calculated as 0.8 of the short-wave radiation (after Gay, 1971).
Evaporation from wet canopies was estimated fromequation (4) with infinite ks . Because boundary layerconductance (ka) is large relative to ks for conifer needles,even at low windspeeds, the rate of transpiration rarelyexceeds 5% of the evaporation rate of free water fromthe leaf surfaces (Jarvis, James, & Landsberg, 1976).Thus, to provide a closer comparison with actual trans-piration, a reference rate of potential transpiration wasalso calculated with ks set to the maximum measuredvalue of 0.2 X 10 -2 m s -1 expressed on the basis of totalsurface area (Running, 1976).
Leaf stomata! conductance (ks)Foliage was sampled on 3 days from 3 trees at a heightof 40-45 m. A 12-gauge shotgun loaded with 00 buck-shot was used to remove samples of shoots. Shoots werecaught and immediately placed in a null-balance diffu-sion porometer to measure leaf conductance (Beardsell,Jarvis, & Davidson, 1972).
The shoots, stored in plastic bags, were taken to thelaboratory where a surface area meter (Lambda Instru-ments, Inc.) determined projected leaf area. Leaf conduct-ance was calculated from leaf area, balancing flow rates,temperature, and humidity within the porometerchamber (Beardsell et al., 1972). Results were expressedon a total surface area basis, 2.5 times the projected leafarea.
Leaf water potential (4f L)Leaf water potential was measured with a pressurechamber (Scholander, Hammel, Bradstreet, & Hemming-sen, 1965) on shoots sampled simultaneously for leaf
conductance measurements. In addition, some shootsfrom the trees were sampled at night for estimatingmaximum water potential at the time of minimum trans-piration.
Sapwood relative water content (Re)
The relative water content of sapwood (R 5 ), expressedas a percentage, was calculated from:
Wf WdRs = • 100 (4)
Vf
where Wf fresh weight of wood, g; Wd = dry weight ofthe wood, g; Vf = volume of the wood, cm 3 ; Vs = volumeof solid material in the wood (= Wd/1.53), cm3.
The volume of solid material was calculated from thedry weight assuming that cellulose and lignin had a con-stant density of 1.53 g cm -3 (Siau, 1971; Skaar, 1972).Sapwood water deficit was (100 —Rs).
R s was measured on wood cores from five to ten largeDouglas-fir sampled weekly throughout the summer andat somewhat longer intervals during the rest of the year.The cores, from the outer 2-cm band of sapwood at 1.3-m height, were collected with an increment borer. Twocores with a total volume of 0.6079 cm 3 were takenfrom each tree, placed in vials, and later transported tothe laboratory to be weighed, dried at 70°C, and re-weighed.
To check the uniformity of Rs within individual trees,it was measured at various positions on nine trees 25- to30-m tall immediately after they had been felled. Sometrees had virtually no variation, as found by Chalk &Bigg (1956) and Clark & Gibbs (1951), but at othersampling times the values from the upper portion oftrees were 10-15% different from those at 1.3 m.Across the sapwood at the same height, we found onlyabout a 5% variation, similar to that reported by Chalk& Bigg (1956) in Douglas-fir.
Limited sampling in August, September and Octoberfailed to show a significant diurnal variation in Rs . Formaking comparisons throughout the year, we alwaystried to sample between 0800 and 1000 h.
Sapwood relative conductivity (K)In the xylem, liquid water moves by masss flow alonggradients of hydrostatic pressure (P) in the absence ofmembranes so that xylem pressure potential is the appro-priate driving force. Movement into cells adjacent to thepathway is by osmosis across membranes along gradientsof water potential (*). Because Alf is in dynamic equili-brium with xylem pressure potential and because theosmotic potential of xylem sap is small, we may assumethat Alf = P at a given height (Jarvis, 1975). Thus, theflow at any point is:
z ' chi/q =K J —dz = (41 , — 4/ 2)K (5)z2 dz
where (‘If s — 11' 2) is the pressure drop or water potentialdifference between z 1 and z 2 (Pa). Included in the sap-
134 R. H. WARING & S. W. RUNNING
wood relative conductivity, K, are effects attributable tothe length and cross-sectional area of the pathway andthe viscosity of water which depends on both tempera-ture and solute (Heine, 1971). Specifically, K, withunits of m 2 , is defined:
an/K=
(6)
A s (`1, 1 - ‘1,2)
where 77 = the viscosity of xylem sap, N s m -2 ; q = theflow rate, m 3 s"; l = the path length, m; A s = the cross-sectional area of sapwood, m2.
Average K values for a tree were calculated with equa-tion (6) assuming: water potential follows a uniformgradient from the base of the tree to the crown; trans-piration (E) approximates flow rate (q); the appropriatearea (A 5 ) equals the average of that at 1.3 m and at thebase of the crown; and the xylem sap is pure water with aviscosity dependent upon ambient temperature. We as-sume that the relative conductivity can be calculated at aspecified height (40-45 m) by comparing the differencein leaf water potential at predawn, when q 0, with thewater potential when transpiration is occurring.
An alternative calculation, which does not include theeffects of viscosity, is defined as conductivity, G, withunits of m 5 N-1 s' (Heine, 1971).
Volume of available water (0a)In a sample of wood of volume (Vf) at saturation, thevolume of water (VH20 ) is:
Vii20 Vf Vs - Vf Wd
(7)1.53
as defined in equation (4).The specific gravity (S.G.) of the sample is:
WdS.G. = -
VI
Substituting for Wd into equation (7):
VH2 0 = Vf (i S.G.
1.53Dividing through by Vf, , the volume fraction occupiedby water (0) is:
S.G.(1) = 1--
1.53Specific gravity, determined from core samples,
decreased from 0.5 at the base to 0.3 at the crown ofrapidly growing Douglas-fir 30-m tall. Assuming a con-servative average value of 0.45,
= 0.71 (m 3 of water per m 3 of wood).To determine the fraction of 0 available for exchange,
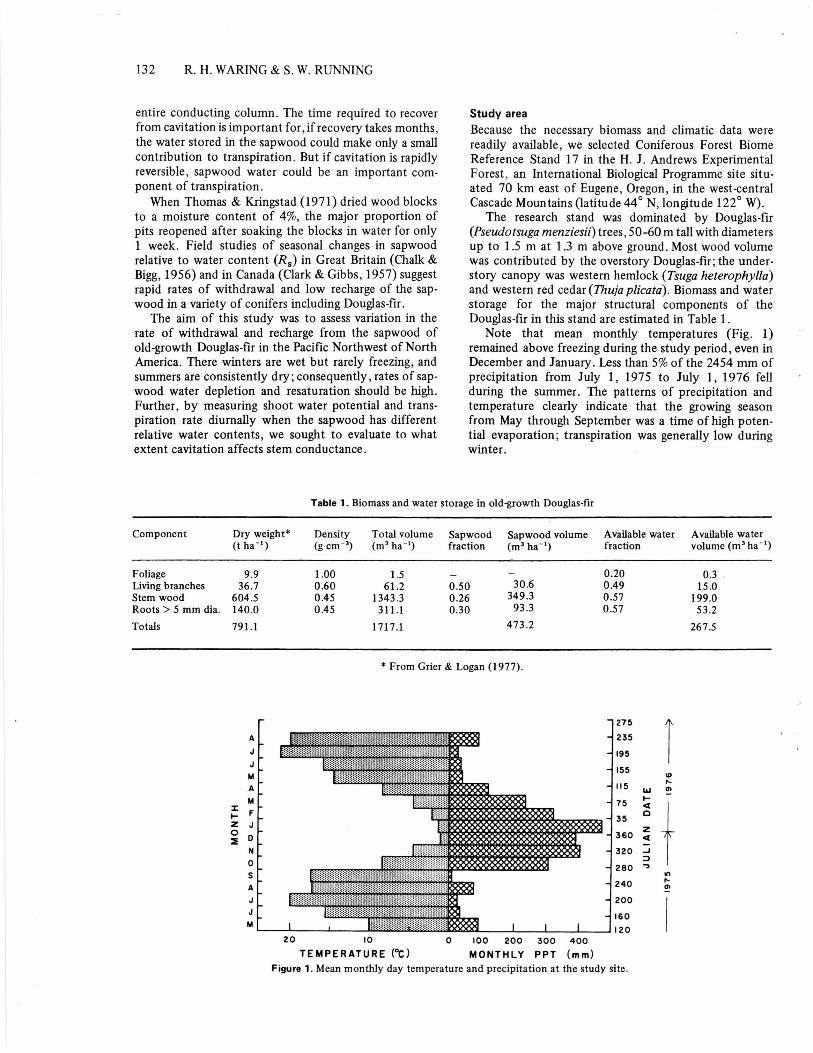
uniform samples of saturated Douglas-fir sapwood werecut into 5.4 cm 3 discs and placed above salt solutions ofdifferent osmotic potentials (n) for 6 weeks to equilibrateto constant weight. R s was calculated from equation (4).Once cavitation occurred, a water potential of only- 10 X 10 5 Pa (- 10 bar) was required to remove 80%of the water from the sapwood (Fig. 2). The water
-1 -15 -20 -25 -30 -35
-rr (10 5 Po)
Figure 2. The relation between relative water content (Rs) ofDouglas-fir sapwood and water potential. Discs of wood (5.4cm 3) were equilibrated over NaCI solutions with a range ofosmotic potentials (n) for 6 weeks. Standard errors are indicatedby vertical lines.
bound in hydration with the cell walls was estimated tobe somewhat less than 20% of the saturated content.Other calculations (after Siau, 1971) yield a similar value;therefore, up to 80% of the water in saturated sapwoodwas assumed available. Thus, the volume fraction ofavailable water was:
4)a = 0.8 = 0.57
The sapwood volume of the stem was estimated usingthe linear relationship that Grier & Waring (1974) deter-mined between foliage weight and sapwood cross-sectional area at a height of 1.3 m. The foliage biomassof 9.9 t ha -1 corresponds to a sapwood basal area of13.42 m 2 ha -1 . Our observations on smaller trees suggestthat sapwood area decreases 50% between 1.3 m and thebase of the crown. Assuming the base of the crown is atan average height of 35 m, the volume of sapwood belowthe crown ( 17 ) is:
113.4 + (0.5) 13.4Vsw = 35 = 349 m3 ha'
2This figure is 26% of the total volume of stemwood,again a conservative estimate for total volume of sap-wood because most of the stemwood in the crown is alsosapwood. Then the volume of available water is:
Va Vsw • Oa = 349 • 0.57 = 199 m 3 ha -1 (20 mm of water).The sapwood fraction of living branches and roots
was conservatively estimated from a few samples, andavailable water was similarly estimated (Table 1).
For the foliage, the maximum change in R L wasassumed to be 20% over a range in '1' from 0 to -30 X10 5 Pa, and the saturated weight was assumed equivalentto 150% of the dry weight, so the maximum volume ofwater stored in the foliage was 0.3 m 3 ha' (0.03 mm ofwater).
Thus, the stemwood contains at least 75% of the totalwater stored in the trees, and a 1% change in R s repre-sents 2.5 m 3 ha -1 (0.25 mm) of water. For the tree as awhole, a 1% change in R 5 is equivalent to 33 m 3 ha"(0.33 mm) of water. The foliage stores only 0.1% of thetotal capacity (see Table 1).
30
( a )25
20
>-0 15
EW 10
5
0
50
•
10O
I I t 1 1
200 240 280 320 360 35 1975
0 - 120 160 75 115
1976155 195 235
SAPWOOD WATER STORAGE 135
Results
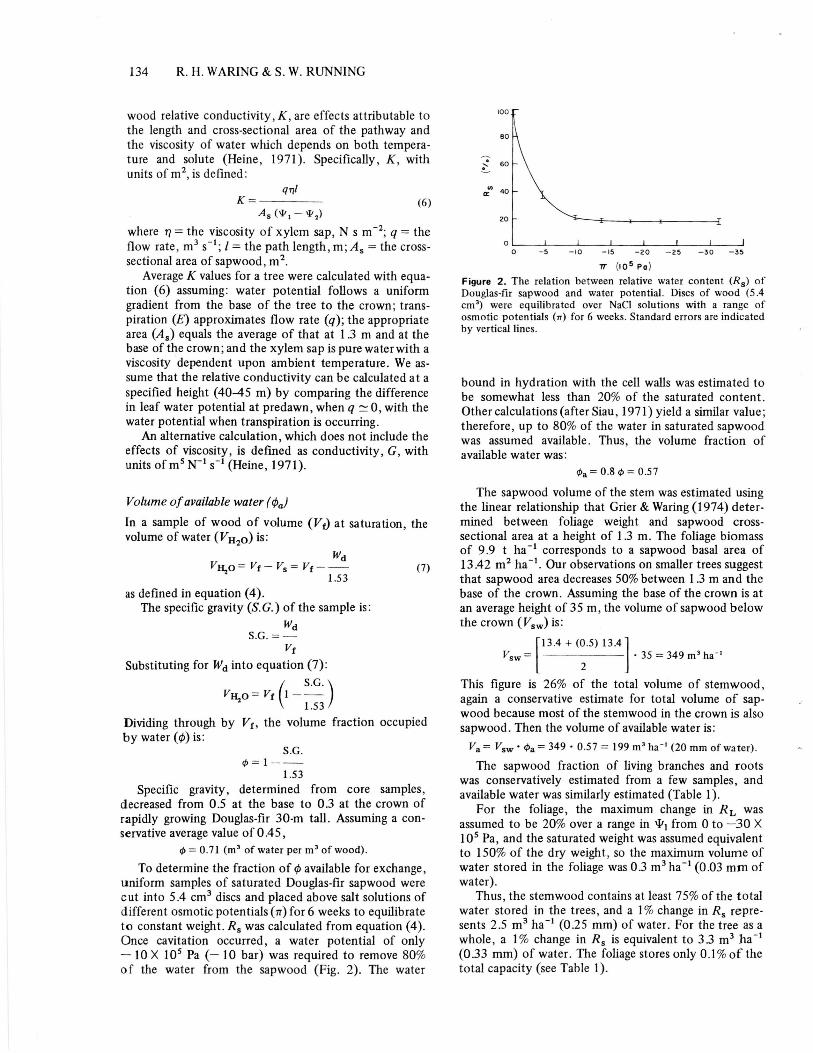
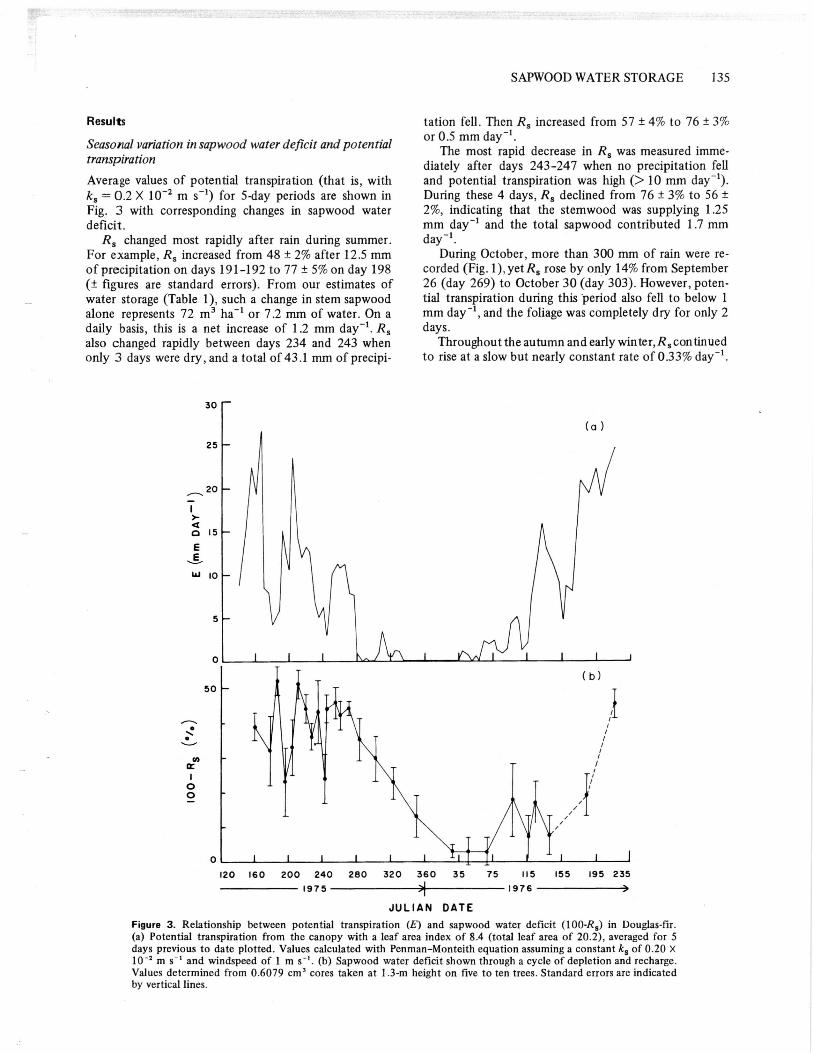
Seasonal variation in sapwood water deficit and potentialtranspirationAverage values of potential transpiration (that is, withks 0.2 X 10 -2 m s") for 5-day periods are shown inFig. 3 with corresponding changes in sapwood waterdeficit.
R, changed most rapidly after rain during summer.For example, Rs increased from 48 ± 2% after 12.5 mmof precipitation on days 191-192 to 77 ± 5% on day 198(± figures are standard errors). From our estimates ofwater storage (Table 1), such a change in stem sapwoodalone represents 72 m 3 ha' or 7.2 mm of water. On adaily basis, this is a net increase of 1.2 mm day'. Rsalso changed rapidly between days 234 and 243 whenonly 3 days were dry, and a total of 43.1 mm of precipi-
tation fell. Then R, increased from 57 ± 4% to 76 ± 3%or 0.5 mm day'.
The most rapid decrease in R, was measured imme-diately after days 243-247 when no precipitation felland potential transpiration was high (> 10 mm day").During these 4 days, R s declined from 76 ± 3% to 56 ±2%, indicating that the stemwood was supplying 1.25mm day' and the total sapwood contributed 1.7 mmday'.
During October, more than 300 mm of rain were re-corded (Fig. 1). yet R s rose by only 14% from September26 (day 269) to October 30 (day 303). However, poten-tial transpiration during this period also fell to below 1mm day -1 , and the foliage was completely dry for only 2days.
Throughout the autumn and early winter, R, continuedto rise at a slow but nearly constant rate of 0.33% day".
JULIAN DATE
Figure 3. Relationship between potential transpiration (E) and sapwood water deficit (100-R s) in Douglas-fir.(a) Potential transpiration from the canopy with a leaf area index of 8.4 (total leaf area of 20.2), averaged for 5days previous to date plotted. Values calculated with Penman-Monteith equation assuming a constant k s of 0.20 X10' m s' and windspeed of 1 m s". (b) Sapwood water deficit shown through a cycle of depletion and recharge.Values determined from 0.6079 cm' cores taken at I.3-m height on five to ten trees. Standard errors are indicatedby vertical lines.
-4-8
-120In
0-16
-J
0.20
0.10
0
-20-24
136 R. H. WARING & S. W. RUNNING
After a period of 57 days without dry foliage, the sap-wood reached full capacity by January 23 and remainedsaturated until day 69; R, subsequently varied between82 and 93% until the end of May (day 139). Thereafter,we greatly reduced our sampling intensity, and we mayonly conclude that a major deficit in sapwood watercontent again developed in August 1976.
Comparing E with sapwood water deficit (Fig. 3)shows that sapwood did not remain at full capacity if
191 Pa (19.1 mb). Average R s at the start of the day was78%. 4 September 1975 (day 247) was also clear withpredawn klfL of - 9.0 and a minimum of - 23 X 105Pa. Average R, was 56%, and lc, fell from 0.07 to 0.01 X10 -2 m s -1 at 1400 h when D reached 220 Pa (22.0 mb).
The diurnal course of actual transpiration (E) increaseduntil 1000 h on May 6 and July 1 and until 1200 h onSeptember 4. The total amount of water transpired oneach of the 3 days was 3.5, 3.1, and 1.8 mm day-1.
4 6 8 10 12 14 16 18 20TI ME (h)
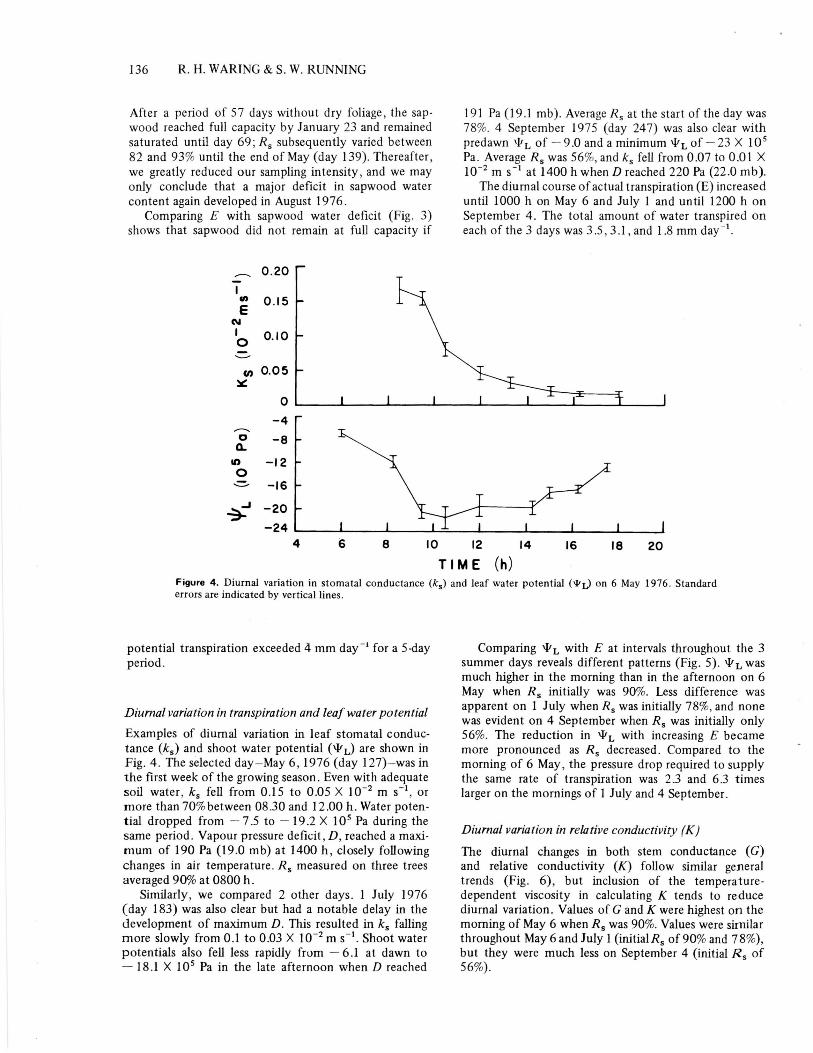
Figure 4. Diurnal variation in stomatal conductance (k5 ) and leaf water potential (9%) on 6 May 1976. Standarderrors are indicated by vertical lines.
potential transpiration exceeded 4 mm day' for a 5-dayperiod.
Diurnal variation in transpiration and leaf water potentialExamples of diurnal variation in leaf stomatal conduc-tance (ks ) and shoot water potential ( x1f L) are shown inFig. 4. The selected day-May 6, 1976 (day 127)-was inthe first week of the growing season. Even with adequatesoil water, k, fell from 0.15 to 0.05 X 10 -2 m s -1 . ormore than 70% between 08.30 and 12.00 h. Water poten-tial dropped from - 7.5 to -19.2 X 10 5 Pa during thesame period. Vapour pressure deficit, D, reached a maxi-mum of 190 Pa (19.0 mb) at 1400 h, closely followingchanges in air temperature. R, measured on three treesaveraged 90% at 0800 h.
Similarly, we compared 2 other days. 1 July 1976(day 183) was also clear but had a notable delay in thedevelopment of maximum D. This resulted in k, fallingmore slowly from 0.1 to 0.03 X 10 -2 m s - '. Shoot waterpotentials also fell less rapidly from - 6.1 at dawn to- 18.1 X 10 5 Pa in the late afternoon when D reached
Comparing "L with E at intervals throughout the 3summer days reveals different patterns (Fig. 5). T T, wasmuch higher in the morning than in the afternoon on 6May when R, initially was 90%. Less difference wasapparent on 1 July when R, was initially 78%, and nonewas evident on 4 September when R, was initially only56%. The reduction in ‘P L, with increasing E becamemore pronounced as R, decreased. Compared to themorning of 6 May, the pressure drop required to supplythe same rate of transpiration was 2.3 and 6.3 timeslarger on the mornings of 1 July and 4 September.
Diurnal variation in relative conductivity (K)The diurnal changes in both stem conductance (G)and relative conductivity (K) follow similar generaltrends (Fig. 6), but inclusion of the temperature-dependent viscosity in calculating K tends to reducediurnal variation. Values of G and K were highest on themorning of May 6 when R, was 90%. Values were similarthroughout May 6 and July 1 (initial Rs of 90% and 78%),but they were much less on September 4 (initial R, of56%).
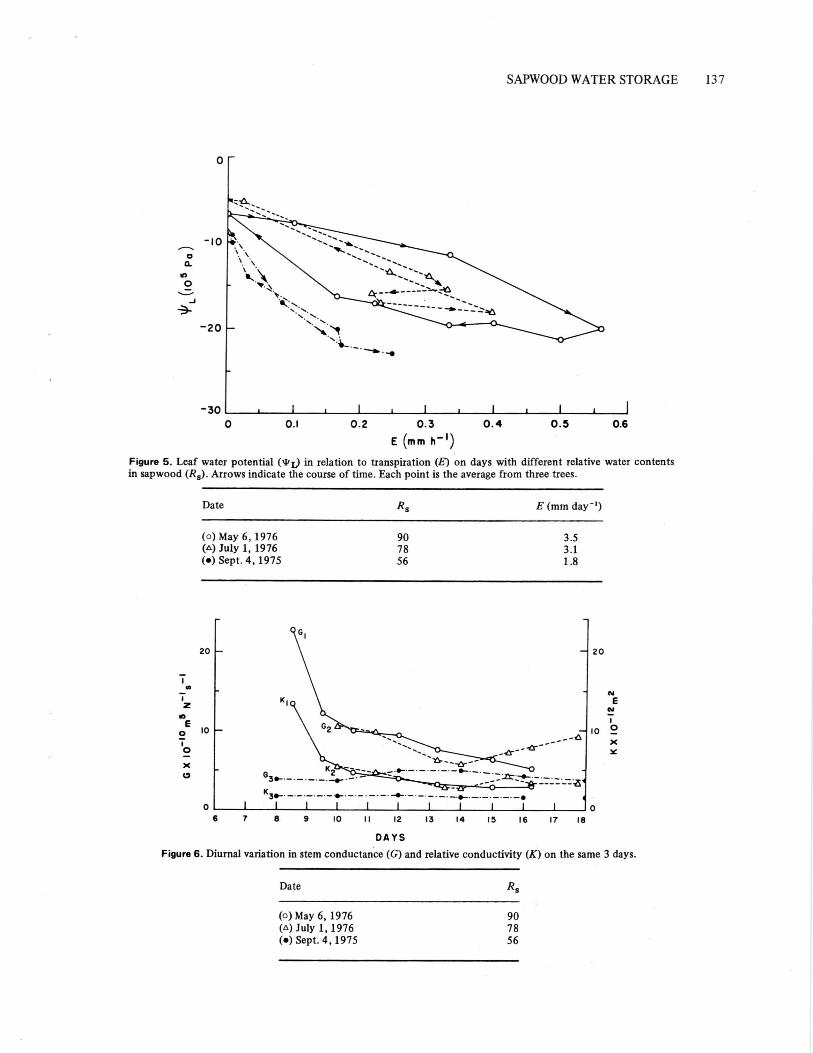
Date Rs E (mm day')
907856
3.53.11.8
(0) May 6, 1976(A) July 1, 1976(•) Sept. 4, 1975
20 20
Nto
X
E10 10
6
I I I0 06 12 13 14 15 16 17 18
K
I I I I I
7 8 9 10 11
SAPWOOD WATER STORAGE 137
0 0.1 0.2 0.3
0.4
0.5
0.6
E (mm
Figure 5. Leaf water potential (‘P L) in relation to transpiration (E) on days with different relative water contentsin sapwood (Rs). Arrows indicate the course of time. Each point is the average from three trees.
DAYS
Figure 6. Diurnal variation in stem conductance (G) and relative conductivity (K) on the same 3 days.
Date Rs
(0) May 6, 1976 90(A) July 1, 1976 78(e) Sept. 4, 1975 56
138 R. H. WARING & S. W. RUNNING
Discussion
The seasonal analysis of Rs suggests that contributionsof water from that stored in sapwood are largest in thespring and early summer. Depletion of sapwood waterbegan almost as soon as transpiration, consistent withthe hypothesis that the most readily available sources ofwater are drawn on first (Weatherley, 1970).
The rate of change in R s did not exceed 5% day" andfell to as little as 0.33% day' during the period of winterrecharge. Because all sampling was restricted to the outer2-cm band of sapwood near the base of the tree, largerchanges possibly occurred higher up, particularly in thecanopy where specific gravity of the wood is less and thewater potentials are lower.
The amount of water contributed from sapwood inthe stem reached 1.2 mm day'. If all the sapwood inthe tree contributes similarly, the total contributioncould reach 1.7 mm day -1 . However, the limbs withtheir higher wood density are less likely to suffer cavita-tion and probably do not contribute as much. The roots,nearest the water in the soil and furthest from thedemand, probably contribute in a minor way too.
The seasonal variation in R 5 (Fig. 3) is similar to thefindings of Chalk & Bigg (1956) and Clark & Gibbs(1957).
Although the foliage was fully rehydrated by October3, Rs remained low until well into November, then rosesteadily until the stem was completely recharged in mid-January. Apparently numerous cavitated tracheids can-not refill instantly when transpiration is very low, butinstead refill gradually over an extended period.
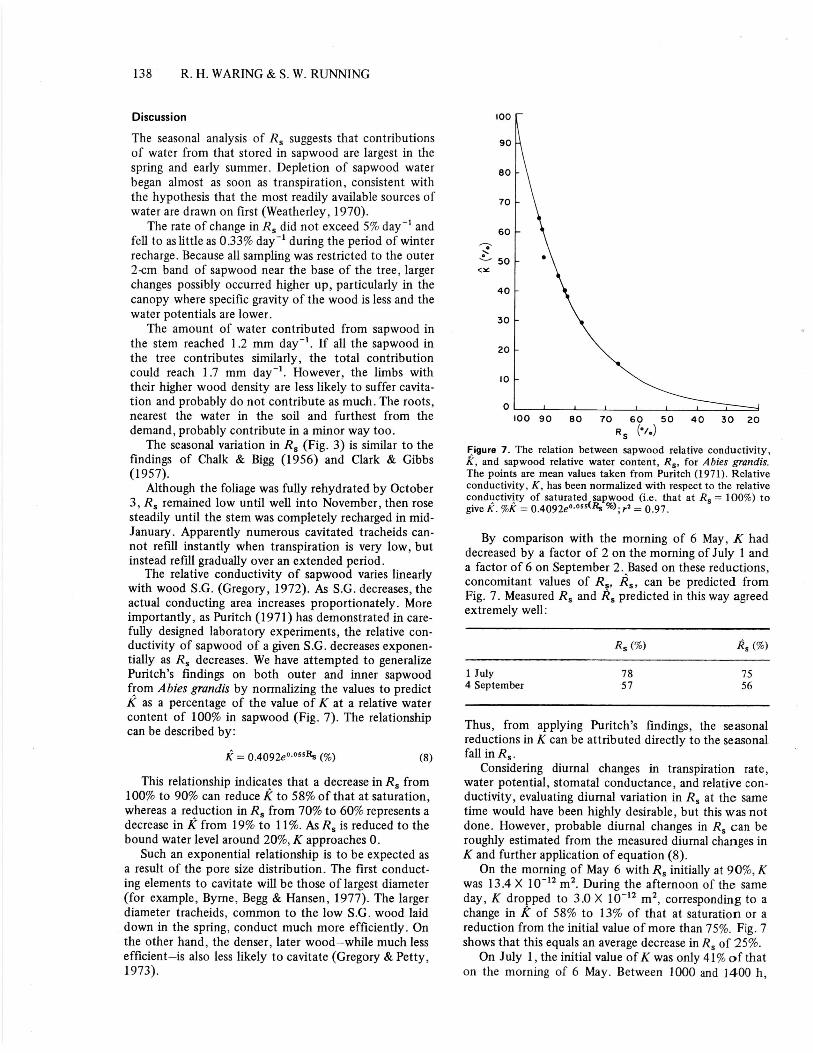
The relative conductivity of sapwood varies linearlywith wood S.G. (Gregory, 1972). As S.G. decreases, theactual conducting area increases proportionately. Moreimportantly, as Puritch (1971) has demonstrated in care-fully designed laboratory experiments, the relative con-ductivity of sapwood of a given S.G. decreases exponen-tially as Rs decreases. We have attempted to generalizePuritch's findings on both outer and inner sapwoodfrom Abies grandis by normalizing the values to predictK as a percentage of the value of K at a relative watercontent of 100% in sapwood (Fig. 7). The relationshipcan be described by:
K = 0.4092e .•"5R. (%) (8)
This relationship indicates that a decrease in R s from100% to 90% can reduce K to 58% of that at saturation,whereas a reduction in Rs from 70% to 60% represents adecrease in K from 19% to 11%. As Rs is reduced to thebound water level around 20%, K approaches 0.
Such an exponential relationship is to be expected asa result of the pore size distribution. The first conduct-ing elements to cavitate will be those of largest diameter(for example, Byrne, Begg & Hansen, 1977). The largerdiameter tracheids, common to the low S.G. wood laiddown in the spring, conduct much more efficiently. Onthe other hand, the denser, later wood—while much lessefficient—is also less likely to cavitate (Gregory & Petty,1973).
100
90
80
70
60
50<le
40
30
20
10
0100 90 80 70 60 50 40 30 20
R (°/..)Figure 7. The relation between sapwood relative conductivity,K, and sapwood relative water content, R s , for Abies grandis.The points are mean values taken from Puritch (1971). Relativeconductivity, K, has been normalized with respect to the relativeconductivity of saturated sapwood (i.e. that at R s = 100%) togive K. %K 0.4092e-"Rs %); r2 = 0.97.
By comparison with the morning of 6 May, K haddecreased by a factor of 2 on the morning of July 1 anda factor of 6 on September 2. Based on these reductions,concomitant values of Rs, Rs , can be predicted fromFig. 7. Measured Rs and Rs predicted in this way agreedextremely well:
Rs(%) RS (%)
1 July 78 754 September 57 56
Thus, from applying Puritch's findings, the seasonalreductions in K can be attributed directly to the seasonalfall in Rs.
Considering diurnal changes in transpiration rate,water potential, stomatal conductance, and relative con-ductivity, evaluating diurnal variation in Rs at the sametime would have been highly desirable, but this was notdone. However, probable diurnal changes in Rs can beroughly estimated from the measured diurnal changes inK and further application of equation (8).
On the morning of May 6 with R s initially at 90%, Kwas 13.4 X 10 -12 m 2 . During the afternoon of the sameday, K dropped to 3.0 X 10 -12 m 2 , corresponding to achange in IZ of 58% to 13% of that at saturation or areduction from the initial value of more than 75%. Fig. 7shows that this equals an average decrease in R s of 25%.
On July 1, the initial value of K was only 41% of thaton the morning of 6 May. Between 1000 and 1400 h,
SAPWOOD WATER STORAGE 139
K decreased from 5.5 to 2.7 X 10 -12 m 2 and, thereafter,increased again reaching 4.4 X 10 -12 m 2 in the late after-noon. This change in K corresponds to a fall in R s from78% to a minimum of 65%. In September the initialvalue of Rs was only 56%, and K was much lower andmuch less variable, ranging from 1.7 to 2.0 X 10 -12 m2.Average K was 9%, and the calculated diurnal variationin R s was less than 3%.
Recently the senior author measured R, of Scots pine3- to 5-m tall through the first clear days of the growingseason immediately after snow melt in Sweden (23-24May 1977). In these small trees, Rs changed 20% from81% to 61% (standard error = 2%) during a day similarin several respects to May 6 in this study. Thus, onMay 6, the Rs of Douglas-fir quite possibly could havechanged diurnally by 25%.
The marked hysteresis in the relation between "Land E at high Rs on May 6 and the lack of hysteresis atlow R. on September 4 are consistent with the hypo-thesis that water moves to the evaporation sites in theleaves from the nearest sources of most readily availablewater, such as the branches and sapwood in the treecrown (Jarvis, 1976). Rs is unlikely to have changed uni-formly throughout the tree. Rather we expect that theRs of sapwood in the upper crown may be higher at thestart of the day and that a large change in Rs in that partof the tree could account for much of the change in K.We have found the crown wood on smaller trees (30-mtall) to have a Rs of 90% to 95%, while the stemwoodbelow was at 80% to 85%.
Because these tissues are finite sources of water, theircapacity to supply water must decrease as water is with-drawn. Thus, as transpiration increases through the morn-ing, sapwood water deficit is likely to spread down thetree, progressively reducing average K. As transpirationfalls again in the afternoon, this process would beexpected to reverse and K to increase again as on July 1,provided that water is available in the soil and that K ishigh enough for the water to move easily through theplant. However, as the season progresses and the store ofwater in the sapwood empties, K falls further and remainslow, possibly because it is now too low for water tomove easily back into the large number of cavitatedtracheids.
Once Rs reaches an extremely low level in the autumn,the sapwood probably cannot provide a substantialsupply of water for transpiration (cf. Roberts, 1976).However, in the summer when Rs is changing substan-tially from day to day and probably also diurnally, largeamounts of water from the sapwood may be transpired.For example, depletion of stored water on 6 May iscalculated as more than 6 mm, much higher than ourcalculated E. However, allowing for errors in biomassestimates and in our assumptions and measurements ofleaf stomatal area, as well as allowing for the fact thateven a generalized relationship as defined for Abiesgrandis is unlikely to exactly fit old-growth Douglas-firtrees, sapwood clearly stores a considerable amount ofwater that is drawn upon to meet the evaporativedemand.
Notwithstanding this supply of water, stomata] con-ductance falls almost from the onset of appreciabletranspiration in April until October, possibly becauseDouglas-fir stomata respond to a saturation deficit (Tan& Black, 1976).
Our data suggest that large trees may be particularlysensitive to high evaporative demand as evidenced byalmost complete stomata] closure in the afternoon duringthe first week of the growing season. Because stomatalconductance affects photosynthesis as well as transpira-tion, the results strongly support the conclusion reachedby Emmingham & Waring (1976) that Douglas-fir treesin the Pacific Northwest may accumulate more than 50%of their total assimilation from October to May.
Summary
Sapwood is a major reservoir for water. In old-growthDouglas-fir, it may be drawn upon to supply 1.7 mmday -1 for short periods. During the summer, recharge atthe rate of 1.0 mm day -1 is not uncommon after precipi-tation. During autumn and winter when the canopy iswet much of the time, recharge averages less than 0.1mm day -1 . The total storage capacity of the Douglas-firforest is estimated at 267 m 3 water ha -1 (26.7 mm), 75%of which is in the stemwood.
Stem conductance (G) and relative conductivity (K)decrease more than sixfold between May and September,signifying that a proportional increase in pressure drop(A1P) is required to maintain the same transpiration rate.These changes- can be accounted for by an exponentialdecrease in G and K expected from measured changes insapwood relative water content (Rs).
Calculations suggest that, under some conditions, adiurnal change in Rs of as much as 25% may be requiredto explain the observed decrease in G and K. AlthoughR s in small trees changed 20%, a much smaller overallchange can be expected in large trees. The largest varia-tion is likely in the upper stem and crown where Rs maybe initially higher than at the base of the tree and wherethe specific gravity of wood is notably less.
The fact that large trees begin to deplete their sap-wood water reservoirs and to close their stomata almostfrom the onset of transpiration in April supports otherstudies that indicate October to May as a critically impor-tant period for the carbon balance of conifers in thePacific Northwest of the United States.
Acknowledgments
This work was initiated under National Science Founda-tion Grant No. GB-36810X to the Coniferous ForestBiome, U.S. Analysis of Ecosystem. The manuscript wasdeveloped in application for National Science FoundationGrant DEB 76-10765 and completed while the seniorauthor was on sabbatical at the Department of Forestryand Natural Resources, University of Edinburgh,Scotland.
We should particularly thank Professor Paul G. Jarvis,University of Edinburgh and Dr J. J. Landsberg, Long
140 R. H. WARING & S. W. RUNNING
Ashton Research Station, Bristol for their critical reviewsof the original manuscript. This is contribution No. 254of the Coniferous Forest Biome and paper 1116 of theForest Research Laboratory, School of Forestry, OregonState University, Corvallis.
References
Beardsell, M.F., Jarvis, P.G. & Davidson, B. (1972) A null-balancediffusion porometer suitable for use with leaves of manyshapes. Journal of Applied Ecology 9, 677-690.
Byrne, G.F., Begg, J.E. & Hansen, G.K. (1977) Cavitation andresistance to water flow in plant roots. Agriculture Meteoro-logy, 18, 21-15.
Chalk, L. & Bigg, J.M. (1956) The distribution of moisture in theliving stem in Sitka spruce and Douglas-fir. Forestry, 29, 5-21.
Clark, J. & Gibbs, R.D. (1957) Studies in tree physiology. IV.Further investigations of seasonal changes in moisture con-tent of certain Canadian forest trees. Canadian Journal ofBotany, 35, 219-253.
Dobbs, R.C. & Scott, D.R.M. (1971) Distribution of diurnal fluc-tuations in stem circumference of Douglas-fir. CanadianJournal of Forest Research, 1, 80-83.
Emmingham, W.H. & Waring, R.H. (1976) An index of photo-synthesis for comparing forest sites in western Oregon.Canadian Journal of Forest Research, 7, 165-174.
Gay, L.W. (1971) The regression of net radiation upon solarradiation. Archiv Pr Meterologie, Geophysik undBioklimato-logie, Series B, 19, 1-14.
Gregory, S.C. (1972) Some effects of the pathogenic fungus Peri-dermium pini (Pers.) Lev. on the water physiology of Pinussylvestris Linn. Ph.D. thesis, University of Aberdeen, Scotland,p. 457.
Gregory, S.C. & Petty, J.A. (1973) Valve actions of bordered pitsin conifers. Journal of Experimental Botany 24, 763-767.
Grier, C.C. & Logan, R.S. (1977) Old growth Douglas-fir commu-nities of a western Oregon watershed: biomass distributionand production budgets. Ecological Monographs, 47, 373-400.
Grier C.C. & Waring R.H. (1974) Conifer foliage mass related tosapwood area. Forest Science, 20, 205-206.
Heine, R.W. (1971) Hydraulic conductivity in trees. Journal ofExperimental Botany, 22, 503-511.
Jarvis, P.G. (1975) Water transfer in plants. In: Heat and MassTransfer in the Environment of Vegetation (Ed. by D. A. deVries and N. H. Afgan), 1974 Seminar of the International
Centre for Heat and Mass Transfer, Dubrovnik, pp. 369-394. Scripta Book Company, Washington, D.C.
Jarvis, P.G. (1976) The interpretation of the variation in leafwater potential and stomatal conductance found in canopiesin the field. Philosophical Transactions of the Royal Societyof London, Series B, 273, 593-610.
Jarvis, P.G., James, G.B. & Landsberg, J.J. (1976) Coniferousforest. In: Vegetation and the Atmosphere, Vol. 2, CaseStudies (Ed. by J. L. Monteith), pp. 171-240. AcademicPress. London.
Monteith, J.L. (1965) Evaporation and environment. In: TheState and Movement of Water in Living Organisms (Ed. by G.E. Fogg). Symposia of the Society for Experimental Biology,19, 205-234.
Puritch, G.S. (1971) Water permeability of the wood of Grand fir(Abies grandis (Doug.) Lindl.) in relation to infestation bythe balsam woolly aphid, Adeleges piceae (Ratz.). Journal ofExperimental Botany, 22, 936-945.
Richter, H. (1973) Frictional potential losses and total waterpotential in plants: a re-evaluation. Journal of ExperimentalBotany 24, 983-994.
Roberts, J. (1976) An examination of the quantity of waterstored in mature Pinus sylvestris L. trees. Journal of Experi-mental Botany, 27, 473-479.
Running, S.W. (1976) Environmental control of leaf water con-ductance in conifers. Canadian Journal of Forest Research, 6,104-112.
Scholander, P.F., Hammel, H.T., Bradstreet, E.D. & Hemmingsen,E.A. (1965) Sap pressure in vascular plants. Science, 148,339-346.
Siau, J.F. (1971) Flow in Wood. Syracuse Wood Science Series 1,p. 131. Syracuse University Press, Syracuse, New York.
Skaar, C. (1972) Water in Wood. Syracuse Wood Science Series 4,p. 218. Syracuse University Press, Syracuse, New York.
Tan, C.S. & Black, T.A. (1976) Factors affecting the canopy resist-ance of a Douglas-fn forest. Boundary-layer Meteorology, 10,475-488.
Thomas, R.J. & Kringstad, K.P. (1971) The role of hydrogenbonding on pit aspiration. Holz forschung, 25, 143-149.
Waring, R.H., Holbo, H.R., Bueb, R.P. & Fredriksen, R.L. (1978)Meteorological data report from the Coniferous ForestBiome's primary station on the H. J. Andrews ExperimentalForest in Oregon. U.S. Forest Service, Pacific NorthwestForest and Range Experiment Station, Portland, Oregon (inpress).
Weatherley, P.E. (1970) Some aspects of water relations. In:Advances in Botanical Research, Vol. 3 (Ed. by R. D. Preston),pp. 171-206. Academic Press, London.