Embed Size (px)
Citation preview
1/53Copyright, 2017 SAPPORO HOLDINGS LTD. All rights reserved.
August 4, 2017
Sapporo Group Business Results Presentation for the Six Months Ended June 30, 2017
URL http://www.sapporoholdings.jp/english
2/53Copyright, 2017 SAPPORO HOLDINGS LTD. All rights reserved.
Contents
1. 2017 2Q Point P3
2. 2017 2Q Results P4~32
Appendix:Collection of Data by business P33~52
3/53Copyright, 2017 SAPPORO HOLDINGS LTD. All rights reserved.
First-Half 2017 Point
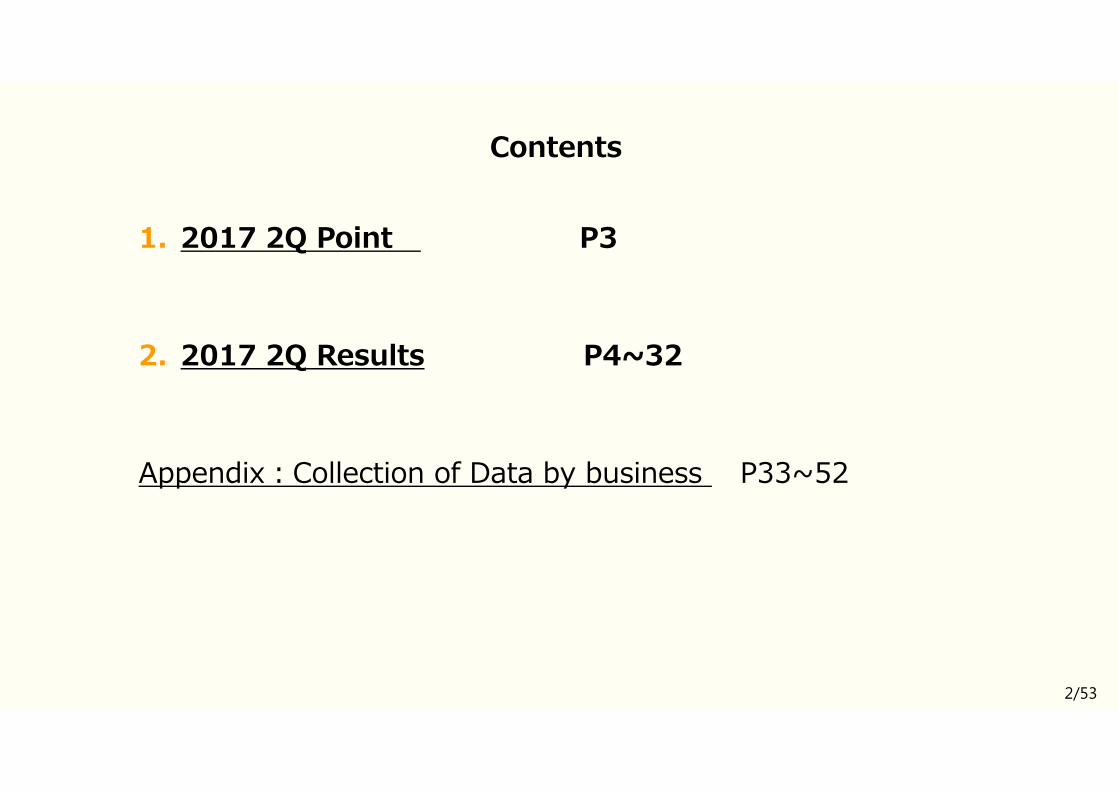
First- Half 2017 Results Point
Progress in line with initial plan
No change to full-year forecast
Promote initiatives for transformation of the Group management platform and enhancement brand
Toward growth in the “Food” field and global business expansion・Acquisition of entire equity in Anchor Brewing Company・Transfer production of silver Cans which have been produced by
SLEEMAN, Canada to Vietnam・Relaunch of soy milk yogurt , etc.
4/53Copyright, 2017 SAPPORO HOLDINGS LTD. All rights reserved.
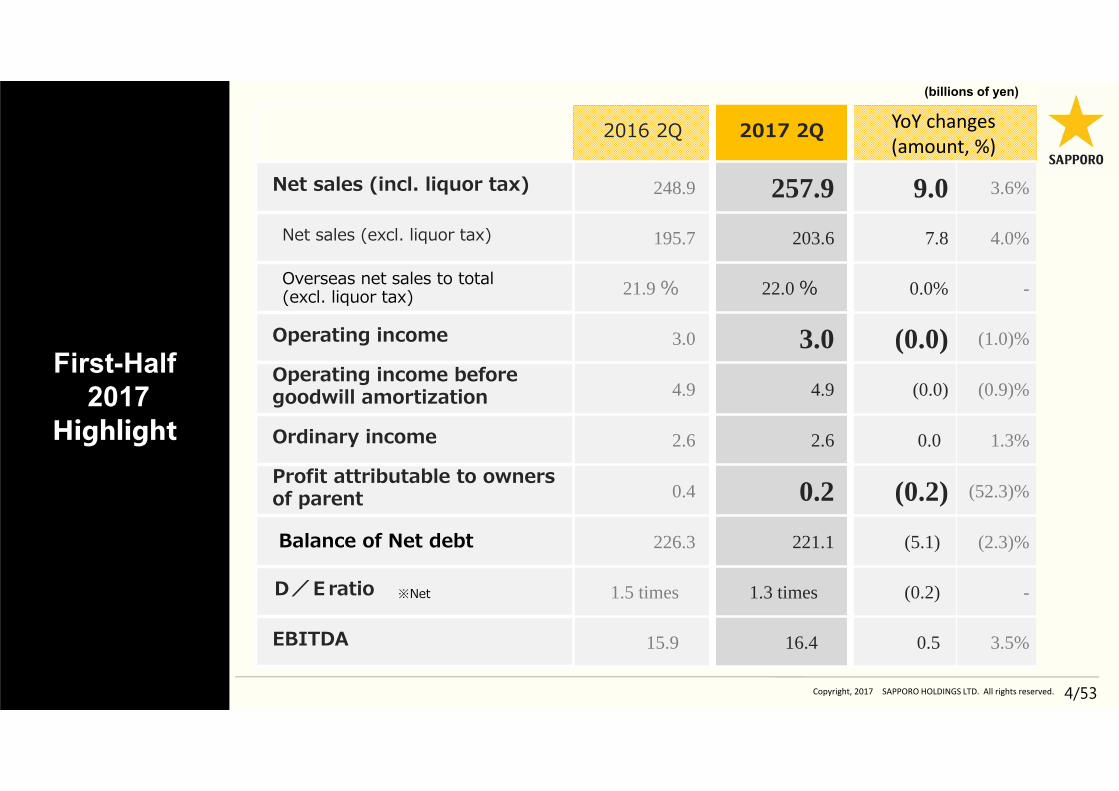
First-Half2017
Highlight
2016 2Q 2017 2Q YoY changes(amount, %)
Net sales (incl. liquor tax) 248.9 257.9 9.0 3.6%
Net sales (excl. liquor tax) 195.7 203.6 7.8 4.0%
Overseas net sales to total (excl. liquor tax) 21.9 % 22.0 % 0.0% -
Operating income 3.0 3.0 (0.0) (1.0)%
Operating income before goodwill amortization 4.9 4.9 (0.0) (0.9)%
Ordinary income 2.6 2.6 0.0 1.3%
Profit attributable to owners of parent 0.4 0.2 (0.2) (52.3)%
Balance of Net debt 226.3 221.1 (5.1) (2.3)%
D/Eratio 1.5 times 1.3 times (0.2) -
EBITDA 15.9 16.4 0.5 3.5%
※Net
(billions of yen)
5/53Copyright, 2017 SAPPORO HOLDINGS LTD. All rights reserved.
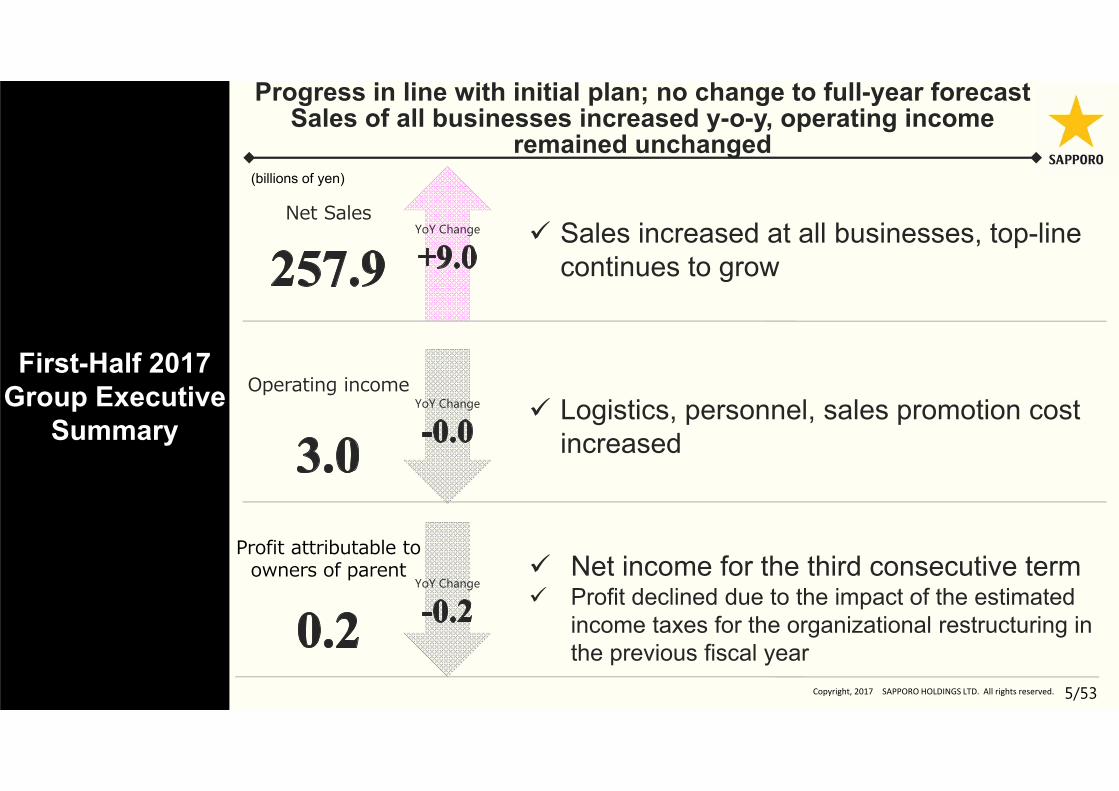
First-Half 2017Group Executive
Summary
Net Sales
Operating income
Profit attributable toowners of parent
Sales increased at all businesses, top-line continues to grow
Logistics, personnel, sales promotion cost increased
Net income for the third consecutive term Profit declined due to the impact of the estimated
income taxes for the organizational restructuring in the previous fiscal year
YoY Change
YoY Change
YoY Change
Progress in line with initial plan; no change to full-year forecastSales of all businesses increased y-o-y, operating income
remained unchanged(billions of yen)
6/53Copyright, 2017 SAPPORO HOLDINGS LTD. All rights reserved.
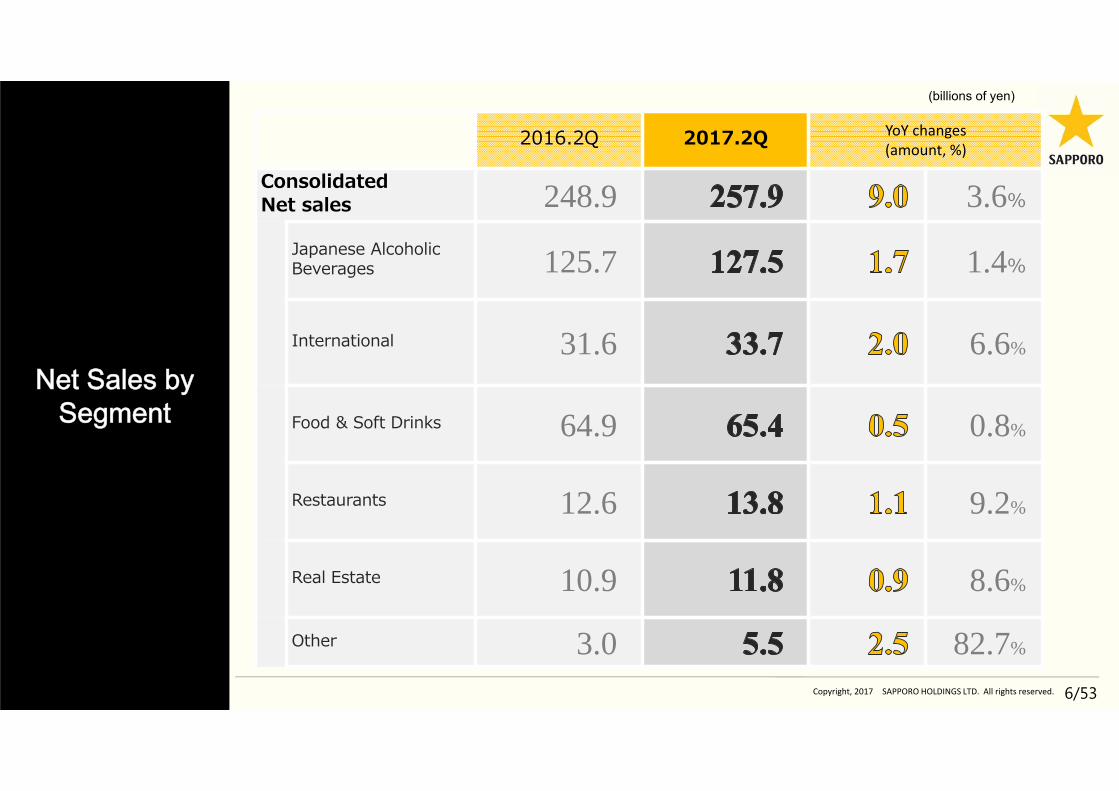
Net Sales by Segment
2016.2Q 2017.2Q YoY changes(amount, %)
Consolidated Net sales 248.9 3.6%
Japanese Alcoholic Beverages 125.7 1.4%
International 31.6 6.6%
Food & Soft Drinks 64.9 0.8%
Restaurants 12.6 9.2%
Real Estate 10.9 8.6%
Other 3.0 82.7%
(billions of yen)
7/53Copyright, 2017 SAPPORO HOLDINGS LTD. All rights reserved.
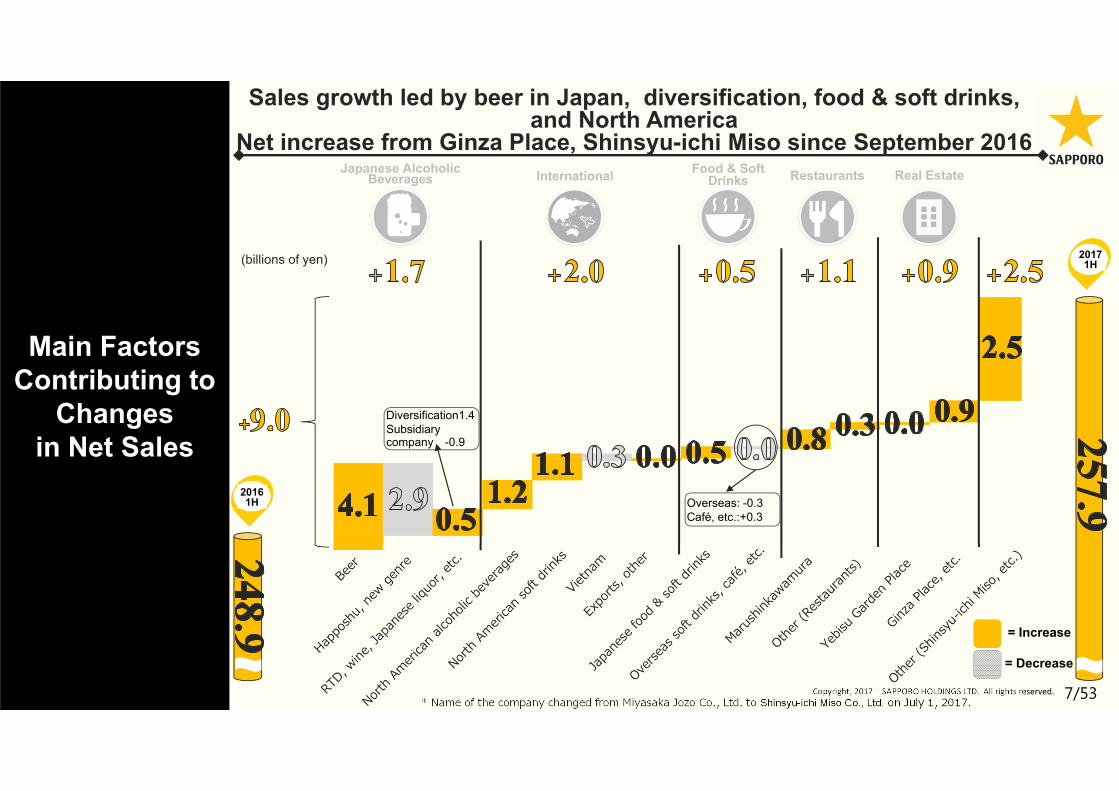
Main FactorsContributing to
Changes in Net Sales
Japanese Alcoholic Beverages International Food & Soft
Drinks Restaurants Real Estate
Sales growth led by beer in Japan, diversification, food & soft drinks, and North America
Net increase from Ginza Place, Shinsyu-ichi Miso since September 2016
* Name of the company changed from Miyasaka Jozo Co., Ltd. to Shinsyu-ichi Miso Co., Ltd. on July 1, 2017.
Overseas: -0.3Café, etc.:+0.3
= Decrease
= Increase
(billions of yen)
20161H
20171H
Diversification1.4Subsidiarycompany -0.9
8/53Copyright, 2017 SAPPORO HOLDINGS LTD. All rights reserved.
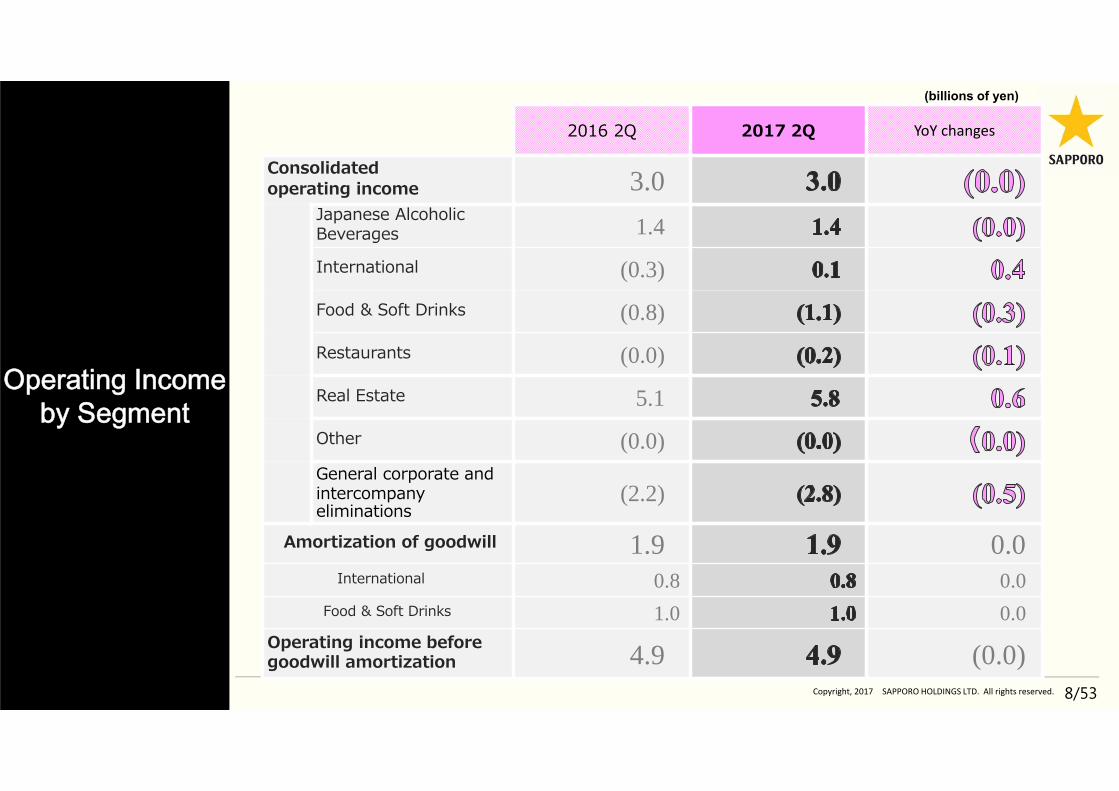
Operating Income by Segment
2016 2Q 2017 2Q YoY changes
Consolidatedoperating income 3.0
Japanese Alcoholic Beverages 1.4
International (0.3)
Food & Soft Drinks (0.8)
Restaurants (0.0)
Real Estate 5.1
Other (0.0)General corporate and intercompany eliminations
(2.2)
Amortization of goodwill 1.9 0.0International 0.8 0.0
Food & Soft Drinks 1.0 0.0Operating income before goodwill amortization 4.9 (0.0)
(billions of yen)
9/53Copyright, 2017 SAPPORO HOLDINGS LTD. All rights reserved.
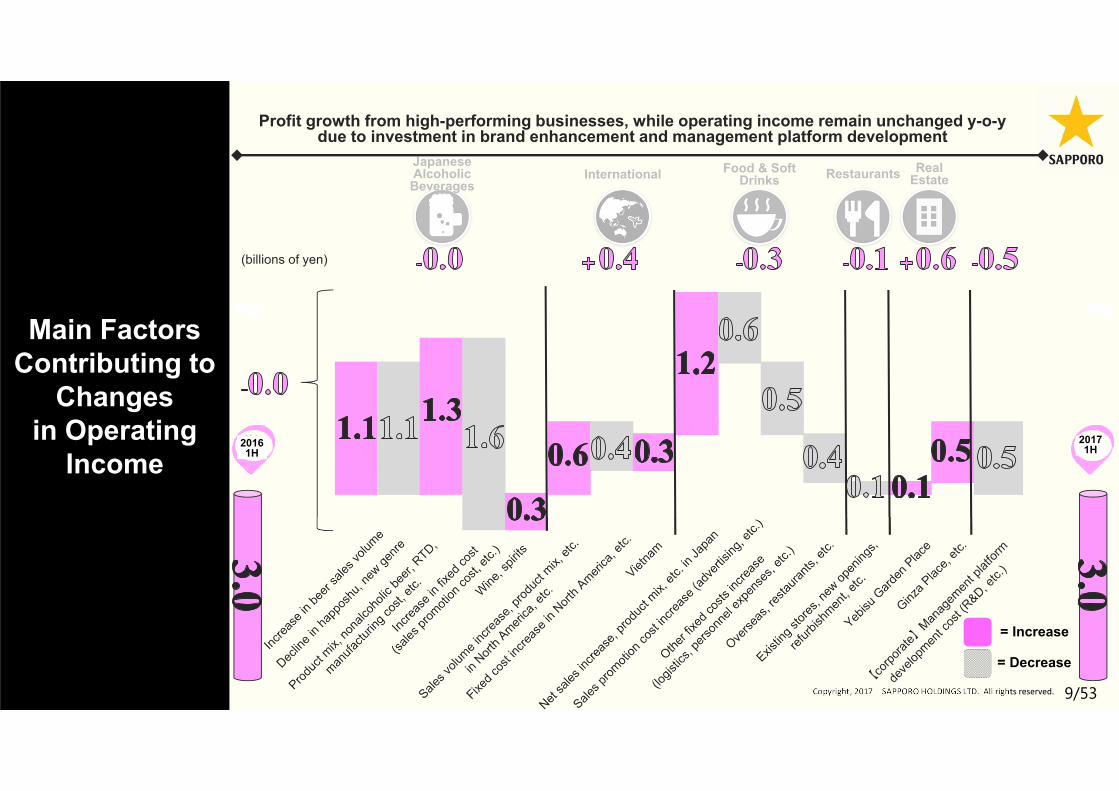
Main FactorsContributing to
Changes in Operating
Income
Japanese Alcoholic Beverages
International Food & Soft Drinks Restaurants Real
Estate
Profit growth from high-performing businesses, while operating income remain unchanged y-o-y due to investment in brand enhancement and management platform development
= Decrease
= Increase
(billions of yen)
20161H
20171H
10/53Copyright, 2017 SAPPORO HOLDINGS LTD. All rights reserved.
Overview of Each Business
11/53Copyright, 2017 SAPPORO HOLDINGS LTD. All rights reserved.
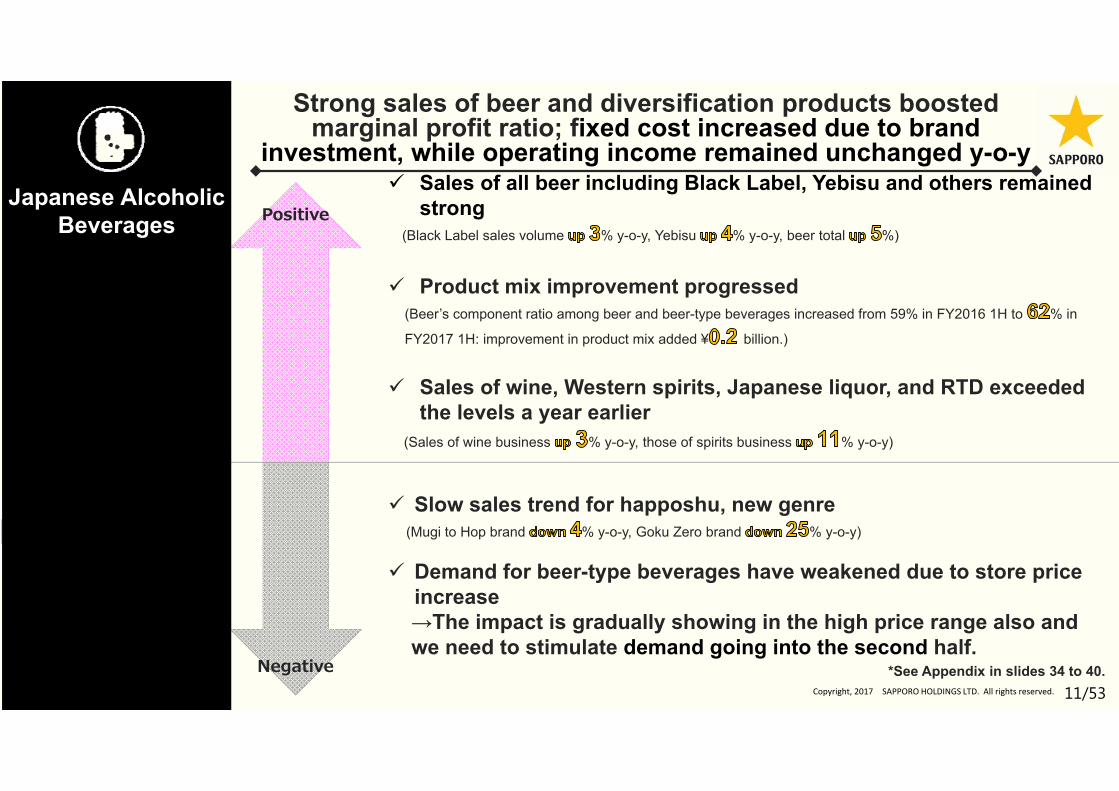
*See Appendix in slides 34 to 40.
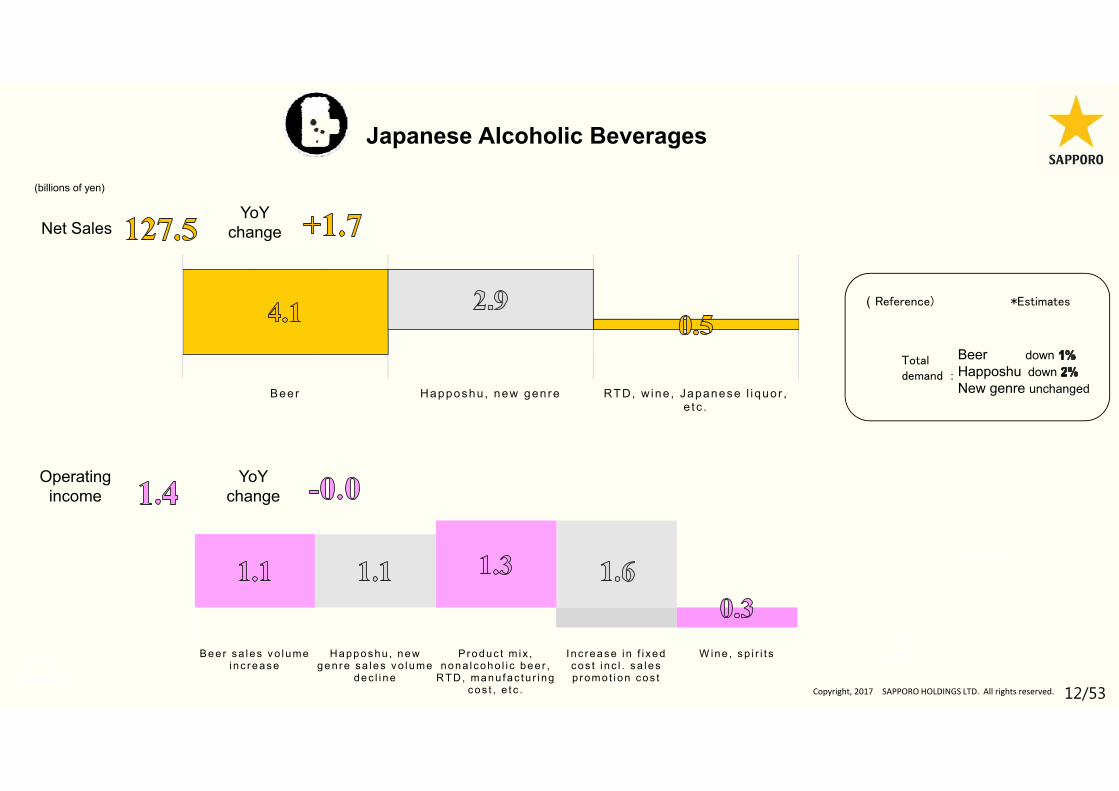
Sales of all beer including Black Label, Yebisu and others remained strong
(Black Label sales volume % y-o-y, Yebisu % y-o-y, beer total %)
Product mix improvement progressed(Beer’s component ratio among beer and beer-type beverages increased from 59% in FY2016 1H to % in
FY2017 1H: improvement in product mix added ¥ billion.)
Sales of wine, Western spirits, Japanese liquor, and RTD exceeded the levels a year earlier
(Sales of wine business % y-o-y, those of spirits business % y-o-y)
Slow sales trend for happoshu, new genre(Mugi to Hop brand % y-o-y, Goku Zero brand % y-o-y)
Demand for beer-type beverages have weakened due to store price increase→The impact is gradually showing in the high price range also and we need to stimulate demand going into the second half.
Sales
Positive
Negative
Strong sales of beer and diversification products boosted marginal profit ratio; fixed cost increased due to brand
investment, while operating income remained unchanged y-o-y
Total demand
:Beer down 1%Happoshu down 2%New genre unchanged
(Reference) *Estimates
B e e r H a p p o s h u , n e w g e n r e
R T D , w i n e , J a p a n e s e
l i q u o r , e t c .
Operating income
YoYchange
YoYchange
B e e r s a l e s v o l u m e
i n c r e a s e
H a p p o s h u , n e w g e n r e s a l e s
v o l u m e d e c l i n e
P r o d u c t m i x , n o n a l c o h o l i c
b e e r , R T D , m a n u f a c t u r i n g
c o s t , e t c .
I n c r e a s e i n f i x e d c o s t i n c l . s a l e s
p r o m o t i o n c o s t
W i n e , s p i r i t s
(billions of yen)
Japanese Alcoholic Beverages
12/53Copyright, 2017 SAPPORO HOLDINGS LTD. All rights reserved.
Net Sales
Total demand
*Estimates
Operating income
YoY change
YoY change
((billions of yen)
Japanese Alcoholic Beverages
Total demand
Beer down Happoshu down New genre unchanged
(Reference) *Estimates
Totaldemand :
Beer Happoshu, new genre RTD, w ine , Japanese l iquor , e tc .
Bee r sa les v o lume i nc rease
Happoshu , new gen re sa les v o lume
dec l i ne
Produc t m ix , nona l coho l i c bee r ,
RT D, manu fac tu r i ng cos t , e t c .
I nc rease i n f i xed cos t i nc l . sa les p romo t i on cos t
W ine , sp i r i t s
13/53Copyright, 2017 SAPPORO HOLDINGS LTD. All rights reserved.
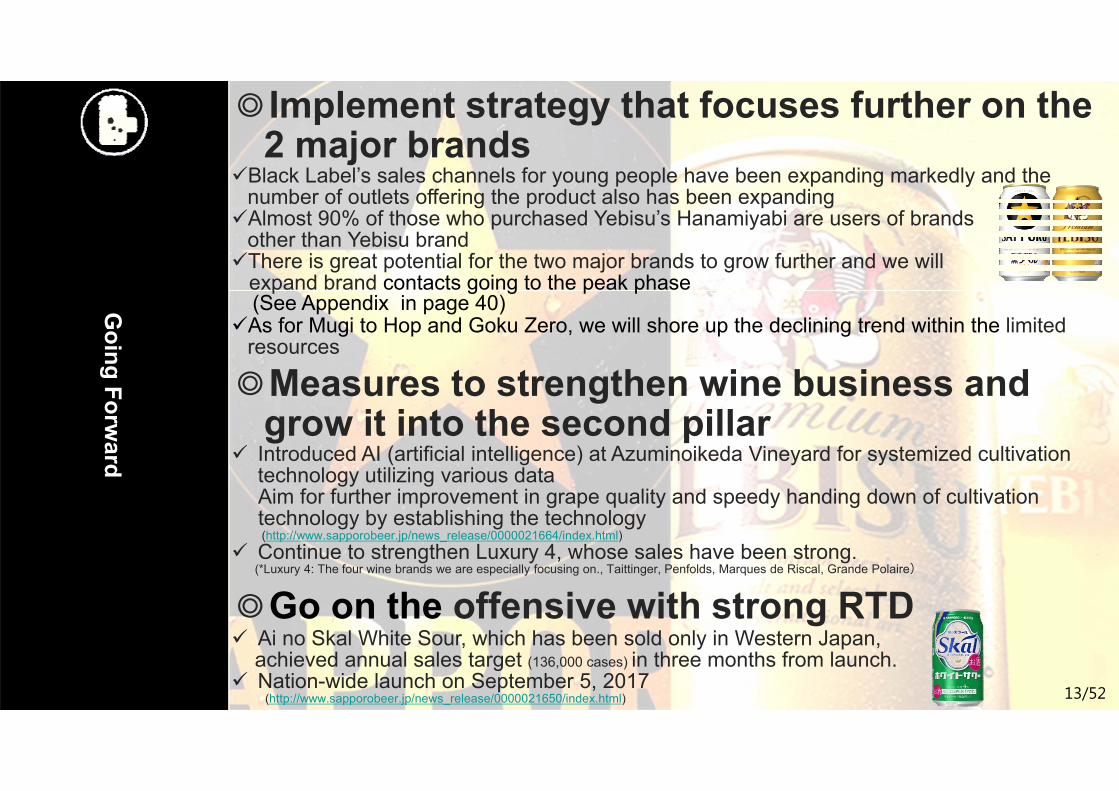
◎Implement strategy that focuses further on the 2 major brands
Black Label’s sales channels for young people have been expanding markedly and the number of outlets offering the product also has been expandingAlmost 90% of those who purchased Yebisu’s Hanamiyabi are users of brands
other than Yebisu brandThere is great potential for the two major brands to grow further and we will
expand brand contacts going to the peak phase(See Appendix in page 40)
As for Mugi to Hop and Goku Zero, we will shore up the declining trend within the limited resources
◎Measures to strengthen wine business and grow it into the second pillar
Introduced AI (artificial intelligence) at Azuminoikeda Vineyard for systemized cultivation technology utilizing various dataAim for further improvement in grape quality and speedy handing down of cultivation technology by establishing the technology(http://www.sapporobeer.jp/news_release/0000021664/index.html)
Continue to strengthen Luxury 4, whose sales have been strong. (*Luxury 4: The four wine brands we are especially focusing on., Taittinger, Penfolds, Marques de Riscal, Grande Polaire)
◎Go on the offensive with strong RTD Ai no Skal White Sour, which has been sold only in Western Japan,
achieved annual sales target (136,000 cases) in three months from launch. Nation-wide launch on September 5, 2017
(http://www.sapporobeer.jp/news_release/0000021650/index.html)
Going Forw
ard
13/52
14/53Copyright, 2017 SAPPORO HOLDINGS LTD. All rights reserved.
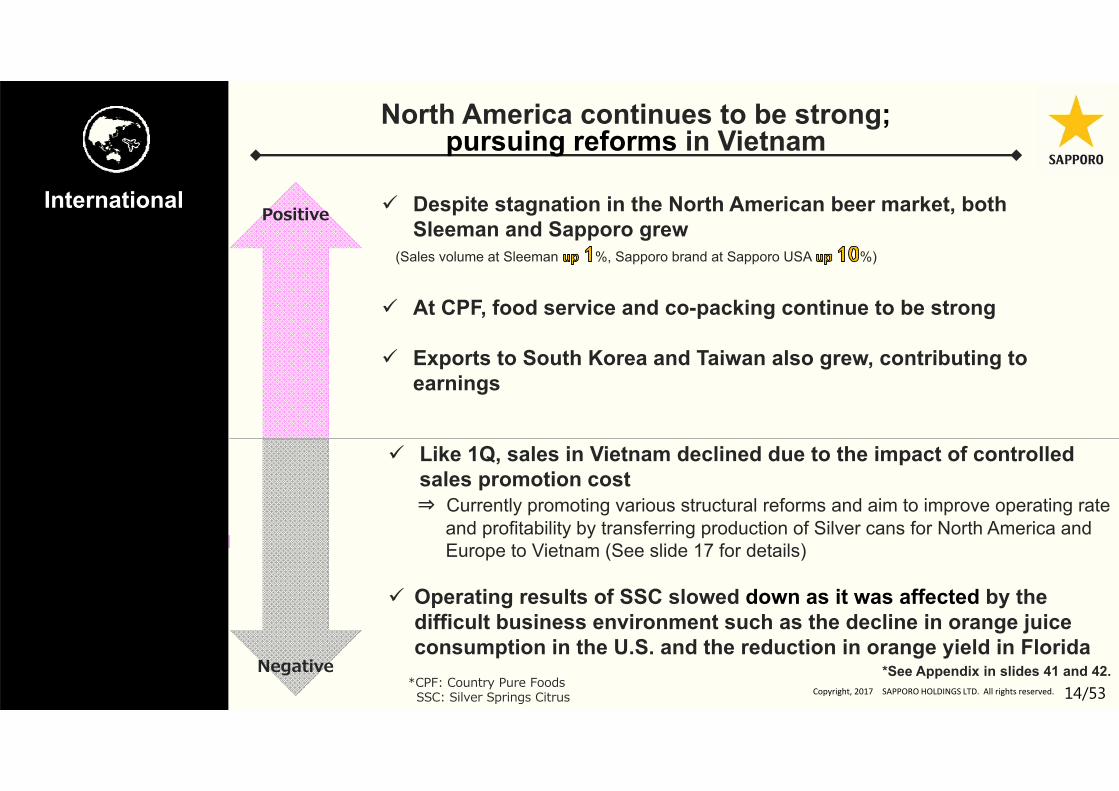
Despite stagnation in the North American beer market, both Sleeman and Sapporo grew
(Sales volume at Sleeman %, Sapporo brand at Sapporo USA %)
At CPF, food service and co-packing continue to be strong
Exports to South Korea and Taiwan also grew, contributing to earnings
Like 1Q, sales in Vietnam declined due to the impact of controlled sales promotion cost⇒ Currently promoting various structural reforms and aim to improve operating rate
and profitability by transferring production of Silver cans for North America and Europe to Vietnam (See slide 17 for details)
Operating results of SSC slowed down as it was affected by the difficult business environment such as the decline in orange juice consumption in the U.S. and the reduction in orange yield in Florida
Positive
Negative
North America continues to be strong; pursuing reforms in Vietnam
*CPF: Country Pure FoodsSSC: Silver Springs Citrus
:Canadian beer
down about 2%U.S. beer
down about 2%
Sales
Operating income
YoY change
YoYchange
*See Appendix in slides 41 and 42.Total
demand
(Reference) *Estimates
(billions of yen)
S a l e s v o l ume i n c r e a s e ,
p r o d u c t m i x , e t c . i n No r t h Ame r i c a , e t c .
I n c r e a s e i n f i x e d c o s t i n
No r t h Ame r i c a , e t c .
V i e t n am
S a l e s v o l ume i n c r e a s e ,
p r o d u c t m i x , e t c . i n No r t h Ame r i c a , e t c .
I n c r e a s e i n f i x e d c o s t i n
No r t h Ame r i c a , e t c .
V i e t n am
International
15/53Copyright, 2017 SAPPORO HOLDINGS LTD. All rights reserved.
Net Sales
Total demand
*Estimates
Operating income
YoY change
YoY change
((billions of yen)
International
Total demand
(Reference) *Estimates
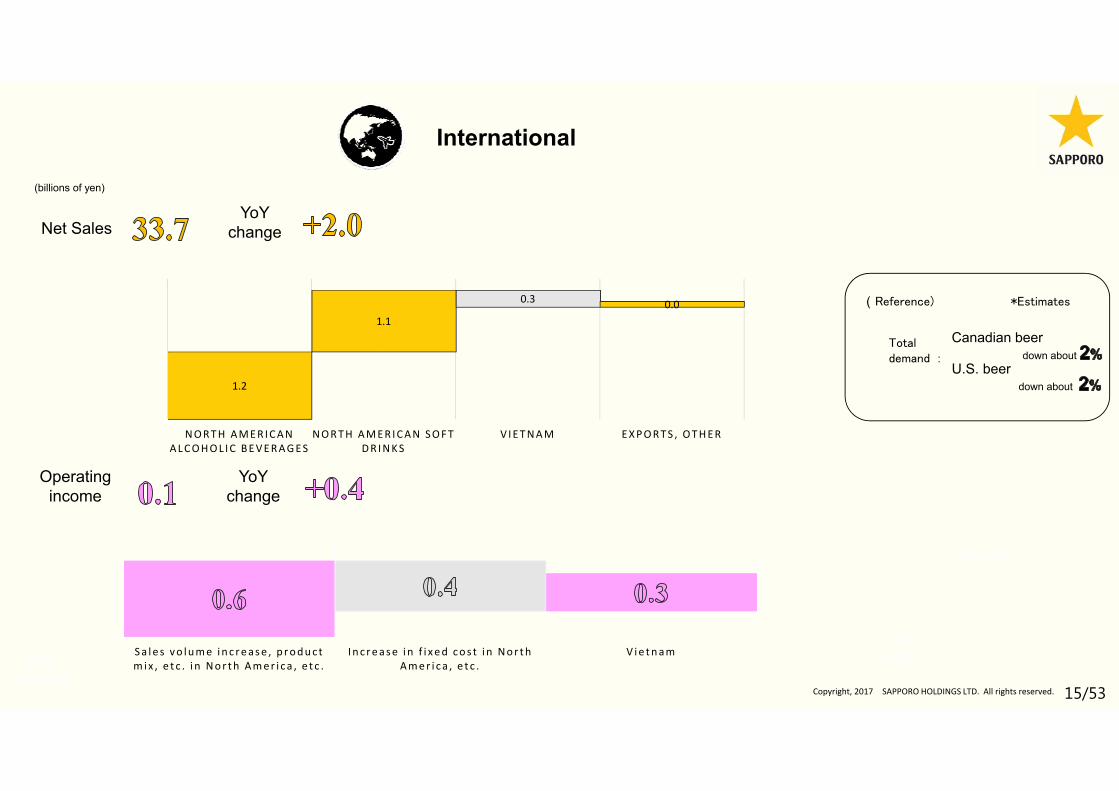
Totaldemand :
Canadian beer down about
U.S. beer down about 1.2
1.1
0.3 0.0
NORTH AMERICAN ALCOHOL IC BEVERAGES
NORTH AMERICAN SOFT DRINKS
V IETNAM EXPORTS , OTHER
Sa le s vo lume i n c rease , product mix , e tc . i n Nor th Amer i ca , e tc .
I nc rease i n f i xed cos t i n Nor th Amer i ca , e tc .
V ie tnam
16/53Copyright, 2017 SAPPORO HOLDINGS LTD. All rights reserved.*CPF: Country Pure Foods
SSC: Silver Springs Citrus 16/52
Going Forw
ard
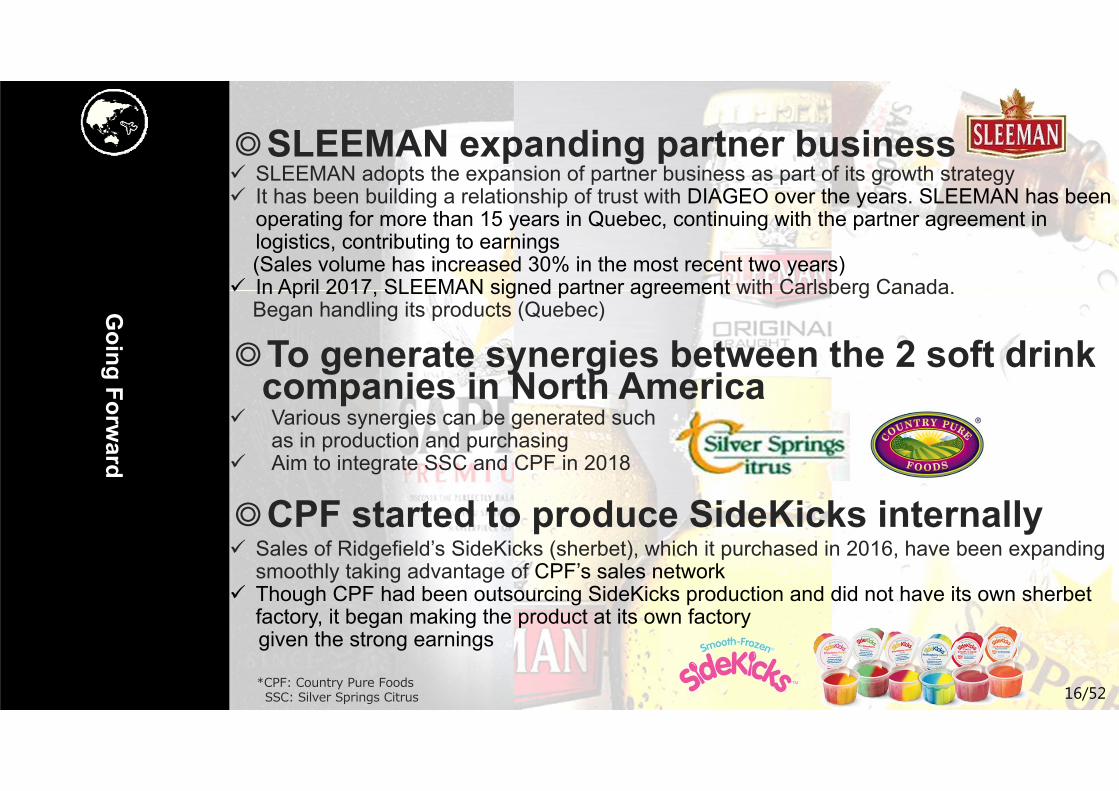
◎SLEEMAN expanding partner business SLEEMAN adopts the expansion of partner business as part of its growth strategy It has been building a relationship of trust with DIAGEO over the years. SLEEMAN has been
operating for more than 15 years in Quebec, continuing with the partner agreement in logistics, contributing to earnings(Sales volume has increased 30% in the most recent two years)
In April 2017, SLEEMAN signed partner agreement with Carlsberg Canada.Began handling its products (Quebec)
◎To generate synergies between the 2 soft drink companies in North America
Various synergies can be generated such as in production and purchasing
Aim to integrate SSC and CPF in 2018
◎CPF started to produce SideKicks internally Sales of Ridgefield’s SideKicks (sherbet), which it purchased in 2016, have been expanding
smoothly taking advantage of CPF’s sales network Though CPF had been outsourcing SideKicks production and did not have its own sherbet
factory, it began making the product at its own factory given the strong earnings

17/53Copyright, 2017 SAPPORO HOLDINGS LTD. All rights reserved.
今後に向けて
SLEEMAN Guelph Brewery
SAPPORO VIETNAMLong An Brewery
City Brewery
17/52
Going Forw
ard
◎Promoting optimization of global supply chain Transfer production of so-called Silver cans which have been produced by Guelph Plant of SLEEMAN
to Vietnam As the transfer will create redundant capacity at SLEEMAN, the company will make those products
which it had been outsourcing to City Brewing at its own facility (some product will continue to be made at City Brewing)
Even though logistics cost increases, we will improve profitability of the overall International business by improving the operating rate in Vietnam and switching to internal production of some products at SLEEMAN
18/53Copyright, 2017 SAPPORO HOLDINGS LTD. All rights reserved.
Going Forw
ard
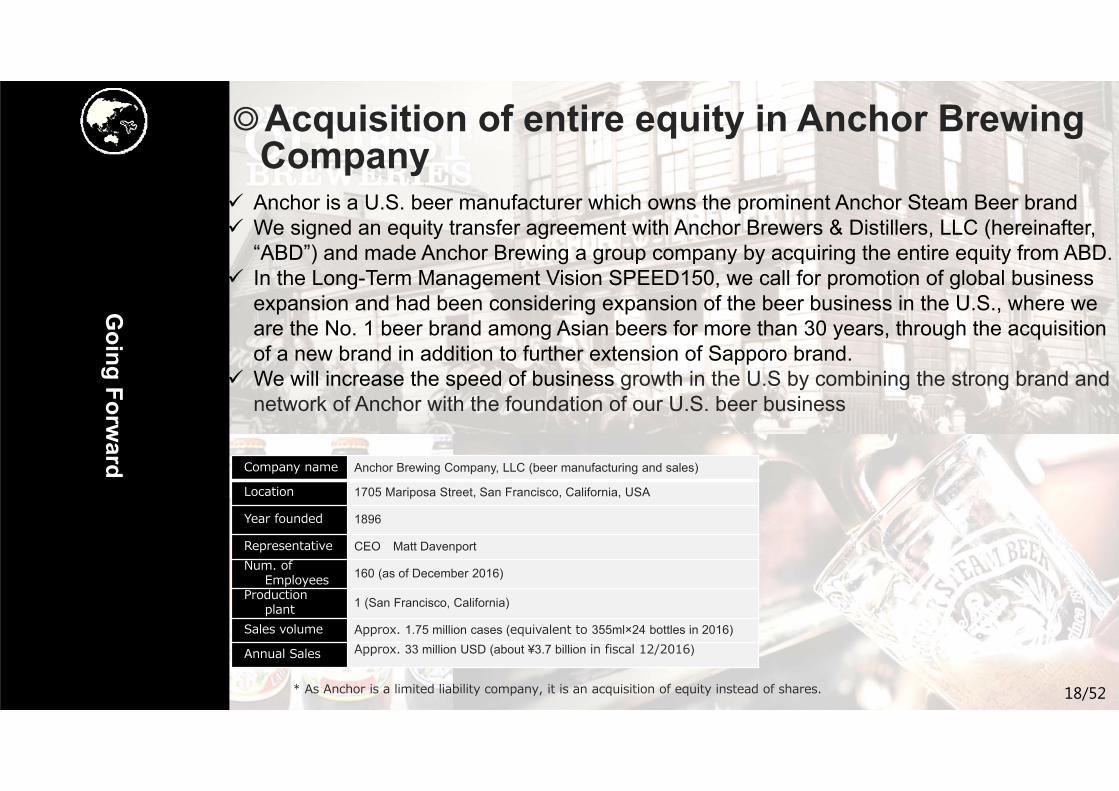
◎Acquisition of entire equity in Anchor Brewing Company
Anchor is a U.S. beer manufacturer which owns the prominent Anchor Steam Beer brand We signed an equity transfer agreement with Anchor Brewers & Distillers, LLC (hereinafter,
“ABD”) and made Anchor Brewing a group company by acquiring the entire equity from ABD. In the Long-Term Management Vision SPEED150, we call for promotion of global business
expansion and had been considering expansion of the beer business in the U.S., where we are the No. 1 beer brand among Asian beers for more than 30 years, through the acquisition of a new brand in addition to further extension of Sapporo brand.
We will increase the speed of business growth in the U.S by combining the strong brand and network of Anchor with the foundation of our U.S. beer business
* As Anchor is a limited liability company, it is an acquisition of equity instead of shares.
Company name Anchor Brewing Company, LLC (beer manufacturing and sales)
Location 1705 Mariposa Street, San Francisco, California, USA
Year founded 1896
Representative CEO Matt DavenportNum. of
Employees 160 (as of December 2016)
Production plant 1 (San Francisco, California)
Sales volume Approx. 1.75 million cases (equivalent to 355ml×24 bottles in 2016)
Annual Sales Approx. 33 million USD (about ¥3.7 billion in fiscal 12/2016)
18/52
19/53Copyright, 2017 SAPPORO HOLDINGS LTD. All rights reserved.
Food & Soft Drinks
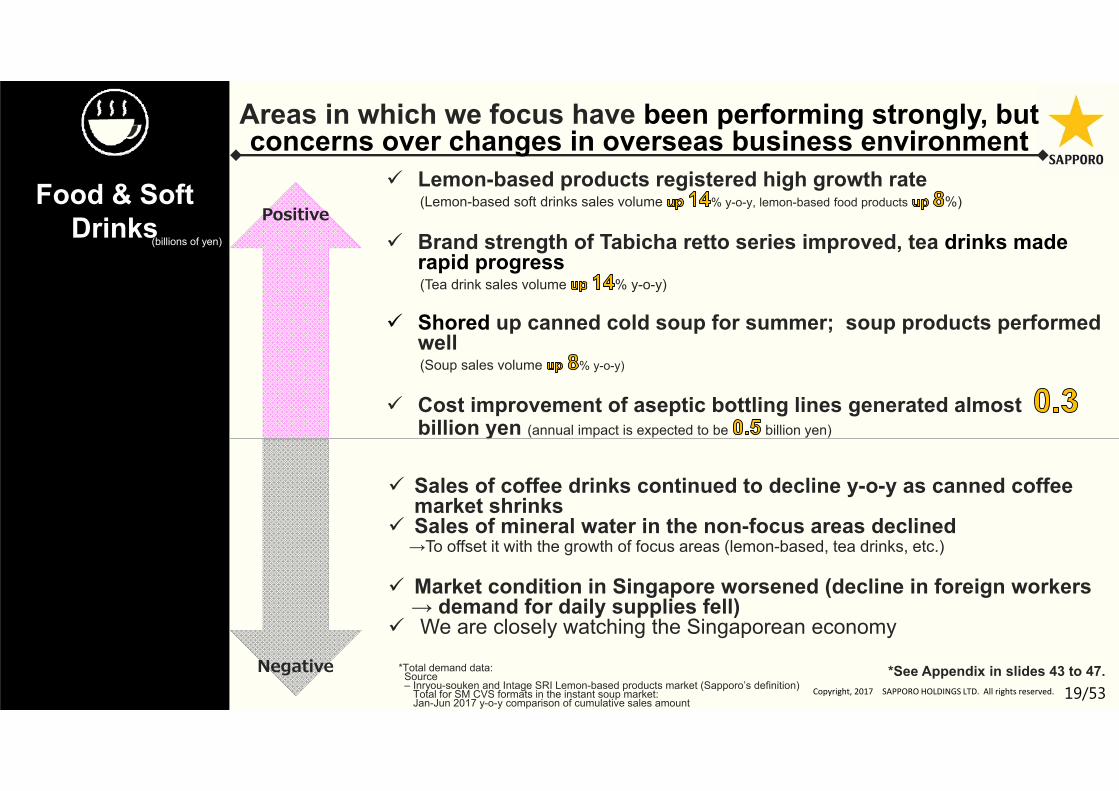
Lemon-based products registered high growth rate(Lemon-based soft drinks sales volume % y-o-y, lemon-based food products %)
Brand strength of Tabicha retto series improved, tea drinks made rapid progress(Tea drink sales volume % y-o-y)
Shored up canned cold soup for summer; soup products performed well(Soup sales volume % y-o-y)
Cost improvement of aseptic bottling lines generated almost billion yen (annual impact is expected to be billion yen)
Sales of coffee drinks continued to decline y-o-y as canned coffee market shrinks
Sales of mineral water in the non-focus areas declined→To offset it with the growth of focus areas (lemon-based, tea drinks, etc.)
Market condition in Singapore worsened (decline in foreign workers → demand for daily supplies fell)
We are closely watching the Singaporean economy
Positive
Negative
Areas in which we focus have been performing strongly, but concerns over changes in overseas business environment
*See Appendix in slides 43 to 47.*Total demand data:Source – Inryou-souken and Intage SRI Lemon-based products market (Sapporo’s definition)
Total for SM CVS formats in the instant soup market: Jan-Jun 2017 y-o-y comparison of cumulative sales amount
(billions of yen)
20/53Copyright, 2017 SAPPORO HOLDINGS LTD. All rights reserved.
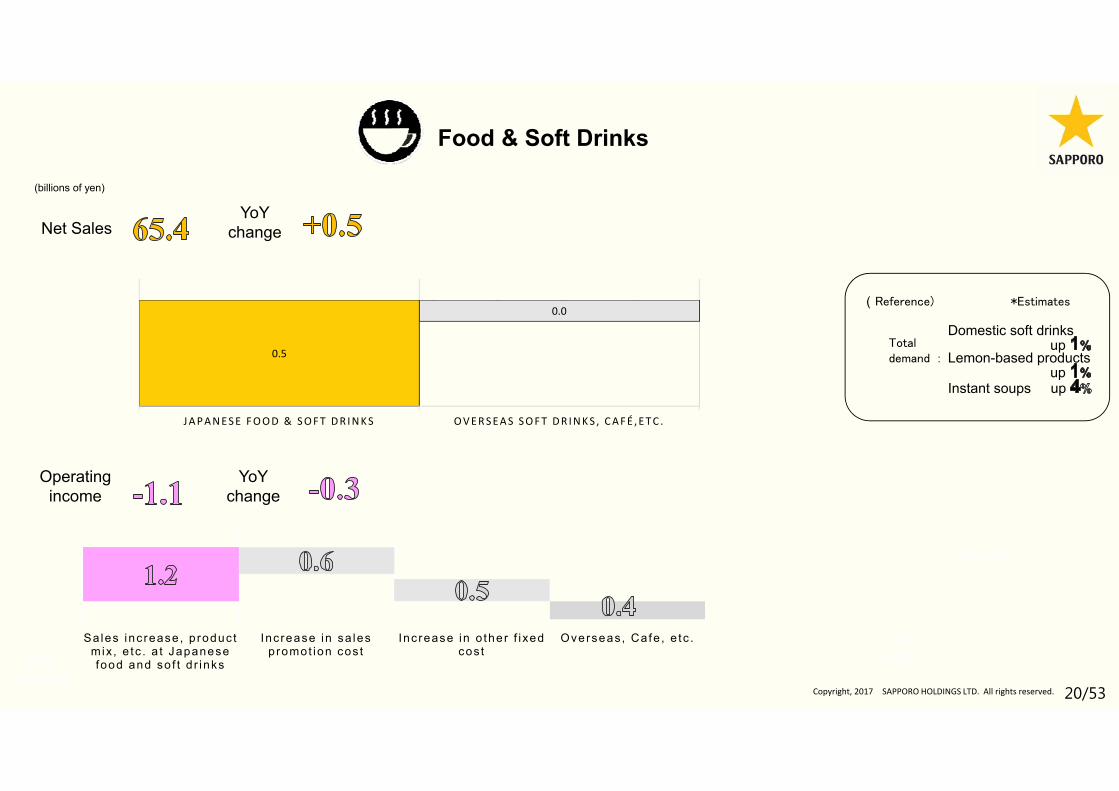
Net Sales
Total demand
*Estimates
Operating income
YoY change
YoY change
((billions of yen)
Total demand
(Reference) *Estimates
Totaldemand :
Food & Soft Drinks
Domestic soft drinksup
Lemon-based productsup
Instant soups up
0.5
0.0
JAPANESE FOOD & SOFT DRINKS OVERSEAS SOFT DRINKS , CAFÉ ,ETC .
Sales inc rease , p roduc t m ix , e tc . a t Japanese food and so f t d r inks
Increase in sa les p romot ion cos t
Inc rease in o ther f i xed cos t
Overseas, Cafe , e tc .
21/53Copyright, 2017 SAPPORO HOLDINGS LTD. All rights reserved.
Going Forw
ard
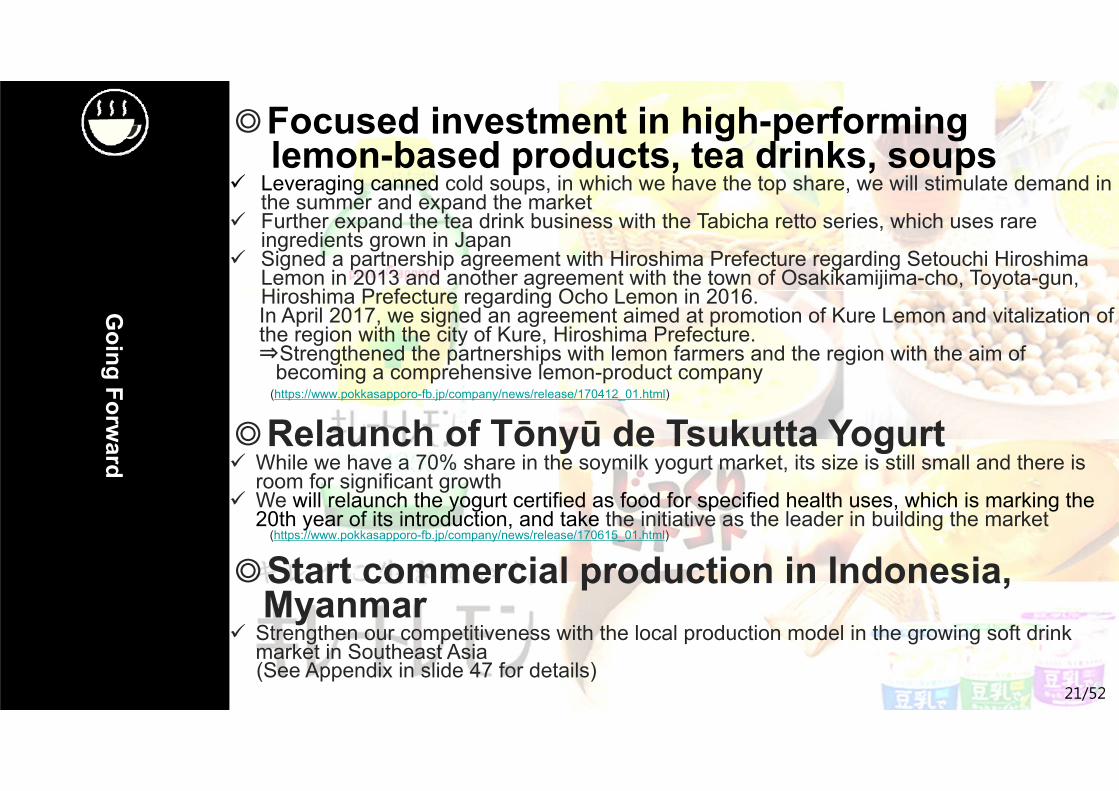
◎Focused investment in high-performing lemon-based products, tea drinks, soups
Leveraging canned cold soups, in which we have the top share, we will stimulate demand in the summer and expand the market
Further expand the tea drink business with the Tabicha retto series, which uses rare ingredients grown in Japan
Signed a partnership agreement with Hiroshima Prefecture regarding Setouchi Hiroshima Lemon in 2013 and another agreement with the town of Osakikamijima-cho, Toyota-gun, Hiroshima Prefecture regarding Ocho Lemon in 2016.In April 2017, we signed an agreement aimed at promotion of Kure Lemon and vitalization of the region with the city of Kure, Hiroshima Prefecture. ⇒Strengthened the partnerships with lemon farmers and the region with the aim of
becoming a comprehensive lemon-product company(https://www.pokkasapporo-fb.jp/company/news/release/170412_01.html)
◎Relaunch of Tōnyū de Tsukutta Yogurt While we have a 70% share in the soymilk yogurt market, its size is still small and there is
room for significant growth We will relaunch the yogurt certified as food for specified health uses, which is marking the
20th year of its introduction, and take the initiative as the leader in building the market(https://www.pokkasapporo-fb.jp/company/news/release/170615_01.html)
◎Start commercial production in Indonesia, Myanmar
Strengthen our competitiveness with the local production model in the growing soft drink market in Southeast Asia(See Appendix in slide 47 for details)
21/52
22/53Copyright, 2017 SAPPORO HOLDINGS LTD. All rights reserved.
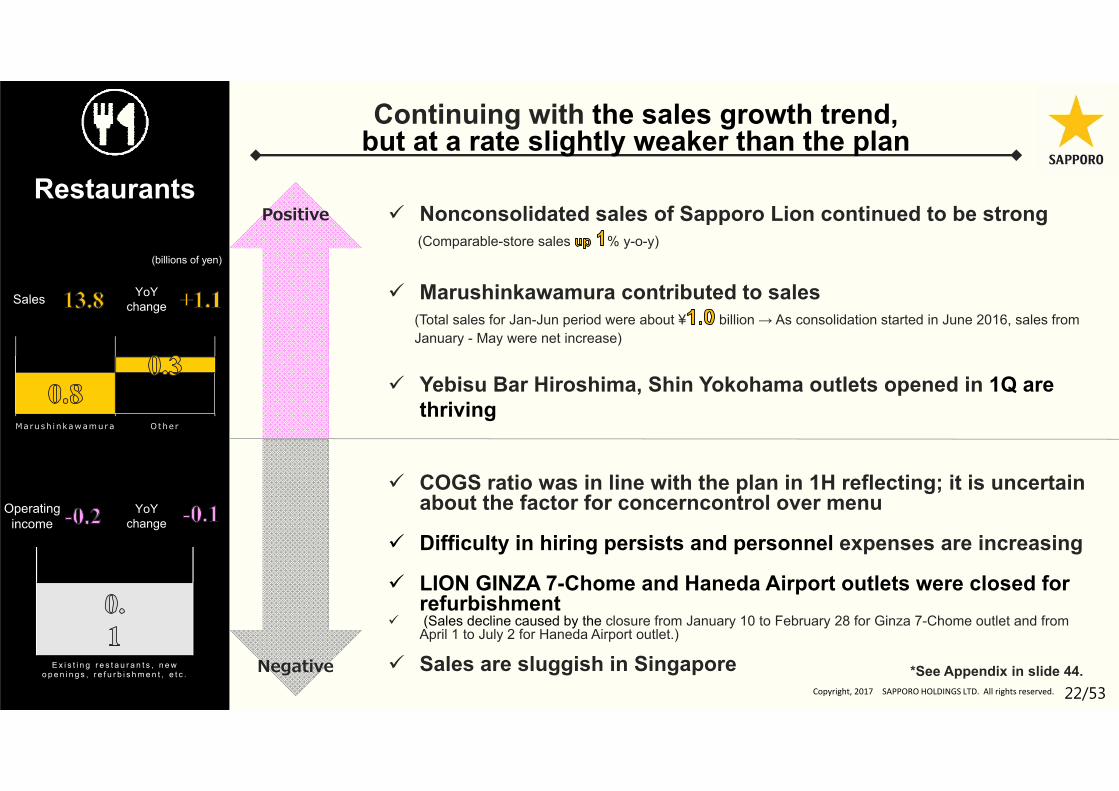
Restaurants Nonconsolidated sales of Sapporo Lion continued to be strong
(Comparable-store sales % y-o-y)
Marushinkawamura contributed to sales(Total sales for Jan-Jun period were about ¥ billion → As consolidation started in June 2016, sales from January - May were net increase)
Yebisu Bar Hiroshima, Shin Yokohama outlets opened in 1Q are thriving
COGS ratio was in line with the plan in 1H reflecting; it is uncertain about the factor for concerncontrol over menu
Difficulty in hiring persists and personnel expenses are increasing
LION GINZA 7-Chome and Haneda Airport outlets were closed for refurbishment
(Sales decline caused by the closure from January 10 to February 28 for Ginza 7-Chome outlet and from April 1 to July 2 for Haneda Airport outlet.)
Sales are sluggish in Singapore
Positive
Negative
Continuing with the sales growth trend, but at a rate slightly weaker than the plan
*See Appendix in slide 44.E x i s t i n g r e s t a u r a n t s , n e w o p e n i n g s , r e f u r b i s h m e n t , e t c .
Sales
Operating income
YoY change
YoY change
Ma ru sh i n k a w am u r a O the r
(billions of yen)
23/53Copyright, 2017 SAPPORO HOLDINGS LTD. All rights reserved.
Going Forw
ard
◎Maintain sales with the mainstay outlets and the successful Yebisu Bar format
◎Measures to reduce cost In a market environment where the pressure of cost increase is mounting, we will implement
maximum measures such as COGS control and reduction of various expenses to reduce the impact
◎Disseminate brand through Yebisu Bar and Grande Polaire Winebar
Having opened during February and March, 2017, sales at Yebisu Bar Hiroshima and Shin Yokohama outlets have been significantly exceeding the plan
As showrooms of the Sapporo Group, they serve as a forum for experiencing the Sapporo Group brands
23/52
24/53Copyright, 2017 SAPPORO HOLDINGS LTD. All rights reserved.
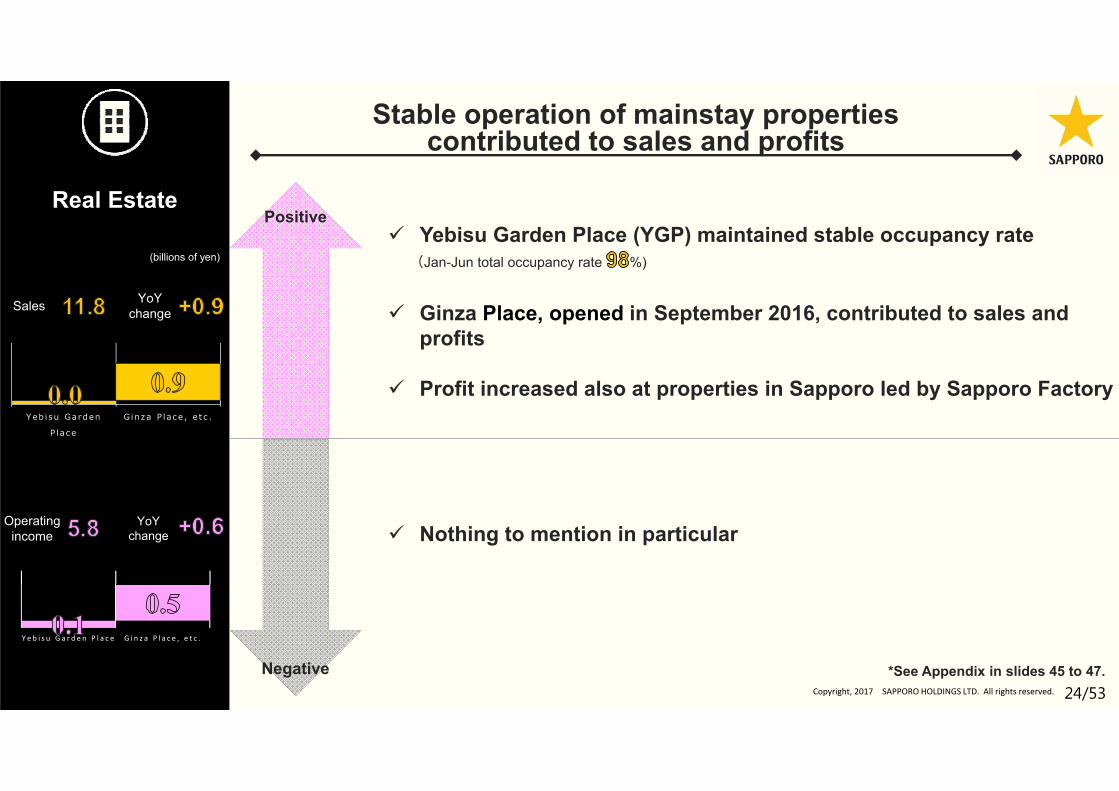
Real Estate
(billions of yen)
Yebisu Garden Place (YGP) maintained stable occupancy rate(Jan-Jun total occupancy rate %)
Ginza Place, opened in September 2016, contributed to sales and profits
Profit increased also at properties in Sapporo led by Sapporo Factory
Nothing to mention in particular
Positive
Negative
Stable operation of mainstay properties contributed to sales and profits
*See Appendix in slides 45 to 47.
Y e b i s u Ga r d e n P l a c e G i n z a P l a c e , e t c .
Sales
Operating income
YoY change
YoYchange
Yeb i s u Ga r den
P l a c e
G i n z a P l a c e , e t c .
25/53Copyright, 2017 SAPPORO HOLDINGS LTD. All rights reserved.
Going Forw
ard
◎Stable operation of mainstay properties Yebisu Garden Place (YGP), Ginza Place and other mainstay properties maintained stable
occupancy Renovation work of the YGP Tower Restaurant Street on the 39th floor is progressing for
August opening
◎Completion of TDY Sapporo Collaboration Showroom work
Developed in property adjacent to Sapporo Factory located in Chuo ward, Sapporo Completed construction in May, Opening in July 2017 (See Appendix in slide 50)
25/52
26/53Copyright, 2017 SAPPORO HOLDINGS LTD. All rights reserved.
Special Factorsin the Business
Results
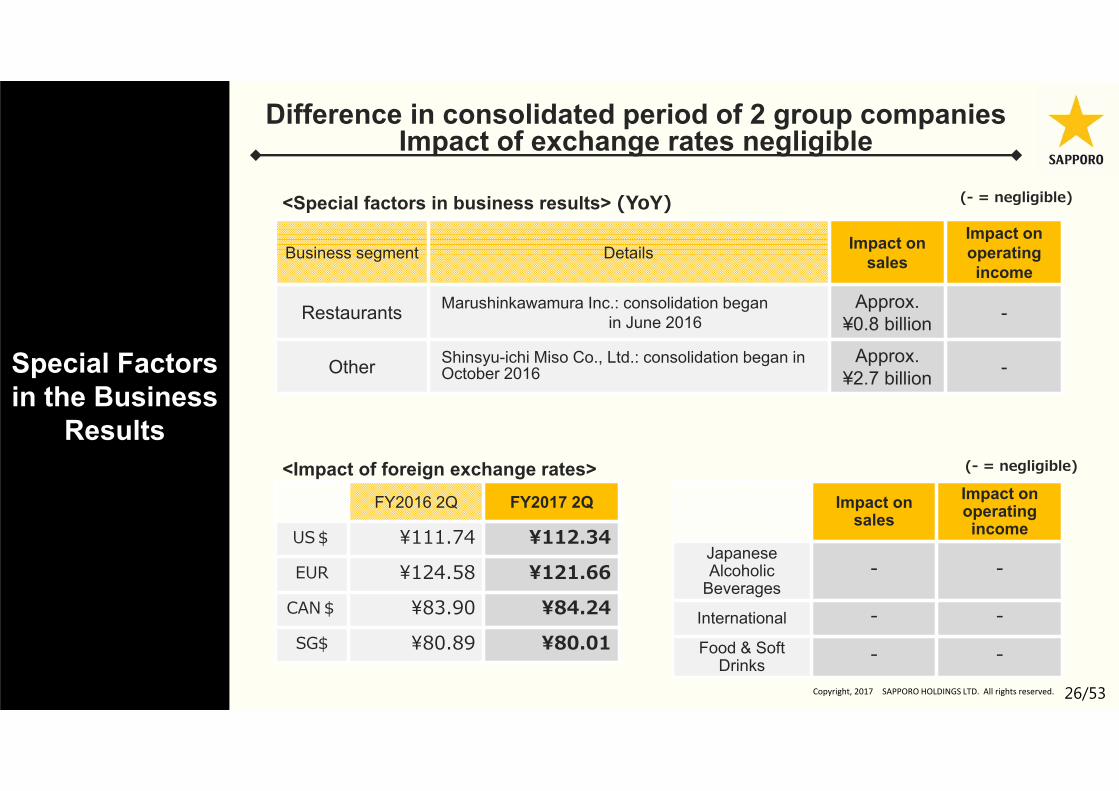
Business segment Details Impact on sales
Impact on operating income
Restaurants Marushinkawamura Inc.: consolidation beganin June 2016
Approx. ¥0.8 billion -
Other Shinsyu-ichi Miso Co., Ltd.: consolidation began in October 2016
Approx. ¥2.7 billion -
FY2016 2Q FY2017 2Q
US$ ¥111.74 ¥112.34EUR ¥124.58 ¥121.66
CAN$ ¥83.90 ¥84.24SG$ ¥80.89 ¥80.01
Impact on sales
Impact on operating income
JapaneseAlcoholic
Beverages- -
International - -Food & Soft
Drinks - -
<Special factors in business results> (YoY)
<Impact of foreign exchange rates>
Difference in consolidated period of 2 group companiesImpact of exchange rates negligible
(- = negligible)
(- = negligible)
27/53Copyright, 2017 SAPPORO HOLDINGS LTD. All rights reserved.
Changes inOther Income
and Expenses
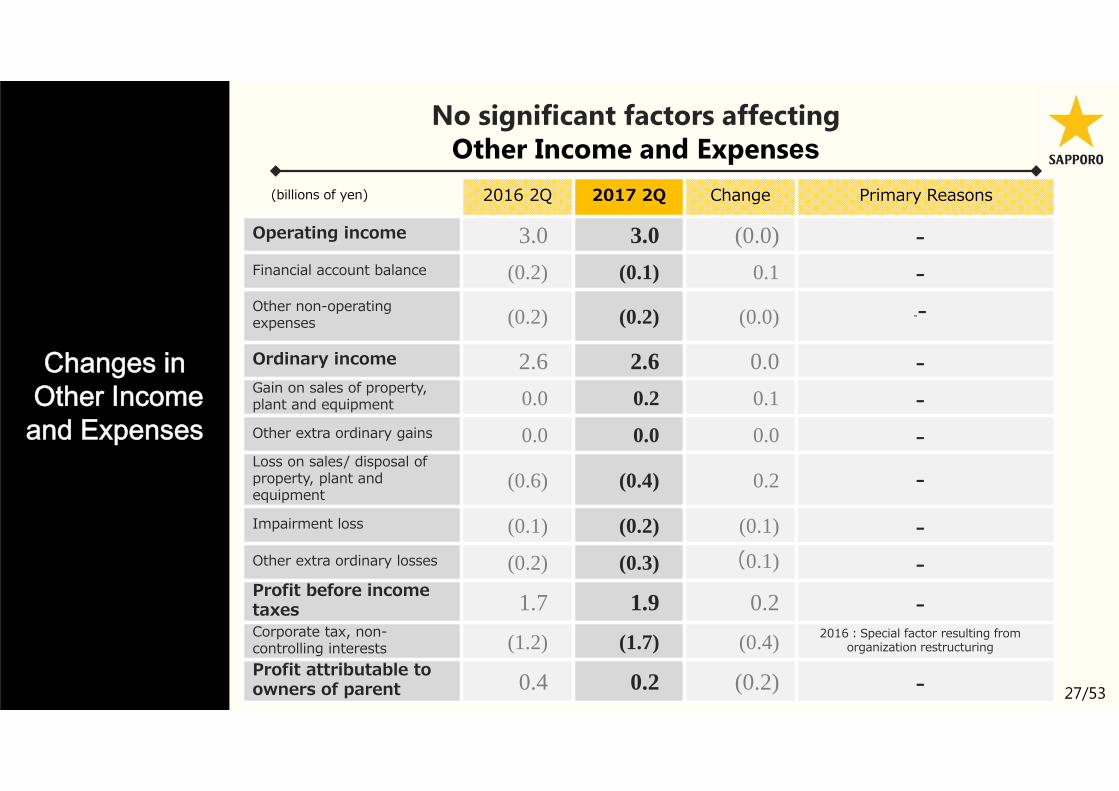
2016 2Q 2017 2Q Change Primary Reasons
Operating income 3.0 3.0 (0.0) -Financial account balance (0.2) (0.1) 0.1 -Other non-operating expenses (0.2) (0.2) (0.0) --Ordinary income 2.6 2.6 0.0 -Gain on sales of property, plant and equipment 0.0 0.2 0.1 -Other extra ordinary gains 0.0 0.0 0.0 -Loss on sales/ disposal of property, plant and equipment
(0.6) (0.4) 0.2 -Impairment loss (0.1) (0.2) (0.1) -Other extra ordinary losses (0.2) (0.3) (0.1) -Profit before income taxes 1.7 1.9 0.2 -Corporate tax, non-controlling interests (1.2) (1.7) (0.4) 2016:Special factor resulting from
organization restructuring
Profit attributable to owners of parent 0.4 0.2 (0.2) -
No significant factors affecting Other Income and Expenses
(billions of yen)

28/53Copyright, 2017 SAPPORO HOLDINGS LTD. All rights reserved.
79.3 76.5 77.4 78.7 73.6 77.9
29.2 28.8 27.6 27.4 26.2 25.3
346.2 344.2 346.4 356.0 352.7 352.2
17.0 16.7 15.5 18.7 19.5 19.041.2 41.1 40.6 37.9 40.7 42.0
64.3 74.8 71.296.8
68.4 78.912.1 12.4 13.2
10.59.4
10.5
2016 1Q 2016 2Q 2016 3Q End of FY2016 2017 1Q 2017 2Q
Cash and cash
equivalent
Trade receivables
Inventory
Current assets, etc.
Fixed assets
Goodwill
Investments, etc.
Changes in Balance Sheets
20.3 billion yen decline y-o-y in total assets
→Impact of seasonal factors, bank holidays, etc.
(billions of yen)Total assets
Current assets
Fixed assets
<Comparison with the end of FY2016>
29/53Copyright, 2017 SAPPORO HOLDINGS LTD. All rights reserved.
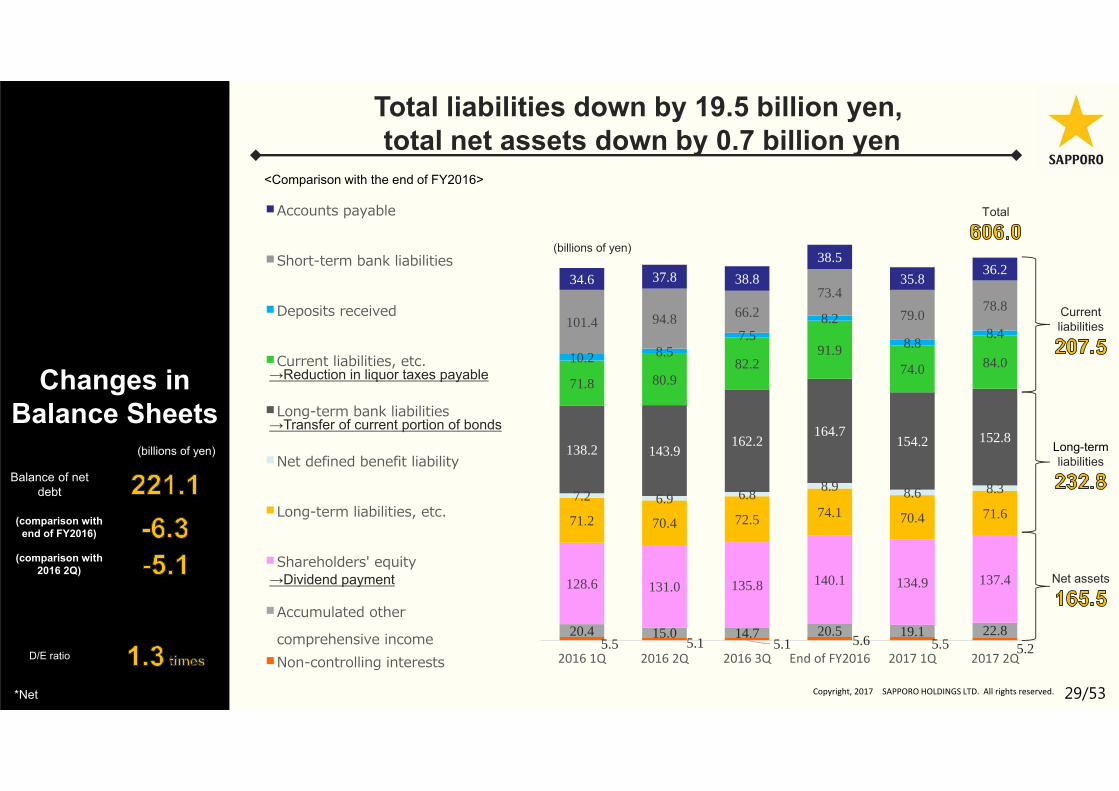
5.5 5.1 5.1 5.6 5.5 5.220.4 15.0 14.7 20.5 19.1 22.8
128.6 131.0 135.8 140.1 134.9 137.4
71.2 70.4 72.5 74.1 70.4 71.67.2 6.9 6.8 8.9 8.6 8.3
138.2 143.9162.2
164.7154.2 152.8
71.8 80.982.2
91.974.0 84.010.2 8.5
7.58.2
8.88.4
101.4 94.8 66.273.4
79.078.8
34.6 37.8 38.838.5
35.836.2
2016 1Q 2016 2Q 2016 3Q End of FY2016 2017 1Q 2017 2Q
Accounts payable
Short-term bank liabilities
Deposits received
Current liabilities, etc.
Long-term bank liabilities
Net defined benefit liability
Long-term liabilities, etc.
Shareholders' equity
Accumulated other
comprehensive incomeNon-controlling interests
Changes in Balance Sheets
Total liabilities down by 19.5 billion yen,total net assets down by 0.7 billion yen
→Reduction in liquor taxes payable
→Transfer of current portion of bonds
→Dividend payment
Total
Current liabilities
Long-termliabilities
Net assets
Balance of net debt
D/E ratio
*Net
<Comparison with the end of FY2016>
(comparison with end of FY2016)
(comparison with 2016 2Q)
(billions of yen)
(billions of yen)
30/53Copyright, 2017 SAPPORO HOLDINGS LTD. All rights reserved.
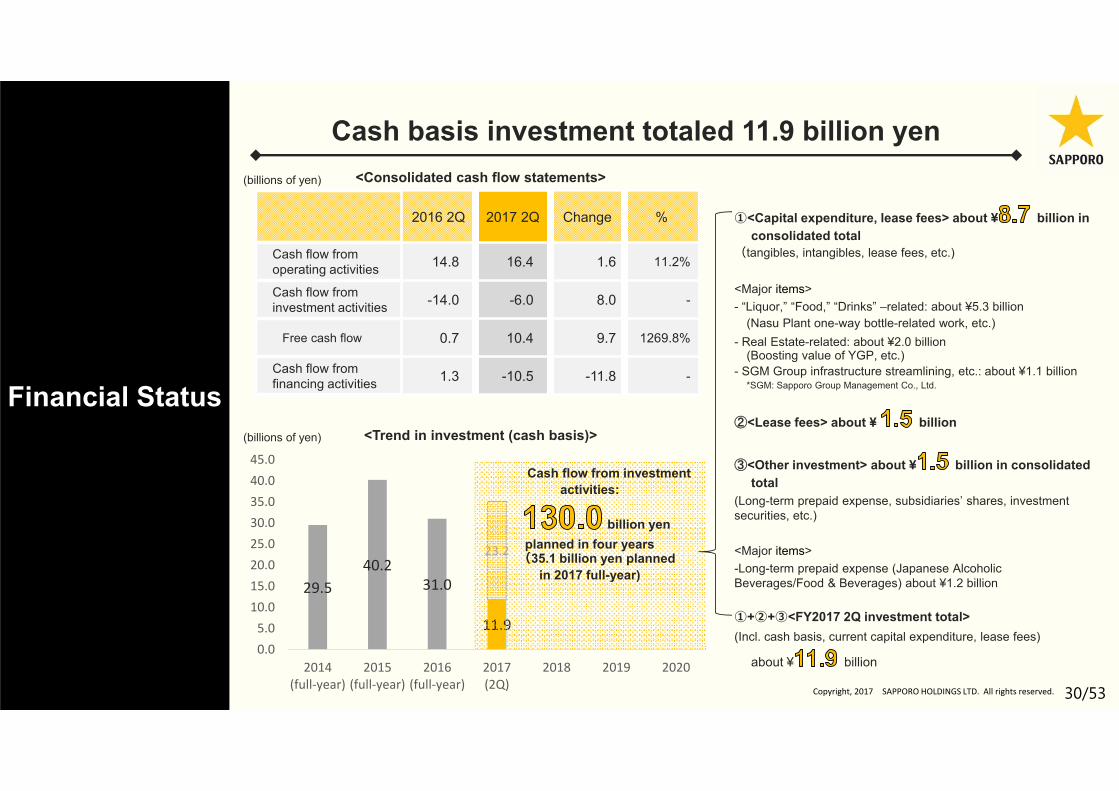
29.540.2
31.0
11.9
23.2
0.05.010.015.020.025.030.035.040.045.0
2014(full‐year)
2015(full‐year)
2016(full‐year)
2017(2Q)
2018 2019 2020
<Trend in investment (cash basis)>
Cash flow from investment activities:
billion yen planned in four years
(35.1 billion yen planned in 2017 full-year)
Financial Status(billions of yen)
Cash basis investment totaled 11.9 billion yen
2016 2Q 2017 2Q Change %
Cash flow from operating activities 14.8 16.4 1.6 11.2%
Cash flow from investment activities -14.0 -6.0 8.0 -
Free cash flow 0.7 10.4 9.7 1269.8%
Cash flow from financing activities 1.3 -10.5 -11.8 -
<Consolidated cash flow statements>
①<Capital expenditure, lease fees> about ¥ billion in consolidated total
(tangibles, intangibles, lease fees, etc.)
<Major items>- “Liquor,” “Food,” “Drinks” –related: about ¥5.3 billion
(Nasu Plant one-way bottle-related work, etc.)- Real Estate-related: about ¥2.0 billion
(Boosting value of YGP, etc.)- SGM Group infrastructure streamlining, etc.: about ¥1.1 billion
*SGM: Sapporo Group Management Co., Ltd.
②<Lease fees> about ¥ billion
③<Other investment> about ¥ billion in consolidated total
(Long-term prepaid expense, subsidiaries’ shares, investment securities, etc.)
<Major items>-Long-term prepaid expense (Japanese Alcoholic Beverages/Food & Beverages) about ¥1.2 billion
①+②+③<FY2017 2Q investment total>(Incl. cash basis, current capital expenditure, lease fees)
about ¥ billion
(billions of yen)
31/53Copyright, 2017 SAPPORO HOLDINGS LTD. All rights reserved.
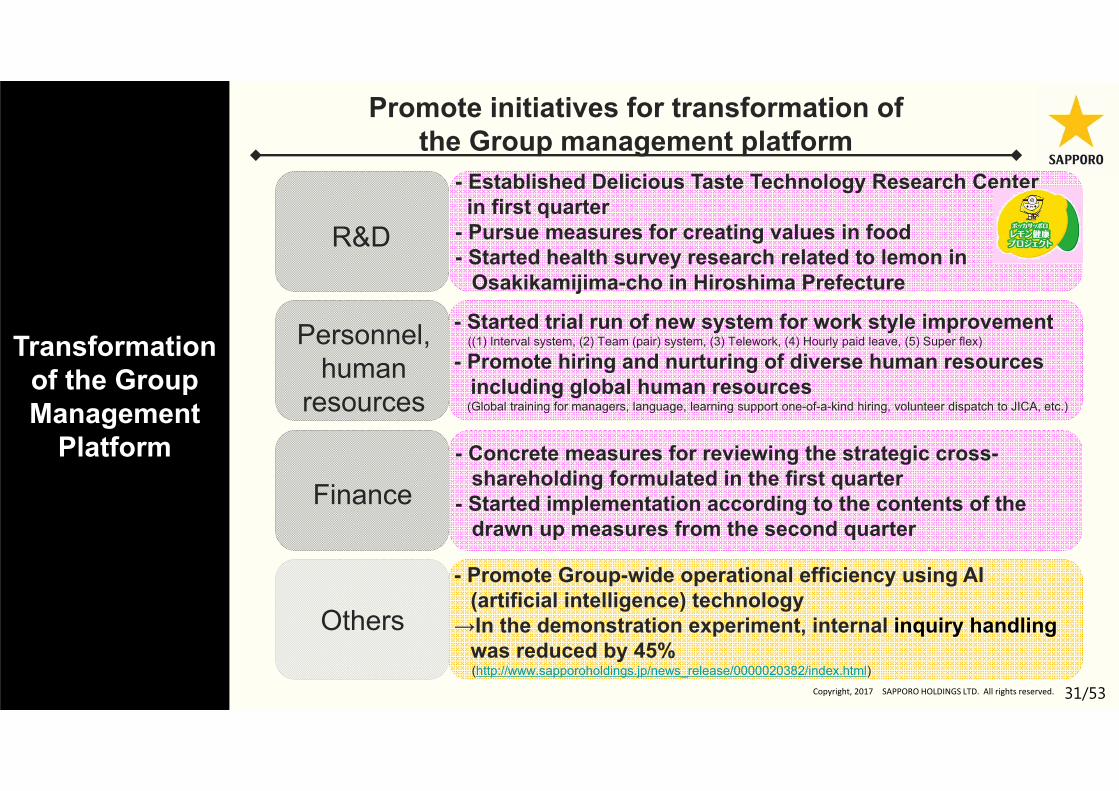
Transformation of the Group Management
Platform
- Established Delicious Taste Technology Research Center in first quarter
- Pursue measures for creating values in food- Started health survey research related to lemon in
Osakikamijima-cho in Hiroshima Prefecture
R&D
Personnel,human
resources
- Started trial run of new system for work style improvement((1) Interval system, (2) Team (pair) system, (3) Telework, (4) Hourly paid leave, (5) Super flex)
- Promote hiring and nurturing of diverse human resources including global human resources
(Global training for managers, language, learning support one-of-a-kind hiring, volunteer dispatch to JICA, etc.)
Finance- Concrete measures for reviewing the strategic cross-
shareholding formulated in the first quarter- Started implementation according to the contents of the
drawn up measures from the second quarter
- Promote Group-wide operational efficiency using AI (artificial intelligence) technology
→In the demonstration experiment, internal inquiry handling was reduced by 45%(http://www.sapporoholdings.jp/news_release/0000020382/index.html)
Others
Promote initiatives for transformation of the Group management platform
32/53Copyright, 2017 SAPPORO HOLDINGS LTD. All rights reserved.
Transformation of the Group Management
Platform
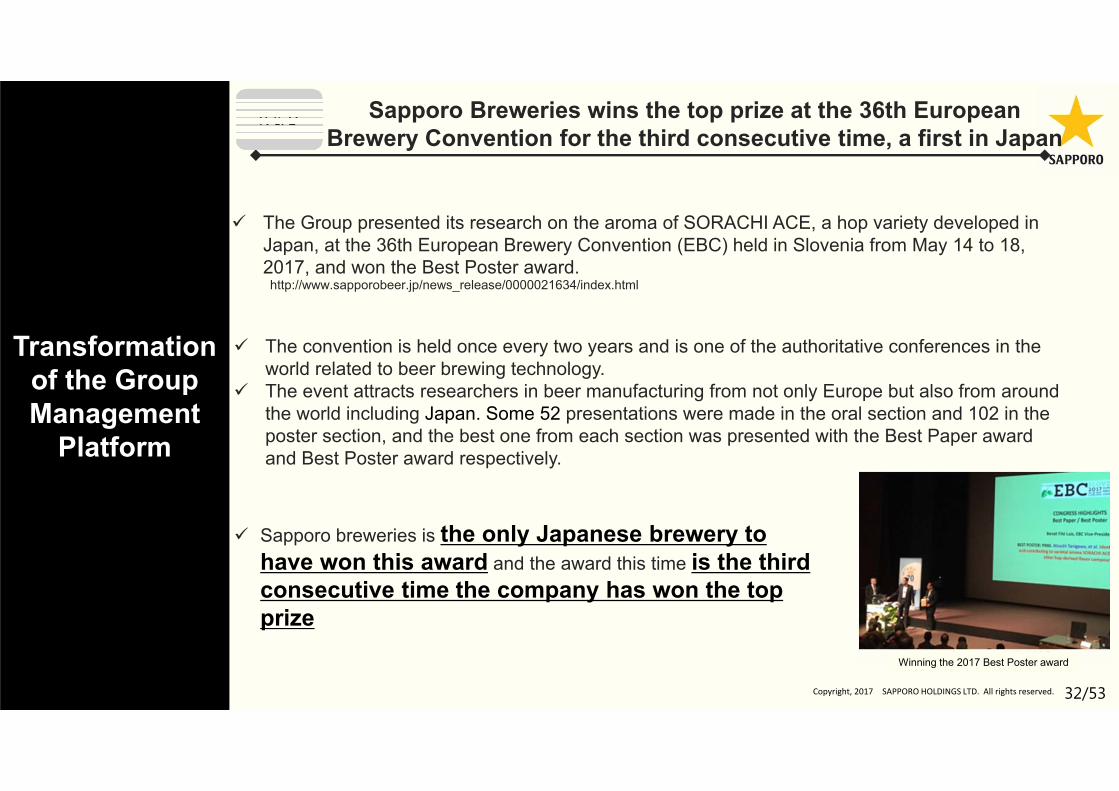
Sapporo Breweries wins the top prize at the 36th European Brewery Convention for the third consecutive time, a first in Japan
The Group presented its research on the aroma of SORACHI ACE, a hop variety developed in Japan, at the 36th European Brewery Convention (EBC) held in Slovenia from May 14 to 18, 2017, and won the Best Poster award.http://www.sapporobeer.jp/news_release/0000021634/index.html
Sapporo breweries is the only Japanese brewery to have won this award and the award this time is the third consecutive time the company has won the top prize
The convention is held once every two years and is one of the authoritative conferences in the world related to beer brewing technology.
The event attracts researchers in beer manufacturing from not only Europe but also from around the world including Japan. Some 52 presentations were made in the oral section and 102 in the poster section, and the best one from each section was presented with the Best Paper award and Best Poster award respectively.
Winning the 2017 Best Poster award
33/53Copyright, 2017 SAPPORO HOLDINGS LTD. All rights reserved.
Appendix
34/53Copyright, 2017 SAPPORO HOLDINGS LTD. All rights reserved.
Appendix
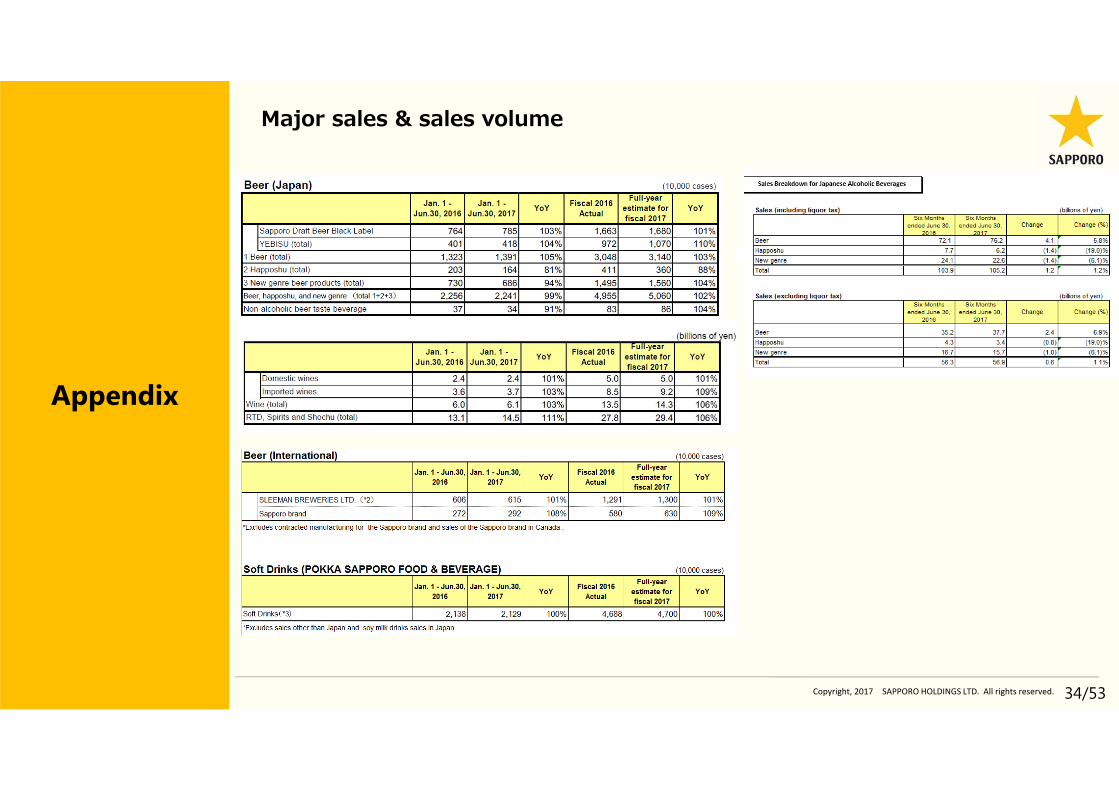
Major sales & sales volume
-
35/53Copyright, 2017 SAPPORO HOLDINGS LTD. All rights reserved.
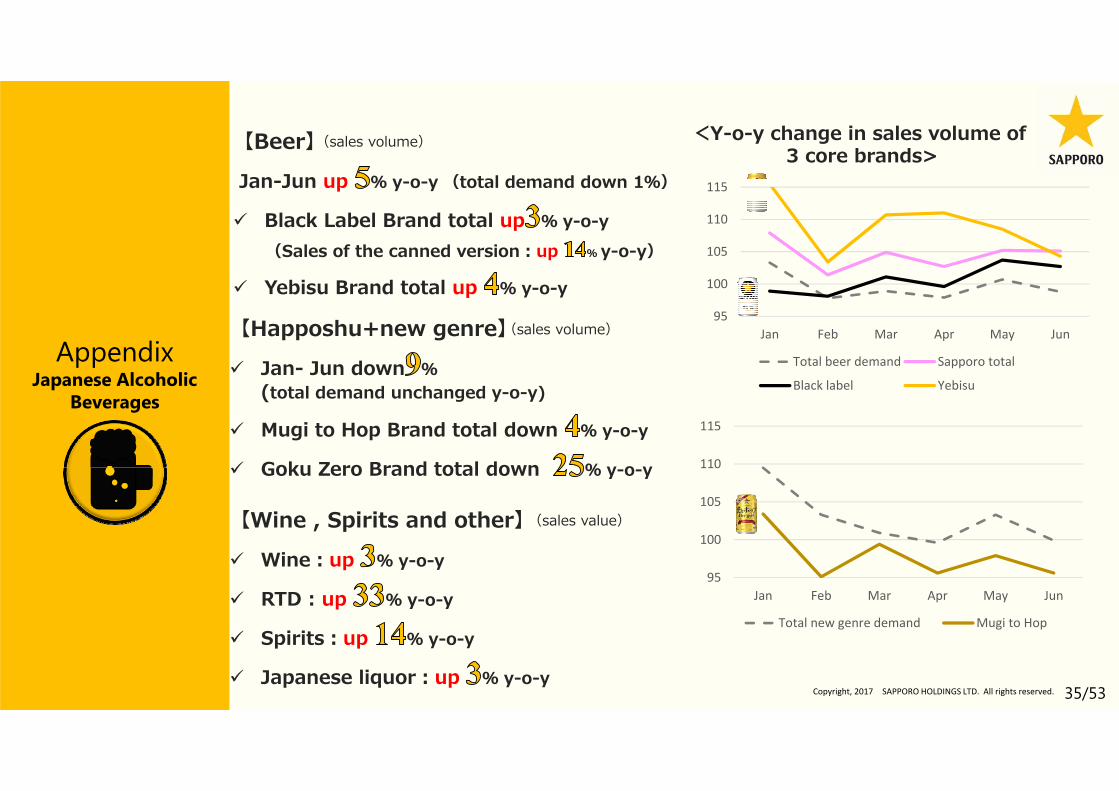
【Beer】Jan-Jun up % y-o-y (total demand down 1%)
Black Label Brand total up % y-o-y(Sales of the canned version:up % y-o-y)
Yebisu Brand total up % y-o-y
【Happoshu+new genre】 Jan- Jun down %
(total demand unchanged y-o-y)
Mugi to Hop Brand total down % y-o-y
Goku Zero Brand total down % y-o-y
【Wine , Spirits and other】 Wine:up % y-o-y
RTD : up % y-o-y
Spirits:up % y-o-y
Japanese liquor:up % y-o-y
AppendixJapanese Alcoholic
Beverages
(sales volume) <Y-o-y change in sales volume of3 core brands>
(sales volume)
(sales value)
95
100
105
110
115
Jan Feb Mar Apr May Jun
Total beer demand Sapporo total
Black label Yebisu
95
100
105
110
115
Jan Feb Mar Apr May Jun
Total new genre demand Mugi to Hop
36/53Copyright, 2017 SAPPORO HOLDINGS LTD. All rights reserved.
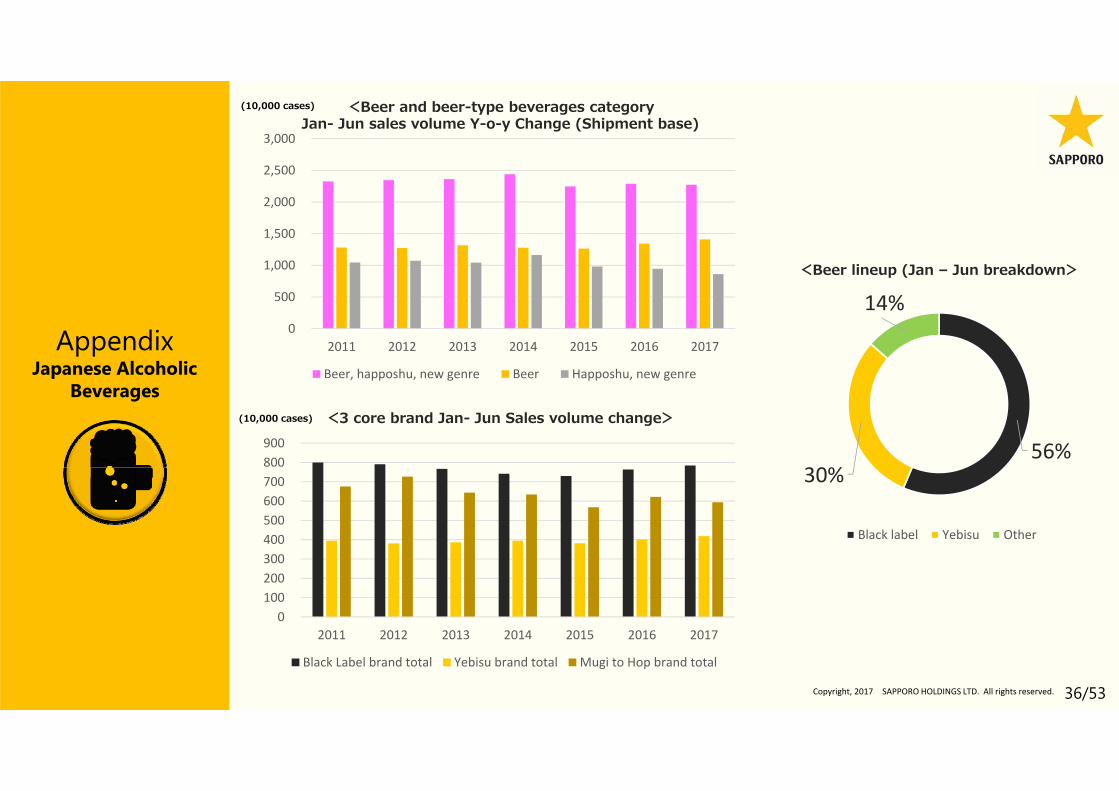
<Beer and beer-type beverages categoryJan- Jun sales volume Y-o-y Change (Shipment base)
<3 core brand Jan- Jun Sales volume change>
<Beer lineup (Jan – Jun breakdown>
AppendixJapanese Alcoholic
Beverages
(10,000 cases)
(10,000 cases)
0
500
1,000
1,500
2,000
2,500
3,000
2011 2012 2013 2014 2015 2016 2017
Beer, happoshu, new genre Beer Happoshu, new genre
0100200300400500600700800900
2011 2012 2013 2014 2015 2016 2017
Black Label brand total Yebisu brand total Mugi to Hop brand total
56%30%
14%
Black label Yebisu Other
37/53Copyright, 2017 SAPPORO HOLDINGS LTD. All rights reserved.
AppendixJapanese Alcoholic
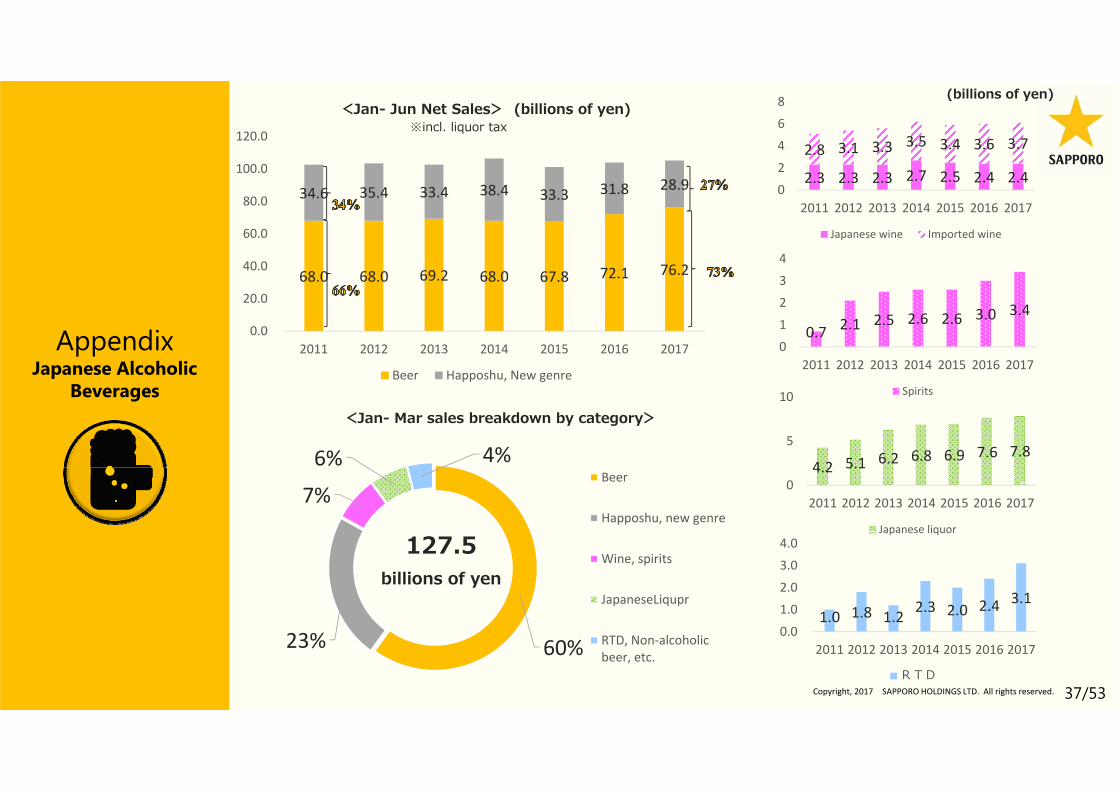
Beverages<Jan- Mar sales breakdown by category>
127.5billions of yen
<Jan- Jun Net Sales> (billions of yen)※incl. liquor tax
(billions of yen)
68.0 68.0 69.2 68.0 67.8 72.1 76.2
34.6 35.4 33.4 38.4 33.3 31.8 28.9
0.0
20.0
40.0
60.0
80.0
100.0
120.0
2011 2012 2013 2014 2015 2016 2017
Beer Happoshu, New genre
60%23%
7%
6% 4%Beer
Happoshu, new genre
Wine, spirits
JapaneseLiqupr
RTD, Non‐alcoholicbeer, etc.
2.3 2.3 2.3 2.7 2.5 2.4 2.4
2.8 3.1 3.3 3.5 3.4 3.6 3.7
0
2
4
6
8
2011 2012 2013 2014 2015 2016 2017
Japanese wine Imported wine
0.7 2.1 2.5 2.6 2.6 3.0 3.4
0
1
2
3
4
2011 2012 2013 2014 2015 2016 2017
Spirits
4.2 5.1 6.2 6.8 6.9 7.6 7.8
0
5
10
2011 2012 2013 2014 2015 2016 2017
Japanese liquor
1.0 1.8 1.2 2.3 2.0 2.43.1
0.0
1.0
2.0
3.0
4.0
2011 2012 2013 2014 2015 2016 2017
RTD
38/53Copyright, 2017 SAPPORO HOLDINGS LTD. All rights reserved.
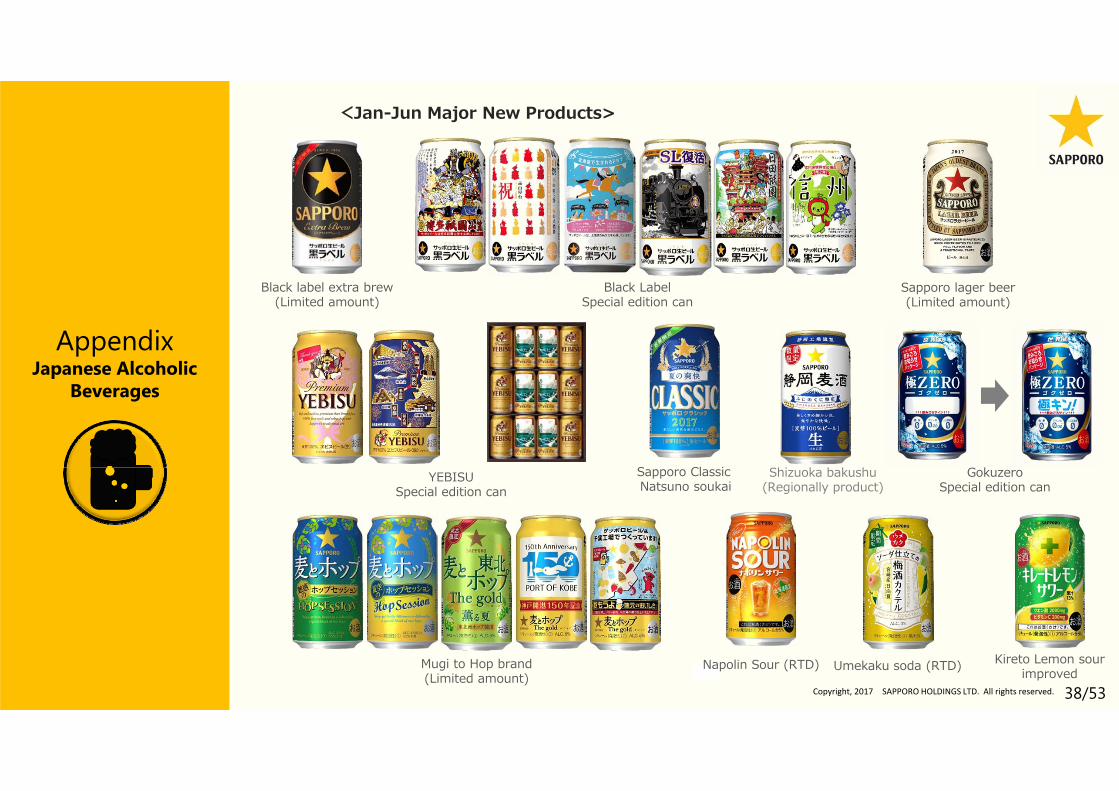
<Jan-Jun Major New Products>
AppendixJapanese Alcoholic
Beverages
Black label extra brew(Limited amount)
Shizuoka bakushu(Regionally product)
Sapporo ClassicNatsuno soukai
Sapporo lager beer(Limited amount)
Napolin Sour (RTD)
Black Label Special edition can
Umekaku soda (RTD) Kireto Lemon sour improved
YEBISUSpecial edition can
Mugi to Hop brand(Limited amount)
GokuzeroSpecial edition can
39/53Copyright, 2017 SAPPORO HOLDINGS LTD. All rights reserved.
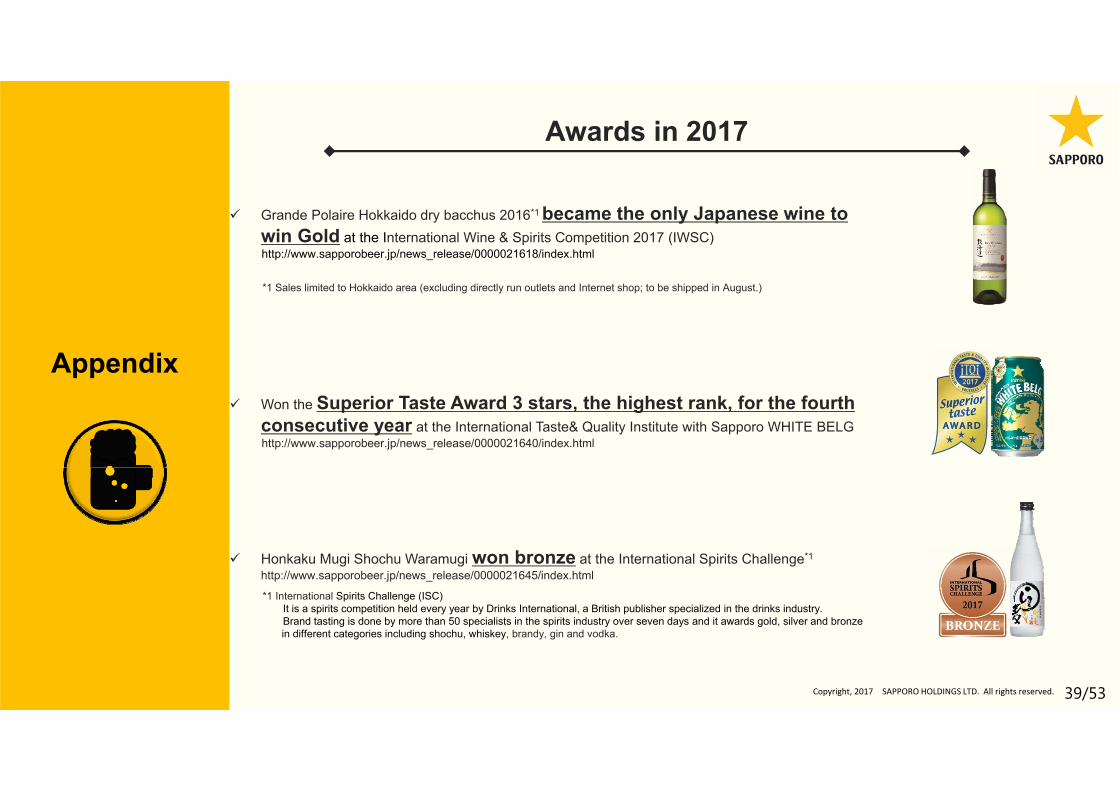
Awards in 2017
Honkaku Mugi Shochu Waramugi won bronze at the International Spirits Challenge*1
http://www.sapporobeer.jp/news_release/0000021645/index.html
*1 International Spirits Challenge (ISC)It is a spirits competition held every year by Drinks International, a British publisher specialized in the drinks industry.Brand tasting is done by more than 50 specialists in the spirits industry over seven days and it awards gold, silver and bronze in different categories including shochu, whiskey, brandy, gin and vodka.
Won the Superior Taste Award 3 stars, the highest rank, for the fourth consecutive year at the International Taste& Quality Institute with Sapporo WHITE BELG http://www.sapporobeer.jp/news_release/0000021640/index.html
Grande Polaire Hokkaido dry bacchus 2016*1 became the only Japanese wine to win Gold at the International Wine & Spirits Competition 2017 (IWSC)http://www.sapporobeer.jp/news_release/0000021618/index.html
*1 Sales limited to Hokkaido area (excluding directly run outlets and Internet shop; to be shipped in August.)
Appendix
40/53Copyright, 2017 SAPPORO HOLDINGS LTD. All rights reserved.
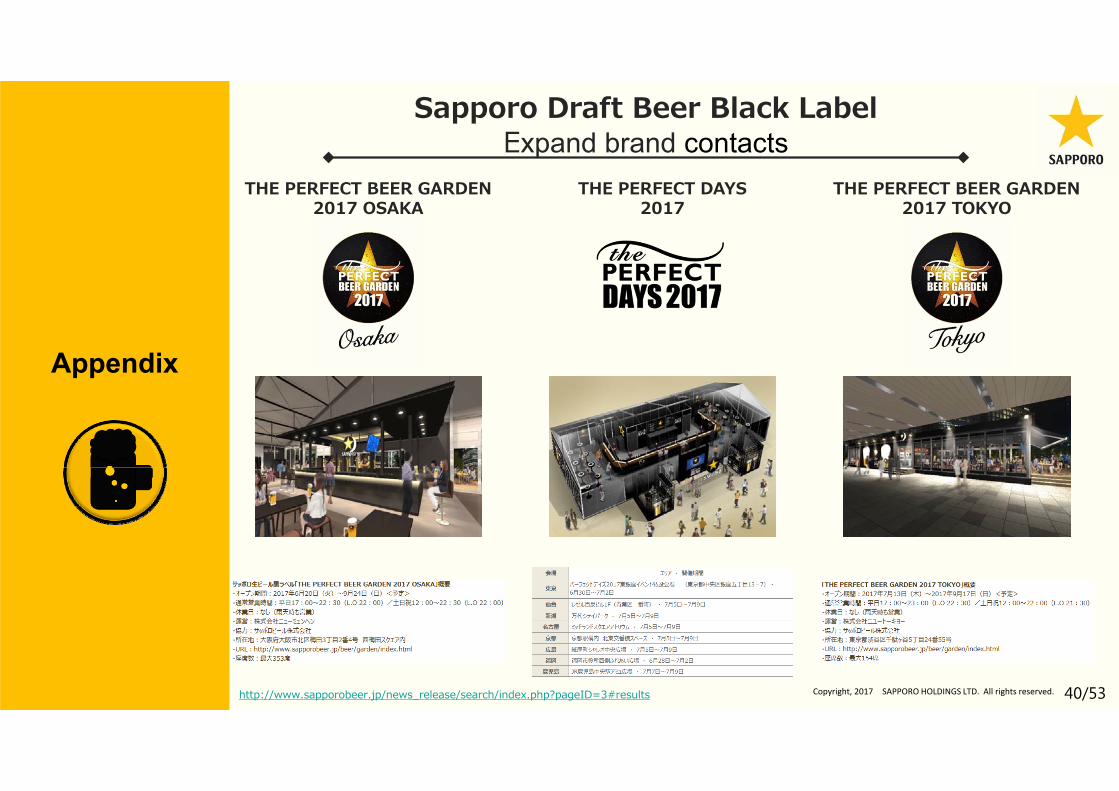
Sapporo Draft Beer Black LabelExpand brand contacts
Appendix
THE PERFECT BEER GARDEN 2017 TOKYO
THE PERFECT DAYS2017
THE PERFECT BEER GARDEN 2017 OSAKA
http://www.sapporobeer.jp/news_release/search/index.php?pageID=3#results
41/53Copyright, 2017 SAPPORO HOLDINGS LTD. All rights reserved.
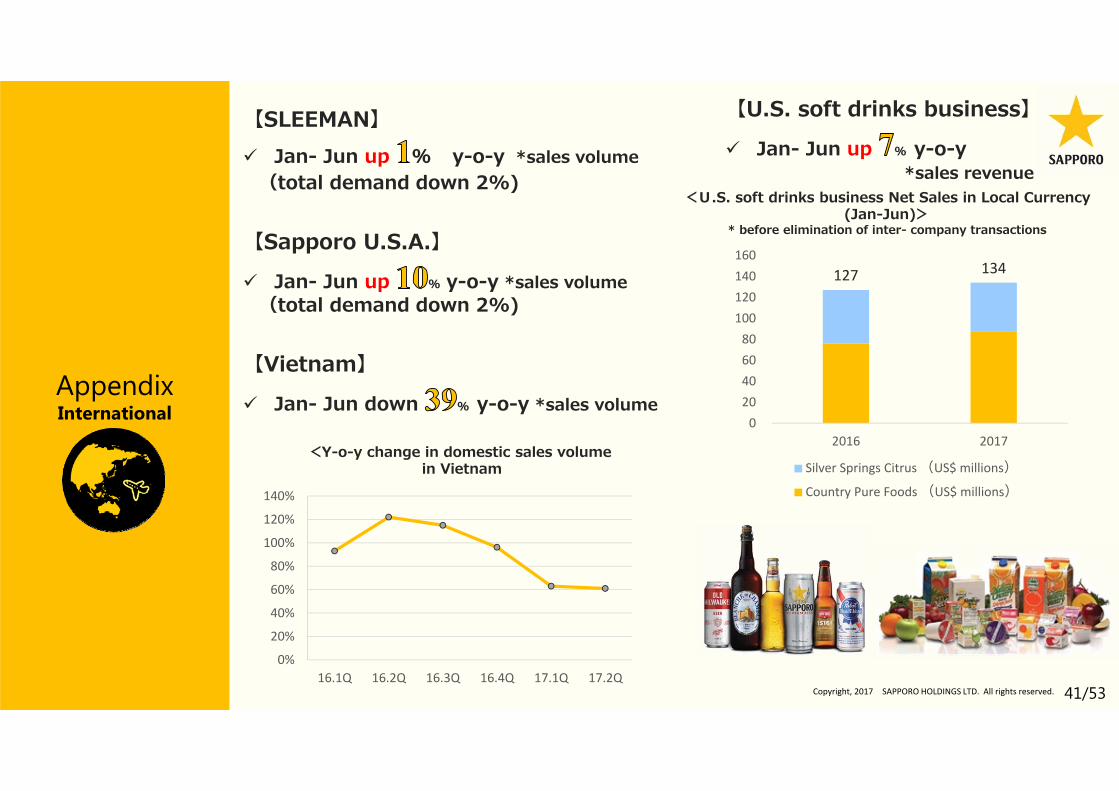
AppendixInternational
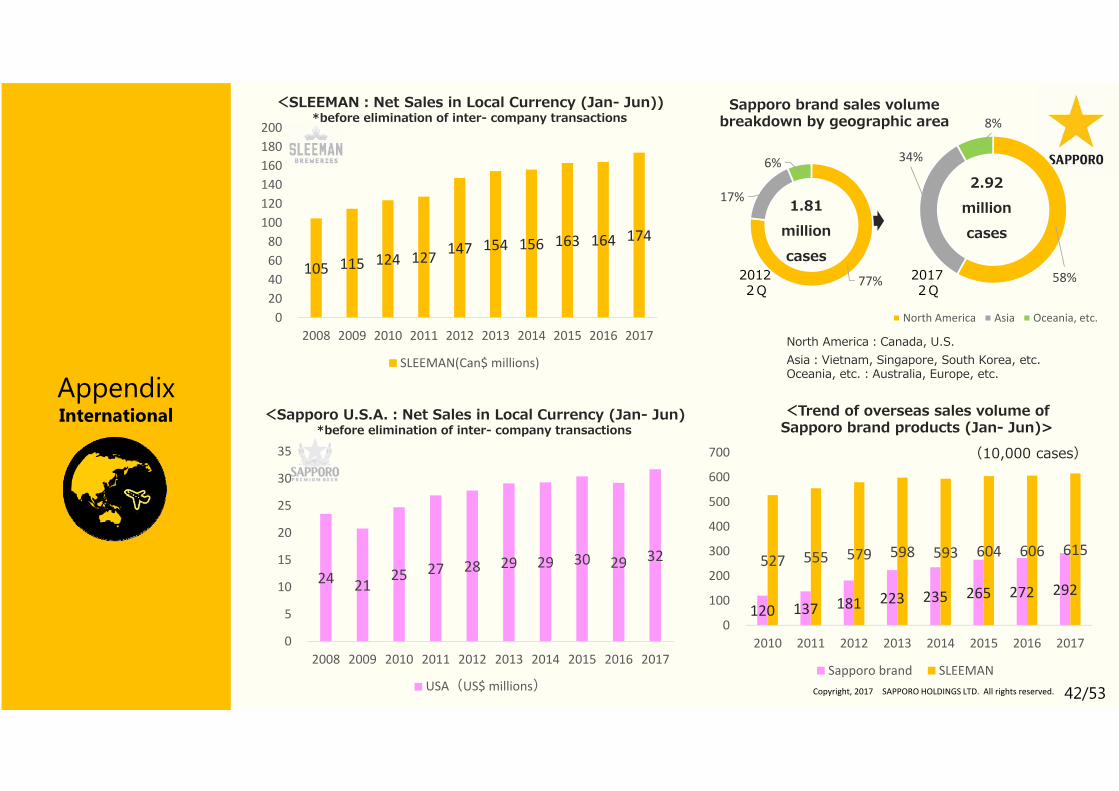
【SLEEMAN】 Jan- Jun up % y-o-y *sales volume
(total demand down 2%)
【Sapporo U.S.A.】 Jan- Jun up % y-o-y *sales volume
(total demand down 2%)
【Vietnam】 Jan- Jun down % y-o-y *sales volume
<Y-o-y change in domestic sales volumein Vietnam
<U.S. soft drinks business Net Sales in Local Currency (Jan-Jun)>
* before elimination of inter- company transactions
【U.S. soft drinks business】 Jan- Jun up % y-o-y
*sales revenue
0%
20%
40%
60%
80%
100%
120%
140%
16.1Q 16.2Q 16.3Q 16.4Q 17.1Q 17.2Q
127 134
020406080
100120140160
2016 2017
Silver Springs Citrus (US$ millions)Country Pure Foods (US$ millions)
42/53Copyright, 2017 SAPPORO HOLDINGS LTD. All rights reserved.
<Trend of overseas sales volume of Sapporo brand products (Jan- Jun)>
Sapporo brand sales volume breakdown by geographic area
North America:Canada, U.S.Asia:Vietnam, Singapore, South Korea, etc.Oceania, etc.:Australia, Europe, etc.
2.92million cases
<SLEEMAN:Net Sales in Local Currency (Jan- Jun))*before elimination of inter- company transactions
20122Q
2017 2Q
(10,000 cases)
<Sapporo U.S.A.:Net Sales in Local Currency (Jan- Jun)*before elimination of inter- company transactions
1.81million cases
AppendixInternational
105 115 124 127 147
154 156 163 164 174
020406080100120140160180200
2008 2009 2010 2011 2012 2013 2014 2015 2016 2017
SLEEMAN(Can$ millions)
24 21 25 27 28 29 29 30 29 32
0
5
10
15
20
25
30
35
2008 2009 2010 2011 2012 2013 2014 2015 2016 2017
USA(US$ millions)
77%
17%
6%
58%
34%
8%
North America Asia Oceania, etc.
120 137 181 223 235 265 272 292
527 555 579 598 593 604 606 615
0
100
200
300
400
500
600
700
2010 2011 2012 2013 2014 2015 2016 2017
Sapporo brand SLEEMAN
43/53Copyright, 2017 SAPPORO HOLDINGS LTD. All rights reserved.
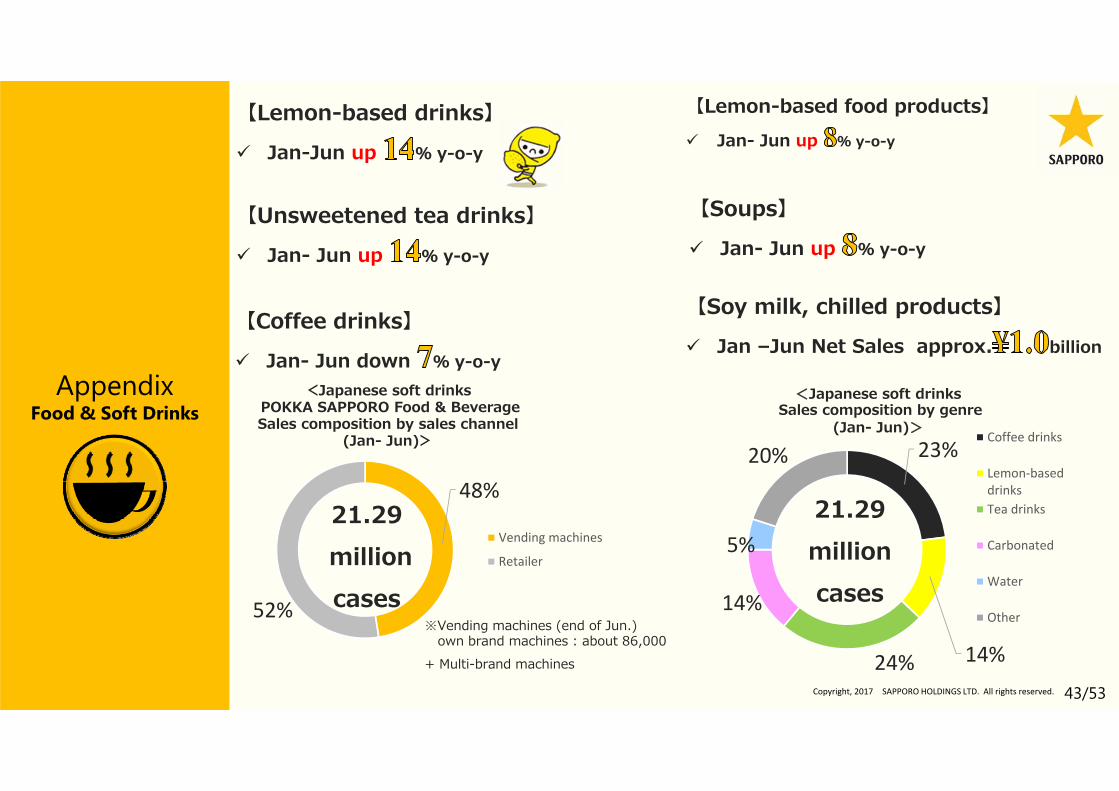
【Lemon-based drinks】 Jan-Jun up % y-o-y
AppendixFood & Soft Drinks
【Unsweetened tea drinks】 Jan- Jun up % y-o-y
【Coffee drinks】 Jan- Jun down % y-o-y
【Lemon-based food products】 Jan- Jun up % y-o-y
【Soups】 Jan- Jun up % y-o-y
【Soy milk, chilled products】 Jan –Jun Net Sales approx. billion
<Japanese soft drinksSales composition by genre
(Jan- Jun)>
<Japanese soft drinksPOKKA SAPPORO Food & Beverage Sales composition by sales channel
(Jan- Jun)>
※Vending machines (end of Jun.)own brand machines : about 86,000
+ Multi-brand machines
48%
52%
Vending machines
Retailer
21.29millioncases
23%
14%24%
14%
5%
20%Coffee drinks
Lemon‐baseddrinksTea drinks
Carbonated
Water
Other
21.29million cases
44/53Copyright, 2017 SAPPORO HOLDINGS LTD. All rights reserved.
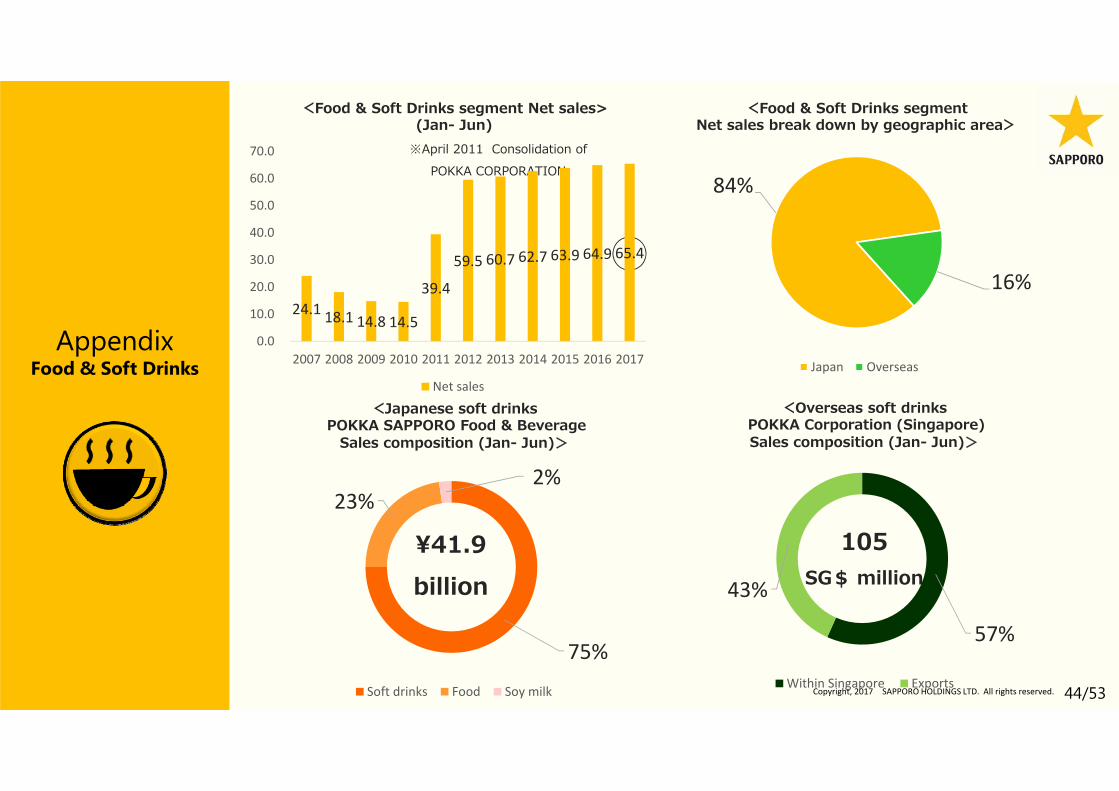
<Food & Soft Drinks segment Net sales>(Jan- Jun)
<Food & Soft Drinks segment Net sales break down by geographic area>
※April 2011 Consolidation of POKKA CORPORATION
<Japanese soft drinksPOKKA SAPPORO Food & Beverage
Sales composition (Jan- Jun)>
<Overseas soft drinksPOKKA Corporation (Singapore) Sales composition (Jan- Jun)>
AppendixFood & Soft Drinks
105SG$ million
¥41.9billion
24.1 18.1 14.8 14.5
39.4
59.5 60.7 62.7 63.9 64.9 65.4
0.0
10.0
20.0
30.0
40.0
50.0
60.0
70.0
2007 2008 2009 2010 2011 2012 2013 2014 2015 2016 2017
Net sales
84%
16%
Japan Overseas
75%
23%2%
Soft drinks Food Soy milk
57%
43%
Within Singapore Exports

45/53Copyright, 2017 SAPPORO HOLDINGS LTD. All rights reserved.
AppendixFood & Soft Drinks
【Pokka Create CO., Ltd.】 Jan- Jun Net sales billion
up % y-o-y
<New & refurbish outlets ><Number of outlets as of June 30, 2017 : 192>
192
107
85 Directory operated
FC
105
37
50 East Japan
Central Japan
West Japan192
46/53Copyright, 2017 SAPPORO HOLDINGS LTD. All rights reserved.
AppendixFood & Soft Drinks
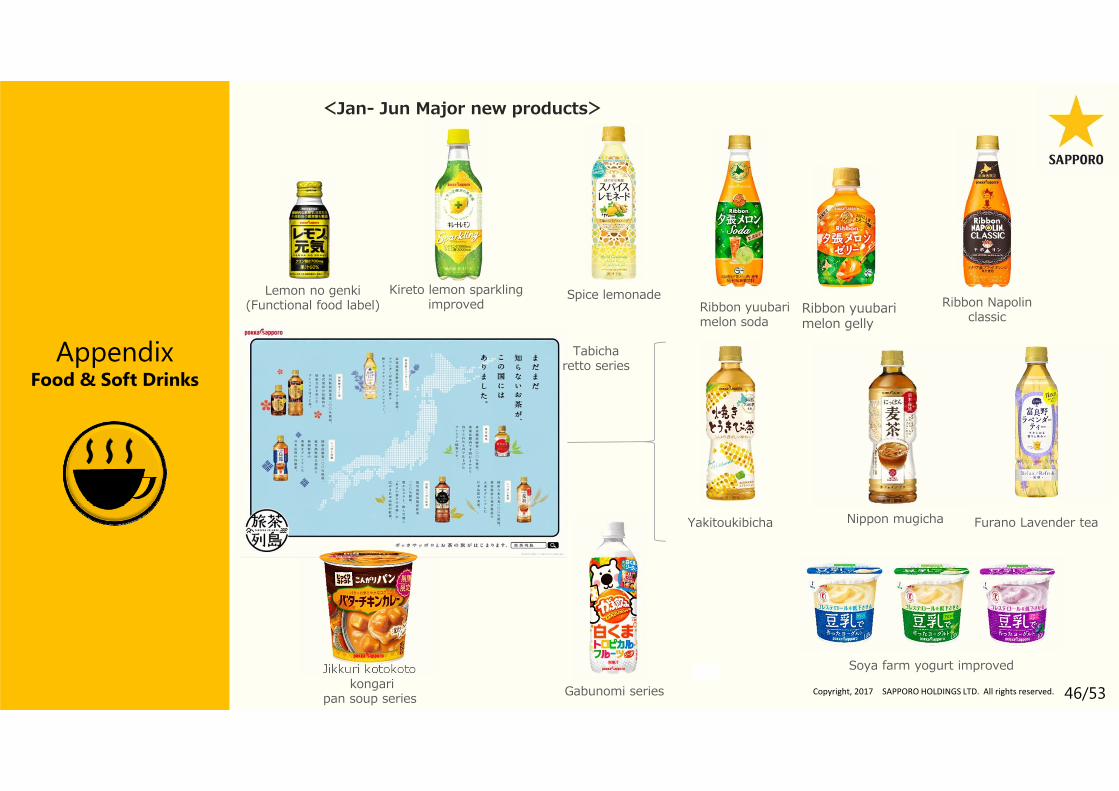
<Jan- Jun Major new products>
Lemon no genki(Functional food label)
Kireto lemon sparklingimproved
Nippon mugicha Furano Lavender tea
Ribbon Napolin classic
Ribbon yuubarimelon soda
Jikkuri kotokotokongari
pan soup series
Yakitoukibicha
Spice lemonade
Soya farm yogurt improved
Gabunomi series
Ribbon yuubari melon gelly
Tabicha retto series
47/53Copyright, 2017 SAPPORO HOLDINGS LTD. All rights reserved.
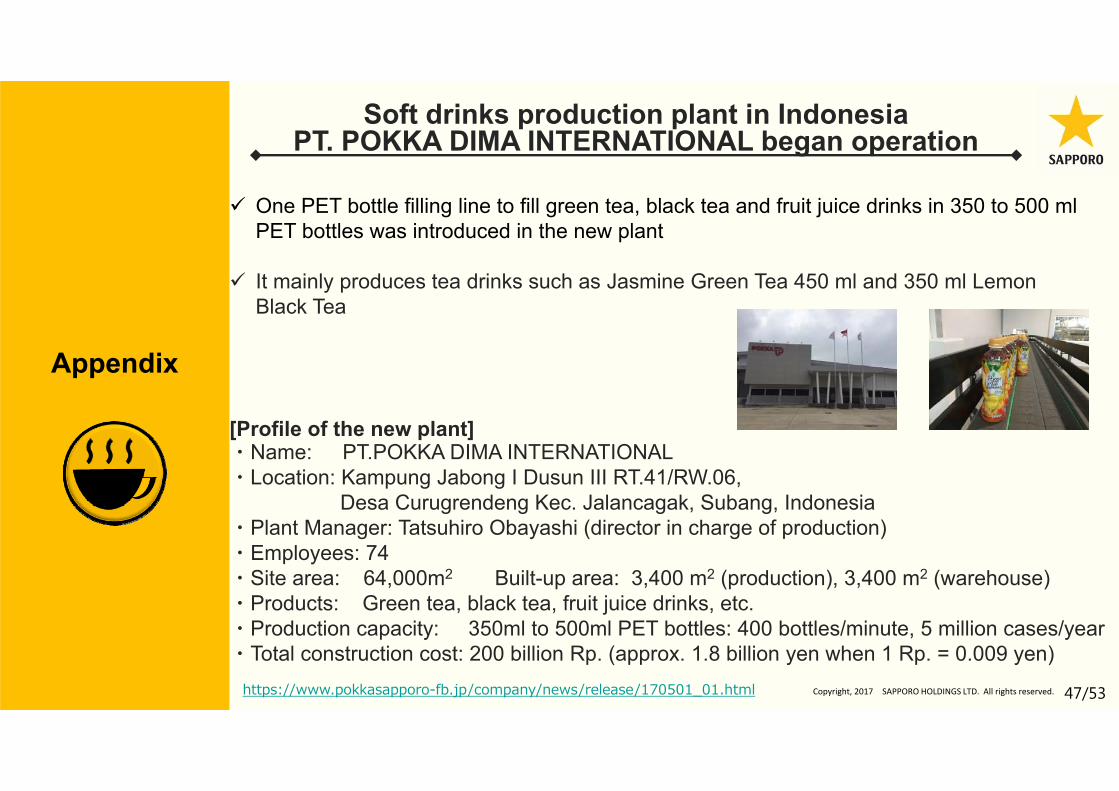
One PET bottle filling line to fill green tea, black tea and fruit juice drinks in 350 to 500 ml PET bottles was introduced in the new plant
It mainly produces tea drinks such as Jasmine Green Tea 450 ml and 350 ml Lemon Black Tea
Soft drinks production plant in Indonesia PT. POKKA DIMA INTERNATIONAL began operation
[Profile of the new plant]・Name: PT.POKKA DIMA INTERNATIONAL ・Location: Kampung Jabong I Dusun III RT.41/RW.06,
Desa Curugrendeng Kec. Jalancagak, Subang, Indonesia ・Plant Manager: Tatsuhiro Obayashi (director in charge of production)・Employees: 74・Site area: 64,000m2 Built-up area: 3,400 m2 (production), 3,400 m2 (warehouse)・Products: Green tea, black tea, fruit juice drinks, etc.・Production capacity: 350ml to 500ml PET bottles: 400 bottles/minute, 5 million cases/year・Total construction cost: 200 billion Rp. (approx. 1.8 billion yen when 1 Rp. = 0.009 yen)
https://www.pokkasapporo-fb.jp/company/news/release/170501_01.html
Appendix
48/53Copyright, 2017 SAPPORO HOLDINGS LTD. All rights reserved.
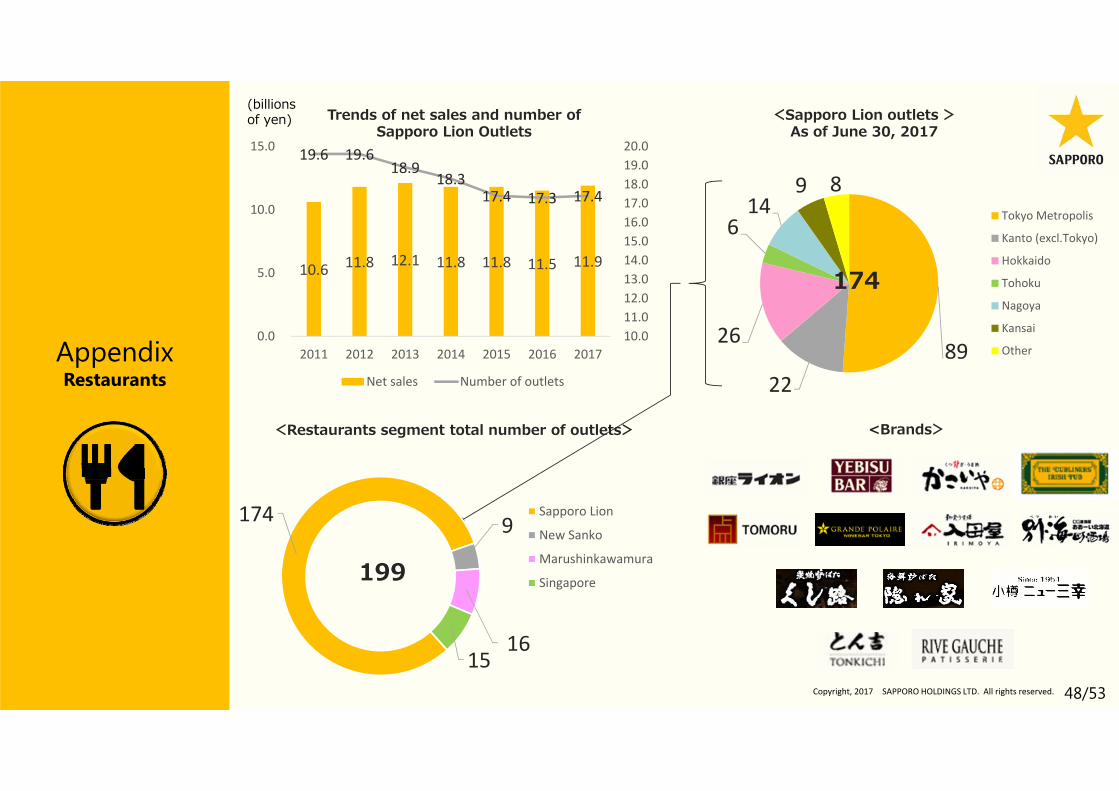
AppendixRestaurants
Trends of net sales and number ofSapporo Lion Outlets
<Restaurants segment total number of outlets>
<Sapporo Lion outlets >As of June 30, 2017
199
<Brands>
(billions of yen)
10.6 11.8 12.1 11.8 11.8 11.5 11.9
19.6 19.6 18.9
18.3 17.4 17.3 17.4
10.011.012.013.014.015.016.017.018.019.020.0
0.0
5.0
10.0
15.0
2011 2012 2013 2014 2015 2016 2017
Net sales Number of outlets
89 22
26
6 14
9 8 Tokyo Metropolis
Kanto (excl.Tokyo)
Hokkaido
Tohoku
Nagoya
Kansai
Other
174
174 9
16 15
Sapporo Lion
New Sanko
Marushinkawamura
Singapore
49/53Copyright, 2017 SAPPORO HOLDINGS LTD. All rights reserved.
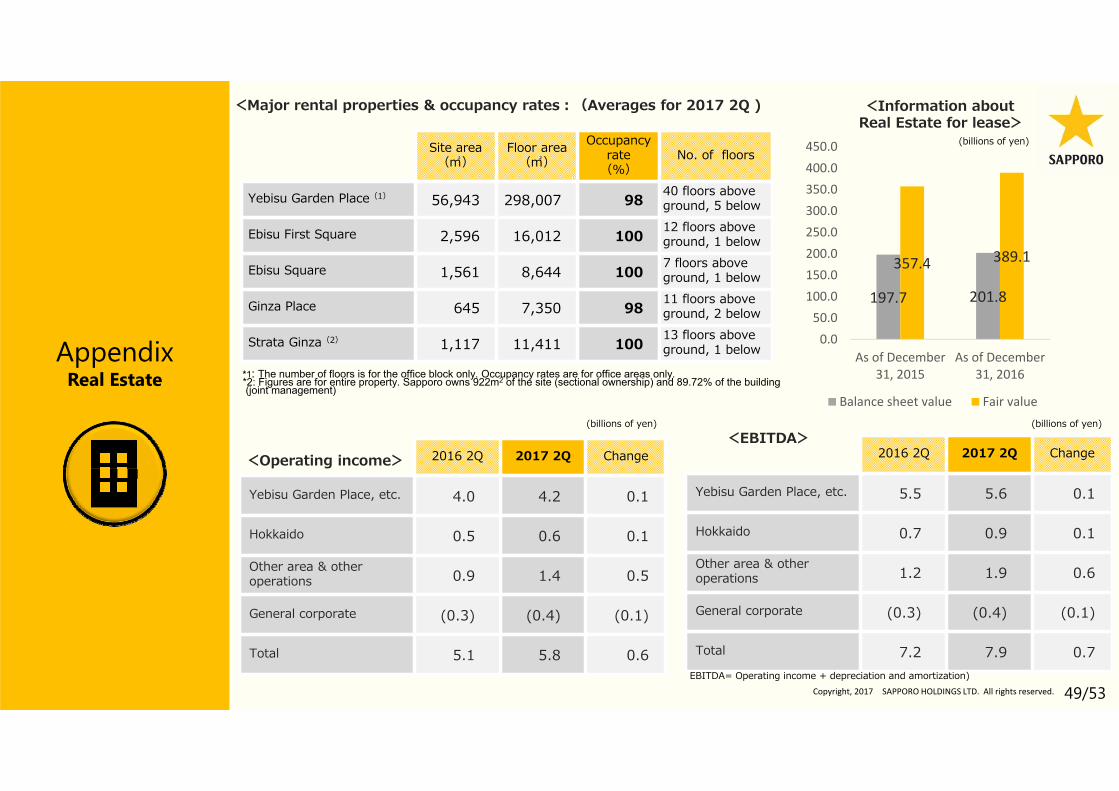
AppendixReal Estate
Site area(㎡)
Floor area(㎡)
Occupancy rate
(%)No. of floors
Yebisu Garden Place(1) 56,943 298,007 98 40 floors above ground, 5 below
Ebisu First Square 2,596 16,012 100 12 floors above ground, 1 below
Ebisu Square 1,561 8,644 100 7 floors above ground, 1 below
Ginza Place 645 7,350 98 11 floors above ground, 2 below
Strata Ginza(2) 1,117 11,411 100 13 floors above ground, 1 below
<Major rental properties & occupancy rates:(Averages for 2017 2Q ) <Information aboutReal Estate for lease>
197.7 201.8
357.4 389.1
0.050.0
100.0150.0200.0250.0300.0350.0400.0450.0
As of December31, 2015
As of December31, 2016
Balance sheet value Fair value
2016 2Q 2017 2Q Change
Yebisu Garden Place, etc. 5.5 5.6 0.1
Hokkaido 0.7 0.9 0.1
Other area & other operations 1.2 1.9 0.6
General corporate (0.3) (0.4) (0.1)
Total 7.2 7.9 0.7
2016 2Q 2017 2Q Change
Yebisu Garden Place, etc. 4.0 4.2 0.1
Hokkaido 0.5 0.6 0.1
Other area & other operations 0.9 1.4 0.5
General corporate (0.3) (0.4) (0.1)
Total 5.1 5.8 0.6
<Operating income><EBITDA>
*1: The number of floors is for the office block only. Occupancy rates are for office areas only.*2: Figures are for entire property. Sapporo owns 922m2 of the site (sectional ownership) and 89.72% of the building(joint management)
(billions of yen)
EBITDA= Operating income + depreciation and amortization)
(billions of yen)(billions of yen)
50/53Copyright, 2017 SAPPORO HOLDINGS LTD. All rights reserved.
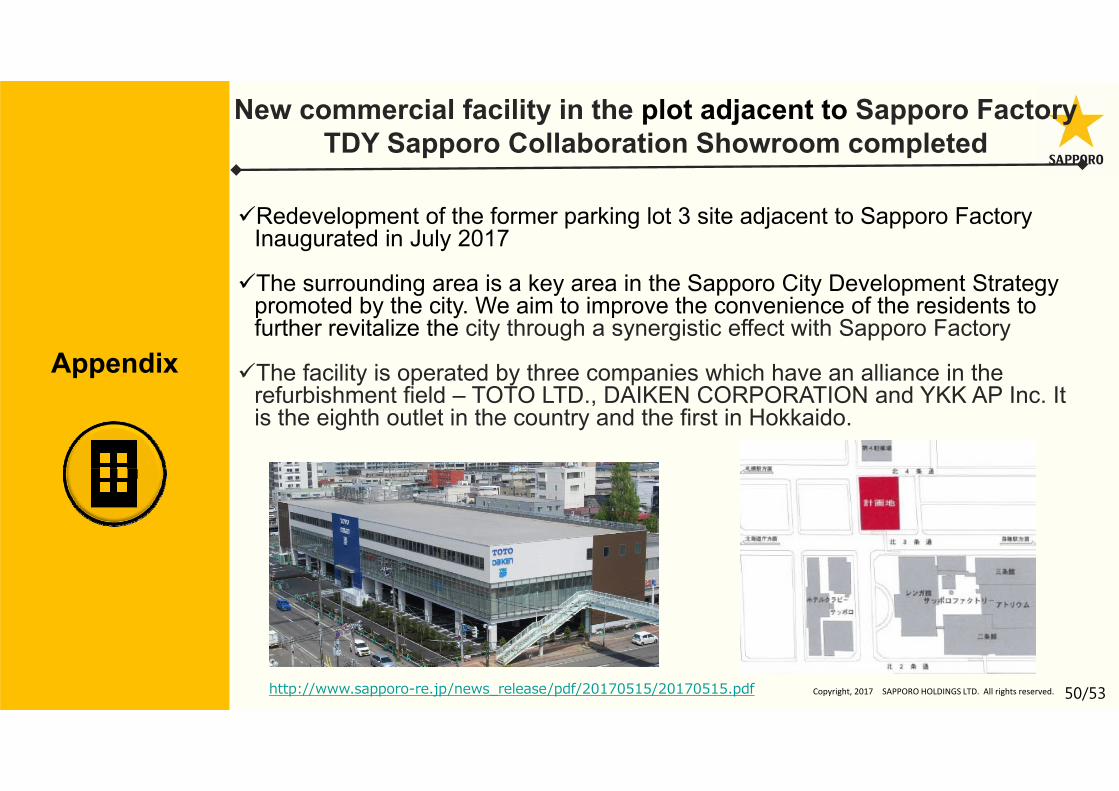
New commercial facility in the plot adjacent to Sapporo FactoryTDY Sapporo Collaboration Showroom completed
Appendix
Redevelopment of the former parking lot 3 site adjacent to Sapporo FactoryInaugurated in July 2017
The surrounding area is a key area in the Sapporo City Development Strategy promoted by the city. We aim to improve the convenience of the residents to further revitalize the city through a synergistic effect with Sapporo Factory
The facility is operated by three companies which have an alliance in the refurbishment field – TOTO LTD., DAIKEN CORPORATION and YKK AP Inc. It is the eighth outlet in the country and the first in Hokkaido.
http://www.sapporo-re.jp/news_release/pdf/20170515/20170515.pdf
51/53Copyright, 2017 SAPPORO HOLDINGS LTD. All rights reserved.
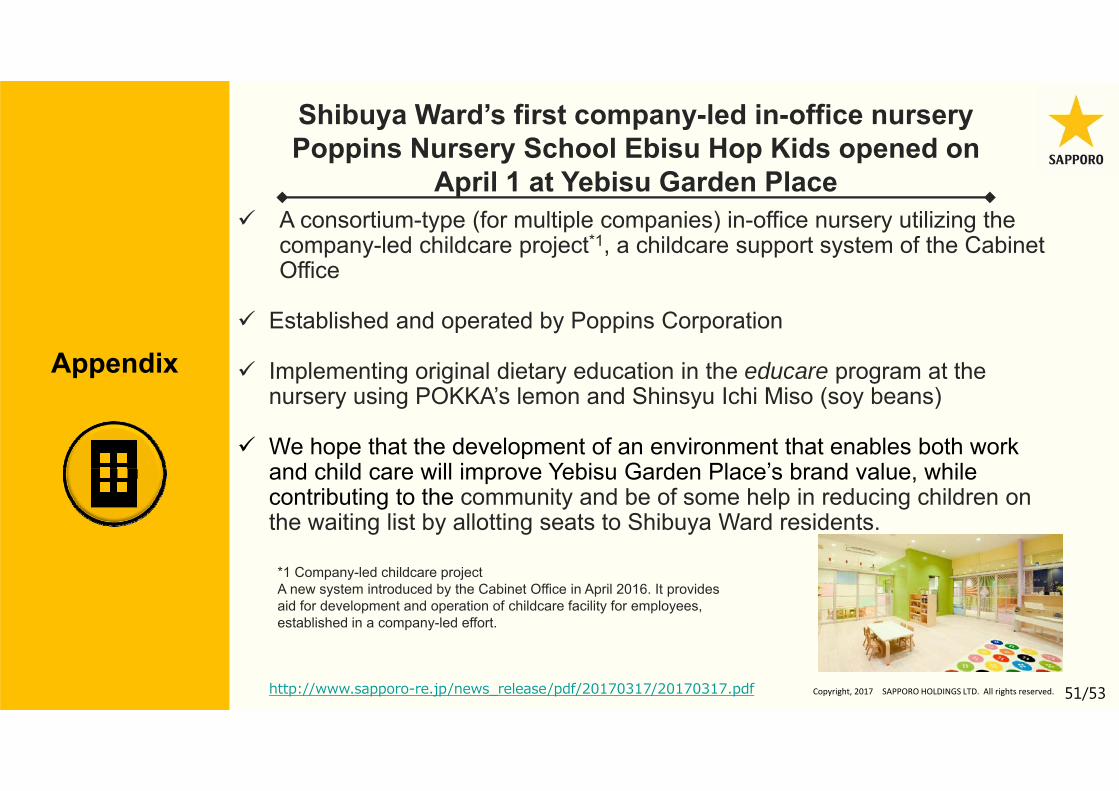
Shibuya Ward’s first company-led in-office nursery Poppins Nursery School Ebisu Hop Kids opened on
April 1 at Yebisu Garden Place
Appendix
A consortium-type (for multiple companies) in-office nursery utilizing the company-led childcare project*1, a childcare support system of the Cabinet Office
Established and operated by Poppins Corporation
Implementing original dietary education in the educare program at the nursery using POKKA’s lemon and Shinsyu Ichi Miso (soy beans)
We hope that the development of an environment that enables both work and child care will improve Yebisu Garden Place’s brand value, while contributing to the community and be of some help in reducing children on the waiting list by allotting seats to Shibuya Ward residents.
http://www.sapporo-re.jp/news_release/pdf/20170317/20170317.pdf
*1 Company-led childcare projectA new system introduced by the Cabinet Office in April 2016. It provides aid for development and operation of childcare facility for employees, established in a company-led effort.
52/53Copyright, 2017 SAPPORO HOLDINGS LTD. All rights reserved.
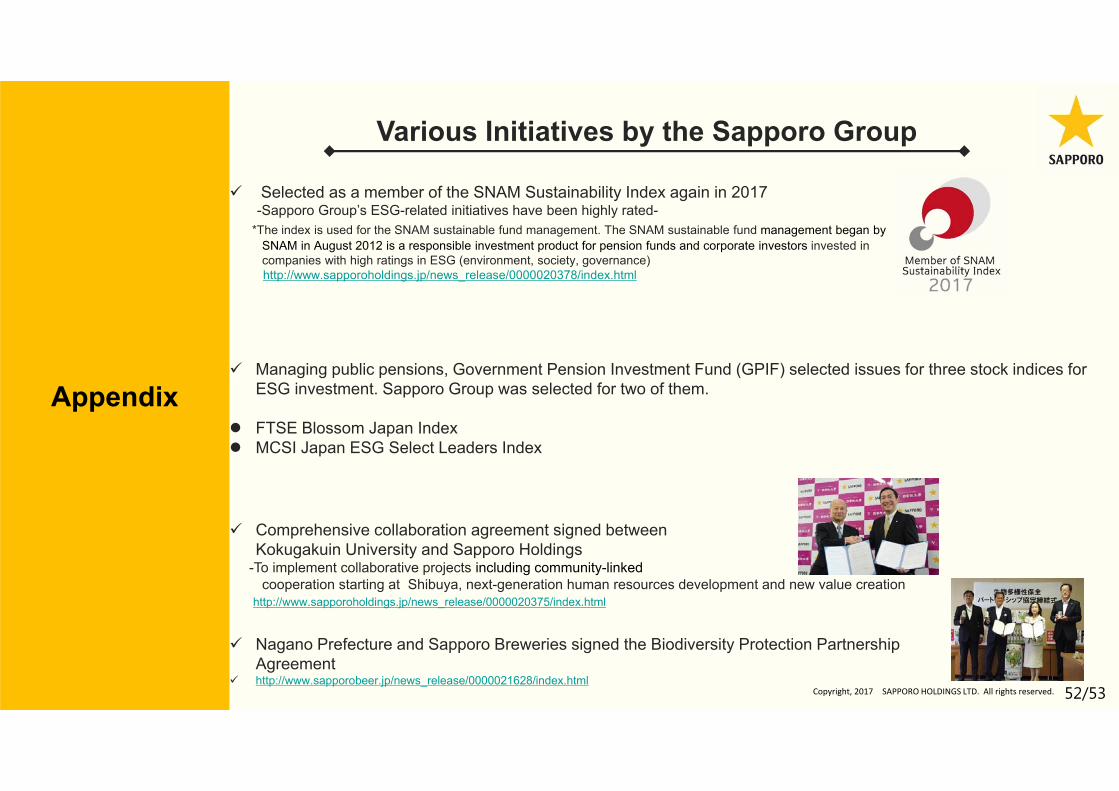
Selected as a member of the SNAM Sustainability Index again in 2017-Sapporo Group’s ESG-related initiatives have been highly rated-
*The index is used for the SNAM sustainable fund management. The SNAM sustainable fund management began by SNAM in August 2012 is a responsible investment product for pension funds and corporate investors invested in companies with high ratings in ESG (environment, society, governance) http://www.sapporoholdings.jp/news_release/0000020378/index.html
Comprehensive collaboration agreement signed between Kokugakuin University and Sapporo Holdings
-To implement collaborative projects including community-linkedcooperation starting at Shibuya, next-generation human resources development and new value creation
http://www.sapporoholdings.jp/news_release/0000020375/index.html
Nagano Prefecture and Sapporo Breweries signed the Biodiversity Protection Partnership Agreement
http://www.sapporobeer.jp/news_release/0000021628/index.html
Various Initiatives by the Sapporo Group
Appendix Managing public pensions, Government Pension Investment Fund (GPIF) selected issues for three stock indices for
ESG investment. Sapporo Group was selected for two of them.
FTSE Blossom Japan Index MCSI Japan ESG Select Leaders Index
53/53Copyright, 2017 SAPPORO HOLDINGS LTD. All rights reserved.
As an intrinsic part of people's lives, Sapporo will contribute to the evolution of creative, enriching and rewarding lifestyles.
The earnings forecasts and forward‐looking statements appearing in this document were prepared by theSAPPORO Group based on currently available information and its best assessment of potential risks anduncertainties. Actual outcomes may differ materially from forecasts due to changes in various underlyingfactors.