Embed Size (px)
Citation preview

Document Version 30 March 2014
f
SAP NetWeaver Process Integration (PI)
Performance Check Guide Analyzing Performance Problems and Possible Solution Strategies
SAP NetWeaver PI 71x
SAP NetWeaver PI 73x
SAP NetWeaver PI 74
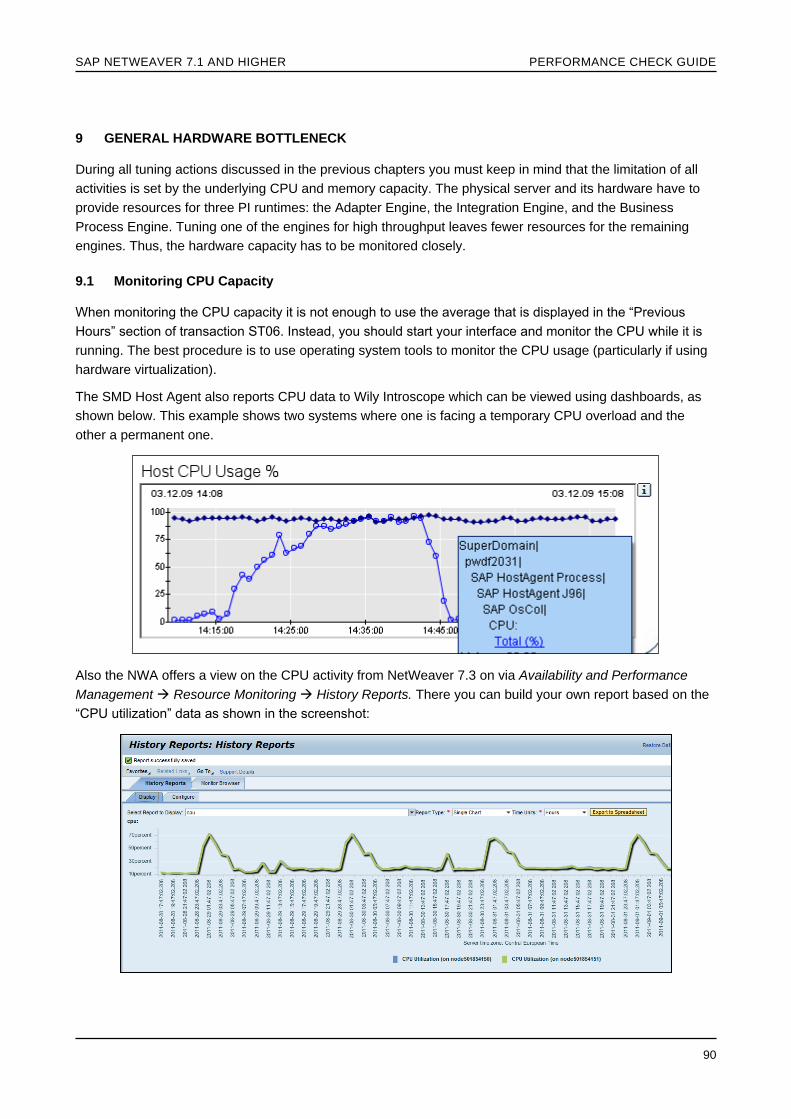
SAP NETWEAVER 71 AND HIGHER PERFORMANCE CHECK GUIDE
2
DOCUMENT HISTORY
Before you start planning make sure you have the latest version of this document You can find the link to
the latest version via SAP Note 894509 ndash PI Performance Check
The following table provides an overview on the most important changes to this document
Version Date Description
30 March 2014 Reason for new version Include latest improvements in PI 731 and
PI 74 and enhanced tuning options for Java only runtime Many
sections were updated Major changes are
Additional symptom (blacklisting) for qRFC queues in READY status
Long processing time for Lean Message Search
IDoc posting configuration on receiver side
Tuning of SOAP sender adapter
More information about IDOC_AAE adapter tuning
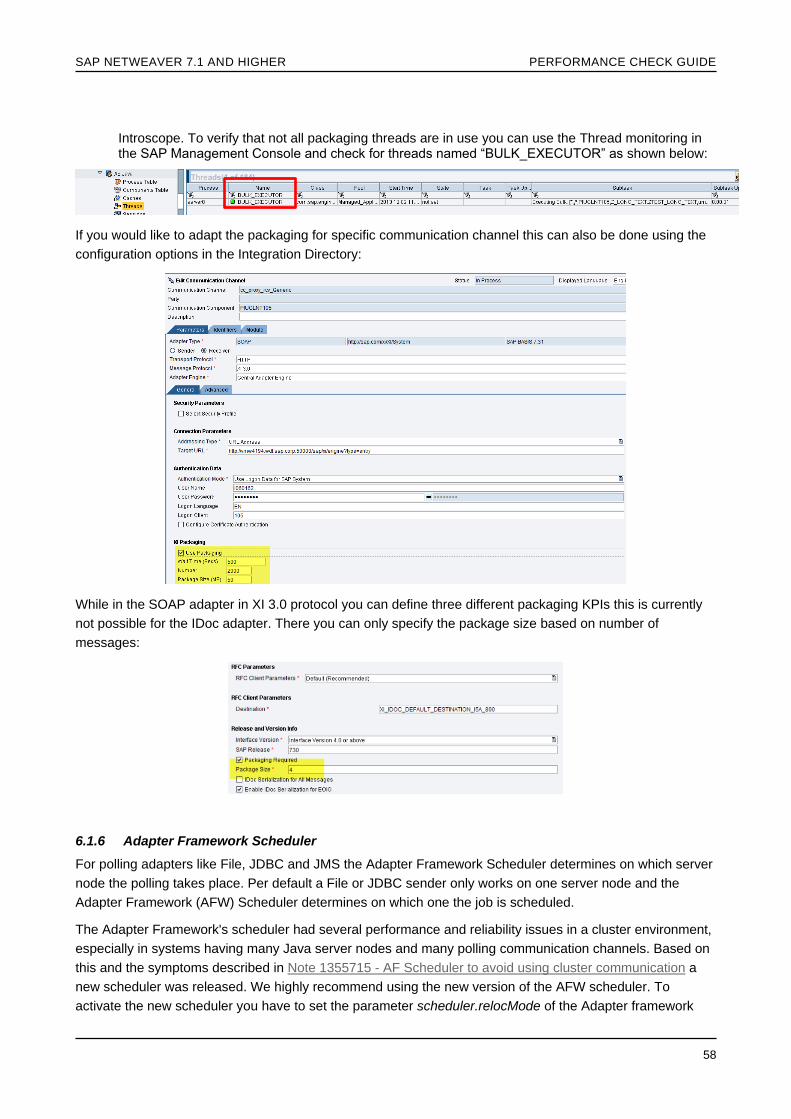
Packaging for Java IDoc and Java Proxy adapter
New Adapter Framework Scheduler for polling adapters
new performance monitor for Adapter Engine
Enhancements of the maxReceiver parameter for individual interfaces
Include latest information for staging and logging (restructured to be part of Java only chapter)
FCA Thread tuning for incoming HTTP requests
Enhancements in the Proxy framework on senderreceiver ERPs
Large message queues on PI Adapter Engine
Generic J2EE database monitoring in NWA
Appendix section XPI_Inspector
20 October 2011 Reason for new version Adaption to PI 73
Added document history
Added options and description about AEX
Added new adapters updated existing adapter parallelization
Description of additional monitors (Java performance monitor and new ccBPM monitor)
General review of entire document with corrections
More details and performance measurements for Java Only
SAP NETWEAVER 71 AND HIGHER PERFORMANCE CHECK GUIDE
3
(ICO) scenarios
Additional new chapters
Prevent blocking of EO queues
Avoid uneven backlogs with queue balancing
Reduce the number of EOIO queues
Adapter Framework Scheduler
Avoid blocking of Java only scenarios
J2EE HTTP load balancing
Persistence of Audit Log information in PI 710 and higher
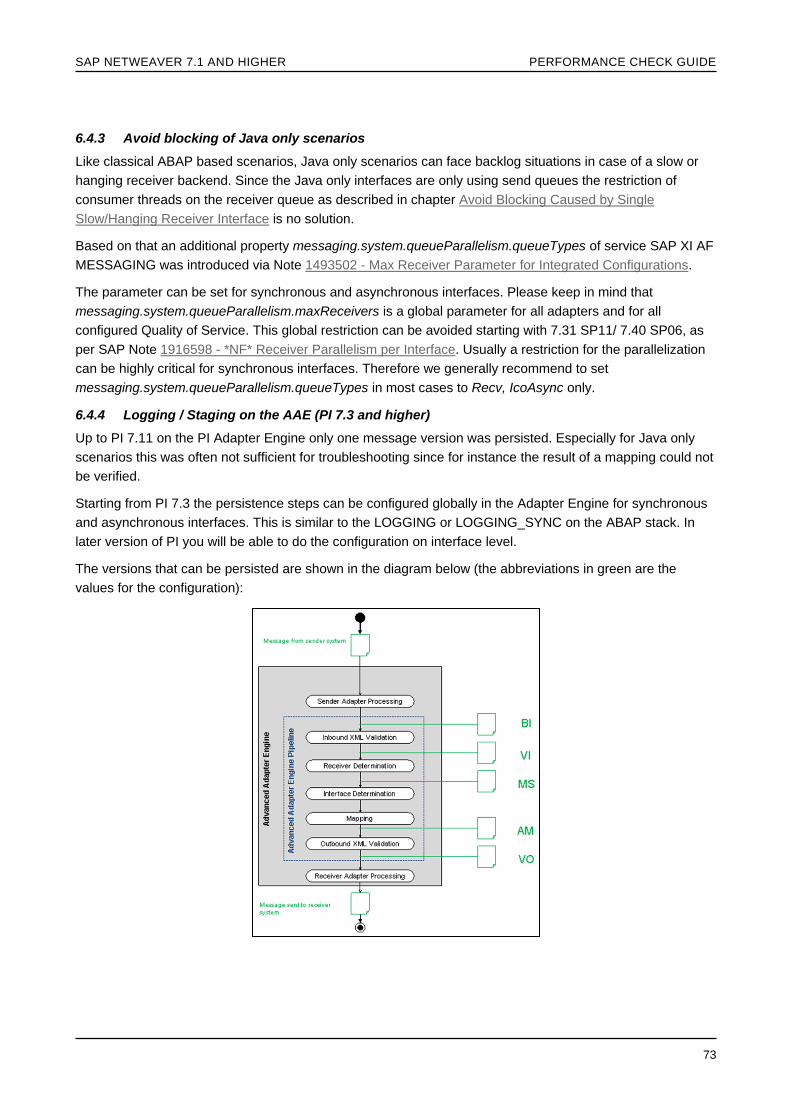
Logging Staging on the AAE (PI 73 and higher)
11 December 2009 Reason for new version Adaption to PI 71
General review of entire document with corrections
Additional new chapters
Tuning the IDoc adapter
Message Prioritization on the ABAP stack
Prioritization in the Messaging System
Avoid blocking caused by single slowhanging receiver interface
Performance of Module Processing
Advanced Adapter Engine Integrated Configuration
ABAP Proxy system tuning
Wily Transaction Trace
10 October 2007 Initial document version released for XI 30 and PI 70
SAP NETWEAVER 71 AND HIGHER PERFORMANCE CHECK GUIDE
4
TABLE OF CONTENTS
1 INTRODUCTION 6
2 WORKING WITH THIS DOCUMENT 10
3 DETERMINING THE BOTTLENECK 12 31 Integration Engine Processing Time 12 32 Adapter Engine Processing Time 13 321 Adapter Engine Performance monitor in PI 731 and higher 15 33 Processing Time in the Business Process Engine 16
4 ANALYZING THE INTEGRATION ENGINE 20 41 Work Process Overview (SM50SM66) 21 42 qRFC Resources (SARFC) 22 43 Parallelization of PI qRFC Queues 23 44 Analyzing the runtime of PI pipeline steps 29 441 Long Processing Times for ldquoPLSRV_RECEIVER_ DETERMINATIONrdquo PLSRV_INTERFACE_DETERMINATION 30 442 Long Processing Times for ldquoPLSRV_MAPPING_REQUESTrdquo 30 443 Long Processing Times for ldquoPLSRV_CALL_ADAPTERrdquo 33 444 Long Processing Times for ldquoDB_ENTRY_QUEUEINGrdquo 34 445 Long Processing Times for ldquoDB_SPLITTER_QUEUEINGrdquo 34 446 Long Processing Times for ldquoLMS_EXTRACTIONrdquo 36 447 Other step performed in the ABAP pipeline 36 45 PI Message Packaging for Integration Engine 37 46 Prevent blocking of EO queues 38 47 Avoid uneven backlogs with queue balancing 38 48 Reduce the number of parallel EOIO queues 40 49 Tuning the ABAP IDoc Adapter 41 491 ABAP basis tuning 41 492 Packaging on sender and receiver side 42 493 Configuration of IDoc posting on receiver side 42 410 Message Prioritization on the ABAP Stack 44
5 ANALYZING THE BUSINESS PROCESS ENGINE (BPE) 45 51 Work Process Overview 45 52 Duration of Integration Process Steps 45 53 Advanced Analysis Load Created by the Business Process Engine (ST03N) 47 54 Database Reorganization 47 55 Queuing and ccBPM (or increasing Parallelism for ccBPM Processes) 48 56 Message Packaging in BPE 48
6 ANALYZING THE (ADVANCED) ADAPTER ENGINE 50 61 Adapter Performance Problem 51 611 Adapter Parallelism 51 612 Sender Adapter 54 613 Receiver Adapter 55 614 IDoc_AAE adapter tuning 56 615 Packaging for Proxy (SOAP in XI 30 protocol) and Java IDoc adapter 56 616 Adapter Framework Scheduler 58 62 Messaging System Bottleneck 60 621 Messaging System in between AFW Sender Adapter and Integration Server (Outbound) 63 622 Messaging System in Between Integration Server and AFW Receiver Adapter (Inbound) 64 623 Interface Prioritization in the Messaging System 64 624 Avoid Blocking Caused by Single SlowHanging Receiver Interface 65 625 Overhead based on interface pattern being used 67 63 Performance of Module Processing 68 64 Java only scenarios Integrated Configuration objects 69
SAP NETWEAVER 71 AND HIGHER PERFORMANCE CHECK GUIDE
5
641 General performance gain when using Java only scenarios 69 642 Message Flow of Java only scenarios 71 643 Avoid blocking of Java only scenarios 73 644 Logging Staging on the AAE (PI 73 and higher) 73 65 J2EE HTTP load balancing 75 66 J2EE Engine Bottleneck 76 661 Java Memory 76 662 Java System and Application Threads 80 663 FCA Server Threads 83 664 Switch Off VMC 84
7 ABAP PROXY SYSTEM TUNING 85 71 New enhancements in Proxy queuing 86
8 MESSAGE SIZE AS SOURCE OF PERFORMANCE PROBLEMS 87 81 Large message queues on PI ABAP 88 82 Large message queues on PI Adapter Engine 88
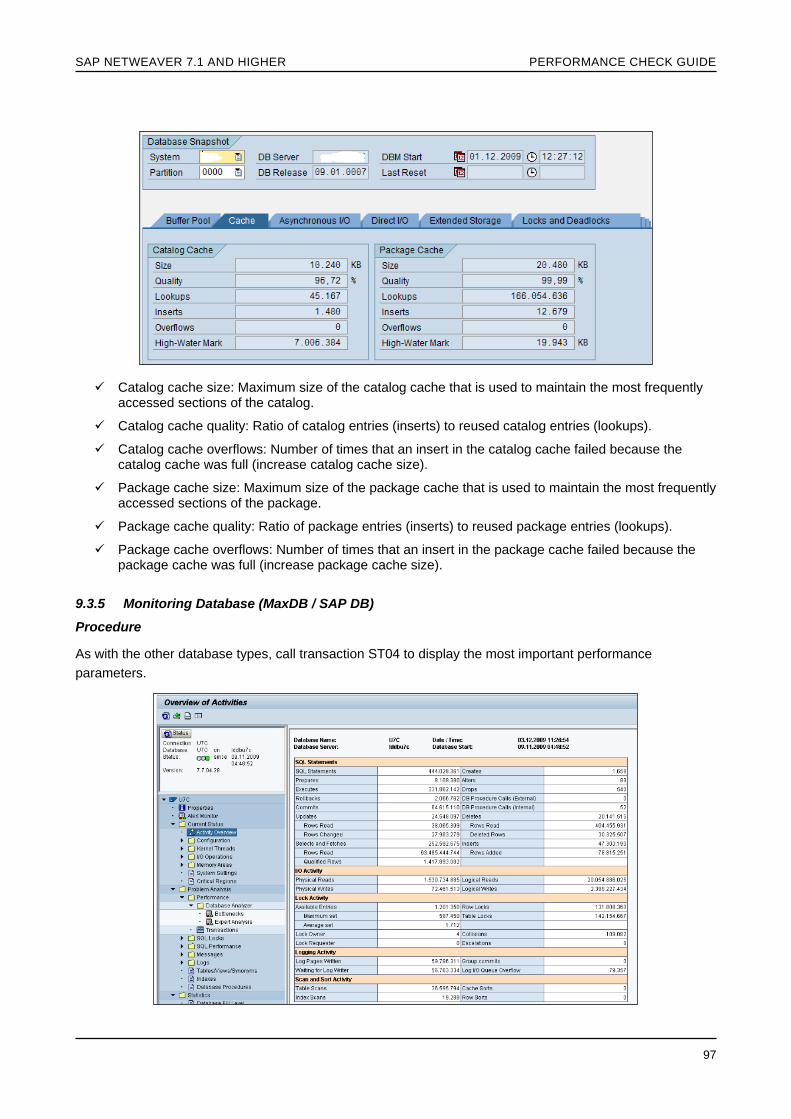
9 GENERAL HARDWARE BOTTLENECK 90 91 Monitoring CPU Capacity 90 92 Monitoring Memory and Paging Activity 91 93 Monitoring the Database 91 931 Generic J2EE database monitoring in NWA 92 932 Monitoring Database (Oracle) 93 933 Monitoring Database (MS SQL) 94 934 Monitoring Database (DB2) 95 935 Monitoring Database (MaxDB SAP DB) 97 94 Monitoring Database Tables 99
10 TRACES LOGS AND MONITORING DECREASING PERFORMANCE 101 101 Integration Engine 101 102 Business Process Engine 102 103 Adapter Framework 102 1031 Persistence of Audit Log information in PI 710 and higher 103
11 ERRORS AS SOURCE OF PERFORMANCE PROBLEMS 104
APPENDIX A 105 A1 Wily Introscope Transaction Trace 105 A2 XPI inspector for troubleshooting and performance analysis 106
SAP NETWEAVER 71 AND HIGHER PERFORMANCE CHECK GUIDE
6
1 INTRODUCTION
SAP NetWeaver Process Integration (PI) consists of the following functional components Integration Builder
(including Enterprise Service Repository (ESR) Service Registry (SR) and Integration Directory) Integration
Server (including Integration Engine Business Process Engine and Adapter Engine) Runtime Workbench
(RWB) and System Landscape Directory (SLD) The SLD in contrast to the other components may not
necessarily be part of the PI system in your system landscape because it is used by several SAP NetWeaver
products (however it will be accessed by the PI system regularly) Additional components in your PI
landscape might be the Partner Connectivity Kit (PCK) a J2SE Adapter Engine one or several non-central
Advanced Adapter Engines or an Advanced Adapter Engine Extended An overview is given in the graphic
below The communication and accessibility of these components can be checked using the PI Readiness
Check (SAP Note 817920)
Processing at runtime is carried out by the Integration Server (IS) with the aid of the SLD The IS in this
graphic stands for the Web Application Server 70 or higher In the classic environment PI is installed as a
double stack an ABAP and a Java stack (J2EE Engine) The ABAP stack is responsible for pipeline
processing in the Integration Engine (Receiver Determination Interface Determination and so on) and the
processing of integration processes in the Business Process Engine Every message has to pass through
the ABAP stack The Java stack executes the mapping of messages (with the exception of ABAP mappings)
and hosts the Adapter Framework (AFW) The Adapter Framework contains all XI adapters except the plain
HTTP WSRM and IDoc adapters
SAP NETWEAVER 71 AND HIGHER PERFORMANCE CHECK GUIDE
7
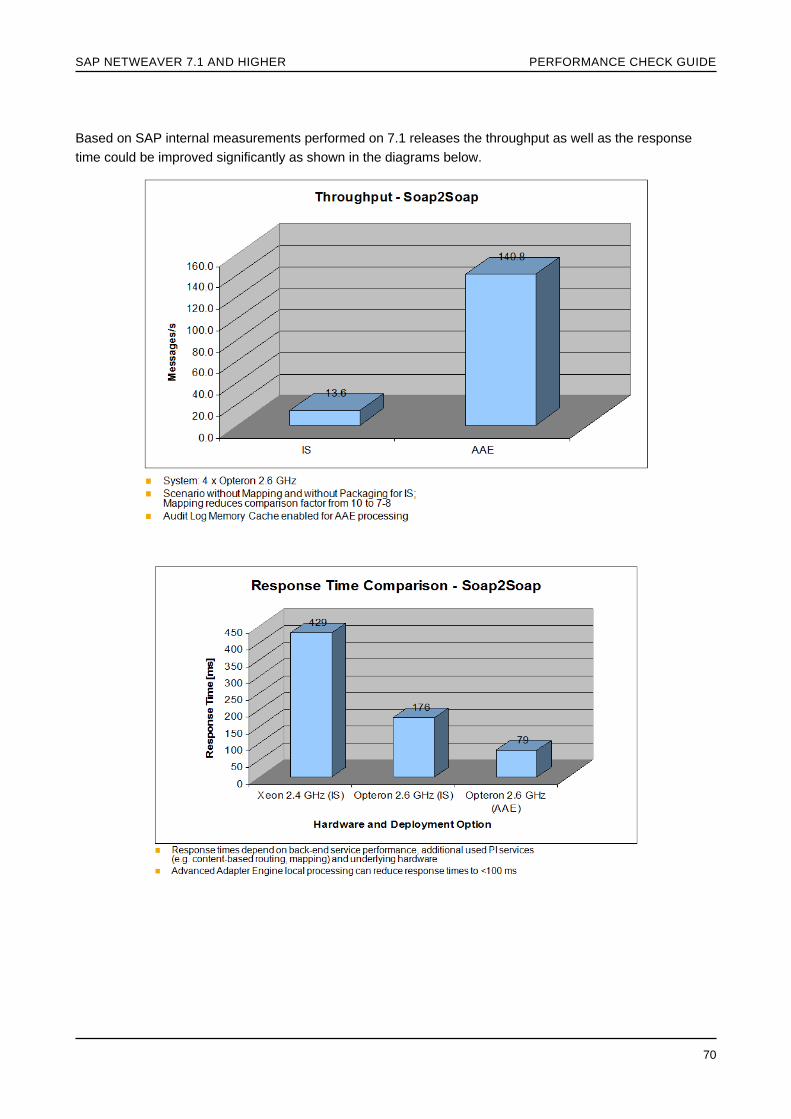
With 71 the so called Advanced Adapter Engine (AAE) was introduced The Adapter Engine was enhanced
to provide additional routing and mapping call functionality so that it is possible to process messages locally
This means that a message that is handled by a sender and receiver adapter based on J2EE does not need
to be forwarded to the ABAP Integration Engine This saves a lot of internal communication reduces the
response time and significantly increases the overall throughput The deployment options and the message
flow for 71 based systems and higher are shown below Currently not all the functionalities available in the
PI ABAP stack are available on the AAE but each new PI release closes the gap further
In SAP PI 73 and higher the Adapter Engine Extended (AEX) was introduced In addition to the AAE the
Adapter Engine Extended also allows local configuration of the PI objects The AEX can therefore be seen
as a complete PI installation running on Java only From the runtime perspective no major differences can be
seen compared to the AAE and therefore no differentiation is made in this guide
SAP NETWEAVER 71 AND HIGHER PERFORMANCE CHECK GUIDE
8
Looking at the different involved components we get a first impression of where a performance problem
might be located In the Integration Engine itself in the Business Process Engine or in one of the Advanced
Adapter Engines (central non-central plain PCK) Of course a performance problem could also occur
anywhere in between for example in the network or around a firewall Note that there is a separation
between a performance issue ldquoin PIrdquo and a performance issue in any attached systems If viewed ldquothrough
the eyesrdquo of a message (that is from the point of view of the message flow) then the PI system technically
starts as soon as the message enters an adapter or (if HTTP communication is used) as soon as the
message enters the pipeline of the Integration Engine Any delay prior to this must be handled by the
sending system The PI system technically ends as soon as the message reaches the target system for
example a given receiver adapter (or in case of HTTP communication the pipeline of the Integration Server)
has received the success message of the receiver Any delay after this point in time must be analyzed in the
receiving system
There are generally two types of performance problems The first is a more general statement that the PI
system is slow and has a low performance level or does not reach the expected throughput The second is
typically connected to a specific interface failing to meet the business expectation with regard to the
processing time The layout of this check is based on the latter First you should try to determine the
component that is responsible for the long processing time or the component that needs the highest absolute
time for processing Once this has been clarified there is a set of transactions that will help you to analyze
the origin of the performance problem
If the recommendations given in this guide are not sufficient SAP can help you to optimize the service via
SAP consulting or SAP MaxAttention services SAP might also handle smaller problems restricted to a
specific interface if you describe your problem in a SAP customer incident Support offerings like ldquoSAP
Going Live Analysis (GA)rdquo and ldquoSAP Going Live Verification (GV)rdquo can be used to ensure that the main
system parameters are configured according to SAP best practice You can order any type of service using
SAP Service Marketplace or your local SAP contacts
If you have already worked with the PI Admin Check (SAP Note 884865) you will recognize some of the
transactions This is because SAP considers the regular checking of the performance to be an important
administrational task However this check tries to show the methodology to approach performance problems
to its reader Also it offers the most common reasons for performance problems and links to possible follow-
up actions but does not refer to any regular administrational transactions
SAP NETWEAVER 71 AND HIGHER PERFORMANCE CHECK GUIDE
9
Wily Introscope is a prerequisite for analyzing performance problems at the Java side It allows you to
monitor the resource usage of multiple J2EE server nodes and provides information about all the important
components on the Java stack like mapping runtime messaging system or module processor Furthermore
the data collected by Wily is stored for several days so it is still possible to analyze a performance problem at
a later date Wily Introscope is provided free-of-charge for SAP customers It is delivered as part of Solution
Manager Diagnostics but can also be installed separately For more information see
httpservicesapcomdiagnostics or SAP Note 797147
SAP NETWEAVER 71 AND HIGHER PERFORMANCE CHECK GUIDE
10
2 WORKING WITH THIS DOCUMENT
If you are experiencing performance problems on your Process Integration system start with Chapter 3
Determining the Bottleneck It helps you to determine the processing time for the different runtimes within PI
Integration Engine Business Process Engine and Adapter Engine or connected Proxy System Once you
have identified the area in which the bottleneck is most probably located continue with the relevant chapter
This is not always easy to do because a long processing time is not always an indication for a bottleneck It
can make sense to do this if a complicated step is involved (Business Process Engine) if an extensive
mapping is to be executed (IS) or if the payload is quite large (all runtimes) For this reason you need to
compare the value that you retrieve from Chapter 3 with values that you have received previously for
example The history data provided for the Java components by Wily Introscope is a big help If this is not
possible you will have to work with a hypothesis
Once the area of concern has been identified (or your first assumption leads you there) Chapters 4 5 6
and 7 will help you to analyze the Integration Engine the Business Process Engine the PI Adapter
Framework and the ABAP Proxy runtime
After (or preferably during) the analysis of the different process components it is important to keep in mind
that the bottlenecks you have observed could also be caused by other interfaces processing at the same
time It will lead you to slightly different conclusions and tuning measures You therefore have to distinguish
the following cases based on where the problem occurs
A with regard to the interface itself that is it occurs even if a single message of this interface is processed
B or with regard to the volume of this interface that is many messages of this interface are processed at the same time
C or with regard to the overall message volume processed on PI
This can be analyzed by repeating the procedure of Chapter 3 for A) a single message that is processed
while no other messages of this interface are processed and while no other interfaces are running Then
compare this value with B) the processing time for a typical amount of messages of this interface not simply
one message as before If the values of measurement A) and B) are similar repeat the procedure with C) a
typical volume of all interfaces that is during a representative timeframe on your productive PI system or
with the help of a tailored volume test
These three measurements ndash A) processing time of a single message B) processing time of a typical
amount of messages of a single interface and C) processing time of a typical amount of messages of all
interfaces ndash should enable you to distinguish between the three possible situations
o A specific interface has long processing steps that need to be identified and improved The tuning options are usually limited and a re-design of the interface might be required
o The mass processing of an interface leads to high processing times This situation typically calls for tuning measures
o The long processing time is a result of the overall load on the system This situation can be solved by tuning measures and by taking advantage of PI features for example to establish separation of interfaces If the bottleneck is hardware-related it could also require a re-sizing of the hardware that is used
SAP NETWEAVER 71 AND HIGHER PERFORMANCE CHECK GUIDE
11
Chapters 8 9 10 and 11 deal with more general reasons for bad performance such as heavy
tracinglogging error situations and general hardware problems They should be taken into account if the
reason for slow processing cannot be found easily or if situation C from above applies (long processing times
due to a high overall load)
Important
Chapter 9 provides the basic checks for the hardware of the PI server It should not only be used when
analyzing a hardware bottleneck due to a high overall load andor an insufficient sizing but should also be
used after every change made to the configuration of PI to ensure that the hardware is able to handle the
new situation This is important because a classical PI system uses three runtime engines (IS BPE AFW)
Tuning one engine for high throughput might have a direct impact on the others With every tuning action
applied you have to be aware of the consequences on the other runtimes or the available hardware
resources
SAP NETWEAVER 71 AND HIGHER PERFORMANCE CHECK GUIDE
12
3 DETERMINING THE BOTTLENECK
The total processing time in PI consists of the processing time in the Integration Server processing time in
the Business Process Engine (if ccBPM is used) as well as the processing time in the Adapter Framework (if
adapters except IDoc plain HTTP or ABAP proxies are used) In the subsequent chapters you will find a
detailed description of how to obtain these processing times
For reasons of completeness we will also have a look at the ABAP Proxy runtime and the available
performance evaluations
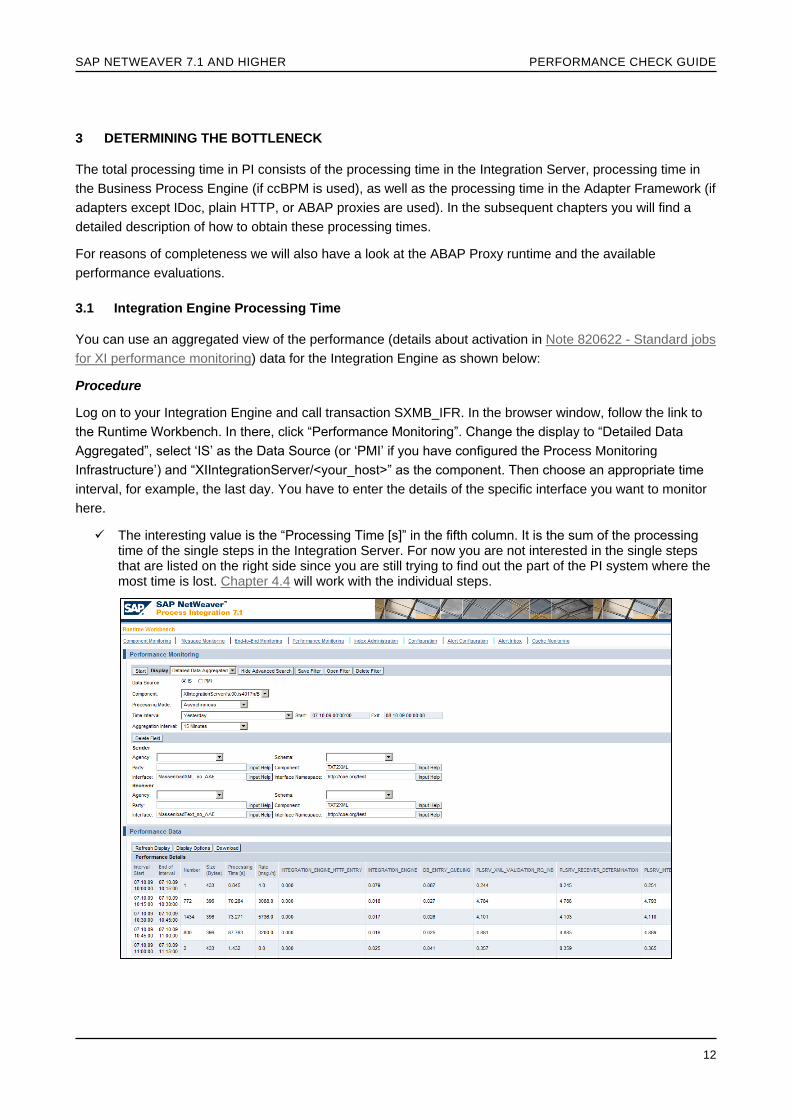
31 Integration Engine Processing Time
You can use an aggregated view of the performance (details about activation in Note 820622 - Standard jobs
for XI performance monitoring) data for the Integration Engine as shown below
Procedure
Log on to your Integration Engine and call transaction SXMB_IFR In the browser window follow the link to
the Runtime Workbench In there click ldquoPerformance Monitoringrdquo Change the display to ldquoDetailed Data
Aggregatedrdquo select lsquoISrsquo as the Data Source (or lsquoPMIrsquo if you have configured the Process Monitoring
Infrastructurersquo) and ldquoXIIntegrationServerltyour_hostgtrdquo as the component Then choose an appropriate time
interval for example the last day You have to enter the details of the specific interface you want to monitor
here
The interesting value is the ldquoProcessing Time [s]rdquo in the fifth column It is the sum of the processing time of the single steps in the Integration Server For now you are not interested in the single steps that are listed on the right side since you are still trying to find out the part of the PI system where the most time is lost Chapter 44 will work with the individual steps
SAP NETWEAVER 71 AND HIGHER PERFORMANCE CHECK GUIDE
13
If you do not know which interface is affected yet you first have to get an overview Instead of navigating to
Detailed Data Aggregated in the Runtime Workbench choose Overview Aggregated Use the button Display
Options and check the options for sender component receiver component sender interface and receiver
interface Check the processing times as described above
32 Adapter Engine Processing Time
Procedure
Log on to your Integration Server and call transaction SXMB_IFR In the browser window follow the link to
the Runtime Workbench In there click Message Monitoring choose Adapter Engine lthostgt from Database
from the drop down lists and press Display Enter your interface details and ldquoStartrdquo the selection Select one
message using the radio button and press Details
Calculate the difference between the start and end timestamp indicated on the screen
Do the above calculation for the outbound (AFW IS) as well as the inbound (IS AFW) messages
The audit log of successful message is no longer persisted in SAP NetWeaver PI 71 by default in order to minimize the load on the database The audit log has a high impact on the database load since it usually consists of many rows that are inserted individually in the database In newer releases therefore a cache was implemented that keeps the audit log information for a period of time only Thus no detailed information is available any longer from a historical point of view Instead you should use Wily Introscope for historical analyses of the performance of successful messages
The audit log can be persisted on the database to allow historical analysis of performance problems
on the Java stack To do so change the parameter ldquomessagingauditLogmemoryCacherdquo from
true to false for service ldquoXPI Service Messaging Systemrdquo using NetWeaver Administrator (NWA) as described in SAP Note 1314974 Note Only do this temporarily if you have identified the bottleneck on the AFW First try using Wily to determine the root cause of the problem
SAP NETWEAVER 71 AND HIGHER PERFORMANCE CHECK GUIDE
14
Due to above mentioned limitations Wily Introscope is the right tool for performance analysis of the Adapter Engine Wily persists the most important steps like queuing module processing and average response time in historical dashboards (aggregated data per intervals for all server nodes of a system or all systems with filters possible etc)
SAP NETWEAVER 71 AND HIGHER PERFORMANCE CHECK GUIDE
15
Especially for Java-Only runtime using Integrated Configuration Wily shows the complete processing time after the initial sender adapter steps (receiver determination mapping and time in the backend call) as can be seen in the Message Processing Time dashboard below
Using the ldquoShow Minimum and Maximumrdquo functionality deviations from the average processing time can be seen In the example below a message processing step takes up to 22 seconds The reason for this could either be a slow mapping or a delay in the call to the receiver system (in the example below Java IDoc adapter is used to transfer the data to ERP)
In case of high processing times in one of your steps further analysis might be required using thread dumps or the Java Profiler as outlined in the appendix section A2 XPI inspector for troubleshooting and performance analysis
321 Adapter Engine Performance monitor in PI 731 and higher
Starting from PI 731 SP4 there is a new performance monitor available for the Adapter Engine More
information on the activation of the performance monitor can be found at Note 1636215 ndash Performance
Monitoring for the Adapter Engine Similar to the ABAP monitor in the RWB the data is displayed in an
aggregated format On the PI start page use the link ldquoConfiguration and Monitoring Homerdquo Go to ldquoAdapter
Enginerdquo and select ldquoPerformance Monitorrdquo The data is persisted on an hourly basis for the last 24 hours and
on a daily basis for the last 7 days The data is further grouped on interface level and per Java server node
With the information provided you can therefore see the minimum maximum and average response time of
an individual interface on a specific Java server node All individual steps of the message processing like
time spent in the Messaging System queues or Adapter modules are listed In the example below you can
SAP NETWEAVER 71 AND HIGHER PERFORMANCE CHECK GUIDE
16
see that most of the time (5 seconds) is spent in a module called SimpleWaitModule This would be the entry
point for the further analysis
Starting with 731 SP10 (740 SP05) this data can be exported to excel in two ways Overview or Detailed (details in SAP Note 1886761)
33 Processing Time in the Business Process Engine
Procedure
Log on to your integration server and call transaction SXMB_MONI Adjust your selection in a way that you
select one or more messages of the respective interface Once the messages are listed navigate to the
Outbound column (or Inbound if your integration process is the sender) and click on PE Alternatively you
can select the radio button for ldquoProcess Viewrdquo on the entranceselection screen of SXMB_MONI
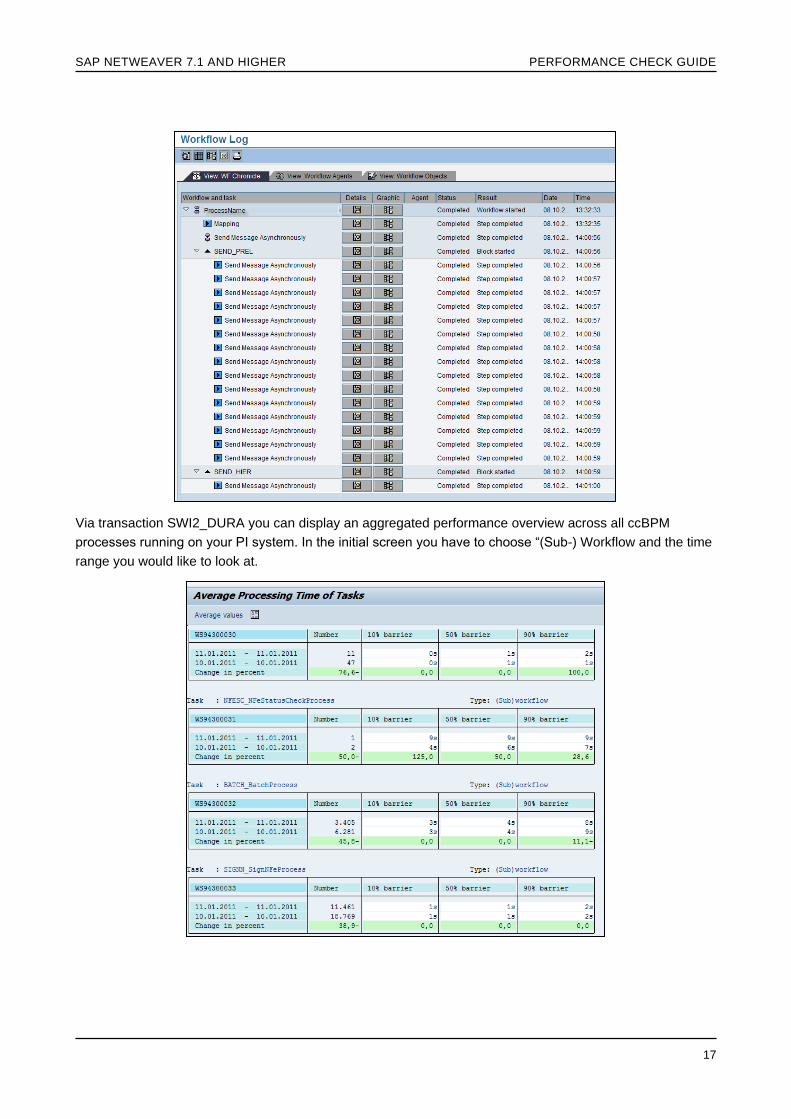
To judge the performance of an integration process it is essential to understand the steps that are executed A long-running integration process in itself is not critical because it can wait for a trigger event or can include a synchronous call to a backend Therefore it is important to understand the steps that are included before analyzing an individual workflow log For example the screenshot below shows a long waiting time after the mapping This is perhaps due to an integrated wait step
Calculate the time difference between the first and the last entry Note that this time for the workflow does not include the duration of RFC calls for example To see this processing time navigate to the ldquoList with Technical Detailsrdquo (second button from the left on the screenshot below or shift + F9) Repeat this step for several messages to get an overview about the most time consuming steps
Please Note that the processing time mentioned above does not include the waiting time of the messages in the ccBPM queues Therefore it is essential to monitor a queue backlog in ccBPM queues as discussed in section ldquoQueuing and ccBPM (or increasing Parallelism for ccBPM Processes)rdquo
SAP NETWEAVER 71 AND HIGHER PERFORMANCE CHECK GUIDE
17
Via transaction SWI2_DURA you can display an aggregated performance overview across all ccBPM
processes running on your PI system In the initial screen you have to choose ldquo(Sub-) Workflow and the time
range you would like to look at
SAP NETWEAVER 71 AND HIGHER PERFORMANCE CHECK GUIDE
18
The results here allow you to compare the average performance of a process It shows you the processing
time based on barriers The 50 barrier means that 50 of the messages were processed faster than the
value specified Furthermore you also see a comparison of the processing time to eg the day before By
adjusting the selection criteria of the transaction you can therefore get a good overview about the normal
processing time of the Integration process and can judge if there is a general performance problem or just a
temporary one
The number of process instances per integration process can be easily checked via transaction
SWI2_FREQ The data shown allows you to check the volume of the Integration Processes and allow you to
judge if your performance problem is caused by an increase of volume which could cause a higher latency in
the ccBPM queues
New in PI 73 and higher
Starting from PI 73 a new monitoring for ccBPM processes is available This monitor can be started from
transaction SXMB_MONI_BPE Integration Process Monitoring (also available in ldquoConfiguration and
Monitoring Homerdquo on PI start page) This is new browser based view that allows a simplified and aggregated
view on the PI Integration Processes
On the initial screen you get an overview about all the Integration Processes executed in the selected time
interval Therefore you can immediately see the volume of each Integration Process
From there you can navigate to the Integration process facing the performance issues and look at the
individual process instances and the start and end time Furthermore there is a direct entry point to see the
PI messages that are assigned to this process
SAP NETWEAVER 71 AND HIGHER PERFORMANCE CHECK GUIDE
19
Choosing one special process instance ID you will see the time spend in each individual processing step
within the process In the example below you can see that most of the time is spend in the Wait Step
SAP NETWEAVER 71 AND HIGHER PERFORMANCE CHECK GUIDE
20
4 ANALYZING THE INTEGRATION ENGINE
If chapter Determining the Bottleneck has shown that the bottleneck is clearly in the Integration Engine there
are several transactions that can help you to analyze the reason for this To understand why this selection of
transactions helps to analyze the problem it is important to know that the processing within the Integration
Engine is done within the pipeline The central pipeline of the Integration Server executes the following main
steps
Central Pipeline Steps Description of Central Pipeline Steps
PLSRV_XML_VALIDATION_RQ_INB XML Validation Inbound Channel Request
PLSRV_RECEIVER_DETERMINATION Receiver Determination
PLSRV_INTERFACE_DETERMINATION Interface Determination
PLSRV_RECEIVER_MESSAGE_SPLIT Branching of Messages
PLSRV_MAPPING_REQUEST Mapping
PLSRV_OUTBOUND_BINDING Technical Routing
PLSRV_XML_VALIDATION_RQ_OUT XML Validation Outbound Channel Request
PLSRV_CALL_ADAPTER Transfer to Respective Adapter IDoc HTTP Proxy AFW
PLSRV_XML_VALIDATION_RS_INBXML Validation Inbound Channel Response
PLSRV_MAPPING_RESPONSE Response Message Mapping
PLSRV_XML_VALIDATION_RS_OUT Validation Outbound Channel Response
The last three steps highlighted in bold are available in case of synchronous messages only and reflect the
time spent in the mapping of the synchronous response message
The steps indicated in red are new in SAP NetWeaver PI 71 and higher and can be used to validate the
payload of a PI message against an XML schema These steps are optional and can be executed at different
times in the PI pipeline processing for example before and after a mapping (as shown above)
With PI 731 an additional option of using an external Virus Scan during PI message processing can be
activated as described in the Online Help The Virus Scan can be configured on multiple steps in the pipeline
ndash eg after the mapping (Virus Scan Outbound Channel Request) when receiving a synchronous response
(Virus Scan Inbound Channel Response) and after the response mapping (Virus Scan Outbound Channel
Response)
It is important to know is that these pipeline steps are executed based on qRFC Logical Unit of Work (LUW)
by using dialog work processes
SAP NETWEAVER 71 AND HIGHER PERFORMANCE CHECK GUIDE
21
With 711 and higher versions you can activate the Lean Message Search (LMS) to be able to search for
payload content This is described in more detail in chapter Long Processing Times for
ldquoLMS_EXTRACTIONrdquo
41 Work Process Overview (SM50SM66)
The work process overview is the central transaction to get an overview of the current processes running in
the Integration Engine For message processing PI is only using Dialog work processes (DIA WP) Therefore
it is essential to ensure that enough DIA WPs available
The process overview is only a snapshot analysis You therefore have to refresh the data multiple times to
get a feeling for the dynamics of the processes The most important questions to be asked are as follows
How many work processes are being used on average Use the CPU Time (clock symbol) to check that not all DIA WPs are used In case all DIA WPs have a high CPU time this indicates a WP bottleneck
Which users are using these processes It depends on the usage of your PI system All asynchronous messages are processed by the QIN scheduler who will start the message processing in DIA WPs The user that is shown in SM66 will be the one that triggered the QIN scheduler This can eg be a communication user for a connected backend (usually a copy of PIAPPLUSER) or the user used to send data from the Adapter Engine (per default PIAFUSER)
Activities related to the Business Process Engine (ccBPM) will be indicated by user WF-BATCH If you see high WF-BATCH activity take a look at chapter 51
Are there any long running processes and if so what are these processes doing with regard to the reports used and the tables accessed
o As a rule of thumb for the initial configuration the number of DIA work processes should be around six times the value of CPU in your PI system (rdispwp_no_dia = 6 to 8 times CPUs cores based on SAP Note 1375656 - SAP NetWeaver PI System Parameters)
If you would like to get an overview for an extended period of time without actually refreshing the transaction
at regular intervals use report SDFMON and schedule the Daily Monitoring It allows you to collect metrics
such as CPU usage amount of free Dialog work processes and most importantly a snapshot of the work
process activity as provided in transactions SM50 and SM66 The frequency for the data collection can be as
low as 10 seconds and the data can be viewed after the configurable timeframe of the analysis Note
SDFMON is only intended for analysis of performance issues and should only be scheduled for a limited
period of time
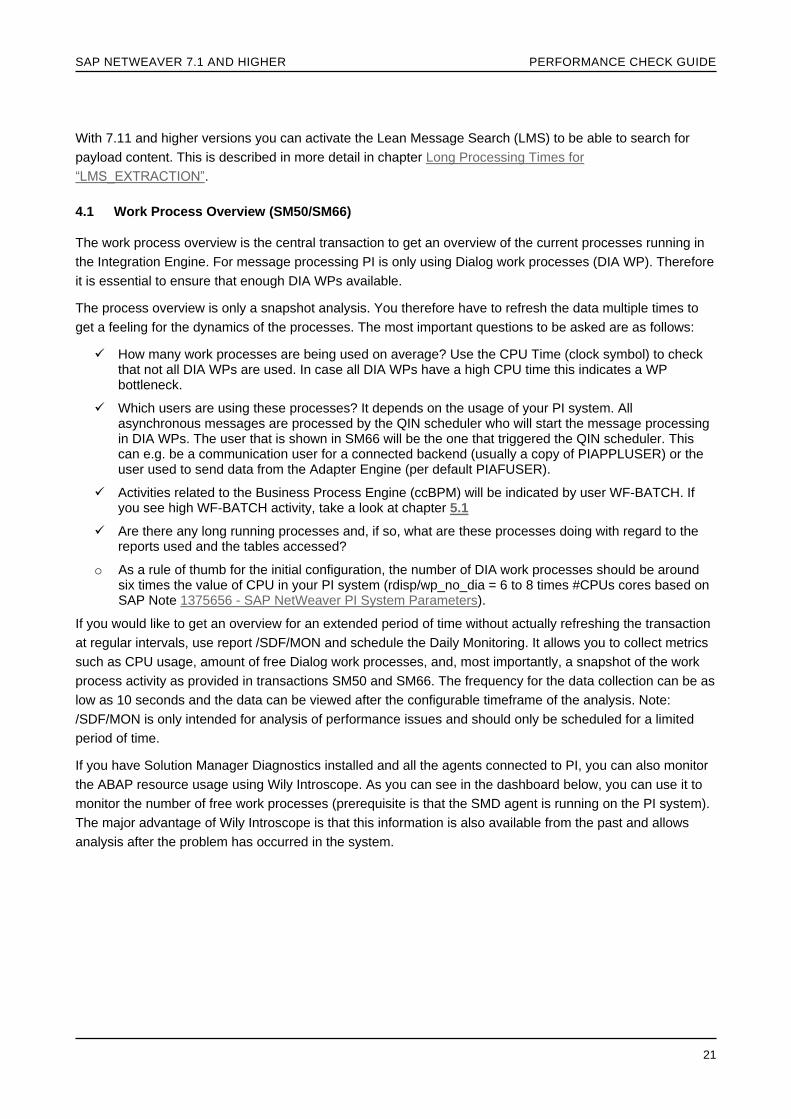
If you have Solution Manager Diagnostics installed and all the agents connected to PI you can also monitor
the ABAP resource usage using Wily Introscope As you can see in the dashboard below you can use it to
monitor the number of free work processes (prerequisite is that the SMD agent is running on the PI system)
The major advantage of Wily Introscope is that this information is also available from the past and allows
analysis after the problem has occurred in the system
SAP NETWEAVER 71 AND HIGHER PERFORMANCE CHECK GUIDE
22
42 qRFC Resources (SARFC)
Depending on the configuration of the RFC server group not all dialog work processes can be used for
qRFC processing in the Integration Server As stated earlier all (ABAP based) asynchronous messages are
processed using qRFC Therefore tuning the RFC layer is one of the most important tasks to achieve good
PI performance
In case you have a high volume of (usually runtime critical) synchronous scenarios you have to ensure that
enough DIA WPs are kept free by the asynchronous interfaces running at the same time Since this is a very
difficult tuning exercise we usually recommend implementing runtime critical synchronous interfaces using
Java only configuration (ICO) whenever possible If this is not possible you have to ensure via SARFC tuning
that enough work processes are kept free to process the synchronous messages
The current resource situation in the system can be monitored using transaction SARFC
Procedure
First check which application servers can be used for qRFC inbound processing by checking the AS Group
assigned in transaction SMQR
Call transaction SARFC and refresh several times since the values are only snapshot values
Is the value for ldquoMax Resourcesrdquo close to your overall number of dialog work processes Max Resources is a fixed value and describes how many DIA work processes may be used for RFC communication If the value is too low your RFC parameters need tuning to provide the Integration Server with enough resource for the pipeline processing The RFC parameters can be displayed by double-clicking on ldquoServer Namerdquo
o A good starting point is to set the values as follows
Max no of logons = 90
Max disp of own logons = 90
Max no of WPs used = 90
Max wait time = 5
Min no of free WP = 3-10 (depending on the size of the application server)
These values are specified in SAP Note 1375656 ndash SAP NetWeaver PI System Parameters (this parameter must be increased if you plan to have synchronous interfaces) To avoid any bottleneck and blocking situation free DIA WPs should always be available The value should be adjusted based on the overall number of DIA WPs available at the system and the above requirements
SAP NETWEAVER 71 AND HIGHER PERFORMANCE CHECK GUIDE
23
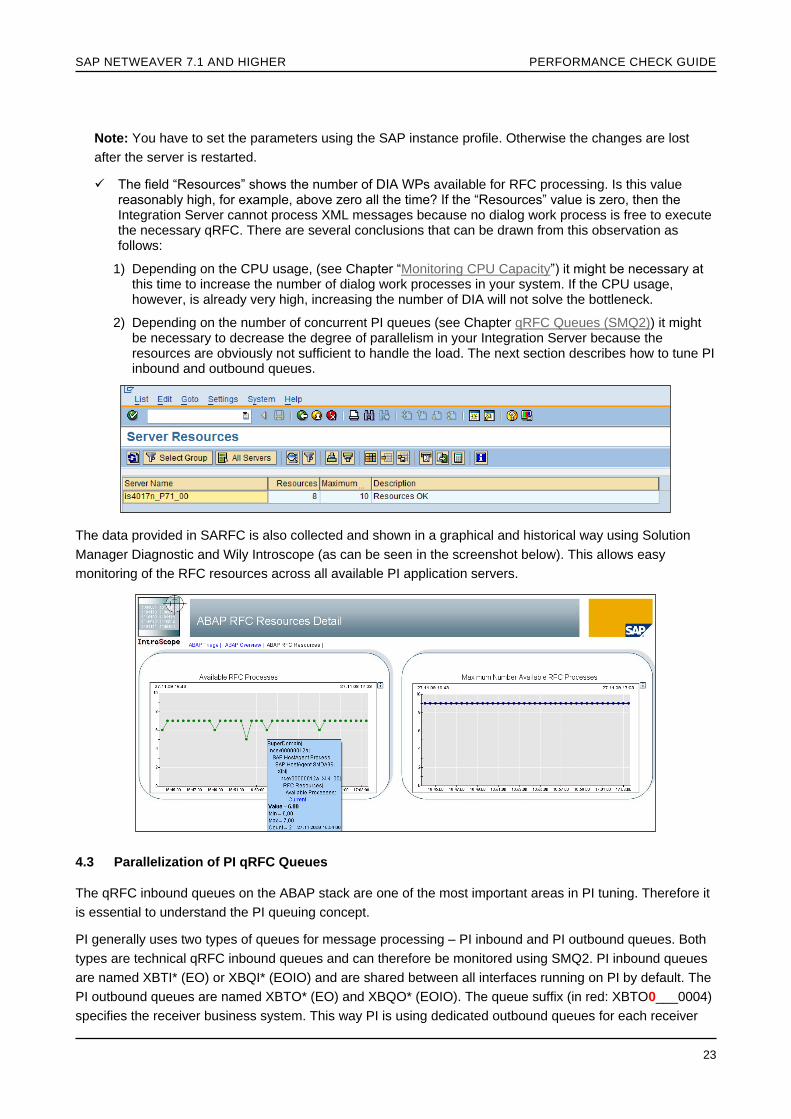
Note You have to set the parameters using the SAP instance profile Otherwise the changes are lost
after the server is restarted
The field ldquoResourcesrdquo shows the number of DIA WPs available for RFC processing Is this value reasonably high for example above zero all the time If the ldquoResourcesrdquo value is zero then the Integration Server cannot process XML messages because no dialog work process is free to execute the necessary qRFC There are several conclusions that can be drawn from this observation as follows
1) Depending on the CPU usage (see Chapter ldquoMonitoring CPU Capacityrdquo) it might be necessary at this time to increase the number of dialog work processes in your system If the CPU usage however is already very high increasing the number of DIA will not solve the bottleneck
2) Depending on the number of concurrent PI queues (see Chapter qRFC Queues (SMQ2)) it might be necessary to decrease the degree of parallelism in your Integration Server because the resources are obviously not sufficient to handle the load The next section describes how to tune PI inbound and outbound queues
The data provided in SARFC is also collected and shown in a graphical and historical way using Solution
Manager Diagnostic and Wily Introscope (as can be seen in the screenshot below) This allows easy
monitoring of the RFC resources across all available PI application servers
43 Parallelization of PI qRFC Queues
The qRFC inbound queues on the ABAP stack are one of the most important areas in PI tuning Therefore it
is essential to understand the PI queuing concept
PI generally uses two types of queues for message processing ndash PI inbound and PI outbound queues Both
types are technical qRFC inbound queues and can therefore be monitored using SMQ2 PI inbound queues
are named XBTI (EO) or XBQI (EOIO) and are shared between all interfaces running on PI by default The
PI outbound queues are named XBTO (EO) and XBQO (EOIO) The queue suffix (in red XBTO0___0004)
specifies the receiver business system This way PI is using dedicated outbound queues for each receiver
SAP NETWEAVER 71 AND HIGHER PERFORMANCE CHECK GUIDE
24
system All interfaces belonging to the same receiver business system are contained in the same outbound
queue Furthermore there are dedicated queues for prioritization of separation of large messages To get an
overview about the available queues use SXMB_ADM Manage Queues
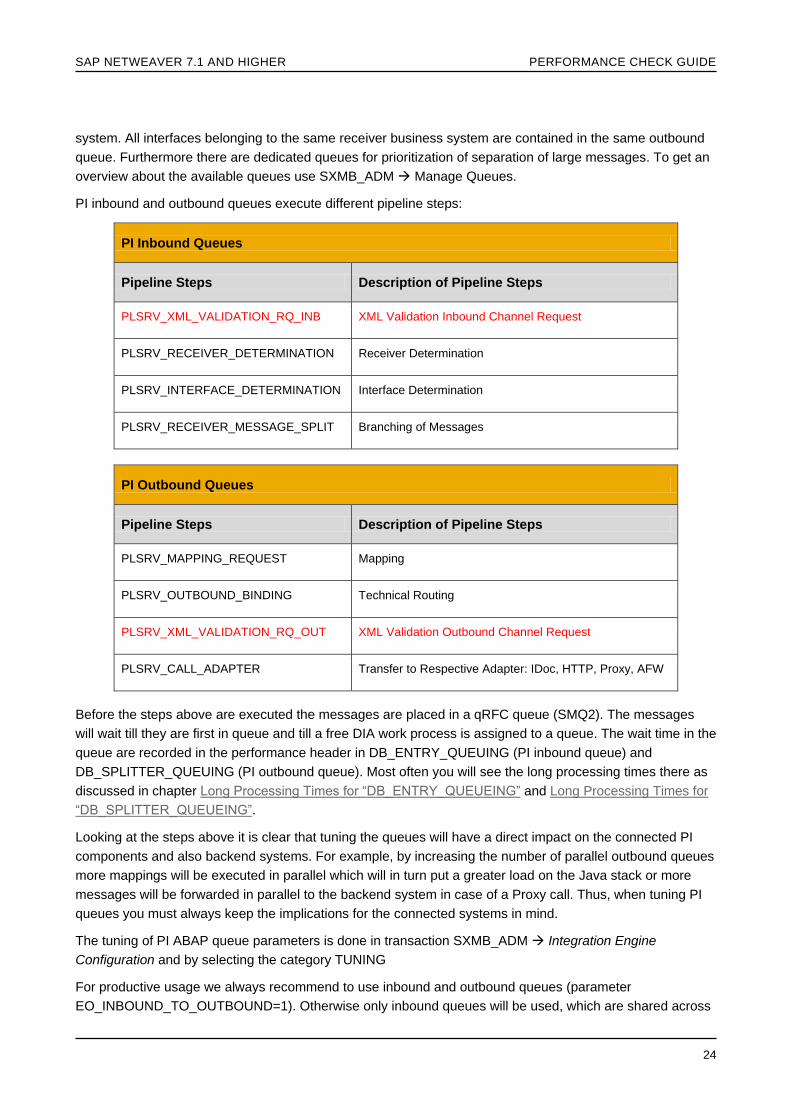
PI inbound and outbound queues execute different pipeline steps
PI Inbound Queues
Pipeline Steps Description of Pipeline Steps
PLSRV_XML_VALIDATION_RQ_INB XML Validation Inbound Channel Request
PLSRV_RECEIVER_DETERMINATION Receiver Determination
PLSRV_INTERFACE_DETERMINATION Interface Determination
PLSRV_RECEIVER_MESSAGE_SPLIT Branching of Messages
PI Outbound Queues
Pipeline Steps Description of Pipeline Steps
PLSRV_MAPPING_REQUEST Mapping
PLSRV_OUTBOUND_BINDING Technical Routing
PLSRV_XML_VALIDATION_RQ_OUT XML Validation Outbound Channel Request
PLSRV_CALL_ADAPTER Transfer to Respective Adapter IDoc HTTP Proxy AFW
Before the steps above are executed the messages are placed in a qRFC queue (SMQ2) The messages
will wait till they are first in queue and till a free DIA work process is assigned to a queue The wait time in the
queue are recorded in the performance header in DB_ENTRY_QUEUING (PI inbound queue) and
DB_SPLITTER_QUEUING (PI outbound queue) Most often you will see the long processing times there as
discussed in chapter Long Processing Times for ldquoDB_ENTRY_QUEUEINGrdquo and Long Processing Times for
ldquoDB_SPLITTER_QUEUEINGrdquo
Looking at the steps above it is clear that tuning the queues will have a direct impact on the connected PI
components and also backend systems For example by increasing the number of parallel outbound queues
more mappings will be executed in parallel which will in turn put a greater load on the Java stack or more
messages will be forwarded in parallel to the backend system in case of a Proxy call Thus when tuning PI
queues you must always keep the implications for the connected systems in mind
The tuning of PI ABAP queue parameters is done in transaction SXMB_ADM Integration Engine
Configuration and by selecting the category TUNING
For productive usage we always recommend to use inbound and outbound queues (parameter
EO_INBOUND_TO_OUTBOUND=1) Otherwise only inbound queues will be used which are shared across
SAP NETWEAVER 71 AND HIGHER PERFORMANCE CHECK GUIDE
25
all interfaces Hence a problem with one single backend system will affect all interfaces running on the
system
The principle of less is sometimes more also applies for tuning the number of parallel PI queues Increasing
the number of parallel queues will result in more parallel queues with fewer entries per queue In theory this
should result in a lower latency if enough DIA WPs are available
But practically this is not true for high volume systems The main reason for this is the overhead involved in
the reloading of queues (see details below) Furthermore important tuning measures like PI packaging (see
Chapter ldquoPI Message Packagingrdquo) aim to increase the throughput based on a higher number of messages in
the queue Thus from a throughput perspective it is definitely advisable to configure fewer queues
If you have very high runtime requirements you should prioritize these interfaces and assign a different
parallelism for high priority queues only This can be done using parameters
EO_INBOUND_PARALLEL_HIGH_PRIO and EO_OUTBOUND_PARALLEL_HIGH_PRIO as described in
section ldquoMessage Prioritization on the ABAP Stackrdquo
To tune the parallelism of inbound and outbound queues the relevant parameters are
EO_INBOUND_PARALLEL and EO_OUTBOUND_PARALLEL have to be used
Below you can see a screenshot of SMQ2 You can see the PI inbound queues and outbound queues Also
ccBPM queues (XBQO$PE) are displayed and will be discussed in section 5
Procedure
Log on to your Integration Server call transaction SMQ2 and execute If you are running ABAP proxies on a
separate client on the same system enter lsquorsquo for the client Transaction SMQ2 provides snapshots only and
must therefore be refreshed several times to get viable information
o The first value to check is the number of queues concurrently active over a period of time Since each queue needs a dialog work process to be worked on the number of concurrent queues must not be too high compared to the number of dialog work processes usable for RFC communication (see Chapter qRFC Resources (SARFC)) The optimum throughput can be achieved if the number of active queues is equal to or slightly higher than the number of dialog work processes (provided that the number of DIA work processes can be handled by the CPU of the system see transaction ST06)
In case many of the queues are EOIO queues (eg because the serialization is done on the material number) try to reduce the queues by following Chapter EOIO tuning
o The second value of importance is the number of entries per queue Hit refresh a few times to check if the numbers increasedecreaseremain the same An increase of entries for all queues or a specific
SAP NETWEAVER 71 AND HIGHER PERFORMANCE CHECK GUIDE
26
queue points to a bottleneck or a general problem on the system The conclusion that can be drawn from this is not simple Possible reasons have been found to include
1) A slow step in a specific interface
Bad processing time of a single message or a whole interface can be caused by expensive processing steps as for example the mapping step or receiver determination This can be confirmed by looking at the processing time for each step as shown in ldquoAnalyzing the runtime of pipeline stepsrdquo
2) Backlog in Queues
Check if inbound or outbound queues face a backlog A backlog in a queue is generally nothing critical since the queues ensure that the PI components as well as the backend systems are not overloaded For instance batch triggered interfaces are usually causing high backlogs that get processed over time Only in case the backlog prevents you to meet the business requirements for an interface this should be analyzed
If the backlog is caused by a high volume of messages arriving in a short period of time one solution to minimize the backlog is to increase the number of queues available for this interface (if sufficient hardware is available) If one interface is having a backlog in the outbound queues you could eg specify EO_OUTBOUND_PARALLEL with a sub parameter specifying your interface to increase the parallelism for this interface
But in general a backlog can also be caused by a long processing time in one of the pipeline steps as discussed in 1) or a performance problem with one of the connected components like PI Java stack or connected backend systems Due to the steps performed in the outbound queues (mapping or call adapter) it is more likely that a backlog will be seen in the outbound queues Inbound queue processing is only expensive if Content Based Routing or Extended Receiver Determination is used To understand which step is taking long follow once more chapter ldquoAnalyzing the runtime of pipeline stepsrdquo
In addition to tuning of the number of inbound and outbound queues also ldquoMessage Prioritization on the ABAP Stackrdquo and ldquoPI Message Packagingrdquo can help
The screenshot below shows such a backlog situation in Wily Introscope Please Note that the information about the queues is only collected by Wily in 5 minutes intervals explaining the gaps between the measurement points On the dashboard ldquoTotal qRFC Inbound Queue Entriesrdquo you can see that the number of messages in SMQ2 is increasing The number of inbound queues does not increase at the same time It also offers a dashboard for the number of entries by queue name and the time entries remain in SMQ2 With the information provided here it is also possible to distinguish a blocking situation or a general resource problem after the problem is no longer present in the system
SAP NETWEAVER 71 AND HIGHER PERFORMANCE CHECK GUIDE
27
3) Queues stay in status READY in SMQ2
To see the status of the queues use the filter button in SMQ2 as shown below
It is a normal situation to see many queues in READY status for a limited amount of time The reason for this is the way the QIN scheduler reloads LUWs (see point 2 below) A waiting time of up to 5 seconds per queuing step is considered normal during normal load situation (even if there is no backlog in the queue and enough resources are available) If you observe a situation where many queues are in READY status for longer period of time the following situations can apply
A resource bottleneck with regard to RFC resources Confirm by following section qRFC Resources (SARFC)
To avoid overloading a system with RFC load the QIN scheduler only reloads new queues after a certain amount of queues have finished processing This can lead to long waiting times in the queues as explained in SAP Note 1115861 - Behaviour of Inbound Scheduler after Resource Bottleneck Since PI is a non-user system we recommend setting rfcinb_sched_resource_threshold to 3 as described in SAP Note 1375656 ndash SAP NetWeaver PI System Parameters
Long DB loading times for RFC tables If using Oracle ensure that SAP Note 1020260 - Delivery of Oracle statistics is applied
Additional overhead during the pipeline executions occurs due to PI internal mechanisms Per default a lock is set during processing of each message This is no longer necessary and should
SAP NETWEAVER 71 AND HIGHER PERFORMANCE CHECK GUIDE
28
be switched off by setting the parameter LOCK_MESSAGE of category RUNTIME to 0 as described in SAP Note 1058915 In addition during the processing of an individual message the message repeatedly calls an enqueue which leads to a deterioration of the throughput This can be avoided by setting parameter CACHE_ENQUEUE to 0 as described in SAP Note 1366904
Sometimes a queue stays in READY status for a very long time while other queues are getting processed fine After manual unlocking the queue is processed but then stops after some time again A potential reason is described in Note 1500048 - SMQ2 inbound Queue remains in READY state In a PI environment queues in status RUNNING for more than 30 minutes usually happen due to one individual step taking long (as discussed in step 1) or a problem on the infrastructure (eg memory problems on Java or HTTP 200 lost on network) After 30 minutes the QIN scheduler removes this queue from the scheduling and therefore it remains in READY To solve such cases the root cause for the blocking has to be understood
4) Queue in READY status due to queue blacklisting
If a queue is for a very long time in status RUNNING (eg due to a problem with a mapping or due to a very slow backend) it is possible that the QIN scheduler excludes this queue from queue scheduling Hence the queue stays in status READY even though enough work processes are available The ldquoblacklistingrdquo of queues takes place when the runtime of a queue exceeds the ldquoMonitoring thresholdrdquo configured on this queue Notes 1500048 - queues stay in ready (schedule_monitor) and Note 1745298 - SMQR Inbound queue scheduler identify excluded entries provide more input on this topic The screenshot below shows a setting of 2400 seconds (40 minutes) for this parameter
Check if a queue stays in READY status for a long time while others are processing without any issue Ensure Note 1745298 is implemented and check the system log for the following exception ldquoQINEXCLUDE ltqueue namegt lttimedate at which the queue scheduler startedgt If this is the case check why the long runtime occurs (see section Analyzing the runtime of PI pipeline steps) or increase the schedule_monitor in exceptional cases only (if eg the runtime of an individual processing step cannot be improved further)
5) An error situation is blocking one or more queues
Click the Alarm Bell (Change View) push button once to see only queues with error status Errors delay the queue processing within the Integration Server and may decrease the throughput if for example multiple retries occur Navigate to the first entry of the queue and analyze the problem by forward navigation to the relevant message in SXMB_MONI
Often you see EO queues in SYSFAIL or RETRY due to the problems during the processing of an individual message This can be prevented by following the description of Chapter Prevent blocking of EO queues
SAP NETWEAVER 71 AND HIGHER PERFORMANCE CHECK GUIDE
29
44 Analyzing the runtime of PI pipeline steps
The duration of the pipeline steps is the ultimate answer to long processing times in the Integration Engine
since it describes exactly how much time was spent at which point The recommended way to retrieve the
duration of the pipeline steps is the RWB and will be described below Advanced users may use the
Performance Header of the SOAP message using transaction SXMB_MONI but the timestamps are not
easy to read If you still prefer the latter method here is the explanation 20110409092656165 must be read
as yyyymmddhh(min)(min)(sec)(sec)(microseconds) that is the timestamp corresponds to April 9 2011 at
092656 and 165 microseconds Please note that these timestamps in Performance Header of
SXI_MONITOR transaction are stored and displayed in UTC time therefore conversion to system time must
be done when analyzing them
In case PI message packaging is configured the performance header will always reflect the processing time
per package Hence a duration of 50 seconds does not mean a single message took 50 seconds but
eventually the package contained 100 messages so that every message took 05 ms More details about
this can be found in section PI Message Packaging
Procedure
Log on to your Integration Server and call transaction SXMB_IFR In the browser window follow the link to
the Runtime Workbench In there click Performance Monitoring Change the display to Detailed Data
Aggregated and choose an appropriate time interval for example the last day For this selection you have to
enter the details of the specific interface you want to monitor
You will now see in the lowerndashpart of the screen a split of the processing time into single steps Check the time difference between the steps Does any step take longer than expected In the example in the screenshot below the DB_ENTRY_QUEUEING starts after 0032 seconds and ends after 0243 seconds which means it took 0211 seconds (211ms)
SAP NETWEAVER 71 AND HIGHER PERFORMANCE CHECK GUIDE
30
Compare the processing times for the single steps for different measurements as outlined in Chapter
Pipeline Steps (SXMB_MONI or RWB) For example is a single step only long if many messages
are processed or if a single message is processed This helps you to decide if the problem is a
general design problem (single message has long processing step) or if it is related to the message
volume (only for a high number of messages this process step has large values)
Each step has different follow-up actions that are described next
441 Long Processing Times for ldquoPLSRV_RECEIVER_ DETERMINATIONrdquo PLSRV_INTERFACE_DETERMINATION
Steps that can take a long time in inbound processing are the Receiver and Interface Determination In these
steps the receiver system and interface is calculated Normally this is very fast but PI offers the possibility of
enhanced receiver determinations In these cases the calculation is based on the payload of a message
There are different implementation options
o Content-Based Routing (CBR)
CBR allows defining XPath expressions that are evaluated during runtime These expressions can be combined by logical operators for example to check the value for multiple fields The processing time of such a request directly correlates to the number and complexity of the conditions defined
No tuning options exist for the system in regard to CBR The performance of this step can only be changed by reducing the number of rules by changing the design of the interfaces Another option is to use an extended receiver determination (executing a mapping program) since this is faster than CBR using many rules
o Mapping to determine Receivers
A standard PI mapping (ABAP Java XSLT) can also be used to determine the receiver If you observe high runtimes in such a receiver determination follow the steps outlined in the next section since the same mapping runtime is used
442 Long Processing Times for ldquoPLSRV_MAPPING_REQUESTrdquo
Before analyzing the mapping you must understand which runtime is used Mappings can be implemented
in ABAP as graphical mappings in the Enterprise Service Builder as self-developed Java mappings or
XSLT mappings One interface can also be configured to use a sequence of mappings executed
sequentially In such a case analysis is more difficult because it is not clear which mapping in the sequence
is taking a long time
Normal debugging and tracing tools (transaction ST12) can be used for mappings executed in ABAP Any
type of mapping can be tested from ABAP using transaction SXI_MAPPING_TEST Knowing
senderreceiver partyserviceinterfacenamespace and source message payload it is possible to check the
target message (after mapping execution) and detailed trace output (similar to contents of trace of the
message in SXMB_MONI with TRACE_LEVEL = 3) It can also be used for debugging at runtime by using
the standard debugging functionality
For ABAP based XSLT mappings it is also possible via transaction XSLT_TOOL to test trace and debug
XSLT transformations on the ABAP stack
In general the mapping response time is heavily influenced by the complexity of the mapping and the
message size Therefore to analyze a performance problem in the mapping environment you should
compare the mapping runtime during the time of the problem with values reported several days earlier to get
a better understanding
SAP NETWEAVER 71 AND HIGHER PERFORMANCE CHECK GUIDE
31
If no AAE is used the starting point of a mapping is the Integration Engine that will send the request by RFC
destination AI_RUNTIME_JCOSERVER to the gateway There it will be picked up by a registered server
program The registered server program belongs to the J2EE Engine The request will be forwarded to the
J2EE Engine by a JCo call and then executed by the Java runtime When the mapping has been executed
the result is sent back to the ABAP pipeline There are therefore multiple places to check when trying to
determine why the mapping step took so long
Before analyzing the mapping runtime of the PI system check if only one interface is affected or if you face a
long mapping runtime for different interfaces To do so check the mapping runtime of messages being
processed at the same time in the system
The best tool for such an analysis is Wily Introscope which offers a dashboard for all mappings being
executed at a given time Each line in the dashboard represents one mapping and shows the average
response time and the number of invocations
In the screenshot below you can see that many different mapping steps have required around 500 seconds
for processing Comparing the data during the incident with the data from the day before will allow you to
judge if this might be a problem of the underlying J2EE engine as described in section J2EE Engine
Bottleneck
If there is only one mapping that faces performance problems there would be just one line sticking out in the
Wily graphs If you face a general problem that affects different interfaces you can choose a longer
timeframe that allows you to compare the processing times in a different time period and verify if it is only a
ldquotemporaryrdquo issue ndash this would for example indicate an overload of the mapping runtime
If you have found out that only one interface is affected then it is very unlikely to be a system problem but
rather a problem in the implementation of the mapping of that specific interface
SAP NETWEAVER 71 AND HIGHER PERFORMANCE CHECK GUIDE
32
Check the message size of the mapping in the runtime header using SXMB_MONI Verify if the message size is larger than usual (which would explain the longer runtime)
There can also be one or many lookups to a remote system (using RFC or JDBC) causing the long processing time of a mapping Together with the application you then have to check if the connection to the backend is working properly Such a mapping with lookups can be analyzed using Wily Transaction Trace as explained in the appendix section Wily Transaction Trace
If not one but several interfaces are affected a potential system bottleneck occurs and this is described in
the following
o Not enough resources (registered server programs) available That could either be the case if too many mapping requests are issued at the same time or if one J2EE server node is down and has not registered any server programs
To check if there were too many mapping requests for the available registered server programs compare the number of outbound queues that are concurrently active with the number of registered server programs The number of outbound queues that are concurrently active can be monitored with transaction SMQ2 and counting queues with the names XBTO amp XBQOXB2O XBTA and XBQAXB2A (high priority) XBTZ and XBQZXB2Z (low priority) and XBTM (large messages) In addition to this you have to take into account mapping steps that are executed by synchronous messages or in a ccBPM process Mappings executed by a ccBPM process are not queued but the ccBPM process calls the mapping program directly using tRFC The number of registered server programs can be determined with transaction SMGW Goto Logged On Clients and filtering by the program (ldquoTP Namerdquo) AI_RUNTIME_ltSIDgt In general we recommend configuring 20 parallel mapping connections per server node
If the problem occurred in the past it is more difficult to determine the number of queues that are concurrently active One way is to use transaction SXMB_MONI and specify every possible outbound queue (field ldquoQueue IDrdquo) in the advanced selection criteria (Note wildcard search not available) The timeframe can be restricted in the upper-part of the advanced selection criteria Advanced users could use transaction SE16 to search directly in table SXMSPMAST using the field ldquoQUEUEINTrdquo
The other option is to use the Wily ldquoqRFC Inbound Queue Detailrdquo dashboard as described in qRFC Queue Monitoring (SMQ2)
To check if the J2EE is not available or if the server program is not registered for a different reason use transaction SM59 to test the RFC destination AI_RUNTIME_JCOSERVER If the problem occurred in the past search the gateway trace (transaction SMGW GoTo Trace Gateway Display File) and the RFC developer traces dev_rfc files available in the work directory for the string ldquoAI_RUNTIMErdquo In addition check the std_serverltngtout in the work directory for restarts of the J2EE Engine
SAP NETWEAVER 71 AND HIGHER PERFORMANCE CHECK GUIDE
33
o Depending on the checks above there are two options to resolve the bottleneck Of course if the J2EE was not available the reason for this has to be found and prevented in the future
The two options for tuning are
1) the number of outbound queues that are concurrently active and
2) the number of mapping connections from the J2EE server to the ABAP gateway
The increase of mapping connections is only recommended for strong J2EE servers since each mapping thread needs resources like CPU and Heap memory Too many mapping connections mean too many mappings being executed on the J2EE Engine In turn this might reduce the performance of other parts of the PI system for example the pipeline processing in the Integration Engine or the processing within the adapters of the AFW or can even cause out-of-memory errors on the J2EE engine Add additional J2EE server nodes to balance the parallel requests Each J2EE server node will
register new destinations at the gateway and will therefore take a part of the mapping load
Another option is to reduce the number of outbound queues that are concurrently active to solve the bottleneck This will certainly result in higher backlogs in the queue and is therefore only applicable for less runtime critical interfaces This option can be used if the backlog is caused by a master data interface with high volume but no critical processing time requirements In such a case you can only lower the number of parallel queues for this interface by using a sub-parameter of EO_OUTBOUND_PARALLEL in transaction SXMB_ADM By doing so you slow down one interface to ensure other (more critical) interfaces have sufficient resources available
o If multiple application servers configured on the PI system ensure that all the server nodes are connected to their local gateway (local bundle option) as described in the guide How To Scale PI
443 Long Processing Times for ldquoPLSRV_CALL_ADAPTERrdquo
Call adapter is the last step executed in the PI pipeline and forwards the message to the next component
along the message flow In most cases (local Adapter Engine IDoc or BPE) this is a local call The IDoc
adapter only puts the message on the tRFC layer (SM58) of the PI system so that the actual transfer of the
IDoc is not included in the performance header For ABAP Proxies plain HTTP or calls to a central or
decentral Adapter Engine an HTTP call is made so that network time can have an influence here
Looking at the processing time we have to distinguish asynchronous (EO and EOIO) and synchronous (BE)
interfaces
In asynchronous interfaces the call adapter step includes the transfer of the message by the network and
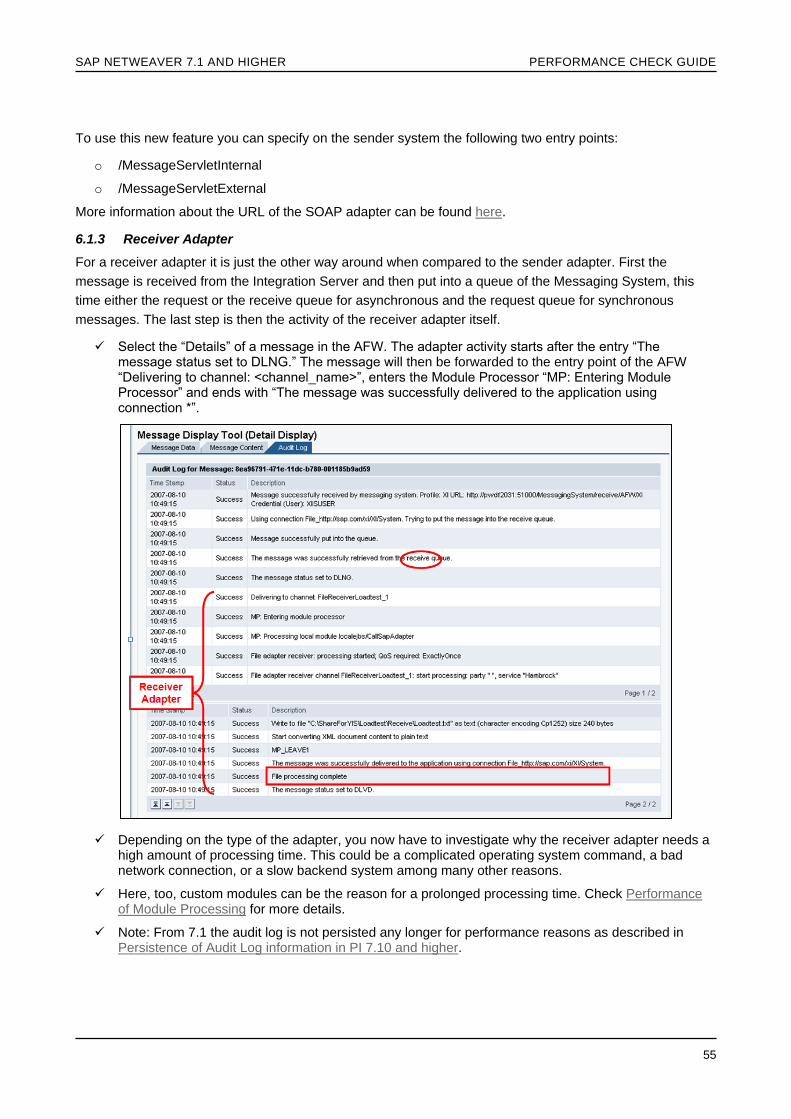
the initial steps on the receiver side (in most cases this just means persisting the message on the receiverrsquos
database) A long duration can therefore have two reasons
o Network latency For large messages of several MB in particular the network latency is an important factor (especially if the receiving ABAP proxy system is located on another continent for example) Network latency has to be checked in case of a long call adapter step In case HTTP load balancers are used they are considered as part of the network
o Insufficient resources on receiver side Enough resources must be available at the receiver side to ensure quick processing of a message For instance enough ICM threads and dialog work processes must be available in the case of an ABAP proxy system Therefore the analysis of long call adapter steps always has to include the relevant backend system
For synchronous messages (requestresponse behavior) the call adapter step also includes the processing
time on the backend to generate the response message Therefore the call adapter for synchronous
messages includes the time of the transfer of the request message the calculation of the corresponding
response message at the receiver side and the transfer back to PI Therefore the processing time to
process a request at the receiving target system for synchronous messages must always be analyzed to find
the most costly processing steps
SAP NETWEAVER 71 AND HIGHER PERFORMANCE CHECK GUIDE
34
444 Long Processing Times for ldquoDB_ENTRY_QUEUEINGrdquo
The value for DB_ENTRY_QUEUEING describes the time that a message has spent waiting in a PI inbound
queue before processing started In case of errors the time also includes the wait time for restart of the LUW
in the queue The inbound queues (XBTI XBT1 XBT9 XBTL for EO messages and XBQIXB2I
XBQ1XB21 XBQ9XB29 for EOIO messages) process the pipeline steps for the Receiver
Determination the Interface Determination and the Message Split (and optionally XML inbound validation)
Thus if the step DB_ENTRY_QUEUEING has a high value the inbound queues have to be monitored using
transactions SMQ2 and SARFC The reasons are similar as those outlined in chapter qRFC Resources
(SARFC) and qRFC Queues (SMQ2)
o Not enough resources (DIA work processes for RFC communication) available
o A backlog in the queues caused by one of the following reasons
The number of parallel inbound queues is too low to handle the incoming messages in parallel Note that a simple increase of the parameter EO_INBOUND_PARALLEL might not always be the solution (as enough work processes also have to be available to process the queues in parallel) The number of work processes is in turn restricted by the number of CPUs that are available for your system If you would like to separate critical from non-critical sender systems define a dedicated set of inbound queues by specifying a sender ID as a sub parameter of EO_INBOUND_PARALLEL For example by doing so you can separate master data interfaces from business critical interfaces Please note that the separation on inbound queues only works on Business System level and not on interface level
The inbound queues were blocked by the first LUW Use transaction SMQ2 to check if that is still the case To identify if such a situation occurred in the past use the Wily Introscope dashboard ldquoABAP System qRFC Inbound Detailldquo It is generally not easy to find the one message that is blocking the queue It might be achieved by checking RFC traces or by searching for a single message with a long pipeline processing step For EO queues there is no business reason to block the queues in case of a single message error To prevent this follow the description in section Prevent blocking of EO queues
In case you have a different runtime of the messages in the queues (eg due to complex extended Receiver Determinations) the number of messages per queue might be uneven distributed between the queues In PI 73 a new balancing option is available as discussed in Avoid uneven backlogs with queue balancing
Problems when loading the LUW by the QIN scheduler as described in qRFC Queues (SMQ2)
Note If your system uses the parameter EO_INBOUND_TO_OUTBOUND = 0 you must also read chapter
445 for analyzing the reasons EO_INBOUND_TO_OUTBOUND only determines whether inbound queues
(value lsquo0rsquo) or inbound and outbound queues (value lsquo1rsquo) are used for the pipeline processing in the integration
server Check the value with transaction SXMB_ADM Integration Engine Configuration Specific
Configuration The default value is lsquo1rsquo meaning the usage of inbound and outbound queues (the
recommended behavior)
445 Long Processing Times for ldquoDB_SPLITTER_QUEUEINGrdquo
The value for DB_SPLITTER_QUEUEING describes the time that a message has spent waiting in a PI
outbound queue until a work process was assigned In case of errors the time also includes the wait time for
the restart of the LUW in the queue
The outbound queues (XBTO XBTA XBTZ XBTM for EO messages and XBQOXB2O
XBQAXB2A XBQZXB2Z for EOIO messages) process the pipeline steps for the mapping outbound
binding and call adapter
SAP NETWEAVER 71 AND HIGHER PERFORMANCE CHECK GUIDE
35
Thus if the step DB_SPLITTER_QUEUEING has a high value the outbound queues have to be monitored
using transactions SMQ2 and SARFC The reasons are similar as outlined in chapters qRFC Resources
(SARFC) and qRFC Queues (SMQ2) or described in the section above for PI inbound queues
o Not enough resources (DIA work processes for RFC communication) available
o A backlog in the queues caused by one of the following reasons
The number of parallel outbound queues is too low to handle the outgoing messages in parallel Note that simply increasing the parameter EO_OUTBOUND_ PARALLEL might not always be the solution as enough work processes have to be available to process the queues in parallel The number of work processes in turn is limited by the number of CPUs available for the system Also the parameter EO_OUTBOUND_PARALLEL is used differently than the parameter EO_INBOUND_ PARALLEL because it determines the degree of parallelism for each receiver system Thus it is possible to increase the number of parallel outbound queues for specific receivers whereas other receivers are handled with a lower degree of parallelism Note that not every receiver backend is able to handle a high degree of parallelism so that in case of an ABAP Proxy system it might not indicate a problem on PI in case you observe a high value for DB_SPLITTER_QUEUING
The outbound queues were blocked by the first LUW To identify if such a situation occurred in the past use the Wily Introscope dashboard ldquoABAP System qRFC Inbound Detailldquo In general it is not easy to find the one message that is blocking the queue It might be achieved by checking RFC traces or by searching for a single message with a long pipeline processing step For EO queues there is no business reason to block the queues in case of a single message error To prevent this follow the description in section Prevent blocking of EO queues
Since the outbound queues include a processing step that is bound to take longer than the other steps (that is the mapping and the call adapter step) this might mean a long waiting time for all subsequent messages As an example assume that a mapping takes 1 second and that 100 messages are waiting in a queue The first message gets executed at once the second message has to wait about 1 second (a bit more since more steps are executed than just the mapping but this should be ignored at the moment) the third takes 3 seconds and so on The 100
th message
has to wait 100 seconds until it is processed that is the value for DB_SPLITTER_QUEUING is as high as 100 For a given outbound queue you would therefore see an increase for the DB_SPLITTER_QUEUING value over time If you experience this situation proceed with Chapter 442
In case you have a different runtime of the messages in the queues (eg due to different message size) the number of messages per queue might be uneven distributed between the queues In PI 73 a new balancing option is available as discussed in Avoid uneven backlogs with queue balancing
o Problems when loading the LUW by the QIN scheduler as described in qRFC Queues (SMQ2)
Note The number of parallel outbound queues is also connected with the ability of the receiving system to
process a specific amount of messages for each time unit
In section Adapter Parallelism default restrictions of the specific adapters of the J2EE Engine are explained Some adapters (JDBC File Mail) can process only one message for each server node at a time (this can be changed) It does not make sense for such adapters to have too many parallel qRFC queues since this will only move the message backlog from ABAP to Java
For messages that are directed to the IDoc outbound adapter the value for EO_OUTBOUND_PARALLEL is connected to the MAXCONN value of the corresponding outbound destination You can define the maximum number of connections using transaction SMQS ndash the default value is 10 parallel connections If applicable SAP highly recommends that you use IDoc packaging in the outbound IDoc adapter to reduce the load during the transmission of tRFC calls from the PI system to the receiving system
For ABAP proxy systems the number of outbound queues directly determines the number of messages sent in parallel to the receiving system Thus you have to ensure that the resources
SAP NETWEAVER 71 AND HIGHER PERFORMANCE CHECK GUIDE
36
available on PI are aligned with those on the sendingreceiving ABAP proxy system
446 Long Processing Times for ldquoLMS_EXTRACTIONrdquo
Lean Message Search can be configured for newer PI releases as described in the Online Help After
applying Note 1761133 - PI runtime Enhancement of performance measurement an additional header for
LMS will be written to the performance header
The header could look like this indicating that around 25 seconds were spent in the LMS analysis
When using trace level two additional timestamps are written to provide details about this overall runtime
LMS_EXTRACTION_GET_VALUES
This timestamp describes the evaluation of the message according to user-defined filter criteria
LMS_EXTRACTION_ADJUST_VALUES
This timestamp describes the post-processing of the previously found values in the BAdI (as of PI 730)
The runtime of the LMS heavily depends on the number of payload attributes to be extracted Also the
payload size and the complexity of the XPath expression has a direct impact on the performance of the LMS
In general the number of elements to be indexed should be kept at a minimum and very deep and complex
XPath expressions should be avoided
If you want to minimize the impact of LMS on the PI message processing time you can define the extraction
method to use an external job In that case the messages will be indexed after processing only and it will
therefore have no performance impact during runtime Of course this method imposes a delay in the
indexing (based on the frequency of job SXMS_EXTRACT_MESSAGES) so that newly processed
messages cannot be searched using LMS If this delay is acceptable for the monitoring responsible the
messages should be indexed using an external job
447 Other step performed in the ABAP pipeline
As discussed earlier there are additional steps in the ABAP pipeline that can be executed based on the
configuration of your scenario Per default these steps will not be activated and should therefore not
consume any time All these steps are traced in the performance header of the message Below you can see
the details for
- XML validation
SAP NETWEAVER 71 AND HIGHER PERFORMANCE CHECK GUIDE
37
- Virus Scan
In case one of these steps is taking long you have to check the configuration of your scenario In the
example of the Virus scan the problem might be related to the external virus scanner used and tuning has to
happen on that side
45 PI Message Packaging for Integration Engine
PI message packaging was introduced with SAP NetWeaver PI 70 SP13 and is per default activated in PI
71 and higher Message packaging in BPE is independent of message packaging in PI (see chapter 56)
but they can be used together
To improve performance and message throughput asynchronous messages can be assembled to packages
and processed as one entity For this the qRFC scheduler was enabled to process a set of messages (a
package) in one LUW Thus instead of sending one message to the different pipeline steps (for example
mappingrouting) a package of messages will be sent that will reduce the number of context switches that is
required Furthermore access to databases is more efficient since requests can be bundled in one database
operation Depending on the number and size of messages in the queue this procedure improves
performance considerably In return message packaging can increase the runtime for individual messages
(latency) due to the delay in the packaging process
Message packaging is only applicable for asynchronous scenarios (QoS EO and EOIO) Due to the potential
latency of individual messages packaging is not suitable for interfaces with very high runtime requirements
In general packaging has the highest benefit for interfaces with high volume and small message size
The performance improvement achieved directly relates to the number of the messages bundled in each
package Message packaging must not solely be used in the PI system Tests have shown that the
performance improvement significantly increases if message packaging is configured end-to-end - that is
from the sending system using PI to the receiving system Message packaging is mainly applicable for
application systems connected to PI by ABAP proxy
From the runtime perspective no major changes are introduced when activating packaging Messages
remain individual entities in regards to persistence and monitoring Additional transactions are introduced
allowing the monitoring of the packaging process
Messages are also treated individually for error handling If an error occurs in a message processed in a
package then the package will be disassembled and all messages will be processed as single messages Of
course in a case where many errors occur (for example due to interface design) this will reduce the benefits
of message packaging SAP systems connected to PI via ABAP Proxy can also make use of the message
packaging to reduce the HTTP calls necessary to transmit messages between the systems Other sending
and receiving applications in particular will not see any changes because they send and receive individual
messages and receive individual commits
The PI message packaging can be adapted to meet your specific needs In general the packaging is
determined by three parameters
SAP NETWEAVER 71 AND HIGHER PERFORMANCE CHECK GUIDE
38
1) Message count Maximum number of messages in a package (default 100)
2) Maximum package size Sum of all messages in kilobytes (default 1 MB)
3) Delay time Time to wait before the queue is processed if the number of messages does not reach
the message count (default 0 meaning no waiting time)
These values can be adjusted using transactions SXMS_BCONF and SXMS_BCM To better use the
performance improvements offered by packaging you could for example define a specific packaging for
interfaces with very small messages to allow up to 1000 messages for each package Another option could
be to increase the waiting time (only if latency is not critical) to create bigger packages
See SAP Note 1037176 - XI Runtime Message Packaging for more details about the necessary
prerequisites and configuration of message packaging More information is also available at
httphelpsapcom SAP NetWeaver SAP NetWeaver PIMobileIdM 71 SAP NetWeaver Process
Integration 71 Including Enhancement Package 1 SAP NetWeaver Process Integration Library
Function-Oriented View Process Integration Integration Engine Message Packaging
46 Prevent blocking of EO queues
In general messages for interfaces using Quality of Service Exactly Once are independent of each other In
case of an error in one message there is no business reason to stop the processing of other messages But
exactly this happens in case an EO queue goes into error due to an error in the processing of a single
message The queue will then be automatically retried in configurable intervals This retry will cause a delay
of all other messages in the queue which cannot be processed due to the error of the first message in the
queue
To avoid this a new error handling was introduced in SAP Notes 1298448 - XI runtime No automatic retry
for EO message processing (set EO_RETRY_AUTOMATIC = 0 and schedule restart job
RSXMB_RESTART_MESSAGES) and SAP Note 1393039 - XI runtime Dump stops XI queue After
applying this Note EO queues will not go in SYSFAIL status any longer These Notes are recommended for
all PI systems and are per default activated on PI 73 systems By specifying a receiver ID as sub parameter
this behavior can be configured for individual interfaces only
In PI 73 you can also configure the number of messages that would go into error before the whole queue
would be stopped For permanent errors (eg due to a problem with the receiving backend) the queue would
go into SYSFAIL so that not too many messages are going into error This also reduces the number of alerts
for Message Based Alerting To define the threshold the parameter EO_RETRY_AUT_COUNT can be set
The default value is 0 and indicates that the number of messages is not restricted
47 Avoid uneven backlogs with queue balancing
From PI 73 on a new mechanism is available to address the distribution of messages in queues Per default
in all PI versions the messages are getting assigned to the different queues randomly In case of different
runtimes of LUWs caused by eg different message sizes or different runtimes in mappings this can cause
an uneven distribution of messages within the different queues This can increase the latency of the
messages waiting at the end of that queue
To avoid such an unequal distribution the system checks the queue length before putting a new message in
the queue Hence it tries to achieve an equal balancing during inbound processing A queue which has a
higher backlog will get less new messages assigned Queues with fewer entries will get more messages
assigned Therefore it is different than the old BALANCING parameter of category TUNING) which was used
SAP NETWEAVER 71 AND HIGHER PERFORMANCE CHECK GUIDE
39
to rebalance messages already assigned to a queue The assignment of messages to queues is shown in
the diagram below
To activate the new queue balancing you have to set the parameters EO_QUEUE_BALANCING_READ and
EO_QUEUE_BALANCING_SELECT of category TUNING in SXMB_ADM If the value of the parameter
EO_QUEUE_BALANCING_READ is 0 (default value) then the messages are distributed randomly across
the queues that are available If however EO_QUEUE_BALANCING_READ is set to a value n greater than
zero then on average the current fill level of the queue is determined after every nth message and stored in
the shared memory of the application server This data is used as the basis for determining the queue (see
description of parameter EO_QUEUE_BALANCING_SELECT) relevant for balancing
The parameter EO_QUEUE_BALANCING_SELECT specifies the relative fill levels of the queues in percent
Relative here means in relation to the maximum filled queue If there are queues with a lower fill level than
defined here then only these are taken into consideration for distribution If all queues have a higher fill level
then all queues are taken into consideration
Please note that determining the fill level takes place using database access and therefore impacts system
performance The value of EO_QUEUE_BALANCING_READ should for this reason be oriented towards the
message throughput and specific requirements or even distribution For higher volume system a higher value
should be chosen
Letrsquos look at an example In case you set the parameter EO_QUEUE_BALANCING_READ to 1000 after
every 1000th incoming message the queue distribution will be checked This requires a database access
and can therefore cause a performance impact The fill level for each queue will then be written to shared
memory In our example we configured EO_QUEUE_BALANCING_SELECT to 20 At a given point in time
you have three outbound queues on the system XBTO__A contains 500 entries XBTO__B 150 and
XBTO__C contains 50 messages Therefore XBTO__B has a fill level of 30 and XBTO__C of 10 That
means the only queue relevant for balancing is XBTO__C which will get more messages assigned
Based on this example you can see that it is important to find the correct values As a general guideline to
minimize performance impact you should set EO_QUEUE_BALANCING_READ to a rather large value The
correct value of EO_QUEUE_BALANCING_SELECT depends on the criticality of a delay caused by a
backlog
SAP NETWEAVER 71 AND HIGHER PERFORMANCE CHECK GUIDE
40
48 Reduce the number of parallel EOIO queues
As discussed in Chapter Parallelization of PI qRFC Queues it is important to keep the number of queues
limited As a rule of thumb the number of active queues should be equal to the number of available work
processes in the system It is especially crucial to not have a lot of queues containing only one message
since this will cause a high overhead on the QIN scheduler due to very frequent reloading of the queues
Especially for EOIO queues we often see a high number of parallel queues containing only one message
The reason for this is for example that the serialization has to be done on document number to eg ensure
that updates to the same material are not transferred out of sequence Typically during a batch triggered
load of master data this can result in hundreds of EOIO queues in SMQ2 just containing only one or two
messages This is very bad from a performance point of view and will cause significant performance
degradation for all other interfaces running at the same time To overcome this situation the overall number
of EOIO queues (for all interfaces) can be limited as of PI 71 as described in Change Number of EOIO
Queues
The maximum number of queues can be set in SXMB_ADM Configure Filter for Queue Prioritization
Number of EOIO queues
During runtime a new set of queues will be used with the name XB2 as can be seen below for the outbound
queues
These queues will be shared between all EOIO interfaces for the given interface priority and by setting the
number of queues the parallelization for all EOIO interfaces is limited Thus more messages will be using the
same EOIO queue and therefore PI message packaging will work better and also the reloading of the
queues by the QIN scheduler will show much better performance
In case of errors the messages will be removed from the XB2 queues and will be moved to the standard
XBQ queues All other messages for the same serialization context will be moved to the XBQ queue
directly to ensure the serialization is maintained This means that in case of an error the shared EOIO
queues will not be blocked and messages for other serialization contexts will be not delayed
SAP NETWEAVER 71 AND HIGHER PERFORMANCE CHECK GUIDE
41
49 Tuning the ABAP IDoc Adapter
Very often the IDoc adapter deals with very high message volume and tuning of this is very essential
491 ABAP basis tuning
As stated above the IDoc adapter uses the tRFC layer to transfer messages from PI to the receiver system
The IDoc adapter will only put the message in SM58 and from there the standard tRFC layer forwards the
LUW You therefore have to ensure that sufficient resources (mainly DIA WPs) are available for processing
tRFC requests
Wily Introscope also offers a dashboard (shown below) for the tRFC layer which shows the tRFC entries and
their different statuses With these dashboards you are also able to identify history backlogs on tRFC
In order to control the resources used when sending the IDocs from sender system to PI or from PI to the
receiver backend you can also think about registering the RFC destinations in SMQS in PI as known from
standard ALE tuning By changing the Max Conn or the Max Runtime values in SMQS you can limit or
increase the number of DIA WPs used by the tRFC layer to send the IDocs for a given destination This will
mitigate the risk of system overload on sender and receiver side
SAP NETWEAVER 71 AND HIGHER PERFORMANCE CHECK GUIDE
42
492 Packaging on sender and receiver side
One option for improving the performance of messages processed with the IDoc adapter is to use IDoc
packaging
The receiver IDoc adapter in PI (for sending messages from PI to the receiving application system) already
had the option for packaging IDocs in previous releases For this messages processed in the IDoc adapter
are bundled together before being sent out to the receiving system Thus only one tRFC call is required to
send multiple IDocs The message packaging that is being discussed in section PI Message Packaging uses
a similar approach and therefore replaces the ldquooldrdquo packaging of IDocs in the receiver IDoc adapter
Therefore we highly recommend configuring Message Packaging since this helps transferring data for the
IDoc adapter as well as the ABAP Proxy
For the sender IDoc adapter there was previously the option to activate packaging in the partner profile of
the sending system in case IDocs are not send immediately but in batch By specifying the ldquoMaximum
Number of IDocsrdquo in the report RSEOUT00 multiple IDocs are bundled in one tRFC calls At the PI side
these packages will be disassembled by the IDoc adapter and the messages will be processed individually
Therefore this will help mainly to reduce the tRFC resources involved in transferring the data between the
systems but not within PI
This behavior was changed with SAP NetWeaver PI 711 and higher If the sender backend sends an IDoc
package to PI a new option has been introduced which allows the processing of IDocs as a package on PI
as well You can specify an IDoc package size on the sender IDoc Communication Channel The necessary
configuration is described in detail in the following SDN blog - IDoc Package Processing Using Sender IDoc
Adapter in PI EhP1 A significant increase in throughput was recorded for high volume interfaces with small
IDocs
493 Configuration of IDoc posting on receiver side
As described in SAP Note 1828282 - IDoc adapter long runtime XI -gt IDoc-gt ALE also the way the IDocs
are posted on the receiver ERP backend will directly influence the processing of the LUW on the PI side In
general two options exist for IDoc posting
Trigger immediately The IDoc will be posted directly when it is received For this a free dialog workprocess will be required
Trigger by background program If this option is chosen the IDoc is persisted on the ERP side and the posting of the application data will happen asynchronously using report RBDAPP01 via a background job
SAP NETWEAVER 71 AND HIGHER PERFORMANCE CHECK GUIDE
43
When ldquotrigger immediatelyrdquo is configured the sender system (PI) has to wait till the IDoc is posted While the
workprocess will roll out you will see the LUW in ldquoTransaction Executingrdquo during this time For the
IDOC_AAE the RFC connection and the java threads will be kept busy until the IDOC is posted in the
backend therefore leading to backlogs on the IDOC_AAE
The coding for posting the application data can be very complex and therefore this operation can take a long
time consuming unnecessary resources also on the sender side With background processing of the IDocs
the sender and receiver systems are decoupled from each other
Due to this we generally recommend to use ldquotrigger immediatelyrdquo in exceptional cases where the data has to
be posted without any delay In all other cases like high volume replication of master data background
processing of IDocs should be chosen
With Note 1793313 and 1855518 a third option for posting IDocs on the ERP side was introduced This
option is using bgRFC on the ERP side to queue the IDocs As soon as the configured resources for the
bgRFC destination are available the IDocs will be posted By doing so the IDocs will be posted based on
resource availability on the receiver system and no additional background jobs will be required Furthermore
storing the LUWs in bgRFC will ensure that the sender and receiver systems are decoupled This option
therefore guarantees that the IDocs will be posted as soon as possible based on the available resources on
the receiver system without the requirement to schedule many background jobs This new option is therefore
the recommended way of IDoc posting in systems that fulfill the necessary requirements
SAP NETWEAVER 71 AND HIGHER PERFORMANCE CHECK GUIDE
44
410 Message Prioritization on the ABAP Stack
A performance problem is often caused by an overload of the system for example due to a high volume
master interface If business critical interfaces with a maximum response time are running at the same time
then they might face delays due to a lack of resources Furthermore as described in qRFC Queues (SMQ2)
messages of different interfaces use the same inbound queue by default which means that critical and less-
critical messages are mixed up in the same queue
We highly recommend using message prioritization on the ABAP stack to prevent such delays for critical
interfaces (for Java see Interface Prioritization in the Messaging System )
For more information about PI prioritization see httphelpsapcom and navigate to SAP NetWeaver SAP
NetWeaver PIMobileIdM 71 SAP NetWeaver Process Integration 71 Including Enhancement Package 1
SAP NetWeaver Process Integration Library Function-Oriented View Process Integration
Integration Engine Prioritized Message Processing
To balance the available resources further between the configured interfaces you can also configure a
different parallelization level for queues with different priorities Details for this can be found in SAP Note
1333028 ndash Different Parallelization for HP Queues
SAP NETWEAVER 71 AND HIGHER PERFORMANCE CHECK GUIDE
45
5 ANALYZING THE BUSINESS PROCESS ENGINE (BPE)
This chapter helps to analyze performance problems if Chapter Determining the Bottleneck has shown that
the BPE is the slowest step for a message during its time in the PI system Of course this type of runtime
engine is very susceptible to inefficient design of the implemented integration process Information about
best practices for designing BPE processes can be found in the documentation Making Correct Use of
Integration Processes In general the memory and resource consumption is higher than for a simple pipeline
processing in the Integration Engine As outlined in the document linked above every message that is sent
to BPE and every message that is sent from BPE is duplicated In addition work items are created for the
integration process itself as well as for every step More database space is therefore required than
previously expected and more CPU time is needed for the additional steps
51 Work Process Overview
The Business Process Engine executes the steps (work items) of an integration process using tRFC calls to
the RFC destination WORKFLOW_LOCAL_ltclientgt To check if there are enough resources available to
process the work items call transaction SM50 (on each application server) while one of the integration
processes is running
o Look for the user ldquoWF-BATCHrdquo and follow its activities by refreshing the transaction
o Are there always dialog work processes available
The most important point to keep in mind here is the concurrent activity of the Business Process Engine (for
ccBPM processes) and the Integration Engine (for pipeline processing) Both runtime environments need
dialog work processes Thus performance problems in one of the engines cannot be solved by restricting
the other Rather an appropriate balance between the two runtimes has to be found
The activity of the WF-BATCH user is not restricted by default It is highly recommended that you register the
RFC destination WORKFLOW_LOCAL_ltclientgt with transaction SMQS and assign a suitable amount of
maximum connections Otherwise ccBPM activity may block the pipeline processing of the Integration
Server and reduce the throughput of PI drastically SAP Note 888279 - Regulatingdistributing the Workflow
Load gives more details
In addition it might help to use specific servers (dialog instances) to carry out a given workflow or to use load
balancing Of course both options only apply for larger PI systems that consist of at least a central instance
and one dialog instance
52 Duration of Integration Process Steps
As described in section Processing Time in the Business Process Engine with PI 73 there is a new monitor
available in ldquoConfiguration and Monitoring Homerdquo on PI start page It shows the duration of individual steps
of an integration process in a very easy way and is the now tool to analyze performance related issues on
the ccBPM
SAP NETWEAVER 71 AND HIGHER PERFORMANCE CHECK GUIDE
46
For releases prior than PI 73 check in the workflow log for long-running steps as described in the previous
chapter Use the ldquoList with Technical Detailsrdquo to do so Since the design of integration processes varies
significantly there is no general rule for the duration of a step or for specific sequences of steps Instead
you have to get a feeling for your implemented integration processes
Did a specific process step decrease in performance over a period of time
Does one specific process step stick out with regard to the other steps of the same integration process
Do you observe long durations for a transformation step (ldquomappingrdquo)
Do you observe long durations of synchronous sendreceive steps in the integration process which correlates for example to a slow response from a connected remote system
Use the SAP Notes database to learn about recommendations and hints SAP Note 857530 - BPE
Composite Note Regarding Performance acts as a central note for all performance notes and might be used
as the entry point
Once you are able to answer the above questions there are several paths to follow
o Two common reasons should be taken into consideration for a performance decrease over time Firstly the load on PI might have increased over time as well Check the hardware resources (chapter 9) and carefully monitor the work process availability (chapter 51) Alternatively the underlying databases might slow down the integration processes Use chapter 54 to check this possibility
o If it is a specific process step that sticks out the process design itself has to be reviewed The SAP Notes mentioned above might help here
o If the mapping step takes a long time it is worth having a look at chapter 442 since the BPE and the IE use the same resources (mapping connections from the ABAP gateway to the J2EE server) to execute their mapping
o If there is a long processing time for a synchronous sendreceive step check the connected backend system for any performance issues
SAP NETWEAVER 71 AND HIGHER PERFORMANCE CHECK GUIDE
47
53 Advanced Analysis Load Created by the Business Process Engine (ST03N)
Since the Business Process Engine runs on the ABAP part of the PI Integration Server you can use the
statistical data written by the dialog work processes to analyze a performance problem
Procedure
Log in to your Integration Server and call transaction ST03N Switch to ldquoExpert Moderdquo and choose the
appropriate timeframe (this could be the ldquoLast Minutersquos Loadrdquo from the Detailed Analysis menu or a specific
day or week from the Workload menu) In the Analysis View navigate to User and Settlement Statistics and
then to User Profile The user you are interested in is the WF-BATCH user who does all ccBPM-related work
Compare the total CPU Time (in seconds) to the time frame (in seconds) of the analysis In the above example an analysis time frame of 1 hour has been chosen which corresponds to 3600 seconds To be exact these 3600 seconds have to be multiplied by the number of available CPUs Out of these 3600CPU seconds the WF-BATCH user used up 36 seconds
o The above value gives you a good idea of how much load the Business Process Engine creates on your PI Integration Server By comparison with the other users (as well as the CPU utilization from transaction ST06) you can determine if the Integration Server is able to handle this load with the available number of CPUs or not This does not help you to optimize the load but it does provide support when deciding how to distribute the workload of the BPE and the workload of the Integration Server (see Chapter 51)
Experienced ABAP administrators should also analyze the database time wait time and compare these values
54 Database Reorganization
The database is accessed many times during the processing of an Integration Process This is not usually
connected with performance problems but if a specific database table is large then statements may take
longer than for small database tables
Use transaction ST05 to collect a SQL trace while the integration process in question is being executed Restrict the trace to user WF-BATCH When the integration process is finished stop the trace and view it Look for high values in the duration column especially for SELECT statements
Use transaction SE16 to determine the number of entries for the typical workflow tables SWW_WI2OBJ and SWFRXI There are many more database tables used by BPE but if the number of entries is high for the above tables they are high for the rest as well See SAP Note 872388 - Troubleshooting Archiving and Deletion in XI and the links given in this note if you find high amounts of entries
SAP NETWEAVER 71 AND HIGHER PERFORMANCE CHECK GUIDE
48
55 Queuing and ccBPM (or increasing Parallelism for ccBPM Processes)
Until recently ccBPM processes accepted messages from only one queue (one queue XBQO$PEWS for
each workflow) If there was a high message throughput for this workflow then a high backlog occurred for
these queues A couple of enhancements have therefore been implemented to improve scalability if the
ccBPM runtime
o Inbound processing without buffering
o Use of one configurable queue that can be prioritized or assigned to a dedicated server
o Use of multiple inbound queues (queue name will be XBPE_WS)
o Configure transactional behavior of ccBPM process steps to reduce number of persistency steps
Details about the configuration and tuning of the ccBPM runtime are described at
httpswwwsdnsapcomirjsdnhowtoguides SAP Netweaver 70 End-to-End Process Integration
o How to Configure Inbound Processing in ccBPM Part I Delivery Mode
o How to Configure Inbound Processing in ccBPM Part II Queue Assignment
o How to Configure ccBPM Runtime Part III Transactional Behavior of an Integration Process
Procedure
Use transaction SMQ2 to check if the queues of type XBQO$PE show a high backlog
o Based on this information verify if the ccBPM process is suitable to run with multiple queues This is especially the case for collect patterns realized in BPE If you can use multiple queues configure the workflow based on the above guides
56 Message Packaging in BPE
Inbound processing takes up the most amount of processing time in many scenarios within BPE
Message packaging in BPE helps to improve performance by delivering multiple messages to BPE process
instances in one transaction This can lead to an increased throughput which means that the number of
messages that can be processed in a specific amount of time can increase significantly Message packaging
can also increase the runtime for individual messages (latency) due to the delay in the packaging process
The sending of packages can be triggered when the packages exceed a certain number of messages a
specific package size (in kB) or a maximum waiting time The extent of the performance improvement that
can be obtained depends on the type of scenario Scenarios with the following prerequisites are generally
most suitable
o Many messages are received for each process instance
o Messages that are sent to a process instance arrive together in a short period of time
o Generally high load on the process type
o Messages do not have to be delivered immediately
For example collect scenarios are particularly suitable for message packaging The higher the number of
messages is in a package the higher the potential performance improvements will be
Tests that have been performed have shown a high potential for throughput improvements up to factor 47 in
tested Collect Scenarios depending on the packaging size that has been configured For more details about
the functionality of Message Packaging in BPE and its configuration see SAP Note 1058623 - BPE
Message Packaging
SAP NETWEAVER 71 AND HIGHER PERFORMANCE CHECK GUIDE
49
Message packaging in BPE is independent of message packaging in PI (see Chapter 45) but they can be
used together
SAP NETWEAVER 71 AND HIGHER PERFORMANCE CHECK GUIDE
50
6 ANALYZING THE (ADVANCED) ADAPTER ENGINE
This chapter describes further checks and possible reasons for bottlenecks in the (Advanced) Adapter
Engine Although this is not the place to describe the architecture of the Adapter Framework in detail the
following aspects are important to know for the analysis of a performance problem on the AFW
o The AFW contains the Messaging System that is responsible for the persistence and queuing of messages Within the flow of a message it is placed in between the sender adapter (for example a file adapter that polls from a folder) and the Integration Server as well as between the Integration Server and the receiver adapter (for example a JMS adapter that sends a message out to an external system)
o The Messaging System uses 4 queues for each adapter type and these are responsible for receiving and sending messages To separate the message transfer each adapter (for example JMS SOAP JDBC and so on) has its own set of queues One queue for receiving synchronous messages (Request queue) one queue for sending synchronous messages (Call queue) one queue for receiving asynchronous messages (Receive queue) and one queue for sending asynchronous messages (Send queue) The name of the queue always states the adapter type and the queue name (for example JMS_httpsapcomxiXISystemReceive for the JMS receiver asynchronous queues)
o A configurable number of consumer threads are assigned on each queue These threads work on the queue in parallel meaning that the Messaging Queues are not strictly FirstIn-FirstOut Five threads are assigned by default to each queue and thus five messages can be processed in parallel But as will be discussed later the parallel execution of requests to the backend depends heavily on the adapter being used since not every adapter can work in parallel by default
o SAP NetWeaver PI 71 introduced a new queue The dispatcher queue The dispatcher queue is used to realize prioritization on the AAE (see chapter Prioritization in the Messaging System) Every message in the PI system is first assigned to the dispatcher queue before it is assigned to the adapter-specific queues
Viewed from the perspective of a message that enters the PI system using a J2EE Engine adapter (for
example File) and leaves the PI system using a J2EE Engine adapter (for example JDBC) asynchronously
the steps are as follows
1) Enter the sender adapter
2) Put into the dispatcher queue of the messaging system
3) Forwarded to the File send queue of the messaging system (based on Interface priority)
4) Retrieved from the send queue by a consumer thread
5) Sent from the messaging system to the pipeline of the ABAP Integration Engine (if no Integrated Configuration (AAE) is used
6) Processed by the pipeline steps of the Integration Engine
7) Sent to the messaging system by the Integration Engine
8) Put into the dispatcher queue of the messaging system
9) Forwarded to the JDBC receive queue of the messaging system (based on Interface priority)
10) Retrieved from the receive queue (based on the maxReceivers)
11) Sent to the receiver adapter
12) Sent to the final receiver
SAP NETWEAVER 71 AND HIGHER PERFORMANCE CHECK GUIDE
51
All the analysis is based on the information provided in the Audit Log With SAP NetWeaver PI 71 the audit
log is not persisted for successful messages in the database by default to avoid performance overhead
Therefore the audit log is only available in the cache for a limited period of time (based on the overall
message volume) More details can be found in chapter Persistence of Audit Log information in PI 710 and
higher
As described in chapter Adapter Engine Performance monitor in PI 731 and higher a new performance
monitor is available from PI 731 SP4 With this monitor you can display the processing time per interface in
a given interval and identify the processing steps in which a lot of time is spend
With 731 SP10 and 74 SP5 a download functionality for the performance monitor is provided as described
in SAP Note 1886761
61 Adapter Performance Problem
Compared to a bottleneck in the Messaging System it is relatively easy to detect a performance
problembottleneck in the adapter Since the timestamps for inbound and outbound messages are written at
different points in time the procedure is described separately for sender and receiver adapters
Note It is not generally possible for all sender and receiver adapters to work in parallel (discussed in section
Adapter Parallelism)
611 Adapter Parallelism
As mentioned before not all adapters are able to handle requests in parallel Thus increasing the number of
threads working on a queue in the messaging system will not solve a performance problembottleneck
There are 3 strategies to work around these restrictions
1) Create additional communication channels with a different name and adjust the respective senderreceiver agreements to use them in parallel
2) Add a second server node that will automatically have the same adapters and communication channel running as the first server node This does not work for polling sender adapters (File JDBC or Mail) since the adapter framework scheduler assigns only one server node to a polling communication channel
3) Install and use a non-central Adapter Framework for performance-critical interfaces to achieve better separation of interfaces
SAP NETWEAVER 71 AND HIGHER PERFORMANCE CHECK GUIDE
52
Some of the most frequently-used adapters and the possible options are discussed below
o Polling Adapters (JDBC Mail File)
At the sender side these adapters use an Adapter Framework Scheduler which assigns a server node that does the polling at the specified interval Thus only one server node in the J2EE cluster does the polling and no parallelization can be achieved Therefore scaling via additional server node is not possible More details will be presented in section Adapter Framework Scheduler For example since the channels are doing the same SELECT statement on the database or pick up files with the same file name parallel processing will only result in locking problems To increase the throughput for such interfaces the polling interval has to be reduced to avoid a big backlog of data that is to be polled If the volume is still too high you should think about creating a second interface for example the new interface would poll the data from a different directory or database table to avoid locking
At the receiver side the adapters work sequentially on each server node by default For example only one UPDATE statement can be executed for JDBC for each Communication Channel (independent of the number of consumer threads configured in the Messaging System) and all the other messages for the same Communication Channel will wait until the first one is finished This is done to avoid blocking situations on the remote database On the other hand this can cause blocking situations for whole adapters as discussed in section Avoid Blocking Caused by Single SlowHanging Receiver Interface
To allow better throughput for these adapters you can configure the degree of parallelism at the receiver side In the Processing tab of the Communication Channel in the field ldquoMaximum Concurrencyrdquo enter the number of messages to be processed in parallel by the receiver channel For example if you enter the value 2 then two messages are processed in parallel on one J2EE server node The parallel execution of these statements at database level of course depends on the nature of the statements and the isolation level defined on the database If all statements update the same database record database locking will occur and no parallelization can be achieved
o JMS Adapter
The JMS adapter is per default using a push mechanism on the PI sender side This means the data is pushed by the sending MQ provider Per default every Communication channel has one JMS connection established per J2EE server node On each connection it processes one message after the other so that the processing is sequential Since there is one connection per server node scaling via additional server nodes is an option
With Note 1502046 - JMS Adapter message pull mechanism the JMS protocol can be changed to use a pull mechanism By doing so you can specify a polling interval in the PI Communication Channel and PI will be the initiator of the communication Also here the Adapter Framework Scheduler is used which implies sequential processing But in contrary to JDBC or File sender channels the JMS polling sender channel will allow parallel processing on all server nodes of the J2EE cluster Therefore scaling via additional J2EE server nodes is an option
The JMS receiver side supports parallel operation out of the box Only some small parts during message processing (pure sending of the message to the JMS provider) are synchronized Therefore to enable parallel processing on the JMS receiver side no actions are necessary
o SOAP Adapter
The SOAP adapter is able to process requests in parallel The SOAP sender side has in general no limitations in the number of requests it can execute in parallel The limiting factor here is the FCAThreads available to process the incoming HTTP calls This is discussed in more detail in chapter Tuning SOAP sender adapter On the receiver side the parallelism depends on the number of the threads defined in the messaging system and the ability of the receiving system to cope with the load
SAP NETWEAVER 71 AND HIGHER PERFORMANCE CHECK GUIDE
53
o RFC Adapter
The RFC adapter offers parameters to adjust the degree of parallelism by defining the number of initial and maximum connections to be used The initial threads are allocated from the Application thread pool directly and are therefore not available for any other tasks Therefore the number of initial thread should be kept minimal To avoid bottlenecks during the peak time the maximum connections can be used A bottleneck is indicated by the following exception in the Audit Log
comsapaiiaframsapiDeliveryException error while processing message to remote systemcomsapaiiafrfccoreclientRfcClientException resource error could not get a client from JCOPool comsapmwjcoJCO$Exception (106) JCO_ERROR_RESOURCE Connection pool RfcClient hellip is exhausted The current pool size limit (max connections) is 1 connections
Also this should be done carefully since these threads will be taken from the J2EE application thread pool Therefore a very high value there can cause a bottleneck on the J2EE engine and therefore cause a major instability of the system As per RFC adapter online help the maximum number of connections are restricted to 50
o IDoc_AAE Adapter
The IDoc adapter on Java (IDoc_AAE) was introduced with PI 73 On the sender side the parallelization depends on the configuration mode chosen In Manual Mode the adapter works sequential per server node For channels in ldquoDefault Moderdquo it depends on the configuration of the inbound Resource Adapter (RA) Via the parameter MaxReaderThreadCount of the inbound RA you can configure how many threads are globally available for all IDoc adapters running in Default Mode Hence this determines the overall parallelization of the IDoc sender adapter per Java server node Currently the recommended maximum number of threads is 10
The receiver side of the Java IDoc adapter is working parallel per default
The table below gives a summary of the parallelism for the different adapter types
SAP NETWEAVER 71 AND HIGHER PERFORMANCE CHECK GUIDE
54
612 Sender Adapter
The first step(s) to be taken for a sender adapter depend on the type of adapter itself Afterwards however
the message flow is always the same First the message is processed in the Module Processor and
afterwards put into the queue of the Messaging System If the message is synchronous then it is the call
queue if the message is asynchronous that it is the send queue The final action of the Adapter Framework
is then to send the message from the messaging system to the Integration Server (for Non ICO interfaces)
Only the first entries of the audit log are of interest to establish if the sender adapter has a performance
problem From the first entry to the entry ldquoMessage successfully put into the queuerdquo These steps logically
belong to the sender adapter and the Module Processor while the subsequent steps belong to the
Messaging System The sender adapter uses one J2EE Engine application thread to execute its work This
is generally the same thread for all steps involved
Select the ldquoDetailsrdquo of a message in the AFW The first entry of the audit log will be the beginning of the activity of the sender adapter The end of the adapterrsquos activity is marked by the entry ldquoThe application sent the message asynchronously using connection Returning to applicationrdquo
6121 Tuning SOAP sender adapter As described above in general there is no limitation in the parallelization of the SOAP sender adapter itself
The incoming SOAP requests are limited by the available FCA Threads for HTTP processing The FCA
Threads are discussed in more detail in FCA Server Threads
Per default all interfaces using the SOAP adapter are using the same set of FCA Threads since they are all
using the same URL httplthostgtltportgtMessageServlet In case one interface is facing a very high load or
slow backend connections this can cause a blockage of the available FCA Threads and could cause a heavy
impact on the processing time of other interfaces
To avoid this SAP Note 1903431 allows the usage of different URLs for specific interfaces This way you
could isolate interfaces with a very high volume on a dedicated entry point using its own set of FCA Threads
In case of high load for this interface the other SOAP sender interfaces would not be affected by a shortage
of FCA Threads
SAP NETWEAVER 71 AND HIGHER PERFORMANCE CHECK GUIDE
55
To use this new feature you can specify on the sender system the following two entry points
o MessageServletInternal
o MessageServletExternal
More information about the URL of the SOAP adapter can be found here
613 Receiver Adapter
For a receiver adapter it is just the other way around when compared to the sender adapter First the
message is received from the Integration Server and then put into a queue of the Messaging System this
time either the request or the receive queue for asynchronous and the request queue for synchronous
messages The last step is then the activity of the receiver adapter itself
Select the ldquoDetailsrdquo of a message in the AFW The adapter activity starts after the entry ldquoThe message status set to DLNGrdquo The message will then be forwarded to the entry point of the AFW ldquoDelivering to channel ltchannel_namegtrdquo enters the Module Processor ldquoMP Entering Module Processorrdquo and ends with ldquoThe message was successfully delivered to the application using connection rdquo
Depending on the type of the adapter you now have to investigate why the receiver adapter needs a high amount of processing time This could be a complicated operating system command a bad network connection or a slow backend system among many other reasons
Here too custom modules can be the reason for a prolonged processing time Check Performance of Module Processing for more details
Note From 71 the audit log is not persisted any longer for performance reasons as described in Persistence of Audit Log information in PI 710 and higher
SAP NETWEAVER 71 AND HIGHER PERFORMANCE CHECK GUIDE
56
614 IDoc_AAE adapter tuning
A comprehensive and up-to date description about the tuning of the IDoc adapter is summarized in Note
1641541 - IDoc_AAE Adapter performance tuning Please refer to this Note for details
Similar to all other adapters running on the Adapter Engine also the IDOC_AAE adapter is using the Messaging System queues and the explanations of the next chapter Messaging System Bottleneck are also valid for the IDOC_AAE adapter Note that the IDOC_AAE adapter only supports async Scenarios ndash so it is only using the ldquoSendrdquo queue in Java-only scenarios and the ldquoSendrdquo and ldquoReceiverdquo queue in dual-stack scenariosrdquo
For the IDoc_AAE sender you can configure in addition bulk support as indicated in the screenshot below By doing so all messages received by PI in one RFC call from ERP will be processed as one message This is similar to the mechanism of the ABAP IDoc adapter described in the chapter Packaging on sender and receiver side except with the difference that the number of messages in one bulk cannot be further limited
It is also essential to ensure that the size of the IDocs or IDoc packages for sender or receiver IDocs is not
getting too large to avoid any negative impact on the Java heap memory and Garbage Collection In the
case of the IDoc_AAE adapter the XML size of the IDoc is less critical it is the number of segments in an
IDoc or the overall number of segments in all IDocs of an IDoc package that will influence the memory
allocation during message processing Based on the current implementation per IDoc segment around 5 KB
of memory during processing is required A package of 5 IDocs with 2000 segments for each IDoc would
consume roughly 500 MB during processing In such cases it is important to eg lower the package size
andor use large message queues as outlined in chapter Large message queues on PI Adapter Engine
615 Packaging for Proxy (SOAP in XI 30 protocol) and Java IDoc adapter
Due to message packaging in the Integration Engine (see PI Message Packaging for Integration Engine) the
ABAP based IDoc and Proxy adapter was always using packaging when sending asynchronous messages
to the receiver system With PI 731 packaging was also introduced for Java based IDoc and Proxy (SOAP in
XI 30 protocol) adapter The aim of packaging is to achieve similar benefits to packaging already existing in
ABAP pipeline
o Less calls to backend consuming less parallel Dialog Work Processes on the receiver
o Less overhead due to context switches authentication when calling the backend
Especially for high volume interfaces packaging should be enabled to avoid overloading of the backend
systems and impact on users operating on the system
SAP NETWEAVER 71 AND HIGHER PERFORMANCE CHECK GUIDE
57
Important
In the ABAP stack the packaging is active per default (in 71 and higher) as described in chapter PI
Message Packaging for Integration Engine Experience shows that packaging can have a very high impact
on the DIA Work process usage on the ERP receiver side Especially for migration projects from dual-stack
PI to AEXPO it is important to evaluate packaging to avoid any negative impact on the receiving ECC due
to missing packaging
The packaging on Java works in general different then on ABAP While in ABAP the aggregation is done on
the individual qRFC queue level (which always contains messages to one receiver system only) this is not
possible on the Adapter Engine since messages for all receivers are located in the same queue Therefore
packages are built outside of the Adapter Engine queues The messages to be packaged will be forwarded
to a bulk handler which waits till either the time for the package is exceeded or the number of messages or
data size is reached After this the message is send by a bulk thread to the receiving backend system
Packaging on Java is always done for a server node individually If you have a high number of server nodes
packaging will work less efficiently due to the load balancing of messages across the available server nodes
When enabling message packaging the message status will stay in status ldquoDeliveringrdquo throughout all steps
described above In the audit log you can see the time it spends in packaging The audit log shown below
shows eg that the message was almost waiting one minute before the package was built and 9 IDocs were
sent with this package
Packaging can be enabled globally by setting the following parameters in Messaging System service as
described in Note 1913972
o messagingsystemmsgcollectorenabled Enable packaging or disable it globally
o messagingsystemmsgcollectormaxMemPerBulk The maximum size of a bulk message
o messagingsystemmsgcollectorbulkTimeout The wait time per bulk - default 60 seconds
o messagingsystemmsgcollectormaxMemTotal Maximum memory which can be used by message collector
o messagingsystemmsgcollectorpoolSize Number of parallel threads used to send out packages to the backend This value has to be tuned based on the general performance of the receiver system the network latency between the systems or the configuration of the IDoc posting on the ERP sender side (described in chapter IDoc posting on receiver side) Therefore tuning of these threads might be very important These threads can unfortunately not be monitored yet with any PI tool or Wily
SAP NETWEAVER 71 AND HIGHER PERFORMANCE CHECK GUIDE
58
Introscope To verify that not all packaging threads are in use you can use the Thread monitoring in the SAP Management Console and check for threads named ldquoBULK_EXECUTORrdquo as shown below
If you would like to adapt the packaging for specific communication channel this can also be done using the
configuration options in the Integration Directory
While in the SOAP adapter in XI 30 protocol you can define three different packaging KPIs this is currently
not possible for the IDoc adapter There you can only specify the package size based on number of
messages
616 Adapter Framework Scheduler
For polling adapters like File JDBC and JMS the Adapter Framework Scheduler determines on which server
node the polling takes place Per default a File or JDBC sender only works on one server node and the
Adapter Framework (AFW) Scheduler determines on which one the job is scheduled
The Adapter Frameworks scheduler had several performance and reliability issues in a cluster environment
especially in systems having many Java server nodes and many polling communication channels Based on
this and the symptoms described in Note 1355715 - AF Scheduler to avoid using cluster communication a
new scheduler was released We highly recommend using the new version of the AFW scheduler To
activate the new scheduler you have to set the parameter schedulerrelocMode of the Adapter framework
SAP NETWEAVER 71 AND HIGHER PERFORMANCE CHECK GUIDE
59
service property to some negative value For instance by setting the value to -15 after every 15th polling
interval a rebalancing of the channel within the J2EE cluster might happen This can allow for better
balancing of the incoming load across the available server nodes if the files are coming in on regular
intervals The balancing is achieved by doing a servlet call Based on the HTTP load balancing the channel
might then be dispatched to another server node To avoid the balancing overhead this value should not be
set too low A value between -10 and -15 should be acceptable in most cases For very short polling intervals
(eg every second) even lower values (eg -50) can be configured
In case many files are put at one given time on the directory (by eg using a batch process) all these files will
be processed by one polling process only Hence a proper load balancing cannot be achieved by the AFW
scheduler In such a case the only option is to use write the files with different names or different directories
so that you can configure multiple sender channels to pick up the files
Starting from PI 731 you can monitor the Adapter Framework Scheduler in pimon Monitoring
Background Job Processing Monitor Adapter Framework Scheduler Jobs There you can check on which
server node the Communication Channel is polling (Status=rdquoActiverdquo) Also you can see the time the channel
was polling the last time and will poll next time
You cannot influence the server node on which the channel is polling This is determined via the AFW
scheduler You can only influence the frequency after which a channel can potentially move to another
server node by tuning the parameter relocMode as outlined above
Prior to PI 731 you have to use the following URL to monitor the Adapter Framework Scheduler
httpserverportAdapterFrameworkschedulerschedulerjsp
Above you see an example of a File sender channel The type value determines if the channel runs only on
one server node (type = L (local)) or on all server nodes (Type = G (global)) The time in the brackets
[60000] determines the polling interval in ms ndash in this case 60 seconds The Status column shows the
status of the channel
o ldquoONrdquo Currently polling
o ldquoonrdquo Currently waiting for the next polling
SAP NETWEAVER 71 AND HIGHER PERFORMANCE CHECK GUIDE
60
o ldquooffrdquo not scheduled any longer (eg channel deactivated or scheduled on another server node)
62 Messaging System Bottleneck
As described earlier the Messaging System is responsible for persisting and queuing messages that come
from any sender adapter and go to the Integration Server pipeline or Java only interfaces (ICO) or that come
from the Integration Server pipeline and go to any receiver adapter The time difference between receiving
the message from the one side and delivering it to the other side is the value that can be used to analyze
bottlenecks in the Messaging System The following chapters describe how to determine the time difference
for both directions
A bottleneck (or rather a ldquofakerdquo bottleneck) in the Messaging System can usually be closely connected with a
performance problem in the receiver adapter You must therefore make sure you execute the check
described in chapter 613 If the receiver adapter needs a lot of time to process messages then of course
the messages get queued in the messaging system and remain there for a long time since the adapter is not
ready to process the next one yet It looks like the messaging system is not fast enough but actually the
receiver adapter is the limiting factor
Execute the checks described in chapter 621 and 622 to get an overview of the situation you should do this for multiple messages
Decide if a specific receiver adapter is causing long waiting times in the messaging system by executing the check described in chapter 613 An additional hint at a receiver adapter problem is if only messages to specific receivers show a long wait time in the queue
Use the queue monitoring in the Runtime Workbench (RWB) to analyze how many threads are active for each of the queue types and how large the queue size currently is To do so choose Component Monitoring Adapter Engine Press the Engine Status button and choose tab ldquoAdditional Datardquo This will open the page below showing the number of messages in a queue the threads currently working and the maximum available threads Note This view only shows the Messaging System of one J2EE server node To get the whole picture you have to check all the server nodes that are available in your system via the drop down list box
SAP NETWEAVER 71 AND HIGHER PERFORMANCE CHECK GUIDE
61
o Since checking all the server nodes with this browser frontend can be very tedious it is better to use Wily Introscope since it allows easy graphical analysis of the queues and thread usage of the messaging system across Java server nodes
The starting point in Wily Introscope is usually the PI triage showing all the backlogs in the queue In the screenshot below a backlog in the dispatcher queue (for 71 and higher only) can be seen
The dispatcher queue is not the problem here since it will forward messages to the adapter queue if any free
threads are available on the adapter specific consumer threads The analysis must start in the PI inbound
queues By using the navigation button in the upper right corner of the inbound queue size you can directly
jump to a more detailed view where you can see that the file adapter was causing the backlog
SAP NETWEAVER 71 AND HIGHER PERFORMANCE CHECK GUIDE
62
To see the consumer thread usage you can then follow the link to the file adapter In the screenshot below
you can see that all consumer threads were exceeded during the time of the backlog Thus increasing the
number of consumer threads could be a solution if the resulting delay is not acceptable for business
o If it is obvious that the messaging system does not have enough resources as in the case above increase the number of consumers for the queue in question Use the results of the previous check to decide which adapter queues need more consumers
The adapter specific queues in the messaging system have to be configured in the NWA using
service ldquoXPI Service AF Corerdquo and property messagingconnectionDefinition The default
values for the sending and receiving consumer threads are set as follows
(name=global messageListener=localejbsAFWListener exceptionListener=
localejbsAFWListener pollInterval=60000 pollAttempts=60
SendmaxConsumers=5 RecvmaxConsumers=5 CallmaxConsumers=5
RqstmaxConsumers=5)
To set individual values for a specific adapter type you have to add a new property set to the default set with the name of the respective adapter type for example
(name=JMS_httpsapcomxiXISystem
messageListener=localejbsAFWListener
exceptionListener=localejbsAFWListener pollInterval=60000
pollAttempts=60 SendmaxConsumers=7 RecvmaxConsumers=7
CallmaxConsumers=7 RqstmaxConsumers=7)
The name of the adapter specific queue is based on the pattern ltadapter_namegt_ ltnamespacegt for
example RFC_httpsapcomxiXISystem
Note that you must not change parameters such as pollInterval and pollAttempts For more details see SAP Note 791655 - Documentation of the XI Messaging System Service Properties
o Not all adapters use the parameter above Some special adapters like CIDX RNIF or Java Proxy can be changed by using the service ldquoXPI Service Messaging Systemrdquo and property messagingconnectionParams by adding the relevant lines for the adapter in question as described above
o A performance problem on the Messaging System can also be caused by a high logging as described in chapter Logging Staging on the AAE (PI 73 and higher)
o Important Make sure that your system is able to handle the additional threads that is monitor the CPU usage and application thread availability as well as the memory of the J2EE Engine after you have applied the change
SAP NETWEAVER 71 AND HIGHER PERFORMANCE CHECK GUIDE
63
o Important Keep in mind that not all adapters are able to handle requests in parallel even if you assign more threads on the Messaging System queues In such a case adding additional threads will not speed up processing significantly See chapter Adapter Parallelism for details
o A backlog of messages in the messaging system is highly critical for synchronous scenarios due to timeouts that might occur Therefore the number of synchronous threads always has to be tuned so that no bottleneck occurs Often a backlog in synchronous queues is caused due to bad performance on the receiving backend system
o More information is provided in the blog Tuning the PI Messaging System Queues
621 Messaging System in between AFW Sender Adapter and Integration Server (Outbound)
Open the Audit Log of a message and look for the following entry ldquoThe message was successfully retrieved
from the send queuerdquo Note that the queue name would be ldquoCall Queuerdquo if the message was synchronous
To determine how long the message waited to be picked up from the queue compare the timestamp of the
above entry with the timestamp for the step ldquoMessage successfully put into the queuerdquo A large time
difference between those two timestamps would therefore indicate a bottleneck for consumer threads on the
sender queues in the Messaging System
Instead of checking the latency of single messages we recommend using Wily Introscope to monitor the
queue behavior as shown above
Asynchronous messages only use one thread for processing in the messaging system Multiple threads are
used for synchronous messages The adapter thread puts the message into the messaging system queue
and will wait till the messaging system delivers the response The adapter thread is therefore not available
for other tasks until the response is returned A consumer thread on the call queue sends the message to the
Integration Engine The response will be received by a third thread (consumer thread of send queue) which
correlates the response with the original request After this the initiating adapter thread will be notified to
send the response to the original sender system This correlation can be seen in the audit log of the
synchronous message below
SAP NETWEAVER 71 AND HIGHER PERFORMANCE CHECK GUIDE
64
622 Messaging System in Between Integration Server and AFW Receiver Adapter (Inbound)
Open the Audit Log of a message and look for the following entry ldquoMessage successfully put into the
queuerdquo Compare this timestamp with the timestamp for the step ldquoThe message was successfully retrieved
from the receive queuerdquo The time difference between these two timestamps is the time that the message
waited in the messaging system for a free consumer thread A large time difference between those two
timestamps indicates a bottleneck in the adapter specific inbound queues of the Messaging System
623 Interface Prioritization in the Messaging System
SAP NetWeaver PI 71 and higher offers the possibility for prioritization of interfaces similar to the ABAP
stack This feature is especially helpful if high volume interfaces run at the same time with business critical
interfaces To minimize the delay for critical messages the Messaging System now makes it possible for you
to define high medium and low priority processing at interface level Based on the priority the Dispatcher
Queue of the messaging system (which will be the first entry point for all messages) will forward the
messages to the standard adapter-specific queues The priority assigned to an interface determines the
number of messages that are forwarded once the adapter-specific queues have free consumer threads
available This is done based on a weighting of the messages to be reloaded The weights for the different
priorities are as follows High 75 Medium 20 Low 5
Based on this approach you can ensure that more resources can be used for high priority interfaces The
screenshot below shows the UI for message prioritization available in pimon Configuration and
Administration Message Prioritization
SAP NETWEAVER 71 AND HIGHER PERFORMANCE CHECK GUIDE
65
The number of messages per priority can be seen in a dashboard in Wily as shown below
You can find more details on configuring usage prioritization within the AAE at SAP Online Help navigate to
SAP NetWeaver SAP NetWeaver PI SAP NetWeaver Process Integration 71 Including Enhancement
Package 1 SAP NetWeaver Process Integration Library Function-Oriented View Process Integration
Process Integration Monitoring Component Monitoring Prioritizing the Processing of Messages
624 Avoid Blocking Caused by Single SlowHanging Receiver Interface
As already discussed above some receiver adapters process messages sequentially on one server node by
default This is independent of the number of consumer threads defined for the corresponding receiver
queue in the messaging system For example even though you have configured 20 threads for the JDBC
Receiver one Communication Channel will only be able to send one request to the remote database at a
given time If there are many messages for the same interface all of them will get a thread from the
messaging system but will be blocked when performing the adapter call
In the case of a slow message transmission for example for EDI interfaces using ISDN technology or
remote system with small network bandwidth this behavior can cause a ldquohangingrdquo situation for a specific
adapter since one interface can block all messaging threads As a result all the other interfaces will not get
any resources and will be blocked
SAP NETWEAVER 71 AND HIGHER PERFORMANCE CHECK GUIDE
66
Based on this a parameter messagingsystemqueueParallelismmaxReceivers was introduced which can
be set in NWA in service XPI Service Messaging System With this parameter you can restrict the maximum
number of receiver consumer threads that can be used by one interface In older releases (lower 731 SP11
and 74 SP6) this is a global parameter at the moment that affects all adapters It should therefore not be set
too restrictively If you need high parallel throughput one option is to set the maxReceiver parameter to 5 (so
that each interface can use 5 consumer threads for each server node) and increase the overall number of
threads on the receive queue for the adapter in question (for example JDBC) to 20 With this configuration it
will be possible for four interfaces to get resources in parallel before all threads are blocked For more
information see Note 1136790 - Blocking Receiver Channel May Affect the Whole Adapter Type and SDN
blog Tuning the PI Messaging System Queues
In the screenshot below you see the impact of maxReceivers parameter when a backlog for one interface
occurs Even though there are more free SOAP threads available they are not consumed Hence the free
SOAP threads could be assigned to other interfaces running in parallel
This parameter has a direct impact on the queue where message backlogs occur As mentioned earlier
usually a backlog should occur on the Dispatcher queue only since it is responsible to dispatch threads only
if there are free consumer threads in the adapter specific queue When setting maxReceiver you restrict the
threads per interface and this means that less consumer threads are blocked When one interface is facing a
high backlog there will always be free consumer threads and therefore the dispatcher queue can dispatch
the message to the adapter specific queue Hence the backlog will appear in the adapter specific queue so
that the message prioritization would not work properly any longer
SAP NETWEAVER 71 AND HIGHER PERFORMANCE CHECK GUIDE
67
Per default the maxReceiver parameter is only relevant for asynchronous message processing (ICo and
classical dual-stack scenarios) The reason here is that a wait time for synchronous scenarios should be
avoided by all means and therefore additional restrictions in the number of available threads can be very
critical Therefore it is usually advisable to not limit the threads per interface but increase the overall number
of available threads In case you have many high volume synchronous scenarios with different priority that
run in parallel it might be advisable to limit the threads each interface can use To do so you have to set the
parameter messagingsystemqueueParallelismqueueTypes to Recv ICoAll as described in SAP Note
1493502 - Max Receiver Parameter for Integrated Configurations
Enhancement with 731 SP11 and 74 SP6
With Note 1916598 - NF Receiver Parallelism per Interface an enhancement was introduced that allows
the specification of the maximum parallelization on more granular level This new feature has to be activated
by setting the parameter messagingsystemqueueParallelismperInterface to true Using a configuration UI
you can specify rules to determine the parallelization for all interfaces of a given receiver service If no rule
for a given interface is specified the global maxReceivers value will be considered If the receiver service
corresponds to a technical business system this configuration would help to restrict the parallel requests
from PI to that system This also works across protocols so that eg it could be used to restrict the number of
parallel requests using Proxy or IDoc to the same ERP receiver system Below you can find a screenshot of
the configuration UI in NWA SOA Monitoring
With the improvement mentioned above also the dispatching mechanism in the dispatcher queue is
changed so that it is aware of the maxReceiver settings This means that now again the backlog will now be
placed in the dispatcher queue and the prioritization will work properly
625 Overhead based on interface pattern being used
Also the interface pattern configured can cause some overhead When choosing the interface pattern
ldquoStateless Operationrdquo each message is parsed against its data type during inbound processing This can
cause performance and memory overhead but gives a syntactical check of the data received
When choosing ldquoStateless (XI30-Compatible)rdquo no check of the data type is performed and therefore the
overhead is avoided Therefore for interface with good data quality and high message throughput this
interface pattern should be chosen
SAP NETWEAVER 71 AND HIGHER PERFORMANCE CHECK GUIDE
68
63 Performance of Module Processing
If your analysis in chapter Adapter Performance Problem pointed to a problem in the Module Processing
then you must analyze the runtime of the modules used in the Communication Channel Adapter modules
can be combined so that one CC calls multiple modules in a defined sequence Adapter modules can be
custom-developed or SAP standard and can be used for many different purposes ndash like to transform the EDI
message before sending it to the partner or to change header attributes of a PI message before forwarding it
to a legacy application Due to the flexible usage of adapter modules there is also no standard way to
approach performance problems
In the audit log shown below you can see two adapter modules One module is a customer-developed
module called SimpleWaitModule The next module called CallSAPAdapter which is a standard module that
inserts the data into the messaging system queues
In the audit log you will get a first impression of the duration of the module In the example above you can
see that the SimpleWaitModule requires 4 seconds of processing time
Once again Wily Introscope offers a better overview of the processing time of modules In the screenshot
below you can see a dashboard showing the cumulativeaverage response times and number of invocations
of different modules If there is one that has been running for a very long time then it would be very easy to
identify since there will be a line indicating a much higher average response time The tooltip displays the
name of the module
Module
Processing
SAP NETWEAVER 71 AND HIGHER PERFORMANCE CHECK GUIDE
69
Once you have identified the module with the long running time you have to talk to the responsible developer
to understand why it is taking that long Eventually the module executes a look-up to a remote system using
JCo or JDBC which could be responsible for the delay In the best case the module will print out information
in addition to the audit log to detect such steps If not use the Wily Introscope transaction trace as explained
in appendix Wily Transaction Trace
64 Java only scenarios Integrated Configuration objects
From SAP NetWeaver PI 71 on you can configure scenarios that only run on the Java stack using the
Advance Adapter Engine (AAE) when only Java-based adapters are used A new configuration object is
used for this that is called Integrated Configuration When using this the steps executed so far in the ABAP
pipeline (Receiver Determination Interface Determination and Mapping) are also executed by the services in
the Adapter Engine
641 General performance gain when using Java only scenarios
The major advantage of AAE processing is a reduced overhead due to the context switches between ABAP
and Java Thus the overall throughput can be increased significantly and the overall latency of a PI
message can be reduced greatly If possible interfaces should always use the Integrated Configuration to
achieve best performance Therefore the best tuning option is to change a scenario that is using Java based
sender and receiver adapters from a classical ABAP-based scenario to an AAE-based one
SAP NETWEAVER 71 AND HIGHER PERFORMANCE CHECK GUIDE
70
Based on SAP internal measurements performed on 71 releases the throughput as well as the response
time could be improved significantly as shown in the diagrams below
SAP NETWEAVER 71 AND HIGHER PERFORMANCE CHECK GUIDE
71
Based on these measurements the following statements can be made
1) Significant performance improvements can be achieved always with local processing (if available) for a certain scenario
2) This is valid for all adapter types huge mapping runtimes slow networks slow (receiver) applications reduce the throughput and therefore rated for the overall scenario also reduce the benefit of local processing in terms of overall throughput and response time measurements
3) Greatest benefit is recognized for small payloads (comparison 10k 50k 500k) and asynchronous messages
642 Message Flow of Java only scenarios
All the Java based tuning options mentioned in chapter Analyzing the (Advanced) Adapter Engine and Long
Processing Times for ldquoPLSRV_MAPPING_REQUESTrdquo are still valid Just the calling sequence is different
The following describes the steps used in Integrated Configuration to help you better understand the
message flow of an interface The example is JMS to Mail
1) Enter the JMS sender adapter
2) Put into the dispatcher queue of the messaging system
3) Forwarded to the JMS send queue of the messaging system
4) Message is taken by JMS send consumer thread
a No message split used
In this case the JMS consumer thread will do all the necessary steps previously done in the ABAP pipeline (like receiver determination interface determination and mapping) and will then also transfer the message to the backend system (remote database in our example) Thus all the steps are executed by one thread only
b Message split used (1n message relation)
In this case there is a context switch The thread taking the message out of the queue will process the message up to the message split step It will create the new message and put it in the Send queue again from where it will be taken by different threads (which will then map the child message and finally send it to the receiving system)
As we can see in this example for Integrated Configuration only one thread does all the different steps of a
message The consumer thread will not be available for other messages during the execution of these steps
The tuning of the Send queue (Call for synchronous messages) is therefore much more important for
scenarios using Integrated Configuration than for ABAP-based scenarios
The different steps of the message processing can be seen in the audit log of a message If for example a
long-running mapping or adapter module is indicated then you can use the relevant chapter of this guide
There is no difference in the analysis except that for mappings no JCo connection is required since the
mapping call is done directly from the Java stack
SAP NETWEAVER 71 AND HIGHER PERFORMANCE CHECK GUIDE
72
The example audit logs below are based on a Java only synchronous SOAP to SOAP scenario
In the highlighted areas you can see that all the steps are very fast except the mapping call which lasts
around 7 seconds To analyze the long duration of the mapping now the same steps as discussed in chapter
Long Processing Times for ldquoPLSRV_MAPPING_REQUESTrdquo have to be followed
SAP NETWEAVER 71 AND HIGHER PERFORMANCE CHECK GUIDE
73
643 Avoid blocking of Java only scenarios
Like classical ABAP based scenarios Java only scenarios can face backlog situations in case of a slow or
hanging receiver backend Since the Java only interfaces are only using send queues the restriction of
consumer threads on the receiver queue as described in chapter Avoid Blocking Caused by Single
SlowHanging Receiver Interface is no solution
Based on that an additional property messagingsystemqueueParallelismqueueTypes of service SAP XI AF
MESSAGING was introduced via Note 1493502 - Max Receiver Parameter for Integrated Configurations
The parameter can be set for synchronous and asynchronous interfaces Please keep in mind that
messagingsystemqueueParallelismmaxReceivers is a global parameter for all adapters and for all
configured Quality of Service This global restriction can be avoided starting with 731 SP11 740 SP06 as
per SAP Note 1916598 - NF Receiver Parallelism per Interface Usually a restriction for the parallelization
can be highly critical for synchronous interfaces Therefore we generally recommend to set
messagingsystemqueueParallelismqueueTypes in most cases to Recv IcoAsync only
644 Logging Staging on the AAE (PI 73 and higher)
Up to PI 711 on the PI Adapter Engine only one message version was persisted Especially for Java only
scenarios this was often not sufficient for troubleshooting since for instance the result of a mapping could not
be verified
Starting from PI 73 the persistence steps can be configured globally in the Adapter Engine for synchronous
and asynchronous interfaces This is similar to the LOGGING or LOGGING_SYNC on the ABAP stack In
later version of PI you will be able to do the configuration on interface level
The versions that can be persisted are shown in the diagram below (the abbreviations in green are the
values for the configuration)
SAP NETWEAVER 71 AND HIGHER PERFORMANCE CHECK GUIDE
74
In the Messaging System we generally distinguish Staging (versioning) and Logging An overview is given
below
For details about the configuration please refer to the SAP online help Saving Message Versions
Similar to the LOGGING on the ABAP Integration Server persisting several versions of the Java message
can cause a high overhead on the DB and can cause a decrease in performance
The persistence steps can be seen directly in the audit log of a message
Also the Message Monitor shows the persisted versions
SAP NETWEAVER 71 AND HIGHER PERFORMANCE CHECK GUIDE
75
While this additional monitoring attributes are extremely helpful for troubleshooting they should be used
carefully from a performance perspective Especially the number of message versions and the
loggingstaging mode you choose can have a severe impact on performance Therefore you have to find the
balance between business requirement and performance overhead Some guidelines on how to use staging
and logging are summarized in SAP Note 1760915 - FAQ Staging and Logging in PI 73 and higher
65 J2EE HTTP load balancing
With NetWeaver version 71 and higher the Java HTTP load balancing is no longer done by the Java
Dispatcher but by the ICM The default load balancing rules of the ICM are designed with a stateful
application in mind giving priority to the balancing of HTTP sessions These default rules are not optimal for
stateless applications such as SAP PI
In the past we could observe an unequal load distribution across Java server nodes caused by this In case
of high backlogs this can cause a delay in the overall message processing of the interface because one
server node has more messages assigned than others and therefore not all available resources are used
A typical example can be seen in the Wily screenshot below
SAP Note 1596109 ndash Uneven distribution of HTTP requests on Java server nodes introduces new load
balancing rules for stateless applications like PI Please follow the description in the Note to ensure the
messages are distributed equally across the available server nodes In the meantime these load balancing
rules can also be executed using the CTC templates as described in Notes 1756963 and 1757922 Also this
has been included in the PI Initial Setup wizard in order to execute this task automatically as a post-
installation step (see Note 1760700 - PI CTC Add HTTP loadbalancing to initial setup)
SAP NETWEAVER 71 AND HIGHER PERFORMANCE CHECK GUIDE
76
For the example given above we could see a much better load balancing after the new load balancing rules
were implemented This can be seen in the following screenshot
Please Note The load balancing rules mentioned above are only responsible to balance the messages
across the available server nodes of one instance HTTP load balancing across application servers is done
by the SAP Web Dispatcher More information about this is provided in the Guide How To Scale SAP PI 71
66 J2EE Engine Bottleneck
All tuning that can be done in the AFW is limited by the ability of the J2EE Engine to handle a given amount
of threads and to provide enough memory that is needed to process all requests Of course the CPU is also
a limiting factor but this will be discussed in Chapter 91
From SAP NetWeaver PI 71 onwards the SAP VM is used on all platforms Therefore the analysis of all
platforms can use the same tools
661 Java Memory
The first analysis of the J2EE memory is usually done using the garbage collection (GC) behavior of the
Java Virtual Machine (JVM) To get the information of the GC written to the standard log file the JVM has to
be started with the parameter ndashverbosegc
Analyze the file std_serverltngtout for the frequency of GCs their duration and the allocated memory
Look for unusual patterns indicating an Out-of-Memory error or an unintentional restart of your J2EE engine This would be visible if the allocated memory drops to 0 at a given point in time A healthy Garbage Collection output would display a saw tooth pattern ndash that is the memory usage would increase over time but then go down to its original value as soon as a full Garbage Collection is triggered You should see the memory usage go down to initial values during low volume times (night-time)
Pay attention to GCs with a high duration This is important because no PI message can be mapped or processed by the J2EE Adapter Framework during a GC in a JAVA VM One of the many reasons for long GCs that should be mentioned here is paging (see chapter 92) If the heap space of the J2EE Engine is exhausted all objects in the heap are evaluated for their references If there is still a reference the object is kept If there is no reference the object is deleted If some or all of the objects have been swapped out due to insufficient RAM then they have to be swapped in to be evaluated This leads to very long runtimes for GCs GCs of more than 15 minutes have been observed on swapping systems
SAP NETWEAVER 71 AND HIGHER PERFORMANCE CHECK GUIDE
77
Different tools exist for the Garbage Collection Analysis
1) Solution Manager Diagnostics
Solution Manager Diagnostics (SMD) offers a memory analysis application that is able to read the GC output in the std_serverltngtout files To start call the Root Cause Analysis section In the Common Task list you find the entry Java Memory Analysis which will give you the chance to upload your std_serverltngtout file It shows the memory allocated after the GC and also prints the duration of each GC (black dots with duration scale on right axis) A normal GC output should show a saw tooth pattern where the memory always goes down to an initial value (especially during low volume times) This is shown in the example screenshot below
2) Wily Introscope
Again Wily Introscope offers different dashboards that can be used to check the Garbage Collection behavior on the J2EE engine The dashboard can be found using the J2EE Overview J2EE GC Overview and shows important KPIs for the GC such as the count of GC or the duration for each interval The GC Time dashboards shows the ratio of time spent in GC An example is shown in the screenshot below
SAP NETWEAVER 71 AND HIGHER PERFORMANCE CHECK GUIDE
78
3) Netweaver Administrator
The NWA also offers a view to monitor the Java heap usage However the important information about the duration of the GC is not available This monitor can be found by navigating to Availability and Performance Management Java System Reports Choose Report System Health
In NetWeaver 73 you find this data in Availability and Performance Management Resource Monitoring History Reports There you can build your own Memory report of the monitoring data provided The screenshot below eg shows the Used Memory per server node
SAP NETWEAVER 71 AND HIGHER PERFORMANCE CHECK GUIDE
79
4) SAP JVM Profiler
The SAP JVM profiler allows the analysis of the extensive GC information stored in the sapjvm_gcprf files of the server node folders or to directly connect to the server node to retrieve this information More information can be found at httpwikiscnsapcomwikidisplayASJAVAJava+Profiling
SAP NETWEAVER 71 AND HIGHER PERFORMANCE CHECK GUIDE
80
Procedure
o Search for restarts of the J2EE Engine by searching for the string ldquois startingrdquo in the file std_serverltngtout Apart from the first of these entries (which simply marks the initial start of the J2EE Engine) the second and any later entries mark a fatal situation after which the J2EE server node had to be restarted This could for example be an outndashof-memory situation Search the log above those entries for a possible reason
o Search for exceptions and fatal entries Was an out-of-memory error reported (search for pattern OutOfMemory) Was a thread shortage reported
o This document does not deal with tuning the J2EE Engine If at this point it becomes clear that the J2EE Engine is the limiting factor proceed with SAP Notes or open a customer incident Only some very basic recommendations are given here
o The parameters for the SAP VM are defined by Zero Admin templates From time to time new Zero Admin templates might be released which change important parameters for the SAP VM Thus you should check SAP Note 1248926 - AS Java VM Parameters for NetWeaver 71-based Products regularly and apply the changes accordingly
o The problem might be caused by too high parallelization when processing large messages This should be restricted to avoid overloading of the Java heap memory
1) In case the interfaces are using the ABAP Integration Server use the large message queue filters to restrict the parallelization of mapping calls from ABAP queues To do so set parameter EO_MSG_SIZE_LIMIT to eg 5000 to direct all large messages to dedicated XBTL or XBTM queues
2) To restrict the parallelization on the Java Messaging System you can use the large message queue mechanism described in chapter Large message queues on the Messaging System
o If it is already obvious that the memory of your J2EE Engine is getting short and nothing can be changed on the scenarios itself you have several options for scaling your PI landscape Especially for large PI installations with high message throughput or large messages SAP Note 1502676 - Scaling up large PI installations describes potential options
1) Increase the Java Heap of your server node If sufficient physical memory is available increase the default heap size of 2 GB to a higher value such as 3 or 4 GB Experience shows that the SAP VM can handle these heap sizes without major impact on performance Larger heap sizes can cause longer processing time of GCs which in turn can affect the PI application negatively Increasing the maximum heap size on the J2EE engine will automatically adapt the new area of the heap due to a dynamic configuration (in newer J2EE versions this will be per default set to 16 of the overall heap) After increasing the heap size monitor the duration of the GC execution
2) Add an additional server node to distribute the load over more processes SAP recommends that productive systems have at least 2 Java server nodes per instance Prerequisite is that your physical host has enough RAM and CPU To minimize the overhead for J2EE cluster communication it is in general recommended configuring larger server nodes (as described above) then a high number of server nodes
3) Add an additional application server consisting of a double stack Web Application Server (ABAP and J2EE Engine) to distribute the load to an additional hardware Find details on the scaling of PI with multiple instances in the Guide How To Scale up SAP NetWeaver Process Integration
4) Use a non-central Adapter Engine to separate large messages that cause the memory problem from business critical scenarios
662 Java System and Application Threads
A system or application thread is required for every task that the J2EE Engine executes Each of these
thread types are maintained using a thread pool If the pool of available threads is expired no more requests
can be processed It is therefore important that you have enough threads available at all times
SAP NETWEAVER 71 AND HIGHER PERFORMANCE CHECK GUIDE
81
o In general SAP recommends that you increase the system and application thread count for a PI system As described in SAP Note 937159 - XI Adapter Engine is stuck the application threads should be increased to 350 and the system threads to lsquo120rsquo for all J2EE server nodes
o There are two options for checking the thread usage
1) Wily Introscope
Wily Introscope provides a dashboard in the J2EE Overview section called J2EE CPU and Memory Detail that can also be used to monitor the thread usage on a PI engine Different views exist for Application and System Threads as shown in the screenshot below
2) NetWeaver Administrator (NWA)
The NWA also offers a monitor similar to the one available for the memory mentioned above This monitor can be found by navigating to Availability and Performance Management Java System Reports Choose Report System Health and looking at the windows shown in the screenshot below
Again in NetWeaver 73 and higher the monitor can be found at Availability and Performance
Management Resource Monitoring History Report An example for the Application Thread
Usage is shown below
SAP NETWEAVER 71 AND HIGHER PERFORMANCE CHECK GUIDE
82
Check if the ThreadPoolUsageRate is below 80 for both the application threads and the system threads Also check the maximum value by choosing a longer history in Wily Introscope
Has the thread usage increased over the last daysweeks
Is there one server node that shows a higher thread usage than others
3) SAP Management Console
The SAP Management Console is an essential tool to analyze different aspects of the J2EE engine It also offers a thread dump view similar to SM50 in ABAP showing the activity of all the threads of a given Java Application Server More information about the SAP MC can be found in Note 1014480 - SAP Management Console (SAP-MC) and the online help The SAP Management Console can be started as Java web-start application using httpltservergt5ltInstanc_numbergt13
Navigate to AS Java Threads and check for any threads in red status (gt20 secs running time) This indicates long running threads and you should check for the related thread stacks The example below shows a long running thread related to the PI directory You can see the user doing the request and can see that the thread is waiting for an HTTP response from the CPACache
SAP NETWEAVER 71 AND HIGHER PERFORMANCE CHECK GUIDE
83
If you are not sure what is causing the problem you should take multiple thread dumps (at least 3 every 30 seconds) for all server nodes This can be done in the Management Console navigating to AS Java Process Table
The Thread Dump Viewer tool (TDV) from Note 1020246 - Thread Dump Viewer for SAP Java Engine can be used to analyze the produced thread dumps (inside the results archive that can be downloaded to your local PC)
663 FCA Server Threads
An additional type of thread was introduced with SAP NetWeaver PI 71 that is responsible for HTTP traffic
FCA Server Threads The FCA Server Threads are responsible for receiving HTTP calls at the Java side
(after the Java dispatcher is no longer available) Also FCA Threads use a Thread Pool Fifteen FCA
Threads are configured by default but based on SAP Note 1375656 - SAP Netweaver PI System Parameters
we recommend that you increase it to 50 This can be done in the NWA by changing the parameter
FCAServerThreadCount of service HTTP Provider
FCA Server Threads are particularly crucial for synchronous message transfer and for HTTP-based
scenarios like WebServices or calls from the ABAP engine to the Adapter Engine If there is a long duration
of the HTTP call due to a slow backend system then the thread is blocked for the whole time and not
available to send other HTTP requests (other PI messages)
SAP NETWEAVER 71 AND HIGHER PERFORMANCE CHECK GUIDE
84
The configured FCAServerThreadCount represents the maximum number of threads working on a single
entry point An entry point in the PI sense could eg be the SOAP Adapter Servlet (share with all channels
as described in Tuning SOAP sender adapter)
o If response times for specific entry point are high (gt15 seconds) additional FCA threads will be spawned to be available for parallel HTTP based incoming requests using different entry points only This ensures that in case of problems with one application not all other applications will be blocked constantly
o An overall maximum of 20xFCAServerThreadCount may be used in the J2EE engine
There is currently no standard monitor available for FCA Threads except the thread view in the SAP
Management Console A new dashboard will be integrated into Wily Introscope soon and will also show the
FCA Server Threads that are in use
664 Switch Off VMC
The Virtual Machine Container (VMC) is enabled by default for an ABAP WebAS 71 Since PI does not use
VMC at runtime the VMC can be switched off on a PI system to avoid resource overhead This
recommendation is based on SAP Note 1375656 - SAP NetWeaver PI System Parameters
You can activate the VM Container setting the profile parameters vmcjenable = off which can be changed
using profile maintenance (transaction RZ10) Once you have made the change you need to restart the SAP
Web Application Server instance
SAP NETWEAVER 71 AND HIGHER PERFORMANCE CHECK GUIDE
85
7 ABAP PROXY SYSTEM TUNING
Every ABAP WebAS gt 620 includes an ABAP Proxy runtime This enables a SAP system to talk native PI
protocol (XI-SOAP) so that no costly transformation is necessary
In general ABAP proxy is just a framework that is triggered by (sender) or triggers (receiver) application-
specific coding It is not possible to give a general tuning recommendation because the applications and use
cases of ABAP proxy can differ so greatly
In this section we would like to highlight the system tuning options that can be applied to improve the
throughput at the ABAP Proxy backend side
In general you can increase the throughput of EO interfaces by changing the queue parallelization Two
different parameters exist to change the number of qRFC queues on the ABAP Proxy backend As in PI
ABAP Proxy processing is based on qRFC inbound queues (SMQ2) with specific names A sender proxy
uses XBTS queues (10 parallel by default) and a receiver proxy XBTR (20 parallel by default)
The sender proxy only forwards the message to PI by executing an HTTP call that must not take too much
time and which is not resource-critical On the other hand the receiver proxy executes the inbound
processing of the messages based on the application context (and which can be very time-consuming) It is
therefore more likely to face a backlog situation in the Receiver Proxy queues In the screenshot below you
can see the performance header of a receiver proxy message that required around 20 minutes in the
PLSRV_CALL_INBOUND_PROXY (which corresponds to the posting of the application data)
Of course such a long-running message will block the queue and all messages behind it will face a higher
latency Since this step is purely application-related it is only possible to perform tuning at the application
side
The number of sender and receiver ABAP Proxy queues can be changed in transaction SXMB_ADM on the
proxy backend with parameter EO_INBOUND_PARALLEL and sub parameter SENDER (XBTS queues)
and RECEIVER (XBTR queues) The prerequisite for increasing the number of queues is that there are
enough qRFC resources are available at the proxy system (as discussed in section qRFC Resources
(SARFC))
Also as described in chapter Message Prioritization on the ABAP Stack prioritization can be configured in
the ABAP Proxy system This can be used to separate runtime-critical interfaces from interfaces with a long
application processing (as shown above)
SAP NETWEAVER 71 AND HIGHER PERFORMANCE CHECK GUIDE
86
71 New enhancements in Proxy queuing
The queuing mechanism was enhanced for sender and receiver proxy systems with Note 1802294
(Receiver) and Note 1831889 (Sender) After implementing these two Notes interface specific queues will be
used and tuning of these queues on interface level will be possible This can be very helpful in cases where
one receiver interface shows very long posting time in the application coding that cannot be further
improved Other messages for more business critical interfaces will eventually be blocked by this message
due to the common usage of the XBTR queues On the sender side of a Proxy system the processing of the
queues call the central PI hub In general the processing time there should be fast But in case of high
volume interfaces you might want to slow down less business critical interfaces to avoid overloading of your
central PI hub The prioritization mechanisms available prior to these Notes did not provide such options
This is achieved by adding an interface specific identifier to the queue-name In the screenshot below you
see a comparison in the queue names for the old framework (red) and the new framework (blue)
For the sender queues the following new parameters are introduced
o Parameter EO_QUEUE_PREFIX_INTERFACE with sub parameter SENDERSENDER_BACK Should be set to lsquo1rsquo to active interface specific queue This is a global switch affecting all sender interfaces
o Parameter EO_INBOUND_PARALLEL_SENDER without sub parameter determines the general number of queues per interface
Using a sub parameter ltsender IDgt the parallelization of individual interfaces can be changed This can eg be used to assign more queues for high priority interfaces
Wildcards can be used in the ltsender IDgt to group interfaces sharing eg the same service name or the same interface name but different services
For the receiver queues the following new parameters are introduced
o Parameter EO_QUEUE_PREFIX_INTERFACE with sub parameter RECEIVER Should be set to lsquo1rsquo to active interface specific queue This is a global switch affecting all receiver interfaces
o Parameter EO_INBOUND_PARALLEL_RECEIVER without sub parameter determines the general number of queues per interface
Using a sub parameter ltsender IDgt the parallelization of individual interfaces can be changed This can eg be used to assign more queues for high priority interfaces
Wildcards can be used in the ltsender IDgt to group interfaces sharing eg the same service name or the same interface name but different services
This new feature also replaces the currently existing prioritization since it is in general more flexible and
powerful We therefore recommend adjusting existing prioritization rules using the new queuing possibilities
described above
SAP NETWEAVER 71 AND HIGHER PERFORMANCE CHECK GUIDE
87
8 MESSAGE SIZE AS SOURCE OF PERFORMANCE PROBLEMS
The message size directly influences the performance of an interface The size of a PI message depends on
two elements The PI header elements with a rather static size and the payload which can vary greatly
between interfaces or over time for one interface (for example larger messages during year-end closing)
The size of the PI message header can cause a major overhead for small messages of only a few kB and
can cause a decrease in the overall throughput of the interface Furthermore many system operations (like
context switches or database operations) are necessary for only a small payload The larger the message
payload the smaller the overhead due to the PI message header On the other hand large messages
require a lot of memory on the Java stack which can cause heavy memory usage on ABAP or excessive
garbage collection activity (see section Java Memory) that will also reduce the overall system performance
Very large messages can even crash the PI system by causing an Out-of-Memory exception for example
You therefore have to find a compromise for the PI message size
Below you see throughput measurements performed by SAP In general the best throughput was identified
for messages sizes of 1 to 5 MB
The message size in these measurements corresponds to the XML message size processed in PI and not
the size of the file or IDoc being sent to PI You can use the Runtime Header of the ABAP stack to check the
message size Below you can see an example of a very small message While the MessageSizePayload
field describes the size of the payload in bytes (here 433 bytes) the MessageSizeTotal describes the total
message size (header + payload) In the example this is around 14 KB demonstrating the overhead by the PI
header for small messages The next two lines describe the payload size before and after the mapping In
the example below the mapping reduces the payload size The last two lines determine the size of the
response message that is sent back to PI before and after the response mapping for synchronous
messages
SAP NETWEAVER 71 AND HIGHER PERFORMANCE CHECK GUIDE
88
Based on the above observations we highly recommend that you use a reasonable message size for your
interfaces During the design and implementation of the interface we therefore recommend using a message
size of 1 to 5 MB if possible Messages can be collected at the sender side or by using IDoc packaging as
described in Tuning the IDoc Adapter to achieve this In case of large messages a split has to be performed
by changing the sender processing or by using the split functions available in the structure conversion of the
File adapter
81 Large message queues on PI ABAP
In case the interfaces are using the ABAP Integration Server use the large message queue filters to restrict
the parallelization of mapping calls from ABAP queues To do so set the parameter EO_MSG_SIZE_LIMIT of
category TUNING to eg 5000 to direct all messages larger 5 MB to dedicated XBTL or XBTM queues
The value of the parameter depends on the number of large messages and the acceptable delay that might
be caused due to a backlog in the large message queue
To reduce the backlog the number of large message queues can also be configured via parameter
EO_MSG_SIZE_LIMIT_PARALLEL of category TUNING The default value is 1 so that all messages larger
than the defined threshold will be processed in one single queue Naturally the parallelization should not be
set higher than 2 or 3 to avoid overloading of the Java memory due to parallel large message requests
82 Large message queues on PI Adapter Engine
SAP Note 1727870 - Handling of large messages in the Messaging System introduces large message
queues (virtual queues no adapter behind) also for the Java based Adapter Engine Contrary to the
Integration Engine it is not the size of a single large message only that determines the parallelization
Instead the sum of the size of the large messages across all adapters on a given Java server node is limited
to avoid overloading the Java heap This is based on so called permits that define a threshold of a message
size Each message larger than the permit threshold is considered as large message The number of permits
can be configured as well to determine the degree of parallelization Per default the permit size is 10 MB and
10 permits are available This means that large messages will be processed in parallel if 100 MB are not
exceeded
To show this let us look at an example using the default values Let us assume we have 5 messages waiting
to be processed (status ldquoTo Be Deliveredrdquo on one server node Message A has 5 MB message B has 10
MB message C has 50 MB message D 150 MB message E 50 MB and message F 40 MB Message A is
not considered large since the size is smaller than the permit size and is not considered large and can be
immediately processed Message B requires 1 permit message C requires 5 Since enough permits are
available processing will start (status DLNG) Hence for message D all available 10 permits would be
required Since the permits are currently not available it cannot be scheduled If blacklisting is enabled the
message will be put to error status (NDLV) since it exceed the maximum number of defined permits In that
case the message would have to be restarted manually Message E requires 5 permits and can also not be
scheduled But since there are 4 permits left message F is put to DLNG Due to the smaller size message B
and message F finish first releasing 5 permits This is sufficient to schedule message E which requires 5
SAP NETWEAVER 71 AND HIGHER PERFORMANCE CHECK GUIDE
89
permits Only after message E and C have finished message D can be scheduled consuming all available
permits
The example above shows a potential delay a large message could face due to the waiting time for the
permits But the assumption is that large messages are not time critical and therefore additional delay is less
critical than potential overload of the system
The large message queue handling is based on the Messaging System queues This means that restricting
the parallelization is only possible after the initial persistence of the message in the Messaging System
queues Per default this is only done after the Receiver Determination Therefore if you have a very high
parallel load of incoming large requests this feature will not help Instead you would have to restrict the size
of incoming requests on the sender channel (eg file size limit in the file adapter or the
icmHTTPmax_request_size_KB limit in the ICM for incoming HTTP requests) If you have very complex
extended receiver determination or complex content based routing it might be useful to configure staging in
the first processing step of the Messaging System (BI=3) as described in Logging Staging on the AAE (PI
73 and higher)
The number of permits consumed can be monitored in PIMON Monitoring Adapter Engine Status The
number of threads corresponds to the number of consumed permits
In newer Wily versions there is also a dashboard showing the number of consumed permits as well The
Worker Threads on the right hand side of the screenshot correspond to the permits
SAP NETWEAVER 71 AND HIGHER PERFORMANCE CHECK GUIDE
90
9 GENERAL HARDWARE BOTTLENECK
During all tuning actions discussed in the previous chapters you must keep in mind that the limitation of all
activities is set by the underlying CPU and memory capacity The physical server and its hardware have to
provide resources for three PI runtimes the Adapter Engine the Integration Engine and the Business
Process Engine Tuning one of the engines for high throughput leaves fewer resources for the remaining
engines Thus the hardware capacity has to be monitored closely
91 Monitoring CPU Capacity
When monitoring the CPU capacity it is not enough to use the average that is displayed in the ldquoPrevious
Hoursrdquo section of transaction ST06 Instead you should start your interface and monitor the CPU while it is
running The best procedure is to use operating system tools to monitor the CPU usage (particularly if using
hardware virtualization)
The SMD Host Agent also reports CPU data to Wily Introscope which can be viewed using dashboards as
shown below This example shows two systems where one is facing a temporary CPU overload and the
other a permanent one
Also the NWA offers a view on the CPU activity from NetWeaver 73 on via Availability and Performance
Management Resource Monitoring History Reports There you can build your own report based on the
ldquoCPU utilizationrdquo data as shown in the screenshot
SAP NETWEAVER 71 AND HIGHER PERFORMANCE CHECK GUIDE
91
You can also monitor the CPU usage in ST06 as described below
Procedure
Log on to your Integration Server and call transaction ST06 Take a look at the snapshot that is provided on
the entry screen than navigate to ldquoDetailed Analysis Menurdquo
Snapshot view Is the idle time (upper left corner) at a reasonable value at all times for example around 10 or higher
Snapshot view The load average is a good indicator of the dimension of the bottleneck It describes the number of processes for each CPU that are in a wait queue before they are assigned to a free CPU As long as the average remains at one process for each available CPU the CPU resources are sufficient Once there is an average of around three processes for each available CPU there is a bottleneck at the CPU resources In connection with a high CPU usage a high value here can indicate that too many processes are active on the server In connection with a low CPU usage a high value here can indicate that the main memory is too small The processes are then waiting due to excessive paging
Detailed Analysis View TOP CPU Which thread uses up the highest amount of CPU Is it the J2EE Engine the work processes or the database
o There are different follow-up actions to be taken depending on the findings of the second check The first option is of course to simply increase the hardware This should be accompanied by a thorough sizing (for which SAP provides the Quicksizer in the Service Marketplace httpservicesapcomquicksizer )
o The second option is to identify the CPU-consuming threads and to think about a reduction of the load in this component For example if the J2EE Engine is the largest consumer then it is worth re-evaluating the number of concurrent mapping threads andor consumer queues as described in the previous chapters
o SAP Note 742395 - Analyzing High CPU Usage by the J2EE Engine provides a good entry point if the J2EE Engine consumes too much CPU
o If it is the work processes that consume a lot of CPU use transaction ST03N to figure out if it is the Integration Server or the Business Process Engine You can do that by looking at the CPU usage per user BPE uses the user WF-BATCH while the Integration Server uses the last user who activated a qRFC queue (typically PIAFUSER or PIAPPLUSER) Use the previous chapter to restrict these activities
92 Monitoring Memory and Paging Activity
As stated above paging is very critical for the Java stack since it influence the Java GC behavior directly
Therefore paging should be avoided in every case for a Java-based system
The OS tools are the most reliable for monitoring the paging activity on your system Transaction ST06 can
also be used to perform a snapshot analysis Take a look at the snapshot that is provided on the entry
screen
Snapshot view Is there enough physical memory available
Snapshot view Is there considerable paging Paging can have a negative influence on your J2EE Engine If it does this can be seen in long GC times as described in Chapter 661
93 Monitoring the Database
Monitoring database performance is a rather complex task and requires information to be gathered from a
variety of sources Only a basic set of indicators is given for the purpose of this guide A more detailed
SAP NETWEAVER 71 AND HIGHER PERFORMANCE CHECK GUIDE
92
analysis is required if these indicators point to a major performance problem in the database If assistance is
needed open a support message under the component BC-DB-ORA (or MSS SDB DB6 respectively)
931 Generic J2EE database monitoring in NWA
The next sections of this chapter will be mainly based on ABAP transactions to do a detailed analysis of the
database performanceThe NWA however offers possibilities to monitor the database performance for the
Java based tables This is especially helpful for Java only AEXPO or Non-Central AAEs In the NWA you
can use the ldquoOpen SQL Monitorrdquo in the Troubleshooting section of NWA The official documentation can be
found in the Online Help Monitoring DB via DBACOCKPIT transaction (ABAP based) is possible also for the
Java-only systems from SAP Solution Manager (DBA Cockpit must be configured in the Managed System
Setup)
It will be too much to outline all the available functionalities here Instead only a few key capabilities will be
demonstrated If you want to eg see the number of select update or insert statements in your system you
can use the ldquoTable Statistics Monitorrdquo It clearly shows you which tables in your system are accessed the
most frequently
To see the processing time of the different statements on your system you can use the ldquoOpen SQL statisticsrdquo
monitor There you can see the count the total average and max processing time of the individual SQL
SAP NETWEAVER 71 AND HIGHER PERFORMANCE CHECK GUIDE
93
statements and can therefore identify the expensive statements on your system
Per default the recorded period is always from the last restart of the system If you would like to just look at
the statistics for a specific time period (eg during a test) you have the option of resetting the statistics in the
individual monitor prior to the test
932 Monitoring Database (Oracle)
Procedure
Log on to your Integration Server and call transaction ST04
SAP NETWEAVER 71 AND HIGHER PERFORMANCE CHECK GUIDE
94
Many of the numbers in the screenshot above depend on each other The following checklist names a few
key performance figures of your Oracle database
The data buffer quality for instance is based on the ratio of physical reads versus the total number of reads The lower the ratio the better the buffer quality The data buffer quality should be better than 94 the statistics should be based on 15 million total reads This number of reads ensures that the database is in an equilibrated state
Ratio of user and recursive calls A good performance is indicated by ratio values greater than 2 Otherwise the number of recursive calls compared to the number of user calls is too high Over time this ratio always declines because more and more SQL statements get parsed in the meantime
Number of reads for each user call If this value exceeds 30 blocks for each user call this indicates an expensive SQL statement
Check the value of TimeUser call Values larger than 15 ms often indicate an optimization issue
Compare busy wait time versus CPU time A ratio of 6040 generally indicates a well-tuned system Significantly higher values (for example 8020) indicate room for improvement
The DD-cache quality should be better than 80
933 Monitoring Database (MS SQL)
Procedure
To display the most important performance parameters of the database call Transaction ST04 or choose
Tools Administration Monitor Performance Database Activity An analysis is only meaningful if
the database has been running for several hours with a typical workload To ensure a significant database
SAP NETWEAVER 71 AND HIGHER PERFORMANCE CHECK GUIDE
95
workload we recommend a minimum of 500 CPU busy seconds Note The default values displayed in
section Server Engine are relative values To display the absolute values press button Absolute values
Check the values in (1)
The cache hit ratio (2) which is the main performance indicator for the data cache shows the
average percentage of requested data pages found in the cache This is the average value since startup The value should always be above 98 (even during heavy workload) If it is significantly below 98 the data cache could be too small To check the history of these values use Transaction ST04 and choose Detail Analysis Menu Performance Database A snapshot is collected every 2 hours
Memory setting (5) shows the memory allocation strategy used and shows the following
FIXED SQL Server has a constant amount of memory allocated which is set by SQL Server configuration parameters min server memory (MB) = max server memory (MB)
RANGE SQL Server dynamically allocates memory between min server memory (MB) lt gt max server memory (MB)
AUTO SQL Server dynamically allocates memory between 4 MB and 2 PB which is set by min server memory (MB) = 0 and max server memory (MB) = 2147483647
FIXED-AWE SQL Server has a constant amount of memory allocated which is set by min server memory (MB) = max server memory (MB) In addition the address windowing extension functionality of Windows 2000 is enabled
934 Monitoring Database (DB2)
Procedure
To get an overview of the overall buffer pool usage catalog and package cache information go to
transaction ST04 choose Performance Database section Buffer Pool (or section Cache respectively)
1 1
1 2
1 3
1 5
1 4
gt 6h
gt 98
SAP NETWEAVER 71 AND HIGHER PERFORMANCE CHECK GUIDE
96
Buffer Pools Number Number of buffer pools configured in this system
Buffer Pools Total Size The total size of all configured buffer pools in KB If more than one buffer pool is used choose Performance Buffer Pools to get the size and buffer quality for every single buffer pool
Overall buffer quality This represents the ratio of physical reads to logical reads of all buffer pools
Data hit ratio In addition to overall buffer quality you can use the data hit ratio to monitor the database (data logical reads - data physical reads) (data logical reads) 100
Index hit ratio In addition to overall buffer quality you can use the index hit ratio to monitor the database (index logical reads - index physical reads) (index logical reads) 100
Data or Index logical reads The total number of read requests for data or index pages that went through the buffer pool
Data or Index physical reads The total number of read requests that required IO to place data or index pages in the buffer pool
Data synchronous reads or writes Read or write requests performed by db2agents
SAP NETWEAVER 71 AND HIGHER PERFORMANCE CHECK GUIDE
97
Catalog cache size Maximum size of the catalog cache that is used to maintain the most frequently accessed sections of the catalog
Catalog cache quality Ratio of catalog entries (inserts) to reused catalog entries (lookups)
Catalog cache overflows Number of times that an insert in the catalog cache failed because the catalog cache was full (increase catalog cache size)
Package cache size Maximum size of the package cache that is used to maintain the most frequently accessed sections of the package
Package cache quality Ratio of package entries (inserts) to reused package entries (lookups)
Package cache overflows Number of times that an insert in the package cache failed because the package cache was full (increase package cache size)
935 Monitoring Database (MaxDB SAP DB)
Procedure
As with the other database types call transaction ST04 to display the most important performance
parameters
SAP NETWEAVER 71 AND HIGHER PERFORMANCE CHECK GUIDE
98
With the Database Performance Monitor (transaction ST04) and its submonitors the CCMS in the SAP R3
System allows you to view in the SAP R3 System all of the information that can be used to identify
bottleneck situations
The SQL Statements section provides information about the number of SQL statements executed and related sizes
The IO Activity section lists physical and logical read and write accesses to the database
The Lock Activity section (in transaction ST04) allows you to identify possible bottlenecks in the assignment of locks by the database
The Logging Activity section combines information about the log area
The Scan and sort activity section can be helpful in identifying that suitable indexes are missing
The Cache Activity section provides information about the usage of the caches and the associated hit rates
o The data cache Hit rate should be 99 in a balanced system If this is not the case you need to check if the low hit rate is due to the size of the data cache being too small or due to an unsuitable SQL statement If necessary you can increase the data cache by increasing the MaxDB parameter Data_Cache_Size (lower than 74) or Cache_Size (74 or higher)
o The catalog cache hit rate should be 85 in a balanced system It is not a cause for concern if the catalog hit rate is temporarily lower since accesses to the system tables and an active command monitor can temporarily impair the hit rate If the catalog cache is busy the pages are paged out in the data cache rather than on the hard disk
o Log entries are not written directly to the log volume but first into a buffer (LOG_IO_QUEUE) so as to be able to write several log entries together asynchronously with one IO on the hard disk Only once a LOG_IO_QUEUE page is full is it written to the hard disk However there are situations in which you need to write LOG entries from the LOG_QUEUE onto the hard disk as quickly as possible for example if transactions are completed (COMMITROLLBACK) The transactions wait until the log writer reports the OK informing them that the log entry is on the hard disk Firstly this means that is important to use the quickest possible hard disks for the log volume(s) and secondly you must ensure that no LOG_QUEUE_OVERFLOWS occur in production operation If the LOG_IO_QUEUE is full then all transactions that want to write LOG entries must wait until free memory becomes available again in the LOG_IO_QUEUE At LOG_QUEUE_OVERFOLWS (Transaction DB50 -gt Current Status -gt Activities Overview -gt LOG_IO_QUEUE Overflow) you need to increase the LOG_IO_QUEUE parameter
SAP NETWEAVER 71 AND HIGHER PERFORMANCE CHECK GUIDE
99
o In accordance with Note 819324 - FAQ MaxDB SQL optimization check which SQL statements are responsible for the most disk accesses and whether they can be optimized You should also optimize SQL statements that have a poor runtime and poor selectivity
Bottleneck Analysis
The Bottleneck Analysis function is available in transaction ST04 under the Problem Analyzes
Performance Database Analyzer Bottlenecks You can use this function to activate the corresponding
analysis tool dbanalyzer
The dbanalyzer then collects important performance data every 15 minutes and evaluates this for possible
bottlenecks
The result of the bottleneck analysis is output in text format to provide a quick overview of possible causes of
performance problems For a more detailed description of the bottleneck messages see the online
documentation (httphelpsapcom) in the SAP Web Application Server area and search for SAP DB
bottleneck analysis messages
The dbanalyzer tool can also be started at operating system level It logs its analysis results in files with date
stamps in the subdirectory ltrundirectorygtanalyzer (you can find the actual directory by double-clicking on
lsquoPropertiesrsquo in DB50) of the relevant database instance
94 Monitoring Database Tables
Some of the tables of SAP PI grow very quickly and can cause severe performance problems if archiving or
deletion does not take place frequently For troubleshooting see SAP Note 872388 ndash Troubleshooting
Archiving and Deletion in PI
Procedure
Log on to your Integration Server and call transaction SE16 Enter the table names as listed below and execute In the following screen simply press the button ldquoNumber of Entriesrdquo The most important tables are SXMSPMAST (cleaned up by XML message archivingdeletion)
If you use the switch procedure you have to check SXMSPMAST2 as well
SXMSCLUR SXMSCLUP (cleaned up by XML message archivingdeletion)
If you use the switch procedure you have to check SXMSPCLUR2 and SXMSCLUP2 as well
SAP NETWEAVER 71 AND HIGHER PERFORMANCE CHECK GUIDE
100
SXMSPHIST (cleaned up by the deletion of history entries)
If you use the switch procedure you have to check SXMSPHIST2 as well
SXMSPFRAWH and SXMSPFRAWD (cleaned up by the performance jobs see SAP Note 820622 ndash Standard Jobs for XI Performance Monitoring)
SWFRXI (cleaned up by specific jobs see SAP Note 874708 - BPE HT Deleting Message Persistence Data in SWFRXI)
SWWWIHEAD (cleaned up by work item archivingdeletion)
Use an appropriate database tool for example SQLPLUS for Oracle for the database tables of the J2EE schema Main tables that could be affected of growth
PI Message tables BC_MSG and BC_MSG_AUDIT (when audit log persistence is enabled)
PI message logging information when stagingloging is used BC_MSG_LOG_VERSION
XI IDoc tables (if IDoc persistence is activated) XI_IDOC_IN_MSG and XI_IDCO_OUT_MSG
Check for all tables if the number of entries is reasonably small or remains roughly constant over a period of time If that is not the case check your archivingdeletion setup
SAP NETWEAVER 71 AND HIGHER PERFORMANCE CHECK GUIDE
101
10 TRACES LOGS AND MONITORING DECREASING PERFORMANCE
101 Integration Engine
There are three important locations for the configuration of tracing logging in the Integration Engine The
pipeline settings of PI itself the Internet Communication Manager (ICM) and the gateway All three are
heavily involved in message processing and therefore their tracing or logging settings can have an impact on
performance On top of this you might have changed the SM59 RFC destinations and have switched on the
trace in order to analyze a problem If so then this needs to be reset as well
Procedure
Start transaction SXMB_ADM and navigate to Integration Engine Configuration Specific Configuration and search for the following entries
Category Parameter Subparameter Current Value Default
RUNTIME TRACE_LEVEL ltnonegt ltyour valuegt 1
RUNTIME LOGGING ltnonegt ltyour valuegt 0
RUNTIME LOGGING_SYNC ltnonegt ltyour valuegt 0
Set the above parameters back to the default value which is the recommended value by SAP
Start transaction SMICM and check the value of the Trace Level that is displayed in the overview
(third line) Set the trace level to lsquo1rsquo if not already the case You can do so by navigating to Goto Trace Level Set
Start transaction SMGW navigate to Goto Parameters Display and check the parameter Trace Level Set the trace level to lsquo1rsquo if not already the case You can do so by navigating to Goto Trace Gateway Reduce Level (or Increase Level respectively)
Start transaction SM59 and search the following RFC destination for the flag ldquoTracerdquo on the tab Special Options and remove the Flag ldquoTracerdquo if it has been set
AI_RUNTIME_JCOSERVER
AI_DIRECTORY_JCOSERVER
LCRSAPRFC
SAPSLDAPI It is possible that other RFC destinations are used for sending out IDocs and similar
SAP NETWEAVER 71 AND HIGHER PERFORMANCE CHECK GUIDE
102
102 Business Process Engine
You only have to check the Event Trace in the Business Process Engine
Procedure
Call transaction SWELS and check if the Event Trace is switched on The recommended setting is lsquooffrsquo (as shown in the screenshot below)
103 Adapter Framework
Since the Adapter Framework runs on the J2EE Engine the tracing and logging can be conveniently
checked and controlled using NetWeaver Administrator To improve the performance SAP recommends that
you set all trace levels to default Higher trace levels are only acceptable in productive usage during problem
analysis Below you will find a description on how to set the default trace level for all locations at once It is of
possible to do it for every location separately but this way you might forget to reset one of the locations
Procedure
Start the NetWeaver Administrator and navigate to Problem Management (or Troubleshooting in NW 73 and higher) Logs and Traces and choose Log Configuration In the Show drop down list box choose Tracing Locations Select the Root Location in the tree and press the button Default Configuration This will set the default configuration for all locations
Start the NetWeaver Administrator and navigate to Troubleshooting Logviewer (direct link nwalinks) Open the View ldquoDeveloper Tracerdquo and check if you have very frequent reoccurring exceptions that fill up the trace Analyze the exception and check what is causing this (eg a wrong configuration of a Communication Channel causing repeated traces If you see very frequent errors for which you cannot find the root cause open a customer incident at SAP
SAP NETWEAVER 71 AND HIGHER PERFORMANCE CHECK GUIDE
103
An aggregated view of Java exceptions (by number date instance server node etc) are reported and available in SAP Solution Manager Root Cause Analysis Exception Analysis functionality
1031 Persistence of Audit Log information in PI 710 and higher
With SAP NetWeaver PI 71 the audit log is not persisted for successful messages in the database by default
to avoid performance overhead Therefore the audit log is only available in the cache for a limited period of
time (based on the overall message volume)
Audit log persistence can be activated temporarily for performance troubleshooting where audit log
information is required To do so use the NWA and change the parameter
ldquomessagingauditLogmemoryCacherdquo to false in service XPI Service Messaging System by setting the
parameter to false Details can be found in SAP Note 1314974 - PI 71 AF Messaging System audit log
persistence Only do so temporarily during the time of troubleshooting to avoid any performance problems
from the additional persistence
After implementing Note 1611347 - New data columns in Message Monitoring additional information like
message processing time in ms and server node is visible in the message monitor
SAP NETWEAVER 71 AND HIGHER PERFORMANCE CHECK GUIDE
104
11 ERRORS AS SOURCE OF PERFORMANCE PROBLEMS
If errors occur within messages or within technical components of the SAP Process Integration then this can
have a severe impact on the overall performance Thus to solve performance problems it is sometimes
necessary to analyze the log files of technical components and to search for messages with errors To
search for messages with errors use the PI Admin Check which is available using SAP Note 884865 - PIXI
Admin Check
Procedure
ICM (Internet Communication Manager)
Start transaction SMICM open the log file (Shift + F5 or GoTo Trace File Show All) and check for errors
Gateway
Start transaction SMGW open the Log File (CTRL + Shift + F10 or Goto Trace Gateway Display File) and check for errors
System Log
Start transaction SM21 choose an appropriate time interval and search the log entries for errors Repeat the procedure for remote systems if you are using dialog instances
ABAP Runtime Errors
Start transaction ST22 choose an appropriate time interval and search for PI-related dumps In general the number of ABAP dumps should be very small on a PI system and therefore all occurring dumps should be analyzed
Alerts CCMS
Start transaction RZ20 and search for recent alerts
Work Process and RFC trace
In the PI work directory check all files which begin with dev_rfc or dev_w for errors
J2EE Engine
In the PI work directory search for errors in file dev_server0out If you are using more than one J2EE server node check dev_serverltngtout as well
Applications running on the J2EE Engine
The traces for application-related errors are the defaulttrc files located in j2eeclusterserverltngtlog directory To monitor exceptions across multiple server nodes the best tool to use is the LogViewer service of the NWA This is available via Problem Management Logs and Traces and choose Log Viewer Search for exceptions in the area of the performance problem for example the PI Messaging system
SAP NETWEAVER 71 AND HIGHER PERFORMANCE CHECK GUIDE
105
APPENDIX A
A1 Wily Introscope Transaction Trace
As mentioned above the Wily Transaction trace can be used to trace expensive steps that were noticed
during the mapping or module processing The transaction trace will allow you to drill down further into Java
performance problems and to distinguish if it is a pure coding problem or caused by a look-up to a remote
system or a slow connection to the local database
The Wily Transaction trace can be used to trace all steps that exceed a specific duration on the Java stack If
a user is known (for example for SAP Enterprise Portal) the tracing can be restricted to a specific user In PI
if you encounter a module that lasts several seconds then you can restrict the tracing as shown below
Note Starting the Transaction Trace increases the data collection on the satellite system (PI) and is
therefore only recommended in productive environment for troubleshooting purposes
With the selection above the trace will run for 10 minutes (this is the maximum and it can be canceled earlier)
and will trace all steps exceeding 3 seconds for the agents of the PI system If such long-running steps are
found then a new window will be displayed listing these steps
In the screenshot below you can see the result in the Trace View The Trace View shows the elapsed time
from left to rightndash in the example below around 48 seconds From top to bottom we can see the call stack of
the thread In general we are interested in long-running threads on the bottom of the trace view A long-
running block at the bottom means that this is the lowest level coding that was instrumented and which is
consuming all the time
In the example below we see a mapping call that is performing many individual database statements ndash this
will become visible by highlighting the lowest level In such a case you have to review the coding of the
mapping to see if the high amount of database calls can be summarized in one call
SAP NETWEAVER 71 AND HIGHER PERFORMANCE CHECK GUIDE
106
Another case that is often seen is that a lookup using JDBC to a remote database or RFC to an ABAP
system takes a long time in the mapping or adapter module In such a case there will be one long block at
the bottom of the transaction trace that also gives you some details about the statement that was executed
A2 XPI inspector for troubleshooting and performance analysis
The XPI Inspector is an additional tool that provides enhanced logging and tracing capabilities with a main
focus on troubleshooting But the tool can also be used for troubleshooting of performance issues
General information about the tool can be found at Note 1514898 - XPI Inspector for troubleshooting PI The
tool can be called using the following URL on your system httphostjava-portxpi_inspector
To analyze performance problems typically the example ldquo51 ndash ldquoPerformance Problem)rdquo is used As a basic
measurement it allows you to take multiple thread dumps in specific time intervals These thread dumps can
be analyzed later by your administrators or SAP support to identify what is causing the problem The Thread
Dump Viewer tool (TDV) from Note 1020246 - Thread Dump Viewer for SAP Java Engine can be used to
analyze the produced thread dumps (inside the results archive that can be downloaded to your local PC)
SAP NETWEAVER 71 AND HIGHER PERFORMANCE CHECK GUIDE
107
In addition the tool allows you to do JVM profiling be either doing JVM Performance tracing or JVM Memory
Allocation tracing This can help to understand in detail which steps of the processing are taking a long time
As output the tool provides prf files that can be loaded into the JVM Profiler More information can be found
at httpwikiscnsapcomwikidisplayASJAVAJava+Profiling Please Note that these traces (especially the
memory profiling) will cause a high overhead on the J2EE engine and are therefore not recommended to be
used in production Instead it is advisable to reproduce the problem on your QA system and use the tool
there
Document Version 30 March 2014
wwwsapcom
copy 2014 SAP AG All rights reserved
SAP R3 SAP NetWeaver Duet PartnerEdge ByDesign SAP
BusinessObjects Explorer StreamWork SAP HANA and other SAP
products and services mentioned herein as well as their respective
logos are trademarks or registered trademarks of SAP AG in Germany
and other countries
Business Objects and the Business Objects logo BusinessObjects
Crystal Reports Crystal Decisions Web Intelligence Xcelsius and
other Business Objects products and services mentioned herein as
well as their respective logos are trademarks or registered trademarks
of Business Objects Software Ltd Business Objects is an SAP
company
Sybase and Adaptive Server iAnywhere Sybase 365 SQL
Anywhere and other Sybase products and services mentioned herein
as well as their respective logos are trademarks or registered
trademarks of Sybase Inc Sybase is an SAP company
Crossgate mgic EDDY B2B 360deg and B2B 360deg Services are
registered trademarks of Crossgate AG in Germany and other
countries Crossgate is an SAP company
All other product and service names mentioned are the trademarks of
their respective companies Data contained in this document serves
informational purposes only National product specifications may vary
These materials are subject to change without notice These materials
are provided by SAP AG and its affiliated companies (SAP Group)
for informational purposes only without representation or warranty of
any kind and SAP Group shall not be liable for errors or omissions
with respect to the materials The only warranties for SAP Group
products and services are those that are set forth in the express
warranty statements accompanying such products and services if
any Nothing herein should be construed as constituting an additional
warranty
wwwsapcom
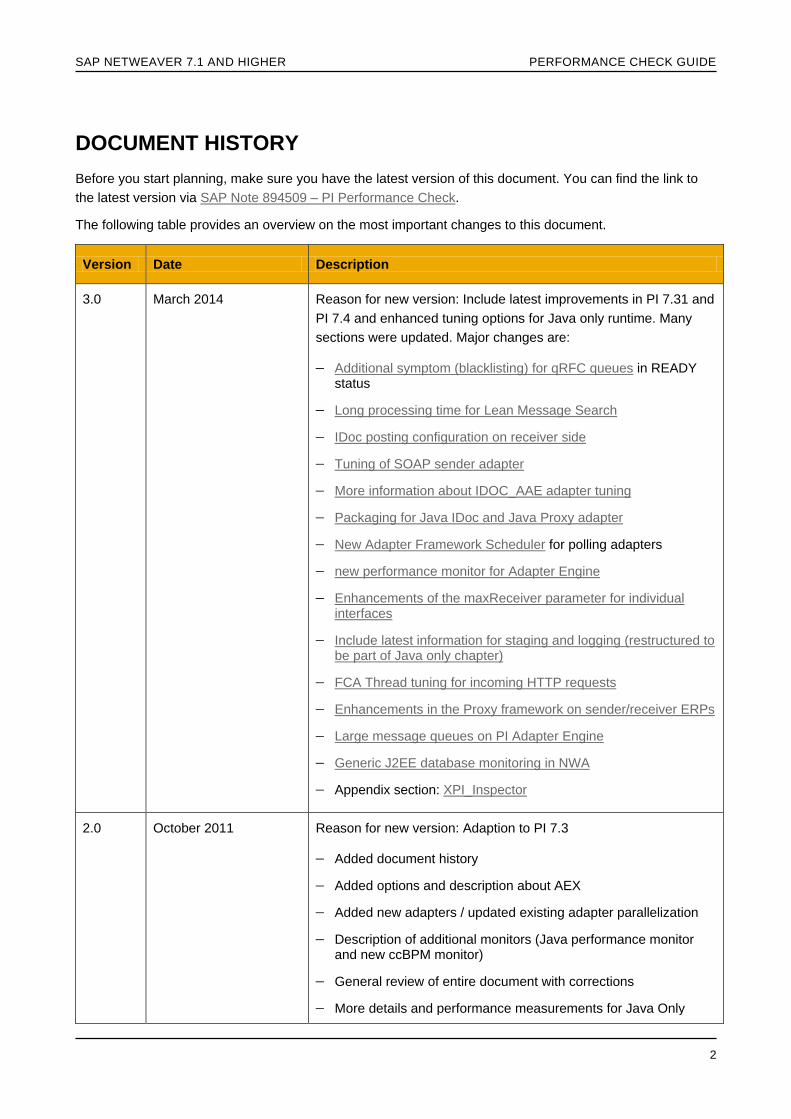
SAP NETWEAVER 71 AND HIGHER PERFORMANCE CHECK GUIDE
2
DOCUMENT HISTORY
Before you start planning make sure you have the latest version of this document You can find the link to
the latest version via SAP Note 894509 ndash PI Performance Check
The following table provides an overview on the most important changes to this document
Version Date Description
30 March 2014 Reason for new version Include latest improvements in PI 731 and
PI 74 and enhanced tuning options for Java only runtime Many
sections were updated Major changes are
Additional symptom (blacklisting) for qRFC queues in READY status
Long processing time for Lean Message Search
IDoc posting configuration on receiver side
Tuning of SOAP sender adapter
More information about IDOC_AAE adapter tuning
Packaging for Java IDoc and Java Proxy adapter
New Adapter Framework Scheduler for polling adapters
new performance monitor for Adapter Engine
Enhancements of the maxReceiver parameter for individual interfaces
Include latest information for staging and logging (restructured to be part of Java only chapter)
FCA Thread tuning for incoming HTTP requests
Enhancements in the Proxy framework on senderreceiver ERPs
Large message queues on PI Adapter Engine
Generic J2EE database monitoring in NWA
Appendix section XPI_Inspector
20 October 2011 Reason for new version Adaption to PI 73
Added document history
Added options and description about AEX
Added new adapters updated existing adapter parallelization
Description of additional monitors (Java performance monitor and new ccBPM monitor)
General review of entire document with corrections
More details and performance measurements for Java Only
SAP NETWEAVER 71 AND HIGHER PERFORMANCE CHECK GUIDE
3
(ICO) scenarios
Additional new chapters
Prevent blocking of EO queues
Avoid uneven backlogs with queue balancing
Reduce the number of EOIO queues
Adapter Framework Scheduler
Avoid blocking of Java only scenarios
J2EE HTTP load balancing
Persistence of Audit Log information in PI 710 and higher
Logging Staging on the AAE (PI 73 and higher)
11 December 2009 Reason for new version Adaption to PI 71
General review of entire document with corrections
Additional new chapters
Tuning the IDoc adapter
Message Prioritization on the ABAP stack
Prioritization in the Messaging System
Avoid blocking caused by single slowhanging receiver interface
Performance of Module Processing
Advanced Adapter Engine Integrated Configuration
ABAP Proxy system tuning
Wily Transaction Trace
10 October 2007 Initial document version released for XI 30 and PI 70
SAP NETWEAVER 71 AND HIGHER PERFORMANCE CHECK GUIDE
4
TABLE OF CONTENTS
1 INTRODUCTION 6
2 WORKING WITH THIS DOCUMENT 10
3 DETERMINING THE BOTTLENECK 12 31 Integration Engine Processing Time 12 32 Adapter Engine Processing Time 13 321 Adapter Engine Performance monitor in PI 731 and higher 15 33 Processing Time in the Business Process Engine 16
4 ANALYZING THE INTEGRATION ENGINE 20 41 Work Process Overview (SM50SM66) 21 42 qRFC Resources (SARFC) 22 43 Parallelization of PI qRFC Queues 23 44 Analyzing the runtime of PI pipeline steps 29 441 Long Processing Times for ldquoPLSRV_RECEIVER_ DETERMINATIONrdquo PLSRV_INTERFACE_DETERMINATION 30 442 Long Processing Times for ldquoPLSRV_MAPPING_REQUESTrdquo 30 443 Long Processing Times for ldquoPLSRV_CALL_ADAPTERrdquo 33 444 Long Processing Times for ldquoDB_ENTRY_QUEUEINGrdquo 34 445 Long Processing Times for ldquoDB_SPLITTER_QUEUEINGrdquo 34 446 Long Processing Times for ldquoLMS_EXTRACTIONrdquo 36 447 Other step performed in the ABAP pipeline 36 45 PI Message Packaging for Integration Engine 37 46 Prevent blocking of EO queues 38 47 Avoid uneven backlogs with queue balancing 38 48 Reduce the number of parallel EOIO queues 40 49 Tuning the ABAP IDoc Adapter 41 491 ABAP basis tuning 41 492 Packaging on sender and receiver side 42 493 Configuration of IDoc posting on receiver side 42 410 Message Prioritization on the ABAP Stack 44
5 ANALYZING THE BUSINESS PROCESS ENGINE (BPE) 45 51 Work Process Overview 45 52 Duration of Integration Process Steps 45 53 Advanced Analysis Load Created by the Business Process Engine (ST03N) 47 54 Database Reorganization 47 55 Queuing and ccBPM (or increasing Parallelism for ccBPM Processes) 48 56 Message Packaging in BPE 48
6 ANALYZING THE (ADVANCED) ADAPTER ENGINE 50 61 Adapter Performance Problem 51 611 Adapter Parallelism 51 612 Sender Adapter 54 613 Receiver Adapter 55 614 IDoc_AAE adapter tuning 56 615 Packaging for Proxy (SOAP in XI 30 protocol) and Java IDoc adapter 56 616 Adapter Framework Scheduler 58 62 Messaging System Bottleneck 60 621 Messaging System in between AFW Sender Adapter and Integration Server (Outbound) 63 622 Messaging System in Between Integration Server and AFW Receiver Adapter (Inbound) 64 623 Interface Prioritization in the Messaging System 64 624 Avoid Blocking Caused by Single SlowHanging Receiver Interface 65 625 Overhead based on interface pattern being used 67 63 Performance of Module Processing 68 64 Java only scenarios Integrated Configuration objects 69
SAP NETWEAVER 71 AND HIGHER PERFORMANCE CHECK GUIDE
5
641 General performance gain when using Java only scenarios 69 642 Message Flow of Java only scenarios 71 643 Avoid blocking of Java only scenarios 73 644 Logging Staging on the AAE (PI 73 and higher) 73 65 J2EE HTTP load balancing 75 66 J2EE Engine Bottleneck 76 661 Java Memory 76 662 Java System and Application Threads 80 663 FCA Server Threads 83 664 Switch Off VMC 84
7 ABAP PROXY SYSTEM TUNING 85 71 New enhancements in Proxy queuing 86
8 MESSAGE SIZE AS SOURCE OF PERFORMANCE PROBLEMS 87 81 Large message queues on PI ABAP 88 82 Large message queues on PI Adapter Engine 88
9 GENERAL HARDWARE BOTTLENECK 90 91 Monitoring CPU Capacity 90 92 Monitoring Memory and Paging Activity 91 93 Monitoring the Database 91 931 Generic J2EE database monitoring in NWA 92 932 Monitoring Database (Oracle) 93 933 Monitoring Database (MS SQL) 94 934 Monitoring Database (DB2) 95 935 Monitoring Database (MaxDB SAP DB) 97 94 Monitoring Database Tables 99
10 TRACES LOGS AND MONITORING DECREASING PERFORMANCE 101 101 Integration Engine 101 102 Business Process Engine 102 103 Adapter Framework 102 1031 Persistence of Audit Log information in PI 710 and higher 103
11 ERRORS AS SOURCE OF PERFORMANCE PROBLEMS 104
APPENDIX A 105 A1 Wily Introscope Transaction Trace 105 A2 XPI inspector for troubleshooting and performance analysis 106
SAP NETWEAVER 71 AND HIGHER PERFORMANCE CHECK GUIDE
6
1 INTRODUCTION
SAP NetWeaver Process Integration (PI) consists of the following functional components Integration Builder
(including Enterprise Service Repository (ESR) Service Registry (SR) and Integration Directory) Integration
Server (including Integration Engine Business Process Engine and Adapter Engine) Runtime Workbench
(RWB) and System Landscape Directory (SLD) The SLD in contrast to the other components may not
necessarily be part of the PI system in your system landscape because it is used by several SAP NetWeaver
products (however it will be accessed by the PI system regularly) Additional components in your PI
landscape might be the Partner Connectivity Kit (PCK) a J2SE Adapter Engine one or several non-central
Advanced Adapter Engines or an Advanced Adapter Engine Extended An overview is given in the graphic
below The communication and accessibility of these components can be checked using the PI Readiness
Check (SAP Note 817920)
Processing at runtime is carried out by the Integration Server (IS) with the aid of the SLD The IS in this
graphic stands for the Web Application Server 70 or higher In the classic environment PI is installed as a
double stack an ABAP and a Java stack (J2EE Engine) The ABAP stack is responsible for pipeline
processing in the Integration Engine (Receiver Determination Interface Determination and so on) and the
processing of integration processes in the Business Process Engine Every message has to pass through
the ABAP stack The Java stack executes the mapping of messages (with the exception of ABAP mappings)
and hosts the Adapter Framework (AFW) The Adapter Framework contains all XI adapters except the plain
HTTP WSRM and IDoc adapters
SAP NETWEAVER 71 AND HIGHER PERFORMANCE CHECK GUIDE
7
With 71 the so called Advanced Adapter Engine (AAE) was introduced The Adapter Engine was enhanced
to provide additional routing and mapping call functionality so that it is possible to process messages locally
This means that a message that is handled by a sender and receiver adapter based on J2EE does not need
to be forwarded to the ABAP Integration Engine This saves a lot of internal communication reduces the
response time and significantly increases the overall throughput The deployment options and the message
flow for 71 based systems and higher are shown below Currently not all the functionalities available in the
PI ABAP stack are available on the AAE but each new PI release closes the gap further
In SAP PI 73 and higher the Adapter Engine Extended (AEX) was introduced In addition to the AAE the
Adapter Engine Extended also allows local configuration of the PI objects The AEX can therefore be seen
as a complete PI installation running on Java only From the runtime perspective no major differences can be
seen compared to the AAE and therefore no differentiation is made in this guide
SAP NETWEAVER 71 AND HIGHER PERFORMANCE CHECK GUIDE
8
Looking at the different involved components we get a first impression of where a performance problem
might be located In the Integration Engine itself in the Business Process Engine or in one of the Advanced
Adapter Engines (central non-central plain PCK) Of course a performance problem could also occur
anywhere in between for example in the network or around a firewall Note that there is a separation
between a performance issue ldquoin PIrdquo and a performance issue in any attached systems If viewed ldquothrough
the eyesrdquo of a message (that is from the point of view of the message flow) then the PI system technically
starts as soon as the message enters an adapter or (if HTTP communication is used) as soon as the
message enters the pipeline of the Integration Engine Any delay prior to this must be handled by the
sending system The PI system technically ends as soon as the message reaches the target system for
example a given receiver adapter (or in case of HTTP communication the pipeline of the Integration Server)
has received the success message of the receiver Any delay after this point in time must be analyzed in the
receiving system
There are generally two types of performance problems The first is a more general statement that the PI
system is slow and has a low performance level or does not reach the expected throughput The second is
typically connected to a specific interface failing to meet the business expectation with regard to the
processing time The layout of this check is based on the latter First you should try to determine the
component that is responsible for the long processing time or the component that needs the highest absolute
time for processing Once this has been clarified there is a set of transactions that will help you to analyze
the origin of the performance problem
If the recommendations given in this guide are not sufficient SAP can help you to optimize the service via
SAP consulting or SAP MaxAttention services SAP might also handle smaller problems restricted to a
specific interface if you describe your problem in a SAP customer incident Support offerings like ldquoSAP
Going Live Analysis (GA)rdquo and ldquoSAP Going Live Verification (GV)rdquo can be used to ensure that the main
system parameters are configured according to SAP best practice You can order any type of service using
SAP Service Marketplace or your local SAP contacts
If you have already worked with the PI Admin Check (SAP Note 884865) you will recognize some of the
transactions This is because SAP considers the regular checking of the performance to be an important
administrational task However this check tries to show the methodology to approach performance problems
to its reader Also it offers the most common reasons for performance problems and links to possible follow-
up actions but does not refer to any regular administrational transactions
SAP NETWEAVER 71 AND HIGHER PERFORMANCE CHECK GUIDE
9
Wily Introscope is a prerequisite for analyzing performance problems at the Java side It allows you to
monitor the resource usage of multiple J2EE server nodes and provides information about all the important
components on the Java stack like mapping runtime messaging system or module processor Furthermore
the data collected by Wily is stored for several days so it is still possible to analyze a performance problem at
a later date Wily Introscope is provided free-of-charge for SAP customers It is delivered as part of Solution
Manager Diagnostics but can also be installed separately For more information see
httpservicesapcomdiagnostics or SAP Note 797147
SAP NETWEAVER 71 AND HIGHER PERFORMANCE CHECK GUIDE
10
2 WORKING WITH THIS DOCUMENT
If you are experiencing performance problems on your Process Integration system start with Chapter 3
Determining the Bottleneck It helps you to determine the processing time for the different runtimes within PI
Integration Engine Business Process Engine and Adapter Engine or connected Proxy System Once you
have identified the area in which the bottleneck is most probably located continue with the relevant chapter
This is not always easy to do because a long processing time is not always an indication for a bottleneck It
can make sense to do this if a complicated step is involved (Business Process Engine) if an extensive
mapping is to be executed (IS) or if the payload is quite large (all runtimes) For this reason you need to
compare the value that you retrieve from Chapter 3 with values that you have received previously for
example The history data provided for the Java components by Wily Introscope is a big help If this is not
possible you will have to work with a hypothesis
Once the area of concern has been identified (or your first assumption leads you there) Chapters 4 5 6
and 7 will help you to analyze the Integration Engine the Business Process Engine the PI Adapter
Framework and the ABAP Proxy runtime
After (or preferably during) the analysis of the different process components it is important to keep in mind
that the bottlenecks you have observed could also be caused by other interfaces processing at the same
time It will lead you to slightly different conclusions and tuning measures You therefore have to distinguish
the following cases based on where the problem occurs
A with regard to the interface itself that is it occurs even if a single message of this interface is processed
B or with regard to the volume of this interface that is many messages of this interface are processed at the same time
C or with regard to the overall message volume processed on PI
This can be analyzed by repeating the procedure of Chapter 3 for A) a single message that is processed
while no other messages of this interface are processed and while no other interfaces are running Then
compare this value with B) the processing time for a typical amount of messages of this interface not simply
one message as before If the values of measurement A) and B) are similar repeat the procedure with C) a
typical volume of all interfaces that is during a representative timeframe on your productive PI system or
with the help of a tailored volume test
These three measurements ndash A) processing time of a single message B) processing time of a typical
amount of messages of a single interface and C) processing time of a typical amount of messages of all
interfaces ndash should enable you to distinguish between the three possible situations
o A specific interface has long processing steps that need to be identified and improved The tuning options are usually limited and a re-design of the interface might be required
o The mass processing of an interface leads to high processing times This situation typically calls for tuning measures
o The long processing time is a result of the overall load on the system This situation can be solved by tuning measures and by taking advantage of PI features for example to establish separation of interfaces If the bottleneck is hardware-related it could also require a re-sizing of the hardware that is used
SAP NETWEAVER 71 AND HIGHER PERFORMANCE CHECK GUIDE
11
Chapters 8 9 10 and 11 deal with more general reasons for bad performance such as heavy
tracinglogging error situations and general hardware problems They should be taken into account if the
reason for slow processing cannot be found easily or if situation C from above applies (long processing times
due to a high overall load)
Important
Chapter 9 provides the basic checks for the hardware of the PI server It should not only be used when
analyzing a hardware bottleneck due to a high overall load andor an insufficient sizing but should also be
used after every change made to the configuration of PI to ensure that the hardware is able to handle the
new situation This is important because a classical PI system uses three runtime engines (IS BPE AFW)
Tuning one engine for high throughput might have a direct impact on the others With every tuning action
applied you have to be aware of the consequences on the other runtimes or the available hardware
resources
SAP NETWEAVER 71 AND HIGHER PERFORMANCE CHECK GUIDE
12
3 DETERMINING THE BOTTLENECK
The total processing time in PI consists of the processing time in the Integration Server processing time in
the Business Process Engine (if ccBPM is used) as well as the processing time in the Adapter Framework (if
adapters except IDoc plain HTTP or ABAP proxies are used) In the subsequent chapters you will find a
detailed description of how to obtain these processing times
For reasons of completeness we will also have a look at the ABAP Proxy runtime and the available
performance evaluations
31 Integration Engine Processing Time
You can use an aggregated view of the performance (details about activation in Note 820622 - Standard jobs
for XI performance monitoring) data for the Integration Engine as shown below
Procedure
Log on to your Integration Engine and call transaction SXMB_IFR In the browser window follow the link to
the Runtime Workbench In there click ldquoPerformance Monitoringrdquo Change the display to ldquoDetailed Data
Aggregatedrdquo select lsquoISrsquo as the Data Source (or lsquoPMIrsquo if you have configured the Process Monitoring
Infrastructurersquo) and ldquoXIIntegrationServerltyour_hostgtrdquo as the component Then choose an appropriate time
interval for example the last day You have to enter the details of the specific interface you want to monitor
here
The interesting value is the ldquoProcessing Time [s]rdquo in the fifth column It is the sum of the processing time of the single steps in the Integration Server For now you are not interested in the single steps that are listed on the right side since you are still trying to find out the part of the PI system where the most time is lost Chapter 44 will work with the individual steps
SAP NETWEAVER 71 AND HIGHER PERFORMANCE CHECK GUIDE
13
If you do not know which interface is affected yet you first have to get an overview Instead of navigating to
Detailed Data Aggregated in the Runtime Workbench choose Overview Aggregated Use the button Display
Options and check the options for sender component receiver component sender interface and receiver
interface Check the processing times as described above
32 Adapter Engine Processing Time
Procedure
Log on to your Integration Server and call transaction SXMB_IFR In the browser window follow the link to
the Runtime Workbench In there click Message Monitoring choose Adapter Engine lthostgt from Database
from the drop down lists and press Display Enter your interface details and ldquoStartrdquo the selection Select one
message using the radio button and press Details
Calculate the difference between the start and end timestamp indicated on the screen
Do the above calculation for the outbound (AFW IS) as well as the inbound (IS AFW) messages
The audit log of successful message is no longer persisted in SAP NetWeaver PI 71 by default in order to minimize the load on the database The audit log has a high impact on the database load since it usually consists of many rows that are inserted individually in the database In newer releases therefore a cache was implemented that keeps the audit log information for a period of time only Thus no detailed information is available any longer from a historical point of view Instead you should use Wily Introscope for historical analyses of the performance of successful messages
The audit log can be persisted on the database to allow historical analysis of performance problems
on the Java stack To do so change the parameter ldquomessagingauditLogmemoryCacherdquo from
true to false for service ldquoXPI Service Messaging Systemrdquo using NetWeaver Administrator (NWA) as described in SAP Note 1314974 Note Only do this temporarily if you have identified the bottleneck on the AFW First try using Wily to determine the root cause of the problem
SAP NETWEAVER 71 AND HIGHER PERFORMANCE CHECK GUIDE
14
Due to above mentioned limitations Wily Introscope is the right tool for performance analysis of the Adapter Engine Wily persists the most important steps like queuing module processing and average response time in historical dashboards (aggregated data per intervals for all server nodes of a system or all systems with filters possible etc)
SAP NETWEAVER 71 AND HIGHER PERFORMANCE CHECK GUIDE
15
Especially for Java-Only runtime using Integrated Configuration Wily shows the complete processing time after the initial sender adapter steps (receiver determination mapping and time in the backend call) as can be seen in the Message Processing Time dashboard below
Using the ldquoShow Minimum and Maximumrdquo functionality deviations from the average processing time can be seen In the example below a message processing step takes up to 22 seconds The reason for this could either be a slow mapping or a delay in the call to the receiver system (in the example below Java IDoc adapter is used to transfer the data to ERP)
In case of high processing times in one of your steps further analysis might be required using thread dumps or the Java Profiler as outlined in the appendix section A2 XPI inspector for troubleshooting and performance analysis
321 Adapter Engine Performance monitor in PI 731 and higher
Starting from PI 731 SP4 there is a new performance monitor available for the Adapter Engine More
information on the activation of the performance monitor can be found at Note 1636215 ndash Performance
Monitoring for the Adapter Engine Similar to the ABAP monitor in the RWB the data is displayed in an
aggregated format On the PI start page use the link ldquoConfiguration and Monitoring Homerdquo Go to ldquoAdapter
Enginerdquo and select ldquoPerformance Monitorrdquo The data is persisted on an hourly basis for the last 24 hours and
on a daily basis for the last 7 days The data is further grouped on interface level and per Java server node
With the information provided you can therefore see the minimum maximum and average response time of
an individual interface on a specific Java server node All individual steps of the message processing like
time spent in the Messaging System queues or Adapter modules are listed In the example below you can
SAP NETWEAVER 71 AND HIGHER PERFORMANCE CHECK GUIDE
16
see that most of the time (5 seconds) is spent in a module called SimpleWaitModule This would be the entry
point for the further analysis
Starting with 731 SP10 (740 SP05) this data can be exported to excel in two ways Overview or Detailed (details in SAP Note 1886761)
33 Processing Time in the Business Process Engine
Procedure
Log on to your integration server and call transaction SXMB_MONI Adjust your selection in a way that you
select one or more messages of the respective interface Once the messages are listed navigate to the
Outbound column (or Inbound if your integration process is the sender) and click on PE Alternatively you
can select the radio button for ldquoProcess Viewrdquo on the entranceselection screen of SXMB_MONI
To judge the performance of an integration process it is essential to understand the steps that are executed A long-running integration process in itself is not critical because it can wait for a trigger event or can include a synchronous call to a backend Therefore it is important to understand the steps that are included before analyzing an individual workflow log For example the screenshot below shows a long waiting time after the mapping This is perhaps due to an integrated wait step
Calculate the time difference between the first and the last entry Note that this time for the workflow does not include the duration of RFC calls for example To see this processing time navigate to the ldquoList with Technical Detailsrdquo (second button from the left on the screenshot below or shift + F9) Repeat this step for several messages to get an overview about the most time consuming steps
Please Note that the processing time mentioned above does not include the waiting time of the messages in the ccBPM queues Therefore it is essential to monitor a queue backlog in ccBPM queues as discussed in section ldquoQueuing and ccBPM (or increasing Parallelism for ccBPM Processes)rdquo
SAP NETWEAVER 71 AND HIGHER PERFORMANCE CHECK GUIDE
17
Via transaction SWI2_DURA you can display an aggregated performance overview across all ccBPM
processes running on your PI system In the initial screen you have to choose ldquo(Sub-) Workflow and the time
range you would like to look at
SAP NETWEAVER 71 AND HIGHER PERFORMANCE CHECK GUIDE
18
The results here allow you to compare the average performance of a process It shows you the processing
time based on barriers The 50 barrier means that 50 of the messages were processed faster than the
value specified Furthermore you also see a comparison of the processing time to eg the day before By
adjusting the selection criteria of the transaction you can therefore get a good overview about the normal
processing time of the Integration process and can judge if there is a general performance problem or just a
temporary one
The number of process instances per integration process can be easily checked via transaction
SWI2_FREQ The data shown allows you to check the volume of the Integration Processes and allow you to
judge if your performance problem is caused by an increase of volume which could cause a higher latency in
the ccBPM queues
New in PI 73 and higher
Starting from PI 73 a new monitoring for ccBPM processes is available This monitor can be started from
transaction SXMB_MONI_BPE Integration Process Monitoring (also available in ldquoConfiguration and
Monitoring Homerdquo on PI start page) This is new browser based view that allows a simplified and aggregated
view on the PI Integration Processes
On the initial screen you get an overview about all the Integration Processes executed in the selected time
interval Therefore you can immediately see the volume of each Integration Process
From there you can navigate to the Integration process facing the performance issues and look at the
individual process instances and the start and end time Furthermore there is a direct entry point to see the
PI messages that are assigned to this process
SAP NETWEAVER 71 AND HIGHER PERFORMANCE CHECK GUIDE
19
Choosing one special process instance ID you will see the time spend in each individual processing step
within the process In the example below you can see that most of the time is spend in the Wait Step
SAP NETWEAVER 71 AND HIGHER PERFORMANCE CHECK GUIDE
20
4 ANALYZING THE INTEGRATION ENGINE
If chapter Determining the Bottleneck has shown that the bottleneck is clearly in the Integration Engine there
are several transactions that can help you to analyze the reason for this To understand why this selection of
transactions helps to analyze the problem it is important to know that the processing within the Integration
Engine is done within the pipeline The central pipeline of the Integration Server executes the following main
steps
Central Pipeline Steps Description of Central Pipeline Steps
PLSRV_XML_VALIDATION_RQ_INB XML Validation Inbound Channel Request
PLSRV_RECEIVER_DETERMINATION Receiver Determination
PLSRV_INTERFACE_DETERMINATION Interface Determination
PLSRV_RECEIVER_MESSAGE_SPLIT Branching of Messages
PLSRV_MAPPING_REQUEST Mapping
PLSRV_OUTBOUND_BINDING Technical Routing
PLSRV_XML_VALIDATION_RQ_OUT XML Validation Outbound Channel Request
PLSRV_CALL_ADAPTER Transfer to Respective Adapter IDoc HTTP Proxy AFW
PLSRV_XML_VALIDATION_RS_INBXML Validation Inbound Channel Response
PLSRV_MAPPING_RESPONSE Response Message Mapping
PLSRV_XML_VALIDATION_RS_OUT Validation Outbound Channel Response
The last three steps highlighted in bold are available in case of synchronous messages only and reflect the
time spent in the mapping of the synchronous response message
The steps indicated in red are new in SAP NetWeaver PI 71 and higher and can be used to validate the
payload of a PI message against an XML schema These steps are optional and can be executed at different
times in the PI pipeline processing for example before and after a mapping (as shown above)
With PI 731 an additional option of using an external Virus Scan during PI message processing can be
activated as described in the Online Help The Virus Scan can be configured on multiple steps in the pipeline
ndash eg after the mapping (Virus Scan Outbound Channel Request) when receiving a synchronous response
(Virus Scan Inbound Channel Response) and after the response mapping (Virus Scan Outbound Channel
Response)
It is important to know is that these pipeline steps are executed based on qRFC Logical Unit of Work (LUW)
by using dialog work processes
SAP NETWEAVER 71 AND HIGHER PERFORMANCE CHECK GUIDE
21
With 711 and higher versions you can activate the Lean Message Search (LMS) to be able to search for
payload content This is described in more detail in chapter Long Processing Times for
ldquoLMS_EXTRACTIONrdquo
41 Work Process Overview (SM50SM66)
The work process overview is the central transaction to get an overview of the current processes running in
the Integration Engine For message processing PI is only using Dialog work processes (DIA WP) Therefore
it is essential to ensure that enough DIA WPs available
The process overview is only a snapshot analysis You therefore have to refresh the data multiple times to
get a feeling for the dynamics of the processes The most important questions to be asked are as follows
How many work processes are being used on average Use the CPU Time (clock symbol) to check that not all DIA WPs are used In case all DIA WPs have a high CPU time this indicates a WP bottleneck
Which users are using these processes It depends on the usage of your PI system All asynchronous messages are processed by the QIN scheduler who will start the message processing in DIA WPs The user that is shown in SM66 will be the one that triggered the QIN scheduler This can eg be a communication user for a connected backend (usually a copy of PIAPPLUSER) or the user used to send data from the Adapter Engine (per default PIAFUSER)
Activities related to the Business Process Engine (ccBPM) will be indicated by user WF-BATCH If you see high WF-BATCH activity take a look at chapter 51
Are there any long running processes and if so what are these processes doing with regard to the reports used and the tables accessed
o As a rule of thumb for the initial configuration the number of DIA work processes should be around six times the value of CPU in your PI system (rdispwp_no_dia = 6 to 8 times CPUs cores based on SAP Note 1375656 - SAP NetWeaver PI System Parameters)
If you would like to get an overview for an extended period of time without actually refreshing the transaction
at regular intervals use report SDFMON and schedule the Daily Monitoring It allows you to collect metrics
such as CPU usage amount of free Dialog work processes and most importantly a snapshot of the work
process activity as provided in transactions SM50 and SM66 The frequency for the data collection can be as
low as 10 seconds and the data can be viewed after the configurable timeframe of the analysis Note
SDFMON is only intended for analysis of performance issues and should only be scheduled for a limited
period of time
If you have Solution Manager Diagnostics installed and all the agents connected to PI you can also monitor
the ABAP resource usage using Wily Introscope As you can see in the dashboard below you can use it to
monitor the number of free work processes (prerequisite is that the SMD agent is running on the PI system)
The major advantage of Wily Introscope is that this information is also available from the past and allows
analysis after the problem has occurred in the system
SAP NETWEAVER 71 AND HIGHER PERFORMANCE CHECK GUIDE
22
42 qRFC Resources (SARFC)
Depending on the configuration of the RFC server group not all dialog work processes can be used for
qRFC processing in the Integration Server As stated earlier all (ABAP based) asynchronous messages are
processed using qRFC Therefore tuning the RFC layer is one of the most important tasks to achieve good
PI performance
In case you have a high volume of (usually runtime critical) synchronous scenarios you have to ensure that
enough DIA WPs are kept free by the asynchronous interfaces running at the same time Since this is a very
difficult tuning exercise we usually recommend implementing runtime critical synchronous interfaces using
Java only configuration (ICO) whenever possible If this is not possible you have to ensure via SARFC tuning
that enough work processes are kept free to process the synchronous messages
The current resource situation in the system can be monitored using transaction SARFC
Procedure
First check which application servers can be used for qRFC inbound processing by checking the AS Group
assigned in transaction SMQR
Call transaction SARFC and refresh several times since the values are only snapshot values
Is the value for ldquoMax Resourcesrdquo close to your overall number of dialog work processes Max Resources is a fixed value and describes how many DIA work processes may be used for RFC communication If the value is too low your RFC parameters need tuning to provide the Integration Server with enough resource for the pipeline processing The RFC parameters can be displayed by double-clicking on ldquoServer Namerdquo
o A good starting point is to set the values as follows
Max no of logons = 90
Max disp of own logons = 90
Max no of WPs used = 90
Max wait time = 5
Min no of free WP = 3-10 (depending on the size of the application server)
These values are specified in SAP Note 1375656 ndash SAP NetWeaver PI System Parameters (this parameter must be increased if you plan to have synchronous interfaces) To avoid any bottleneck and blocking situation free DIA WPs should always be available The value should be adjusted based on the overall number of DIA WPs available at the system and the above requirements
SAP NETWEAVER 71 AND HIGHER PERFORMANCE CHECK GUIDE
23
Note You have to set the parameters using the SAP instance profile Otherwise the changes are lost
after the server is restarted
The field ldquoResourcesrdquo shows the number of DIA WPs available for RFC processing Is this value reasonably high for example above zero all the time If the ldquoResourcesrdquo value is zero then the Integration Server cannot process XML messages because no dialog work process is free to execute the necessary qRFC There are several conclusions that can be drawn from this observation as follows
1) Depending on the CPU usage (see Chapter ldquoMonitoring CPU Capacityrdquo) it might be necessary at this time to increase the number of dialog work processes in your system If the CPU usage however is already very high increasing the number of DIA will not solve the bottleneck
2) Depending on the number of concurrent PI queues (see Chapter qRFC Queues (SMQ2)) it might be necessary to decrease the degree of parallelism in your Integration Server because the resources are obviously not sufficient to handle the load The next section describes how to tune PI inbound and outbound queues
The data provided in SARFC is also collected and shown in a graphical and historical way using Solution
Manager Diagnostic and Wily Introscope (as can be seen in the screenshot below) This allows easy
monitoring of the RFC resources across all available PI application servers
43 Parallelization of PI qRFC Queues
The qRFC inbound queues on the ABAP stack are one of the most important areas in PI tuning Therefore it
is essential to understand the PI queuing concept
PI generally uses two types of queues for message processing ndash PI inbound and PI outbound queues Both
types are technical qRFC inbound queues and can therefore be monitored using SMQ2 PI inbound queues
are named XBTI (EO) or XBQI (EOIO) and are shared between all interfaces running on PI by default The
PI outbound queues are named XBTO (EO) and XBQO (EOIO) The queue suffix (in red XBTO0___0004)
specifies the receiver business system This way PI is using dedicated outbound queues for each receiver
SAP NETWEAVER 71 AND HIGHER PERFORMANCE CHECK GUIDE
24
system All interfaces belonging to the same receiver business system are contained in the same outbound
queue Furthermore there are dedicated queues for prioritization of separation of large messages To get an
overview about the available queues use SXMB_ADM Manage Queues
PI inbound and outbound queues execute different pipeline steps
PI Inbound Queues
Pipeline Steps Description of Pipeline Steps
PLSRV_XML_VALIDATION_RQ_INB XML Validation Inbound Channel Request
PLSRV_RECEIVER_DETERMINATION Receiver Determination
PLSRV_INTERFACE_DETERMINATION Interface Determination
PLSRV_RECEIVER_MESSAGE_SPLIT Branching of Messages
PI Outbound Queues
Pipeline Steps Description of Pipeline Steps
PLSRV_MAPPING_REQUEST Mapping
PLSRV_OUTBOUND_BINDING Technical Routing
PLSRV_XML_VALIDATION_RQ_OUT XML Validation Outbound Channel Request
PLSRV_CALL_ADAPTER Transfer to Respective Adapter IDoc HTTP Proxy AFW
Before the steps above are executed the messages are placed in a qRFC queue (SMQ2) The messages
will wait till they are first in queue and till a free DIA work process is assigned to a queue The wait time in the
queue are recorded in the performance header in DB_ENTRY_QUEUING (PI inbound queue) and
DB_SPLITTER_QUEUING (PI outbound queue) Most often you will see the long processing times there as
discussed in chapter Long Processing Times for ldquoDB_ENTRY_QUEUEINGrdquo and Long Processing Times for
ldquoDB_SPLITTER_QUEUEINGrdquo
Looking at the steps above it is clear that tuning the queues will have a direct impact on the connected PI
components and also backend systems For example by increasing the number of parallel outbound queues
more mappings will be executed in parallel which will in turn put a greater load on the Java stack or more
messages will be forwarded in parallel to the backend system in case of a Proxy call Thus when tuning PI
queues you must always keep the implications for the connected systems in mind
The tuning of PI ABAP queue parameters is done in transaction SXMB_ADM Integration Engine
Configuration and by selecting the category TUNING
For productive usage we always recommend to use inbound and outbound queues (parameter
EO_INBOUND_TO_OUTBOUND=1) Otherwise only inbound queues will be used which are shared across
SAP NETWEAVER 71 AND HIGHER PERFORMANCE CHECK GUIDE
25
all interfaces Hence a problem with one single backend system will affect all interfaces running on the
system
The principle of less is sometimes more also applies for tuning the number of parallel PI queues Increasing
the number of parallel queues will result in more parallel queues with fewer entries per queue In theory this
should result in a lower latency if enough DIA WPs are available
But practically this is not true for high volume systems The main reason for this is the overhead involved in
the reloading of queues (see details below) Furthermore important tuning measures like PI packaging (see
Chapter ldquoPI Message Packagingrdquo) aim to increase the throughput based on a higher number of messages in
the queue Thus from a throughput perspective it is definitely advisable to configure fewer queues
If you have very high runtime requirements you should prioritize these interfaces and assign a different
parallelism for high priority queues only This can be done using parameters
EO_INBOUND_PARALLEL_HIGH_PRIO and EO_OUTBOUND_PARALLEL_HIGH_PRIO as described in
section ldquoMessage Prioritization on the ABAP Stackrdquo
To tune the parallelism of inbound and outbound queues the relevant parameters are
EO_INBOUND_PARALLEL and EO_OUTBOUND_PARALLEL have to be used
Below you can see a screenshot of SMQ2 You can see the PI inbound queues and outbound queues Also
ccBPM queues (XBQO$PE) are displayed and will be discussed in section 5
Procedure
Log on to your Integration Server call transaction SMQ2 and execute If you are running ABAP proxies on a
separate client on the same system enter lsquorsquo for the client Transaction SMQ2 provides snapshots only and
must therefore be refreshed several times to get viable information
o The first value to check is the number of queues concurrently active over a period of time Since each queue needs a dialog work process to be worked on the number of concurrent queues must not be too high compared to the number of dialog work processes usable for RFC communication (see Chapter qRFC Resources (SARFC)) The optimum throughput can be achieved if the number of active queues is equal to or slightly higher than the number of dialog work processes (provided that the number of DIA work processes can be handled by the CPU of the system see transaction ST06)
In case many of the queues are EOIO queues (eg because the serialization is done on the material number) try to reduce the queues by following Chapter EOIO tuning
o The second value of importance is the number of entries per queue Hit refresh a few times to check if the numbers increasedecreaseremain the same An increase of entries for all queues or a specific
SAP NETWEAVER 71 AND HIGHER PERFORMANCE CHECK GUIDE
26
queue points to a bottleneck or a general problem on the system The conclusion that can be drawn from this is not simple Possible reasons have been found to include
1) A slow step in a specific interface
Bad processing time of a single message or a whole interface can be caused by expensive processing steps as for example the mapping step or receiver determination This can be confirmed by looking at the processing time for each step as shown in ldquoAnalyzing the runtime of pipeline stepsrdquo
2) Backlog in Queues
Check if inbound or outbound queues face a backlog A backlog in a queue is generally nothing critical since the queues ensure that the PI components as well as the backend systems are not overloaded For instance batch triggered interfaces are usually causing high backlogs that get processed over time Only in case the backlog prevents you to meet the business requirements for an interface this should be analyzed
If the backlog is caused by a high volume of messages arriving in a short period of time one solution to minimize the backlog is to increase the number of queues available for this interface (if sufficient hardware is available) If one interface is having a backlog in the outbound queues you could eg specify EO_OUTBOUND_PARALLEL with a sub parameter specifying your interface to increase the parallelism for this interface
But in general a backlog can also be caused by a long processing time in one of the pipeline steps as discussed in 1) or a performance problem with one of the connected components like PI Java stack or connected backend systems Due to the steps performed in the outbound queues (mapping or call adapter) it is more likely that a backlog will be seen in the outbound queues Inbound queue processing is only expensive if Content Based Routing or Extended Receiver Determination is used To understand which step is taking long follow once more chapter ldquoAnalyzing the runtime of pipeline stepsrdquo
In addition to tuning of the number of inbound and outbound queues also ldquoMessage Prioritization on the ABAP Stackrdquo and ldquoPI Message Packagingrdquo can help
The screenshot below shows such a backlog situation in Wily Introscope Please Note that the information about the queues is only collected by Wily in 5 minutes intervals explaining the gaps between the measurement points On the dashboard ldquoTotal qRFC Inbound Queue Entriesrdquo you can see that the number of messages in SMQ2 is increasing The number of inbound queues does not increase at the same time It also offers a dashboard for the number of entries by queue name and the time entries remain in SMQ2 With the information provided here it is also possible to distinguish a blocking situation or a general resource problem after the problem is no longer present in the system
SAP NETWEAVER 71 AND HIGHER PERFORMANCE CHECK GUIDE
27
3) Queues stay in status READY in SMQ2
To see the status of the queues use the filter button in SMQ2 as shown below
It is a normal situation to see many queues in READY status for a limited amount of time The reason for this is the way the QIN scheduler reloads LUWs (see point 2 below) A waiting time of up to 5 seconds per queuing step is considered normal during normal load situation (even if there is no backlog in the queue and enough resources are available) If you observe a situation where many queues are in READY status for longer period of time the following situations can apply
A resource bottleneck with regard to RFC resources Confirm by following section qRFC Resources (SARFC)
To avoid overloading a system with RFC load the QIN scheduler only reloads new queues after a certain amount of queues have finished processing This can lead to long waiting times in the queues as explained in SAP Note 1115861 - Behaviour of Inbound Scheduler after Resource Bottleneck Since PI is a non-user system we recommend setting rfcinb_sched_resource_threshold to 3 as described in SAP Note 1375656 ndash SAP NetWeaver PI System Parameters
Long DB loading times for RFC tables If using Oracle ensure that SAP Note 1020260 - Delivery of Oracle statistics is applied
Additional overhead during the pipeline executions occurs due to PI internal mechanisms Per default a lock is set during processing of each message This is no longer necessary and should
SAP NETWEAVER 71 AND HIGHER PERFORMANCE CHECK GUIDE
28
be switched off by setting the parameter LOCK_MESSAGE of category RUNTIME to 0 as described in SAP Note 1058915 In addition during the processing of an individual message the message repeatedly calls an enqueue which leads to a deterioration of the throughput This can be avoided by setting parameter CACHE_ENQUEUE to 0 as described in SAP Note 1366904
Sometimes a queue stays in READY status for a very long time while other queues are getting processed fine After manual unlocking the queue is processed but then stops after some time again A potential reason is described in Note 1500048 - SMQ2 inbound Queue remains in READY state In a PI environment queues in status RUNNING for more than 30 minutes usually happen due to one individual step taking long (as discussed in step 1) or a problem on the infrastructure (eg memory problems on Java or HTTP 200 lost on network) After 30 minutes the QIN scheduler removes this queue from the scheduling and therefore it remains in READY To solve such cases the root cause for the blocking has to be understood
4) Queue in READY status due to queue blacklisting
If a queue is for a very long time in status RUNNING (eg due to a problem with a mapping or due to a very slow backend) it is possible that the QIN scheduler excludes this queue from queue scheduling Hence the queue stays in status READY even though enough work processes are available The ldquoblacklistingrdquo of queues takes place when the runtime of a queue exceeds the ldquoMonitoring thresholdrdquo configured on this queue Notes 1500048 - queues stay in ready (schedule_monitor) and Note 1745298 - SMQR Inbound queue scheduler identify excluded entries provide more input on this topic The screenshot below shows a setting of 2400 seconds (40 minutes) for this parameter
Check if a queue stays in READY status for a long time while others are processing without any issue Ensure Note 1745298 is implemented and check the system log for the following exception ldquoQINEXCLUDE ltqueue namegt lttimedate at which the queue scheduler startedgt If this is the case check why the long runtime occurs (see section Analyzing the runtime of PI pipeline steps) or increase the schedule_monitor in exceptional cases only (if eg the runtime of an individual processing step cannot be improved further)
5) An error situation is blocking one or more queues
Click the Alarm Bell (Change View) push button once to see only queues with error status Errors delay the queue processing within the Integration Server and may decrease the throughput if for example multiple retries occur Navigate to the first entry of the queue and analyze the problem by forward navigation to the relevant message in SXMB_MONI
Often you see EO queues in SYSFAIL or RETRY due to the problems during the processing of an individual message This can be prevented by following the description of Chapter Prevent blocking of EO queues
SAP NETWEAVER 71 AND HIGHER PERFORMANCE CHECK GUIDE
29
44 Analyzing the runtime of PI pipeline steps
The duration of the pipeline steps is the ultimate answer to long processing times in the Integration Engine
since it describes exactly how much time was spent at which point The recommended way to retrieve the
duration of the pipeline steps is the RWB and will be described below Advanced users may use the
Performance Header of the SOAP message using transaction SXMB_MONI but the timestamps are not
easy to read If you still prefer the latter method here is the explanation 20110409092656165 must be read
as yyyymmddhh(min)(min)(sec)(sec)(microseconds) that is the timestamp corresponds to April 9 2011 at
092656 and 165 microseconds Please note that these timestamps in Performance Header of
SXI_MONITOR transaction are stored and displayed in UTC time therefore conversion to system time must
be done when analyzing them
In case PI message packaging is configured the performance header will always reflect the processing time
per package Hence a duration of 50 seconds does not mean a single message took 50 seconds but
eventually the package contained 100 messages so that every message took 05 ms More details about
this can be found in section PI Message Packaging
Procedure
Log on to your Integration Server and call transaction SXMB_IFR In the browser window follow the link to
the Runtime Workbench In there click Performance Monitoring Change the display to Detailed Data
Aggregated and choose an appropriate time interval for example the last day For this selection you have to
enter the details of the specific interface you want to monitor
You will now see in the lowerndashpart of the screen a split of the processing time into single steps Check the time difference between the steps Does any step take longer than expected In the example in the screenshot below the DB_ENTRY_QUEUEING starts after 0032 seconds and ends after 0243 seconds which means it took 0211 seconds (211ms)
SAP NETWEAVER 71 AND HIGHER PERFORMANCE CHECK GUIDE
30
Compare the processing times for the single steps for different measurements as outlined in Chapter
Pipeline Steps (SXMB_MONI or RWB) For example is a single step only long if many messages
are processed or if a single message is processed This helps you to decide if the problem is a
general design problem (single message has long processing step) or if it is related to the message
volume (only for a high number of messages this process step has large values)
Each step has different follow-up actions that are described next
441 Long Processing Times for ldquoPLSRV_RECEIVER_ DETERMINATIONrdquo PLSRV_INTERFACE_DETERMINATION
Steps that can take a long time in inbound processing are the Receiver and Interface Determination In these
steps the receiver system and interface is calculated Normally this is very fast but PI offers the possibility of
enhanced receiver determinations In these cases the calculation is based on the payload of a message
There are different implementation options
o Content-Based Routing (CBR)
CBR allows defining XPath expressions that are evaluated during runtime These expressions can be combined by logical operators for example to check the value for multiple fields The processing time of such a request directly correlates to the number and complexity of the conditions defined
No tuning options exist for the system in regard to CBR The performance of this step can only be changed by reducing the number of rules by changing the design of the interfaces Another option is to use an extended receiver determination (executing a mapping program) since this is faster than CBR using many rules
o Mapping to determine Receivers
A standard PI mapping (ABAP Java XSLT) can also be used to determine the receiver If you observe high runtimes in such a receiver determination follow the steps outlined in the next section since the same mapping runtime is used
442 Long Processing Times for ldquoPLSRV_MAPPING_REQUESTrdquo
Before analyzing the mapping you must understand which runtime is used Mappings can be implemented
in ABAP as graphical mappings in the Enterprise Service Builder as self-developed Java mappings or
XSLT mappings One interface can also be configured to use a sequence of mappings executed
sequentially In such a case analysis is more difficult because it is not clear which mapping in the sequence
is taking a long time
Normal debugging and tracing tools (transaction ST12) can be used for mappings executed in ABAP Any
type of mapping can be tested from ABAP using transaction SXI_MAPPING_TEST Knowing
senderreceiver partyserviceinterfacenamespace and source message payload it is possible to check the
target message (after mapping execution) and detailed trace output (similar to contents of trace of the
message in SXMB_MONI with TRACE_LEVEL = 3) It can also be used for debugging at runtime by using
the standard debugging functionality
For ABAP based XSLT mappings it is also possible via transaction XSLT_TOOL to test trace and debug
XSLT transformations on the ABAP stack
In general the mapping response time is heavily influenced by the complexity of the mapping and the
message size Therefore to analyze a performance problem in the mapping environment you should
compare the mapping runtime during the time of the problem with values reported several days earlier to get
a better understanding
SAP NETWEAVER 71 AND HIGHER PERFORMANCE CHECK GUIDE
31
If no AAE is used the starting point of a mapping is the Integration Engine that will send the request by RFC
destination AI_RUNTIME_JCOSERVER to the gateway There it will be picked up by a registered server
program The registered server program belongs to the J2EE Engine The request will be forwarded to the
J2EE Engine by a JCo call and then executed by the Java runtime When the mapping has been executed
the result is sent back to the ABAP pipeline There are therefore multiple places to check when trying to
determine why the mapping step took so long
Before analyzing the mapping runtime of the PI system check if only one interface is affected or if you face a
long mapping runtime for different interfaces To do so check the mapping runtime of messages being
processed at the same time in the system
The best tool for such an analysis is Wily Introscope which offers a dashboard for all mappings being
executed at a given time Each line in the dashboard represents one mapping and shows the average
response time and the number of invocations
In the screenshot below you can see that many different mapping steps have required around 500 seconds
for processing Comparing the data during the incident with the data from the day before will allow you to
judge if this might be a problem of the underlying J2EE engine as described in section J2EE Engine
Bottleneck
If there is only one mapping that faces performance problems there would be just one line sticking out in the
Wily graphs If you face a general problem that affects different interfaces you can choose a longer
timeframe that allows you to compare the processing times in a different time period and verify if it is only a
ldquotemporaryrdquo issue ndash this would for example indicate an overload of the mapping runtime
If you have found out that only one interface is affected then it is very unlikely to be a system problem but
rather a problem in the implementation of the mapping of that specific interface
SAP NETWEAVER 71 AND HIGHER PERFORMANCE CHECK GUIDE
32
Check the message size of the mapping in the runtime header using SXMB_MONI Verify if the message size is larger than usual (which would explain the longer runtime)
There can also be one or many lookups to a remote system (using RFC or JDBC) causing the long processing time of a mapping Together with the application you then have to check if the connection to the backend is working properly Such a mapping with lookups can be analyzed using Wily Transaction Trace as explained in the appendix section Wily Transaction Trace
If not one but several interfaces are affected a potential system bottleneck occurs and this is described in
the following
o Not enough resources (registered server programs) available That could either be the case if too many mapping requests are issued at the same time or if one J2EE server node is down and has not registered any server programs
To check if there were too many mapping requests for the available registered server programs compare the number of outbound queues that are concurrently active with the number of registered server programs The number of outbound queues that are concurrently active can be monitored with transaction SMQ2 and counting queues with the names XBTO amp XBQOXB2O XBTA and XBQAXB2A (high priority) XBTZ and XBQZXB2Z (low priority) and XBTM (large messages) In addition to this you have to take into account mapping steps that are executed by synchronous messages or in a ccBPM process Mappings executed by a ccBPM process are not queued but the ccBPM process calls the mapping program directly using tRFC The number of registered server programs can be determined with transaction SMGW Goto Logged On Clients and filtering by the program (ldquoTP Namerdquo) AI_RUNTIME_ltSIDgt In general we recommend configuring 20 parallel mapping connections per server node
If the problem occurred in the past it is more difficult to determine the number of queues that are concurrently active One way is to use transaction SXMB_MONI and specify every possible outbound queue (field ldquoQueue IDrdquo) in the advanced selection criteria (Note wildcard search not available) The timeframe can be restricted in the upper-part of the advanced selection criteria Advanced users could use transaction SE16 to search directly in table SXMSPMAST using the field ldquoQUEUEINTrdquo
The other option is to use the Wily ldquoqRFC Inbound Queue Detailrdquo dashboard as described in qRFC Queue Monitoring (SMQ2)
To check if the J2EE is not available or if the server program is not registered for a different reason use transaction SM59 to test the RFC destination AI_RUNTIME_JCOSERVER If the problem occurred in the past search the gateway trace (transaction SMGW GoTo Trace Gateway Display File) and the RFC developer traces dev_rfc files available in the work directory for the string ldquoAI_RUNTIMErdquo In addition check the std_serverltngtout in the work directory for restarts of the J2EE Engine
SAP NETWEAVER 71 AND HIGHER PERFORMANCE CHECK GUIDE
33
o Depending on the checks above there are two options to resolve the bottleneck Of course if the J2EE was not available the reason for this has to be found and prevented in the future
The two options for tuning are
1) the number of outbound queues that are concurrently active and
2) the number of mapping connections from the J2EE server to the ABAP gateway
The increase of mapping connections is only recommended for strong J2EE servers since each mapping thread needs resources like CPU and Heap memory Too many mapping connections mean too many mappings being executed on the J2EE Engine In turn this might reduce the performance of other parts of the PI system for example the pipeline processing in the Integration Engine or the processing within the adapters of the AFW or can even cause out-of-memory errors on the J2EE engine Add additional J2EE server nodes to balance the parallel requests Each J2EE server node will
register new destinations at the gateway and will therefore take a part of the mapping load
Another option is to reduce the number of outbound queues that are concurrently active to solve the bottleneck This will certainly result in higher backlogs in the queue and is therefore only applicable for less runtime critical interfaces This option can be used if the backlog is caused by a master data interface with high volume but no critical processing time requirements In such a case you can only lower the number of parallel queues for this interface by using a sub-parameter of EO_OUTBOUND_PARALLEL in transaction SXMB_ADM By doing so you slow down one interface to ensure other (more critical) interfaces have sufficient resources available
o If multiple application servers configured on the PI system ensure that all the server nodes are connected to their local gateway (local bundle option) as described in the guide How To Scale PI
443 Long Processing Times for ldquoPLSRV_CALL_ADAPTERrdquo
Call adapter is the last step executed in the PI pipeline and forwards the message to the next component
along the message flow In most cases (local Adapter Engine IDoc or BPE) this is a local call The IDoc
adapter only puts the message on the tRFC layer (SM58) of the PI system so that the actual transfer of the
IDoc is not included in the performance header For ABAP Proxies plain HTTP or calls to a central or
decentral Adapter Engine an HTTP call is made so that network time can have an influence here
Looking at the processing time we have to distinguish asynchronous (EO and EOIO) and synchronous (BE)
interfaces
In asynchronous interfaces the call adapter step includes the transfer of the message by the network and
the initial steps on the receiver side (in most cases this just means persisting the message on the receiverrsquos
database) A long duration can therefore have two reasons
o Network latency For large messages of several MB in particular the network latency is an important factor (especially if the receiving ABAP proxy system is located on another continent for example) Network latency has to be checked in case of a long call adapter step In case HTTP load balancers are used they are considered as part of the network
o Insufficient resources on receiver side Enough resources must be available at the receiver side to ensure quick processing of a message For instance enough ICM threads and dialog work processes must be available in the case of an ABAP proxy system Therefore the analysis of long call adapter steps always has to include the relevant backend system
For synchronous messages (requestresponse behavior) the call adapter step also includes the processing
time on the backend to generate the response message Therefore the call adapter for synchronous
messages includes the time of the transfer of the request message the calculation of the corresponding
response message at the receiver side and the transfer back to PI Therefore the processing time to
process a request at the receiving target system for synchronous messages must always be analyzed to find
the most costly processing steps
SAP NETWEAVER 71 AND HIGHER PERFORMANCE CHECK GUIDE
34
444 Long Processing Times for ldquoDB_ENTRY_QUEUEINGrdquo
The value for DB_ENTRY_QUEUEING describes the time that a message has spent waiting in a PI inbound
queue before processing started In case of errors the time also includes the wait time for restart of the LUW
in the queue The inbound queues (XBTI XBT1 XBT9 XBTL for EO messages and XBQIXB2I
XBQ1XB21 XBQ9XB29 for EOIO messages) process the pipeline steps for the Receiver
Determination the Interface Determination and the Message Split (and optionally XML inbound validation)
Thus if the step DB_ENTRY_QUEUEING has a high value the inbound queues have to be monitored using
transactions SMQ2 and SARFC The reasons are similar as those outlined in chapter qRFC Resources
(SARFC) and qRFC Queues (SMQ2)
o Not enough resources (DIA work processes for RFC communication) available
o A backlog in the queues caused by one of the following reasons
The number of parallel inbound queues is too low to handle the incoming messages in parallel Note that a simple increase of the parameter EO_INBOUND_PARALLEL might not always be the solution (as enough work processes also have to be available to process the queues in parallel) The number of work processes is in turn restricted by the number of CPUs that are available for your system If you would like to separate critical from non-critical sender systems define a dedicated set of inbound queues by specifying a sender ID as a sub parameter of EO_INBOUND_PARALLEL For example by doing so you can separate master data interfaces from business critical interfaces Please note that the separation on inbound queues only works on Business System level and not on interface level
The inbound queues were blocked by the first LUW Use transaction SMQ2 to check if that is still the case To identify if such a situation occurred in the past use the Wily Introscope dashboard ldquoABAP System qRFC Inbound Detailldquo It is generally not easy to find the one message that is blocking the queue It might be achieved by checking RFC traces or by searching for a single message with a long pipeline processing step For EO queues there is no business reason to block the queues in case of a single message error To prevent this follow the description in section Prevent blocking of EO queues
In case you have a different runtime of the messages in the queues (eg due to complex extended Receiver Determinations) the number of messages per queue might be uneven distributed between the queues In PI 73 a new balancing option is available as discussed in Avoid uneven backlogs with queue balancing
Problems when loading the LUW by the QIN scheduler as described in qRFC Queues (SMQ2)
Note If your system uses the parameter EO_INBOUND_TO_OUTBOUND = 0 you must also read chapter
445 for analyzing the reasons EO_INBOUND_TO_OUTBOUND only determines whether inbound queues
(value lsquo0rsquo) or inbound and outbound queues (value lsquo1rsquo) are used for the pipeline processing in the integration
server Check the value with transaction SXMB_ADM Integration Engine Configuration Specific
Configuration The default value is lsquo1rsquo meaning the usage of inbound and outbound queues (the
recommended behavior)
445 Long Processing Times for ldquoDB_SPLITTER_QUEUEINGrdquo
The value for DB_SPLITTER_QUEUEING describes the time that a message has spent waiting in a PI
outbound queue until a work process was assigned In case of errors the time also includes the wait time for
the restart of the LUW in the queue
The outbound queues (XBTO XBTA XBTZ XBTM for EO messages and XBQOXB2O
XBQAXB2A XBQZXB2Z for EOIO messages) process the pipeline steps for the mapping outbound
binding and call adapter
SAP NETWEAVER 71 AND HIGHER PERFORMANCE CHECK GUIDE
35
Thus if the step DB_SPLITTER_QUEUEING has a high value the outbound queues have to be monitored
using transactions SMQ2 and SARFC The reasons are similar as outlined in chapters qRFC Resources
(SARFC) and qRFC Queues (SMQ2) or described in the section above for PI inbound queues
o Not enough resources (DIA work processes for RFC communication) available
o A backlog in the queues caused by one of the following reasons
The number of parallel outbound queues is too low to handle the outgoing messages in parallel Note that simply increasing the parameter EO_OUTBOUND_ PARALLEL might not always be the solution as enough work processes have to be available to process the queues in parallel The number of work processes in turn is limited by the number of CPUs available for the system Also the parameter EO_OUTBOUND_PARALLEL is used differently than the parameter EO_INBOUND_ PARALLEL because it determines the degree of parallelism for each receiver system Thus it is possible to increase the number of parallel outbound queues for specific receivers whereas other receivers are handled with a lower degree of parallelism Note that not every receiver backend is able to handle a high degree of parallelism so that in case of an ABAP Proxy system it might not indicate a problem on PI in case you observe a high value for DB_SPLITTER_QUEUING
The outbound queues were blocked by the first LUW To identify if such a situation occurred in the past use the Wily Introscope dashboard ldquoABAP System qRFC Inbound Detailldquo In general it is not easy to find the one message that is blocking the queue It might be achieved by checking RFC traces or by searching for a single message with a long pipeline processing step For EO queues there is no business reason to block the queues in case of a single message error To prevent this follow the description in section Prevent blocking of EO queues
Since the outbound queues include a processing step that is bound to take longer than the other steps (that is the mapping and the call adapter step) this might mean a long waiting time for all subsequent messages As an example assume that a mapping takes 1 second and that 100 messages are waiting in a queue The first message gets executed at once the second message has to wait about 1 second (a bit more since more steps are executed than just the mapping but this should be ignored at the moment) the third takes 3 seconds and so on The 100
th message
has to wait 100 seconds until it is processed that is the value for DB_SPLITTER_QUEUING is as high as 100 For a given outbound queue you would therefore see an increase for the DB_SPLITTER_QUEUING value over time If you experience this situation proceed with Chapter 442
In case you have a different runtime of the messages in the queues (eg due to different message size) the number of messages per queue might be uneven distributed between the queues In PI 73 a new balancing option is available as discussed in Avoid uneven backlogs with queue balancing
o Problems when loading the LUW by the QIN scheduler as described in qRFC Queues (SMQ2)
Note The number of parallel outbound queues is also connected with the ability of the receiving system to
process a specific amount of messages for each time unit
In section Adapter Parallelism default restrictions of the specific adapters of the J2EE Engine are explained Some adapters (JDBC File Mail) can process only one message for each server node at a time (this can be changed) It does not make sense for such adapters to have too many parallel qRFC queues since this will only move the message backlog from ABAP to Java
For messages that are directed to the IDoc outbound adapter the value for EO_OUTBOUND_PARALLEL is connected to the MAXCONN value of the corresponding outbound destination You can define the maximum number of connections using transaction SMQS ndash the default value is 10 parallel connections If applicable SAP highly recommends that you use IDoc packaging in the outbound IDoc adapter to reduce the load during the transmission of tRFC calls from the PI system to the receiving system
For ABAP proxy systems the number of outbound queues directly determines the number of messages sent in parallel to the receiving system Thus you have to ensure that the resources
SAP NETWEAVER 71 AND HIGHER PERFORMANCE CHECK GUIDE
36
available on PI are aligned with those on the sendingreceiving ABAP proxy system
446 Long Processing Times for ldquoLMS_EXTRACTIONrdquo
Lean Message Search can be configured for newer PI releases as described in the Online Help After
applying Note 1761133 - PI runtime Enhancement of performance measurement an additional header for
LMS will be written to the performance header
The header could look like this indicating that around 25 seconds were spent in the LMS analysis
When using trace level two additional timestamps are written to provide details about this overall runtime
LMS_EXTRACTION_GET_VALUES
This timestamp describes the evaluation of the message according to user-defined filter criteria
LMS_EXTRACTION_ADJUST_VALUES
This timestamp describes the post-processing of the previously found values in the BAdI (as of PI 730)
The runtime of the LMS heavily depends on the number of payload attributes to be extracted Also the
payload size and the complexity of the XPath expression has a direct impact on the performance of the LMS
In general the number of elements to be indexed should be kept at a minimum and very deep and complex
XPath expressions should be avoided
If you want to minimize the impact of LMS on the PI message processing time you can define the extraction
method to use an external job In that case the messages will be indexed after processing only and it will
therefore have no performance impact during runtime Of course this method imposes a delay in the
indexing (based on the frequency of job SXMS_EXTRACT_MESSAGES) so that newly processed
messages cannot be searched using LMS If this delay is acceptable for the monitoring responsible the
messages should be indexed using an external job
447 Other step performed in the ABAP pipeline
As discussed earlier there are additional steps in the ABAP pipeline that can be executed based on the
configuration of your scenario Per default these steps will not be activated and should therefore not
consume any time All these steps are traced in the performance header of the message Below you can see
the details for
- XML validation
SAP NETWEAVER 71 AND HIGHER PERFORMANCE CHECK GUIDE
37
- Virus Scan
In case one of these steps is taking long you have to check the configuration of your scenario In the
example of the Virus scan the problem might be related to the external virus scanner used and tuning has to
happen on that side
45 PI Message Packaging for Integration Engine
PI message packaging was introduced with SAP NetWeaver PI 70 SP13 and is per default activated in PI
71 and higher Message packaging in BPE is independent of message packaging in PI (see chapter 56)
but they can be used together
To improve performance and message throughput asynchronous messages can be assembled to packages
and processed as one entity For this the qRFC scheduler was enabled to process a set of messages (a
package) in one LUW Thus instead of sending one message to the different pipeline steps (for example
mappingrouting) a package of messages will be sent that will reduce the number of context switches that is
required Furthermore access to databases is more efficient since requests can be bundled in one database
operation Depending on the number and size of messages in the queue this procedure improves
performance considerably In return message packaging can increase the runtime for individual messages
(latency) due to the delay in the packaging process
Message packaging is only applicable for asynchronous scenarios (QoS EO and EOIO) Due to the potential
latency of individual messages packaging is not suitable for interfaces with very high runtime requirements
In general packaging has the highest benefit for interfaces with high volume and small message size
The performance improvement achieved directly relates to the number of the messages bundled in each
package Message packaging must not solely be used in the PI system Tests have shown that the
performance improvement significantly increases if message packaging is configured end-to-end - that is
from the sending system using PI to the receiving system Message packaging is mainly applicable for
application systems connected to PI by ABAP proxy
From the runtime perspective no major changes are introduced when activating packaging Messages
remain individual entities in regards to persistence and monitoring Additional transactions are introduced
allowing the monitoring of the packaging process
Messages are also treated individually for error handling If an error occurs in a message processed in a
package then the package will be disassembled and all messages will be processed as single messages Of
course in a case where many errors occur (for example due to interface design) this will reduce the benefits
of message packaging SAP systems connected to PI via ABAP Proxy can also make use of the message
packaging to reduce the HTTP calls necessary to transmit messages between the systems Other sending
and receiving applications in particular will not see any changes because they send and receive individual
messages and receive individual commits
The PI message packaging can be adapted to meet your specific needs In general the packaging is
determined by three parameters
SAP NETWEAVER 71 AND HIGHER PERFORMANCE CHECK GUIDE
38
1) Message count Maximum number of messages in a package (default 100)
2) Maximum package size Sum of all messages in kilobytes (default 1 MB)
3) Delay time Time to wait before the queue is processed if the number of messages does not reach
the message count (default 0 meaning no waiting time)
These values can be adjusted using transactions SXMS_BCONF and SXMS_BCM To better use the
performance improvements offered by packaging you could for example define a specific packaging for
interfaces with very small messages to allow up to 1000 messages for each package Another option could
be to increase the waiting time (only if latency is not critical) to create bigger packages
See SAP Note 1037176 - XI Runtime Message Packaging for more details about the necessary
prerequisites and configuration of message packaging More information is also available at
httphelpsapcom SAP NetWeaver SAP NetWeaver PIMobileIdM 71 SAP NetWeaver Process
Integration 71 Including Enhancement Package 1 SAP NetWeaver Process Integration Library
Function-Oriented View Process Integration Integration Engine Message Packaging
46 Prevent blocking of EO queues
In general messages for interfaces using Quality of Service Exactly Once are independent of each other In
case of an error in one message there is no business reason to stop the processing of other messages But
exactly this happens in case an EO queue goes into error due to an error in the processing of a single
message The queue will then be automatically retried in configurable intervals This retry will cause a delay
of all other messages in the queue which cannot be processed due to the error of the first message in the
queue
To avoid this a new error handling was introduced in SAP Notes 1298448 - XI runtime No automatic retry
for EO message processing (set EO_RETRY_AUTOMATIC = 0 and schedule restart job
RSXMB_RESTART_MESSAGES) and SAP Note 1393039 - XI runtime Dump stops XI queue After
applying this Note EO queues will not go in SYSFAIL status any longer These Notes are recommended for
all PI systems and are per default activated on PI 73 systems By specifying a receiver ID as sub parameter
this behavior can be configured for individual interfaces only
In PI 73 you can also configure the number of messages that would go into error before the whole queue
would be stopped For permanent errors (eg due to a problem with the receiving backend) the queue would
go into SYSFAIL so that not too many messages are going into error This also reduces the number of alerts
for Message Based Alerting To define the threshold the parameter EO_RETRY_AUT_COUNT can be set
The default value is 0 and indicates that the number of messages is not restricted
47 Avoid uneven backlogs with queue balancing
From PI 73 on a new mechanism is available to address the distribution of messages in queues Per default
in all PI versions the messages are getting assigned to the different queues randomly In case of different
runtimes of LUWs caused by eg different message sizes or different runtimes in mappings this can cause
an uneven distribution of messages within the different queues This can increase the latency of the
messages waiting at the end of that queue
To avoid such an unequal distribution the system checks the queue length before putting a new message in
the queue Hence it tries to achieve an equal balancing during inbound processing A queue which has a
higher backlog will get less new messages assigned Queues with fewer entries will get more messages
assigned Therefore it is different than the old BALANCING parameter of category TUNING) which was used
SAP NETWEAVER 71 AND HIGHER PERFORMANCE CHECK GUIDE
39
to rebalance messages already assigned to a queue The assignment of messages to queues is shown in
the diagram below
To activate the new queue balancing you have to set the parameters EO_QUEUE_BALANCING_READ and
EO_QUEUE_BALANCING_SELECT of category TUNING in SXMB_ADM If the value of the parameter
EO_QUEUE_BALANCING_READ is 0 (default value) then the messages are distributed randomly across
the queues that are available If however EO_QUEUE_BALANCING_READ is set to a value n greater than
zero then on average the current fill level of the queue is determined after every nth message and stored in
the shared memory of the application server This data is used as the basis for determining the queue (see
description of parameter EO_QUEUE_BALANCING_SELECT) relevant for balancing
The parameter EO_QUEUE_BALANCING_SELECT specifies the relative fill levels of the queues in percent
Relative here means in relation to the maximum filled queue If there are queues with a lower fill level than
defined here then only these are taken into consideration for distribution If all queues have a higher fill level
then all queues are taken into consideration
Please note that determining the fill level takes place using database access and therefore impacts system
performance The value of EO_QUEUE_BALANCING_READ should for this reason be oriented towards the
message throughput and specific requirements or even distribution For higher volume system a higher value
should be chosen
Letrsquos look at an example In case you set the parameter EO_QUEUE_BALANCING_READ to 1000 after
every 1000th incoming message the queue distribution will be checked This requires a database access
and can therefore cause a performance impact The fill level for each queue will then be written to shared
memory In our example we configured EO_QUEUE_BALANCING_SELECT to 20 At a given point in time
you have three outbound queues on the system XBTO__A contains 500 entries XBTO__B 150 and
XBTO__C contains 50 messages Therefore XBTO__B has a fill level of 30 and XBTO__C of 10 That
means the only queue relevant for balancing is XBTO__C which will get more messages assigned
Based on this example you can see that it is important to find the correct values As a general guideline to
minimize performance impact you should set EO_QUEUE_BALANCING_READ to a rather large value The
correct value of EO_QUEUE_BALANCING_SELECT depends on the criticality of a delay caused by a
backlog
SAP NETWEAVER 71 AND HIGHER PERFORMANCE CHECK GUIDE
40
48 Reduce the number of parallel EOIO queues
As discussed in Chapter Parallelization of PI qRFC Queues it is important to keep the number of queues
limited As a rule of thumb the number of active queues should be equal to the number of available work
processes in the system It is especially crucial to not have a lot of queues containing only one message
since this will cause a high overhead on the QIN scheduler due to very frequent reloading of the queues
Especially for EOIO queues we often see a high number of parallel queues containing only one message
The reason for this is for example that the serialization has to be done on document number to eg ensure
that updates to the same material are not transferred out of sequence Typically during a batch triggered
load of master data this can result in hundreds of EOIO queues in SMQ2 just containing only one or two
messages This is very bad from a performance point of view and will cause significant performance
degradation for all other interfaces running at the same time To overcome this situation the overall number
of EOIO queues (for all interfaces) can be limited as of PI 71 as described in Change Number of EOIO
Queues
The maximum number of queues can be set in SXMB_ADM Configure Filter for Queue Prioritization
Number of EOIO queues
During runtime a new set of queues will be used with the name XB2 as can be seen below for the outbound
queues
These queues will be shared between all EOIO interfaces for the given interface priority and by setting the
number of queues the parallelization for all EOIO interfaces is limited Thus more messages will be using the
same EOIO queue and therefore PI message packaging will work better and also the reloading of the
queues by the QIN scheduler will show much better performance
In case of errors the messages will be removed from the XB2 queues and will be moved to the standard
XBQ queues All other messages for the same serialization context will be moved to the XBQ queue
directly to ensure the serialization is maintained This means that in case of an error the shared EOIO
queues will not be blocked and messages for other serialization contexts will be not delayed
SAP NETWEAVER 71 AND HIGHER PERFORMANCE CHECK GUIDE
41
49 Tuning the ABAP IDoc Adapter
Very often the IDoc adapter deals with very high message volume and tuning of this is very essential
491 ABAP basis tuning
As stated above the IDoc adapter uses the tRFC layer to transfer messages from PI to the receiver system
The IDoc adapter will only put the message in SM58 and from there the standard tRFC layer forwards the
LUW You therefore have to ensure that sufficient resources (mainly DIA WPs) are available for processing
tRFC requests
Wily Introscope also offers a dashboard (shown below) for the tRFC layer which shows the tRFC entries and
their different statuses With these dashboards you are also able to identify history backlogs on tRFC
In order to control the resources used when sending the IDocs from sender system to PI or from PI to the
receiver backend you can also think about registering the RFC destinations in SMQS in PI as known from
standard ALE tuning By changing the Max Conn or the Max Runtime values in SMQS you can limit or
increase the number of DIA WPs used by the tRFC layer to send the IDocs for a given destination This will
mitigate the risk of system overload on sender and receiver side
SAP NETWEAVER 71 AND HIGHER PERFORMANCE CHECK GUIDE
42
492 Packaging on sender and receiver side
One option for improving the performance of messages processed with the IDoc adapter is to use IDoc
packaging
The receiver IDoc adapter in PI (for sending messages from PI to the receiving application system) already
had the option for packaging IDocs in previous releases For this messages processed in the IDoc adapter
are bundled together before being sent out to the receiving system Thus only one tRFC call is required to
send multiple IDocs The message packaging that is being discussed in section PI Message Packaging uses
a similar approach and therefore replaces the ldquooldrdquo packaging of IDocs in the receiver IDoc adapter
Therefore we highly recommend configuring Message Packaging since this helps transferring data for the
IDoc adapter as well as the ABAP Proxy
For the sender IDoc adapter there was previously the option to activate packaging in the partner profile of
the sending system in case IDocs are not send immediately but in batch By specifying the ldquoMaximum
Number of IDocsrdquo in the report RSEOUT00 multiple IDocs are bundled in one tRFC calls At the PI side
these packages will be disassembled by the IDoc adapter and the messages will be processed individually
Therefore this will help mainly to reduce the tRFC resources involved in transferring the data between the
systems but not within PI
This behavior was changed with SAP NetWeaver PI 711 and higher If the sender backend sends an IDoc
package to PI a new option has been introduced which allows the processing of IDocs as a package on PI
as well You can specify an IDoc package size on the sender IDoc Communication Channel The necessary
configuration is described in detail in the following SDN blog - IDoc Package Processing Using Sender IDoc
Adapter in PI EhP1 A significant increase in throughput was recorded for high volume interfaces with small
IDocs
493 Configuration of IDoc posting on receiver side
As described in SAP Note 1828282 - IDoc adapter long runtime XI -gt IDoc-gt ALE also the way the IDocs
are posted on the receiver ERP backend will directly influence the processing of the LUW on the PI side In
general two options exist for IDoc posting
Trigger immediately The IDoc will be posted directly when it is received For this a free dialog workprocess will be required
Trigger by background program If this option is chosen the IDoc is persisted on the ERP side and the posting of the application data will happen asynchronously using report RBDAPP01 via a background job
SAP NETWEAVER 71 AND HIGHER PERFORMANCE CHECK GUIDE
43
When ldquotrigger immediatelyrdquo is configured the sender system (PI) has to wait till the IDoc is posted While the
workprocess will roll out you will see the LUW in ldquoTransaction Executingrdquo during this time For the
IDOC_AAE the RFC connection and the java threads will be kept busy until the IDOC is posted in the
backend therefore leading to backlogs on the IDOC_AAE
The coding for posting the application data can be very complex and therefore this operation can take a long
time consuming unnecessary resources also on the sender side With background processing of the IDocs
the sender and receiver systems are decoupled from each other
Due to this we generally recommend to use ldquotrigger immediatelyrdquo in exceptional cases where the data has to
be posted without any delay In all other cases like high volume replication of master data background
processing of IDocs should be chosen
With Note 1793313 and 1855518 a third option for posting IDocs on the ERP side was introduced This
option is using bgRFC on the ERP side to queue the IDocs As soon as the configured resources for the
bgRFC destination are available the IDocs will be posted By doing so the IDocs will be posted based on
resource availability on the receiver system and no additional background jobs will be required Furthermore
storing the LUWs in bgRFC will ensure that the sender and receiver systems are decoupled This option
therefore guarantees that the IDocs will be posted as soon as possible based on the available resources on
the receiver system without the requirement to schedule many background jobs This new option is therefore
the recommended way of IDoc posting in systems that fulfill the necessary requirements
SAP NETWEAVER 71 AND HIGHER PERFORMANCE CHECK GUIDE
44
410 Message Prioritization on the ABAP Stack
A performance problem is often caused by an overload of the system for example due to a high volume
master interface If business critical interfaces with a maximum response time are running at the same time
then they might face delays due to a lack of resources Furthermore as described in qRFC Queues (SMQ2)
messages of different interfaces use the same inbound queue by default which means that critical and less-
critical messages are mixed up in the same queue
We highly recommend using message prioritization on the ABAP stack to prevent such delays for critical
interfaces (for Java see Interface Prioritization in the Messaging System )
For more information about PI prioritization see httphelpsapcom and navigate to SAP NetWeaver SAP
NetWeaver PIMobileIdM 71 SAP NetWeaver Process Integration 71 Including Enhancement Package 1
SAP NetWeaver Process Integration Library Function-Oriented View Process Integration
Integration Engine Prioritized Message Processing
To balance the available resources further between the configured interfaces you can also configure a
different parallelization level for queues with different priorities Details for this can be found in SAP Note
1333028 ndash Different Parallelization for HP Queues
SAP NETWEAVER 71 AND HIGHER PERFORMANCE CHECK GUIDE
45
5 ANALYZING THE BUSINESS PROCESS ENGINE (BPE)
This chapter helps to analyze performance problems if Chapter Determining the Bottleneck has shown that
the BPE is the slowest step for a message during its time in the PI system Of course this type of runtime
engine is very susceptible to inefficient design of the implemented integration process Information about
best practices for designing BPE processes can be found in the documentation Making Correct Use of
Integration Processes In general the memory and resource consumption is higher than for a simple pipeline
processing in the Integration Engine As outlined in the document linked above every message that is sent
to BPE and every message that is sent from BPE is duplicated In addition work items are created for the
integration process itself as well as for every step More database space is therefore required than
previously expected and more CPU time is needed for the additional steps
51 Work Process Overview
The Business Process Engine executes the steps (work items) of an integration process using tRFC calls to
the RFC destination WORKFLOW_LOCAL_ltclientgt To check if there are enough resources available to
process the work items call transaction SM50 (on each application server) while one of the integration
processes is running
o Look for the user ldquoWF-BATCHrdquo and follow its activities by refreshing the transaction
o Are there always dialog work processes available
The most important point to keep in mind here is the concurrent activity of the Business Process Engine (for
ccBPM processes) and the Integration Engine (for pipeline processing) Both runtime environments need
dialog work processes Thus performance problems in one of the engines cannot be solved by restricting
the other Rather an appropriate balance between the two runtimes has to be found
The activity of the WF-BATCH user is not restricted by default It is highly recommended that you register the
RFC destination WORKFLOW_LOCAL_ltclientgt with transaction SMQS and assign a suitable amount of
maximum connections Otherwise ccBPM activity may block the pipeline processing of the Integration
Server and reduce the throughput of PI drastically SAP Note 888279 - Regulatingdistributing the Workflow
Load gives more details
In addition it might help to use specific servers (dialog instances) to carry out a given workflow or to use load
balancing Of course both options only apply for larger PI systems that consist of at least a central instance
and one dialog instance
52 Duration of Integration Process Steps
As described in section Processing Time in the Business Process Engine with PI 73 there is a new monitor
available in ldquoConfiguration and Monitoring Homerdquo on PI start page It shows the duration of individual steps
of an integration process in a very easy way and is the now tool to analyze performance related issues on
the ccBPM
SAP NETWEAVER 71 AND HIGHER PERFORMANCE CHECK GUIDE
46
For releases prior than PI 73 check in the workflow log for long-running steps as described in the previous
chapter Use the ldquoList with Technical Detailsrdquo to do so Since the design of integration processes varies
significantly there is no general rule for the duration of a step or for specific sequences of steps Instead
you have to get a feeling for your implemented integration processes
Did a specific process step decrease in performance over a period of time
Does one specific process step stick out with regard to the other steps of the same integration process
Do you observe long durations for a transformation step (ldquomappingrdquo)
Do you observe long durations of synchronous sendreceive steps in the integration process which correlates for example to a slow response from a connected remote system
Use the SAP Notes database to learn about recommendations and hints SAP Note 857530 - BPE
Composite Note Regarding Performance acts as a central note for all performance notes and might be used
as the entry point
Once you are able to answer the above questions there are several paths to follow
o Two common reasons should be taken into consideration for a performance decrease over time Firstly the load on PI might have increased over time as well Check the hardware resources (chapter 9) and carefully monitor the work process availability (chapter 51) Alternatively the underlying databases might slow down the integration processes Use chapter 54 to check this possibility
o If it is a specific process step that sticks out the process design itself has to be reviewed The SAP Notes mentioned above might help here
o If the mapping step takes a long time it is worth having a look at chapter 442 since the BPE and the IE use the same resources (mapping connections from the ABAP gateway to the J2EE server) to execute their mapping
o If there is a long processing time for a synchronous sendreceive step check the connected backend system for any performance issues
SAP NETWEAVER 71 AND HIGHER PERFORMANCE CHECK GUIDE
47
53 Advanced Analysis Load Created by the Business Process Engine (ST03N)
Since the Business Process Engine runs on the ABAP part of the PI Integration Server you can use the
statistical data written by the dialog work processes to analyze a performance problem
Procedure
Log in to your Integration Server and call transaction ST03N Switch to ldquoExpert Moderdquo and choose the
appropriate timeframe (this could be the ldquoLast Minutersquos Loadrdquo from the Detailed Analysis menu or a specific
day or week from the Workload menu) In the Analysis View navigate to User and Settlement Statistics and
then to User Profile The user you are interested in is the WF-BATCH user who does all ccBPM-related work
Compare the total CPU Time (in seconds) to the time frame (in seconds) of the analysis In the above example an analysis time frame of 1 hour has been chosen which corresponds to 3600 seconds To be exact these 3600 seconds have to be multiplied by the number of available CPUs Out of these 3600CPU seconds the WF-BATCH user used up 36 seconds
o The above value gives you a good idea of how much load the Business Process Engine creates on your PI Integration Server By comparison with the other users (as well as the CPU utilization from transaction ST06) you can determine if the Integration Server is able to handle this load with the available number of CPUs or not This does not help you to optimize the load but it does provide support when deciding how to distribute the workload of the BPE and the workload of the Integration Server (see Chapter 51)
Experienced ABAP administrators should also analyze the database time wait time and compare these values
54 Database Reorganization
The database is accessed many times during the processing of an Integration Process This is not usually
connected with performance problems but if a specific database table is large then statements may take
longer than for small database tables
Use transaction ST05 to collect a SQL trace while the integration process in question is being executed Restrict the trace to user WF-BATCH When the integration process is finished stop the trace and view it Look for high values in the duration column especially for SELECT statements
Use transaction SE16 to determine the number of entries for the typical workflow tables SWW_WI2OBJ and SWFRXI There are many more database tables used by BPE but if the number of entries is high for the above tables they are high for the rest as well See SAP Note 872388 - Troubleshooting Archiving and Deletion in XI and the links given in this note if you find high amounts of entries
SAP NETWEAVER 71 AND HIGHER PERFORMANCE CHECK GUIDE
48
55 Queuing and ccBPM (or increasing Parallelism for ccBPM Processes)
Until recently ccBPM processes accepted messages from only one queue (one queue XBQO$PEWS for
each workflow) If there was a high message throughput for this workflow then a high backlog occurred for
these queues A couple of enhancements have therefore been implemented to improve scalability if the
ccBPM runtime
o Inbound processing without buffering
o Use of one configurable queue that can be prioritized or assigned to a dedicated server
o Use of multiple inbound queues (queue name will be XBPE_WS)
o Configure transactional behavior of ccBPM process steps to reduce number of persistency steps
Details about the configuration and tuning of the ccBPM runtime are described at
httpswwwsdnsapcomirjsdnhowtoguides SAP Netweaver 70 End-to-End Process Integration
o How to Configure Inbound Processing in ccBPM Part I Delivery Mode
o How to Configure Inbound Processing in ccBPM Part II Queue Assignment
o How to Configure ccBPM Runtime Part III Transactional Behavior of an Integration Process
Procedure
Use transaction SMQ2 to check if the queues of type XBQO$PE show a high backlog
o Based on this information verify if the ccBPM process is suitable to run with multiple queues This is especially the case for collect patterns realized in BPE If you can use multiple queues configure the workflow based on the above guides
56 Message Packaging in BPE
Inbound processing takes up the most amount of processing time in many scenarios within BPE
Message packaging in BPE helps to improve performance by delivering multiple messages to BPE process
instances in one transaction This can lead to an increased throughput which means that the number of
messages that can be processed in a specific amount of time can increase significantly Message packaging
can also increase the runtime for individual messages (latency) due to the delay in the packaging process
The sending of packages can be triggered when the packages exceed a certain number of messages a
specific package size (in kB) or a maximum waiting time The extent of the performance improvement that
can be obtained depends on the type of scenario Scenarios with the following prerequisites are generally
most suitable
o Many messages are received for each process instance
o Messages that are sent to a process instance arrive together in a short period of time
o Generally high load on the process type
o Messages do not have to be delivered immediately
For example collect scenarios are particularly suitable for message packaging The higher the number of
messages is in a package the higher the potential performance improvements will be
Tests that have been performed have shown a high potential for throughput improvements up to factor 47 in
tested Collect Scenarios depending on the packaging size that has been configured For more details about
the functionality of Message Packaging in BPE and its configuration see SAP Note 1058623 - BPE
Message Packaging
SAP NETWEAVER 71 AND HIGHER PERFORMANCE CHECK GUIDE
49
Message packaging in BPE is independent of message packaging in PI (see Chapter 45) but they can be
used together
SAP NETWEAVER 71 AND HIGHER PERFORMANCE CHECK GUIDE
50
6 ANALYZING THE (ADVANCED) ADAPTER ENGINE
This chapter describes further checks and possible reasons for bottlenecks in the (Advanced) Adapter
Engine Although this is not the place to describe the architecture of the Adapter Framework in detail the
following aspects are important to know for the analysis of a performance problem on the AFW
o The AFW contains the Messaging System that is responsible for the persistence and queuing of messages Within the flow of a message it is placed in between the sender adapter (for example a file adapter that polls from a folder) and the Integration Server as well as between the Integration Server and the receiver adapter (for example a JMS adapter that sends a message out to an external system)
o The Messaging System uses 4 queues for each adapter type and these are responsible for receiving and sending messages To separate the message transfer each adapter (for example JMS SOAP JDBC and so on) has its own set of queues One queue for receiving synchronous messages (Request queue) one queue for sending synchronous messages (Call queue) one queue for receiving asynchronous messages (Receive queue) and one queue for sending asynchronous messages (Send queue) The name of the queue always states the adapter type and the queue name (for example JMS_httpsapcomxiXISystemReceive for the JMS receiver asynchronous queues)
o A configurable number of consumer threads are assigned on each queue These threads work on the queue in parallel meaning that the Messaging Queues are not strictly FirstIn-FirstOut Five threads are assigned by default to each queue and thus five messages can be processed in parallel But as will be discussed later the parallel execution of requests to the backend depends heavily on the adapter being used since not every adapter can work in parallel by default
o SAP NetWeaver PI 71 introduced a new queue The dispatcher queue The dispatcher queue is used to realize prioritization on the AAE (see chapter Prioritization in the Messaging System) Every message in the PI system is first assigned to the dispatcher queue before it is assigned to the adapter-specific queues
Viewed from the perspective of a message that enters the PI system using a J2EE Engine adapter (for
example File) and leaves the PI system using a J2EE Engine adapter (for example JDBC) asynchronously
the steps are as follows
1) Enter the sender adapter
2) Put into the dispatcher queue of the messaging system
3) Forwarded to the File send queue of the messaging system (based on Interface priority)
4) Retrieved from the send queue by a consumer thread
5) Sent from the messaging system to the pipeline of the ABAP Integration Engine (if no Integrated Configuration (AAE) is used
6) Processed by the pipeline steps of the Integration Engine
7) Sent to the messaging system by the Integration Engine
8) Put into the dispatcher queue of the messaging system
9) Forwarded to the JDBC receive queue of the messaging system (based on Interface priority)
10) Retrieved from the receive queue (based on the maxReceivers)
11) Sent to the receiver adapter
12) Sent to the final receiver
SAP NETWEAVER 71 AND HIGHER PERFORMANCE CHECK GUIDE
51
All the analysis is based on the information provided in the Audit Log With SAP NetWeaver PI 71 the audit
log is not persisted for successful messages in the database by default to avoid performance overhead
Therefore the audit log is only available in the cache for a limited period of time (based on the overall
message volume) More details can be found in chapter Persistence of Audit Log information in PI 710 and
higher
As described in chapter Adapter Engine Performance monitor in PI 731 and higher a new performance
monitor is available from PI 731 SP4 With this monitor you can display the processing time per interface in
a given interval and identify the processing steps in which a lot of time is spend
With 731 SP10 and 74 SP5 a download functionality for the performance monitor is provided as described
in SAP Note 1886761
61 Adapter Performance Problem
Compared to a bottleneck in the Messaging System it is relatively easy to detect a performance
problembottleneck in the adapter Since the timestamps for inbound and outbound messages are written at
different points in time the procedure is described separately for sender and receiver adapters
Note It is not generally possible for all sender and receiver adapters to work in parallel (discussed in section
Adapter Parallelism)
611 Adapter Parallelism
As mentioned before not all adapters are able to handle requests in parallel Thus increasing the number of
threads working on a queue in the messaging system will not solve a performance problembottleneck
There are 3 strategies to work around these restrictions
1) Create additional communication channels with a different name and adjust the respective senderreceiver agreements to use them in parallel
2) Add a second server node that will automatically have the same adapters and communication channel running as the first server node This does not work for polling sender adapters (File JDBC or Mail) since the adapter framework scheduler assigns only one server node to a polling communication channel
3) Install and use a non-central Adapter Framework for performance-critical interfaces to achieve better separation of interfaces
SAP NETWEAVER 71 AND HIGHER PERFORMANCE CHECK GUIDE
52
Some of the most frequently-used adapters and the possible options are discussed below
o Polling Adapters (JDBC Mail File)
At the sender side these adapters use an Adapter Framework Scheduler which assigns a server node that does the polling at the specified interval Thus only one server node in the J2EE cluster does the polling and no parallelization can be achieved Therefore scaling via additional server node is not possible More details will be presented in section Adapter Framework Scheduler For example since the channels are doing the same SELECT statement on the database or pick up files with the same file name parallel processing will only result in locking problems To increase the throughput for such interfaces the polling interval has to be reduced to avoid a big backlog of data that is to be polled If the volume is still too high you should think about creating a second interface for example the new interface would poll the data from a different directory or database table to avoid locking
At the receiver side the adapters work sequentially on each server node by default For example only one UPDATE statement can be executed for JDBC for each Communication Channel (independent of the number of consumer threads configured in the Messaging System) and all the other messages for the same Communication Channel will wait until the first one is finished This is done to avoid blocking situations on the remote database On the other hand this can cause blocking situations for whole adapters as discussed in section Avoid Blocking Caused by Single SlowHanging Receiver Interface
To allow better throughput for these adapters you can configure the degree of parallelism at the receiver side In the Processing tab of the Communication Channel in the field ldquoMaximum Concurrencyrdquo enter the number of messages to be processed in parallel by the receiver channel For example if you enter the value 2 then two messages are processed in parallel on one J2EE server node The parallel execution of these statements at database level of course depends on the nature of the statements and the isolation level defined on the database If all statements update the same database record database locking will occur and no parallelization can be achieved
o JMS Adapter
The JMS adapter is per default using a push mechanism on the PI sender side This means the data is pushed by the sending MQ provider Per default every Communication channel has one JMS connection established per J2EE server node On each connection it processes one message after the other so that the processing is sequential Since there is one connection per server node scaling via additional server nodes is an option
With Note 1502046 - JMS Adapter message pull mechanism the JMS protocol can be changed to use a pull mechanism By doing so you can specify a polling interval in the PI Communication Channel and PI will be the initiator of the communication Also here the Adapter Framework Scheduler is used which implies sequential processing But in contrary to JDBC or File sender channels the JMS polling sender channel will allow parallel processing on all server nodes of the J2EE cluster Therefore scaling via additional J2EE server nodes is an option
The JMS receiver side supports parallel operation out of the box Only some small parts during message processing (pure sending of the message to the JMS provider) are synchronized Therefore to enable parallel processing on the JMS receiver side no actions are necessary
o SOAP Adapter
The SOAP adapter is able to process requests in parallel The SOAP sender side has in general no limitations in the number of requests it can execute in parallel The limiting factor here is the FCAThreads available to process the incoming HTTP calls This is discussed in more detail in chapter Tuning SOAP sender adapter On the receiver side the parallelism depends on the number of the threads defined in the messaging system and the ability of the receiving system to cope with the load
SAP NETWEAVER 71 AND HIGHER PERFORMANCE CHECK GUIDE
53
o RFC Adapter
The RFC adapter offers parameters to adjust the degree of parallelism by defining the number of initial and maximum connections to be used The initial threads are allocated from the Application thread pool directly and are therefore not available for any other tasks Therefore the number of initial thread should be kept minimal To avoid bottlenecks during the peak time the maximum connections can be used A bottleneck is indicated by the following exception in the Audit Log
comsapaiiaframsapiDeliveryException error while processing message to remote systemcomsapaiiafrfccoreclientRfcClientException resource error could not get a client from JCOPool comsapmwjcoJCO$Exception (106) JCO_ERROR_RESOURCE Connection pool RfcClient hellip is exhausted The current pool size limit (max connections) is 1 connections
Also this should be done carefully since these threads will be taken from the J2EE application thread pool Therefore a very high value there can cause a bottleneck on the J2EE engine and therefore cause a major instability of the system As per RFC adapter online help the maximum number of connections are restricted to 50
o IDoc_AAE Adapter
The IDoc adapter on Java (IDoc_AAE) was introduced with PI 73 On the sender side the parallelization depends on the configuration mode chosen In Manual Mode the adapter works sequential per server node For channels in ldquoDefault Moderdquo it depends on the configuration of the inbound Resource Adapter (RA) Via the parameter MaxReaderThreadCount of the inbound RA you can configure how many threads are globally available for all IDoc adapters running in Default Mode Hence this determines the overall parallelization of the IDoc sender adapter per Java server node Currently the recommended maximum number of threads is 10
The receiver side of the Java IDoc adapter is working parallel per default
The table below gives a summary of the parallelism for the different adapter types
SAP NETWEAVER 71 AND HIGHER PERFORMANCE CHECK GUIDE
54
612 Sender Adapter
The first step(s) to be taken for a sender adapter depend on the type of adapter itself Afterwards however
the message flow is always the same First the message is processed in the Module Processor and
afterwards put into the queue of the Messaging System If the message is synchronous then it is the call
queue if the message is asynchronous that it is the send queue The final action of the Adapter Framework
is then to send the message from the messaging system to the Integration Server (for Non ICO interfaces)
Only the first entries of the audit log are of interest to establish if the sender adapter has a performance
problem From the first entry to the entry ldquoMessage successfully put into the queuerdquo These steps logically
belong to the sender adapter and the Module Processor while the subsequent steps belong to the
Messaging System The sender adapter uses one J2EE Engine application thread to execute its work This
is generally the same thread for all steps involved
Select the ldquoDetailsrdquo of a message in the AFW The first entry of the audit log will be the beginning of the activity of the sender adapter The end of the adapterrsquos activity is marked by the entry ldquoThe application sent the message asynchronously using connection Returning to applicationrdquo
6121 Tuning SOAP sender adapter As described above in general there is no limitation in the parallelization of the SOAP sender adapter itself
The incoming SOAP requests are limited by the available FCA Threads for HTTP processing The FCA
Threads are discussed in more detail in FCA Server Threads
Per default all interfaces using the SOAP adapter are using the same set of FCA Threads since they are all
using the same URL httplthostgtltportgtMessageServlet In case one interface is facing a very high load or
slow backend connections this can cause a blockage of the available FCA Threads and could cause a heavy
impact on the processing time of other interfaces
To avoid this SAP Note 1903431 allows the usage of different URLs for specific interfaces This way you
could isolate interfaces with a very high volume on a dedicated entry point using its own set of FCA Threads
In case of high load for this interface the other SOAP sender interfaces would not be affected by a shortage
of FCA Threads
SAP NETWEAVER 71 AND HIGHER PERFORMANCE CHECK GUIDE
55
To use this new feature you can specify on the sender system the following two entry points
o MessageServletInternal
o MessageServletExternal
More information about the URL of the SOAP adapter can be found here
613 Receiver Adapter
For a receiver adapter it is just the other way around when compared to the sender adapter First the
message is received from the Integration Server and then put into a queue of the Messaging System this
time either the request or the receive queue for asynchronous and the request queue for synchronous
messages The last step is then the activity of the receiver adapter itself
Select the ldquoDetailsrdquo of a message in the AFW The adapter activity starts after the entry ldquoThe message status set to DLNGrdquo The message will then be forwarded to the entry point of the AFW ldquoDelivering to channel ltchannel_namegtrdquo enters the Module Processor ldquoMP Entering Module Processorrdquo and ends with ldquoThe message was successfully delivered to the application using connection rdquo
Depending on the type of the adapter you now have to investigate why the receiver adapter needs a high amount of processing time This could be a complicated operating system command a bad network connection or a slow backend system among many other reasons
Here too custom modules can be the reason for a prolonged processing time Check Performance of Module Processing for more details
Note From 71 the audit log is not persisted any longer for performance reasons as described in Persistence of Audit Log information in PI 710 and higher
SAP NETWEAVER 71 AND HIGHER PERFORMANCE CHECK GUIDE
56
614 IDoc_AAE adapter tuning
A comprehensive and up-to date description about the tuning of the IDoc adapter is summarized in Note
1641541 - IDoc_AAE Adapter performance tuning Please refer to this Note for details
Similar to all other adapters running on the Adapter Engine also the IDOC_AAE adapter is using the Messaging System queues and the explanations of the next chapter Messaging System Bottleneck are also valid for the IDOC_AAE adapter Note that the IDOC_AAE adapter only supports async Scenarios ndash so it is only using the ldquoSendrdquo queue in Java-only scenarios and the ldquoSendrdquo and ldquoReceiverdquo queue in dual-stack scenariosrdquo
For the IDoc_AAE sender you can configure in addition bulk support as indicated in the screenshot below By doing so all messages received by PI in one RFC call from ERP will be processed as one message This is similar to the mechanism of the ABAP IDoc adapter described in the chapter Packaging on sender and receiver side except with the difference that the number of messages in one bulk cannot be further limited
It is also essential to ensure that the size of the IDocs or IDoc packages for sender or receiver IDocs is not
getting too large to avoid any negative impact on the Java heap memory and Garbage Collection In the
case of the IDoc_AAE adapter the XML size of the IDoc is less critical it is the number of segments in an
IDoc or the overall number of segments in all IDocs of an IDoc package that will influence the memory
allocation during message processing Based on the current implementation per IDoc segment around 5 KB
of memory during processing is required A package of 5 IDocs with 2000 segments for each IDoc would
consume roughly 500 MB during processing In such cases it is important to eg lower the package size
andor use large message queues as outlined in chapter Large message queues on PI Adapter Engine
615 Packaging for Proxy (SOAP in XI 30 protocol) and Java IDoc adapter
Due to message packaging in the Integration Engine (see PI Message Packaging for Integration Engine) the
ABAP based IDoc and Proxy adapter was always using packaging when sending asynchronous messages
to the receiver system With PI 731 packaging was also introduced for Java based IDoc and Proxy (SOAP in
XI 30 protocol) adapter The aim of packaging is to achieve similar benefits to packaging already existing in
ABAP pipeline
o Less calls to backend consuming less parallel Dialog Work Processes on the receiver
o Less overhead due to context switches authentication when calling the backend
Especially for high volume interfaces packaging should be enabled to avoid overloading of the backend
systems and impact on users operating on the system
SAP NETWEAVER 71 AND HIGHER PERFORMANCE CHECK GUIDE
57
Important
In the ABAP stack the packaging is active per default (in 71 and higher) as described in chapter PI
Message Packaging for Integration Engine Experience shows that packaging can have a very high impact
on the DIA Work process usage on the ERP receiver side Especially for migration projects from dual-stack
PI to AEXPO it is important to evaluate packaging to avoid any negative impact on the receiving ECC due
to missing packaging
The packaging on Java works in general different then on ABAP While in ABAP the aggregation is done on
the individual qRFC queue level (which always contains messages to one receiver system only) this is not
possible on the Adapter Engine since messages for all receivers are located in the same queue Therefore
packages are built outside of the Adapter Engine queues The messages to be packaged will be forwarded
to a bulk handler which waits till either the time for the package is exceeded or the number of messages or
data size is reached After this the message is send by a bulk thread to the receiving backend system
Packaging on Java is always done for a server node individually If you have a high number of server nodes
packaging will work less efficiently due to the load balancing of messages across the available server nodes
When enabling message packaging the message status will stay in status ldquoDeliveringrdquo throughout all steps
described above In the audit log you can see the time it spends in packaging The audit log shown below
shows eg that the message was almost waiting one minute before the package was built and 9 IDocs were
sent with this package
Packaging can be enabled globally by setting the following parameters in Messaging System service as
described in Note 1913972
o messagingsystemmsgcollectorenabled Enable packaging or disable it globally
o messagingsystemmsgcollectormaxMemPerBulk The maximum size of a bulk message
o messagingsystemmsgcollectorbulkTimeout The wait time per bulk - default 60 seconds
o messagingsystemmsgcollectormaxMemTotal Maximum memory which can be used by message collector
o messagingsystemmsgcollectorpoolSize Number of parallel threads used to send out packages to the backend This value has to be tuned based on the general performance of the receiver system the network latency between the systems or the configuration of the IDoc posting on the ERP sender side (described in chapter IDoc posting on receiver side) Therefore tuning of these threads might be very important These threads can unfortunately not be monitored yet with any PI tool or Wily
SAP NETWEAVER 71 AND HIGHER PERFORMANCE CHECK GUIDE
58
Introscope To verify that not all packaging threads are in use you can use the Thread monitoring in the SAP Management Console and check for threads named ldquoBULK_EXECUTORrdquo as shown below
If you would like to adapt the packaging for specific communication channel this can also be done using the
configuration options in the Integration Directory
While in the SOAP adapter in XI 30 protocol you can define three different packaging KPIs this is currently
not possible for the IDoc adapter There you can only specify the package size based on number of
messages
616 Adapter Framework Scheduler
For polling adapters like File JDBC and JMS the Adapter Framework Scheduler determines on which server
node the polling takes place Per default a File or JDBC sender only works on one server node and the
Adapter Framework (AFW) Scheduler determines on which one the job is scheduled
The Adapter Frameworks scheduler had several performance and reliability issues in a cluster environment
especially in systems having many Java server nodes and many polling communication channels Based on
this and the symptoms described in Note 1355715 - AF Scheduler to avoid using cluster communication a
new scheduler was released We highly recommend using the new version of the AFW scheduler To
activate the new scheduler you have to set the parameter schedulerrelocMode of the Adapter framework
SAP NETWEAVER 71 AND HIGHER PERFORMANCE CHECK GUIDE
59
service property to some negative value For instance by setting the value to -15 after every 15th polling
interval a rebalancing of the channel within the J2EE cluster might happen This can allow for better
balancing of the incoming load across the available server nodes if the files are coming in on regular
intervals The balancing is achieved by doing a servlet call Based on the HTTP load balancing the channel
might then be dispatched to another server node To avoid the balancing overhead this value should not be
set too low A value between -10 and -15 should be acceptable in most cases For very short polling intervals
(eg every second) even lower values (eg -50) can be configured
In case many files are put at one given time on the directory (by eg using a batch process) all these files will
be processed by one polling process only Hence a proper load balancing cannot be achieved by the AFW
scheduler In such a case the only option is to use write the files with different names or different directories
so that you can configure multiple sender channels to pick up the files
Starting from PI 731 you can monitor the Adapter Framework Scheduler in pimon Monitoring
Background Job Processing Monitor Adapter Framework Scheduler Jobs There you can check on which
server node the Communication Channel is polling (Status=rdquoActiverdquo) Also you can see the time the channel
was polling the last time and will poll next time
You cannot influence the server node on which the channel is polling This is determined via the AFW
scheduler You can only influence the frequency after which a channel can potentially move to another
server node by tuning the parameter relocMode as outlined above
Prior to PI 731 you have to use the following URL to monitor the Adapter Framework Scheduler
httpserverportAdapterFrameworkschedulerschedulerjsp
Above you see an example of a File sender channel The type value determines if the channel runs only on
one server node (type = L (local)) or on all server nodes (Type = G (global)) The time in the brackets
[60000] determines the polling interval in ms ndash in this case 60 seconds The Status column shows the
status of the channel
o ldquoONrdquo Currently polling
o ldquoonrdquo Currently waiting for the next polling
SAP NETWEAVER 71 AND HIGHER PERFORMANCE CHECK GUIDE
60
o ldquooffrdquo not scheduled any longer (eg channel deactivated or scheduled on another server node)
62 Messaging System Bottleneck
As described earlier the Messaging System is responsible for persisting and queuing messages that come
from any sender adapter and go to the Integration Server pipeline or Java only interfaces (ICO) or that come
from the Integration Server pipeline and go to any receiver adapter The time difference between receiving
the message from the one side and delivering it to the other side is the value that can be used to analyze
bottlenecks in the Messaging System The following chapters describe how to determine the time difference
for both directions
A bottleneck (or rather a ldquofakerdquo bottleneck) in the Messaging System can usually be closely connected with a
performance problem in the receiver adapter You must therefore make sure you execute the check
described in chapter 613 If the receiver adapter needs a lot of time to process messages then of course
the messages get queued in the messaging system and remain there for a long time since the adapter is not
ready to process the next one yet It looks like the messaging system is not fast enough but actually the
receiver adapter is the limiting factor
Execute the checks described in chapter 621 and 622 to get an overview of the situation you should do this for multiple messages
Decide if a specific receiver adapter is causing long waiting times in the messaging system by executing the check described in chapter 613 An additional hint at a receiver adapter problem is if only messages to specific receivers show a long wait time in the queue
Use the queue monitoring in the Runtime Workbench (RWB) to analyze how many threads are active for each of the queue types and how large the queue size currently is To do so choose Component Monitoring Adapter Engine Press the Engine Status button and choose tab ldquoAdditional Datardquo This will open the page below showing the number of messages in a queue the threads currently working and the maximum available threads Note This view only shows the Messaging System of one J2EE server node To get the whole picture you have to check all the server nodes that are available in your system via the drop down list box
SAP NETWEAVER 71 AND HIGHER PERFORMANCE CHECK GUIDE
61
o Since checking all the server nodes with this browser frontend can be very tedious it is better to use Wily Introscope since it allows easy graphical analysis of the queues and thread usage of the messaging system across Java server nodes
The starting point in Wily Introscope is usually the PI triage showing all the backlogs in the queue In the screenshot below a backlog in the dispatcher queue (for 71 and higher only) can be seen
The dispatcher queue is not the problem here since it will forward messages to the adapter queue if any free
threads are available on the adapter specific consumer threads The analysis must start in the PI inbound
queues By using the navigation button in the upper right corner of the inbound queue size you can directly
jump to a more detailed view where you can see that the file adapter was causing the backlog
SAP NETWEAVER 71 AND HIGHER PERFORMANCE CHECK GUIDE
62
To see the consumer thread usage you can then follow the link to the file adapter In the screenshot below
you can see that all consumer threads were exceeded during the time of the backlog Thus increasing the
number of consumer threads could be a solution if the resulting delay is not acceptable for business
o If it is obvious that the messaging system does not have enough resources as in the case above increase the number of consumers for the queue in question Use the results of the previous check to decide which adapter queues need more consumers
The adapter specific queues in the messaging system have to be configured in the NWA using
service ldquoXPI Service AF Corerdquo and property messagingconnectionDefinition The default
values for the sending and receiving consumer threads are set as follows
(name=global messageListener=localejbsAFWListener exceptionListener=
localejbsAFWListener pollInterval=60000 pollAttempts=60
SendmaxConsumers=5 RecvmaxConsumers=5 CallmaxConsumers=5
RqstmaxConsumers=5)
To set individual values for a specific adapter type you have to add a new property set to the default set with the name of the respective adapter type for example
(name=JMS_httpsapcomxiXISystem
messageListener=localejbsAFWListener
exceptionListener=localejbsAFWListener pollInterval=60000
pollAttempts=60 SendmaxConsumers=7 RecvmaxConsumers=7
CallmaxConsumers=7 RqstmaxConsumers=7)
The name of the adapter specific queue is based on the pattern ltadapter_namegt_ ltnamespacegt for
example RFC_httpsapcomxiXISystem
Note that you must not change parameters such as pollInterval and pollAttempts For more details see SAP Note 791655 - Documentation of the XI Messaging System Service Properties
o Not all adapters use the parameter above Some special adapters like CIDX RNIF or Java Proxy can be changed by using the service ldquoXPI Service Messaging Systemrdquo and property messagingconnectionParams by adding the relevant lines for the adapter in question as described above
o A performance problem on the Messaging System can also be caused by a high logging as described in chapter Logging Staging on the AAE (PI 73 and higher)
o Important Make sure that your system is able to handle the additional threads that is monitor the CPU usage and application thread availability as well as the memory of the J2EE Engine after you have applied the change
SAP NETWEAVER 71 AND HIGHER PERFORMANCE CHECK GUIDE
63
o Important Keep in mind that not all adapters are able to handle requests in parallel even if you assign more threads on the Messaging System queues In such a case adding additional threads will not speed up processing significantly See chapter Adapter Parallelism for details
o A backlog of messages in the messaging system is highly critical for synchronous scenarios due to timeouts that might occur Therefore the number of synchronous threads always has to be tuned so that no bottleneck occurs Often a backlog in synchronous queues is caused due to bad performance on the receiving backend system
o More information is provided in the blog Tuning the PI Messaging System Queues
621 Messaging System in between AFW Sender Adapter and Integration Server (Outbound)
Open the Audit Log of a message and look for the following entry ldquoThe message was successfully retrieved
from the send queuerdquo Note that the queue name would be ldquoCall Queuerdquo if the message was synchronous
To determine how long the message waited to be picked up from the queue compare the timestamp of the
above entry with the timestamp for the step ldquoMessage successfully put into the queuerdquo A large time
difference between those two timestamps would therefore indicate a bottleneck for consumer threads on the
sender queues in the Messaging System
Instead of checking the latency of single messages we recommend using Wily Introscope to monitor the
queue behavior as shown above
Asynchronous messages only use one thread for processing in the messaging system Multiple threads are
used for synchronous messages The adapter thread puts the message into the messaging system queue
and will wait till the messaging system delivers the response The adapter thread is therefore not available
for other tasks until the response is returned A consumer thread on the call queue sends the message to the
Integration Engine The response will be received by a third thread (consumer thread of send queue) which
correlates the response with the original request After this the initiating adapter thread will be notified to
send the response to the original sender system This correlation can be seen in the audit log of the
synchronous message below
SAP NETWEAVER 71 AND HIGHER PERFORMANCE CHECK GUIDE
64
622 Messaging System in Between Integration Server and AFW Receiver Adapter (Inbound)
Open the Audit Log of a message and look for the following entry ldquoMessage successfully put into the
queuerdquo Compare this timestamp with the timestamp for the step ldquoThe message was successfully retrieved
from the receive queuerdquo The time difference between these two timestamps is the time that the message
waited in the messaging system for a free consumer thread A large time difference between those two
timestamps indicates a bottleneck in the adapter specific inbound queues of the Messaging System
623 Interface Prioritization in the Messaging System
SAP NetWeaver PI 71 and higher offers the possibility for prioritization of interfaces similar to the ABAP
stack This feature is especially helpful if high volume interfaces run at the same time with business critical
interfaces To minimize the delay for critical messages the Messaging System now makes it possible for you
to define high medium and low priority processing at interface level Based on the priority the Dispatcher
Queue of the messaging system (which will be the first entry point for all messages) will forward the
messages to the standard adapter-specific queues The priority assigned to an interface determines the
number of messages that are forwarded once the adapter-specific queues have free consumer threads
available This is done based on a weighting of the messages to be reloaded The weights for the different
priorities are as follows High 75 Medium 20 Low 5
Based on this approach you can ensure that more resources can be used for high priority interfaces The
screenshot below shows the UI for message prioritization available in pimon Configuration and
Administration Message Prioritization
SAP NETWEAVER 71 AND HIGHER PERFORMANCE CHECK GUIDE
65
The number of messages per priority can be seen in a dashboard in Wily as shown below
You can find more details on configuring usage prioritization within the AAE at SAP Online Help navigate to
SAP NetWeaver SAP NetWeaver PI SAP NetWeaver Process Integration 71 Including Enhancement
Package 1 SAP NetWeaver Process Integration Library Function-Oriented View Process Integration
Process Integration Monitoring Component Monitoring Prioritizing the Processing of Messages
624 Avoid Blocking Caused by Single SlowHanging Receiver Interface
As already discussed above some receiver adapters process messages sequentially on one server node by
default This is independent of the number of consumer threads defined for the corresponding receiver
queue in the messaging system For example even though you have configured 20 threads for the JDBC
Receiver one Communication Channel will only be able to send one request to the remote database at a
given time If there are many messages for the same interface all of them will get a thread from the
messaging system but will be blocked when performing the adapter call
In the case of a slow message transmission for example for EDI interfaces using ISDN technology or
remote system with small network bandwidth this behavior can cause a ldquohangingrdquo situation for a specific
adapter since one interface can block all messaging threads As a result all the other interfaces will not get
any resources and will be blocked
SAP NETWEAVER 71 AND HIGHER PERFORMANCE CHECK GUIDE
66
Based on this a parameter messagingsystemqueueParallelismmaxReceivers was introduced which can
be set in NWA in service XPI Service Messaging System With this parameter you can restrict the maximum
number of receiver consumer threads that can be used by one interface In older releases (lower 731 SP11
and 74 SP6) this is a global parameter at the moment that affects all adapters It should therefore not be set
too restrictively If you need high parallel throughput one option is to set the maxReceiver parameter to 5 (so
that each interface can use 5 consumer threads for each server node) and increase the overall number of
threads on the receive queue for the adapter in question (for example JDBC) to 20 With this configuration it
will be possible for four interfaces to get resources in parallel before all threads are blocked For more
information see Note 1136790 - Blocking Receiver Channel May Affect the Whole Adapter Type and SDN
blog Tuning the PI Messaging System Queues
In the screenshot below you see the impact of maxReceivers parameter when a backlog for one interface
occurs Even though there are more free SOAP threads available they are not consumed Hence the free
SOAP threads could be assigned to other interfaces running in parallel
This parameter has a direct impact on the queue where message backlogs occur As mentioned earlier
usually a backlog should occur on the Dispatcher queue only since it is responsible to dispatch threads only
if there are free consumer threads in the adapter specific queue When setting maxReceiver you restrict the
threads per interface and this means that less consumer threads are blocked When one interface is facing a
high backlog there will always be free consumer threads and therefore the dispatcher queue can dispatch
the message to the adapter specific queue Hence the backlog will appear in the adapter specific queue so
that the message prioritization would not work properly any longer
SAP NETWEAVER 71 AND HIGHER PERFORMANCE CHECK GUIDE
67
Per default the maxReceiver parameter is only relevant for asynchronous message processing (ICo and
classical dual-stack scenarios) The reason here is that a wait time for synchronous scenarios should be
avoided by all means and therefore additional restrictions in the number of available threads can be very
critical Therefore it is usually advisable to not limit the threads per interface but increase the overall number
of available threads In case you have many high volume synchronous scenarios with different priority that
run in parallel it might be advisable to limit the threads each interface can use To do so you have to set the
parameter messagingsystemqueueParallelismqueueTypes to Recv ICoAll as described in SAP Note
1493502 - Max Receiver Parameter for Integrated Configurations
Enhancement with 731 SP11 and 74 SP6
With Note 1916598 - NF Receiver Parallelism per Interface an enhancement was introduced that allows
the specification of the maximum parallelization on more granular level This new feature has to be activated
by setting the parameter messagingsystemqueueParallelismperInterface to true Using a configuration UI
you can specify rules to determine the parallelization for all interfaces of a given receiver service If no rule
for a given interface is specified the global maxReceivers value will be considered If the receiver service
corresponds to a technical business system this configuration would help to restrict the parallel requests
from PI to that system This also works across protocols so that eg it could be used to restrict the number of
parallel requests using Proxy or IDoc to the same ERP receiver system Below you can find a screenshot of
the configuration UI in NWA SOA Monitoring
With the improvement mentioned above also the dispatching mechanism in the dispatcher queue is
changed so that it is aware of the maxReceiver settings This means that now again the backlog will now be
placed in the dispatcher queue and the prioritization will work properly
625 Overhead based on interface pattern being used
Also the interface pattern configured can cause some overhead When choosing the interface pattern
ldquoStateless Operationrdquo each message is parsed against its data type during inbound processing This can
cause performance and memory overhead but gives a syntactical check of the data received
When choosing ldquoStateless (XI30-Compatible)rdquo no check of the data type is performed and therefore the
overhead is avoided Therefore for interface with good data quality and high message throughput this
interface pattern should be chosen
SAP NETWEAVER 71 AND HIGHER PERFORMANCE CHECK GUIDE
68
63 Performance of Module Processing
If your analysis in chapter Adapter Performance Problem pointed to a problem in the Module Processing
then you must analyze the runtime of the modules used in the Communication Channel Adapter modules
can be combined so that one CC calls multiple modules in a defined sequence Adapter modules can be
custom-developed or SAP standard and can be used for many different purposes ndash like to transform the EDI
message before sending it to the partner or to change header attributes of a PI message before forwarding it
to a legacy application Due to the flexible usage of adapter modules there is also no standard way to
approach performance problems
In the audit log shown below you can see two adapter modules One module is a customer-developed
module called SimpleWaitModule The next module called CallSAPAdapter which is a standard module that
inserts the data into the messaging system queues
In the audit log you will get a first impression of the duration of the module In the example above you can
see that the SimpleWaitModule requires 4 seconds of processing time
Once again Wily Introscope offers a better overview of the processing time of modules In the screenshot
below you can see a dashboard showing the cumulativeaverage response times and number of invocations
of different modules If there is one that has been running for a very long time then it would be very easy to
identify since there will be a line indicating a much higher average response time The tooltip displays the
name of the module
Module
Processing
SAP NETWEAVER 71 AND HIGHER PERFORMANCE CHECK GUIDE
69
Once you have identified the module with the long running time you have to talk to the responsible developer
to understand why it is taking that long Eventually the module executes a look-up to a remote system using
JCo or JDBC which could be responsible for the delay In the best case the module will print out information
in addition to the audit log to detect such steps If not use the Wily Introscope transaction trace as explained
in appendix Wily Transaction Trace
64 Java only scenarios Integrated Configuration objects
From SAP NetWeaver PI 71 on you can configure scenarios that only run on the Java stack using the
Advance Adapter Engine (AAE) when only Java-based adapters are used A new configuration object is
used for this that is called Integrated Configuration When using this the steps executed so far in the ABAP
pipeline (Receiver Determination Interface Determination and Mapping) are also executed by the services in
the Adapter Engine
641 General performance gain when using Java only scenarios
The major advantage of AAE processing is a reduced overhead due to the context switches between ABAP
and Java Thus the overall throughput can be increased significantly and the overall latency of a PI
message can be reduced greatly If possible interfaces should always use the Integrated Configuration to
achieve best performance Therefore the best tuning option is to change a scenario that is using Java based
sender and receiver adapters from a classical ABAP-based scenario to an AAE-based one
SAP NETWEAVER 71 AND HIGHER PERFORMANCE CHECK GUIDE
70
Based on SAP internal measurements performed on 71 releases the throughput as well as the response
time could be improved significantly as shown in the diagrams below
SAP NETWEAVER 71 AND HIGHER PERFORMANCE CHECK GUIDE
71
Based on these measurements the following statements can be made
1) Significant performance improvements can be achieved always with local processing (if available) for a certain scenario
2) This is valid for all adapter types huge mapping runtimes slow networks slow (receiver) applications reduce the throughput and therefore rated for the overall scenario also reduce the benefit of local processing in terms of overall throughput and response time measurements
3) Greatest benefit is recognized for small payloads (comparison 10k 50k 500k) and asynchronous messages
642 Message Flow of Java only scenarios
All the Java based tuning options mentioned in chapter Analyzing the (Advanced) Adapter Engine and Long
Processing Times for ldquoPLSRV_MAPPING_REQUESTrdquo are still valid Just the calling sequence is different
The following describes the steps used in Integrated Configuration to help you better understand the
message flow of an interface The example is JMS to Mail
1) Enter the JMS sender adapter
2) Put into the dispatcher queue of the messaging system
3) Forwarded to the JMS send queue of the messaging system
4) Message is taken by JMS send consumer thread
a No message split used
In this case the JMS consumer thread will do all the necessary steps previously done in the ABAP pipeline (like receiver determination interface determination and mapping) and will then also transfer the message to the backend system (remote database in our example) Thus all the steps are executed by one thread only
b Message split used (1n message relation)
In this case there is a context switch The thread taking the message out of the queue will process the message up to the message split step It will create the new message and put it in the Send queue again from where it will be taken by different threads (which will then map the child message and finally send it to the receiving system)
As we can see in this example for Integrated Configuration only one thread does all the different steps of a
message The consumer thread will not be available for other messages during the execution of these steps
The tuning of the Send queue (Call for synchronous messages) is therefore much more important for
scenarios using Integrated Configuration than for ABAP-based scenarios
The different steps of the message processing can be seen in the audit log of a message If for example a
long-running mapping or adapter module is indicated then you can use the relevant chapter of this guide
There is no difference in the analysis except that for mappings no JCo connection is required since the
mapping call is done directly from the Java stack
SAP NETWEAVER 71 AND HIGHER PERFORMANCE CHECK GUIDE
72
The example audit logs below are based on a Java only synchronous SOAP to SOAP scenario
In the highlighted areas you can see that all the steps are very fast except the mapping call which lasts
around 7 seconds To analyze the long duration of the mapping now the same steps as discussed in chapter
Long Processing Times for ldquoPLSRV_MAPPING_REQUESTrdquo have to be followed
SAP NETWEAVER 71 AND HIGHER PERFORMANCE CHECK GUIDE
73
643 Avoid blocking of Java only scenarios
Like classical ABAP based scenarios Java only scenarios can face backlog situations in case of a slow or
hanging receiver backend Since the Java only interfaces are only using send queues the restriction of
consumer threads on the receiver queue as described in chapter Avoid Blocking Caused by Single
SlowHanging Receiver Interface is no solution
Based on that an additional property messagingsystemqueueParallelismqueueTypes of service SAP XI AF
MESSAGING was introduced via Note 1493502 - Max Receiver Parameter for Integrated Configurations
The parameter can be set for synchronous and asynchronous interfaces Please keep in mind that
messagingsystemqueueParallelismmaxReceivers is a global parameter for all adapters and for all
configured Quality of Service This global restriction can be avoided starting with 731 SP11 740 SP06 as
per SAP Note 1916598 - NF Receiver Parallelism per Interface Usually a restriction for the parallelization
can be highly critical for synchronous interfaces Therefore we generally recommend to set
messagingsystemqueueParallelismqueueTypes in most cases to Recv IcoAsync only
644 Logging Staging on the AAE (PI 73 and higher)
Up to PI 711 on the PI Adapter Engine only one message version was persisted Especially for Java only
scenarios this was often not sufficient for troubleshooting since for instance the result of a mapping could not
be verified
Starting from PI 73 the persistence steps can be configured globally in the Adapter Engine for synchronous
and asynchronous interfaces This is similar to the LOGGING or LOGGING_SYNC on the ABAP stack In
later version of PI you will be able to do the configuration on interface level
The versions that can be persisted are shown in the diagram below (the abbreviations in green are the
values for the configuration)
SAP NETWEAVER 71 AND HIGHER PERFORMANCE CHECK GUIDE
74
In the Messaging System we generally distinguish Staging (versioning) and Logging An overview is given
below
For details about the configuration please refer to the SAP online help Saving Message Versions
Similar to the LOGGING on the ABAP Integration Server persisting several versions of the Java message
can cause a high overhead on the DB and can cause a decrease in performance
The persistence steps can be seen directly in the audit log of a message
Also the Message Monitor shows the persisted versions
SAP NETWEAVER 71 AND HIGHER PERFORMANCE CHECK GUIDE
75
While this additional monitoring attributes are extremely helpful for troubleshooting they should be used
carefully from a performance perspective Especially the number of message versions and the
loggingstaging mode you choose can have a severe impact on performance Therefore you have to find the
balance between business requirement and performance overhead Some guidelines on how to use staging
and logging are summarized in SAP Note 1760915 - FAQ Staging and Logging in PI 73 and higher
65 J2EE HTTP load balancing
With NetWeaver version 71 and higher the Java HTTP load balancing is no longer done by the Java
Dispatcher but by the ICM The default load balancing rules of the ICM are designed with a stateful
application in mind giving priority to the balancing of HTTP sessions These default rules are not optimal for
stateless applications such as SAP PI
In the past we could observe an unequal load distribution across Java server nodes caused by this In case
of high backlogs this can cause a delay in the overall message processing of the interface because one
server node has more messages assigned than others and therefore not all available resources are used
A typical example can be seen in the Wily screenshot below
SAP Note 1596109 ndash Uneven distribution of HTTP requests on Java server nodes introduces new load
balancing rules for stateless applications like PI Please follow the description in the Note to ensure the
messages are distributed equally across the available server nodes In the meantime these load balancing
rules can also be executed using the CTC templates as described in Notes 1756963 and 1757922 Also this
has been included in the PI Initial Setup wizard in order to execute this task automatically as a post-
installation step (see Note 1760700 - PI CTC Add HTTP loadbalancing to initial setup)
SAP NETWEAVER 71 AND HIGHER PERFORMANCE CHECK GUIDE
76
For the example given above we could see a much better load balancing after the new load balancing rules
were implemented This can be seen in the following screenshot
Please Note The load balancing rules mentioned above are only responsible to balance the messages
across the available server nodes of one instance HTTP load balancing across application servers is done
by the SAP Web Dispatcher More information about this is provided in the Guide How To Scale SAP PI 71
66 J2EE Engine Bottleneck
All tuning that can be done in the AFW is limited by the ability of the J2EE Engine to handle a given amount
of threads and to provide enough memory that is needed to process all requests Of course the CPU is also
a limiting factor but this will be discussed in Chapter 91
From SAP NetWeaver PI 71 onwards the SAP VM is used on all platforms Therefore the analysis of all
platforms can use the same tools
661 Java Memory
The first analysis of the J2EE memory is usually done using the garbage collection (GC) behavior of the
Java Virtual Machine (JVM) To get the information of the GC written to the standard log file the JVM has to
be started with the parameter ndashverbosegc
Analyze the file std_serverltngtout for the frequency of GCs their duration and the allocated memory
Look for unusual patterns indicating an Out-of-Memory error or an unintentional restart of your J2EE engine This would be visible if the allocated memory drops to 0 at a given point in time A healthy Garbage Collection output would display a saw tooth pattern ndash that is the memory usage would increase over time but then go down to its original value as soon as a full Garbage Collection is triggered You should see the memory usage go down to initial values during low volume times (night-time)
Pay attention to GCs with a high duration This is important because no PI message can be mapped or processed by the J2EE Adapter Framework during a GC in a JAVA VM One of the many reasons for long GCs that should be mentioned here is paging (see chapter 92) If the heap space of the J2EE Engine is exhausted all objects in the heap are evaluated for their references If there is still a reference the object is kept If there is no reference the object is deleted If some or all of the objects have been swapped out due to insufficient RAM then they have to be swapped in to be evaluated This leads to very long runtimes for GCs GCs of more than 15 minutes have been observed on swapping systems
SAP NETWEAVER 71 AND HIGHER PERFORMANCE CHECK GUIDE
77
Different tools exist for the Garbage Collection Analysis
1) Solution Manager Diagnostics
Solution Manager Diagnostics (SMD) offers a memory analysis application that is able to read the GC output in the std_serverltngtout files To start call the Root Cause Analysis section In the Common Task list you find the entry Java Memory Analysis which will give you the chance to upload your std_serverltngtout file It shows the memory allocated after the GC and also prints the duration of each GC (black dots with duration scale on right axis) A normal GC output should show a saw tooth pattern where the memory always goes down to an initial value (especially during low volume times) This is shown in the example screenshot below
2) Wily Introscope
Again Wily Introscope offers different dashboards that can be used to check the Garbage Collection behavior on the J2EE engine The dashboard can be found using the J2EE Overview J2EE GC Overview and shows important KPIs for the GC such as the count of GC or the duration for each interval The GC Time dashboards shows the ratio of time spent in GC An example is shown in the screenshot below
SAP NETWEAVER 71 AND HIGHER PERFORMANCE CHECK GUIDE
78
3) Netweaver Administrator
The NWA also offers a view to monitor the Java heap usage However the important information about the duration of the GC is not available This monitor can be found by navigating to Availability and Performance Management Java System Reports Choose Report System Health
In NetWeaver 73 you find this data in Availability and Performance Management Resource Monitoring History Reports There you can build your own Memory report of the monitoring data provided The screenshot below eg shows the Used Memory per server node
SAP NETWEAVER 71 AND HIGHER PERFORMANCE CHECK GUIDE
79
4) SAP JVM Profiler
The SAP JVM profiler allows the analysis of the extensive GC information stored in the sapjvm_gcprf files of the server node folders or to directly connect to the server node to retrieve this information More information can be found at httpwikiscnsapcomwikidisplayASJAVAJava+Profiling
SAP NETWEAVER 71 AND HIGHER PERFORMANCE CHECK GUIDE
80
Procedure
o Search for restarts of the J2EE Engine by searching for the string ldquois startingrdquo in the file std_serverltngtout Apart from the first of these entries (which simply marks the initial start of the J2EE Engine) the second and any later entries mark a fatal situation after which the J2EE server node had to be restarted This could for example be an outndashof-memory situation Search the log above those entries for a possible reason
o Search for exceptions and fatal entries Was an out-of-memory error reported (search for pattern OutOfMemory) Was a thread shortage reported
o This document does not deal with tuning the J2EE Engine If at this point it becomes clear that the J2EE Engine is the limiting factor proceed with SAP Notes or open a customer incident Only some very basic recommendations are given here
o The parameters for the SAP VM are defined by Zero Admin templates From time to time new Zero Admin templates might be released which change important parameters for the SAP VM Thus you should check SAP Note 1248926 - AS Java VM Parameters for NetWeaver 71-based Products regularly and apply the changes accordingly
o The problem might be caused by too high parallelization when processing large messages This should be restricted to avoid overloading of the Java heap memory
1) In case the interfaces are using the ABAP Integration Server use the large message queue filters to restrict the parallelization of mapping calls from ABAP queues To do so set parameter EO_MSG_SIZE_LIMIT to eg 5000 to direct all large messages to dedicated XBTL or XBTM queues
2) To restrict the parallelization on the Java Messaging System you can use the large message queue mechanism described in chapter Large message queues on the Messaging System
o If it is already obvious that the memory of your J2EE Engine is getting short and nothing can be changed on the scenarios itself you have several options for scaling your PI landscape Especially for large PI installations with high message throughput or large messages SAP Note 1502676 - Scaling up large PI installations describes potential options
1) Increase the Java Heap of your server node If sufficient physical memory is available increase the default heap size of 2 GB to a higher value such as 3 or 4 GB Experience shows that the SAP VM can handle these heap sizes without major impact on performance Larger heap sizes can cause longer processing time of GCs which in turn can affect the PI application negatively Increasing the maximum heap size on the J2EE engine will automatically adapt the new area of the heap due to a dynamic configuration (in newer J2EE versions this will be per default set to 16 of the overall heap) After increasing the heap size monitor the duration of the GC execution
2) Add an additional server node to distribute the load over more processes SAP recommends that productive systems have at least 2 Java server nodes per instance Prerequisite is that your physical host has enough RAM and CPU To minimize the overhead for J2EE cluster communication it is in general recommended configuring larger server nodes (as described above) then a high number of server nodes
3) Add an additional application server consisting of a double stack Web Application Server (ABAP and J2EE Engine) to distribute the load to an additional hardware Find details on the scaling of PI with multiple instances in the Guide How To Scale up SAP NetWeaver Process Integration
4) Use a non-central Adapter Engine to separate large messages that cause the memory problem from business critical scenarios
662 Java System and Application Threads
A system or application thread is required for every task that the J2EE Engine executes Each of these
thread types are maintained using a thread pool If the pool of available threads is expired no more requests
can be processed It is therefore important that you have enough threads available at all times
SAP NETWEAVER 71 AND HIGHER PERFORMANCE CHECK GUIDE
81
o In general SAP recommends that you increase the system and application thread count for a PI system As described in SAP Note 937159 - XI Adapter Engine is stuck the application threads should be increased to 350 and the system threads to lsquo120rsquo for all J2EE server nodes
o There are two options for checking the thread usage
1) Wily Introscope
Wily Introscope provides a dashboard in the J2EE Overview section called J2EE CPU and Memory Detail that can also be used to monitor the thread usage on a PI engine Different views exist for Application and System Threads as shown in the screenshot below
2) NetWeaver Administrator (NWA)
The NWA also offers a monitor similar to the one available for the memory mentioned above This monitor can be found by navigating to Availability and Performance Management Java System Reports Choose Report System Health and looking at the windows shown in the screenshot below
Again in NetWeaver 73 and higher the monitor can be found at Availability and Performance
Management Resource Monitoring History Report An example for the Application Thread
Usage is shown below
SAP NETWEAVER 71 AND HIGHER PERFORMANCE CHECK GUIDE
82
Check if the ThreadPoolUsageRate is below 80 for both the application threads and the system threads Also check the maximum value by choosing a longer history in Wily Introscope
Has the thread usage increased over the last daysweeks
Is there one server node that shows a higher thread usage than others
3) SAP Management Console
The SAP Management Console is an essential tool to analyze different aspects of the J2EE engine It also offers a thread dump view similar to SM50 in ABAP showing the activity of all the threads of a given Java Application Server More information about the SAP MC can be found in Note 1014480 - SAP Management Console (SAP-MC) and the online help The SAP Management Console can be started as Java web-start application using httpltservergt5ltInstanc_numbergt13
Navigate to AS Java Threads and check for any threads in red status (gt20 secs running time) This indicates long running threads and you should check for the related thread stacks The example below shows a long running thread related to the PI directory You can see the user doing the request and can see that the thread is waiting for an HTTP response from the CPACache
SAP NETWEAVER 71 AND HIGHER PERFORMANCE CHECK GUIDE
83
If you are not sure what is causing the problem you should take multiple thread dumps (at least 3 every 30 seconds) for all server nodes This can be done in the Management Console navigating to AS Java Process Table
The Thread Dump Viewer tool (TDV) from Note 1020246 - Thread Dump Viewer for SAP Java Engine can be used to analyze the produced thread dumps (inside the results archive that can be downloaded to your local PC)
663 FCA Server Threads
An additional type of thread was introduced with SAP NetWeaver PI 71 that is responsible for HTTP traffic
FCA Server Threads The FCA Server Threads are responsible for receiving HTTP calls at the Java side
(after the Java dispatcher is no longer available) Also FCA Threads use a Thread Pool Fifteen FCA
Threads are configured by default but based on SAP Note 1375656 - SAP Netweaver PI System Parameters
we recommend that you increase it to 50 This can be done in the NWA by changing the parameter
FCAServerThreadCount of service HTTP Provider
FCA Server Threads are particularly crucial for synchronous message transfer and for HTTP-based
scenarios like WebServices or calls from the ABAP engine to the Adapter Engine If there is a long duration
of the HTTP call due to a slow backend system then the thread is blocked for the whole time and not
available to send other HTTP requests (other PI messages)
SAP NETWEAVER 71 AND HIGHER PERFORMANCE CHECK GUIDE
84
The configured FCAServerThreadCount represents the maximum number of threads working on a single
entry point An entry point in the PI sense could eg be the SOAP Adapter Servlet (share with all channels
as described in Tuning SOAP sender adapter)
o If response times for specific entry point are high (gt15 seconds) additional FCA threads will be spawned to be available for parallel HTTP based incoming requests using different entry points only This ensures that in case of problems with one application not all other applications will be blocked constantly
o An overall maximum of 20xFCAServerThreadCount may be used in the J2EE engine
There is currently no standard monitor available for FCA Threads except the thread view in the SAP
Management Console A new dashboard will be integrated into Wily Introscope soon and will also show the
FCA Server Threads that are in use
664 Switch Off VMC
The Virtual Machine Container (VMC) is enabled by default for an ABAP WebAS 71 Since PI does not use
VMC at runtime the VMC can be switched off on a PI system to avoid resource overhead This
recommendation is based on SAP Note 1375656 - SAP NetWeaver PI System Parameters
You can activate the VM Container setting the profile parameters vmcjenable = off which can be changed
using profile maintenance (transaction RZ10) Once you have made the change you need to restart the SAP
Web Application Server instance
SAP NETWEAVER 71 AND HIGHER PERFORMANCE CHECK GUIDE
85
7 ABAP PROXY SYSTEM TUNING
Every ABAP WebAS gt 620 includes an ABAP Proxy runtime This enables a SAP system to talk native PI
protocol (XI-SOAP) so that no costly transformation is necessary
In general ABAP proxy is just a framework that is triggered by (sender) or triggers (receiver) application-
specific coding It is not possible to give a general tuning recommendation because the applications and use
cases of ABAP proxy can differ so greatly
In this section we would like to highlight the system tuning options that can be applied to improve the
throughput at the ABAP Proxy backend side
In general you can increase the throughput of EO interfaces by changing the queue parallelization Two
different parameters exist to change the number of qRFC queues on the ABAP Proxy backend As in PI
ABAP Proxy processing is based on qRFC inbound queues (SMQ2) with specific names A sender proxy
uses XBTS queues (10 parallel by default) and a receiver proxy XBTR (20 parallel by default)
The sender proxy only forwards the message to PI by executing an HTTP call that must not take too much
time and which is not resource-critical On the other hand the receiver proxy executes the inbound
processing of the messages based on the application context (and which can be very time-consuming) It is
therefore more likely to face a backlog situation in the Receiver Proxy queues In the screenshot below you
can see the performance header of a receiver proxy message that required around 20 minutes in the
PLSRV_CALL_INBOUND_PROXY (which corresponds to the posting of the application data)
Of course such a long-running message will block the queue and all messages behind it will face a higher
latency Since this step is purely application-related it is only possible to perform tuning at the application
side
The number of sender and receiver ABAP Proxy queues can be changed in transaction SXMB_ADM on the
proxy backend with parameter EO_INBOUND_PARALLEL and sub parameter SENDER (XBTS queues)
and RECEIVER (XBTR queues) The prerequisite for increasing the number of queues is that there are
enough qRFC resources are available at the proxy system (as discussed in section qRFC Resources
(SARFC))
Also as described in chapter Message Prioritization on the ABAP Stack prioritization can be configured in
the ABAP Proxy system This can be used to separate runtime-critical interfaces from interfaces with a long
application processing (as shown above)
SAP NETWEAVER 71 AND HIGHER PERFORMANCE CHECK GUIDE
86
71 New enhancements in Proxy queuing
The queuing mechanism was enhanced for sender and receiver proxy systems with Note 1802294
(Receiver) and Note 1831889 (Sender) After implementing these two Notes interface specific queues will be
used and tuning of these queues on interface level will be possible This can be very helpful in cases where
one receiver interface shows very long posting time in the application coding that cannot be further
improved Other messages for more business critical interfaces will eventually be blocked by this message
due to the common usage of the XBTR queues On the sender side of a Proxy system the processing of the
queues call the central PI hub In general the processing time there should be fast But in case of high
volume interfaces you might want to slow down less business critical interfaces to avoid overloading of your
central PI hub The prioritization mechanisms available prior to these Notes did not provide such options
This is achieved by adding an interface specific identifier to the queue-name In the screenshot below you
see a comparison in the queue names for the old framework (red) and the new framework (blue)
For the sender queues the following new parameters are introduced
o Parameter EO_QUEUE_PREFIX_INTERFACE with sub parameter SENDERSENDER_BACK Should be set to lsquo1rsquo to active interface specific queue This is a global switch affecting all sender interfaces
o Parameter EO_INBOUND_PARALLEL_SENDER without sub parameter determines the general number of queues per interface
Using a sub parameter ltsender IDgt the parallelization of individual interfaces can be changed This can eg be used to assign more queues for high priority interfaces
Wildcards can be used in the ltsender IDgt to group interfaces sharing eg the same service name or the same interface name but different services
For the receiver queues the following new parameters are introduced
o Parameter EO_QUEUE_PREFIX_INTERFACE with sub parameter RECEIVER Should be set to lsquo1rsquo to active interface specific queue This is a global switch affecting all receiver interfaces
o Parameter EO_INBOUND_PARALLEL_RECEIVER without sub parameter determines the general number of queues per interface
Using a sub parameter ltsender IDgt the parallelization of individual interfaces can be changed This can eg be used to assign more queues for high priority interfaces
Wildcards can be used in the ltsender IDgt to group interfaces sharing eg the same service name or the same interface name but different services
This new feature also replaces the currently existing prioritization since it is in general more flexible and
powerful We therefore recommend adjusting existing prioritization rules using the new queuing possibilities
described above
SAP NETWEAVER 71 AND HIGHER PERFORMANCE CHECK GUIDE
87
8 MESSAGE SIZE AS SOURCE OF PERFORMANCE PROBLEMS
The message size directly influences the performance of an interface The size of a PI message depends on
two elements The PI header elements with a rather static size and the payload which can vary greatly
between interfaces or over time for one interface (for example larger messages during year-end closing)
The size of the PI message header can cause a major overhead for small messages of only a few kB and
can cause a decrease in the overall throughput of the interface Furthermore many system operations (like
context switches or database operations) are necessary for only a small payload The larger the message
payload the smaller the overhead due to the PI message header On the other hand large messages
require a lot of memory on the Java stack which can cause heavy memory usage on ABAP or excessive
garbage collection activity (see section Java Memory) that will also reduce the overall system performance
Very large messages can even crash the PI system by causing an Out-of-Memory exception for example
You therefore have to find a compromise for the PI message size
Below you see throughput measurements performed by SAP In general the best throughput was identified
for messages sizes of 1 to 5 MB
The message size in these measurements corresponds to the XML message size processed in PI and not
the size of the file or IDoc being sent to PI You can use the Runtime Header of the ABAP stack to check the
message size Below you can see an example of a very small message While the MessageSizePayload
field describes the size of the payload in bytes (here 433 bytes) the MessageSizeTotal describes the total
message size (header + payload) In the example this is around 14 KB demonstrating the overhead by the PI
header for small messages The next two lines describe the payload size before and after the mapping In
the example below the mapping reduces the payload size The last two lines determine the size of the
response message that is sent back to PI before and after the response mapping for synchronous
messages
SAP NETWEAVER 71 AND HIGHER PERFORMANCE CHECK GUIDE
88
Based on the above observations we highly recommend that you use a reasonable message size for your
interfaces During the design and implementation of the interface we therefore recommend using a message
size of 1 to 5 MB if possible Messages can be collected at the sender side or by using IDoc packaging as
described in Tuning the IDoc Adapter to achieve this In case of large messages a split has to be performed
by changing the sender processing or by using the split functions available in the structure conversion of the
File adapter
81 Large message queues on PI ABAP
In case the interfaces are using the ABAP Integration Server use the large message queue filters to restrict
the parallelization of mapping calls from ABAP queues To do so set the parameter EO_MSG_SIZE_LIMIT of
category TUNING to eg 5000 to direct all messages larger 5 MB to dedicated XBTL or XBTM queues
The value of the parameter depends on the number of large messages and the acceptable delay that might
be caused due to a backlog in the large message queue
To reduce the backlog the number of large message queues can also be configured via parameter
EO_MSG_SIZE_LIMIT_PARALLEL of category TUNING The default value is 1 so that all messages larger
than the defined threshold will be processed in one single queue Naturally the parallelization should not be
set higher than 2 or 3 to avoid overloading of the Java memory due to parallel large message requests
82 Large message queues on PI Adapter Engine
SAP Note 1727870 - Handling of large messages in the Messaging System introduces large message
queues (virtual queues no adapter behind) also for the Java based Adapter Engine Contrary to the
Integration Engine it is not the size of a single large message only that determines the parallelization
Instead the sum of the size of the large messages across all adapters on a given Java server node is limited
to avoid overloading the Java heap This is based on so called permits that define a threshold of a message
size Each message larger than the permit threshold is considered as large message The number of permits
can be configured as well to determine the degree of parallelization Per default the permit size is 10 MB and
10 permits are available This means that large messages will be processed in parallel if 100 MB are not
exceeded
To show this let us look at an example using the default values Let us assume we have 5 messages waiting
to be processed (status ldquoTo Be Deliveredrdquo on one server node Message A has 5 MB message B has 10
MB message C has 50 MB message D 150 MB message E 50 MB and message F 40 MB Message A is
not considered large since the size is smaller than the permit size and is not considered large and can be
immediately processed Message B requires 1 permit message C requires 5 Since enough permits are
available processing will start (status DLNG) Hence for message D all available 10 permits would be
required Since the permits are currently not available it cannot be scheduled If blacklisting is enabled the
message will be put to error status (NDLV) since it exceed the maximum number of defined permits In that
case the message would have to be restarted manually Message E requires 5 permits and can also not be
scheduled But since there are 4 permits left message F is put to DLNG Due to the smaller size message B
and message F finish first releasing 5 permits This is sufficient to schedule message E which requires 5
SAP NETWEAVER 71 AND HIGHER PERFORMANCE CHECK GUIDE
89
permits Only after message E and C have finished message D can be scheduled consuming all available
permits
The example above shows a potential delay a large message could face due to the waiting time for the
permits But the assumption is that large messages are not time critical and therefore additional delay is less
critical than potential overload of the system
The large message queue handling is based on the Messaging System queues This means that restricting
the parallelization is only possible after the initial persistence of the message in the Messaging System
queues Per default this is only done after the Receiver Determination Therefore if you have a very high
parallel load of incoming large requests this feature will not help Instead you would have to restrict the size
of incoming requests on the sender channel (eg file size limit in the file adapter or the
icmHTTPmax_request_size_KB limit in the ICM for incoming HTTP requests) If you have very complex
extended receiver determination or complex content based routing it might be useful to configure staging in
the first processing step of the Messaging System (BI=3) as described in Logging Staging on the AAE (PI
73 and higher)
The number of permits consumed can be monitored in PIMON Monitoring Adapter Engine Status The
number of threads corresponds to the number of consumed permits
In newer Wily versions there is also a dashboard showing the number of consumed permits as well The
Worker Threads on the right hand side of the screenshot correspond to the permits
SAP NETWEAVER 71 AND HIGHER PERFORMANCE CHECK GUIDE
90
9 GENERAL HARDWARE BOTTLENECK
During all tuning actions discussed in the previous chapters you must keep in mind that the limitation of all
activities is set by the underlying CPU and memory capacity The physical server and its hardware have to
provide resources for three PI runtimes the Adapter Engine the Integration Engine and the Business
Process Engine Tuning one of the engines for high throughput leaves fewer resources for the remaining
engines Thus the hardware capacity has to be monitored closely
91 Monitoring CPU Capacity
When monitoring the CPU capacity it is not enough to use the average that is displayed in the ldquoPrevious
Hoursrdquo section of transaction ST06 Instead you should start your interface and monitor the CPU while it is
running The best procedure is to use operating system tools to monitor the CPU usage (particularly if using
hardware virtualization)
The SMD Host Agent also reports CPU data to Wily Introscope which can be viewed using dashboards as
shown below This example shows two systems where one is facing a temporary CPU overload and the
other a permanent one
Also the NWA offers a view on the CPU activity from NetWeaver 73 on via Availability and Performance
Management Resource Monitoring History Reports There you can build your own report based on the
ldquoCPU utilizationrdquo data as shown in the screenshot
SAP NETWEAVER 71 AND HIGHER PERFORMANCE CHECK GUIDE
91
You can also monitor the CPU usage in ST06 as described below
Procedure
Log on to your Integration Server and call transaction ST06 Take a look at the snapshot that is provided on
the entry screen than navigate to ldquoDetailed Analysis Menurdquo
Snapshot view Is the idle time (upper left corner) at a reasonable value at all times for example around 10 or higher
Snapshot view The load average is a good indicator of the dimension of the bottleneck It describes the number of processes for each CPU that are in a wait queue before they are assigned to a free CPU As long as the average remains at one process for each available CPU the CPU resources are sufficient Once there is an average of around three processes for each available CPU there is a bottleneck at the CPU resources In connection with a high CPU usage a high value here can indicate that too many processes are active on the server In connection with a low CPU usage a high value here can indicate that the main memory is too small The processes are then waiting due to excessive paging
Detailed Analysis View TOP CPU Which thread uses up the highest amount of CPU Is it the J2EE Engine the work processes or the database
o There are different follow-up actions to be taken depending on the findings of the second check The first option is of course to simply increase the hardware This should be accompanied by a thorough sizing (for which SAP provides the Quicksizer in the Service Marketplace httpservicesapcomquicksizer )
o The second option is to identify the CPU-consuming threads and to think about a reduction of the load in this component For example if the J2EE Engine is the largest consumer then it is worth re-evaluating the number of concurrent mapping threads andor consumer queues as described in the previous chapters
o SAP Note 742395 - Analyzing High CPU Usage by the J2EE Engine provides a good entry point if the J2EE Engine consumes too much CPU
o If it is the work processes that consume a lot of CPU use transaction ST03N to figure out if it is the Integration Server or the Business Process Engine You can do that by looking at the CPU usage per user BPE uses the user WF-BATCH while the Integration Server uses the last user who activated a qRFC queue (typically PIAFUSER or PIAPPLUSER) Use the previous chapter to restrict these activities
92 Monitoring Memory and Paging Activity
As stated above paging is very critical for the Java stack since it influence the Java GC behavior directly
Therefore paging should be avoided in every case for a Java-based system
The OS tools are the most reliable for monitoring the paging activity on your system Transaction ST06 can
also be used to perform a snapshot analysis Take a look at the snapshot that is provided on the entry
screen
Snapshot view Is there enough physical memory available
Snapshot view Is there considerable paging Paging can have a negative influence on your J2EE Engine If it does this can be seen in long GC times as described in Chapter 661
93 Monitoring the Database
Monitoring database performance is a rather complex task and requires information to be gathered from a
variety of sources Only a basic set of indicators is given for the purpose of this guide A more detailed
SAP NETWEAVER 71 AND HIGHER PERFORMANCE CHECK GUIDE
92
analysis is required if these indicators point to a major performance problem in the database If assistance is
needed open a support message under the component BC-DB-ORA (or MSS SDB DB6 respectively)
931 Generic J2EE database monitoring in NWA
The next sections of this chapter will be mainly based on ABAP transactions to do a detailed analysis of the
database performanceThe NWA however offers possibilities to monitor the database performance for the
Java based tables This is especially helpful for Java only AEXPO or Non-Central AAEs In the NWA you
can use the ldquoOpen SQL Monitorrdquo in the Troubleshooting section of NWA The official documentation can be
found in the Online Help Monitoring DB via DBACOCKPIT transaction (ABAP based) is possible also for the
Java-only systems from SAP Solution Manager (DBA Cockpit must be configured in the Managed System
Setup)
It will be too much to outline all the available functionalities here Instead only a few key capabilities will be
demonstrated If you want to eg see the number of select update or insert statements in your system you
can use the ldquoTable Statistics Monitorrdquo It clearly shows you which tables in your system are accessed the
most frequently
To see the processing time of the different statements on your system you can use the ldquoOpen SQL statisticsrdquo
monitor There you can see the count the total average and max processing time of the individual SQL
SAP NETWEAVER 71 AND HIGHER PERFORMANCE CHECK GUIDE
93
statements and can therefore identify the expensive statements on your system
Per default the recorded period is always from the last restart of the system If you would like to just look at
the statistics for a specific time period (eg during a test) you have the option of resetting the statistics in the
individual monitor prior to the test
932 Monitoring Database (Oracle)
Procedure
Log on to your Integration Server and call transaction ST04
SAP NETWEAVER 71 AND HIGHER PERFORMANCE CHECK GUIDE
94
Many of the numbers in the screenshot above depend on each other The following checklist names a few
key performance figures of your Oracle database
The data buffer quality for instance is based on the ratio of physical reads versus the total number of reads The lower the ratio the better the buffer quality The data buffer quality should be better than 94 the statistics should be based on 15 million total reads This number of reads ensures that the database is in an equilibrated state
Ratio of user and recursive calls A good performance is indicated by ratio values greater than 2 Otherwise the number of recursive calls compared to the number of user calls is too high Over time this ratio always declines because more and more SQL statements get parsed in the meantime
Number of reads for each user call If this value exceeds 30 blocks for each user call this indicates an expensive SQL statement
Check the value of TimeUser call Values larger than 15 ms often indicate an optimization issue
Compare busy wait time versus CPU time A ratio of 6040 generally indicates a well-tuned system Significantly higher values (for example 8020) indicate room for improvement
The DD-cache quality should be better than 80
933 Monitoring Database (MS SQL)
Procedure
To display the most important performance parameters of the database call Transaction ST04 or choose
Tools Administration Monitor Performance Database Activity An analysis is only meaningful if
the database has been running for several hours with a typical workload To ensure a significant database
SAP NETWEAVER 71 AND HIGHER PERFORMANCE CHECK GUIDE
95
workload we recommend a minimum of 500 CPU busy seconds Note The default values displayed in
section Server Engine are relative values To display the absolute values press button Absolute values
Check the values in (1)
The cache hit ratio (2) which is the main performance indicator for the data cache shows the
average percentage of requested data pages found in the cache This is the average value since startup The value should always be above 98 (even during heavy workload) If it is significantly below 98 the data cache could be too small To check the history of these values use Transaction ST04 and choose Detail Analysis Menu Performance Database A snapshot is collected every 2 hours
Memory setting (5) shows the memory allocation strategy used and shows the following
FIXED SQL Server has a constant amount of memory allocated which is set by SQL Server configuration parameters min server memory (MB) = max server memory (MB)
RANGE SQL Server dynamically allocates memory between min server memory (MB) lt gt max server memory (MB)
AUTO SQL Server dynamically allocates memory between 4 MB and 2 PB which is set by min server memory (MB) = 0 and max server memory (MB) = 2147483647
FIXED-AWE SQL Server has a constant amount of memory allocated which is set by min server memory (MB) = max server memory (MB) In addition the address windowing extension functionality of Windows 2000 is enabled
934 Monitoring Database (DB2)
Procedure
To get an overview of the overall buffer pool usage catalog and package cache information go to
transaction ST04 choose Performance Database section Buffer Pool (or section Cache respectively)
1 1
1 2
1 3
1 5
1 4
gt 6h
gt 98
SAP NETWEAVER 71 AND HIGHER PERFORMANCE CHECK GUIDE
96
Buffer Pools Number Number of buffer pools configured in this system
Buffer Pools Total Size The total size of all configured buffer pools in KB If more than one buffer pool is used choose Performance Buffer Pools to get the size and buffer quality for every single buffer pool
Overall buffer quality This represents the ratio of physical reads to logical reads of all buffer pools
Data hit ratio In addition to overall buffer quality you can use the data hit ratio to monitor the database (data logical reads - data physical reads) (data logical reads) 100
Index hit ratio In addition to overall buffer quality you can use the index hit ratio to monitor the database (index logical reads - index physical reads) (index logical reads) 100
Data or Index logical reads The total number of read requests for data or index pages that went through the buffer pool
Data or Index physical reads The total number of read requests that required IO to place data or index pages in the buffer pool
Data synchronous reads or writes Read or write requests performed by db2agents
SAP NETWEAVER 71 AND HIGHER PERFORMANCE CHECK GUIDE
97
Catalog cache size Maximum size of the catalog cache that is used to maintain the most frequently accessed sections of the catalog
Catalog cache quality Ratio of catalog entries (inserts) to reused catalog entries (lookups)
Catalog cache overflows Number of times that an insert in the catalog cache failed because the catalog cache was full (increase catalog cache size)
Package cache size Maximum size of the package cache that is used to maintain the most frequently accessed sections of the package
Package cache quality Ratio of package entries (inserts) to reused package entries (lookups)
Package cache overflows Number of times that an insert in the package cache failed because the package cache was full (increase package cache size)
935 Monitoring Database (MaxDB SAP DB)
Procedure
As with the other database types call transaction ST04 to display the most important performance
parameters
SAP NETWEAVER 71 AND HIGHER PERFORMANCE CHECK GUIDE
98
With the Database Performance Monitor (transaction ST04) and its submonitors the CCMS in the SAP R3
System allows you to view in the SAP R3 System all of the information that can be used to identify
bottleneck situations
The SQL Statements section provides information about the number of SQL statements executed and related sizes
The IO Activity section lists physical and logical read and write accesses to the database
The Lock Activity section (in transaction ST04) allows you to identify possible bottlenecks in the assignment of locks by the database
The Logging Activity section combines information about the log area
The Scan and sort activity section can be helpful in identifying that suitable indexes are missing
The Cache Activity section provides information about the usage of the caches and the associated hit rates
o The data cache Hit rate should be 99 in a balanced system If this is not the case you need to check if the low hit rate is due to the size of the data cache being too small or due to an unsuitable SQL statement If necessary you can increase the data cache by increasing the MaxDB parameter Data_Cache_Size (lower than 74) or Cache_Size (74 or higher)
o The catalog cache hit rate should be 85 in a balanced system It is not a cause for concern if the catalog hit rate is temporarily lower since accesses to the system tables and an active command monitor can temporarily impair the hit rate If the catalog cache is busy the pages are paged out in the data cache rather than on the hard disk
o Log entries are not written directly to the log volume but first into a buffer (LOG_IO_QUEUE) so as to be able to write several log entries together asynchronously with one IO on the hard disk Only once a LOG_IO_QUEUE page is full is it written to the hard disk However there are situations in which you need to write LOG entries from the LOG_QUEUE onto the hard disk as quickly as possible for example if transactions are completed (COMMITROLLBACK) The transactions wait until the log writer reports the OK informing them that the log entry is on the hard disk Firstly this means that is important to use the quickest possible hard disks for the log volume(s) and secondly you must ensure that no LOG_QUEUE_OVERFLOWS occur in production operation If the LOG_IO_QUEUE is full then all transactions that want to write LOG entries must wait until free memory becomes available again in the LOG_IO_QUEUE At LOG_QUEUE_OVERFOLWS (Transaction DB50 -gt Current Status -gt Activities Overview -gt LOG_IO_QUEUE Overflow) you need to increase the LOG_IO_QUEUE parameter
SAP NETWEAVER 71 AND HIGHER PERFORMANCE CHECK GUIDE
99
o In accordance with Note 819324 - FAQ MaxDB SQL optimization check which SQL statements are responsible for the most disk accesses and whether they can be optimized You should also optimize SQL statements that have a poor runtime and poor selectivity
Bottleneck Analysis
The Bottleneck Analysis function is available in transaction ST04 under the Problem Analyzes
Performance Database Analyzer Bottlenecks You can use this function to activate the corresponding
analysis tool dbanalyzer
The dbanalyzer then collects important performance data every 15 minutes and evaluates this for possible
bottlenecks
The result of the bottleneck analysis is output in text format to provide a quick overview of possible causes of
performance problems For a more detailed description of the bottleneck messages see the online
documentation (httphelpsapcom) in the SAP Web Application Server area and search for SAP DB
bottleneck analysis messages
The dbanalyzer tool can also be started at operating system level It logs its analysis results in files with date
stamps in the subdirectory ltrundirectorygtanalyzer (you can find the actual directory by double-clicking on
lsquoPropertiesrsquo in DB50) of the relevant database instance
94 Monitoring Database Tables
Some of the tables of SAP PI grow very quickly and can cause severe performance problems if archiving or
deletion does not take place frequently For troubleshooting see SAP Note 872388 ndash Troubleshooting
Archiving and Deletion in PI
Procedure
Log on to your Integration Server and call transaction SE16 Enter the table names as listed below and execute In the following screen simply press the button ldquoNumber of Entriesrdquo The most important tables are SXMSPMAST (cleaned up by XML message archivingdeletion)
If you use the switch procedure you have to check SXMSPMAST2 as well
SXMSCLUR SXMSCLUP (cleaned up by XML message archivingdeletion)
If you use the switch procedure you have to check SXMSPCLUR2 and SXMSCLUP2 as well
SAP NETWEAVER 71 AND HIGHER PERFORMANCE CHECK GUIDE
100
SXMSPHIST (cleaned up by the deletion of history entries)
If you use the switch procedure you have to check SXMSPHIST2 as well
SXMSPFRAWH and SXMSPFRAWD (cleaned up by the performance jobs see SAP Note 820622 ndash Standard Jobs for XI Performance Monitoring)
SWFRXI (cleaned up by specific jobs see SAP Note 874708 - BPE HT Deleting Message Persistence Data in SWFRXI)
SWWWIHEAD (cleaned up by work item archivingdeletion)
Use an appropriate database tool for example SQLPLUS for Oracle for the database tables of the J2EE schema Main tables that could be affected of growth
PI Message tables BC_MSG and BC_MSG_AUDIT (when audit log persistence is enabled)
PI message logging information when stagingloging is used BC_MSG_LOG_VERSION
XI IDoc tables (if IDoc persistence is activated) XI_IDOC_IN_MSG and XI_IDCO_OUT_MSG
Check for all tables if the number of entries is reasonably small or remains roughly constant over a period of time If that is not the case check your archivingdeletion setup
SAP NETWEAVER 71 AND HIGHER PERFORMANCE CHECK GUIDE
101
10 TRACES LOGS AND MONITORING DECREASING PERFORMANCE
101 Integration Engine
There are three important locations for the configuration of tracing logging in the Integration Engine The
pipeline settings of PI itself the Internet Communication Manager (ICM) and the gateway All three are
heavily involved in message processing and therefore their tracing or logging settings can have an impact on
performance On top of this you might have changed the SM59 RFC destinations and have switched on the
trace in order to analyze a problem If so then this needs to be reset as well
Procedure
Start transaction SXMB_ADM and navigate to Integration Engine Configuration Specific Configuration and search for the following entries
Category Parameter Subparameter Current Value Default
RUNTIME TRACE_LEVEL ltnonegt ltyour valuegt 1
RUNTIME LOGGING ltnonegt ltyour valuegt 0
RUNTIME LOGGING_SYNC ltnonegt ltyour valuegt 0
Set the above parameters back to the default value which is the recommended value by SAP
Start transaction SMICM and check the value of the Trace Level that is displayed in the overview
(third line) Set the trace level to lsquo1rsquo if not already the case You can do so by navigating to Goto Trace Level Set
Start transaction SMGW navigate to Goto Parameters Display and check the parameter Trace Level Set the trace level to lsquo1rsquo if not already the case You can do so by navigating to Goto Trace Gateway Reduce Level (or Increase Level respectively)
Start transaction SM59 and search the following RFC destination for the flag ldquoTracerdquo on the tab Special Options and remove the Flag ldquoTracerdquo if it has been set
AI_RUNTIME_JCOSERVER
AI_DIRECTORY_JCOSERVER
LCRSAPRFC
SAPSLDAPI It is possible that other RFC destinations are used for sending out IDocs and similar
SAP NETWEAVER 71 AND HIGHER PERFORMANCE CHECK GUIDE
102
102 Business Process Engine
You only have to check the Event Trace in the Business Process Engine
Procedure
Call transaction SWELS and check if the Event Trace is switched on The recommended setting is lsquooffrsquo (as shown in the screenshot below)
103 Adapter Framework
Since the Adapter Framework runs on the J2EE Engine the tracing and logging can be conveniently
checked and controlled using NetWeaver Administrator To improve the performance SAP recommends that
you set all trace levels to default Higher trace levels are only acceptable in productive usage during problem
analysis Below you will find a description on how to set the default trace level for all locations at once It is of
possible to do it for every location separately but this way you might forget to reset one of the locations
Procedure
Start the NetWeaver Administrator and navigate to Problem Management (or Troubleshooting in NW 73 and higher) Logs and Traces and choose Log Configuration In the Show drop down list box choose Tracing Locations Select the Root Location in the tree and press the button Default Configuration This will set the default configuration for all locations
Start the NetWeaver Administrator and navigate to Troubleshooting Logviewer (direct link nwalinks) Open the View ldquoDeveloper Tracerdquo and check if you have very frequent reoccurring exceptions that fill up the trace Analyze the exception and check what is causing this (eg a wrong configuration of a Communication Channel causing repeated traces If you see very frequent errors for which you cannot find the root cause open a customer incident at SAP
SAP NETWEAVER 71 AND HIGHER PERFORMANCE CHECK GUIDE
103
An aggregated view of Java exceptions (by number date instance server node etc) are reported and available in SAP Solution Manager Root Cause Analysis Exception Analysis functionality
1031 Persistence of Audit Log information in PI 710 and higher
With SAP NetWeaver PI 71 the audit log is not persisted for successful messages in the database by default
to avoid performance overhead Therefore the audit log is only available in the cache for a limited period of
time (based on the overall message volume)
Audit log persistence can be activated temporarily for performance troubleshooting where audit log
information is required To do so use the NWA and change the parameter
ldquomessagingauditLogmemoryCacherdquo to false in service XPI Service Messaging System by setting the
parameter to false Details can be found in SAP Note 1314974 - PI 71 AF Messaging System audit log
persistence Only do so temporarily during the time of troubleshooting to avoid any performance problems
from the additional persistence
After implementing Note 1611347 - New data columns in Message Monitoring additional information like
message processing time in ms and server node is visible in the message monitor
SAP NETWEAVER 71 AND HIGHER PERFORMANCE CHECK GUIDE
104
11 ERRORS AS SOURCE OF PERFORMANCE PROBLEMS
If errors occur within messages or within technical components of the SAP Process Integration then this can
have a severe impact on the overall performance Thus to solve performance problems it is sometimes
necessary to analyze the log files of technical components and to search for messages with errors To
search for messages with errors use the PI Admin Check which is available using SAP Note 884865 - PIXI
Admin Check
Procedure
ICM (Internet Communication Manager)
Start transaction SMICM open the log file (Shift + F5 or GoTo Trace File Show All) and check for errors
Gateway
Start transaction SMGW open the Log File (CTRL + Shift + F10 or Goto Trace Gateway Display File) and check for errors
System Log
Start transaction SM21 choose an appropriate time interval and search the log entries for errors Repeat the procedure for remote systems if you are using dialog instances
ABAP Runtime Errors
Start transaction ST22 choose an appropriate time interval and search for PI-related dumps In general the number of ABAP dumps should be very small on a PI system and therefore all occurring dumps should be analyzed
Alerts CCMS
Start transaction RZ20 and search for recent alerts
Work Process and RFC trace
In the PI work directory check all files which begin with dev_rfc or dev_w for errors
J2EE Engine
In the PI work directory search for errors in file dev_server0out If you are using more than one J2EE server node check dev_serverltngtout as well
Applications running on the J2EE Engine
The traces for application-related errors are the defaulttrc files located in j2eeclusterserverltngtlog directory To monitor exceptions across multiple server nodes the best tool to use is the LogViewer service of the NWA This is available via Problem Management Logs and Traces and choose Log Viewer Search for exceptions in the area of the performance problem for example the PI Messaging system
SAP NETWEAVER 71 AND HIGHER PERFORMANCE CHECK GUIDE
105
APPENDIX A
A1 Wily Introscope Transaction Trace
As mentioned above the Wily Transaction trace can be used to trace expensive steps that were noticed
during the mapping or module processing The transaction trace will allow you to drill down further into Java
performance problems and to distinguish if it is a pure coding problem or caused by a look-up to a remote
system or a slow connection to the local database
The Wily Transaction trace can be used to trace all steps that exceed a specific duration on the Java stack If
a user is known (for example for SAP Enterprise Portal) the tracing can be restricted to a specific user In PI
if you encounter a module that lasts several seconds then you can restrict the tracing as shown below
Note Starting the Transaction Trace increases the data collection on the satellite system (PI) and is
therefore only recommended in productive environment for troubleshooting purposes
With the selection above the trace will run for 10 minutes (this is the maximum and it can be canceled earlier)
and will trace all steps exceeding 3 seconds for the agents of the PI system If such long-running steps are
found then a new window will be displayed listing these steps
In the screenshot below you can see the result in the Trace View The Trace View shows the elapsed time
from left to rightndash in the example below around 48 seconds From top to bottom we can see the call stack of
the thread In general we are interested in long-running threads on the bottom of the trace view A long-
running block at the bottom means that this is the lowest level coding that was instrumented and which is
consuming all the time
In the example below we see a mapping call that is performing many individual database statements ndash this
will become visible by highlighting the lowest level In such a case you have to review the coding of the
mapping to see if the high amount of database calls can be summarized in one call
SAP NETWEAVER 71 AND HIGHER PERFORMANCE CHECK GUIDE
106
Another case that is often seen is that a lookup using JDBC to a remote database or RFC to an ABAP
system takes a long time in the mapping or adapter module In such a case there will be one long block at
the bottom of the transaction trace that also gives you some details about the statement that was executed
A2 XPI inspector for troubleshooting and performance analysis
The XPI Inspector is an additional tool that provides enhanced logging and tracing capabilities with a main
focus on troubleshooting But the tool can also be used for troubleshooting of performance issues
General information about the tool can be found at Note 1514898 - XPI Inspector for troubleshooting PI The
tool can be called using the following URL on your system httphostjava-portxpi_inspector
To analyze performance problems typically the example ldquo51 ndash ldquoPerformance Problem)rdquo is used As a basic
measurement it allows you to take multiple thread dumps in specific time intervals These thread dumps can
be analyzed later by your administrators or SAP support to identify what is causing the problem The Thread
Dump Viewer tool (TDV) from Note 1020246 - Thread Dump Viewer for SAP Java Engine can be used to
analyze the produced thread dumps (inside the results archive that can be downloaded to your local PC)
SAP NETWEAVER 71 AND HIGHER PERFORMANCE CHECK GUIDE
107
In addition the tool allows you to do JVM profiling be either doing JVM Performance tracing or JVM Memory
Allocation tracing This can help to understand in detail which steps of the processing are taking a long time
As output the tool provides prf files that can be loaded into the JVM Profiler More information can be found
at httpwikiscnsapcomwikidisplayASJAVAJava+Profiling Please Note that these traces (especially the
memory profiling) will cause a high overhead on the J2EE engine and are therefore not recommended to be
used in production Instead it is advisable to reproduce the problem on your QA system and use the tool
there
Document Version 30 March 2014
wwwsapcom
copy 2014 SAP AG All rights reserved
SAP R3 SAP NetWeaver Duet PartnerEdge ByDesign SAP
BusinessObjects Explorer StreamWork SAP HANA and other SAP
products and services mentioned herein as well as their respective
logos are trademarks or registered trademarks of SAP AG in Germany
and other countries
Business Objects and the Business Objects logo BusinessObjects
Crystal Reports Crystal Decisions Web Intelligence Xcelsius and
other Business Objects products and services mentioned herein as
well as their respective logos are trademarks or registered trademarks
of Business Objects Software Ltd Business Objects is an SAP
company
Sybase and Adaptive Server iAnywhere Sybase 365 SQL
Anywhere and other Sybase products and services mentioned herein
as well as their respective logos are trademarks or registered
trademarks of Sybase Inc Sybase is an SAP company
Crossgate mgic EDDY B2B 360deg and B2B 360deg Services are
registered trademarks of Crossgate AG in Germany and other
countries Crossgate is an SAP company
All other product and service names mentioned are the trademarks of
their respective companies Data contained in this document serves
informational purposes only National product specifications may vary
These materials are subject to change without notice These materials
are provided by SAP AG and its affiliated companies (SAP Group)
for informational purposes only without representation or warranty of
any kind and SAP Group shall not be liable for errors or omissions
with respect to the materials The only warranties for SAP Group
products and services are those that are set forth in the express
warranty statements accompanying such products and services if
any Nothing herein should be construed as constituting an additional
warranty
wwwsapcom

SAP NETWEAVER 71 AND HIGHER PERFORMANCE CHECK GUIDE
3
(ICO) scenarios
Additional new chapters
Prevent blocking of EO queues
Avoid uneven backlogs with queue balancing
Reduce the number of EOIO queues
Adapter Framework Scheduler
Avoid blocking of Java only scenarios
J2EE HTTP load balancing
Persistence of Audit Log information in PI 710 and higher
Logging Staging on the AAE (PI 73 and higher)
11 December 2009 Reason for new version Adaption to PI 71
General review of entire document with corrections
Additional new chapters
Tuning the IDoc adapter
Message Prioritization on the ABAP stack
Prioritization in the Messaging System
Avoid blocking caused by single slowhanging receiver interface
Performance of Module Processing
Advanced Adapter Engine Integrated Configuration
ABAP Proxy system tuning
Wily Transaction Trace
10 October 2007 Initial document version released for XI 30 and PI 70
SAP NETWEAVER 71 AND HIGHER PERFORMANCE CHECK GUIDE
4
TABLE OF CONTENTS
1 INTRODUCTION 6
2 WORKING WITH THIS DOCUMENT 10
3 DETERMINING THE BOTTLENECK 12 31 Integration Engine Processing Time 12 32 Adapter Engine Processing Time 13 321 Adapter Engine Performance monitor in PI 731 and higher 15 33 Processing Time in the Business Process Engine 16
4 ANALYZING THE INTEGRATION ENGINE 20 41 Work Process Overview (SM50SM66) 21 42 qRFC Resources (SARFC) 22 43 Parallelization of PI qRFC Queues 23 44 Analyzing the runtime of PI pipeline steps 29 441 Long Processing Times for ldquoPLSRV_RECEIVER_ DETERMINATIONrdquo PLSRV_INTERFACE_DETERMINATION 30 442 Long Processing Times for ldquoPLSRV_MAPPING_REQUESTrdquo 30 443 Long Processing Times for ldquoPLSRV_CALL_ADAPTERrdquo 33 444 Long Processing Times for ldquoDB_ENTRY_QUEUEINGrdquo 34 445 Long Processing Times for ldquoDB_SPLITTER_QUEUEINGrdquo 34 446 Long Processing Times for ldquoLMS_EXTRACTIONrdquo 36 447 Other step performed in the ABAP pipeline 36 45 PI Message Packaging for Integration Engine 37 46 Prevent blocking of EO queues 38 47 Avoid uneven backlogs with queue balancing 38 48 Reduce the number of parallel EOIO queues 40 49 Tuning the ABAP IDoc Adapter 41 491 ABAP basis tuning 41 492 Packaging on sender and receiver side 42 493 Configuration of IDoc posting on receiver side 42 410 Message Prioritization on the ABAP Stack 44
5 ANALYZING THE BUSINESS PROCESS ENGINE (BPE) 45 51 Work Process Overview 45 52 Duration of Integration Process Steps 45 53 Advanced Analysis Load Created by the Business Process Engine (ST03N) 47 54 Database Reorganization 47 55 Queuing and ccBPM (or increasing Parallelism for ccBPM Processes) 48 56 Message Packaging in BPE 48
6 ANALYZING THE (ADVANCED) ADAPTER ENGINE 50 61 Adapter Performance Problem 51 611 Adapter Parallelism 51 612 Sender Adapter 54 613 Receiver Adapter 55 614 IDoc_AAE adapter tuning 56 615 Packaging for Proxy (SOAP in XI 30 protocol) and Java IDoc adapter 56 616 Adapter Framework Scheduler 58 62 Messaging System Bottleneck 60 621 Messaging System in between AFW Sender Adapter and Integration Server (Outbound) 63 622 Messaging System in Between Integration Server and AFW Receiver Adapter (Inbound) 64 623 Interface Prioritization in the Messaging System 64 624 Avoid Blocking Caused by Single SlowHanging Receiver Interface 65 625 Overhead based on interface pattern being used 67 63 Performance of Module Processing 68 64 Java only scenarios Integrated Configuration objects 69
SAP NETWEAVER 71 AND HIGHER PERFORMANCE CHECK GUIDE
5
641 General performance gain when using Java only scenarios 69 642 Message Flow of Java only scenarios 71 643 Avoid blocking of Java only scenarios 73 644 Logging Staging on the AAE (PI 73 and higher) 73 65 J2EE HTTP load balancing 75 66 J2EE Engine Bottleneck 76 661 Java Memory 76 662 Java System and Application Threads 80 663 FCA Server Threads 83 664 Switch Off VMC 84
7 ABAP PROXY SYSTEM TUNING 85 71 New enhancements in Proxy queuing 86
8 MESSAGE SIZE AS SOURCE OF PERFORMANCE PROBLEMS 87 81 Large message queues on PI ABAP 88 82 Large message queues on PI Adapter Engine 88
9 GENERAL HARDWARE BOTTLENECK 90 91 Monitoring CPU Capacity 90 92 Monitoring Memory and Paging Activity 91 93 Monitoring the Database 91 931 Generic J2EE database monitoring in NWA 92 932 Monitoring Database (Oracle) 93 933 Monitoring Database (MS SQL) 94 934 Monitoring Database (DB2) 95 935 Monitoring Database (MaxDB SAP DB) 97 94 Monitoring Database Tables 99
10 TRACES LOGS AND MONITORING DECREASING PERFORMANCE 101 101 Integration Engine 101 102 Business Process Engine 102 103 Adapter Framework 102 1031 Persistence of Audit Log information in PI 710 and higher 103
11 ERRORS AS SOURCE OF PERFORMANCE PROBLEMS 104
APPENDIX A 105 A1 Wily Introscope Transaction Trace 105 A2 XPI inspector for troubleshooting and performance analysis 106
SAP NETWEAVER 71 AND HIGHER PERFORMANCE CHECK GUIDE
6
1 INTRODUCTION
SAP NetWeaver Process Integration (PI) consists of the following functional components Integration Builder
(including Enterprise Service Repository (ESR) Service Registry (SR) and Integration Directory) Integration
Server (including Integration Engine Business Process Engine and Adapter Engine) Runtime Workbench
(RWB) and System Landscape Directory (SLD) The SLD in contrast to the other components may not
necessarily be part of the PI system in your system landscape because it is used by several SAP NetWeaver
products (however it will be accessed by the PI system regularly) Additional components in your PI
landscape might be the Partner Connectivity Kit (PCK) a J2SE Adapter Engine one or several non-central
Advanced Adapter Engines or an Advanced Adapter Engine Extended An overview is given in the graphic
below The communication and accessibility of these components can be checked using the PI Readiness
Check (SAP Note 817920)
Processing at runtime is carried out by the Integration Server (IS) with the aid of the SLD The IS in this
graphic stands for the Web Application Server 70 or higher In the classic environment PI is installed as a
double stack an ABAP and a Java stack (J2EE Engine) The ABAP stack is responsible for pipeline
processing in the Integration Engine (Receiver Determination Interface Determination and so on) and the
processing of integration processes in the Business Process Engine Every message has to pass through
the ABAP stack The Java stack executes the mapping of messages (with the exception of ABAP mappings)
and hosts the Adapter Framework (AFW) The Adapter Framework contains all XI adapters except the plain
HTTP WSRM and IDoc adapters
SAP NETWEAVER 71 AND HIGHER PERFORMANCE CHECK GUIDE
7
With 71 the so called Advanced Adapter Engine (AAE) was introduced The Adapter Engine was enhanced
to provide additional routing and mapping call functionality so that it is possible to process messages locally
This means that a message that is handled by a sender and receiver adapter based on J2EE does not need
to be forwarded to the ABAP Integration Engine This saves a lot of internal communication reduces the
response time and significantly increases the overall throughput The deployment options and the message
flow for 71 based systems and higher are shown below Currently not all the functionalities available in the
PI ABAP stack are available on the AAE but each new PI release closes the gap further
In SAP PI 73 and higher the Adapter Engine Extended (AEX) was introduced In addition to the AAE the
Adapter Engine Extended also allows local configuration of the PI objects The AEX can therefore be seen
as a complete PI installation running on Java only From the runtime perspective no major differences can be
seen compared to the AAE and therefore no differentiation is made in this guide
SAP NETWEAVER 71 AND HIGHER PERFORMANCE CHECK GUIDE
8
Looking at the different involved components we get a first impression of where a performance problem
might be located In the Integration Engine itself in the Business Process Engine or in one of the Advanced
Adapter Engines (central non-central plain PCK) Of course a performance problem could also occur
anywhere in between for example in the network or around a firewall Note that there is a separation
between a performance issue ldquoin PIrdquo and a performance issue in any attached systems If viewed ldquothrough
the eyesrdquo of a message (that is from the point of view of the message flow) then the PI system technically
starts as soon as the message enters an adapter or (if HTTP communication is used) as soon as the
message enters the pipeline of the Integration Engine Any delay prior to this must be handled by the
sending system The PI system technically ends as soon as the message reaches the target system for
example a given receiver adapter (or in case of HTTP communication the pipeline of the Integration Server)
has received the success message of the receiver Any delay after this point in time must be analyzed in the
receiving system
There are generally two types of performance problems The first is a more general statement that the PI
system is slow and has a low performance level or does not reach the expected throughput The second is
typically connected to a specific interface failing to meet the business expectation with regard to the
processing time The layout of this check is based on the latter First you should try to determine the
component that is responsible for the long processing time or the component that needs the highest absolute
time for processing Once this has been clarified there is a set of transactions that will help you to analyze
the origin of the performance problem
If the recommendations given in this guide are not sufficient SAP can help you to optimize the service via
SAP consulting or SAP MaxAttention services SAP might also handle smaller problems restricted to a
specific interface if you describe your problem in a SAP customer incident Support offerings like ldquoSAP
Going Live Analysis (GA)rdquo and ldquoSAP Going Live Verification (GV)rdquo can be used to ensure that the main
system parameters are configured according to SAP best practice You can order any type of service using
SAP Service Marketplace or your local SAP contacts
If you have already worked with the PI Admin Check (SAP Note 884865) you will recognize some of the
transactions This is because SAP considers the regular checking of the performance to be an important
administrational task However this check tries to show the methodology to approach performance problems
to its reader Also it offers the most common reasons for performance problems and links to possible follow-
up actions but does not refer to any regular administrational transactions
SAP NETWEAVER 71 AND HIGHER PERFORMANCE CHECK GUIDE
9
Wily Introscope is a prerequisite for analyzing performance problems at the Java side It allows you to
monitor the resource usage of multiple J2EE server nodes and provides information about all the important
components on the Java stack like mapping runtime messaging system or module processor Furthermore
the data collected by Wily is stored for several days so it is still possible to analyze a performance problem at
a later date Wily Introscope is provided free-of-charge for SAP customers It is delivered as part of Solution
Manager Diagnostics but can also be installed separately For more information see
httpservicesapcomdiagnostics or SAP Note 797147
SAP NETWEAVER 71 AND HIGHER PERFORMANCE CHECK GUIDE
10
2 WORKING WITH THIS DOCUMENT
If you are experiencing performance problems on your Process Integration system start with Chapter 3
Determining the Bottleneck It helps you to determine the processing time for the different runtimes within PI
Integration Engine Business Process Engine and Adapter Engine or connected Proxy System Once you
have identified the area in which the bottleneck is most probably located continue with the relevant chapter
This is not always easy to do because a long processing time is not always an indication for a bottleneck It
can make sense to do this if a complicated step is involved (Business Process Engine) if an extensive
mapping is to be executed (IS) or if the payload is quite large (all runtimes) For this reason you need to
compare the value that you retrieve from Chapter 3 with values that you have received previously for
example The history data provided for the Java components by Wily Introscope is a big help If this is not
possible you will have to work with a hypothesis
Once the area of concern has been identified (or your first assumption leads you there) Chapters 4 5 6
and 7 will help you to analyze the Integration Engine the Business Process Engine the PI Adapter
Framework and the ABAP Proxy runtime
After (or preferably during) the analysis of the different process components it is important to keep in mind
that the bottlenecks you have observed could also be caused by other interfaces processing at the same
time It will lead you to slightly different conclusions and tuning measures You therefore have to distinguish
the following cases based on where the problem occurs
A with regard to the interface itself that is it occurs even if a single message of this interface is processed
B or with regard to the volume of this interface that is many messages of this interface are processed at the same time
C or with regard to the overall message volume processed on PI
This can be analyzed by repeating the procedure of Chapter 3 for A) a single message that is processed
while no other messages of this interface are processed and while no other interfaces are running Then
compare this value with B) the processing time for a typical amount of messages of this interface not simply
one message as before If the values of measurement A) and B) are similar repeat the procedure with C) a
typical volume of all interfaces that is during a representative timeframe on your productive PI system or
with the help of a tailored volume test
These three measurements ndash A) processing time of a single message B) processing time of a typical
amount of messages of a single interface and C) processing time of a typical amount of messages of all
interfaces ndash should enable you to distinguish between the three possible situations
o A specific interface has long processing steps that need to be identified and improved The tuning options are usually limited and a re-design of the interface might be required
o The mass processing of an interface leads to high processing times This situation typically calls for tuning measures
o The long processing time is a result of the overall load on the system This situation can be solved by tuning measures and by taking advantage of PI features for example to establish separation of interfaces If the bottleneck is hardware-related it could also require a re-sizing of the hardware that is used
SAP NETWEAVER 71 AND HIGHER PERFORMANCE CHECK GUIDE
11
Chapters 8 9 10 and 11 deal with more general reasons for bad performance such as heavy
tracinglogging error situations and general hardware problems They should be taken into account if the
reason for slow processing cannot be found easily or if situation C from above applies (long processing times
due to a high overall load)
Important
Chapter 9 provides the basic checks for the hardware of the PI server It should not only be used when
analyzing a hardware bottleneck due to a high overall load andor an insufficient sizing but should also be
used after every change made to the configuration of PI to ensure that the hardware is able to handle the
new situation This is important because a classical PI system uses three runtime engines (IS BPE AFW)
Tuning one engine for high throughput might have a direct impact on the others With every tuning action
applied you have to be aware of the consequences on the other runtimes or the available hardware
resources
SAP NETWEAVER 71 AND HIGHER PERFORMANCE CHECK GUIDE
12
3 DETERMINING THE BOTTLENECK
The total processing time in PI consists of the processing time in the Integration Server processing time in
the Business Process Engine (if ccBPM is used) as well as the processing time in the Adapter Framework (if
adapters except IDoc plain HTTP or ABAP proxies are used) In the subsequent chapters you will find a
detailed description of how to obtain these processing times
For reasons of completeness we will also have a look at the ABAP Proxy runtime and the available
performance evaluations
31 Integration Engine Processing Time
You can use an aggregated view of the performance (details about activation in Note 820622 - Standard jobs
for XI performance monitoring) data for the Integration Engine as shown below
Procedure
Log on to your Integration Engine and call transaction SXMB_IFR In the browser window follow the link to
the Runtime Workbench In there click ldquoPerformance Monitoringrdquo Change the display to ldquoDetailed Data
Aggregatedrdquo select lsquoISrsquo as the Data Source (or lsquoPMIrsquo if you have configured the Process Monitoring
Infrastructurersquo) and ldquoXIIntegrationServerltyour_hostgtrdquo as the component Then choose an appropriate time
interval for example the last day You have to enter the details of the specific interface you want to monitor
here
The interesting value is the ldquoProcessing Time [s]rdquo in the fifth column It is the sum of the processing time of the single steps in the Integration Server For now you are not interested in the single steps that are listed on the right side since you are still trying to find out the part of the PI system where the most time is lost Chapter 44 will work with the individual steps
SAP NETWEAVER 71 AND HIGHER PERFORMANCE CHECK GUIDE
13
If you do not know which interface is affected yet you first have to get an overview Instead of navigating to
Detailed Data Aggregated in the Runtime Workbench choose Overview Aggregated Use the button Display
Options and check the options for sender component receiver component sender interface and receiver
interface Check the processing times as described above
32 Adapter Engine Processing Time
Procedure
Log on to your Integration Server and call transaction SXMB_IFR In the browser window follow the link to
the Runtime Workbench In there click Message Monitoring choose Adapter Engine lthostgt from Database
from the drop down lists and press Display Enter your interface details and ldquoStartrdquo the selection Select one
message using the radio button and press Details
Calculate the difference between the start and end timestamp indicated on the screen
Do the above calculation for the outbound (AFW IS) as well as the inbound (IS AFW) messages
The audit log of successful message is no longer persisted in SAP NetWeaver PI 71 by default in order to minimize the load on the database The audit log has a high impact on the database load since it usually consists of many rows that are inserted individually in the database In newer releases therefore a cache was implemented that keeps the audit log information for a period of time only Thus no detailed information is available any longer from a historical point of view Instead you should use Wily Introscope for historical analyses of the performance of successful messages
The audit log can be persisted on the database to allow historical analysis of performance problems
on the Java stack To do so change the parameter ldquomessagingauditLogmemoryCacherdquo from
true to false for service ldquoXPI Service Messaging Systemrdquo using NetWeaver Administrator (NWA) as described in SAP Note 1314974 Note Only do this temporarily if you have identified the bottleneck on the AFW First try using Wily to determine the root cause of the problem
SAP NETWEAVER 71 AND HIGHER PERFORMANCE CHECK GUIDE
14
Due to above mentioned limitations Wily Introscope is the right tool for performance analysis of the Adapter Engine Wily persists the most important steps like queuing module processing and average response time in historical dashboards (aggregated data per intervals for all server nodes of a system or all systems with filters possible etc)
SAP NETWEAVER 71 AND HIGHER PERFORMANCE CHECK GUIDE
15
Especially for Java-Only runtime using Integrated Configuration Wily shows the complete processing time after the initial sender adapter steps (receiver determination mapping and time in the backend call) as can be seen in the Message Processing Time dashboard below
Using the ldquoShow Minimum and Maximumrdquo functionality deviations from the average processing time can be seen In the example below a message processing step takes up to 22 seconds The reason for this could either be a slow mapping or a delay in the call to the receiver system (in the example below Java IDoc adapter is used to transfer the data to ERP)
In case of high processing times in one of your steps further analysis might be required using thread dumps or the Java Profiler as outlined in the appendix section A2 XPI inspector for troubleshooting and performance analysis
321 Adapter Engine Performance monitor in PI 731 and higher
Starting from PI 731 SP4 there is a new performance monitor available for the Adapter Engine More
information on the activation of the performance monitor can be found at Note 1636215 ndash Performance
Monitoring for the Adapter Engine Similar to the ABAP monitor in the RWB the data is displayed in an
aggregated format On the PI start page use the link ldquoConfiguration and Monitoring Homerdquo Go to ldquoAdapter
Enginerdquo and select ldquoPerformance Monitorrdquo The data is persisted on an hourly basis for the last 24 hours and
on a daily basis for the last 7 days The data is further grouped on interface level and per Java server node
With the information provided you can therefore see the minimum maximum and average response time of
an individual interface on a specific Java server node All individual steps of the message processing like
time spent in the Messaging System queues or Adapter modules are listed In the example below you can
SAP NETWEAVER 71 AND HIGHER PERFORMANCE CHECK GUIDE
16
see that most of the time (5 seconds) is spent in a module called SimpleWaitModule This would be the entry
point for the further analysis
Starting with 731 SP10 (740 SP05) this data can be exported to excel in two ways Overview or Detailed (details in SAP Note 1886761)
33 Processing Time in the Business Process Engine
Procedure
Log on to your integration server and call transaction SXMB_MONI Adjust your selection in a way that you
select one or more messages of the respective interface Once the messages are listed navigate to the
Outbound column (or Inbound if your integration process is the sender) and click on PE Alternatively you
can select the radio button for ldquoProcess Viewrdquo on the entranceselection screen of SXMB_MONI
To judge the performance of an integration process it is essential to understand the steps that are executed A long-running integration process in itself is not critical because it can wait for a trigger event or can include a synchronous call to a backend Therefore it is important to understand the steps that are included before analyzing an individual workflow log For example the screenshot below shows a long waiting time after the mapping This is perhaps due to an integrated wait step
Calculate the time difference between the first and the last entry Note that this time for the workflow does not include the duration of RFC calls for example To see this processing time navigate to the ldquoList with Technical Detailsrdquo (second button from the left on the screenshot below or shift + F9) Repeat this step for several messages to get an overview about the most time consuming steps
Please Note that the processing time mentioned above does not include the waiting time of the messages in the ccBPM queues Therefore it is essential to monitor a queue backlog in ccBPM queues as discussed in section ldquoQueuing and ccBPM (or increasing Parallelism for ccBPM Processes)rdquo
SAP NETWEAVER 71 AND HIGHER PERFORMANCE CHECK GUIDE
17
Via transaction SWI2_DURA you can display an aggregated performance overview across all ccBPM
processes running on your PI system In the initial screen you have to choose ldquo(Sub-) Workflow and the time
range you would like to look at
SAP NETWEAVER 71 AND HIGHER PERFORMANCE CHECK GUIDE
18
The results here allow you to compare the average performance of a process It shows you the processing
time based on barriers The 50 barrier means that 50 of the messages were processed faster than the
value specified Furthermore you also see a comparison of the processing time to eg the day before By
adjusting the selection criteria of the transaction you can therefore get a good overview about the normal
processing time of the Integration process and can judge if there is a general performance problem or just a
temporary one
The number of process instances per integration process can be easily checked via transaction
SWI2_FREQ The data shown allows you to check the volume of the Integration Processes and allow you to
judge if your performance problem is caused by an increase of volume which could cause a higher latency in
the ccBPM queues
New in PI 73 and higher
Starting from PI 73 a new monitoring for ccBPM processes is available This monitor can be started from
transaction SXMB_MONI_BPE Integration Process Monitoring (also available in ldquoConfiguration and
Monitoring Homerdquo on PI start page) This is new browser based view that allows a simplified and aggregated
view on the PI Integration Processes
On the initial screen you get an overview about all the Integration Processes executed in the selected time
interval Therefore you can immediately see the volume of each Integration Process
From there you can navigate to the Integration process facing the performance issues and look at the
individual process instances and the start and end time Furthermore there is a direct entry point to see the
PI messages that are assigned to this process
SAP NETWEAVER 71 AND HIGHER PERFORMANCE CHECK GUIDE
19
Choosing one special process instance ID you will see the time spend in each individual processing step
within the process In the example below you can see that most of the time is spend in the Wait Step
SAP NETWEAVER 71 AND HIGHER PERFORMANCE CHECK GUIDE
20
4 ANALYZING THE INTEGRATION ENGINE
If chapter Determining the Bottleneck has shown that the bottleneck is clearly in the Integration Engine there
are several transactions that can help you to analyze the reason for this To understand why this selection of
transactions helps to analyze the problem it is important to know that the processing within the Integration
Engine is done within the pipeline The central pipeline of the Integration Server executes the following main
steps
Central Pipeline Steps Description of Central Pipeline Steps
PLSRV_XML_VALIDATION_RQ_INB XML Validation Inbound Channel Request
PLSRV_RECEIVER_DETERMINATION Receiver Determination
PLSRV_INTERFACE_DETERMINATION Interface Determination
PLSRV_RECEIVER_MESSAGE_SPLIT Branching of Messages
PLSRV_MAPPING_REQUEST Mapping
PLSRV_OUTBOUND_BINDING Technical Routing
PLSRV_XML_VALIDATION_RQ_OUT XML Validation Outbound Channel Request
PLSRV_CALL_ADAPTER Transfer to Respective Adapter IDoc HTTP Proxy AFW
PLSRV_XML_VALIDATION_RS_INBXML Validation Inbound Channel Response
PLSRV_MAPPING_RESPONSE Response Message Mapping
PLSRV_XML_VALIDATION_RS_OUT Validation Outbound Channel Response
The last three steps highlighted in bold are available in case of synchronous messages only and reflect the
time spent in the mapping of the synchronous response message
The steps indicated in red are new in SAP NetWeaver PI 71 and higher and can be used to validate the
payload of a PI message against an XML schema These steps are optional and can be executed at different
times in the PI pipeline processing for example before and after a mapping (as shown above)
With PI 731 an additional option of using an external Virus Scan during PI message processing can be
activated as described in the Online Help The Virus Scan can be configured on multiple steps in the pipeline
ndash eg after the mapping (Virus Scan Outbound Channel Request) when receiving a synchronous response
(Virus Scan Inbound Channel Response) and after the response mapping (Virus Scan Outbound Channel
Response)
It is important to know is that these pipeline steps are executed based on qRFC Logical Unit of Work (LUW)
by using dialog work processes
SAP NETWEAVER 71 AND HIGHER PERFORMANCE CHECK GUIDE
21
With 711 and higher versions you can activate the Lean Message Search (LMS) to be able to search for
payload content This is described in more detail in chapter Long Processing Times for
ldquoLMS_EXTRACTIONrdquo
41 Work Process Overview (SM50SM66)
The work process overview is the central transaction to get an overview of the current processes running in
the Integration Engine For message processing PI is only using Dialog work processes (DIA WP) Therefore
it is essential to ensure that enough DIA WPs available
The process overview is only a snapshot analysis You therefore have to refresh the data multiple times to
get a feeling for the dynamics of the processes The most important questions to be asked are as follows
How many work processes are being used on average Use the CPU Time (clock symbol) to check that not all DIA WPs are used In case all DIA WPs have a high CPU time this indicates a WP bottleneck
Which users are using these processes It depends on the usage of your PI system All asynchronous messages are processed by the QIN scheduler who will start the message processing in DIA WPs The user that is shown in SM66 will be the one that triggered the QIN scheduler This can eg be a communication user for a connected backend (usually a copy of PIAPPLUSER) or the user used to send data from the Adapter Engine (per default PIAFUSER)
Activities related to the Business Process Engine (ccBPM) will be indicated by user WF-BATCH If you see high WF-BATCH activity take a look at chapter 51
Are there any long running processes and if so what are these processes doing with regard to the reports used and the tables accessed
o As a rule of thumb for the initial configuration the number of DIA work processes should be around six times the value of CPU in your PI system (rdispwp_no_dia = 6 to 8 times CPUs cores based on SAP Note 1375656 - SAP NetWeaver PI System Parameters)
If you would like to get an overview for an extended period of time without actually refreshing the transaction
at regular intervals use report SDFMON and schedule the Daily Monitoring It allows you to collect metrics
such as CPU usage amount of free Dialog work processes and most importantly a snapshot of the work
process activity as provided in transactions SM50 and SM66 The frequency for the data collection can be as
low as 10 seconds and the data can be viewed after the configurable timeframe of the analysis Note
SDFMON is only intended for analysis of performance issues and should only be scheduled for a limited
period of time
If you have Solution Manager Diagnostics installed and all the agents connected to PI you can also monitor
the ABAP resource usage using Wily Introscope As you can see in the dashboard below you can use it to
monitor the number of free work processes (prerequisite is that the SMD agent is running on the PI system)
The major advantage of Wily Introscope is that this information is also available from the past and allows
analysis after the problem has occurred in the system
SAP NETWEAVER 71 AND HIGHER PERFORMANCE CHECK GUIDE
22
42 qRFC Resources (SARFC)
Depending on the configuration of the RFC server group not all dialog work processes can be used for
qRFC processing in the Integration Server As stated earlier all (ABAP based) asynchronous messages are
processed using qRFC Therefore tuning the RFC layer is one of the most important tasks to achieve good
PI performance
In case you have a high volume of (usually runtime critical) synchronous scenarios you have to ensure that
enough DIA WPs are kept free by the asynchronous interfaces running at the same time Since this is a very
difficult tuning exercise we usually recommend implementing runtime critical synchronous interfaces using
Java only configuration (ICO) whenever possible If this is not possible you have to ensure via SARFC tuning
that enough work processes are kept free to process the synchronous messages
The current resource situation in the system can be monitored using transaction SARFC
Procedure
First check which application servers can be used for qRFC inbound processing by checking the AS Group
assigned in transaction SMQR
Call transaction SARFC and refresh several times since the values are only snapshot values
Is the value for ldquoMax Resourcesrdquo close to your overall number of dialog work processes Max Resources is a fixed value and describes how many DIA work processes may be used for RFC communication If the value is too low your RFC parameters need tuning to provide the Integration Server with enough resource for the pipeline processing The RFC parameters can be displayed by double-clicking on ldquoServer Namerdquo
o A good starting point is to set the values as follows
Max no of logons = 90
Max disp of own logons = 90
Max no of WPs used = 90
Max wait time = 5
Min no of free WP = 3-10 (depending on the size of the application server)
These values are specified in SAP Note 1375656 ndash SAP NetWeaver PI System Parameters (this parameter must be increased if you plan to have synchronous interfaces) To avoid any bottleneck and blocking situation free DIA WPs should always be available The value should be adjusted based on the overall number of DIA WPs available at the system and the above requirements
SAP NETWEAVER 71 AND HIGHER PERFORMANCE CHECK GUIDE
23
Note You have to set the parameters using the SAP instance profile Otherwise the changes are lost
after the server is restarted
The field ldquoResourcesrdquo shows the number of DIA WPs available for RFC processing Is this value reasonably high for example above zero all the time If the ldquoResourcesrdquo value is zero then the Integration Server cannot process XML messages because no dialog work process is free to execute the necessary qRFC There are several conclusions that can be drawn from this observation as follows
1) Depending on the CPU usage (see Chapter ldquoMonitoring CPU Capacityrdquo) it might be necessary at this time to increase the number of dialog work processes in your system If the CPU usage however is already very high increasing the number of DIA will not solve the bottleneck
2) Depending on the number of concurrent PI queues (see Chapter qRFC Queues (SMQ2)) it might be necessary to decrease the degree of parallelism in your Integration Server because the resources are obviously not sufficient to handle the load The next section describes how to tune PI inbound and outbound queues
The data provided in SARFC is also collected and shown in a graphical and historical way using Solution
Manager Diagnostic and Wily Introscope (as can be seen in the screenshot below) This allows easy
monitoring of the RFC resources across all available PI application servers
43 Parallelization of PI qRFC Queues
The qRFC inbound queues on the ABAP stack are one of the most important areas in PI tuning Therefore it
is essential to understand the PI queuing concept
PI generally uses two types of queues for message processing ndash PI inbound and PI outbound queues Both
types are technical qRFC inbound queues and can therefore be monitored using SMQ2 PI inbound queues
are named XBTI (EO) or XBQI (EOIO) and are shared between all interfaces running on PI by default The
PI outbound queues are named XBTO (EO) and XBQO (EOIO) The queue suffix (in red XBTO0___0004)
specifies the receiver business system This way PI is using dedicated outbound queues for each receiver
SAP NETWEAVER 71 AND HIGHER PERFORMANCE CHECK GUIDE
24
system All interfaces belonging to the same receiver business system are contained in the same outbound
queue Furthermore there are dedicated queues for prioritization of separation of large messages To get an
overview about the available queues use SXMB_ADM Manage Queues
PI inbound and outbound queues execute different pipeline steps
PI Inbound Queues
Pipeline Steps Description of Pipeline Steps
PLSRV_XML_VALIDATION_RQ_INB XML Validation Inbound Channel Request
PLSRV_RECEIVER_DETERMINATION Receiver Determination
PLSRV_INTERFACE_DETERMINATION Interface Determination
PLSRV_RECEIVER_MESSAGE_SPLIT Branching of Messages
PI Outbound Queues
Pipeline Steps Description of Pipeline Steps
PLSRV_MAPPING_REQUEST Mapping
PLSRV_OUTBOUND_BINDING Technical Routing
PLSRV_XML_VALIDATION_RQ_OUT XML Validation Outbound Channel Request
PLSRV_CALL_ADAPTER Transfer to Respective Adapter IDoc HTTP Proxy AFW
Before the steps above are executed the messages are placed in a qRFC queue (SMQ2) The messages
will wait till they are first in queue and till a free DIA work process is assigned to a queue The wait time in the
queue are recorded in the performance header in DB_ENTRY_QUEUING (PI inbound queue) and
DB_SPLITTER_QUEUING (PI outbound queue) Most often you will see the long processing times there as
discussed in chapter Long Processing Times for ldquoDB_ENTRY_QUEUEINGrdquo and Long Processing Times for
ldquoDB_SPLITTER_QUEUEINGrdquo
Looking at the steps above it is clear that tuning the queues will have a direct impact on the connected PI
components and also backend systems For example by increasing the number of parallel outbound queues
more mappings will be executed in parallel which will in turn put a greater load on the Java stack or more
messages will be forwarded in parallel to the backend system in case of a Proxy call Thus when tuning PI
queues you must always keep the implications for the connected systems in mind
The tuning of PI ABAP queue parameters is done in transaction SXMB_ADM Integration Engine
Configuration and by selecting the category TUNING
For productive usage we always recommend to use inbound and outbound queues (parameter
EO_INBOUND_TO_OUTBOUND=1) Otherwise only inbound queues will be used which are shared across
SAP NETWEAVER 71 AND HIGHER PERFORMANCE CHECK GUIDE
25
all interfaces Hence a problem with one single backend system will affect all interfaces running on the
system
The principle of less is sometimes more also applies for tuning the number of parallel PI queues Increasing
the number of parallel queues will result in more parallel queues with fewer entries per queue In theory this
should result in a lower latency if enough DIA WPs are available
But practically this is not true for high volume systems The main reason for this is the overhead involved in
the reloading of queues (see details below) Furthermore important tuning measures like PI packaging (see
Chapter ldquoPI Message Packagingrdquo) aim to increase the throughput based on a higher number of messages in
the queue Thus from a throughput perspective it is definitely advisable to configure fewer queues
If you have very high runtime requirements you should prioritize these interfaces and assign a different
parallelism for high priority queues only This can be done using parameters
EO_INBOUND_PARALLEL_HIGH_PRIO and EO_OUTBOUND_PARALLEL_HIGH_PRIO as described in
section ldquoMessage Prioritization on the ABAP Stackrdquo
To tune the parallelism of inbound and outbound queues the relevant parameters are
EO_INBOUND_PARALLEL and EO_OUTBOUND_PARALLEL have to be used
Below you can see a screenshot of SMQ2 You can see the PI inbound queues and outbound queues Also
ccBPM queues (XBQO$PE) are displayed and will be discussed in section 5
Procedure
Log on to your Integration Server call transaction SMQ2 and execute If you are running ABAP proxies on a
separate client on the same system enter lsquorsquo for the client Transaction SMQ2 provides snapshots only and
must therefore be refreshed several times to get viable information
o The first value to check is the number of queues concurrently active over a period of time Since each queue needs a dialog work process to be worked on the number of concurrent queues must not be too high compared to the number of dialog work processes usable for RFC communication (see Chapter qRFC Resources (SARFC)) The optimum throughput can be achieved if the number of active queues is equal to or slightly higher than the number of dialog work processes (provided that the number of DIA work processes can be handled by the CPU of the system see transaction ST06)
In case many of the queues are EOIO queues (eg because the serialization is done on the material number) try to reduce the queues by following Chapter EOIO tuning
o The second value of importance is the number of entries per queue Hit refresh a few times to check if the numbers increasedecreaseremain the same An increase of entries for all queues or a specific
SAP NETWEAVER 71 AND HIGHER PERFORMANCE CHECK GUIDE
26
queue points to a bottleneck or a general problem on the system The conclusion that can be drawn from this is not simple Possible reasons have been found to include
1) A slow step in a specific interface
Bad processing time of a single message or a whole interface can be caused by expensive processing steps as for example the mapping step or receiver determination This can be confirmed by looking at the processing time for each step as shown in ldquoAnalyzing the runtime of pipeline stepsrdquo
2) Backlog in Queues
Check if inbound or outbound queues face a backlog A backlog in a queue is generally nothing critical since the queues ensure that the PI components as well as the backend systems are not overloaded For instance batch triggered interfaces are usually causing high backlogs that get processed over time Only in case the backlog prevents you to meet the business requirements for an interface this should be analyzed
If the backlog is caused by a high volume of messages arriving in a short period of time one solution to minimize the backlog is to increase the number of queues available for this interface (if sufficient hardware is available) If one interface is having a backlog in the outbound queues you could eg specify EO_OUTBOUND_PARALLEL with a sub parameter specifying your interface to increase the parallelism for this interface
But in general a backlog can also be caused by a long processing time in one of the pipeline steps as discussed in 1) or a performance problem with one of the connected components like PI Java stack or connected backend systems Due to the steps performed in the outbound queues (mapping or call adapter) it is more likely that a backlog will be seen in the outbound queues Inbound queue processing is only expensive if Content Based Routing or Extended Receiver Determination is used To understand which step is taking long follow once more chapter ldquoAnalyzing the runtime of pipeline stepsrdquo
In addition to tuning of the number of inbound and outbound queues also ldquoMessage Prioritization on the ABAP Stackrdquo and ldquoPI Message Packagingrdquo can help
The screenshot below shows such a backlog situation in Wily Introscope Please Note that the information about the queues is only collected by Wily in 5 minutes intervals explaining the gaps between the measurement points On the dashboard ldquoTotal qRFC Inbound Queue Entriesrdquo you can see that the number of messages in SMQ2 is increasing The number of inbound queues does not increase at the same time It also offers a dashboard for the number of entries by queue name and the time entries remain in SMQ2 With the information provided here it is also possible to distinguish a blocking situation or a general resource problem after the problem is no longer present in the system
SAP NETWEAVER 71 AND HIGHER PERFORMANCE CHECK GUIDE
27
3) Queues stay in status READY in SMQ2
To see the status of the queues use the filter button in SMQ2 as shown below
It is a normal situation to see many queues in READY status for a limited amount of time The reason for this is the way the QIN scheduler reloads LUWs (see point 2 below) A waiting time of up to 5 seconds per queuing step is considered normal during normal load situation (even if there is no backlog in the queue and enough resources are available) If you observe a situation where many queues are in READY status for longer period of time the following situations can apply
A resource bottleneck with regard to RFC resources Confirm by following section qRFC Resources (SARFC)
To avoid overloading a system with RFC load the QIN scheduler only reloads new queues after a certain amount of queues have finished processing This can lead to long waiting times in the queues as explained in SAP Note 1115861 - Behaviour of Inbound Scheduler after Resource Bottleneck Since PI is a non-user system we recommend setting rfcinb_sched_resource_threshold to 3 as described in SAP Note 1375656 ndash SAP NetWeaver PI System Parameters
Long DB loading times for RFC tables If using Oracle ensure that SAP Note 1020260 - Delivery of Oracle statistics is applied
Additional overhead during the pipeline executions occurs due to PI internal mechanisms Per default a lock is set during processing of each message This is no longer necessary and should
SAP NETWEAVER 71 AND HIGHER PERFORMANCE CHECK GUIDE
28
be switched off by setting the parameter LOCK_MESSAGE of category RUNTIME to 0 as described in SAP Note 1058915 In addition during the processing of an individual message the message repeatedly calls an enqueue which leads to a deterioration of the throughput This can be avoided by setting parameter CACHE_ENQUEUE to 0 as described in SAP Note 1366904
Sometimes a queue stays in READY status for a very long time while other queues are getting processed fine After manual unlocking the queue is processed but then stops after some time again A potential reason is described in Note 1500048 - SMQ2 inbound Queue remains in READY state In a PI environment queues in status RUNNING for more than 30 minutes usually happen due to one individual step taking long (as discussed in step 1) or a problem on the infrastructure (eg memory problems on Java or HTTP 200 lost on network) After 30 minutes the QIN scheduler removes this queue from the scheduling and therefore it remains in READY To solve such cases the root cause for the blocking has to be understood
4) Queue in READY status due to queue blacklisting
If a queue is for a very long time in status RUNNING (eg due to a problem with a mapping or due to a very slow backend) it is possible that the QIN scheduler excludes this queue from queue scheduling Hence the queue stays in status READY even though enough work processes are available The ldquoblacklistingrdquo of queues takes place when the runtime of a queue exceeds the ldquoMonitoring thresholdrdquo configured on this queue Notes 1500048 - queues stay in ready (schedule_monitor) and Note 1745298 - SMQR Inbound queue scheduler identify excluded entries provide more input on this topic The screenshot below shows a setting of 2400 seconds (40 minutes) for this parameter
Check if a queue stays in READY status for a long time while others are processing without any issue Ensure Note 1745298 is implemented and check the system log for the following exception ldquoQINEXCLUDE ltqueue namegt lttimedate at which the queue scheduler startedgt If this is the case check why the long runtime occurs (see section Analyzing the runtime of PI pipeline steps) or increase the schedule_monitor in exceptional cases only (if eg the runtime of an individual processing step cannot be improved further)
5) An error situation is blocking one or more queues
Click the Alarm Bell (Change View) push button once to see only queues with error status Errors delay the queue processing within the Integration Server and may decrease the throughput if for example multiple retries occur Navigate to the first entry of the queue and analyze the problem by forward navigation to the relevant message in SXMB_MONI
Often you see EO queues in SYSFAIL or RETRY due to the problems during the processing of an individual message This can be prevented by following the description of Chapter Prevent blocking of EO queues
SAP NETWEAVER 71 AND HIGHER PERFORMANCE CHECK GUIDE
29
44 Analyzing the runtime of PI pipeline steps
The duration of the pipeline steps is the ultimate answer to long processing times in the Integration Engine
since it describes exactly how much time was spent at which point The recommended way to retrieve the
duration of the pipeline steps is the RWB and will be described below Advanced users may use the
Performance Header of the SOAP message using transaction SXMB_MONI but the timestamps are not
easy to read If you still prefer the latter method here is the explanation 20110409092656165 must be read
as yyyymmddhh(min)(min)(sec)(sec)(microseconds) that is the timestamp corresponds to April 9 2011 at
092656 and 165 microseconds Please note that these timestamps in Performance Header of
SXI_MONITOR transaction are stored and displayed in UTC time therefore conversion to system time must
be done when analyzing them
In case PI message packaging is configured the performance header will always reflect the processing time
per package Hence a duration of 50 seconds does not mean a single message took 50 seconds but
eventually the package contained 100 messages so that every message took 05 ms More details about
this can be found in section PI Message Packaging
Procedure
Log on to your Integration Server and call transaction SXMB_IFR In the browser window follow the link to
the Runtime Workbench In there click Performance Monitoring Change the display to Detailed Data
Aggregated and choose an appropriate time interval for example the last day For this selection you have to
enter the details of the specific interface you want to monitor
You will now see in the lowerndashpart of the screen a split of the processing time into single steps Check the time difference between the steps Does any step take longer than expected In the example in the screenshot below the DB_ENTRY_QUEUEING starts after 0032 seconds and ends after 0243 seconds which means it took 0211 seconds (211ms)
SAP NETWEAVER 71 AND HIGHER PERFORMANCE CHECK GUIDE
30
Compare the processing times for the single steps for different measurements as outlined in Chapter
Pipeline Steps (SXMB_MONI or RWB) For example is a single step only long if many messages
are processed or if a single message is processed This helps you to decide if the problem is a
general design problem (single message has long processing step) or if it is related to the message
volume (only for a high number of messages this process step has large values)
Each step has different follow-up actions that are described next
441 Long Processing Times for ldquoPLSRV_RECEIVER_ DETERMINATIONrdquo PLSRV_INTERFACE_DETERMINATION
Steps that can take a long time in inbound processing are the Receiver and Interface Determination In these
steps the receiver system and interface is calculated Normally this is very fast but PI offers the possibility of
enhanced receiver determinations In these cases the calculation is based on the payload of a message
There are different implementation options
o Content-Based Routing (CBR)
CBR allows defining XPath expressions that are evaluated during runtime These expressions can be combined by logical operators for example to check the value for multiple fields The processing time of such a request directly correlates to the number and complexity of the conditions defined
No tuning options exist for the system in regard to CBR The performance of this step can only be changed by reducing the number of rules by changing the design of the interfaces Another option is to use an extended receiver determination (executing a mapping program) since this is faster than CBR using many rules
o Mapping to determine Receivers
A standard PI mapping (ABAP Java XSLT) can also be used to determine the receiver If you observe high runtimes in such a receiver determination follow the steps outlined in the next section since the same mapping runtime is used
442 Long Processing Times for ldquoPLSRV_MAPPING_REQUESTrdquo
Before analyzing the mapping you must understand which runtime is used Mappings can be implemented
in ABAP as graphical mappings in the Enterprise Service Builder as self-developed Java mappings or
XSLT mappings One interface can also be configured to use a sequence of mappings executed
sequentially In such a case analysis is more difficult because it is not clear which mapping in the sequence
is taking a long time
Normal debugging and tracing tools (transaction ST12) can be used for mappings executed in ABAP Any
type of mapping can be tested from ABAP using transaction SXI_MAPPING_TEST Knowing
senderreceiver partyserviceinterfacenamespace and source message payload it is possible to check the
target message (after mapping execution) and detailed trace output (similar to contents of trace of the
message in SXMB_MONI with TRACE_LEVEL = 3) It can also be used for debugging at runtime by using
the standard debugging functionality
For ABAP based XSLT mappings it is also possible via transaction XSLT_TOOL to test trace and debug
XSLT transformations on the ABAP stack
In general the mapping response time is heavily influenced by the complexity of the mapping and the
message size Therefore to analyze a performance problem in the mapping environment you should
compare the mapping runtime during the time of the problem with values reported several days earlier to get
a better understanding
SAP NETWEAVER 71 AND HIGHER PERFORMANCE CHECK GUIDE
31
If no AAE is used the starting point of a mapping is the Integration Engine that will send the request by RFC
destination AI_RUNTIME_JCOSERVER to the gateway There it will be picked up by a registered server
program The registered server program belongs to the J2EE Engine The request will be forwarded to the
J2EE Engine by a JCo call and then executed by the Java runtime When the mapping has been executed
the result is sent back to the ABAP pipeline There are therefore multiple places to check when trying to
determine why the mapping step took so long
Before analyzing the mapping runtime of the PI system check if only one interface is affected or if you face a
long mapping runtime for different interfaces To do so check the mapping runtime of messages being
processed at the same time in the system
The best tool for such an analysis is Wily Introscope which offers a dashboard for all mappings being
executed at a given time Each line in the dashboard represents one mapping and shows the average
response time and the number of invocations
In the screenshot below you can see that many different mapping steps have required around 500 seconds
for processing Comparing the data during the incident with the data from the day before will allow you to
judge if this might be a problem of the underlying J2EE engine as described in section J2EE Engine
Bottleneck
If there is only one mapping that faces performance problems there would be just one line sticking out in the
Wily graphs If you face a general problem that affects different interfaces you can choose a longer
timeframe that allows you to compare the processing times in a different time period and verify if it is only a
ldquotemporaryrdquo issue ndash this would for example indicate an overload of the mapping runtime
If you have found out that only one interface is affected then it is very unlikely to be a system problem but
rather a problem in the implementation of the mapping of that specific interface
SAP NETWEAVER 71 AND HIGHER PERFORMANCE CHECK GUIDE
32
Check the message size of the mapping in the runtime header using SXMB_MONI Verify if the message size is larger than usual (which would explain the longer runtime)
There can also be one or many lookups to a remote system (using RFC or JDBC) causing the long processing time of a mapping Together with the application you then have to check if the connection to the backend is working properly Such a mapping with lookups can be analyzed using Wily Transaction Trace as explained in the appendix section Wily Transaction Trace
If not one but several interfaces are affected a potential system bottleneck occurs and this is described in
the following
o Not enough resources (registered server programs) available That could either be the case if too many mapping requests are issued at the same time or if one J2EE server node is down and has not registered any server programs
To check if there were too many mapping requests for the available registered server programs compare the number of outbound queues that are concurrently active with the number of registered server programs The number of outbound queues that are concurrently active can be monitored with transaction SMQ2 and counting queues with the names XBTO amp XBQOXB2O XBTA and XBQAXB2A (high priority) XBTZ and XBQZXB2Z (low priority) and XBTM (large messages) In addition to this you have to take into account mapping steps that are executed by synchronous messages or in a ccBPM process Mappings executed by a ccBPM process are not queued but the ccBPM process calls the mapping program directly using tRFC The number of registered server programs can be determined with transaction SMGW Goto Logged On Clients and filtering by the program (ldquoTP Namerdquo) AI_RUNTIME_ltSIDgt In general we recommend configuring 20 parallel mapping connections per server node
If the problem occurred in the past it is more difficult to determine the number of queues that are concurrently active One way is to use transaction SXMB_MONI and specify every possible outbound queue (field ldquoQueue IDrdquo) in the advanced selection criteria (Note wildcard search not available) The timeframe can be restricted in the upper-part of the advanced selection criteria Advanced users could use transaction SE16 to search directly in table SXMSPMAST using the field ldquoQUEUEINTrdquo
The other option is to use the Wily ldquoqRFC Inbound Queue Detailrdquo dashboard as described in qRFC Queue Monitoring (SMQ2)
To check if the J2EE is not available or if the server program is not registered for a different reason use transaction SM59 to test the RFC destination AI_RUNTIME_JCOSERVER If the problem occurred in the past search the gateway trace (transaction SMGW GoTo Trace Gateway Display File) and the RFC developer traces dev_rfc files available in the work directory for the string ldquoAI_RUNTIMErdquo In addition check the std_serverltngtout in the work directory for restarts of the J2EE Engine
SAP NETWEAVER 71 AND HIGHER PERFORMANCE CHECK GUIDE
33
o Depending on the checks above there are two options to resolve the bottleneck Of course if the J2EE was not available the reason for this has to be found and prevented in the future
The two options for tuning are
1) the number of outbound queues that are concurrently active and
2) the number of mapping connections from the J2EE server to the ABAP gateway
The increase of mapping connections is only recommended for strong J2EE servers since each mapping thread needs resources like CPU and Heap memory Too many mapping connections mean too many mappings being executed on the J2EE Engine In turn this might reduce the performance of other parts of the PI system for example the pipeline processing in the Integration Engine or the processing within the adapters of the AFW or can even cause out-of-memory errors on the J2EE engine Add additional J2EE server nodes to balance the parallel requests Each J2EE server node will
register new destinations at the gateway and will therefore take a part of the mapping load
Another option is to reduce the number of outbound queues that are concurrently active to solve the bottleneck This will certainly result in higher backlogs in the queue and is therefore only applicable for less runtime critical interfaces This option can be used if the backlog is caused by a master data interface with high volume but no critical processing time requirements In such a case you can only lower the number of parallel queues for this interface by using a sub-parameter of EO_OUTBOUND_PARALLEL in transaction SXMB_ADM By doing so you slow down one interface to ensure other (more critical) interfaces have sufficient resources available
o If multiple application servers configured on the PI system ensure that all the server nodes are connected to their local gateway (local bundle option) as described in the guide How To Scale PI
443 Long Processing Times for ldquoPLSRV_CALL_ADAPTERrdquo
Call adapter is the last step executed in the PI pipeline and forwards the message to the next component
along the message flow In most cases (local Adapter Engine IDoc or BPE) this is a local call The IDoc
adapter only puts the message on the tRFC layer (SM58) of the PI system so that the actual transfer of the
IDoc is not included in the performance header For ABAP Proxies plain HTTP or calls to a central or
decentral Adapter Engine an HTTP call is made so that network time can have an influence here
Looking at the processing time we have to distinguish asynchronous (EO and EOIO) and synchronous (BE)
interfaces
In asynchronous interfaces the call adapter step includes the transfer of the message by the network and
the initial steps on the receiver side (in most cases this just means persisting the message on the receiverrsquos
database) A long duration can therefore have two reasons
o Network latency For large messages of several MB in particular the network latency is an important factor (especially if the receiving ABAP proxy system is located on another continent for example) Network latency has to be checked in case of a long call adapter step In case HTTP load balancers are used they are considered as part of the network
o Insufficient resources on receiver side Enough resources must be available at the receiver side to ensure quick processing of a message For instance enough ICM threads and dialog work processes must be available in the case of an ABAP proxy system Therefore the analysis of long call adapter steps always has to include the relevant backend system
For synchronous messages (requestresponse behavior) the call adapter step also includes the processing
time on the backend to generate the response message Therefore the call adapter for synchronous
messages includes the time of the transfer of the request message the calculation of the corresponding
response message at the receiver side and the transfer back to PI Therefore the processing time to
process a request at the receiving target system for synchronous messages must always be analyzed to find
the most costly processing steps
SAP NETWEAVER 71 AND HIGHER PERFORMANCE CHECK GUIDE
34
444 Long Processing Times for ldquoDB_ENTRY_QUEUEINGrdquo
The value for DB_ENTRY_QUEUEING describes the time that a message has spent waiting in a PI inbound
queue before processing started In case of errors the time also includes the wait time for restart of the LUW
in the queue The inbound queues (XBTI XBT1 XBT9 XBTL for EO messages and XBQIXB2I
XBQ1XB21 XBQ9XB29 for EOIO messages) process the pipeline steps for the Receiver
Determination the Interface Determination and the Message Split (and optionally XML inbound validation)
Thus if the step DB_ENTRY_QUEUEING has a high value the inbound queues have to be monitored using
transactions SMQ2 and SARFC The reasons are similar as those outlined in chapter qRFC Resources
(SARFC) and qRFC Queues (SMQ2)
o Not enough resources (DIA work processes for RFC communication) available
o A backlog in the queues caused by one of the following reasons
The number of parallel inbound queues is too low to handle the incoming messages in parallel Note that a simple increase of the parameter EO_INBOUND_PARALLEL might not always be the solution (as enough work processes also have to be available to process the queues in parallel) The number of work processes is in turn restricted by the number of CPUs that are available for your system If you would like to separate critical from non-critical sender systems define a dedicated set of inbound queues by specifying a sender ID as a sub parameter of EO_INBOUND_PARALLEL For example by doing so you can separate master data interfaces from business critical interfaces Please note that the separation on inbound queues only works on Business System level and not on interface level
The inbound queues were blocked by the first LUW Use transaction SMQ2 to check if that is still the case To identify if such a situation occurred in the past use the Wily Introscope dashboard ldquoABAP System qRFC Inbound Detailldquo It is generally not easy to find the one message that is blocking the queue It might be achieved by checking RFC traces or by searching for a single message with a long pipeline processing step For EO queues there is no business reason to block the queues in case of a single message error To prevent this follow the description in section Prevent blocking of EO queues
In case you have a different runtime of the messages in the queues (eg due to complex extended Receiver Determinations) the number of messages per queue might be uneven distributed between the queues In PI 73 a new balancing option is available as discussed in Avoid uneven backlogs with queue balancing
Problems when loading the LUW by the QIN scheduler as described in qRFC Queues (SMQ2)
Note If your system uses the parameter EO_INBOUND_TO_OUTBOUND = 0 you must also read chapter
445 for analyzing the reasons EO_INBOUND_TO_OUTBOUND only determines whether inbound queues
(value lsquo0rsquo) or inbound and outbound queues (value lsquo1rsquo) are used for the pipeline processing in the integration
server Check the value with transaction SXMB_ADM Integration Engine Configuration Specific
Configuration The default value is lsquo1rsquo meaning the usage of inbound and outbound queues (the
recommended behavior)
445 Long Processing Times for ldquoDB_SPLITTER_QUEUEINGrdquo
The value for DB_SPLITTER_QUEUEING describes the time that a message has spent waiting in a PI
outbound queue until a work process was assigned In case of errors the time also includes the wait time for
the restart of the LUW in the queue
The outbound queues (XBTO XBTA XBTZ XBTM for EO messages and XBQOXB2O
XBQAXB2A XBQZXB2Z for EOIO messages) process the pipeline steps for the mapping outbound
binding and call adapter
SAP NETWEAVER 71 AND HIGHER PERFORMANCE CHECK GUIDE
35
Thus if the step DB_SPLITTER_QUEUEING has a high value the outbound queues have to be monitored
using transactions SMQ2 and SARFC The reasons are similar as outlined in chapters qRFC Resources
(SARFC) and qRFC Queues (SMQ2) or described in the section above for PI inbound queues
o Not enough resources (DIA work processes for RFC communication) available
o A backlog in the queues caused by one of the following reasons
The number of parallel outbound queues is too low to handle the outgoing messages in parallel Note that simply increasing the parameter EO_OUTBOUND_ PARALLEL might not always be the solution as enough work processes have to be available to process the queues in parallel The number of work processes in turn is limited by the number of CPUs available for the system Also the parameter EO_OUTBOUND_PARALLEL is used differently than the parameter EO_INBOUND_ PARALLEL because it determines the degree of parallelism for each receiver system Thus it is possible to increase the number of parallel outbound queues for specific receivers whereas other receivers are handled with a lower degree of parallelism Note that not every receiver backend is able to handle a high degree of parallelism so that in case of an ABAP Proxy system it might not indicate a problem on PI in case you observe a high value for DB_SPLITTER_QUEUING
The outbound queues were blocked by the first LUW To identify if such a situation occurred in the past use the Wily Introscope dashboard ldquoABAP System qRFC Inbound Detailldquo In general it is not easy to find the one message that is blocking the queue It might be achieved by checking RFC traces or by searching for a single message with a long pipeline processing step For EO queues there is no business reason to block the queues in case of a single message error To prevent this follow the description in section Prevent blocking of EO queues
Since the outbound queues include a processing step that is bound to take longer than the other steps (that is the mapping and the call adapter step) this might mean a long waiting time for all subsequent messages As an example assume that a mapping takes 1 second and that 100 messages are waiting in a queue The first message gets executed at once the second message has to wait about 1 second (a bit more since more steps are executed than just the mapping but this should be ignored at the moment) the third takes 3 seconds and so on The 100
th message
has to wait 100 seconds until it is processed that is the value for DB_SPLITTER_QUEUING is as high as 100 For a given outbound queue you would therefore see an increase for the DB_SPLITTER_QUEUING value over time If you experience this situation proceed with Chapter 442
In case you have a different runtime of the messages in the queues (eg due to different message size) the number of messages per queue might be uneven distributed between the queues In PI 73 a new balancing option is available as discussed in Avoid uneven backlogs with queue balancing
o Problems when loading the LUW by the QIN scheduler as described in qRFC Queues (SMQ2)
Note The number of parallel outbound queues is also connected with the ability of the receiving system to
process a specific amount of messages for each time unit
In section Adapter Parallelism default restrictions of the specific adapters of the J2EE Engine are explained Some adapters (JDBC File Mail) can process only one message for each server node at a time (this can be changed) It does not make sense for such adapters to have too many parallel qRFC queues since this will only move the message backlog from ABAP to Java
For messages that are directed to the IDoc outbound adapter the value for EO_OUTBOUND_PARALLEL is connected to the MAXCONN value of the corresponding outbound destination You can define the maximum number of connections using transaction SMQS ndash the default value is 10 parallel connections If applicable SAP highly recommends that you use IDoc packaging in the outbound IDoc adapter to reduce the load during the transmission of tRFC calls from the PI system to the receiving system
For ABAP proxy systems the number of outbound queues directly determines the number of messages sent in parallel to the receiving system Thus you have to ensure that the resources
SAP NETWEAVER 71 AND HIGHER PERFORMANCE CHECK GUIDE
36
available on PI are aligned with those on the sendingreceiving ABAP proxy system
446 Long Processing Times for ldquoLMS_EXTRACTIONrdquo
Lean Message Search can be configured for newer PI releases as described in the Online Help After
applying Note 1761133 - PI runtime Enhancement of performance measurement an additional header for
LMS will be written to the performance header
The header could look like this indicating that around 25 seconds were spent in the LMS analysis
When using trace level two additional timestamps are written to provide details about this overall runtime
LMS_EXTRACTION_GET_VALUES
This timestamp describes the evaluation of the message according to user-defined filter criteria
LMS_EXTRACTION_ADJUST_VALUES
This timestamp describes the post-processing of the previously found values in the BAdI (as of PI 730)
The runtime of the LMS heavily depends on the number of payload attributes to be extracted Also the
payload size and the complexity of the XPath expression has a direct impact on the performance of the LMS
In general the number of elements to be indexed should be kept at a minimum and very deep and complex
XPath expressions should be avoided
If you want to minimize the impact of LMS on the PI message processing time you can define the extraction
method to use an external job In that case the messages will be indexed after processing only and it will
therefore have no performance impact during runtime Of course this method imposes a delay in the
indexing (based on the frequency of job SXMS_EXTRACT_MESSAGES) so that newly processed
messages cannot be searched using LMS If this delay is acceptable for the monitoring responsible the
messages should be indexed using an external job
447 Other step performed in the ABAP pipeline
As discussed earlier there are additional steps in the ABAP pipeline that can be executed based on the
configuration of your scenario Per default these steps will not be activated and should therefore not
consume any time All these steps are traced in the performance header of the message Below you can see
the details for
- XML validation
SAP NETWEAVER 71 AND HIGHER PERFORMANCE CHECK GUIDE
37
- Virus Scan
In case one of these steps is taking long you have to check the configuration of your scenario In the
example of the Virus scan the problem might be related to the external virus scanner used and tuning has to
happen on that side
45 PI Message Packaging for Integration Engine
PI message packaging was introduced with SAP NetWeaver PI 70 SP13 and is per default activated in PI
71 and higher Message packaging in BPE is independent of message packaging in PI (see chapter 56)
but they can be used together
To improve performance and message throughput asynchronous messages can be assembled to packages
and processed as one entity For this the qRFC scheduler was enabled to process a set of messages (a
package) in one LUW Thus instead of sending one message to the different pipeline steps (for example
mappingrouting) a package of messages will be sent that will reduce the number of context switches that is
required Furthermore access to databases is more efficient since requests can be bundled in one database
operation Depending on the number and size of messages in the queue this procedure improves
performance considerably In return message packaging can increase the runtime for individual messages
(latency) due to the delay in the packaging process
Message packaging is only applicable for asynchronous scenarios (QoS EO and EOIO) Due to the potential
latency of individual messages packaging is not suitable for interfaces with very high runtime requirements
In general packaging has the highest benefit for interfaces with high volume and small message size
The performance improvement achieved directly relates to the number of the messages bundled in each
package Message packaging must not solely be used in the PI system Tests have shown that the
performance improvement significantly increases if message packaging is configured end-to-end - that is
from the sending system using PI to the receiving system Message packaging is mainly applicable for
application systems connected to PI by ABAP proxy
From the runtime perspective no major changes are introduced when activating packaging Messages
remain individual entities in regards to persistence and monitoring Additional transactions are introduced
allowing the monitoring of the packaging process
Messages are also treated individually for error handling If an error occurs in a message processed in a
package then the package will be disassembled and all messages will be processed as single messages Of
course in a case where many errors occur (for example due to interface design) this will reduce the benefits
of message packaging SAP systems connected to PI via ABAP Proxy can also make use of the message
packaging to reduce the HTTP calls necessary to transmit messages between the systems Other sending
and receiving applications in particular will not see any changes because they send and receive individual
messages and receive individual commits
The PI message packaging can be adapted to meet your specific needs In general the packaging is
determined by three parameters
SAP NETWEAVER 71 AND HIGHER PERFORMANCE CHECK GUIDE
38
1) Message count Maximum number of messages in a package (default 100)
2) Maximum package size Sum of all messages in kilobytes (default 1 MB)
3) Delay time Time to wait before the queue is processed if the number of messages does not reach
the message count (default 0 meaning no waiting time)
These values can be adjusted using transactions SXMS_BCONF and SXMS_BCM To better use the
performance improvements offered by packaging you could for example define a specific packaging for
interfaces with very small messages to allow up to 1000 messages for each package Another option could
be to increase the waiting time (only if latency is not critical) to create bigger packages
See SAP Note 1037176 - XI Runtime Message Packaging for more details about the necessary
prerequisites and configuration of message packaging More information is also available at
httphelpsapcom SAP NetWeaver SAP NetWeaver PIMobileIdM 71 SAP NetWeaver Process
Integration 71 Including Enhancement Package 1 SAP NetWeaver Process Integration Library
Function-Oriented View Process Integration Integration Engine Message Packaging
46 Prevent blocking of EO queues
In general messages for interfaces using Quality of Service Exactly Once are independent of each other In
case of an error in one message there is no business reason to stop the processing of other messages But
exactly this happens in case an EO queue goes into error due to an error in the processing of a single
message The queue will then be automatically retried in configurable intervals This retry will cause a delay
of all other messages in the queue which cannot be processed due to the error of the first message in the
queue
To avoid this a new error handling was introduced in SAP Notes 1298448 - XI runtime No automatic retry
for EO message processing (set EO_RETRY_AUTOMATIC = 0 and schedule restart job
RSXMB_RESTART_MESSAGES) and SAP Note 1393039 - XI runtime Dump stops XI queue After
applying this Note EO queues will not go in SYSFAIL status any longer These Notes are recommended for
all PI systems and are per default activated on PI 73 systems By specifying a receiver ID as sub parameter
this behavior can be configured for individual interfaces only
In PI 73 you can also configure the number of messages that would go into error before the whole queue
would be stopped For permanent errors (eg due to a problem with the receiving backend) the queue would
go into SYSFAIL so that not too many messages are going into error This also reduces the number of alerts
for Message Based Alerting To define the threshold the parameter EO_RETRY_AUT_COUNT can be set
The default value is 0 and indicates that the number of messages is not restricted
47 Avoid uneven backlogs with queue balancing
From PI 73 on a new mechanism is available to address the distribution of messages in queues Per default
in all PI versions the messages are getting assigned to the different queues randomly In case of different
runtimes of LUWs caused by eg different message sizes or different runtimes in mappings this can cause
an uneven distribution of messages within the different queues This can increase the latency of the
messages waiting at the end of that queue
To avoid such an unequal distribution the system checks the queue length before putting a new message in
the queue Hence it tries to achieve an equal balancing during inbound processing A queue which has a
higher backlog will get less new messages assigned Queues with fewer entries will get more messages
assigned Therefore it is different than the old BALANCING parameter of category TUNING) which was used
SAP NETWEAVER 71 AND HIGHER PERFORMANCE CHECK GUIDE
39
to rebalance messages already assigned to a queue The assignment of messages to queues is shown in
the diagram below
To activate the new queue balancing you have to set the parameters EO_QUEUE_BALANCING_READ and
EO_QUEUE_BALANCING_SELECT of category TUNING in SXMB_ADM If the value of the parameter
EO_QUEUE_BALANCING_READ is 0 (default value) then the messages are distributed randomly across
the queues that are available If however EO_QUEUE_BALANCING_READ is set to a value n greater than
zero then on average the current fill level of the queue is determined after every nth message and stored in
the shared memory of the application server This data is used as the basis for determining the queue (see
description of parameter EO_QUEUE_BALANCING_SELECT) relevant for balancing
The parameter EO_QUEUE_BALANCING_SELECT specifies the relative fill levels of the queues in percent
Relative here means in relation to the maximum filled queue If there are queues with a lower fill level than
defined here then only these are taken into consideration for distribution If all queues have a higher fill level
then all queues are taken into consideration
Please note that determining the fill level takes place using database access and therefore impacts system
performance The value of EO_QUEUE_BALANCING_READ should for this reason be oriented towards the
message throughput and specific requirements or even distribution For higher volume system a higher value
should be chosen
Letrsquos look at an example In case you set the parameter EO_QUEUE_BALANCING_READ to 1000 after
every 1000th incoming message the queue distribution will be checked This requires a database access
and can therefore cause a performance impact The fill level for each queue will then be written to shared
memory In our example we configured EO_QUEUE_BALANCING_SELECT to 20 At a given point in time
you have three outbound queues on the system XBTO__A contains 500 entries XBTO__B 150 and
XBTO__C contains 50 messages Therefore XBTO__B has a fill level of 30 and XBTO__C of 10 That
means the only queue relevant for balancing is XBTO__C which will get more messages assigned
Based on this example you can see that it is important to find the correct values As a general guideline to
minimize performance impact you should set EO_QUEUE_BALANCING_READ to a rather large value The
correct value of EO_QUEUE_BALANCING_SELECT depends on the criticality of a delay caused by a
backlog
SAP NETWEAVER 71 AND HIGHER PERFORMANCE CHECK GUIDE
40
48 Reduce the number of parallel EOIO queues
As discussed in Chapter Parallelization of PI qRFC Queues it is important to keep the number of queues
limited As a rule of thumb the number of active queues should be equal to the number of available work
processes in the system It is especially crucial to not have a lot of queues containing only one message
since this will cause a high overhead on the QIN scheduler due to very frequent reloading of the queues
Especially for EOIO queues we often see a high number of parallel queues containing only one message
The reason for this is for example that the serialization has to be done on document number to eg ensure
that updates to the same material are not transferred out of sequence Typically during a batch triggered
load of master data this can result in hundreds of EOIO queues in SMQ2 just containing only one or two
messages This is very bad from a performance point of view and will cause significant performance
degradation for all other interfaces running at the same time To overcome this situation the overall number
of EOIO queues (for all interfaces) can be limited as of PI 71 as described in Change Number of EOIO
Queues
The maximum number of queues can be set in SXMB_ADM Configure Filter for Queue Prioritization
Number of EOIO queues
During runtime a new set of queues will be used with the name XB2 as can be seen below for the outbound
queues
These queues will be shared between all EOIO interfaces for the given interface priority and by setting the
number of queues the parallelization for all EOIO interfaces is limited Thus more messages will be using the
same EOIO queue and therefore PI message packaging will work better and also the reloading of the
queues by the QIN scheduler will show much better performance
In case of errors the messages will be removed from the XB2 queues and will be moved to the standard
XBQ queues All other messages for the same serialization context will be moved to the XBQ queue
directly to ensure the serialization is maintained This means that in case of an error the shared EOIO
queues will not be blocked and messages for other serialization contexts will be not delayed
SAP NETWEAVER 71 AND HIGHER PERFORMANCE CHECK GUIDE
41
49 Tuning the ABAP IDoc Adapter
Very often the IDoc adapter deals with very high message volume and tuning of this is very essential
491 ABAP basis tuning
As stated above the IDoc adapter uses the tRFC layer to transfer messages from PI to the receiver system
The IDoc adapter will only put the message in SM58 and from there the standard tRFC layer forwards the
LUW You therefore have to ensure that sufficient resources (mainly DIA WPs) are available for processing
tRFC requests
Wily Introscope also offers a dashboard (shown below) for the tRFC layer which shows the tRFC entries and
their different statuses With these dashboards you are also able to identify history backlogs on tRFC
In order to control the resources used when sending the IDocs from sender system to PI or from PI to the
receiver backend you can also think about registering the RFC destinations in SMQS in PI as known from
standard ALE tuning By changing the Max Conn or the Max Runtime values in SMQS you can limit or
increase the number of DIA WPs used by the tRFC layer to send the IDocs for a given destination This will
mitigate the risk of system overload on sender and receiver side
SAP NETWEAVER 71 AND HIGHER PERFORMANCE CHECK GUIDE
42
492 Packaging on sender and receiver side
One option for improving the performance of messages processed with the IDoc adapter is to use IDoc
packaging
The receiver IDoc adapter in PI (for sending messages from PI to the receiving application system) already
had the option for packaging IDocs in previous releases For this messages processed in the IDoc adapter
are bundled together before being sent out to the receiving system Thus only one tRFC call is required to
send multiple IDocs The message packaging that is being discussed in section PI Message Packaging uses
a similar approach and therefore replaces the ldquooldrdquo packaging of IDocs in the receiver IDoc adapter
Therefore we highly recommend configuring Message Packaging since this helps transferring data for the
IDoc adapter as well as the ABAP Proxy
For the sender IDoc adapter there was previously the option to activate packaging in the partner profile of
the sending system in case IDocs are not send immediately but in batch By specifying the ldquoMaximum
Number of IDocsrdquo in the report RSEOUT00 multiple IDocs are bundled in one tRFC calls At the PI side
these packages will be disassembled by the IDoc adapter and the messages will be processed individually
Therefore this will help mainly to reduce the tRFC resources involved in transferring the data between the
systems but not within PI
This behavior was changed with SAP NetWeaver PI 711 and higher If the sender backend sends an IDoc
package to PI a new option has been introduced which allows the processing of IDocs as a package on PI
as well You can specify an IDoc package size on the sender IDoc Communication Channel The necessary
configuration is described in detail in the following SDN blog - IDoc Package Processing Using Sender IDoc
Adapter in PI EhP1 A significant increase in throughput was recorded for high volume interfaces with small
IDocs
493 Configuration of IDoc posting on receiver side
As described in SAP Note 1828282 - IDoc adapter long runtime XI -gt IDoc-gt ALE also the way the IDocs
are posted on the receiver ERP backend will directly influence the processing of the LUW on the PI side In
general two options exist for IDoc posting
Trigger immediately The IDoc will be posted directly when it is received For this a free dialog workprocess will be required
Trigger by background program If this option is chosen the IDoc is persisted on the ERP side and the posting of the application data will happen asynchronously using report RBDAPP01 via a background job
SAP NETWEAVER 71 AND HIGHER PERFORMANCE CHECK GUIDE
43
When ldquotrigger immediatelyrdquo is configured the sender system (PI) has to wait till the IDoc is posted While the
workprocess will roll out you will see the LUW in ldquoTransaction Executingrdquo during this time For the
IDOC_AAE the RFC connection and the java threads will be kept busy until the IDOC is posted in the
backend therefore leading to backlogs on the IDOC_AAE
The coding for posting the application data can be very complex and therefore this operation can take a long
time consuming unnecessary resources also on the sender side With background processing of the IDocs
the sender and receiver systems are decoupled from each other
Due to this we generally recommend to use ldquotrigger immediatelyrdquo in exceptional cases where the data has to
be posted without any delay In all other cases like high volume replication of master data background
processing of IDocs should be chosen
With Note 1793313 and 1855518 a third option for posting IDocs on the ERP side was introduced This
option is using bgRFC on the ERP side to queue the IDocs As soon as the configured resources for the
bgRFC destination are available the IDocs will be posted By doing so the IDocs will be posted based on
resource availability on the receiver system and no additional background jobs will be required Furthermore
storing the LUWs in bgRFC will ensure that the sender and receiver systems are decoupled This option
therefore guarantees that the IDocs will be posted as soon as possible based on the available resources on
the receiver system without the requirement to schedule many background jobs This new option is therefore
the recommended way of IDoc posting in systems that fulfill the necessary requirements
SAP NETWEAVER 71 AND HIGHER PERFORMANCE CHECK GUIDE
44
410 Message Prioritization on the ABAP Stack
A performance problem is often caused by an overload of the system for example due to a high volume
master interface If business critical interfaces with a maximum response time are running at the same time
then they might face delays due to a lack of resources Furthermore as described in qRFC Queues (SMQ2)
messages of different interfaces use the same inbound queue by default which means that critical and less-
critical messages are mixed up in the same queue
We highly recommend using message prioritization on the ABAP stack to prevent such delays for critical
interfaces (for Java see Interface Prioritization in the Messaging System )
For more information about PI prioritization see httphelpsapcom and navigate to SAP NetWeaver SAP
NetWeaver PIMobileIdM 71 SAP NetWeaver Process Integration 71 Including Enhancement Package 1
SAP NetWeaver Process Integration Library Function-Oriented View Process Integration
Integration Engine Prioritized Message Processing
To balance the available resources further between the configured interfaces you can also configure a
different parallelization level for queues with different priorities Details for this can be found in SAP Note
1333028 ndash Different Parallelization for HP Queues
SAP NETWEAVER 71 AND HIGHER PERFORMANCE CHECK GUIDE
45
5 ANALYZING THE BUSINESS PROCESS ENGINE (BPE)
This chapter helps to analyze performance problems if Chapter Determining the Bottleneck has shown that
the BPE is the slowest step for a message during its time in the PI system Of course this type of runtime
engine is very susceptible to inefficient design of the implemented integration process Information about
best practices for designing BPE processes can be found in the documentation Making Correct Use of
Integration Processes In general the memory and resource consumption is higher than for a simple pipeline
processing in the Integration Engine As outlined in the document linked above every message that is sent
to BPE and every message that is sent from BPE is duplicated In addition work items are created for the
integration process itself as well as for every step More database space is therefore required than
previously expected and more CPU time is needed for the additional steps
51 Work Process Overview
The Business Process Engine executes the steps (work items) of an integration process using tRFC calls to
the RFC destination WORKFLOW_LOCAL_ltclientgt To check if there are enough resources available to
process the work items call transaction SM50 (on each application server) while one of the integration
processes is running
o Look for the user ldquoWF-BATCHrdquo and follow its activities by refreshing the transaction
o Are there always dialog work processes available
The most important point to keep in mind here is the concurrent activity of the Business Process Engine (for
ccBPM processes) and the Integration Engine (for pipeline processing) Both runtime environments need
dialog work processes Thus performance problems in one of the engines cannot be solved by restricting
the other Rather an appropriate balance between the two runtimes has to be found
The activity of the WF-BATCH user is not restricted by default It is highly recommended that you register the
RFC destination WORKFLOW_LOCAL_ltclientgt with transaction SMQS and assign a suitable amount of
maximum connections Otherwise ccBPM activity may block the pipeline processing of the Integration
Server and reduce the throughput of PI drastically SAP Note 888279 - Regulatingdistributing the Workflow
Load gives more details
In addition it might help to use specific servers (dialog instances) to carry out a given workflow or to use load
balancing Of course both options only apply for larger PI systems that consist of at least a central instance
and one dialog instance
52 Duration of Integration Process Steps
As described in section Processing Time in the Business Process Engine with PI 73 there is a new monitor
available in ldquoConfiguration and Monitoring Homerdquo on PI start page It shows the duration of individual steps
of an integration process in a very easy way and is the now tool to analyze performance related issues on
the ccBPM
SAP NETWEAVER 71 AND HIGHER PERFORMANCE CHECK GUIDE
46
For releases prior than PI 73 check in the workflow log for long-running steps as described in the previous
chapter Use the ldquoList with Technical Detailsrdquo to do so Since the design of integration processes varies
significantly there is no general rule for the duration of a step or for specific sequences of steps Instead
you have to get a feeling for your implemented integration processes
Did a specific process step decrease in performance over a period of time
Does one specific process step stick out with regard to the other steps of the same integration process
Do you observe long durations for a transformation step (ldquomappingrdquo)
Do you observe long durations of synchronous sendreceive steps in the integration process which correlates for example to a slow response from a connected remote system
Use the SAP Notes database to learn about recommendations and hints SAP Note 857530 - BPE
Composite Note Regarding Performance acts as a central note for all performance notes and might be used
as the entry point
Once you are able to answer the above questions there are several paths to follow
o Two common reasons should be taken into consideration for a performance decrease over time Firstly the load on PI might have increased over time as well Check the hardware resources (chapter 9) and carefully monitor the work process availability (chapter 51) Alternatively the underlying databases might slow down the integration processes Use chapter 54 to check this possibility
o If it is a specific process step that sticks out the process design itself has to be reviewed The SAP Notes mentioned above might help here
o If the mapping step takes a long time it is worth having a look at chapter 442 since the BPE and the IE use the same resources (mapping connections from the ABAP gateway to the J2EE server) to execute their mapping
o If there is a long processing time for a synchronous sendreceive step check the connected backend system for any performance issues
SAP NETWEAVER 71 AND HIGHER PERFORMANCE CHECK GUIDE
47
53 Advanced Analysis Load Created by the Business Process Engine (ST03N)
Since the Business Process Engine runs on the ABAP part of the PI Integration Server you can use the
statistical data written by the dialog work processes to analyze a performance problem
Procedure
Log in to your Integration Server and call transaction ST03N Switch to ldquoExpert Moderdquo and choose the
appropriate timeframe (this could be the ldquoLast Minutersquos Loadrdquo from the Detailed Analysis menu or a specific
day or week from the Workload menu) In the Analysis View navigate to User and Settlement Statistics and
then to User Profile The user you are interested in is the WF-BATCH user who does all ccBPM-related work
Compare the total CPU Time (in seconds) to the time frame (in seconds) of the analysis In the above example an analysis time frame of 1 hour has been chosen which corresponds to 3600 seconds To be exact these 3600 seconds have to be multiplied by the number of available CPUs Out of these 3600CPU seconds the WF-BATCH user used up 36 seconds
o The above value gives you a good idea of how much load the Business Process Engine creates on your PI Integration Server By comparison with the other users (as well as the CPU utilization from transaction ST06) you can determine if the Integration Server is able to handle this load with the available number of CPUs or not This does not help you to optimize the load but it does provide support when deciding how to distribute the workload of the BPE and the workload of the Integration Server (see Chapter 51)
Experienced ABAP administrators should also analyze the database time wait time and compare these values
54 Database Reorganization
The database is accessed many times during the processing of an Integration Process This is not usually
connected with performance problems but if a specific database table is large then statements may take
longer than for small database tables
Use transaction ST05 to collect a SQL trace while the integration process in question is being executed Restrict the trace to user WF-BATCH When the integration process is finished stop the trace and view it Look for high values in the duration column especially for SELECT statements
Use transaction SE16 to determine the number of entries for the typical workflow tables SWW_WI2OBJ and SWFRXI There are many more database tables used by BPE but if the number of entries is high for the above tables they are high for the rest as well See SAP Note 872388 - Troubleshooting Archiving and Deletion in XI and the links given in this note if you find high amounts of entries
SAP NETWEAVER 71 AND HIGHER PERFORMANCE CHECK GUIDE
48
55 Queuing and ccBPM (or increasing Parallelism for ccBPM Processes)
Until recently ccBPM processes accepted messages from only one queue (one queue XBQO$PEWS for
each workflow) If there was a high message throughput for this workflow then a high backlog occurred for
these queues A couple of enhancements have therefore been implemented to improve scalability if the
ccBPM runtime
o Inbound processing without buffering
o Use of one configurable queue that can be prioritized or assigned to a dedicated server
o Use of multiple inbound queues (queue name will be XBPE_WS)
o Configure transactional behavior of ccBPM process steps to reduce number of persistency steps
Details about the configuration and tuning of the ccBPM runtime are described at
httpswwwsdnsapcomirjsdnhowtoguides SAP Netweaver 70 End-to-End Process Integration
o How to Configure Inbound Processing in ccBPM Part I Delivery Mode
o How to Configure Inbound Processing in ccBPM Part II Queue Assignment
o How to Configure ccBPM Runtime Part III Transactional Behavior of an Integration Process
Procedure
Use transaction SMQ2 to check if the queues of type XBQO$PE show a high backlog
o Based on this information verify if the ccBPM process is suitable to run with multiple queues This is especially the case for collect patterns realized in BPE If you can use multiple queues configure the workflow based on the above guides
56 Message Packaging in BPE
Inbound processing takes up the most amount of processing time in many scenarios within BPE
Message packaging in BPE helps to improve performance by delivering multiple messages to BPE process
instances in one transaction This can lead to an increased throughput which means that the number of
messages that can be processed in a specific amount of time can increase significantly Message packaging
can also increase the runtime for individual messages (latency) due to the delay in the packaging process
The sending of packages can be triggered when the packages exceed a certain number of messages a
specific package size (in kB) or a maximum waiting time The extent of the performance improvement that
can be obtained depends on the type of scenario Scenarios with the following prerequisites are generally
most suitable
o Many messages are received for each process instance
o Messages that are sent to a process instance arrive together in a short period of time
o Generally high load on the process type
o Messages do not have to be delivered immediately
For example collect scenarios are particularly suitable for message packaging The higher the number of
messages is in a package the higher the potential performance improvements will be
Tests that have been performed have shown a high potential for throughput improvements up to factor 47 in
tested Collect Scenarios depending on the packaging size that has been configured For more details about
the functionality of Message Packaging in BPE and its configuration see SAP Note 1058623 - BPE
Message Packaging
SAP NETWEAVER 71 AND HIGHER PERFORMANCE CHECK GUIDE
49
Message packaging in BPE is independent of message packaging in PI (see Chapter 45) but they can be
used together
SAP NETWEAVER 71 AND HIGHER PERFORMANCE CHECK GUIDE
50
6 ANALYZING THE (ADVANCED) ADAPTER ENGINE
This chapter describes further checks and possible reasons for bottlenecks in the (Advanced) Adapter
Engine Although this is not the place to describe the architecture of the Adapter Framework in detail the
following aspects are important to know for the analysis of a performance problem on the AFW
o The AFW contains the Messaging System that is responsible for the persistence and queuing of messages Within the flow of a message it is placed in between the sender adapter (for example a file adapter that polls from a folder) and the Integration Server as well as between the Integration Server and the receiver adapter (for example a JMS adapter that sends a message out to an external system)
o The Messaging System uses 4 queues for each adapter type and these are responsible for receiving and sending messages To separate the message transfer each adapter (for example JMS SOAP JDBC and so on) has its own set of queues One queue for receiving synchronous messages (Request queue) one queue for sending synchronous messages (Call queue) one queue for receiving asynchronous messages (Receive queue) and one queue for sending asynchronous messages (Send queue) The name of the queue always states the adapter type and the queue name (for example JMS_httpsapcomxiXISystemReceive for the JMS receiver asynchronous queues)
o A configurable number of consumer threads are assigned on each queue These threads work on the queue in parallel meaning that the Messaging Queues are not strictly FirstIn-FirstOut Five threads are assigned by default to each queue and thus five messages can be processed in parallel But as will be discussed later the parallel execution of requests to the backend depends heavily on the adapter being used since not every adapter can work in parallel by default
o SAP NetWeaver PI 71 introduced a new queue The dispatcher queue The dispatcher queue is used to realize prioritization on the AAE (see chapter Prioritization in the Messaging System) Every message in the PI system is first assigned to the dispatcher queue before it is assigned to the adapter-specific queues
Viewed from the perspective of a message that enters the PI system using a J2EE Engine adapter (for
example File) and leaves the PI system using a J2EE Engine adapter (for example JDBC) asynchronously
the steps are as follows
1) Enter the sender adapter
2) Put into the dispatcher queue of the messaging system
3) Forwarded to the File send queue of the messaging system (based on Interface priority)
4) Retrieved from the send queue by a consumer thread
5) Sent from the messaging system to the pipeline of the ABAP Integration Engine (if no Integrated Configuration (AAE) is used
6) Processed by the pipeline steps of the Integration Engine
7) Sent to the messaging system by the Integration Engine
8) Put into the dispatcher queue of the messaging system
9) Forwarded to the JDBC receive queue of the messaging system (based on Interface priority)
10) Retrieved from the receive queue (based on the maxReceivers)
11) Sent to the receiver adapter
12) Sent to the final receiver
SAP NETWEAVER 71 AND HIGHER PERFORMANCE CHECK GUIDE
51
All the analysis is based on the information provided in the Audit Log With SAP NetWeaver PI 71 the audit
log is not persisted for successful messages in the database by default to avoid performance overhead
Therefore the audit log is only available in the cache for a limited period of time (based on the overall
message volume) More details can be found in chapter Persistence of Audit Log information in PI 710 and
higher
As described in chapter Adapter Engine Performance monitor in PI 731 and higher a new performance
monitor is available from PI 731 SP4 With this monitor you can display the processing time per interface in
a given interval and identify the processing steps in which a lot of time is spend
With 731 SP10 and 74 SP5 a download functionality for the performance monitor is provided as described
in SAP Note 1886761
61 Adapter Performance Problem
Compared to a bottleneck in the Messaging System it is relatively easy to detect a performance
problembottleneck in the adapter Since the timestamps for inbound and outbound messages are written at
different points in time the procedure is described separately for sender and receiver adapters
Note It is not generally possible for all sender and receiver adapters to work in parallel (discussed in section
Adapter Parallelism)
611 Adapter Parallelism
As mentioned before not all adapters are able to handle requests in parallel Thus increasing the number of
threads working on a queue in the messaging system will not solve a performance problembottleneck
There are 3 strategies to work around these restrictions
1) Create additional communication channels with a different name and adjust the respective senderreceiver agreements to use them in parallel
2) Add a second server node that will automatically have the same adapters and communication channel running as the first server node This does not work for polling sender adapters (File JDBC or Mail) since the adapter framework scheduler assigns only one server node to a polling communication channel
3) Install and use a non-central Adapter Framework for performance-critical interfaces to achieve better separation of interfaces
SAP NETWEAVER 71 AND HIGHER PERFORMANCE CHECK GUIDE
52
Some of the most frequently-used adapters and the possible options are discussed below
o Polling Adapters (JDBC Mail File)
At the sender side these adapters use an Adapter Framework Scheduler which assigns a server node that does the polling at the specified interval Thus only one server node in the J2EE cluster does the polling and no parallelization can be achieved Therefore scaling via additional server node is not possible More details will be presented in section Adapter Framework Scheduler For example since the channels are doing the same SELECT statement on the database or pick up files with the same file name parallel processing will only result in locking problems To increase the throughput for such interfaces the polling interval has to be reduced to avoid a big backlog of data that is to be polled If the volume is still too high you should think about creating a second interface for example the new interface would poll the data from a different directory or database table to avoid locking
At the receiver side the adapters work sequentially on each server node by default For example only one UPDATE statement can be executed for JDBC for each Communication Channel (independent of the number of consumer threads configured in the Messaging System) and all the other messages for the same Communication Channel will wait until the first one is finished This is done to avoid blocking situations on the remote database On the other hand this can cause blocking situations for whole adapters as discussed in section Avoid Blocking Caused by Single SlowHanging Receiver Interface
To allow better throughput for these adapters you can configure the degree of parallelism at the receiver side In the Processing tab of the Communication Channel in the field ldquoMaximum Concurrencyrdquo enter the number of messages to be processed in parallel by the receiver channel For example if you enter the value 2 then two messages are processed in parallel on one J2EE server node The parallel execution of these statements at database level of course depends on the nature of the statements and the isolation level defined on the database If all statements update the same database record database locking will occur and no parallelization can be achieved
o JMS Adapter
The JMS adapter is per default using a push mechanism on the PI sender side This means the data is pushed by the sending MQ provider Per default every Communication channel has one JMS connection established per J2EE server node On each connection it processes one message after the other so that the processing is sequential Since there is one connection per server node scaling via additional server nodes is an option
With Note 1502046 - JMS Adapter message pull mechanism the JMS protocol can be changed to use a pull mechanism By doing so you can specify a polling interval in the PI Communication Channel and PI will be the initiator of the communication Also here the Adapter Framework Scheduler is used which implies sequential processing But in contrary to JDBC or File sender channels the JMS polling sender channel will allow parallel processing on all server nodes of the J2EE cluster Therefore scaling via additional J2EE server nodes is an option
The JMS receiver side supports parallel operation out of the box Only some small parts during message processing (pure sending of the message to the JMS provider) are synchronized Therefore to enable parallel processing on the JMS receiver side no actions are necessary
o SOAP Adapter
The SOAP adapter is able to process requests in parallel The SOAP sender side has in general no limitations in the number of requests it can execute in parallel The limiting factor here is the FCAThreads available to process the incoming HTTP calls This is discussed in more detail in chapter Tuning SOAP sender adapter On the receiver side the parallelism depends on the number of the threads defined in the messaging system and the ability of the receiving system to cope with the load
SAP NETWEAVER 71 AND HIGHER PERFORMANCE CHECK GUIDE
53
o RFC Adapter
The RFC adapter offers parameters to adjust the degree of parallelism by defining the number of initial and maximum connections to be used The initial threads are allocated from the Application thread pool directly and are therefore not available for any other tasks Therefore the number of initial thread should be kept minimal To avoid bottlenecks during the peak time the maximum connections can be used A bottleneck is indicated by the following exception in the Audit Log
comsapaiiaframsapiDeliveryException error while processing message to remote systemcomsapaiiafrfccoreclientRfcClientException resource error could not get a client from JCOPool comsapmwjcoJCO$Exception (106) JCO_ERROR_RESOURCE Connection pool RfcClient hellip is exhausted The current pool size limit (max connections) is 1 connections
Also this should be done carefully since these threads will be taken from the J2EE application thread pool Therefore a very high value there can cause a bottleneck on the J2EE engine and therefore cause a major instability of the system As per RFC adapter online help the maximum number of connections are restricted to 50
o IDoc_AAE Adapter
The IDoc adapter on Java (IDoc_AAE) was introduced with PI 73 On the sender side the parallelization depends on the configuration mode chosen In Manual Mode the adapter works sequential per server node For channels in ldquoDefault Moderdquo it depends on the configuration of the inbound Resource Adapter (RA) Via the parameter MaxReaderThreadCount of the inbound RA you can configure how many threads are globally available for all IDoc adapters running in Default Mode Hence this determines the overall parallelization of the IDoc sender adapter per Java server node Currently the recommended maximum number of threads is 10
The receiver side of the Java IDoc adapter is working parallel per default
The table below gives a summary of the parallelism for the different adapter types
SAP NETWEAVER 71 AND HIGHER PERFORMANCE CHECK GUIDE
54
612 Sender Adapter
The first step(s) to be taken for a sender adapter depend on the type of adapter itself Afterwards however
the message flow is always the same First the message is processed in the Module Processor and
afterwards put into the queue of the Messaging System If the message is synchronous then it is the call
queue if the message is asynchronous that it is the send queue The final action of the Adapter Framework
is then to send the message from the messaging system to the Integration Server (for Non ICO interfaces)
Only the first entries of the audit log are of interest to establish if the sender adapter has a performance
problem From the first entry to the entry ldquoMessage successfully put into the queuerdquo These steps logically
belong to the sender adapter and the Module Processor while the subsequent steps belong to the
Messaging System The sender adapter uses one J2EE Engine application thread to execute its work This
is generally the same thread for all steps involved
Select the ldquoDetailsrdquo of a message in the AFW The first entry of the audit log will be the beginning of the activity of the sender adapter The end of the adapterrsquos activity is marked by the entry ldquoThe application sent the message asynchronously using connection Returning to applicationrdquo
6121 Tuning SOAP sender adapter As described above in general there is no limitation in the parallelization of the SOAP sender adapter itself
The incoming SOAP requests are limited by the available FCA Threads for HTTP processing The FCA
Threads are discussed in more detail in FCA Server Threads
Per default all interfaces using the SOAP adapter are using the same set of FCA Threads since they are all
using the same URL httplthostgtltportgtMessageServlet In case one interface is facing a very high load or
slow backend connections this can cause a blockage of the available FCA Threads and could cause a heavy
impact on the processing time of other interfaces
To avoid this SAP Note 1903431 allows the usage of different URLs for specific interfaces This way you
could isolate interfaces with a very high volume on a dedicated entry point using its own set of FCA Threads
In case of high load for this interface the other SOAP sender interfaces would not be affected by a shortage
of FCA Threads
SAP NETWEAVER 71 AND HIGHER PERFORMANCE CHECK GUIDE
55
To use this new feature you can specify on the sender system the following two entry points
o MessageServletInternal
o MessageServletExternal
More information about the URL of the SOAP adapter can be found here
613 Receiver Adapter
For a receiver adapter it is just the other way around when compared to the sender adapter First the
message is received from the Integration Server and then put into a queue of the Messaging System this
time either the request or the receive queue for asynchronous and the request queue for synchronous
messages The last step is then the activity of the receiver adapter itself
Select the ldquoDetailsrdquo of a message in the AFW The adapter activity starts after the entry ldquoThe message status set to DLNGrdquo The message will then be forwarded to the entry point of the AFW ldquoDelivering to channel ltchannel_namegtrdquo enters the Module Processor ldquoMP Entering Module Processorrdquo and ends with ldquoThe message was successfully delivered to the application using connection rdquo
Depending on the type of the adapter you now have to investigate why the receiver adapter needs a high amount of processing time This could be a complicated operating system command a bad network connection or a slow backend system among many other reasons
Here too custom modules can be the reason for a prolonged processing time Check Performance of Module Processing for more details
Note From 71 the audit log is not persisted any longer for performance reasons as described in Persistence of Audit Log information in PI 710 and higher
SAP NETWEAVER 71 AND HIGHER PERFORMANCE CHECK GUIDE
56
614 IDoc_AAE adapter tuning
A comprehensive and up-to date description about the tuning of the IDoc adapter is summarized in Note
1641541 - IDoc_AAE Adapter performance tuning Please refer to this Note for details
Similar to all other adapters running on the Adapter Engine also the IDOC_AAE adapter is using the Messaging System queues and the explanations of the next chapter Messaging System Bottleneck are also valid for the IDOC_AAE adapter Note that the IDOC_AAE adapter only supports async Scenarios ndash so it is only using the ldquoSendrdquo queue in Java-only scenarios and the ldquoSendrdquo and ldquoReceiverdquo queue in dual-stack scenariosrdquo
For the IDoc_AAE sender you can configure in addition bulk support as indicated in the screenshot below By doing so all messages received by PI in one RFC call from ERP will be processed as one message This is similar to the mechanism of the ABAP IDoc adapter described in the chapter Packaging on sender and receiver side except with the difference that the number of messages in one bulk cannot be further limited
It is also essential to ensure that the size of the IDocs or IDoc packages for sender or receiver IDocs is not
getting too large to avoid any negative impact on the Java heap memory and Garbage Collection In the
case of the IDoc_AAE adapter the XML size of the IDoc is less critical it is the number of segments in an
IDoc or the overall number of segments in all IDocs of an IDoc package that will influence the memory
allocation during message processing Based on the current implementation per IDoc segment around 5 KB
of memory during processing is required A package of 5 IDocs with 2000 segments for each IDoc would
consume roughly 500 MB during processing In such cases it is important to eg lower the package size
andor use large message queues as outlined in chapter Large message queues on PI Adapter Engine
615 Packaging for Proxy (SOAP in XI 30 protocol) and Java IDoc adapter
Due to message packaging in the Integration Engine (see PI Message Packaging for Integration Engine) the
ABAP based IDoc and Proxy adapter was always using packaging when sending asynchronous messages
to the receiver system With PI 731 packaging was also introduced for Java based IDoc and Proxy (SOAP in
XI 30 protocol) adapter The aim of packaging is to achieve similar benefits to packaging already existing in
ABAP pipeline
o Less calls to backend consuming less parallel Dialog Work Processes on the receiver
o Less overhead due to context switches authentication when calling the backend
Especially for high volume interfaces packaging should be enabled to avoid overloading of the backend
systems and impact on users operating on the system
SAP NETWEAVER 71 AND HIGHER PERFORMANCE CHECK GUIDE
57
Important
In the ABAP stack the packaging is active per default (in 71 and higher) as described in chapter PI
Message Packaging for Integration Engine Experience shows that packaging can have a very high impact
on the DIA Work process usage on the ERP receiver side Especially for migration projects from dual-stack
PI to AEXPO it is important to evaluate packaging to avoid any negative impact on the receiving ECC due
to missing packaging
The packaging on Java works in general different then on ABAP While in ABAP the aggregation is done on
the individual qRFC queue level (which always contains messages to one receiver system only) this is not
possible on the Adapter Engine since messages for all receivers are located in the same queue Therefore
packages are built outside of the Adapter Engine queues The messages to be packaged will be forwarded
to a bulk handler which waits till either the time for the package is exceeded or the number of messages or
data size is reached After this the message is send by a bulk thread to the receiving backend system
Packaging on Java is always done for a server node individually If you have a high number of server nodes
packaging will work less efficiently due to the load balancing of messages across the available server nodes
When enabling message packaging the message status will stay in status ldquoDeliveringrdquo throughout all steps
described above In the audit log you can see the time it spends in packaging The audit log shown below
shows eg that the message was almost waiting one minute before the package was built and 9 IDocs were
sent with this package
Packaging can be enabled globally by setting the following parameters in Messaging System service as
described in Note 1913972
o messagingsystemmsgcollectorenabled Enable packaging or disable it globally
o messagingsystemmsgcollectormaxMemPerBulk The maximum size of a bulk message
o messagingsystemmsgcollectorbulkTimeout The wait time per bulk - default 60 seconds
o messagingsystemmsgcollectormaxMemTotal Maximum memory which can be used by message collector
o messagingsystemmsgcollectorpoolSize Number of parallel threads used to send out packages to the backend This value has to be tuned based on the general performance of the receiver system the network latency between the systems or the configuration of the IDoc posting on the ERP sender side (described in chapter IDoc posting on receiver side) Therefore tuning of these threads might be very important These threads can unfortunately not be monitored yet with any PI tool or Wily
SAP NETWEAVER 71 AND HIGHER PERFORMANCE CHECK GUIDE
58
Introscope To verify that not all packaging threads are in use you can use the Thread monitoring in the SAP Management Console and check for threads named ldquoBULK_EXECUTORrdquo as shown below
If you would like to adapt the packaging for specific communication channel this can also be done using the
configuration options in the Integration Directory
While in the SOAP adapter in XI 30 protocol you can define three different packaging KPIs this is currently
not possible for the IDoc adapter There you can only specify the package size based on number of
messages
616 Adapter Framework Scheduler
For polling adapters like File JDBC and JMS the Adapter Framework Scheduler determines on which server
node the polling takes place Per default a File or JDBC sender only works on one server node and the
Adapter Framework (AFW) Scheduler determines on which one the job is scheduled
The Adapter Frameworks scheduler had several performance and reliability issues in a cluster environment
especially in systems having many Java server nodes and many polling communication channels Based on
this and the symptoms described in Note 1355715 - AF Scheduler to avoid using cluster communication a
new scheduler was released We highly recommend using the new version of the AFW scheduler To
activate the new scheduler you have to set the parameter schedulerrelocMode of the Adapter framework
SAP NETWEAVER 71 AND HIGHER PERFORMANCE CHECK GUIDE
59
service property to some negative value For instance by setting the value to -15 after every 15th polling
interval a rebalancing of the channel within the J2EE cluster might happen This can allow for better
balancing of the incoming load across the available server nodes if the files are coming in on regular
intervals The balancing is achieved by doing a servlet call Based on the HTTP load balancing the channel
might then be dispatched to another server node To avoid the balancing overhead this value should not be
set too low A value between -10 and -15 should be acceptable in most cases For very short polling intervals
(eg every second) even lower values (eg -50) can be configured
In case many files are put at one given time on the directory (by eg using a batch process) all these files will
be processed by one polling process only Hence a proper load balancing cannot be achieved by the AFW
scheduler In such a case the only option is to use write the files with different names or different directories
so that you can configure multiple sender channels to pick up the files
Starting from PI 731 you can monitor the Adapter Framework Scheduler in pimon Monitoring
Background Job Processing Monitor Adapter Framework Scheduler Jobs There you can check on which
server node the Communication Channel is polling (Status=rdquoActiverdquo) Also you can see the time the channel
was polling the last time and will poll next time
You cannot influence the server node on which the channel is polling This is determined via the AFW
scheduler You can only influence the frequency after which a channel can potentially move to another
server node by tuning the parameter relocMode as outlined above
Prior to PI 731 you have to use the following URL to monitor the Adapter Framework Scheduler
httpserverportAdapterFrameworkschedulerschedulerjsp
Above you see an example of a File sender channel The type value determines if the channel runs only on
one server node (type = L (local)) or on all server nodes (Type = G (global)) The time in the brackets
[60000] determines the polling interval in ms ndash in this case 60 seconds The Status column shows the
status of the channel
o ldquoONrdquo Currently polling
o ldquoonrdquo Currently waiting for the next polling
SAP NETWEAVER 71 AND HIGHER PERFORMANCE CHECK GUIDE
60
o ldquooffrdquo not scheduled any longer (eg channel deactivated or scheduled on another server node)
62 Messaging System Bottleneck
As described earlier the Messaging System is responsible for persisting and queuing messages that come
from any sender adapter and go to the Integration Server pipeline or Java only interfaces (ICO) or that come
from the Integration Server pipeline and go to any receiver adapter The time difference between receiving
the message from the one side and delivering it to the other side is the value that can be used to analyze
bottlenecks in the Messaging System The following chapters describe how to determine the time difference
for both directions
A bottleneck (or rather a ldquofakerdquo bottleneck) in the Messaging System can usually be closely connected with a
performance problem in the receiver adapter You must therefore make sure you execute the check
described in chapter 613 If the receiver adapter needs a lot of time to process messages then of course
the messages get queued in the messaging system and remain there for a long time since the adapter is not
ready to process the next one yet It looks like the messaging system is not fast enough but actually the
receiver adapter is the limiting factor
Execute the checks described in chapter 621 and 622 to get an overview of the situation you should do this for multiple messages
Decide if a specific receiver adapter is causing long waiting times in the messaging system by executing the check described in chapter 613 An additional hint at a receiver adapter problem is if only messages to specific receivers show a long wait time in the queue
Use the queue monitoring in the Runtime Workbench (RWB) to analyze how many threads are active for each of the queue types and how large the queue size currently is To do so choose Component Monitoring Adapter Engine Press the Engine Status button and choose tab ldquoAdditional Datardquo This will open the page below showing the number of messages in a queue the threads currently working and the maximum available threads Note This view only shows the Messaging System of one J2EE server node To get the whole picture you have to check all the server nodes that are available in your system via the drop down list box
SAP NETWEAVER 71 AND HIGHER PERFORMANCE CHECK GUIDE
61
o Since checking all the server nodes with this browser frontend can be very tedious it is better to use Wily Introscope since it allows easy graphical analysis of the queues and thread usage of the messaging system across Java server nodes
The starting point in Wily Introscope is usually the PI triage showing all the backlogs in the queue In the screenshot below a backlog in the dispatcher queue (for 71 and higher only) can be seen
The dispatcher queue is not the problem here since it will forward messages to the adapter queue if any free
threads are available on the adapter specific consumer threads The analysis must start in the PI inbound
queues By using the navigation button in the upper right corner of the inbound queue size you can directly
jump to a more detailed view where you can see that the file adapter was causing the backlog
SAP NETWEAVER 71 AND HIGHER PERFORMANCE CHECK GUIDE
62
To see the consumer thread usage you can then follow the link to the file adapter In the screenshot below
you can see that all consumer threads were exceeded during the time of the backlog Thus increasing the
number of consumer threads could be a solution if the resulting delay is not acceptable for business
o If it is obvious that the messaging system does not have enough resources as in the case above increase the number of consumers for the queue in question Use the results of the previous check to decide which adapter queues need more consumers
The adapter specific queues in the messaging system have to be configured in the NWA using
service ldquoXPI Service AF Corerdquo and property messagingconnectionDefinition The default
values for the sending and receiving consumer threads are set as follows
(name=global messageListener=localejbsAFWListener exceptionListener=
localejbsAFWListener pollInterval=60000 pollAttempts=60
SendmaxConsumers=5 RecvmaxConsumers=5 CallmaxConsumers=5
RqstmaxConsumers=5)
To set individual values for a specific adapter type you have to add a new property set to the default set with the name of the respective adapter type for example
(name=JMS_httpsapcomxiXISystem
messageListener=localejbsAFWListener
exceptionListener=localejbsAFWListener pollInterval=60000
pollAttempts=60 SendmaxConsumers=7 RecvmaxConsumers=7
CallmaxConsumers=7 RqstmaxConsumers=7)
The name of the adapter specific queue is based on the pattern ltadapter_namegt_ ltnamespacegt for
example RFC_httpsapcomxiXISystem
Note that you must not change parameters such as pollInterval and pollAttempts For more details see SAP Note 791655 - Documentation of the XI Messaging System Service Properties
o Not all adapters use the parameter above Some special adapters like CIDX RNIF or Java Proxy can be changed by using the service ldquoXPI Service Messaging Systemrdquo and property messagingconnectionParams by adding the relevant lines for the adapter in question as described above
o A performance problem on the Messaging System can also be caused by a high logging as described in chapter Logging Staging on the AAE (PI 73 and higher)
o Important Make sure that your system is able to handle the additional threads that is monitor the CPU usage and application thread availability as well as the memory of the J2EE Engine after you have applied the change
SAP NETWEAVER 71 AND HIGHER PERFORMANCE CHECK GUIDE
63
o Important Keep in mind that not all adapters are able to handle requests in parallel even if you assign more threads on the Messaging System queues In such a case adding additional threads will not speed up processing significantly See chapter Adapter Parallelism for details
o A backlog of messages in the messaging system is highly critical for synchronous scenarios due to timeouts that might occur Therefore the number of synchronous threads always has to be tuned so that no bottleneck occurs Often a backlog in synchronous queues is caused due to bad performance on the receiving backend system
o More information is provided in the blog Tuning the PI Messaging System Queues
621 Messaging System in between AFW Sender Adapter and Integration Server (Outbound)
Open the Audit Log of a message and look for the following entry ldquoThe message was successfully retrieved
from the send queuerdquo Note that the queue name would be ldquoCall Queuerdquo if the message was synchronous
To determine how long the message waited to be picked up from the queue compare the timestamp of the
above entry with the timestamp for the step ldquoMessage successfully put into the queuerdquo A large time
difference between those two timestamps would therefore indicate a bottleneck for consumer threads on the
sender queues in the Messaging System
Instead of checking the latency of single messages we recommend using Wily Introscope to monitor the
queue behavior as shown above
Asynchronous messages only use one thread for processing in the messaging system Multiple threads are
used for synchronous messages The adapter thread puts the message into the messaging system queue
and will wait till the messaging system delivers the response The adapter thread is therefore not available
for other tasks until the response is returned A consumer thread on the call queue sends the message to the
Integration Engine The response will be received by a third thread (consumer thread of send queue) which
correlates the response with the original request After this the initiating adapter thread will be notified to
send the response to the original sender system This correlation can be seen in the audit log of the
synchronous message below
SAP NETWEAVER 71 AND HIGHER PERFORMANCE CHECK GUIDE
64
622 Messaging System in Between Integration Server and AFW Receiver Adapter (Inbound)
Open the Audit Log of a message and look for the following entry ldquoMessage successfully put into the
queuerdquo Compare this timestamp with the timestamp for the step ldquoThe message was successfully retrieved
from the receive queuerdquo The time difference between these two timestamps is the time that the message
waited in the messaging system for a free consumer thread A large time difference between those two
timestamps indicates a bottleneck in the adapter specific inbound queues of the Messaging System
623 Interface Prioritization in the Messaging System
SAP NetWeaver PI 71 and higher offers the possibility for prioritization of interfaces similar to the ABAP
stack This feature is especially helpful if high volume interfaces run at the same time with business critical
interfaces To minimize the delay for critical messages the Messaging System now makes it possible for you
to define high medium and low priority processing at interface level Based on the priority the Dispatcher
Queue of the messaging system (which will be the first entry point for all messages) will forward the
messages to the standard adapter-specific queues The priority assigned to an interface determines the
number of messages that are forwarded once the adapter-specific queues have free consumer threads
available This is done based on a weighting of the messages to be reloaded The weights for the different
priorities are as follows High 75 Medium 20 Low 5
Based on this approach you can ensure that more resources can be used for high priority interfaces The
screenshot below shows the UI for message prioritization available in pimon Configuration and
Administration Message Prioritization
SAP NETWEAVER 71 AND HIGHER PERFORMANCE CHECK GUIDE
65
The number of messages per priority can be seen in a dashboard in Wily as shown below
You can find more details on configuring usage prioritization within the AAE at SAP Online Help navigate to
SAP NetWeaver SAP NetWeaver PI SAP NetWeaver Process Integration 71 Including Enhancement
Package 1 SAP NetWeaver Process Integration Library Function-Oriented View Process Integration
Process Integration Monitoring Component Monitoring Prioritizing the Processing of Messages
624 Avoid Blocking Caused by Single SlowHanging Receiver Interface
As already discussed above some receiver adapters process messages sequentially on one server node by
default This is independent of the number of consumer threads defined for the corresponding receiver
queue in the messaging system For example even though you have configured 20 threads for the JDBC
Receiver one Communication Channel will only be able to send one request to the remote database at a
given time If there are many messages for the same interface all of them will get a thread from the
messaging system but will be blocked when performing the adapter call
In the case of a slow message transmission for example for EDI interfaces using ISDN technology or
remote system with small network bandwidth this behavior can cause a ldquohangingrdquo situation for a specific
adapter since one interface can block all messaging threads As a result all the other interfaces will not get
any resources and will be blocked
SAP NETWEAVER 71 AND HIGHER PERFORMANCE CHECK GUIDE
66
Based on this a parameter messagingsystemqueueParallelismmaxReceivers was introduced which can
be set in NWA in service XPI Service Messaging System With this parameter you can restrict the maximum
number of receiver consumer threads that can be used by one interface In older releases (lower 731 SP11
and 74 SP6) this is a global parameter at the moment that affects all adapters It should therefore not be set
too restrictively If you need high parallel throughput one option is to set the maxReceiver parameter to 5 (so
that each interface can use 5 consumer threads for each server node) and increase the overall number of
threads on the receive queue for the adapter in question (for example JDBC) to 20 With this configuration it
will be possible for four interfaces to get resources in parallel before all threads are blocked For more
information see Note 1136790 - Blocking Receiver Channel May Affect the Whole Adapter Type and SDN
blog Tuning the PI Messaging System Queues
In the screenshot below you see the impact of maxReceivers parameter when a backlog for one interface
occurs Even though there are more free SOAP threads available they are not consumed Hence the free
SOAP threads could be assigned to other interfaces running in parallel
This parameter has a direct impact on the queue where message backlogs occur As mentioned earlier
usually a backlog should occur on the Dispatcher queue only since it is responsible to dispatch threads only
if there are free consumer threads in the adapter specific queue When setting maxReceiver you restrict the
threads per interface and this means that less consumer threads are blocked When one interface is facing a
high backlog there will always be free consumer threads and therefore the dispatcher queue can dispatch
the message to the adapter specific queue Hence the backlog will appear in the adapter specific queue so
that the message prioritization would not work properly any longer
SAP NETWEAVER 71 AND HIGHER PERFORMANCE CHECK GUIDE
67
Per default the maxReceiver parameter is only relevant for asynchronous message processing (ICo and
classical dual-stack scenarios) The reason here is that a wait time for synchronous scenarios should be
avoided by all means and therefore additional restrictions in the number of available threads can be very
critical Therefore it is usually advisable to not limit the threads per interface but increase the overall number
of available threads In case you have many high volume synchronous scenarios with different priority that
run in parallel it might be advisable to limit the threads each interface can use To do so you have to set the
parameter messagingsystemqueueParallelismqueueTypes to Recv ICoAll as described in SAP Note
1493502 - Max Receiver Parameter for Integrated Configurations
Enhancement with 731 SP11 and 74 SP6
With Note 1916598 - NF Receiver Parallelism per Interface an enhancement was introduced that allows
the specification of the maximum parallelization on more granular level This new feature has to be activated
by setting the parameter messagingsystemqueueParallelismperInterface to true Using a configuration UI
you can specify rules to determine the parallelization for all interfaces of a given receiver service If no rule
for a given interface is specified the global maxReceivers value will be considered If the receiver service
corresponds to a technical business system this configuration would help to restrict the parallel requests
from PI to that system This also works across protocols so that eg it could be used to restrict the number of
parallel requests using Proxy or IDoc to the same ERP receiver system Below you can find a screenshot of
the configuration UI in NWA SOA Monitoring
With the improvement mentioned above also the dispatching mechanism in the dispatcher queue is
changed so that it is aware of the maxReceiver settings This means that now again the backlog will now be
placed in the dispatcher queue and the prioritization will work properly
625 Overhead based on interface pattern being used
Also the interface pattern configured can cause some overhead When choosing the interface pattern
ldquoStateless Operationrdquo each message is parsed against its data type during inbound processing This can
cause performance and memory overhead but gives a syntactical check of the data received
When choosing ldquoStateless (XI30-Compatible)rdquo no check of the data type is performed and therefore the
overhead is avoided Therefore for interface with good data quality and high message throughput this
interface pattern should be chosen
SAP NETWEAVER 71 AND HIGHER PERFORMANCE CHECK GUIDE
68
63 Performance of Module Processing
If your analysis in chapter Adapter Performance Problem pointed to a problem in the Module Processing
then you must analyze the runtime of the modules used in the Communication Channel Adapter modules
can be combined so that one CC calls multiple modules in a defined sequence Adapter modules can be
custom-developed or SAP standard and can be used for many different purposes ndash like to transform the EDI
message before sending it to the partner or to change header attributes of a PI message before forwarding it
to a legacy application Due to the flexible usage of adapter modules there is also no standard way to
approach performance problems
In the audit log shown below you can see two adapter modules One module is a customer-developed
module called SimpleWaitModule The next module called CallSAPAdapter which is a standard module that
inserts the data into the messaging system queues
In the audit log you will get a first impression of the duration of the module In the example above you can
see that the SimpleWaitModule requires 4 seconds of processing time
Once again Wily Introscope offers a better overview of the processing time of modules In the screenshot
below you can see a dashboard showing the cumulativeaverage response times and number of invocations
of different modules If there is one that has been running for a very long time then it would be very easy to
identify since there will be a line indicating a much higher average response time The tooltip displays the
name of the module
Module
Processing
SAP NETWEAVER 71 AND HIGHER PERFORMANCE CHECK GUIDE
69
Once you have identified the module with the long running time you have to talk to the responsible developer
to understand why it is taking that long Eventually the module executes a look-up to a remote system using
JCo or JDBC which could be responsible for the delay In the best case the module will print out information
in addition to the audit log to detect such steps If not use the Wily Introscope transaction trace as explained
in appendix Wily Transaction Trace
64 Java only scenarios Integrated Configuration objects
From SAP NetWeaver PI 71 on you can configure scenarios that only run on the Java stack using the
Advance Adapter Engine (AAE) when only Java-based adapters are used A new configuration object is
used for this that is called Integrated Configuration When using this the steps executed so far in the ABAP
pipeline (Receiver Determination Interface Determination and Mapping) are also executed by the services in
the Adapter Engine
641 General performance gain when using Java only scenarios
The major advantage of AAE processing is a reduced overhead due to the context switches between ABAP
and Java Thus the overall throughput can be increased significantly and the overall latency of a PI
message can be reduced greatly If possible interfaces should always use the Integrated Configuration to
achieve best performance Therefore the best tuning option is to change a scenario that is using Java based
sender and receiver adapters from a classical ABAP-based scenario to an AAE-based one
SAP NETWEAVER 71 AND HIGHER PERFORMANCE CHECK GUIDE
70
Based on SAP internal measurements performed on 71 releases the throughput as well as the response
time could be improved significantly as shown in the diagrams below
SAP NETWEAVER 71 AND HIGHER PERFORMANCE CHECK GUIDE
71
Based on these measurements the following statements can be made
1) Significant performance improvements can be achieved always with local processing (if available) for a certain scenario
2) This is valid for all adapter types huge mapping runtimes slow networks slow (receiver) applications reduce the throughput and therefore rated for the overall scenario also reduce the benefit of local processing in terms of overall throughput and response time measurements
3) Greatest benefit is recognized for small payloads (comparison 10k 50k 500k) and asynchronous messages
642 Message Flow of Java only scenarios
All the Java based tuning options mentioned in chapter Analyzing the (Advanced) Adapter Engine and Long
Processing Times for ldquoPLSRV_MAPPING_REQUESTrdquo are still valid Just the calling sequence is different
The following describes the steps used in Integrated Configuration to help you better understand the
message flow of an interface The example is JMS to Mail
1) Enter the JMS sender adapter
2) Put into the dispatcher queue of the messaging system
3) Forwarded to the JMS send queue of the messaging system
4) Message is taken by JMS send consumer thread
a No message split used
In this case the JMS consumer thread will do all the necessary steps previously done in the ABAP pipeline (like receiver determination interface determination and mapping) and will then also transfer the message to the backend system (remote database in our example) Thus all the steps are executed by one thread only
b Message split used (1n message relation)
In this case there is a context switch The thread taking the message out of the queue will process the message up to the message split step It will create the new message and put it in the Send queue again from where it will be taken by different threads (which will then map the child message and finally send it to the receiving system)
As we can see in this example for Integrated Configuration only one thread does all the different steps of a
message The consumer thread will not be available for other messages during the execution of these steps
The tuning of the Send queue (Call for synchronous messages) is therefore much more important for
scenarios using Integrated Configuration than for ABAP-based scenarios
The different steps of the message processing can be seen in the audit log of a message If for example a
long-running mapping or adapter module is indicated then you can use the relevant chapter of this guide
There is no difference in the analysis except that for mappings no JCo connection is required since the
mapping call is done directly from the Java stack
SAP NETWEAVER 71 AND HIGHER PERFORMANCE CHECK GUIDE
72
The example audit logs below are based on a Java only synchronous SOAP to SOAP scenario
In the highlighted areas you can see that all the steps are very fast except the mapping call which lasts
around 7 seconds To analyze the long duration of the mapping now the same steps as discussed in chapter
Long Processing Times for ldquoPLSRV_MAPPING_REQUESTrdquo have to be followed
SAP NETWEAVER 71 AND HIGHER PERFORMANCE CHECK GUIDE
73
643 Avoid blocking of Java only scenarios
Like classical ABAP based scenarios Java only scenarios can face backlog situations in case of a slow or
hanging receiver backend Since the Java only interfaces are only using send queues the restriction of
consumer threads on the receiver queue as described in chapter Avoid Blocking Caused by Single
SlowHanging Receiver Interface is no solution
Based on that an additional property messagingsystemqueueParallelismqueueTypes of service SAP XI AF
MESSAGING was introduced via Note 1493502 - Max Receiver Parameter for Integrated Configurations
The parameter can be set for synchronous and asynchronous interfaces Please keep in mind that
messagingsystemqueueParallelismmaxReceivers is a global parameter for all adapters and for all
configured Quality of Service This global restriction can be avoided starting with 731 SP11 740 SP06 as
per SAP Note 1916598 - NF Receiver Parallelism per Interface Usually a restriction for the parallelization
can be highly critical for synchronous interfaces Therefore we generally recommend to set
messagingsystemqueueParallelismqueueTypes in most cases to Recv IcoAsync only
644 Logging Staging on the AAE (PI 73 and higher)
Up to PI 711 on the PI Adapter Engine only one message version was persisted Especially for Java only
scenarios this was often not sufficient for troubleshooting since for instance the result of a mapping could not
be verified
Starting from PI 73 the persistence steps can be configured globally in the Adapter Engine for synchronous
and asynchronous interfaces This is similar to the LOGGING or LOGGING_SYNC on the ABAP stack In
later version of PI you will be able to do the configuration on interface level
The versions that can be persisted are shown in the diagram below (the abbreviations in green are the
values for the configuration)
SAP NETWEAVER 71 AND HIGHER PERFORMANCE CHECK GUIDE
74
In the Messaging System we generally distinguish Staging (versioning) and Logging An overview is given
below
For details about the configuration please refer to the SAP online help Saving Message Versions
Similar to the LOGGING on the ABAP Integration Server persisting several versions of the Java message
can cause a high overhead on the DB and can cause a decrease in performance
The persistence steps can be seen directly in the audit log of a message
Also the Message Monitor shows the persisted versions
SAP NETWEAVER 71 AND HIGHER PERFORMANCE CHECK GUIDE
75
While this additional monitoring attributes are extremely helpful for troubleshooting they should be used
carefully from a performance perspective Especially the number of message versions and the
loggingstaging mode you choose can have a severe impact on performance Therefore you have to find the
balance between business requirement and performance overhead Some guidelines on how to use staging
and logging are summarized in SAP Note 1760915 - FAQ Staging and Logging in PI 73 and higher
65 J2EE HTTP load balancing
With NetWeaver version 71 and higher the Java HTTP load balancing is no longer done by the Java
Dispatcher but by the ICM The default load balancing rules of the ICM are designed with a stateful
application in mind giving priority to the balancing of HTTP sessions These default rules are not optimal for
stateless applications such as SAP PI
In the past we could observe an unequal load distribution across Java server nodes caused by this In case
of high backlogs this can cause a delay in the overall message processing of the interface because one
server node has more messages assigned than others and therefore not all available resources are used
A typical example can be seen in the Wily screenshot below
SAP Note 1596109 ndash Uneven distribution of HTTP requests on Java server nodes introduces new load
balancing rules for stateless applications like PI Please follow the description in the Note to ensure the
messages are distributed equally across the available server nodes In the meantime these load balancing
rules can also be executed using the CTC templates as described in Notes 1756963 and 1757922 Also this
has been included in the PI Initial Setup wizard in order to execute this task automatically as a post-
installation step (see Note 1760700 - PI CTC Add HTTP loadbalancing to initial setup)
SAP NETWEAVER 71 AND HIGHER PERFORMANCE CHECK GUIDE
76
For the example given above we could see a much better load balancing after the new load balancing rules
were implemented This can be seen in the following screenshot
Please Note The load balancing rules mentioned above are only responsible to balance the messages
across the available server nodes of one instance HTTP load balancing across application servers is done
by the SAP Web Dispatcher More information about this is provided in the Guide How To Scale SAP PI 71
66 J2EE Engine Bottleneck
All tuning that can be done in the AFW is limited by the ability of the J2EE Engine to handle a given amount
of threads and to provide enough memory that is needed to process all requests Of course the CPU is also
a limiting factor but this will be discussed in Chapter 91
From SAP NetWeaver PI 71 onwards the SAP VM is used on all platforms Therefore the analysis of all
platforms can use the same tools
661 Java Memory
The first analysis of the J2EE memory is usually done using the garbage collection (GC) behavior of the
Java Virtual Machine (JVM) To get the information of the GC written to the standard log file the JVM has to
be started with the parameter ndashverbosegc
Analyze the file std_serverltngtout for the frequency of GCs their duration and the allocated memory
Look for unusual patterns indicating an Out-of-Memory error or an unintentional restart of your J2EE engine This would be visible if the allocated memory drops to 0 at a given point in time A healthy Garbage Collection output would display a saw tooth pattern ndash that is the memory usage would increase over time but then go down to its original value as soon as a full Garbage Collection is triggered You should see the memory usage go down to initial values during low volume times (night-time)
Pay attention to GCs with a high duration This is important because no PI message can be mapped or processed by the J2EE Adapter Framework during a GC in a JAVA VM One of the many reasons for long GCs that should be mentioned here is paging (see chapter 92) If the heap space of the J2EE Engine is exhausted all objects in the heap are evaluated for their references If there is still a reference the object is kept If there is no reference the object is deleted If some or all of the objects have been swapped out due to insufficient RAM then they have to be swapped in to be evaluated This leads to very long runtimes for GCs GCs of more than 15 minutes have been observed on swapping systems
SAP NETWEAVER 71 AND HIGHER PERFORMANCE CHECK GUIDE
77
Different tools exist for the Garbage Collection Analysis
1) Solution Manager Diagnostics
Solution Manager Diagnostics (SMD) offers a memory analysis application that is able to read the GC output in the std_serverltngtout files To start call the Root Cause Analysis section In the Common Task list you find the entry Java Memory Analysis which will give you the chance to upload your std_serverltngtout file It shows the memory allocated after the GC and also prints the duration of each GC (black dots with duration scale on right axis) A normal GC output should show a saw tooth pattern where the memory always goes down to an initial value (especially during low volume times) This is shown in the example screenshot below
2) Wily Introscope
Again Wily Introscope offers different dashboards that can be used to check the Garbage Collection behavior on the J2EE engine The dashboard can be found using the J2EE Overview J2EE GC Overview and shows important KPIs for the GC such as the count of GC or the duration for each interval The GC Time dashboards shows the ratio of time spent in GC An example is shown in the screenshot below
SAP NETWEAVER 71 AND HIGHER PERFORMANCE CHECK GUIDE
78
3) Netweaver Administrator
The NWA also offers a view to monitor the Java heap usage However the important information about the duration of the GC is not available This monitor can be found by navigating to Availability and Performance Management Java System Reports Choose Report System Health
In NetWeaver 73 you find this data in Availability and Performance Management Resource Monitoring History Reports There you can build your own Memory report of the monitoring data provided The screenshot below eg shows the Used Memory per server node
SAP NETWEAVER 71 AND HIGHER PERFORMANCE CHECK GUIDE
79
4) SAP JVM Profiler
The SAP JVM profiler allows the analysis of the extensive GC information stored in the sapjvm_gcprf files of the server node folders or to directly connect to the server node to retrieve this information More information can be found at httpwikiscnsapcomwikidisplayASJAVAJava+Profiling
SAP NETWEAVER 71 AND HIGHER PERFORMANCE CHECK GUIDE
80
Procedure
o Search for restarts of the J2EE Engine by searching for the string ldquois startingrdquo in the file std_serverltngtout Apart from the first of these entries (which simply marks the initial start of the J2EE Engine) the second and any later entries mark a fatal situation after which the J2EE server node had to be restarted This could for example be an outndashof-memory situation Search the log above those entries for a possible reason
o Search for exceptions and fatal entries Was an out-of-memory error reported (search for pattern OutOfMemory) Was a thread shortage reported
o This document does not deal with tuning the J2EE Engine If at this point it becomes clear that the J2EE Engine is the limiting factor proceed with SAP Notes or open a customer incident Only some very basic recommendations are given here
o The parameters for the SAP VM are defined by Zero Admin templates From time to time new Zero Admin templates might be released which change important parameters for the SAP VM Thus you should check SAP Note 1248926 - AS Java VM Parameters for NetWeaver 71-based Products regularly and apply the changes accordingly
o The problem might be caused by too high parallelization when processing large messages This should be restricted to avoid overloading of the Java heap memory
1) In case the interfaces are using the ABAP Integration Server use the large message queue filters to restrict the parallelization of mapping calls from ABAP queues To do so set parameter EO_MSG_SIZE_LIMIT to eg 5000 to direct all large messages to dedicated XBTL or XBTM queues
2) To restrict the parallelization on the Java Messaging System you can use the large message queue mechanism described in chapter Large message queues on the Messaging System
o If it is already obvious that the memory of your J2EE Engine is getting short and nothing can be changed on the scenarios itself you have several options for scaling your PI landscape Especially for large PI installations with high message throughput or large messages SAP Note 1502676 - Scaling up large PI installations describes potential options
1) Increase the Java Heap of your server node If sufficient physical memory is available increase the default heap size of 2 GB to a higher value such as 3 or 4 GB Experience shows that the SAP VM can handle these heap sizes without major impact on performance Larger heap sizes can cause longer processing time of GCs which in turn can affect the PI application negatively Increasing the maximum heap size on the J2EE engine will automatically adapt the new area of the heap due to a dynamic configuration (in newer J2EE versions this will be per default set to 16 of the overall heap) After increasing the heap size monitor the duration of the GC execution
2) Add an additional server node to distribute the load over more processes SAP recommends that productive systems have at least 2 Java server nodes per instance Prerequisite is that your physical host has enough RAM and CPU To minimize the overhead for J2EE cluster communication it is in general recommended configuring larger server nodes (as described above) then a high number of server nodes
3) Add an additional application server consisting of a double stack Web Application Server (ABAP and J2EE Engine) to distribute the load to an additional hardware Find details on the scaling of PI with multiple instances in the Guide How To Scale up SAP NetWeaver Process Integration
4) Use a non-central Adapter Engine to separate large messages that cause the memory problem from business critical scenarios
662 Java System and Application Threads
A system or application thread is required for every task that the J2EE Engine executes Each of these
thread types are maintained using a thread pool If the pool of available threads is expired no more requests
can be processed It is therefore important that you have enough threads available at all times
SAP NETWEAVER 71 AND HIGHER PERFORMANCE CHECK GUIDE
81
o In general SAP recommends that you increase the system and application thread count for a PI system As described in SAP Note 937159 - XI Adapter Engine is stuck the application threads should be increased to 350 and the system threads to lsquo120rsquo for all J2EE server nodes
o There are two options for checking the thread usage
1) Wily Introscope
Wily Introscope provides a dashboard in the J2EE Overview section called J2EE CPU and Memory Detail that can also be used to monitor the thread usage on a PI engine Different views exist for Application and System Threads as shown in the screenshot below
2) NetWeaver Administrator (NWA)
The NWA also offers a monitor similar to the one available for the memory mentioned above This monitor can be found by navigating to Availability and Performance Management Java System Reports Choose Report System Health and looking at the windows shown in the screenshot below
Again in NetWeaver 73 and higher the monitor can be found at Availability and Performance
Management Resource Monitoring History Report An example for the Application Thread
Usage is shown below
SAP NETWEAVER 71 AND HIGHER PERFORMANCE CHECK GUIDE
82
Check if the ThreadPoolUsageRate is below 80 for both the application threads and the system threads Also check the maximum value by choosing a longer history in Wily Introscope
Has the thread usage increased over the last daysweeks
Is there one server node that shows a higher thread usage than others
3) SAP Management Console
The SAP Management Console is an essential tool to analyze different aspects of the J2EE engine It also offers a thread dump view similar to SM50 in ABAP showing the activity of all the threads of a given Java Application Server More information about the SAP MC can be found in Note 1014480 - SAP Management Console (SAP-MC) and the online help The SAP Management Console can be started as Java web-start application using httpltservergt5ltInstanc_numbergt13
Navigate to AS Java Threads and check for any threads in red status (gt20 secs running time) This indicates long running threads and you should check for the related thread stacks The example below shows a long running thread related to the PI directory You can see the user doing the request and can see that the thread is waiting for an HTTP response from the CPACache
SAP NETWEAVER 71 AND HIGHER PERFORMANCE CHECK GUIDE
83
If you are not sure what is causing the problem you should take multiple thread dumps (at least 3 every 30 seconds) for all server nodes This can be done in the Management Console navigating to AS Java Process Table
The Thread Dump Viewer tool (TDV) from Note 1020246 - Thread Dump Viewer for SAP Java Engine can be used to analyze the produced thread dumps (inside the results archive that can be downloaded to your local PC)
663 FCA Server Threads
An additional type of thread was introduced with SAP NetWeaver PI 71 that is responsible for HTTP traffic
FCA Server Threads The FCA Server Threads are responsible for receiving HTTP calls at the Java side
(after the Java dispatcher is no longer available) Also FCA Threads use a Thread Pool Fifteen FCA
Threads are configured by default but based on SAP Note 1375656 - SAP Netweaver PI System Parameters
we recommend that you increase it to 50 This can be done in the NWA by changing the parameter
FCAServerThreadCount of service HTTP Provider
FCA Server Threads are particularly crucial for synchronous message transfer and for HTTP-based
scenarios like WebServices or calls from the ABAP engine to the Adapter Engine If there is a long duration
of the HTTP call due to a slow backend system then the thread is blocked for the whole time and not
available to send other HTTP requests (other PI messages)
SAP NETWEAVER 71 AND HIGHER PERFORMANCE CHECK GUIDE
84
The configured FCAServerThreadCount represents the maximum number of threads working on a single
entry point An entry point in the PI sense could eg be the SOAP Adapter Servlet (share with all channels
as described in Tuning SOAP sender adapter)
o If response times for specific entry point are high (gt15 seconds) additional FCA threads will be spawned to be available for parallel HTTP based incoming requests using different entry points only This ensures that in case of problems with one application not all other applications will be blocked constantly
o An overall maximum of 20xFCAServerThreadCount may be used in the J2EE engine
There is currently no standard monitor available for FCA Threads except the thread view in the SAP
Management Console A new dashboard will be integrated into Wily Introscope soon and will also show the
FCA Server Threads that are in use
664 Switch Off VMC
The Virtual Machine Container (VMC) is enabled by default for an ABAP WebAS 71 Since PI does not use
VMC at runtime the VMC can be switched off on a PI system to avoid resource overhead This
recommendation is based on SAP Note 1375656 - SAP NetWeaver PI System Parameters
You can activate the VM Container setting the profile parameters vmcjenable = off which can be changed
using profile maintenance (transaction RZ10) Once you have made the change you need to restart the SAP
Web Application Server instance
SAP NETWEAVER 71 AND HIGHER PERFORMANCE CHECK GUIDE
85
7 ABAP PROXY SYSTEM TUNING
Every ABAP WebAS gt 620 includes an ABAP Proxy runtime This enables a SAP system to talk native PI
protocol (XI-SOAP) so that no costly transformation is necessary
In general ABAP proxy is just a framework that is triggered by (sender) or triggers (receiver) application-
specific coding It is not possible to give a general tuning recommendation because the applications and use
cases of ABAP proxy can differ so greatly
In this section we would like to highlight the system tuning options that can be applied to improve the
throughput at the ABAP Proxy backend side
In general you can increase the throughput of EO interfaces by changing the queue parallelization Two
different parameters exist to change the number of qRFC queues on the ABAP Proxy backend As in PI
ABAP Proxy processing is based on qRFC inbound queues (SMQ2) with specific names A sender proxy
uses XBTS queues (10 parallel by default) and a receiver proxy XBTR (20 parallel by default)
The sender proxy only forwards the message to PI by executing an HTTP call that must not take too much
time and which is not resource-critical On the other hand the receiver proxy executes the inbound
processing of the messages based on the application context (and which can be very time-consuming) It is
therefore more likely to face a backlog situation in the Receiver Proxy queues In the screenshot below you
can see the performance header of a receiver proxy message that required around 20 minutes in the
PLSRV_CALL_INBOUND_PROXY (which corresponds to the posting of the application data)
Of course such a long-running message will block the queue and all messages behind it will face a higher
latency Since this step is purely application-related it is only possible to perform tuning at the application
side
The number of sender and receiver ABAP Proxy queues can be changed in transaction SXMB_ADM on the
proxy backend with parameter EO_INBOUND_PARALLEL and sub parameter SENDER (XBTS queues)
and RECEIVER (XBTR queues) The prerequisite for increasing the number of queues is that there are
enough qRFC resources are available at the proxy system (as discussed in section qRFC Resources
(SARFC))
Also as described in chapter Message Prioritization on the ABAP Stack prioritization can be configured in
the ABAP Proxy system This can be used to separate runtime-critical interfaces from interfaces with a long
application processing (as shown above)
SAP NETWEAVER 71 AND HIGHER PERFORMANCE CHECK GUIDE
86
71 New enhancements in Proxy queuing
The queuing mechanism was enhanced for sender and receiver proxy systems with Note 1802294
(Receiver) and Note 1831889 (Sender) After implementing these two Notes interface specific queues will be
used and tuning of these queues on interface level will be possible This can be very helpful in cases where
one receiver interface shows very long posting time in the application coding that cannot be further
improved Other messages for more business critical interfaces will eventually be blocked by this message
due to the common usage of the XBTR queues On the sender side of a Proxy system the processing of the
queues call the central PI hub In general the processing time there should be fast But in case of high
volume interfaces you might want to slow down less business critical interfaces to avoid overloading of your
central PI hub The prioritization mechanisms available prior to these Notes did not provide such options
This is achieved by adding an interface specific identifier to the queue-name In the screenshot below you
see a comparison in the queue names for the old framework (red) and the new framework (blue)
For the sender queues the following new parameters are introduced
o Parameter EO_QUEUE_PREFIX_INTERFACE with sub parameter SENDERSENDER_BACK Should be set to lsquo1rsquo to active interface specific queue This is a global switch affecting all sender interfaces
o Parameter EO_INBOUND_PARALLEL_SENDER without sub parameter determines the general number of queues per interface
Using a sub parameter ltsender IDgt the parallelization of individual interfaces can be changed This can eg be used to assign more queues for high priority interfaces
Wildcards can be used in the ltsender IDgt to group interfaces sharing eg the same service name or the same interface name but different services
For the receiver queues the following new parameters are introduced
o Parameter EO_QUEUE_PREFIX_INTERFACE with sub parameter RECEIVER Should be set to lsquo1rsquo to active interface specific queue This is a global switch affecting all receiver interfaces
o Parameter EO_INBOUND_PARALLEL_RECEIVER without sub parameter determines the general number of queues per interface
Using a sub parameter ltsender IDgt the parallelization of individual interfaces can be changed This can eg be used to assign more queues for high priority interfaces
Wildcards can be used in the ltsender IDgt to group interfaces sharing eg the same service name or the same interface name but different services
This new feature also replaces the currently existing prioritization since it is in general more flexible and
powerful We therefore recommend adjusting existing prioritization rules using the new queuing possibilities
described above
SAP NETWEAVER 71 AND HIGHER PERFORMANCE CHECK GUIDE
87
8 MESSAGE SIZE AS SOURCE OF PERFORMANCE PROBLEMS
The message size directly influences the performance of an interface The size of a PI message depends on
two elements The PI header elements with a rather static size and the payload which can vary greatly
between interfaces or over time for one interface (for example larger messages during year-end closing)
The size of the PI message header can cause a major overhead for small messages of only a few kB and
can cause a decrease in the overall throughput of the interface Furthermore many system operations (like
context switches or database operations) are necessary for only a small payload The larger the message
payload the smaller the overhead due to the PI message header On the other hand large messages
require a lot of memory on the Java stack which can cause heavy memory usage on ABAP or excessive
garbage collection activity (see section Java Memory) that will also reduce the overall system performance
Very large messages can even crash the PI system by causing an Out-of-Memory exception for example
You therefore have to find a compromise for the PI message size
Below you see throughput measurements performed by SAP In general the best throughput was identified
for messages sizes of 1 to 5 MB
The message size in these measurements corresponds to the XML message size processed in PI and not
the size of the file or IDoc being sent to PI You can use the Runtime Header of the ABAP stack to check the
message size Below you can see an example of a very small message While the MessageSizePayload
field describes the size of the payload in bytes (here 433 bytes) the MessageSizeTotal describes the total
message size (header + payload) In the example this is around 14 KB demonstrating the overhead by the PI
header for small messages The next two lines describe the payload size before and after the mapping In
the example below the mapping reduces the payload size The last two lines determine the size of the
response message that is sent back to PI before and after the response mapping for synchronous
messages
SAP NETWEAVER 71 AND HIGHER PERFORMANCE CHECK GUIDE
88
Based on the above observations we highly recommend that you use a reasonable message size for your
interfaces During the design and implementation of the interface we therefore recommend using a message
size of 1 to 5 MB if possible Messages can be collected at the sender side or by using IDoc packaging as
described in Tuning the IDoc Adapter to achieve this In case of large messages a split has to be performed
by changing the sender processing or by using the split functions available in the structure conversion of the
File adapter
81 Large message queues on PI ABAP
In case the interfaces are using the ABAP Integration Server use the large message queue filters to restrict
the parallelization of mapping calls from ABAP queues To do so set the parameter EO_MSG_SIZE_LIMIT of
category TUNING to eg 5000 to direct all messages larger 5 MB to dedicated XBTL or XBTM queues
The value of the parameter depends on the number of large messages and the acceptable delay that might
be caused due to a backlog in the large message queue
To reduce the backlog the number of large message queues can also be configured via parameter
EO_MSG_SIZE_LIMIT_PARALLEL of category TUNING The default value is 1 so that all messages larger
than the defined threshold will be processed in one single queue Naturally the parallelization should not be
set higher than 2 or 3 to avoid overloading of the Java memory due to parallel large message requests
82 Large message queues on PI Adapter Engine
SAP Note 1727870 - Handling of large messages in the Messaging System introduces large message
queues (virtual queues no adapter behind) also for the Java based Adapter Engine Contrary to the
Integration Engine it is not the size of a single large message only that determines the parallelization
Instead the sum of the size of the large messages across all adapters on a given Java server node is limited
to avoid overloading the Java heap This is based on so called permits that define a threshold of a message
size Each message larger than the permit threshold is considered as large message The number of permits
can be configured as well to determine the degree of parallelization Per default the permit size is 10 MB and
10 permits are available This means that large messages will be processed in parallel if 100 MB are not
exceeded
To show this let us look at an example using the default values Let us assume we have 5 messages waiting
to be processed (status ldquoTo Be Deliveredrdquo on one server node Message A has 5 MB message B has 10
MB message C has 50 MB message D 150 MB message E 50 MB and message F 40 MB Message A is
not considered large since the size is smaller than the permit size and is not considered large and can be
immediately processed Message B requires 1 permit message C requires 5 Since enough permits are
available processing will start (status DLNG) Hence for message D all available 10 permits would be
required Since the permits are currently not available it cannot be scheduled If blacklisting is enabled the
message will be put to error status (NDLV) since it exceed the maximum number of defined permits In that
case the message would have to be restarted manually Message E requires 5 permits and can also not be
scheduled But since there are 4 permits left message F is put to DLNG Due to the smaller size message B
and message F finish first releasing 5 permits This is sufficient to schedule message E which requires 5
SAP NETWEAVER 71 AND HIGHER PERFORMANCE CHECK GUIDE
89
permits Only after message E and C have finished message D can be scheduled consuming all available
permits
The example above shows a potential delay a large message could face due to the waiting time for the
permits But the assumption is that large messages are not time critical and therefore additional delay is less
critical than potential overload of the system
The large message queue handling is based on the Messaging System queues This means that restricting
the parallelization is only possible after the initial persistence of the message in the Messaging System
queues Per default this is only done after the Receiver Determination Therefore if you have a very high
parallel load of incoming large requests this feature will not help Instead you would have to restrict the size
of incoming requests on the sender channel (eg file size limit in the file adapter or the
icmHTTPmax_request_size_KB limit in the ICM for incoming HTTP requests) If you have very complex
extended receiver determination or complex content based routing it might be useful to configure staging in
the first processing step of the Messaging System (BI=3) as described in Logging Staging on the AAE (PI
73 and higher)
The number of permits consumed can be monitored in PIMON Monitoring Adapter Engine Status The
number of threads corresponds to the number of consumed permits
In newer Wily versions there is also a dashboard showing the number of consumed permits as well The
Worker Threads on the right hand side of the screenshot correspond to the permits
SAP NETWEAVER 71 AND HIGHER PERFORMANCE CHECK GUIDE
90
9 GENERAL HARDWARE BOTTLENECK
During all tuning actions discussed in the previous chapters you must keep in mind that the limitation of all
activities is set by the underlying CPU and memory capacity The physical server and its hardware have to
provide resources for three PI runtimes the Adapter Engine the Integration Engine and the Business
Process Engine Tuning one of the engines for high throughput leaves fewer resources for the remaining
engines Thus the hardware capacity has to be monitored closely
91 Monitoring CPU Capacity
When monitoring the CPU capacity it is not enough to use the average that is displayed in the ldquoPrevious
Hoursrdquo section of transaction ST06 Instead you should start your interface and monitor the CPU while it is
running The best procedure is to use operating system tools to monitor the CPU usage (particularly if using
hardware virtualization)
The SMD Host Agent also reports CPU data to Wily Introscope which can be viewed using dashboards as
shown below This example shows two systems where one is facing a temporary CPU overload and the
other a permanent one
Also the NWA offers a view on the CPU activity from NetWeaver 73 on via Availability and Performance
Management Resource Monitoring History Reports There you can build your own report based on the
ldquoCPU utilizationrdquo data as shown in the screenshot
SAP NETWEAVER 71 AND HIGHER PERFORMANCE CHECK GUIDE
91
You can also monitor the CPU usage in ST06 as described below
Procedure
Log on to your Integration Server and call transaction ST06 Take a look at the snapshot that is provided on
the entry screen than navigate to ldquoDetailed Analysis Menurdquo
Snapshot view Is the idle time (upper left corner) at a reasonable value at all times for example around 10 or higher
Snapshot view The load average is a good indicator of the dimension of the bottleneck It describes the number of processes for each CPU that are in a wait queue before they are assigned to a free CPU As long as the average remains at one process for each available CPU the CPU resources are sufficient Once there is an average of around three processes for each available CPU there is a bottleneck at the CPU resources In connection with a high CPU usage a high value here can indicate that too many processes are active on the server In connection with a low CPU usage a high value here can indicate that the main memory is too small The processes are then waiting due to excessive paging
Detailed Analysis View TOP CPU Which thread uses up the highest amount of CPU Is it the J2EE Engine the work processes or the database
o There are different follow-up actions to be taken depending on the findings of the second check The first option is of course to simply increase the hardware This should be accompanied by a thorough sizing (for which SAP provides the Quicksizer in the Service Marketplace httpservicesapcomquicksizer )
o The second option is to identify the CPU-consuming threads and to think about a reduction of the load in this component For example if the J2EE Engine is the largest consumer then it is worth re-evaluating the number of concurrent mapping threads andor consumer queues as described in the previous chapters
o SAP Note 742395 - Analyzing High CPU Usage by the J2EE Engine provides a good entry point if the J2EE Engine consumes too much CPU
o If it is the work processes that consume a lot of CPU use transaction ST03N to figure out if it is the Integration Server or the Business Process Engine You can do that by looking at the CPU usage per user BPE uses the user WF-BATCH while the Integration Server uses the last user who activated a qRFC queue (typically PIAFUSER or PIAPPLUSER) Use the previous chapter to restrict these activities
92 Monitoring Memory and Paging Activity
As stated above paging is very critical for the Java stack since it influence the Java GC behavior directly
Therefore paging should be avoided in every case for a Java-based system
The OS tools are the most reliable for monitoring the paging activity on your system Transaction ST06 can
also be used to perform a snapshot analysis Take a look at the snapshot that is provided on the entry
screen
Snapshot view Is there enough physical memory available
Snapshot view Is there considerable paging Paging can have a negative influence on your J2EE Engine If it does this can be seen in long GC times as described in Chapter 661
93 Monitoring the Database
Monitoring database performance is a rather complex task and requires information to be gathered from a
variety of sources Only a basic set of indicators is given for the purpose of this guide A more detailed
SAP NETWEAVER 71 AND HIGHER PERFORMANCE CHECK GUIDE
92
analysis is required if these indicators point to a major performance problem in the database If assistance is
needed open a support message under the component BC-DB-ORA (or MSS SDB DB6 respectively)
931 Generic J2EE database monitoring in NWA
The next sections of this chapter will be mainly based on ABAP transactions to do a detailed analysis of the
database performanceThe NWA however offers possibilities to monitor the database performance for the
Java based tables This is especially helpful for Java only AEXPO or Non-Central AAEs In the NWA you
can use the ldquoOpen SQL Monitorrdquo in the Troubleshooting section of NWA The official documentation can be
found in the Online Help Monitoring DB via DBACOCKPIT transaction (ABAP based) is possible also for the
Java-only systems from SAP Solution Manager (DBA Cockpit must be configured in the Managed System
Setup)
It will be too much to outline all the available functionalities here Instead only a few key capabilities will be
demonstrated If you want to eg see the number of select update or insert statements in your system you
can use the ldquoTable Statistics Monitorrdquo It clearly shows you which tables in your system are accessed the
most frequently
To see the processing time of the different statements on your system you can use the ldquoOpen SQL statisticsrdquo
monitor There you can see the count the total average and max processing time of the individual SQL
SAP NETWEAVER 71 AND HIGHER PERFORMANCE CHECK GUIDE
93
statements and can therefore identify the expensive statements on your system
Per default the recorded period is always from the last restart of the system If you would like to just look at
the statistics for a specific time period (eg during a test) you have the option of resetting the statistics in the
individual monitor prior to the test
932 Monitoring Database (Oracle)
Procedure
Log on to your Integration Server and call transaction ST04
SAP NETWEAVER 71 AND HIGHER PERFORMANCE CHECK GUIDE
94
Many of the numbers in the screenshot above depend on each other The following checklist names a few
key performance figures of your Oracle database
The data buffer quality for instance is based on the ratio of physical reads versus the total number of reads The lower the ratio the better the buffer quality The data buffer quality should be better than 94 the statistics should be based on 15 million total reads This number of reads ensures that the database is in an equilibrated state
Ratio of user and recursive calls A good performance is indicated by ratio values greater than 2 Otherwise the number of recursive calls compared to the number of user calls is too high Over time this ratio always declines because more and more SQL statements get parsed in the meantime
Number of reads for each user call If this value exceeds 30 blocks for each user call this indicates an expensive SQL statement
Check the value of TimeUser call Values larger than 15 ms often indicate an optimization issue
Compare busy wait time versus CPU time A ratio of 6040 generally indicates a well-tuned system Significantly higher values (for example 8020) indicate room for improvement
The DD-cache quality should be better than 80
933 Monitoring Database (MS SQL)
Procedure
To display the most important performance parameters of the database call Transaction ST04 or choose
Tools Administration Monitor Performance Database Activity An analysis is only meaningful if
the database has been running for several hours with a typical workload To ensure a significant database
SAP NETWEAVER 71 AND HIGHER PERFORMANCE CHECK GUIDE
95
workload we recommend a minimum of 500 CPU busy seconds Note The default values displayed in
section Server Engine are relative values To display the absolute values press button Absolute values
Check the values in (1)
The cache hit ratio (2) which is the main performance indicator for the data cache shows the
average percentage of requested data pages found in the cache This is the average value since startup The value should always be above 98 (even during heavy workload) If it is significantly below 98 the data cache could be too small To check the history of these values use Transaction ST04 and choose Detail Analysis Menu Performance Database A snapshot is collected every 2 hours
Memory setting (5) shows the memory allocation strategy used and shows the following
FIXED SQL Server has a constant amount of memory allocated which is set by SQL Server configuration parameters min server memory (MB) = max server memory (MB)
RANGE SQL Server dynamically allocates memory between min server memory (MB) lt gt max server memory (MB)
AUTO SQL Server dynamically allocates memory between 4 MB and 2 PB which is set by min server memory (MB) = 0 and max server memory (MB) = 2147483647
FIXED-AWE SQL Server has a constant amount of memory allocated which is set by min server memory (MB) = max server memory (MB) In addition the address windowing extension functionality of Windows 2000 is enabled
934 Monitoring Database (DB2)
Procedure
To get an overview of the overall buffer pool usage catalog and package cache information go to
transaction ST04 choose Performance Database section Buffer Pool (or section Cache respectively)
1 1
1 2
1 3
1 5
1 4
gt 6h
gt 98
SAP NETWEAVER 71 AND HIGHER PERFORMANCE CHECK GUIDE
96
Buffer Pools Number Number of buffer pools configured in this system
Buffer Pools Total Size The total size of all configured buffer pools in KB If more than one buffer pool is used choose Performance Buffer Pools to get the size and buffer quality for every single buffer pool
Overall buffer quality This represents the ratio of physical reads to logical reads of all buffer pools
Data hit ratio In addition to overall buffer quality you can use the data hit ratio to monitor the database (data logical reads - data physical reads) (data logical reads) 100
Index hit ratio In addition to overall buffer quality you can use the index hit ratio to monitor the database (index logical reads - index physical reads) (index logical reads) 100
Data or Index logical reads The total number of read requests for data or index pages that went through the buffer pool
Data or Index physical reads The total number of read requests that required IO to place data or index pages in the buffer pool
Data synchronous reads or writes Read or write requests performed by db2agents
SAP NETWEAVER 71 AND HIGHER PERFORMANCE CHECK GUIDE
97
Catalog cache size Maximum size of the catalog cache that is used to maintain the most frequently accessed sections of the catalog
Catalog cache quality Ratio of catalog entries (inserts) to reused catalog entries (lookups)
Catalog cache overflows Number of times that an insert in the catalog cache failed because the catalog cache was full (increase catalog cache size)
Package cache size Maximum size of the package cache that is used to maintain the most frequently accessed sections of the package
Package cache quality Ratio of package entries (inserts) to reused package entries (lookups)
Package cache overflows Number of times that an insert in the package cache failed because the package cache was full (increase package cache size)
935 Monitoring Database (MaxDB SAP DB)
Procedure
As with the other database types call transaction ST04 to display the most important performance
parameters
SAP NETWEAVER 71 AND HIGHER PERFORMANCE CHECK GUIDE
98
With the Database Performance Monitor (transaction ST04) and its submonitors the CCMS in the SAP R3
System allows you to view in the SAP R3 System all of the information that can be used to identify
bottleneck situations
The SQL Statements section provides information about the number of SQL statements executed and related sizes
The IO Activity section lists physical and logical read and write accesses to the database
The Lock Activity section (in transaction ST04) allows you to identify possible bottlenecks in the assignment of locks by the database
The Logging Activity section combines information about the log area
The Scan and sort activity section can be helpful in identifying that suitable indexes are missing
The Cache Activity section provides information about the usage of the caches and the associated hit rates
o The data cache Hit rate should be 99 in a balanced system If this is not the case you need to check if the low hit rate is due to the size of the data cache being too small or due to an unsuitable SQL statement If necessary you can increase the data cache by increasing the MaxDB parameter Data_Cache_Size (lower than 74) or Cache_Size (74 or higher)
o The catalog cache hit rate should be 85 in a balanced system It is not a cause for concern if the catalog hit rate is temporarily lower since accesses to the system tables and an active command monitor can temporarily impair the hit rate If the catalog cache is busy the pages are paged out in the data cache rather than on the hard disk
o Log entries are not written directly to the log volume but first into a buffer (LOG_IO_QUEUE) so as to be able to write several log entries together asynchronously with one IO on the hard disk Only once a LOG_IO_QUEUE page is full is it written to the hard disk However there are situations in which you need to write LOG entries from the LOG_QUEUE onto the hard disk as quickly as possible for example if transactions are completed (COMMITROLLBACK) The transactions wait until the log writer reports the OK informing them that the log entry is on the hard disk Firstly this means that is important to use the quickest possible hard disks for the log volume(s) and secondly you must ensure that no LOG_QUEUE_OVERFLOWS occur in production operation If the LOG_IO_QUEUE is full then all transactions that want to write LOG entries must wait until free memory becomes available again in the LOG_IO_QUEUE At LOG_QUEUE_OVERFOLWS (Transaction DB50 -gt Current Status -gt Activities Overview -gt LOG_IO_QUEUE Overflow) you need to increase the LOG_IO_QUEUE parameter
SAP NETWEAVER 71 AND HIGHER PERFORMANCE CHECK GUIDE
99
o In accordance with Note 819324 - FAQ MaxDB SQL optimization check which SQL statements are responsible for the most disk accesses and whether they can be optimized You should also optimize SQL statements that have a poor runtime and poor selectivity
Bottleneck Analysis
The Bottleneck Analysis function is available in transaction ST04 under the Problem Analyzes
Performance Database Analyzer Bottlenecks You can use this function to activate the corresponding
analysis tool dbanalyzer
The dbanalyzer then collects important performance data every 15 minutes and evaluates this for possible
bottlenecks
The result of the bottleneck analysis is output in text format to provide a quick overview of possible causes of
performance problems For a more detailed description of the bottleneck messages see the online
documentation (httphelpsapcom) in the SAP Web Application Server area and search for SAP DB
bottleneck analysis messages
The dbanalyzer tool can also be started at operating system level It logs its analysis results in files with date
stamps in the subdirectory ltrundirectorygtanalyzer (you can find the actual directory by double-clicking on
lsquoPropertiesrsquo in DB50) of the relevant database instance
94 Monitoring Database Tables
Some of the tables of SAP PI grow very quickly and can cause severe performance problems if archiving or
deletion does not take place frequently For troubleshooting see SAP Note 872388 ndash Troubleshooting
Archiving and Deletion in PI
Procedure
Log on to your Integration Server and call transaction SE16 Enter the table names as listed below and execute In the following screen simply press the button ldquoNumber of Entriesrdquo The most important tables are SXMSPMAST (cleaned up by XML message archivingdeletion)
If you use the switch procedure you have to check SXMSPMAST2 as well
SXMSCLUR SXMSCLUP (cleaned up by XML message archivingdeletion)
If you use the switch procedure you have to check SXMSPCLUR2 and SXMSCLUP2 as well
SAP NETWEAVER 71 AND HIGHER PERFORMANCE CHECK GUIDE
100
SXMSPHIST (cleaned up by the deletion of history entries)
If you use the switch procedure you have to check SXMSPHIST2 as well
SXMSPFRAWH and SXMSPFRAWD (cleaned up by the performance jobs see SAP Note 820622 ndash Standard Jobs for XI Performance Monitoring)
SWFRXI (cleaned up by specific jobs see SAP Note 874708 - BPE HT Deleting Message Persistence Data in SWFRXI)
SWWWIHEAD (cleaned up by work item archivingdeletion)
Use an appropriate database tool for example SQLPLUS for Oracle for the database tables of the J2EE schema Main tables that could be affected of growth
PI Message tables BC_MSG and BC_MSG_AUDIT (when audit log persistence is enabled)
PI message logging information when stagingloging is used BC_MSG_LOG_VERSION
XI IDoc tables (if IDoc persistence is activated) XI_IDOC_IN_MSG and XI_IDCO_OUT_MSG
Check for all tables if the number of entries is reasonably small or remains roughly constant over a period of time If that is not the case check your archivingdeletion setup
SAP NETWEAVER 71 AND HIGHER PERFORMANCE CHECK GUIDE
101
10 TRACES LOGS AND MONITORING DECREASING PERFORMANCE
101 Integration Engine
There are three important locations for the configuration of tracing logging in the Integration Engine The
pipeline settings of PI itself the Internet Communication Manager (ICM) and the gateway All three are
heavily involved in message processing and therefore their tracing or logging settings can have an impact on
performance On top of this you might have changed the SM59 RFC destinations and have switched on the
trace in order to analyze a problem If so then this needs to be reset as well
Procedure
Start transaction SXMB_ADM and navigate to Integration Engine Configuration Specific Configuration and search for the following entries
Category Parameter Subparameter Current Value Default
RUNTIME TRACE_LEVEL ltnonegt ltyour valuegt 1
RUNTIME LOGGING ltnonegt ltyour valuegt 0
RUNTIME LOGGING_SYNC ltnonegt ltyour valuegt 0
Set the above parameters back to the default value which is the recommended value by SAP
Start transaction SMICM and check the value of the Trace Level that is displayed in the overview
(third line) Set the trace level to lsquo1rsquo if not already the case You can do so by navigating to Goto Trace Level Set
Start transaction SMGW navigate to Goto Parameters Display and check the parameter Trace Level Set the trace level to lsquo1rsquo if not already the case You can do so by navigating to Goto Trace Gateway Reduce Level (or Increase Level respectively)
Start transaction SM59 and search the following RFC destination for the flag ldquoTracerdquo on the tab Special Options and remove the Flag ldquoTracerdquo if it has been set
AI_RUNTIME_JCOSERVER
AI_DIRECTORY_JCOSERVER
LCRSAPRFC
SAPSLDAPI It is possible that other RFC destinations are used for sending out IDocs and similar
SAP NETWEAVER 71 AND HIGHER PERFORMANCE CHECK GUIDE
102
102 Business Process Engine
You only have to check the Event Trace in the Business Process Engine
Procedure
Call transaction SWELS and check if the Event Trace is switched on The recommended setting is lsquooffrsquo (as shown in the screenshot below)
103 Adapter Framework
Since the Adapter Framework runs on the J2EE Engine the tracing and logging can be conveniently
checked and controlled using NetWeaver Administrator To improve the performance SAP recommends that
you set all trace levels to default Higher trace levels are only acceptable in productive usage during problem
analysis Below you will find a description on how to set the default trace level for all locations at once It is of
possible to do it for every location separately but this way you might forget to reset one of the locations
Procedure
Start the NetWeaver Administrator and navigate to Problem Management (or Troubleshooting in NW 73 and higher) Logs and Traces and choose Log Configuration In the Show drop down list box choose Tracing Locations Select the Root Location in the tree and press the button Default Configuration This will set the default configuration for all locations
Start the NetWeaver Administrator and navigate to Troubleshooting Logviewer (direct link nwalinks) Open the View ldquoDeveloper Tracerdquo and check if you have very frequent reoccurring exceptions that fill up the trace Analyze the exception and check what is causing this (eg a wrong configuration of a Communication Channel causing repeated traces If you see very frequent errors for which you cannot find the root cause open a customer incident at SAP
SAP NETWEAVER 71 AND HIGHER PERFORMANCE CHECK GUIDE
103
An aggregated view of Java exceptions (by number date instance server node etc) are reported and available in SAP Solution Manager Root Cause Analysis Exception Analysis functionality
1031 Persistence of Audit Log information in PI 710 and higher
With SAP NetWeaver PI 71 the audit log is not persisted for successful messages in the database by default
to avoid performance overhead Therefore the audit log is only available in the cache for a limited period of
time (based on the overall message volume)
Audit log persistence can be activated temporarily for performance troubleshooting where audit log
information is required To do so use the NWA and change the parameter
ldquomessagingauditLogmemoryCacherdquo to false in service XPI Service Messaging System by setting the
parameter to false Details can be found in SAP Note 1314974 - PI 71 AF Messaging System audit log
persistence Only do so temporarily during the time of troubleshooting to avoid any performance problems
from the additional persistence
After implementing Note 1611347 - New data columns in Message Monitoring additional information like
message processing time in ms and server node is visible in the message monitor
SAP NETWEAVER 71 AND HIGHER PERFORMANCE CHECK GUIDE
104
11 ERRORS AS SOURCE OF PERFORMANCE PROBLEMS
If errors occur within messages or within technical components of the SAP Process Integration then this can
have a severe impact on the overall performance Thus to solve performance problems it is sometimes
necessary to analyze the log files of technical components and to search for messages with errors To
search for messages with errors use the PI Admin Check which is available using SAP Note 884865 - PIXI
Admin Check
Procedure
ICM (Internet Communication Manager)
Start transaction SMICM open the log file (Shift + F5 or GoTo Trace File Show All) and check for errors
Gateway
Start transaction SMGW open the Log File (CTRL + Shift + F10 or Goto Trace Gateway Display File) and check for errors
System Log
Start transaction SM21 choose an appropriate time interval and search the log entries for errors Repeat the procedure for remote systems if you are using dialog instances
ABAP Runtime Errors
Start transaction ST22 choose an appropriate time interval and search for PI-related dumps In general the number of ABAP dumps should be very small on a PI system and therefore all occurring dumps should be analyzed
Alerts CCMS
Start transaction RZ20 and search for recent alerts
Work Process and RFC trace
In the PI work directory check all files which begin with dev_rfc or dev_w for errors
J2EE Engine
In the PI work directory search for errors in file dev_server0out If you are using more than one J2EE server node check dev_serverltngtout as well
Applications running on the J2EE Engine
The traces for application-related errors are the defaulttrc files located in j2eeclusterserverltngtlog directory To monitor exceptions across multiple server nodes the best tool to use is the LogViewer service of the NWA This is available via Problem Management Logs and Traces and choose Log Viewer Search for exceptions in the area of the performance problem for example the PI Messaging system
SAP NETWEAVER 71 AND HIGHER PERFORMANCE CHECK GUIDE
105
APPENDIX A
A1 Wily Introscope Transaction Trace
As mentioned above the Wily Transaction trace can be used to trace expensive steps that were noticed
during the mapping or module processing The transaction trace will allow you to drill down further into Java
performance problems and to distinguish if it is a pure coding problem or caused by a look-up to a remote
system or a slow connection to the local database
The Wily Transaction trace can be used to trace all steps that exceed a specific duration on the Java stack If
a user is known (for example for SAP Enterprise Portal) the tracing can be restricted to a specific user In PI
if you encounter a module that lasts several seconds then you can restrict the tracing as shown below
Note Starting the Transaction Trace increases the data collection on the satellite system (PI) and is
therefore only recommended in productive environment for troubleshooting purposes
With the selection above the trace will run for 10 minutes (this is the maximum and it can be canceled earlier)
and will trace all steps exceeding 3 seconds for the agents of the PI system If such long-running steps are
found then a new window will be displayed listing these steps
In the screenshot below you can see the result in the Trace View The Trace View shows the elapsed time
from left to rightndash in the example below around 48 seconds From top to bottom we can see the call stack of
the thread In general we are interested in long-running threads on the bottom of the trace view A long-
running block at the bottom means that this is the lowest level coding that was instrumented and which is
consuming all the time
In the example below we see a mapping call that is performing many individual database statements ndash this
will become visible by highlighting the lowest level In such a case you have to review the coding of the
mapping to see if the high amount of database calls can be summarized in one call
SAP NETWEAVER 71 AND HIGHER PERFORMANCE CHECK GUIDE
106
Another case that is often seen is that a lookup using JDBC to a remote database or RFC to an ABAP
system takes a long time in the mapping or adapter module In such a case there will be one long block at
the bottom of the transaction trace that also gives you some details about the statement that was executed
A2 XPI inspector for troubleshooting and performance analysis
The XPI Inspector is an additional tool that provides enhanced logging and tracing capabilities with a main
focus on troubleshooting But the tool can also be used for troubleshooting of performance issues
General information about the tool can be found at Note 1514898 - XPI Inspector for troubleshooting PI The
tool can be called using the following URL on your system httphostjava-portxpi_inspector
To analyze performance problems typically the example ldquo51 ndash ldquoPerformance Problem)rdquo is used As a basic
measurement it allows you to take multiple thread dumps in specific time intervals These thread dumps can
be analyzed later by your administrators or SAP support to identify what is causing the problem The Thread
Dump Viewer tool (TDV) from Note 1020246 - Thread Dump Viewer for SAP Java Engine can be used to
analyze the produced thread dumps (inside the results archive that can be downloaded to your local PC)
SAP NETWEAVER 71 AND HIGHER PERFORMANCE CHECK GUIDE
107
In addition the tool allows you to do JVM profiling be either doing JVM Performance tracing or JVM Memory
Allocation tracing This can help to understand in detail which steps of the processing are taking a long time
As output the tool provides prf files that can be loaded into the JVM Profiler More information can be found
at httpwikiscnsapcomwikidisplayASJAVAJava+Profiling Please Note that these traces (especially the
memory profiling) will cause a high overhead on the J2EE engine and are therefore not recommended to be
used in production Instead it is advisable to reproduce the problem on your QA system and use the tool
there
Document Version 30 March 2014
wwwsapcom
copy 2014 SAP AG All rights reserved
SAP R3 SAP NetWeaver Duet PartnerEdge ByDesign SAP
BusinessObjects Explorer StreamWork SAP HANA and other SAP
products and services mentioned herein as well as their respective
logos are trademarks or registered trademarks of SAP AG in Germany
and other countries
Business Objects and the Business Objects logo BusinessObjects
Crystal Reports Crystal Decisions Web Intelligence Xcelsius and
other Business Objects products and services mentioned herein as
well as their respective logos are trademarks or registered trademarks
of Business Objects Software Ltd Business Objects is an SAP
company
Sybase and Adaptive Server iAnywhere Sybase 365 SQL
Anywhere and other Sybase products and services mentioned herein
as well as their respective logos are trademarks or registered
trademarks of Sybase Inc Sybase is an SAP company
Crossgate mgic EDDY B2B 360deg and B2B 360deg Services are
registered trademarks of Crossgate AG in Germany and other
countries Crossgate is an SAP company
All other product and service names mentioned are the trademarks of
their respective companies Data contained in this document serves
informational purposes only National product specifications may vary
These materials are subject to change without notice These materials
are provided by SAP AG and its affiliated companies (SAP Group)
for informational purposes only without representation or warranty of
any kind and SAP Group shall not be liable for errors or omissions
with respect to the materials The only warranties for SAP Group
products and services are those that are set forth in the express
warranty statements accompanying such products and services if
any Nothing herein should be construed as constituting an additional
warranty
wwwsapcom
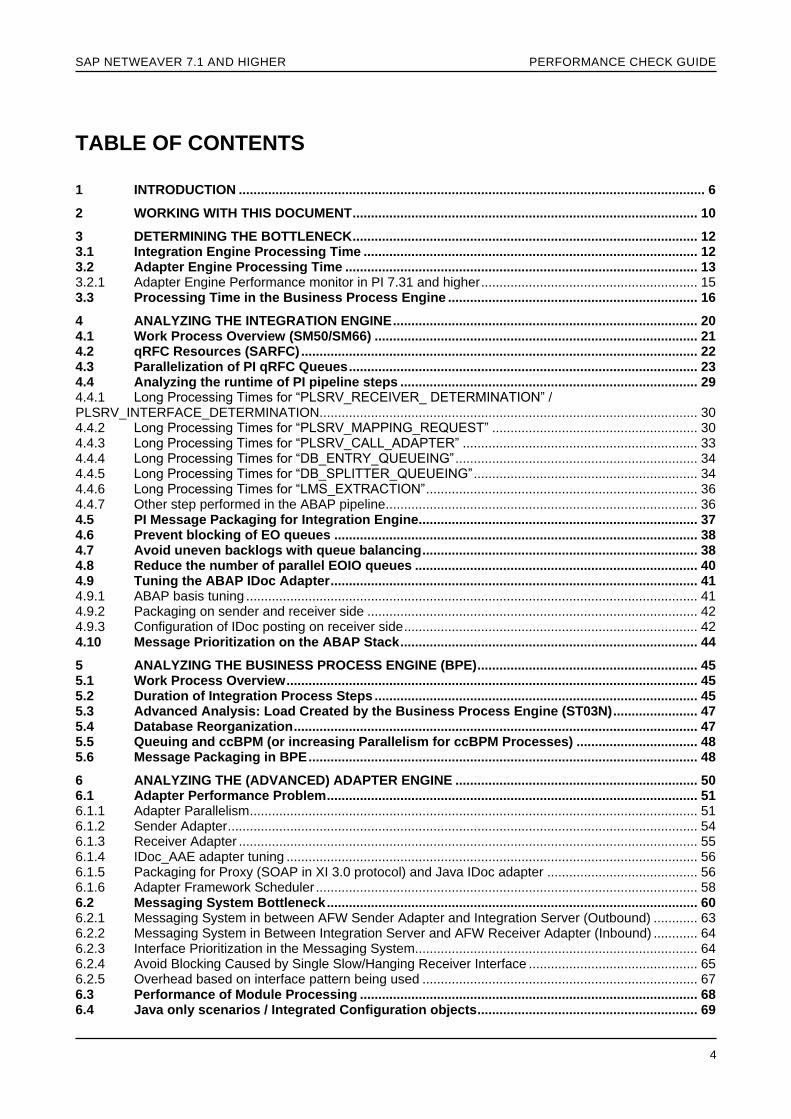
SAP NETWEAVER 71 AND HIGHER PERFORMANCE CHECK GUIDE
5
641 General performance gain when using Java only scenarios 69 642 Message Flow of Java only scenarios 71 643 Avoid blocking of Java only scenarios 73 644 Logging Staging on the AAE (PI 73 and higher) 73 65 J2EE HTTP load balancing 75 66 J2EE Engine Bottleneck 76 661 Java Memory 76 662 Java System and Application Threads 80 663 FCA Server Threads 83 664 Switch Off VMC 84
7 ABAP PROXY SYSTEM TUNING 85 71 New enhancements in Proxy queuing 86
8 MESSAGE SIZE AS SOURCE OF PERFORMANCE PROBLEMS 87 81 Large message queues on PI ABAP 88 82 Large message queues on PI Adapter Engine 88
9 GENERAL HARDWARE BOTTLENECK 90 91 Monitoring CPU Capacity 90 92 Monitoring Memory and Paging Activity 91 93 Monitoring the Database 91 931 Generic J2EE database monitoring in NWA 92 932 Monitoring Database (Oracle) 93 933 Monitoring Database (MS SQL) 94 934 Monitoring Database (DB2) 95 935 Monitoring Database (MaxDB SAP DB) 97 94 Monitoring Database Tables 99
10 TRACES LOGS AND MONITORING DECREASING PERFORMANCE 101 101 Integration Engine 101 102 Business Process Engine 102 103 Adapter Framework 102 1031 Persistence of Audit Log information in PI 710 and higher 103
11 ERRORS AS SOURCE OF PERFORMANCE PROBLEMS 104
APPENDIX A 105 A1 Wily Introscope Transaction Trace 105 A2 XPI inspector for troubleshooting and performance analysis 106
SAP NETWEAVER 71 AND HIGHER PERFORMANCE CHECK GUIDE
6
1 INTRODUCTION
SAP NetWeaver Process Integration (PI) consists of the following functional components Integration Builder
(including Enterprise Service Repository (ESR) Service Registry (SR) and Integration Directory) Integration
Server (including Integration Engine Business Process Engine and Adapter Engine) Runtime Workbench
(RWB) and System Landscape Directory (SLD) The SLD in contrast to the other components may not
necessarily be part of the PI system in your system landscape because it is used by several SAP NetWeaver
products (however it will be accessed by the PI system regularly) Additional components in your PI
landscape might be the Partner Connectivity Kit (PCK) a J2SE Adapter Engine one or several non-central
Advanced Adapter Engines or an Advanced Adapter Engine Extended An overview is given in the graphic
below The communication and accessibility of these components can be checked using the PI Readiness
Check (SAP Note 817920)
Processing at runtime is carried out by the Integration Server (IS) with the aid of the SLD The IS in this
graphic stands for the Web Application Server 70 or higher In the classic environment PI is installed as a
double stack an ABAP and a Java stack (J2EE Engine) The ABAP stack is responsible for pipeline
processing in the Integration Engine (Receiver Determination Interface Determination and so on) and the
processing of integration processes in the Business Process Engine Every message has to pass through
the ABAP stack The Java stack executes the mapping of messages (with the exception of ABAP mappings)
and hosts the Adapter Framework (AFW) The Adapter Framework contains all XI adapters except the plain
HTTP WSRM and IDoc adapters
SAP NETWEAVER 71 AND HIGHER PERFORMANCE CHECK GUIDE
7
With 71 the so called Advanced Adapter Engine (AAE) was introduced The Adapter Engine was enhanced
to provide additional routing and mapping call functionality so that it is possible to process messages locally
This means that a message that is handled by a sender and receiver adapter based on J2EE does not need
to be forwarded to the ABAP Integration Engine This saves a lot of internal communication reduces the
response time and significantly increases the overall throughput The deployment options and the message
flow for 71 based systems and higher are shown below Currently not all the functionalities available in the
PI ABAP stack are available on the AAE but each new PI release closes the gap further
In SAP PI 73 and higher the Adapter Engine Extended (AEX) was introduced In addition to the AAE the
Adapter Engine Extended also allows local configuration of the PI objects The AEX can therefore be seen
as a complete PI installation running on Java only From the runtime perspective no major differences can be
seen compared to the AAE and therefore no differentiation is made in this guide
SAP NETWEAVER 71 AND HIGHER PERFORMANCE CHECK GUIDE
8
Looking at the different involved components we get a first impression of where a performance problem
might be located In the Integration Engine itself in the Business Process Engine or in one of the Advanced
Adapter Engines (central non-central plain PCK) Of course a performance problem could also occur
anywhere in between for example in the network or around a firewall Note that there is a separation
between a performance issue ldquoin PIrdquo and a performance issue in any attached systems If viewed ldquothrough
the eyesrdquo of a message (that is from the point of view of the message flow) then the PI system technically
starts as soon as the message enters an adapter or (if HTTP communication is used) as soon as the
message enters the pipeline of the Integration Engine Any delay prior to this must be handled by the
sending system The PI system technically ends as soon as the message reaches the target system for
example a given receiver adapter (or in case of HTTP communication the pipeline of the Integration Server)
has received the success message of the receiver Any delay after this point in time must be analyzed in the
receiving system
There are generally two types of performance problems The first is a more general statement that the PI
system is slow and has a low performance level or does not reach the expected throughput The second is
typically connected to a specific interface failing to meet the business expectation with regard to the
processing time The layout of this check is based on the latter First you should try to determine the
component that is responsible for the long processing time or the component that needs the highest absolute
time for processing Once this has been clarified there is a set of transactions that will help you to analyze
the origin of the performance problem
If the recommendations given in this guide are not sufficient SAP can help you to optimize the service via
SAP consulting or SAP MaxAttention services SAP might also handle smaller problems restricted to a
specific interface if you describe your problem in a SAP customer incident Support offerings like ldquoSAP
Going Live Analysis (GA)rdquo and ldquoSAP Going Live Verification (GV)rdquo can be used to ensure that the main
system parameters are configured according to SAP best practice You can order any type of service using
SAP Service Marketplace or your local SAP contacts
If you have already worked with the PI Admin Check (SAP Note 884865) you will recognize some of the
transactions This is because SAP considers the regular checking of the performance to be an important
administrational task However this check tries to show the methodology to approach performance problems
to its reader Also it offers the most common reasons for performance problems and links to possible follow-
up actions but does not refer to any regular administrational transactions
SAP NETWEAVER 71 AND HIGHER PERFORMANCE CHECK GUIDE
9
Wily Introscope is a prerequisite for analyzing performance problems at the Java side It allows you to
monitor the resource usage of multiple J2EE server nodes and provides information about all the important
components on the Java stack like mapping runtime messaging system or module processor Furthermore
the data collected by Wily is stored for several days so it is still possible to analyze a performance problem at
a later date Wily Introscope is provided free-of-charge for SAP customers It is delivered as part of Solution
Manager Diagnostics but can also be installed separately For more information see
httpservicesapcomdiagnostics or SAP Note 797147
SAP NETWEAVER 71 AND HIGHER PERFORMANCE CHECK GUIDE
10
2 WORKING WITH THIS DOCUMENT
If you are experiencing performance problems on your Process Integration system start with Chapter 3
Determining the Bottleneck It helps you to determine the processing time for the different runtimes within PI
Integration Engine Business Process Engine and Adapter Engine or connected Proxy System Once you
have identified the area in which the bottleneck is most probably located continue with the relevant chapter
This is not always easy to do because a long processing time is not always an indication for a bottleneck It
can make sense to do this if a complicated step is involved (Business Process Engine) if an extensive
mapping is to be executed (IS) or if the payload is quite large (all runtimes) For this reason you need to
compare the value that you retrieve from Chapter 3 with values that you have received previously for
example The history data provided for the Java components by Wily Introscope is a big help If this is not
possible you will have to work with a hypothesis
Once the area of concern has been identified (or your first assumption leads you there) Chapters 4 5 6
and 7 will help you to analyze the Integration Engine the Business Process Engine the PI Adapter
Framework and the ABAP Proxy runtime
After (or preferably during) the analysis of the different process components it is important to keep in mind
that the bottlenecks you have observed could also be caused by other interfaces processing at the same
time It will lead you to slightly different conclusions and tuning measures You therefore have to distinguish
the following cases based on where the problem occurs
A with regard to the interface itself that is it occurs even if a single message of this interface is processed
B or with regard to the volume of this interface that is many messages of this interface are processed at the same time
C or with regard to the overall message volume processed on PI
This can be analyzed by repeating the procedure of Chapter 3 for A) a single message that is processed
while no other messages of this interface are processed and while no other interfaces are running Then
compare this value with B) the processing time for a typical amount of messages of this interface not simply
one message as before If the values of measurement A) and B) are similar repeat the procedure with C) a
typical volume of all interfaces that is during a representative timeframe on your productive PI system or
with the help of a tailored volume test
These three measurements ndash A) processing time of a single message B) processing time of a typical
amount of messages of a single interface and C) processing time of a typical amount of messages of all
interfaces ndash should enable you to distinguish between the three possible situations
o A specific interface has long processing steps that need to be identified and improved The tuning options are usually limited and a re-design of the interface might be required
o The mass processing of an interface leads to high processing times This situation typically calls for tuning measures
o The long processing time is a result of the overall load on the system This situation can be solved by tuning measures and by taking advantage of PI features for example to establish separation of interfaces If the bottleneck is hardware-related it could also require a re-sizing of the hardware that is used
SAP NETWEAVER 71 AND HIGHER PERFORMANCE CHECK GUIDE
11
Chapters 8 9 10 and 11 deal with more general reasons for bad performance such as heavy
tracinglogging error situations and general hardware problems They should be taken into account if the
reason for slow processing cannot be found easily or if situation C from above applies (long processing times
due to a high overall load)
Important
Chapter 9 provides the basic checks for the hardware of the PI server It should not only be used when
analyzing a hardware bottleneck due to a high overall load andor an insufficient sizing but should also be
used after every change made to the configuration of PI to ensure that the hardware is able to handle the
new situation This is important because a classical PI system uses three runtime engines (IS BPE AFW)
Tuning one engine for high throughput might have a direct impact on the others With every tuning action
applied you have to be aware of the consequences on the other runtimes or the available hardware
resources
SAP NETWEAVER 71 AND HIGHER PERFORMANCE CHECK GUIDE
12
3 DETERMINING THE BOTTLENECK
The total processing time in PI consists of the processing time in the Integration Server processing time in
the Business Process Engine (if ccBPM is used) as well as the processing time in the Adapter Framework (if
adapters except IDoc plain HTTP or ABAP proxies are used) In the subsequent chapters you will find a
detailed description of how to obtain these processing times
For reasons of completeness we will also have a look at the ABAP Proxy runtime and the available
performance evaluations
31 Integration Engine Processing Time
You can use an aggregated view of the performance (details about activation in Note 820622 - Standard jobs
for XI performance monitoring) data for the Integration Engine as shown below
Procedure
Log on to your Integration Engine and call transaction SXMB_IFR In the browser window follow the link to
the Runtime Workbench In there click ldquoPerformance Monitoringrdquo Change the display to ldquoDetailed Data
Aggregatedrdquo select lsquoISrsquo as the Data Source (or lsquoPMIrsquo if you have configured the Process Monitoring
Infrastructurersquo) and ldquoXIIntegrationServerltyour_hostgtrdquo as the component Then choose an appropriate time
interval for example the last day You have to enter the details of the specific interface you want to monitor
here
The interesting value is the ldquoProcessing Time [s]rdquo in the fifth column It is the sum of the processing time of the single steps in the Integration Server For now you are not interested in the single steps that are listed on the right side since you are still trying to find out the part of the PI system where the most time is lost Chapter 44 will work with the individual steps
SAP NETWEAVER 71 AND HIGHER PERFORMANCE CHECK GUIDE
13
If you do not know which interface is affected yet you first have to get an overview Instead of navigating to
Detailed Data Aggregated in the Runtime Workbench choose Overview Aggregated Use the button Display
Options and check the options for sender component receiver component sender interface and receiver
interface Check the processing times as described above
32 Adapter Engine Processing Time
Procedure
Log on to your Integration Server and call transaction SXMB_IFR In the browser window follow the link to
the Runtime Workbench In there click Message Monitoring choose Adapter Engine lthostgt from Database
from the drop down lists and press Display Enter your interface details and ldquoStartrdquo the selection Select one
message using the radio button and press Details
Calculate the difference between the start and end timestamp indicated on the screen
Do the above calculation for the outbound (AFW IS) as well as the inbound (IS AFW) messages
The audit log of successful message is no longer persisted in SAP NetWeaver PI 71 by default in order to minimize the load on the database The audit log has a high impact on the database load since it usually consists of many rows that are inserted individually in the database In newer releases therefore a cache was implemented that keeps the audit log information for a period of time only Thus no detailed information is available any longer from a historical point of view Instead you should use Wily Introscope for historical analyses of the performance of successful messages
The audit log can be persisted on the database to allow historical analysis of performance problems
on the Java stack To do so change the parameter ldquomessagingauditLogmemoryCacherdquo from
true to false for service ldquoXPI Service Messaging Systemrdquo using NetWeaver Administrator (NWA) as described in SAP Note 1314974 Note Only do this temporarily if you have identified the bottleneck on the AFW First try using Wily to determine the root cause of the problem
SAP NETWEAVER 71 AND HIGHER PERFORMANCE CHECK GUIDE
14
Due to above mentioned limitations Wily Introscope is the right tool for performance analysis of the Adapter Engine Wily persists the most important steps like queuing module processing and average response time in historical dashboards (aggregated data per intervals for all server nodes of a system or all systems with filters possible etc)
SAP NETWEAVER 71 AND HIGHER PERFORMANCE CHECK GUIDE
15
Especially for Java-Only runtime using Integrated Configuration Wily shows the complete processing time after the initial sender adapter steps (receiver determination mapping and time in the backend call) as can be seen in the Message Processing Time dashboard below
Using the ldquoShow Minimum and Maximumrdquo functionality deviations from the average processing time can be seen In the example below a message processing step takes up to 22 seconds The reason for this could either be a slow mapping or a delay in the call to the receiver system (in the example below Java IDoc adapter is used to transfer the data to ERP)
In case of high processing times in one of your steps further analysis might be required using thread dumps or the Java Profiler as outlined in the appendix section A2 XPI inspector for troubleshooting and performance analysis
321 Adapter Engine Performance monitor in PI 731 and higher
Starting from PI 731 SP4 there is a new performance monitor available for the Adapter Engine More
information on the activation of the performance monitor can be found at Note 1636215 ndash Performance
Monitoring for the Adapter Engine Similar to the ABAP monitor in the RWB the data is displayed in an
aggregated format On the PI start page use the link ldquoConfiguration and Monitoring Homerdquo Go to ldquoAdapter
Enginerdquo and select ldquoPerformance Monitorrdquo The data is persisted on an hourly basis for the last 24 hours and
on a daily basis for the last 7 days The data is further grouped on interface level and per Java server node
With the information provided you can therefore see the minimum maximum and average response time of
an individual interface on a specific Java server node All individual steps of the message processing like
time spent in the Messaging System queues or Adapter modules are listed In the example below you can
SAP NETWEAVER 71 AND HIGHER PERFORMANCE CHECK GUIDE
16
see that most of the time (5 seconds) is spent in a module called SimpleWaitModule This would be the entry
point for the further analysis
Starting with 731 SP10 (740 SP05) this data can be exported to excel in two ways Overview or Detailed (details in SAP Note 1886761)
33 Processing Time in the Business Process Engine
Procedure
Log on to your integration server and call transaction SXMB_MONI Adjust your selection in a way that you
select one or more messages of the respective interface Once the messages are listed navigate to the
Outbound column (or Inbound if your integration process is the sender) and click on PE Alternatively you
can select the radio button for ldquoProcess Viewrdquo on the entranceselection screen of SXMB_MONI
To judge the performance of an integration process it is essential to understand the steps that are executed A long-running integration process in itself is not critical because it can wait for a trigger event or can include a synchronous call to a backend Therefore it is important to understand the steps that are included before analyzing an individual workflow log For example the screenshot below shows a long waiting time after the mapping This is perhaps due to an integrated wait step
Calculate the time difference between the first and the last entry Note that this time for the workflow does not include the duration of RFC calls for example To see this processing time navigate to the ldquoList with Technical Detailsrdquo (second button from the left on the screenshot below or shift + F9) Repeat this step for several messages to get an overview about the most time consuming steps
Please Note that the processing time mentioned above does not include the waiting time of the messages in the ccBPM queues Therefore it is essential to monitor a queue backlog in ccBPM queues as discussed in section ldquoQueuing and ccBPM (or increasing Parallelism for ccBPM Processes)rdquo
SAP NETWEAVER 71 AND HIGHER PERFORMANCE CHECK GUIDE
17
Via transaction SWI2_DURA you can display an aggregated performance overview across all ccBPM
processes running on your PI system In the initial screen you have to choose ldquo(Sub-) Workflow and the time
range you would like to look at
SAP NETWEAVER 71 AND HIGHER PERFORMANCE CHECK GUIDE
18
The results here allow you to compare the average performance of a process It shows you the processing
time based on barriers The 50 barrier means that 50 of the messages were processed faster than the
value specified Furthermore you also see a comparison of the processing time to eg the day before By
adjusting the selection criteria of the transaction you can therefore get a good overview about the normal
processing time of the Integration process and can judge if there is a general performance problem or just a
temporary one
The number of process instances per integration process can be easily checked via transaction
SWI2_FREQ The data shown allows you to check the volume of the Integration Processes and allow you to
judge if your performance problem is caused by an increase of volume which could cause a higher latency in
the ccBPM queues
New in PI 73 and higher
Starting from PI 73 a new monitoring for ccBPM processes is available This monitor can be started from
transaction SXMB_MONI_BPE Integration Process Monitoring (also available in ldquoConfiguration and
Monitoring Homerdquo on PI start page) This is new browser based view that allows a simplified and aggregated
view on the PI Integration Processes
On the initial screen you get an overview about all the Integration Processes executed in the selected time
interval Therefore you can immediately see the volume of each Integration Process
From there you can navigate to the Integration process facing the performance issues and look at the
individual process instances and the start and end time Furthermore there is a direct entry point to see the
PI messages that are assigned to this process
SAP NETWEAVER 71 AND HIGHER PERFORMANCE CHECK GUIDE
19
Choosing one special process instance ID you will see the time spend in each individual processing step
within the process In the example below you can see that most of the time is spend in the Wait Step
SAP NETWEAVER 71 AND HIGHER PERFORMANCE CHECK GUIDE
20
4 ANALYZING THE INTEGRATION ENGINE
If chapter Determining the Bottleneck has shown that the bottleneck is clearly in the Integration Engine there
are several transactions that can help you to analyze the reason for this To understand why this selection of
transactions helps to analyze the problem it is important to know that the processing within the Integration
Engine is done within the pipeline The central pipeline of the Integration Server executes the following main
steps
Central Pipeline Steps Description of Central Pipeline Steps
PLSRV_XML_VALIDATION_RQ_INB XML Validation Inbound Channel Request
PLSRV_RECEIVER_DETERMINATION Receiver Determination
PLSRV_INTERFACE_DETERMINATION Interface Determination
PLSRV_RECEIVER_MESSAGE_SPLIT Branching of Messages
PLSRV_MAPPING_REQUEST Mapping
PLSRV_OUTBOUND_BINDING Technical Routing
PLSRV_XML_VALIDATION_RQ_OUT XML Validation Outbound Channel Request
PLSRV_CALL_ADAPTER Transfer to Respective Adapter IDoc HTTP Proxy AFW
PLSRV_XML_VALIDATION_RS_INBXML Validation Inbound Channel Response
PLSRV_MAPPING_RESPONSE Response Message Mapping
PLSRV_XML_VALIDATION_RS_OUT Validation Outbound Channel Response
The last three steps highlighted in bold are available in case of synchronous messages only and reflect the
time spent in the mapping of the synchronous response message
The steps indicated in red are new in SAP NetWeaver PI 71 and higher and can be used to validate the
payload of a PI message against an XML schema These steps are optional and can be executed at different
times in the PI pipeline processing for example before and after a mapping (as shown above)
With PI 731 an additional option of using an external Virus Scan during PI message processing can be
activated as described in the Online Help The Virus Scan can be configured on multiple steps in the pipeline
ndash eg after the mapping (Virus Scan Outbound Channel Request) when receiving a synchronous response
(Virus Scan Inbound Channel Response) and after the response mapping (Virus Scan Outbound Channel
Response)
It is important to know is that these pipeline steps are executed based on qRFC Logical Unit of Work (LUW)
by using dialog work processes
SAP NETWEAVER 71 AND HIGHER PERFORMANCE CHECK GUIDE
21
With 711 and higher versions you can activate the Lean Message Search (LMS) to be able to search for
payload content This is described in more detail in chapter Long Processing Times for
ldquoLMS_EXTRACTIONrdquo
41 Work Process Overview (SM50SM66)
The work process overview is the central transaction to get an overview of the current processes running in
the Integration Engine For message processing PI is only using Dialog work processes (DIA WP) Therefore
it is essential to ensure that enough DIA WPs available
The process overview is only a snapshot analysis You therefore have to refresh the data multiple times to
get a feeling for the dynamics of the processes The most important questions to be asked are as follows
How many work processes are being used on average Use the CPU Time (clock symbol) to check that not all DIA WPs are used In case all DIA WPs have a high CPU time this indicates a WP bottleneck
Which users are using these processes It depends on the usage of your PI system All asynchronous messages are processed by the QIN scheduler who will start the message processing in DIA WPs The user that is shown in SM66 will be the one that triggered the QIN scheduler This can eg be a communication user for a connected backend (usually a copy of PIAPPLUSER) or the user used to send data from the Adapter Engine (per default PIAFUSER)
Activities related to the Business Process Engine (ccBPM) will be indicated by user WF-BATCH If you see high WF-BATCH activity take a look at chapter 51
Are there any long running processes and if so what are these processes doing with regard to the reports used and the tables accessed
o As a rule of thumb for the initial configuration the number of DIA work processes should be around six times the value of CPU in your PI system (rdispwp_no_dia = 6 to 8 times CPUs cores based on SAP Note 1375656 - SAP NetWeaver PI System Parameters)
If you would like to get an overview for an extended period of time without actually refreshing the transaction
at regular intervals use report SDFMON and schedule the Daily Monitoring It allows you to collect metrics
such as CPU usage amount of free Dialog work processes and most importantly a snapshot of the work
process activity as provided in transactions SM50 and SM66 The frequency for the data collection can be as
low as 10 seconds and the data can be viewed after the configurable timeframe of the analysis Note
SDFMON is only intended for analysis of performance issues and should only be scheduled for a limited
period of time
If you have Solution Manager Diagnostics installed and all the agents connected to PI you can also monitor
the ABAP resource usage using Wily Introscope As you can see in the dashboard below you can use it to
monitor the number of free work processes (prerequisite is that the SMD agent is running on the PI system)
The major advantage of Wily Introscope is that this information is also available from the past and allows
analysis after the problem has occurred in the system
SAP NETWEAVER 71 AND HIGHER PERFORMANCE CHECK GUIDE
22
42 qRFC Resources (SARFC)
Depending on the configuration of the RFC server group not all dialog work processes can be used for
qRFC processing in the Integration Server As stated earlier all (ABAP based) asynchronous messages are
processed using qRFC Therefore tuning the RFC layer is one of the most important tasks to achieve good
PI performance
In case you have a high volume of (usually runtime critical) synchronous scenarios you have to ensure that
enough DIA WPs are kept free by the asynchronous interfaces running at the same time Since this is a very
difficult tuning exercise we usually recommend implementing runtime critical synchronous interfaces using
Java only configuration (ICO) whenever possible If this is not possible you have to ensure via SARFC tuning
that enough work processes are kept free to process the synchronous messages
The current resource situation in the system can be monitored using transaction SARFC
Procedure
First check which application servers can be used for qRFC inbound processing by checking the AS Group
assigned in transaction SMQR
Call transaction SARFC and refresh several times since the values are only snapshot values
Is the value for ldquoMax Resourcesrdquo close to your overall number of dialog work processes Max Resources is a fixed value and describes how many DIA work processes may be used for RFC communication If the value is too low your RFC parameters need tuning to provide the Integration Server with enough resource for the pipeline processing The RFC parameters can be displayed by double-clicking on ldquoServer Namerdquo
o A good starting point is to set the values as follows
Max no of logons = 90
Max disp of own logons = 90
Max no of WPs used = 90
Max wait time = 5
Min no of free WP = 3-10 (depending on the size of the application server)
These values are specified in SAP Note 1375656 ndash SAP NetWeaver PI System Parameters (this parameter must be increased if you plan to have synchronous interfaces) To avoid any bottleneck and blocking situation free DIA WPs should always be available The value should be adjusted based on the overall number of DIA WPs available at the system and the above requirements
SAP NETWEAVER 71 AND HIGHER PERFORMANCE CHECK GUIDE
23
Note You have to set the parameters using the SAP instance profile Otherwise the changes are lost
after the server is restarted
The field ldquoResourcesrdquo shows the number of DIA WPs available for RFC processing Is this value reasonably high for example above zero all the time If the ldquoResourcesrdquo value is zero then the Integration Server cannot process XML messages because no dialog work process is free to execute the necessary qRFC There are several conclusions that can be drawn from this observation as follows
1) Depending on the CPU usage (see Chapter ldquoMonitoring CPU Capacityrdquo) it might be necessary at this time to increase the number of dialog work processes in your system If the CPU usage however is already very high increasing the number of DIA will not solve the bottleneck
2) Depending on the number of concurrent PI queues (see Chapter qRFC Queues (SMQ2)) it might be necessary to decrease the degree of parallelism in your Integration Server because the resources are obviously not sufficient to handle the load The next section describes how to tune PI inbound and outbound queues
The data provided in SARFC is also collected and shown in a graphical and historical way using Solution
Manager Diagnostic and Wily Introscope (as can be seen in the screenshot below) This allows easy
monitoring of the RFC resources across all available PI application servers
43 Parallelization of PI qRFC Queues
The qRFC inbound queues on the ABAP stack are one of the most important areas in PI tuning Therefore it
is essential to understand the PI queuing concept
PI generally uses two types of queues for message processing ndash PI inbound and PI outbound queues Both
types are technical qRFC inbound queues and can therefore be monitored using SMQ2 PI inbound queues
are named XBTI (EO) or XBQI (EOIO) and are shared between all interfaces running on PI by default The
PI outbound queues are named XBTO (EO) and XBQO (EOIO) The queue suffix (in red XBTO0___0004)
specifies the receiver business system This way PI is using dedicated outbound queues for each receiver
SAP NETWEAVER 71 AND HIGHER PERFORMANCE CHECK GUIDE
24
system All interfaces belonging to the same receiver business system are contained in the same outbound
queue Furthermore there are dedicated queues for prioritization of separation of large messages To get an
overview about the available queues use SXMB_ADM Manage Queues
PI inbound and outbound queues execute different pipeline steps
PI Inbound Queues
Pipeline Steps Description of Pipeline Steps
PLSRV_XML_VALIDATION_RQ_INB XML Validation Inbound Channel Request
PLSRV_RECEIVER_DETERMINATION Receiver Determination
PLSRV_INTERFACE_DETERMINATION Interface Determination
PLSRV_RECEIVER_MESSAGE_SPLIT Branching of Messages
PI Outbound Queues
Pipeline Steps Description of Pipeline Steps
PLSRV_MAPPING_REQUEST Mapping
PLSRV_OUTBOUND_BINDING Technical Routing
PLSRV_XML_VALIDATION_RQ_OUT XML Validation Outbound Channel Request
PLSRV_CALL_ADAPTER Transfer to Respective Adapter IDoc HTTP Proxy AFW
Before the steps above are executed the messages are placed in a qRFC queue (SMQ2) The messages
will wait till they are first in queue and till a free DIA work process is assigned to a queue The wait time in the
queue are recorded in the performance header in DB_ENTRY_QUEUING (PI inbound queue) and
DB_SPLITTER_QUEUING (PI outbound queue) Most often you will see the long processing times there as
discussed in chapter Long Processing Times for ldquoDB_ENTRY_QUEUEINGrdquo and Long Processing Times for
ldquoDB_SPLITTER_QUEUEINGrdquo
Looking at the steps above it is clear that tuning the queues will have a direct impact on the connected PI
components and also backend systems For example by increasing the number of parallel outbound queues
more mappings will be executed in parallel which will in turn put a greater load on the Java stack or more
messages will be forwarded in parallel to the backend system in case of a Proxy call Thus when tuning PI
queues you must always keep the implications for the connected systems in mind
The tuning of PI ABAP queue parameters is done in transaction SXMB_ADM Integration Engine
Configuration and by selecting the category TUNING
For productive usage we always recommend to use inbound and outbound queues (parameter
EO_INBOUND_TO_OUTBOUND=1) Otherwise only inbound queues will be used which are shared across
SAP NETWEAVER 71 AND HIGHER PERFORMANCE CHECK GUIDE
25
all interfaces Hence a problem with one single backend system will affect all interfaces running on the
system
The principle of less is sometimes more also applies for tuning the number of parallel PI queues Increasing
the number of parallel queues will result in more parallel queues with fewer entries per queue In theory this
should result in a lower latency if enough DIA WPs are available
But practically this is not true for high volume systems The main reason for this is the overhead involved in
the reloading of queues (see details below) Furthermore important tuning measures like PI packaging (see
Chapter ldquoPI Message Packagingrdquo) aim to increase the throughput based on a higher number of messages in
the queue Thus from a throughput perspective it is definitely advisable to configure fewer queues
If you have very high runtime requirements you should prioritize these interfaces and assign a different
parallelism for high priority queues only This can be done using parameters
EO_INBOUND_PARALLEL_HIGH_PRIO and EO_OUTBOUND_PARALLEL_HIGH_PRIO as described in
section ldquoMessage Prioritization on the ABAP Stackrdquo
To tune the parallelism of inbound and outbound queues the relevant parameters are
EO_INBOUND_PARALLEL and EO_OUTBOUND_PARALLEL have to be used
Below you can see a screenshot of SMQ2 You can see the PI inbound queues and outbound queues Also
ccBPM queues (XBQO$PE) are displayed and will be discussed in section 5
Procedure
Log on to your Integration Server call transaction SMQ2 and execute If you are running ABAP proxies on a
separate client on the same system enter lsquorsquo for the client Transaction SMQ2 provides snapshots only and
must therefore be refreshed several times to get viable information
o The first value to check is the number of queues concurrently active over a period of time Since each queue needs a dialog work process to be worked on the number of concurrent queues must not be too high compared to the number of dialog work processes usable for RFC communication (see Chapter qRFC Resources (SARFC)) The optimum throughput can be achieved if the number of active queues is equal to or slightly higher than the number of dialog work processes (provided that the number of DIA work processes can be handled by the CPU of the system see transaction ST06)
In case many of the queues are EOIO queues (eg because the serialization is done on the material number) try to reduce the queues by following Chapter EOIO tuning
o The second value of importance is the number of entries per queue Hit refresh a few times to check if the numbers increasedecreaseremain the same An increase of entries for all queues or a specific
SAP NETWEAVER 71 AND HIGHER PERFORMANCE CHECK GUIDE
26
queue points to a bottleneck or a general problem on the system The conclusion that can be drawn from this is not simple Possible reasons have been found to include
1) A slow step in a specific interface
Bad processing time of a single message or a whole interface can be caused by expensive processing steps as for example the mapping step or receiver determination This can be confirmed by looking at the processing time for each step as shown in ldquoAnalyzing the runtime of pipeline stepsrdquo
2) Backlog in Queues
Check if inbound or outbound queues face a backlog A backlog in a queue is generally nothing critical since the queues ensure that the PI components as well as the backend systems are not overloaded For instance batch triggered interfaces are usually causing high backlogs that get processed over time Only in case the backlog prevents you to meet the business requirements for an interface this should be analyzed
If the backlog is caused by a high volume of messages arriving in a short period of time one solution to minimize the backlog is to increase the number of queues available for this interface (if sufficient hardware is available) If one interface is having a backlog in the outbound queues you could eg specify EO_OUTBOUND_PARALLEL with a sub parameter specifying your interface to increase the parallelism for this interface
But in general a backlog can also be caused by a long processing time in one of the pipeline steps as discussed in 1) or a performance problem with one of the connected components like PI Java stack or connected backend systems Due to the steps performed in the outbound queues (mapping or call adapter) it is more likely that a backlog will be seen in the outbound queues Inbound queue processing is only expensive if Content Based Routing or Extended Receiver Determination is used To understand which step is taking long follow once more chapter ldquoAnalyzing the runtime of pipeline stepsrdquo
In addition to tuning of the number of inbound and outbound queues also ldquoMessage Prioritization on the ABAP Stackrdquo and ldquoPI Message Packagingrdquo can help
The screenshot below shows such a backlog situation in Wily Introscope Please Note that the information about the queues is only collected by Wily in 5 minutes intervals explaining the gaps between the measurement points On the dashboard ldquoTotal qRFC Inbound Queue Entriesrdquo you can see that the number of messages in SMQ2 is increasing The number of inbound queues does not increase at the same time It also offers a dashboard for the number of entries by queue name and the time entries remain in SMQ2 With the information provided here it is also possible to distinguish a blocking situation or a general resource problem after the problem is no longer present in the system
SAP NETWEAVER 71 AND HIGHER PERFORMANCE CHECK GUIDE
27
3) Queues stay in status READY in SMQ2
To see the status of the queues use the filter button in SMQ2 as shown below
It is a normal situation to see many queues in READY status for a limited amount of time The reason for this is the way the QIN scheduler reloads LUWs (see point 2 below) A waiting time of up to 5 seconds per queuing step is considered normal during normal load situation (even if there is no backlog in the queue and enough resources are available) If you observe a situation where many queues are in READY status for longer period of time the following situations can apply
A resource bottleneck with regard to RFC resources Confirm by following section qRFC Resources (SARFC)
To avoid overloading a system with RFC load the QIN scheduler only reloads new queues after a certain amount of queues have finished processing This can lead to long waiting times in the queues as explained in SAP Note 1115861 - Behaviour of Inbound Scheduler after Resource Bottleneck Since PI is a non-user system we recommend setting rfcinb_sched_resource_threshold to 3 as described in SAP Note 1375656 ndash SAP NetWeaver PI System Parameters
Long DB loading times for RFC tables If using Oracle ensure that SAP Note 1020260 - Delivery of Oracle statistics is applied
Additional overhead during the pipeline executions occurs due to PI internal mechanisms Per default a lock is set during processing of each message This is no longer necessary and should
SAP NETWEAVER 71 AND HIGHER PERFORMANCE CHECK GUIDE
28
be switched off by setting the parameter LOCK_MESSAGE of category RUNTIME to 0 as described in SAP Note 1058915 In addition during the processing of an individual message the message repeatedly calls an enqueue which leads to a deterioration of the throughput This can be avoided by setting parameter CACHE_ENQUEUE to 0 as described in SAP Note 1366904
Sometimes a queue stays in READY status for a very long time while other queues are getting processed fine After manual unlocking the queue is processed but then stops after some time again A potential reason is described in Note 1500048 - SMQ2 inbound Queue remains in READY state In a PI environment queues in status RUNNING for more than 30 minutes usually happen due to one individual step taking long (as discussed in step 1) or a problem on the infrastructure (eg memory problems on Java or HTTP 200 lost on network) After 30 minutes the QIN scheduler removes this queue from the scheduling and therefore it remains in READY To solve such cases the root cause for the blocking has to be understood
4) Queue in READY status due to queue blacklisting
If a queue is for a very long time in status RUNNING (eg due to a problem with a mapping or due to a very slow backend) it is possible that the QIN scheduler excludes this queue from queue scheduling Hence the queue stays in status READY even though enough work processes are available The ldquoblacklistingrdquo of queues takes place when the runtime of a queue exceeds the ldquoMonitoring thresholdrdquo configured on this queue Notes 1500048 - queues stay in ready (schedule_monitor) and Note 1745298 - SMQR Inbound queue scheduler identify excluded entries provide more input on this topic The screenshot below shows a setting of 2400 seconds (40 minutes) for this parameter
Check if a queue stays in READY status for a long time while others are processing without any issue Ensure Note 1745298 is implemented and check the system log for the following exception ldquoQINEXCLUDE ltqueue namegt lttimedate at which the queue scheduler startedgt If this is the case check why the long runtime occurs (see section Analyzing the runtime of PI pipeline steps) or increase the schedule_monitor in exceptional cases only (if eg the runtime of an individual processing step cannot be improved further)
5) An error situation is blocking one or more queues
Click the Alarm Bell (Change View) push button once to see only queues with error status Errors delay the queue processing within the Integration Server and may decrease the throughput if for example multiple retries occur Navigate to the first entry of the queue and analyze the problem by forward navigation to the relevant message in SXMB_MONI
Often you see EO queues in SYSFAIL or RETRY due to the problems during the processing of an individual message This can be prevented by following the description of Chapter Prevent blocking of EO queues
SAP NETWEAVER 71 AND HIGHER PERFORMANCE CHECK GUIDE
29
44 Analyzing the runtime of PI pipeline steps
The duration of the pipeline steps is the ultimate answer to long processing times in the Integration Engine
since it describes exactly how much time was spent at which point The recommended way to retrieve the
duration of the pipeline steps is the RWB and will be described below Advanced users may use the
Performance Header of the SOAP message using transaction SXMB_MONI but the timestamps are not
easy to read If you still prefer the latter method here is the explanation 20110409092656165 must be read
as yyyymmddhh(min)(min)(sec)(sec)(microseconds) that is the timestamp corresponds to April 9 2011 at
092656 and 165 microseconds Please note that these timestamps in Performance Header of
SXI_MONITOR transaction are stored and displayed in UTC time therefore conversion to system time must
be done when analyzing them
In case PI message packaging is configured the performance header will always reflect the processing time
per package Hence a duration of 50 seconds does not mean a single message took 50 seconds but
eventually the package contained 100 messages so that every message took 05 ms More details about
this can be found in section PI Message Packaging
Procedure
Log on to your Integration Server and call transaction SXMB_IFR In the browser window follow the link to
the Runtime Workbench In there click Performance Monitoring Change the display to Detailed Data
Aggregated and choose an appropriate time interval for example the last day For this selection you have to
enter the details of the specific interface you want to monitor
You will now see in the lowerndashpart of the screen a split of the processing time into single steps Check the time difference between the steps Does any step take longer than expected In the example in the screenshot below the DB_ENTRY_QUEUEING starts after 0032 seconds and ends after 0243 seconds which means it took 0211 seconds (211ms)
SAP NETWEAVER 71 AND HIGHER PERFORMANCE CHECK GUIDE
30
Compare the processing times for the single steps for different measurements as outlined in Chapter
Pipeline Steps (SXMB_MONI or RWB) For example is a single step only long if many messages
are processed or if a single message is processed This helps you to decide if the problem is a
general design problem (single message has long processing step) or if it is related to the message
volume (only for a high number of messages this process step has large values)
Each step has different follow-up actions that are described next
441 Long Processing Times for ldquoPLSRV_RECEIVER_ DETERMINATIONrdquo PLSRV_INTERFACE_DETERMINATION
Steps that can take a long time in inbound processing are the Receiver and Interface Determination In these
steps the receiver system and interface is calculated Normally this is very fast but PI offers the possibility of
enhanced receiver determinations In these cases the calculation is based on the payload of a message
There are different implementation options
o Content-Based Routing (CBR)
CBR allows defining XPath expressions that are evaluated during runtime These expressions can be combined by logical operators for example to check the value for multiple fields The processing time of such a request directly correlates to the number and complexity of the conditions defined
No tuning options exist for the system in regard to CBR The performance of this step can only be changed by reducing the number of rules by changing the design of the interfaces Another option is to use an extended receiver determination (executing a mapping program) since this is faster than CBR using many rules
o Mapping to determine Receivers
A standard PI mapping (ABAP Java XSLT) can also be used to determine the receiver If you observe high runtimes in such a receiver determination follow the steps outlined in the next section since the same mapping runtime is used
442 Long Processing Times for ldquoPLSRV_MAPPING_REQUESTrdquo
Before analyzing the mapping you must understand which runtime is used Mappings can be implemented
in ABAP as graphical mappings in the Enterprise Service Builder as self-developed Java mappings or
XSLT mappings One interface can also be configured to use a sequence of mappings executed
sequentially In such a case analysis is more difficult because it is not clear which mapping in the sequence
is taking a long time
Normal debugging and tracing tools (transaction ST12) can be used for mappings executed in ABAP Any
type of mapping can be tested from ABAP using transaction SXI_MAPPING_TEST Knowing
senderreceiver partyserviceinterfacenamespace and source message payload it is possible to check the
target message (after mapping execution) and detailed trace output (similar to contents of trace of the
message in SXMB_MONI with TRACE_LEVEL = 3) It can also be used for debugging at runtime by using
the standard debugging functionality
For ABAP based XSLT mappings it is also possible via transaction XSLT_TOOL to test trace and debug
XSLT transformations on the ABAP stack
In general the mapping response time is heavily influenced by the complexity of the mapping and the
message size Therefore to analyze a performance problem in the mapping environment you should
compare the mapping runtime during the time of the problem with values reported several days earlier to get
a better understanding
SAP NETWEAVER 71 AND HIGHER PERFORMANCE CHECK GUIDE
31
If no AAE is used the starting point of a mapping is the Integration Engine that will send the request by RFC
destination AI_RUNTIME_JCOSERVER to the gateway There it will be picked up by a registered server
program The registered server program belongs to the J2EE Engine The request will be forwarded to the
J2EE Engine by a JCo call and then executed by the Java runtime When the mapping has been executed
the result is sent back to the ABAP pipeline There are therefore multiple places to check when trying to
determine why the mapping step took so long
Before analyzing the mapping runtime of the PI system check if only one interface is affected or if you face a
long mapping runtime for different interfaces To do so check the mapping runtime of messages being
processed at the same time in the system
The best tool for such an analysis is Wily Introscope which offers a dashboard for all mappings being
executed at a given time Each line in the dashboard represents one mapping and shows the average
response time and the number of invocations
In the screenshot below you can see that many different mapping steps have required around 500 seconds
for processing Comparing the data during the incident with the data from the day before will allow you to
judge if this might be a problem of the underlying J2EE engine as described in section J2EE Engine
Bottleneck
If there is only one mapping that faces performance problems there would be just one line sticking out in the
Wily graphs If you face a general problem that affects different interfaces you can choose a longer
timeframe that allows you to compare the processing times in a different time period and verify if it is only a
ldquotemporaryrdquo issue ndash this would for example indicate an overload of the mapping runtime
If you have found out that only one interface is affected then it is very unlikely to be a system problem but
rather a problem in the implementation of the mapping of that specific interface
SAP NETWEAVER 71 AND HIGHER PERFORMANCE CHECK GUIDE
32
Check the message size of the mapping in the runtime header using SXMB_MONI Verify if the message size is larger than usual (which would explain the longer runtime)
There can also be one or many lookups to a remote system (using RFC or JDBC) causing the long processing time of a mapping Together with the application you then have to check if the connection to the backend is working properly Such a mapping with lookups can be analyzed using Wily Transaction Trace as explained in the appendix section Wily Transaction Trace
If not one but several interfaces are affected a potential system bottleneck occurs and this is described in
the following
o Not enough resources (registered server programs) available That could either be the case if too many mapping requests are issued at the same time or if one J2EE server node is down and has not registered any server programs
To check if there were too many mapping requests for the available registered server programs compare the number of outbound queues that are concurrently active with the number of registered server programs The number of outbound queues that are concurrently active can be monitored with transaction SMQ2 and counting queues with the names XBTO amp XBQOXB2O XBTA and XBQAXB2A (high priority) XBTZ and XBQZXB2Z (low priority) and XBTM (large messages) In addition to this you have to take into account mapping steps that are executed by synchronous messages or in a ccBPM process Mappings executed by a ccBPM process are not queued but the ccBPM process calls the mapping program directly using tRFC The number of registered server programs can be determined with transaction SMGW Goto Logged On Clients and filtering by the program (ldquoTP Namerdquo) AI_RUNTIME_ltSIDgt In general we recommend configuring 20 parallel mapping connections per server node
If the problem occurred in the past it is more difficult to determine the number of queues that are concurrently active One way is to use transaction SXMB_MONI and specify every possible outbound queue (field ldquoQueue IDrdquo) in the advanced selection criteria (Note wildcard search not available) The timeframe can be restricted in the upper-part of the advanced selection criteria Advanced users could use transaction SE16 to search directly in table SXMSPMAST using the field ldquoQUEUEINTrdquo
The other option is to use the Wily ldquoqRFC Inbound Queue Detailrdquo dashboard as described in qRFC Queue Monitoring (SMQ2)
To check if the J2EE is not available or if the server program is not registered for a different reason use transaction SM59 to test the RFC destination AI_RUNTIME_JCOSERVER If the problem occurred in the past search the gateway trace (transaction SMGW GoTo Trace Gateway Display File) and the RFC developer traces dev_rfc files available in the work directory for the string ldquoAI_RUNTIMErdquo In addition check the std_serverltngtout in the work directory for restarts of the J2EE Engine
SAP NETWEAVER 71 AND HIGHER PERFORMANCE CHECK GUIDE
33
o Depending on the checks above there are two options to resolve the bottleneck Of course if the J2EE was not available the reason for this has to be found and prevented in the future
The two options for tuning are
1) the number of outbound queues that are concurrently active and
2) the number of mapping connections from the J2EE server to the ABAP gateway
The increase of mapping connections is only recommended for strong J2EE servers since each mapping thread needs resources like CPU and Heap memory Too many mapping connections mean too many mappings being executed on the J2EE Engine In turn this might reduce the performance of other parts of the PI system for example the pipeline processing in the Integration Engine or the processing within the adapters of the AFW or can even cause out-of-memory errors on the J2EE engine Add additional J2EE server nodes to balance the parallel requests Each J2EE server node will
register new destinations at the gateway and will therefore take a part of the mapping load
Another option is to reduce the number of outbound queues that are concurrently active to solve the bottleneck This will certainly result in higher backlogs in the queue and is therefore only applicable for less runtime critical interfaces This option can be used if the backlog is caused by a master data interface with high volume but no critical processing time requirements In such a case you can only lower the number of parallel queues for this interface by using a sub-parameter of EO_OUTBOUND_PARALLEL in transaction SXMB_ADM By doing so you slow down one interface to ensure other (more critical) interfaces have sufficient resources available
o If multiple application servers configured on the PI system ensure that all the server nodes are connected to their local gateway (local bundle option) as described in the guide How To Scale PI
443 Long Processing Times for ldquoPLSRV_CALL_ADAPTERrdquo
Call adapter is the last step executed in the PI pipeline and forwards the message to the next component
along the message flow In most cases (local Adapter Engine IDoc or BPE) this is a local call The IDoc
adapter only puts the message on the tRFC layer (SM58) of the PI system so that the actual transfer of the
IDoc is not included in the performance header For ABAP Proxies plain HTTP or calls to a central or
decentral Adapter Engine an HTTP call is made so that network time can have an influence here
Looking at the processing time we have to distinguish asynchronous (EO and EOIO) and synchronous (BE)
interfaces
In asynchronous interfaces the call adapter step includes the transfer of the message by the network and
the initial steps on the receiver side (in most cases this just means persisting the message on the receiverrsquos
database) A long duration can therefore have two reasons
o Network latency For large messages of several MB in particular the network latency is an important factor (especially if the receiving ABAP proxy system is located on another continent for example) Network latency has to be checked in case of a long call adapter step In case HTTP load balancers are used they are considered as part of the network
o Insufficient resources on receiver side Enough resources must be available at the receiver side to ensure quick processing of a message For instance enough ICM threads and dialog work processes must be available in the case of an ABAP proxy system Therefore the analysis of long call adapter steps always has to include the relevant backend system
For synchronous messages (requestresponse behavior) the call adapter step also includes the processing
time on the backend to generate the response message Therefore the call adapter for synchronous
messages includes the time of the transfer of the request message the calculation of the corresponding
response message at the receiver side and the transfer back to PI Therefore the processing time to
process a request at the receiving target system for synchronous messages must always be analyzed to find
the most costly processing steps
SAP NETWEAVER 71 AND HIGHER PERFORMANCE CHECK GUIDE
34
444 Long Processing Times for ldquoDB_ENTRY_QUEUEINGrdquo
The value for DB_ENTRY_QUEUEING describes the time that a message has spent waiting in a PI inbound
queue before processing started In case of errors the time also includes the wait time for restart of the LUW
in the queue The inbound queues (XBTI XBT1 XBT9 XBTL for EO messages and XBQIXB2I
XBQ1XB21 XBQ9XB29 for EOIO messages) process the pipeline steps for the Receiver
Determination the Interface Determination and the Message Split (and optionally XML inbound validation)
Thus if the step DB_ENTRY_QUEUEING has a high value the inbound queues have to be monitored using
transactions SMQ2 and SARFC The reasons are similar as those outlined in chapter qRFC Resources
(SARFC) and qRFC Queues (SMQ2)
o Not enough resources (DIA work processes for RFC communication) available
o A backlog in the queues caused by one of the following reasons
The number of parallel inbound queues is too low to handle the incoming messages in parallel Note that a simple increase of the parameter EO_INBOUND_PARALLEL might not always be the solution (as enough work processes also have to be available to process the queues in parallel) The number of work processes is in turn restricted by the number of CPUs that are available for your system If you would like to separate critical from non-critical sender systems define a dedicated set of inbound queues by specifying a sender ID as a sub parameter of EO_INBOUND_PARALLEL For example by doing so you can separate master data interfaces from business critical interfaces Please note that the separation on inbound queues only works on Business System level and not on interface level
The inbound queues were blocked by the first LUW Use transaction SMQ2 to check if that is still the case To identify if such a situation occurred in the past use the Wily Introscope dashboard ldquoABAP System qRFC Inbound Detailldquo It is generally not easy to find the one message that is blocking the queue It might be achieved by checking RFC traces or by searching for a single message with a long pipeline processing step For EO queues there is no business reason to block the queues in case of a single message error To prevent this follow the description in section Prevent blocking of EO queues
In case you have a different runtime of the messages in the queues (eg due to complex extended Receiver Determinations) the number of messages per queue might be uneven distributed between the queues In PI 73 a new balancing option is available as discussed in Avoid uneven backlogs with queue balancing
Problems when loading the LUW by the QIN scheduler as described in qRFC Queues (SMQ2)
Note If your system uses the parameter EO_INBOUND_TO_OUTBOUND = 0 you must also read chapter
445 for analyzing the reasons EO_INBOUND_TO_OUTBOUND only determines whether inbound queues
(value lsquo0rsquo) or inbound and outbound queues (value lsquo1rsquo) are used for the pipeline processing in the integration
server Check the value with transaction SXMB_ADM Integration Engine Configuration Specific
Configuration The default value is lsquo1rsquo meaning the usage of inbound and outbound queues (the
recommended behavior)
445 Long Processing Times for ldquoDB_SPLITTER_QUEUEINGrdquo
The value for DB_SPLITTER_QUEUEING describes the time that a message has spent waiting in a PI
outbound queue until a work process was assigned In case of errors the time also includes the wait time for
the restart of the LUW in the queue
The outbound queues (XBTO XBTA XBTZ XBTM for EO messages and XBQOXB2O
XBQAXB2A XBQZXB2Z for EOIO messages) process the pipeline steps for the mapping outbound
binding and call adapter
SAP NETWEAVER 71 AND HIGHER PERFORMANCE CHECK GUIDE
35
Thus if the step DB_SPLITTER_QUEUEING has a high value the outbound queues have to be monitored
using transactions SMQ2 and SARFC The reasons are similar as outlined in chapters qRFC Resources
(SARFC) and qRFC Queues (SMQ2) or described in the section above for PI inbound queues
o Not enough resources (DIA work processes for RFC communication) available
o A backlog in the queues caused by one of the following reasons
The number of parallel outbound queues is too low to handle the outgoing messages in parallel Note that simply increasing the parameter EO_OUTBOUND_ PARALLEL might not always be the solution as enough work processes have to be available to process the queues in parallel The number of work processes in turn is limited by the number of CPUs available for the system Also the parameter EO_OUTBOUND_PARALLEL is used differently than the parameter EO_INBOUND_ PARALLEL because it determines the degree of parallelism for each receiver system Thus it is possible to increase the number of parallel outbound queues for specific receivers whereas other receivers are handled with a lower degree of parallelism Note that not every receiver backend is able to handle a high degree of parallelism so that in case of an ABAP Proxy system it might not indicate a problem on PI in case you observe a high value for DB_SPLITTER_QUEUING
The outbound queues were blocked by the first LUW To identify if such a situation occurred in the past use the Wily Introscope dashboard ldquoABAP System qRFC Inbound Detailldquo In general it is not easy to find the one message that is blocking the queue It might be achieved by checking RFC traces or by searching for a single message with a long pipeline processing step For EO queues there is no business reason to block the queues in case of a single message error To prevent this follow the description in section Prevent blocking of EO queues
Since the outbound queues include a processing step that is bound to take longer than the other steps (that is the mapping and the call adapter step) this might mean a long waiting time for all subsequent messages As an example assume that a mapping takes 1 second and that 100 messages are waiting in a queue The first message gets executed at once the second message has to wait about 1 second (a bit more since more steps are executed than just the mapping but this should be ignored at the moment) the third takes 3 seconds and so on The 100
th message
has to wait 100 seconds until it is processed that is the value for DB_SPLITTER_QUEUING is as high as 100 For a given outbound queue you would therefore see an increase for the DB_SPLITTER_QUEUING value over time If you experience this situation proceed with Chapter 442
In case you have a different runtime of the messages in the queues (eg due to different message size) the number of messages per queue might be uneven distributed between the queues In PI 73 a new balancing option is available as discussed in Avoid uneven backlogs with queue balancing
o Problems when loading the LUW by the QIN scheduler as described in qRFC Queues (SMQ2)
Note The number of parallel outbound queues is also connected with the ability of the receiving system to
process a specific amount of messages for each time unit
In section Adapter Parallelism default restrictions of the specific adapters of the J2EE Engine are explained Some adapters (JDBC File Mail) can process only one message for each server node at a time (this can be changed) It does not make sense for such adapters to have too many parallel qRFC queues since this will only move the message backlog from ABAP to Java
For messages that are directed to the IDoc outbound adapter the value for EO_OUTBOUND_PARALLEL is connected to the MAXCONN value of the corresponding outbound destination You can define the maximum number of connections using transaction SMQS ndash the default value is 10 parallel connections If applicable SAP highly recommends that you use IDoc packaging in the outbound IDoc adapter to reduce the load during the transmission of tRFC calls from the PI system to the receiving system
For ABAP proxy systems the number of outbound queues directly determines the number of messages sent in parallel to the receiving system Thus you have to ensure that the resources
SAP NETWEAVER 71 AND HIGHER PERFORMANCE CHECK GUIDE
36
available on PI are aligned with those on the sendingreceiving ABAP proxy system
446 Long Processing Times for ldquoLMS_EXTRACTIONrdquo
Lean Message Search can be configured for newer PI releases as described in the Online Help After
applying Note 1761133 - PI runtime Enhancement of performance measurement an additional header for
LMS will be written to the performance header
The header could look like this indicating that around 25 seconds were spent in the LMS analysis
When using trace level two additional timestamps are written to provide details about this overall runtime
LMS_EXTRACTION_GET_VALUES
This timestamp describes the evaluation of the message according to user-defined filter criteria
LMS_EXTRACTION_ADJUST_VALUES
This timestamp describes the post-processing of the previously found values in the BAdI (as of PI 730)
The runtime of the LMS heavily depends on the number of payload attributes to be extracted Also the
payload size and the complexity of the XPath expression has a direct impact on the performance of the LMS
In general the number of elements to be indexed should be kept at a minimum and very deep and complex
XPath expressions should be avoided
If you want to minimize the impact of LMS on the PI message processing time you can define the extraction
method to use an external job In that case the messages will be indexed after processing only and it will
therefore have no performance impact during runtime Of course this method imposes a delay in the
indexing (based on the frequency of job SXMS_EXTRACT_MESSAGES) so that newly processed
messages cannot be searched using LMS If this delay is acceptable for the monitoring responsible the
messages should be indexed using an external job
447 Other step performed in the ABAP pipeline
As discussed earlier there are additional steps in the ABAP pipeline that can be executed based on the
configuration of your scenario Per default these steps will not be activated and should therefore not
consume any time All these steps are traced in the performance header of the message Below you can see
the details for
- XML validation
SAP NETWEAVER 71 AND HIGHER PERFORMANCE CHECK GUIDE
37
- Virus Scan
In case one of these steps is taking long you have to check the configuration of your scenario In the
example of the Virus scan the problem might be related to the external virus scanner used and tuning has to
happen on that side
45 PI Message Packaging for Integration Engine
PI message packaging was introduced with SAP NetWeaver PI 70 SP13 and is per default activated in PI
71 and higher Message packaging in BPE is independent of message packaging in PI (see chapter 56)
but they can be used together
To improve performance and message throughput asynchronous messages can be assembled to packages
and processed as one entity For this the qRFC scheduler was enabled to process a set of messages (a
package) in one LUW Thus instead of sending one message to the different pipeline steps (for example
mappingrouting) a package of messages will be sent that will reduce the number of context switches that is
required Furthermore access to databases is more efficient since requests can be bundled in one database
operation Depending on the number and size of messages in the queue this procedure improves
performance considerably In return message packaging can increase the runtime for individual messages
(latency) due to the delay in the packaging process
Message packaging is only applicable for asynchronous scenarios (QoS EO and EOIO) Due to the potential
latency of individual messages packaging is not suitable for interfaces with very high runtime requirements
In general packaging has the highest benefit for interfaces with high volume and small message size
The performance improvement achieved directly relates to the number of the messages bundled in each
package Message packaging must not solely be used in the PI system Tests have shown that the
performance improvement significantly increases if message packaging is configured end-to-end - that is
from the sending system using PI to the receiving system Message packaging is mainly applicable for
application systems connected to PI by ABAP proxy
From the runtime perspective no major changes are introduced when activating packaging Messages
remain individual entities in regards to persistence and monitoring Additional transactions are introduced
allowing the monitoring of the packaging process
Messages are also treated individually for error handling If an error occurs in a message processed in a
package then the package will be disassembled and all messages will be processed as single messages Of
course in a case where many errors occur (for example due to interface design) this will reduce the benefits
of message packaging SAP systems connected to PI via ABAP Proxy can also make use of the message
packaging to reduce the HTTP calls necessary to transmit messages between the systems Other sending
and receiving applications in particular will not see any changes because they send and receive individual
messages and receive individual commits
The PI message packaging can be adapted to meet your specific needs In general the packaging is
determined by three parameters
SAP NETWEAVER 71 AND HIGHER PERFORMANCE CHECK GUIDE
38
1) Message count Maximum number of messages in a package (default 100)
2) Maximum package size Sum of all messages in kilobytes (default 1 MB)
3) Delay time Time to wait before the queue is processed if the number of messages does not reach
the message count (default 0 meaning no waiting time)
These values can be adjusted using transactions SXMS_BCONF and SXMS_BCM To better use the
performance improvements offered by packaging you could for example define a specific packaging for
interfaces with very small messages to allow up to 1000 messages for each package Another option could
be to increase the waiting time (only if latency is not critical) to create bigger packages
See SAP Note 1037176 - XI Runtime Message Packaging for more details about the necessary
prerequisites and configuration of message packaging More information is also available at
httphelpsapcom SAP NetWeaver SAP NetWeaver PIMobileIdM 71 SAP NetWeaver Process
Integration 71 Including Enhancement Package 1 SAP NetWeaver Process Integration Library
Function-Oriented View Process Integration Integration Engine Message Packaging
46 Prevent blocking of EO queues
In general messages for interfaces using Quality of Service Exactly Once are independent of each other In
case of an error in one message there is no business reason to stop the processing of other messages But
exactly this happens in case an EO queue goes into error due to an error in the processing of a single
message The queue will then be automatically retried in configurable intervals This retry will cause a delay
of all other messages in the queue which cannot be processed due to the error of the first message in the
queue
To avoid this a new error handling was introduced in SAP Notes 1298448 - XI runtime No automatic retry
for EO message processing (set EO_RETRY_AUTOMATIC = 0 and schedule restart job
RSXMB_RESTART_MESSAGES) and SAP Note 1393039 - XI runtime Dump stops XI queue After
applying this Note EO queues will not go in SYSFAIL status any longer These Notes are recommended for
all PI systems and are per default activated on PI 73 systems By specifying a receiver ID as sub parameter
this behavior can be configured for individual interfaces only
In PI 73 you can also configure the number of messages that would go into error before the whole queue
would be stopped For permanent errors (eg due to a problem with the receiving backend) the queue would
go into SYSFAIL so that not too many messages are going into error This also reduces the number of alerts
for Message Based Alerting To define the threshold the parameter EO_RETRY_AUT_COUNT can be set
The default value is 0 and indicates that the number of messages is not restricted
47 Avoid uneven backlogs with queue balancing
From PI 73 on a new mechanism is available to address the distribution of messages in queues Per default
in all PI versions the messages are getting assigned to the different queues randomly In case of different
runtimes of LUWs caused by eg different message sizes or different runtimes in mappings this can cause
an uneven distribution of messages within the different queues This can increase the latency of the
messages waiting at the end of that queue
To avoid such an unequal distribution the system checks the queue length before putting a new message in
the queue Hence it tries to achieve an equal balancing during inbound processing A queue which has a
higher backlog will get less new messages assigned Queues with fewer entries will get more messages
assigned Therefore it is different than the old BALANCING parameter of category TUNING) which was used
SAP NETWEAVER 71 AND HIGHER PERFORMANCE CHECK GUIDE
39
to rebalance messages already assigned to a queue The assignment of messages to queues is shown in
the diagram below
To activate the new queue balancing you have to set the parameters EO_QUEUE_BALANCING_READ and
EO_QUEUE_BALANCING_SELECT of category TUNING in SXMB_ADM If the value of the parameter
EO_QUEUE_BALANCING_READ is 0 (default value) then the messages are distributed randomly across
the queues that are available If however EO_QUEUE_BALANCING_READ is set to a value n greater than
zero then on average the current fill level of the queue is determined after every nth message and stored in
the shared memory of the application server This data is used as the basis for determining the queue (see
description of parameter EO_QUEUE_BALANCING_SELECT) relevant for balancing
The parameter EO_QUEUE_BALANCING_SELECT specifies the relative fill levels of the queues in percent
Relative here means in relation to the maximum filled queue If there are queues with a lower fill level than
defined here then only these are taken into consideration for distribution If all queues have a higher fill level
then all queues are taken into consideration
Please note that determining the fill level takes place using database access and therefore impacts system
performance The value of EO_QUEUE_BALANCING_READ should for this reason be oriented towards the
message throughput and specific requirements or even distribution For higher volume system a higher value
should be chosen
Letrsquos look at an example In case you set the parameter EO_QUEUE_BALANCING_READ to 1000 after
every 1000th incoming message the queue distribution will be checked This requires a database access
and can therefore cause a performance impact The fill level for each queue will then be written to shared
memory In our example we configured EO_QUEUE_BALANCING_SELECT to 20 At a given point in time
you have three outbound queues on the system XBTO__A contains 500 entries XBTO__B 150 and
XBTO__C contains 50 messages Therefore XBTO__B has a fill level of 30 and XBTO__C of 10 That
means the only queue relevant for balancing is XBTO__C which will get more messages assigned
Based on this example you can see that it is important to find the correct values As a general guideline to
minimize performance impact you should set EO_QUEUE_BALANCING_READ to a rather large value The
correct value of EO_QUEUE_BALANCING_SELECT depends on the criticality of a delay caused by a
backlog
SAP NETWEAVER 71 AND HIGHER PERFORMANCE CHECK GUIDE
40
48 Reduce the number of parallel EOIO queues
As discussed in Chapter Parallelization of PI qRFC Queues it is important to keep the number of queues
limited As a rule of thumb the number of active queues should be equal to the number of available work
processes in the system It is especially crucial to not have a lot of queues containing only one message
since this will cause a high overhead on the QIN scheduler due to very frequent reloading of the queues
Especially for EOIO queues we often see a high number of parallel queues containing only one message
The reason for this is for example that the serialization has to be done on document number to eg ensure
that updates to the same material are not transferred out of sequence Typically during a batch triggered
load of master data this can result in hundreds of EOIO queues in SMQ2 just containing only one or two
messages This is very bad from a performance point of view and will cause significant performance
degradation for all other interfaces running at the same time To overcome this situation the overall number
of EOIO queues (for all interfaces) can be limited as of PI 71 as described in Change Number of EOIO
Queues
The maximum number of queues can be set in SXMB_ADM Configure Filter for Queue Prioritization
Number of EOIO queues
During runtime a new set of queues will be used with the name XB2 as can be seen below for the outbound
queues
These queues will be shared between all EOIO interfaces for the given interface priority and by setting the
number of queues the parallelization for all EOIO interfaces is limited Thus more messages will be using the
same EOIO queue and therefore PI message packaging will work better and also the reloading of the
queues by the QIN scheduler will show much better performance
In case of errors the messages will be removed from the XB2 queues and will be moved to the standard
XBQ queues All other messages for the same serialization context will be moved to the XBQ queue
directly to ensure the serialization is maintained This means that in case of an error the shared EOIO
queues will not be blocked and messages for other serialization contexts will be not delayed
SAP NETWEAVER 71 AND HIGHER PERFORMANCE CHECK GUIDE
41
49 Tuning the ABAP IDoc Adapter
Very often the IDoc adapter deals with very high message volume and tuning of this is very essential
491 ABAP basis tuning
As stated above the IDoc adapter uses the tRFC layer to transfer messages from PI to the receiver system
The IDoc adapter will only put the message in SM58 and from there the standard tRFC layer forwards the
LUW You therefore have to ensure that sufficient resources (mainly DIA WPs) are available for processing
tRFC requests
Wily Introscope also offers a dashboard (shown below) for the tRFC layer which shows the tRFC entries and
their different statuses With these dashboards you are also able to identify history backlogs on tRFC
In order to control the resources used when sending the IDocs from sender system to PI or from PI to the
receiver backend you can also think about registering the RFC destinations in SMQS in PI as known from
standard ALE tuning By changing the Max Conn or the Max Runtime values in SMQS you can limit or
increase the number of DIA WPs used by the tRFC layer to send the IDocs for a given destination This will
mitigate the risk of system overload on sender and receiver side
SAP NETWEAVER 71 AND HIGHER PERFORMANCE CHECK GUIDE
42
492 Packaging on sender and receiver side
One option for improving the performance of messages processed with the IDoc adapter is to use IDoc
packaging
The receiver IDoc adapter in PI (for sending messages from PI to the receiving application system) already
had the option for packaging IDocs in previous releases For this messages processed in the IDoc adapter
are bundled together before being sent out to the receiving system Thus only one tRFC call is required to
send multiple IDocs The message packaging that is being discussed in section PI Message Packaging uses
a similar approach and therefore replaces the ldquooldrdquo packaging of IDocs in the receiver IDoc adapter
Therefore we highly recommend configuring Message Packaging since this helps transferring data for the
IDoc adapter as well as the ABAP Proxy
For the sender IDoc adapter there was previously the option to activate packaging in the partner profile of
the sending system in case IDocs are not send immediately but in batch By specifying the ldquoMaximum
Number of IDocsrdquo in the report RSEOUT00 multiple IDocs are bundled in one tRFC calls At the PI side
these packages will be disassembled by the IDoc adapter and the messages will be processed individually
Therefore this will help mainly to reduce the tRFC resources involved in transferring the data between the
systems but not within PI
This behavior was changed with SAP NetWeaver PI 711 and higher If the sender backend sends an IDoc
package to PI a new option has been introduced which allows the processing of IDocs as a package on PI
as well You can specify an IDoc package size on the sender IDoc Communication Channel The necessary
configuration is described in detail in the following SDN blog - IDoc Package Processing Using Sender IDoc
Adapter in PI EhP1 A significant increase in throughput was recorded for high volume interfaces with small
IDocs
493 Configuration of IDoc posting on receiver side
As described in SAP Note 1828282 - IDoc adapter long runtime XI -gt IDoc-gt ALE also the way the IDocs
are posted on the receiver ERP backend will directly influence the processing of the LUW on the PI side In
general two options exist for IDoc posting
Trigger immediately The IDoc will be posted directly when it is received For this a free dialog workprocess will be required
Trigger by background program If this option is chosen the IDoc is persisted on the ERP side and the posting of the application data will happen asynchronously using report RBDAPP01 via a background job
SAP NETWEAVER 71 AND HIGHER PERFORMANCE CHECK GUIDE
43
When ldquotrigger immediatelyrdquo is configured the sender system (PI) has to wait till the IDoc is posted While the
workprocess will roll out you will see the LUW in ldquoTransaction Executingrdquo during this time For the
IDOC_AAE the RFC connection and the java threads will be kept busy until the IDOC is posted in the
backend therefore leading to backlogs on the IDOC_AAE
The coding for posting the application data can be very complex and therefore this operation can take a long
time consuming unnecessary resources also on the sender side With background processing of the IDocs
the sender and receiver systems are decoupled from each other
Due to this we generally recommend to use ldquotrigger immediatelyrdquo in exceptional cases where the data has to
be posted without any delay In all other cases like high volume replication of master data background
processing of IDocs should be chosen
With Note 1793313 and 1855518 a third option for posting IDocs on the ERP side was introduced This
option is using bgRFC on the ERP side to queue the IDocs As soon as the configured resources for the
bgRFC destination are available the IDocs will be posted By doing so the IDocs will be posted based on
resource availability on the receiver system and no additional background jobs will be required Furthermore
storing the LUWs in bgRFC will ensure that the sender and receiver systems are decoupled This option
therefore guarantees that the IDocs will be posted as soon as possible based on the available resources on
the receiver system without the requirement to schedule many background jobs This new option is therefore
the recommended way of IDoc posting in systems that fulfill the necessary requirements
SAP NETWEAVER 71 AND HIGHER PERFORMANCE CHECK GUIDE
44
410 Message Prioritization on the ABAP Stack
A performance problem is often caused by an overload of the system for example due to a high volume
master interface If business critical interfaces with a maximum response time are running at the same time
then they might face delays due to a lack of resources Furthermore as described in qRFC Queues (SMQ2)
messages of different interfaces use the same inbound queue by default which means that critical and less-
critical messages are mixed up in the same queue
We highly recommend using message prioritization on the ABAP stack to prevent such delays for critical
interfaces (for Java see Interface Prioritization in the Messaging System )
For more information about PI prioritization see httphelpsapcom and navigate to SAP NetWeaver SAP
NetWeaver PIMobileIdM 71 SAP NetWeaver Process Integration 71 Including Enhancement Package 1
SAP NetWeaver Process Integration Library Function-Oriented View Process Integration
Integration Engine Prioritized Message Processing
To balance the available resources further between the configured interfaces you can also configure a
different parallelization level for queues with different priorities Details for this can be found in SAP Note
1333028 ndash Different Parallelization for HP Queues
SAP NETWEAVER 71 AND HIGHER PERFORMANCE CHECK GUIDE
45
5 ANALYZING THE BUSINESS PROCESS ENGINE (BPE)
This chapter helps to analyze performance problems if Chapter Determining the Bottleneck has shown that
the BPE is the slowest step for a message during its time in the PI system Of course this type of runtime
engine is very susceptible to inefficient design of the implemented integration process Information about
best practices for designing BPE processes can be found in the documentation Making Correct Use of
Integration Processes In general the memory and resource consumption is higher than for a simple pipeline
processing in the Integration Engine As outlined in the document linked above every message that is sent
to BPE and every message that is sent from BPE is duplicated In addition work items are created for the
integration process itself as well as for every step More database space is therefore required than
previously expected and more CPU time is needed for the additional steps
51 Work Process Overview
The Business Process Engine executes the steps (work items) of an integration process using tRFC calls to
the RFC destination WORKFLOW_LOCAL_ltclientgt To check if there are enough resources available to
process the work items call transaction SM50 (on each application server) while one of the integration
processes is running
o Look for the user ldquoWF-BATCHrdquo and follow its activities by refreshing the transaction
o Are there always dialog work processes available
The most important point to keep in mind here is the concurrent activity of the Business Process Engine (for
ccBPM processes) and the Integration Engine (for pipeline processing) Both runtime environments need
dialog work processes Thus performance problems in one of the engines cannot be solved by restricting
the other Rather an appropriate balance between the two runtimes has to be found
The activity of the WF-BATCH user is not restricted by default It is highly recommended that you register the
RFC destination WORKFLOW_LOCAL_ltclientgt with transaction SMQS and assign a suitable amount of
maximum connections Otherwise ccBPM activity may block the pipeline processing of the Integration
Server and reduce the throughput of PI drastically SAP Note 888279 - Regulatingdistributing the Workflow
Load gives more details
In addition it might help to use specific servers (dialog instances) to carry out a given workflow or to use load
balancing Of course both options only apply for larger PI systems that consist of at least a central instance
and one dialog instance
52 Duration of Integration Process Steps
As described in section Processing Time in the Business Process Engine with PI 73 there is a new monitor
available in ldquoConfiguration and Monitoring Homerdquo on PI start page It shows the duration of individual steps
of an integration process in a very easy way and is the now tool to analyze performance related issues on
the ccBPM
SAP NETWEAVER 71 AND HIGHER PERFORMANCE CHECK GUIDE
46
For releases prior than PI 73 check in the workflow log for long-running steps as described in the previous
chapter Use the ldquoList with Technical Detailsrdquo to do so Since the design of integration processes varies
significantly there is no general rule for the duration of a step or for specific sequences of steps Instead
you have to get a feeling for your implemented integration processes
Did a specific process step decrease in performance over a period of time
Does one specific process step stick out with regard to the other steps of the same integration process
Do you observe long durations for a transformation step (ldquomappingrdquo)
Do you observe long durations of synchronous sendreceive steps in the integration process which correlates for example to a slow response from a connected remote system
Use the SAP Notes database to learn about recommendations and hints SAP Note 857530 - BPE
Composite Note Regarding Performance acts as a central note for all performance notes and might be used
as the entry point
Once you are able to answer the above questions there are several paths to follow
o Two common reasons should be taken into consideration for a performance decrease over time Firstly the load on PI might have increased over time as well Check the hardware resources (chapter 9) and carefully monitor the work process availability (chapter 51) Alternatively the underlying databases might slow down the integration processes Use chapter 54 to check this possibility
o If it is a specific process step that sticks out the process design itself has to be reviewed The SAP Notes mentioned above might help here
o If the mapping step takes a long time it is worth having a look at chapter 442 since the BPE and the IE use the same resources (mapping connections from the ABAP gateway to the J2EE server) to execute their mapping
o If there is a long processing time for a synchronous sendreceive step check the connected backend system for any performance issues
SAP NETWEAVER 71 AND HIGHER PERFORMANCE CHECK GUIDE
47
53 Advanced Analysis Load Created by the Business Process Engine (ST03N)
Since the Business Process Engine runs on the ABAP part of the PI Integration Server you can use the
statistical data written by the dialog work processes to analyze a performance problem
Procedure
Log in to your Integration Server and call transaction ST03N Switch to ldquoExpert Moderdquo and choose the
appropriate timeframe (this could be the ldquoLast Minutersquos Loadrdquo from the Detailed Analysis menu or a specific
day or week from the Workload menu) In the Analysis View navigate to User and Settlement Statistics and
then to User Profile The user you are interested in is the WF-BATCH user who does all ccBPM-related work
Compare the total CPU Time (in seconds) to the time frame (in seconds) of the analysis In the above example an analysis time frame of 1 hour has been chosen which corresponds to 3600 seconds To be exact these 3600 seconds have to be multiplied by the number of available CPUs Out of these 3600CPU seconds the WF-BATCH user used up 36 seconds
o The above value gives you a good idea of how much load the Business Process Engine creates on your PI Integration Server By comparison with the other users (as well as the CPU utilization from transaction ST06) you can determine if the Integration Server is able to handle this load with the available number of CPUs or not This does not help you to optimize the load but it does provide support when deciding how to distribute the workload of the BPE and the workload of the Integration Server (see Chapter 51)
Experienced ABAP administrators should also analyze the database time wait time and compare these values
54 Database Reorganization
The database is accessed many times during the processing of an Integration Process This is not usually
connected with performance problems but if a specific database table is large then statements may take
longer than for small database tables
Use transaction ST05 to collect a SQL trace while the integration process in question is being executed Restrict the trace to user WF-BATCH When the integration process is finished stop the trace and view it Look for high values in the duration column especially for SELECT statements
Use transaction SE16 to determine the number of entries for the typical workflow tables SWW_WI2OBJ and SWFRXI There are many more database tables used by BPE but if the number of entries is high for the above tables they are high for the rest as well See SAP Note 872388 - Troubleshooting Archiving and Deletion in XI and the links given in this note if you find high amounts of entries
SAP NETWEAVER 71 AND HIGHER PERFORMANCE CHECK GUIDE
48
55 Queuing and ccBPM (or increasing Parallelism for ccBPM Processes)
Until recently ccBPM processes accepted messages from only one queue (one queue XBQO$PEWS for
each workflow) If there was a high message throughput for this workflow then a high backlog occurred for
these queues A couple of enhancements have therefore been implemented to improve scalability if the
ccBPM runtime
o Inbound processing without buffering
o Use of one configurable queue that can be prioritized or assigned to a dedicated server
o Use of multiple inbound queues (queue name will be XBPE_WS)
o Configure transactional behavior of ccBPM process steps to reduce number of persistency steps
Details about the configuration and tuning of the ccBPM runtime are described at
httpswwwsdnsapcomirjsdnhowtoguides SAP Netweaver 70 End-to-End Process Integration
o How to Configure Inbound Processing in ccBPM Part I Delivery Mode
o How to Configure Inbound Processing in ccBPM Part II Queue Assignment
o How to Configure ccBPM Runtime Part III Transactional Behavior of an Integration Process
Procedure
Use transaction SMQ2 to check if the queues of type XBQO$PE show a high backlog
o Based on this information verify if the ccBPM process is suitable to run with multiple queues This is especially the case for collect patterns realized in BPE If you can use multiple queues configure the workflow based on the above guides
56 Message Packaging in BPE
Inbound processing takes up the most amount of processing time in many scenarios within BPE
Message packaging in BPE helps to improve performance by delivering multiple messages to BPE process
instances in one transaction This can lead to an increased throughput which means that the number of
messages that can be processed in a specific amount of time can increase significantly Message packaging
can also increase the runtime for individual messages (latency) due to the delay in the packaging process
The sending of packages can be triggered when the packages exceed a certain number of messages a
specific package size (in kB) or a maximum waiting time The extent of the performance improvement that
can be obtained depends on the type of scenario Scenarios with the following prerequisites are generally
most suitable
o Many messages are received for each process instance
o Messages that are sent to a process instance arrive together in a short period of time
o Generally high load on the process type
o Messages do not have to be delivered immediately
For example collect scenarios are particularly suitable for message packaging The higher the number of
messages is in a package the higher the potential performance improvements will be
Tests that have been performed have shown a high potential for throughput improvements up to factor 47 in
tested Collect Scenarios depending on the packaging size that has been configured For more details about
the functionality of Message Packaging in BPE and its configuration see SAP Note 1058623 - BPE
Message Packaging
SAP NETWEAVER 71 AND HIGHER PERFORMANCE CHECK GUIDE
49
Message packaging in BPE is independent of message packaging in PI (see Chapter 45) but they can be
used together
SAP NETWEAVER 71 AND HIGHER PERFORMANCE CHECK GUIDE
50
6 ANALYZING THE (ADVANCED) ADAPTER ENGINE
This chapter describes further checks and possible reasons for bottlenecks in the (Advanced) Adapter
Engine Although this is not the place to describe the architecture of the Adapter Framework in detail the
following aspects are important to know for the analysis of a performance problem on the AFW
o The AFW contains the Messaging System that is responsible for the persistence and queuing of messages Within the flow of a message it is placed in between the sender adapter (for example a file adapter that polls from a folder) and the Integration Server as well as between the Integration Server and the receiver adapter (for example a JMS adapter that sends a message out to an external system)
o The Messaging System uses 4 queues for each adapter type and these are responsible for receiving and sending messages To separate the message transfer each adapter (for example JMS SOAP JDBC and so on) has its own set of queues One queue for receiving synchronous messages (Request queue) one queue for sending synchronous messages (Call queue) one queue for receiving asynchronous messages (Receive queue) and one queue for sending asynchronous messages (Send queue) The name of the queue always states the adapter type and the queue name (for example JMS_httpsapcomxiXISystemReceive for the JMS receiver asynchronous queues)
o A configurable number of consumer threads are assigned on each queue These threads work on the queue in parallel meaning that the Messaging Queues are not strictly FirstIn-FirstOut Five threads are assigned by default to each queue and thus five messages can be processed in parallel But as will be discussed later the parallel execution of requests to the backend depends heavily on the adapter being used since not every adapter can work in parallel by default
o SAP NetWeaver PI 71 introduced a new queue The dispatcher queue The dispatcher queue is used to realize prioritization on the AAE (see chapter Prioritization in the Messaging System) Every message in the PI system is first assigned to the dispatcher queue before it is assigned to the adapter-specific queues
Viewed from the perspective of a message that enters the PI system using a J2EE Engine adapter (for
example File) and leaves the PI system using a J2EE Engine adapter (for example JDBC) asynchronously
the steps are as follows
1) Enter the sender adapter
2) Put into the dispatcher queue of the messaging system
3) Forwarded to the File send queue of the messaging system (based on Interface priority)
4) Retrieved from the send queue by a consumer thread
5) Sent from the messaging system to the pipeline of the ABAP Integration Engine (if no Integrated Configuration (AAE) is used
6) Processed by the pipeline steps of the Integration Engine
7) Sent to the messaging system by the Integration Engine
8) Put into the dispatcher queue of the messaging system
9) Forwarded to the JDBC receive queue of the messaging system (based on Interface priority)
10) Retrieved from the receive queue (based on the maxReceivers)
11) Sent to the receiver adapter
12) Sent to the final receiver
SAP NETWEAVER 71 AND HIGHER PERFORMANCE CHECK GUIDE
51
All the analysis is based on the information provided in the Audit Log With SAP NetWeaver PI 71 the audit
log is not persisted for successful messages in the database by default to avoid performance overhead
Therefore the audit log is only available in the cache for a limited period of time (based on the overall
message volume) More details can be found in chapter Persistence of Audit Log information in PI 710 and
higher
As described in chapter Adapter Engine Performance monitor in PI 731 and higher a new performance
monitor is available from PI 731 SP4 With this monitor you can display the processing time per interface in
a given interval and identify the processing steps in which a lot of time is spend
With 731 SP10 and 74 SP5 a download functionality for the performance monitor is provided as described
in SAP Note 1886761
61 Adapter Performance Problem
Compared to a bottleneck in the Messaging System it is relatively easy to detect a performance
problembottleneck in the adapter Since the timestamps for inbound and outbound messages are written at
different points in time the procedure is described separately for sender and receiver adapters
Note It is not generally possible for all sender and receiver adapters to work in parallel (discussed in section
Adapter Parallelism)
611 Adapter Parallelism
As mentioned before not all adapters are able to handle requests in parallel Thus increasing the number of
threads working on a queue in the messaging system will not solve a performance problembottleneck
There are 3 strategies to work around these restrictions
1) Create additional communication channels with a different name and adjust the respective senderreceiver agreements to use them in parallel
2) Add a second server node that will automatically have the same adapters and communication channel running as the first server node This does not work for polling sender adapters (File JDBC or Mail) since the adapter framework scheduler assigns only one server node to a polling communication channel
3) Install and use a non-central Adapter Framework for performance-critical interfaces to achieve better separation of interfaces
SAP NETWEAVER 71 AND HIGHER PERFORMANCE CHECK GUIDE
52
Some of the most frequently-used adapters and the possible options are discussed below
o Polling Adapters (JDBC Mail File)
At the sender side these adapters use an Adapter Framework Scheduler which assigns a server node that does the polling at the specified interval Thus only one server node in the J2EE cluster does the polling and no parallelization can be achieved Therefore scaling via additional server node is not possible More details will be presented in section Adapter Framework Scheduler For example since the channels are doing the same SELECT statement on the database or pick up files with the same file name parallel processing will only result in locking problems To increase the throughput for such interfaces the polling interval has to be reduced to avoid a big backlog of data that is to be polled If the volume is still too high you should think about creating a second interface for example the new interface would poll the data from a different directory or database table to avoid locking
At the receiver side the adapters work sequentially on each server node by default For example only one UPDATE statement can be executed for JDBC for each Communication Channel (independent of the number of consumer threads configured in the Messaging System) and all the other messages for the same Communication Channel will wait until the first one is finished This is done to avoid blocking situations on the remote database On the other hand this can cause blocking situations for whole adapters as discussed in section Avoid Blocking Caused by Single SlowHanging Receiver Interface
To allow better throughput for these adapters you can configure the degree of parallelism at the receiver side In the Processing tab of the Communication Channel in the field ldquoMaximum Concurrencyrdquo enter the number of messages to be processed in parallel by the receiver channel For example if you enter the value 2 then two messages are processed in parallel on one J2EE server node The parallel execution of these statements at database level of course depends on the nature of the statements and the isolation level defined on the database If all statements update the same database record database locking will occur and no parallelization can be achieved
o JMS Adapter
The JMS adapter is per default using a push mechanism on the PI sender side This means the data is pushed by the sending MQ provider Per default every Communication channel has one JMS connection established per J2EE server node On each connection it processes one message after the other so that the processing is sequential Since there is one connection per server node scaling via additional server nodes is an option
With Note 1502046 - JMS Adapter message pull mechanism the JMS protocol can be changed to use a pull mechanism By doing so you can specify a polling interval in the PI Communication Channel and PI will be the initiator of the communication Also here the Adapter Framework Scheduler is used which implies sequential processing But in contrary to JDBC or File sender channels the JMS polling sender channel will allow parallel processing on all server nodes of the J2EE cluster Therefore scaling via additional J2EE server nodes is an option
The JMS receiver side supports parallel operation out of the box Only some small parts during message processing (pure sending of the message to the JMS provider) are synchronized Therefore to enable parallel processing on the JMS receiver side no actions are necessary
o SOAP Adapter
The SOAP adapter is able to process requests in parallel The SOAP sender side has in general no limitations in the number of requests it can execute in parallel The limiting factor here is the FCAThreads available to process the incoming HTTP calls This is discussed in more detail in chapter Tuning SOAP sender adapter On the receiver side the parallelism depends on the number of the threads defined in the messaging system and the ability of the receiving system to cope with the load
SAP NETWEAVER 71 AND HIGHER PERFORMANCE CHECK GUIDE
53
o RFC Adapter
The RFC adapter offers parameters to adjust the degree of parallelism by defining the number of initial and maximum connections to be used The initial threads are allocated from the Application thread pool directly and are therefore not available for any other tasks Therefore the number of initial thread should be kept minimal To avoid bottlenecks during the peak time the maximum connections can be used A bottleneck is indicated by the following exception in the Audit Log
comsapaiiaframsapiDeliveryException error while processing message to remote systemcomsapaiiafrfccoreclientRfcClientException resource error could not get a client from JCOPool comsapmwjcoJCO$Exception (106) JCO_ERROR_RESOURCE Connection pool RfcClient hellip is exhausted The current pool size limit (max connections) is 1 connections
Also this should be done carefully since these threads will be taken from the J2EE application thread pool Therefore a very high value there can cause a bottleneck on the J2EE engine and therefore cause a major instability of the system As per RFC adapter online help the maximum number of connections are restricted to 50
o IDoc_AAE Adapter
The IDoc adapter on Java (IDoc_AAE) was introduced with PI 73 On the sender side the parallelization depends on the configuration mode chosen In Manual Mode the adapter works sequential per server node For channels in ldquoDefault Moderdquo it depends on the configuration of the inbound Resource Adapter (RA) Via the parameter MaxReaderThreadCount of the inbound RA you can configure how many threads are globally available for all IDoc adapters running in Default Mode Hence this determines the overall parallelization of the IDoc sender adapter per Java server node Currently the recommended maximum number of threads is 10
The receiver side of the Java IDoc adapter is working parallel per default
The table below gives a summary of the parallelism for the different adapter types
SAP NETWEAVER 71 AND HIGHER PERFORMANCE CHECK GUIDE
54
612 Sender Adapter
The first step(s) to be taken for a sender adapter depend on the type of adapter itself Afterwards however
the message flow is always the same First the message is processed in the Module Processor and
afterwards put into the queue of the Messaging System If the message is synchronous then it is the call
queue if the message is asynchronous that it is the send queue The final action of the Adapter Framework
is then to send the message from the messaging system to the Integration Server (for Non ICO interfaces)
Only the first entries of the audit log are of interest to establish if the sender adapter has a performance
problem From the first entry to the entry ldquoMessage successfully put into the queuerdquo These steps logically
belong to the sender adapter and the Module Processor while the subsequent steps belong to the
Messaging System The sender adapter uses one J2EE Engine application thread to execute its work This
is generally the same thread for all steps involved
Select the ldquoDetailsrdquo of a message in the AFW The first entry of the audit log will be the beginning of the activity of the sender adapter The end of the adapterrsquos activity is marked by the entry ldquoThe application sent the message asynchronously using connection Returning to applicationrdquo
6121 Tuning SOAP sender adapter As described above in general there is no limitation in the parallelization of the SOAP sender adapter itself
The incoming SOAP requests are limited by the available FCA Threads for HTTP processing The FCA
Threads are discussed in more detail in FCA Server Threads
Per default all interfaces using the SOAP adapter are using the same set of FCA Threads since they are all
using the same URL httplthostgtltportgtMessageServlet In case one interface is facing a very high load or
slow backend connections this can cause a blockage of the available FCA Threads and could cause a heavy
impact on the processing time of other interfaces
To avoid this SAP Note 1903431 allows the usage of different URLs for specific interfaces This way you
could isolate interfaces with a very high volume on a dedicated entry point using its own set of FCA Threads
In case of high load for this interface the other SOAP sender interfaces would not be affected by a shortage
of FCA Threads
SAP NETWEAVER 71 AND HIGHER PERFORMANCE CHECK GUIDE
55
To use this new feature you can specify on the sender system the following two entry points
o MessageServletInternal
o MessageServletExternal
More information about the URL of the SOAP adapter can be found here
613 Receiver Adapter
For a receiver adapter it is just the other way around when compared to the sender adapter First the
message is received from the Integration Server and then put into a queue of the Messaging System this
time either the request or the receive queue for asynchronous and the request queue for synchronous
messages The last step is then the activity of the receiver adapter itself
Select the ldquoDetailsrdquo of a message in the AFW The adapter activity starts after the entry ldquoThe message status set to DLNGrdquo The message will then be forwarded to the entry point of the AFW ldquoDelivering to channel ltchannel_namegtrdquo enters the Module Processor ldquoMP Entering Module Processorrdquo and ends with ldquoThe message was successfully delivered to the application using connection rdquo
Depending on the type of the adapter you now have to investigate why the receiver adapter needs a high amount of processing time This could be a complicated operating system command a bad network connection or a slow backend system among many other reasons
Here too custom modules can be the reason for a prolonged processing time Check Performance of Module Processing for more details
Note From 71 the audit log is not persisted any longer for performance reasons as described in Persistence of Audit Log information in PI 710 and higher
SAP NETWEAVER 71 AND HIGHER PERFORMANCE CHECK GUIDE
56
614 IDoc_AAE adapter tuning
A comprehensive and up-to date description about the tuning of the IDoc adapter is summarized in Note
1641541 - IDoc_AAE Adapter performance tuning Please refer to this Note for details
Similar to all other adapters running on the Adapter Engine also the IDOC_AAE adapter is using the Messaging System queues and the explanations of the next chapter Messaging System Bottleneck are also valid for the IDOC_AAE adapter Note that the IDOC_AAE adapter only supports async Scenarios ndash so it is only using the ldquoSendrdquo queue in Java-only scenarios and the ldquoSendrdquo and ldquoReceiverdquo queue in dual-stack scenariosrdquo
For the IDoc_AAE sender you can configure in addition bulk support as indicated in the screenshot below By doing so all messages received by PI in one RFC call from ERP will be processed as one message This is similar to the mechanism of the ABAP IDoc adapter described in the chapter Packaging on sender and receiver side except with the difference that the number of messages in one bulk cannot be further limited
It is also essential to ensure that the size of the IDocs or IDoc packages for sender or receiver IDocs is not
getting too large to avoid any negative impact on the Java heap memory and Garbage Collection In the
case of the IDoc_AAE adapter the XML size of the IDoc is less critical it is the number of segments in an
IDoc or the overall number of segments in all IDocs of an IDoc package that will influence the memory
allocation during message processing Based on the current implementation per IDoc segment around 5 KB
of memory during processing is required A package of 5 IDocs with 2000 segments for each IDoc would
consume roughly 500 MB during processing In such cases it is important to eg lower the package size
andor use large message queues as outlined in chapter Large message queues on PI Adapter Engine
615 Packaging for Proxy (SOAP in XI 30 protocol) and Java IDoc adapter
Due to message packaging in the Integration Engine (see PI Message Packaging for Integration Engine) the
ABAP based IDoc and Proxy adapter was always using packaging when sending asynchronous messages
to the receiver system With PI 731 packaging was also introduced for Java based IDoc and Proxy (SOAP in
XI 30 protocol) adapter The aim of packaging is to achieve similar benefits to packaging already existing in
ABAP pipeline
o Less calls to backend consuming less parallel Dialog Work Processes on the receiver
o Less overhead due to context switches authentication when calling the backend
Especially for high volume interfaces packaging should be enabled to avoid overloading of the backend
systems and impact on users operating on the system
SAP NETWEAVER 71 AND HIGHER PERFORMANCE CHECK GUIDE
57
Important
In the ABAP stack the packaging is active per default (in 71 and higher) as described in chapter PI
Message Packaging for Integration Engine Experience shows that packaging can have a very high impact
on the DIA Work process usage on the ERP receiver side Especially for migration projects from dual-stack
PI to AEXPO it is important to evaluate packaging to avoid any negative impact on the receiving ECC due
to missing packaging
The packaging on Java works in general different then on ABAP While in ABAP the aggregation is done on
the individual qRFC queue level (which always contains messages to one receiver system only) this is not
possible on the Adapter Engine since messages for all receivers are located in the same queue Therefore
packages are built outside of the Adapter Engine queues The messages to be packaged will be forwarded
to a bulk handler which waits till either the time for the package is exceeded or the number of messages or
data size is reached After this the message is send by a bulk thread to the receiving backend system
Packaging on Java is always done for a server node individually If you have a high number of server nodes
packaging will work less efficiently due to the load balancing of messages across the available server nodes
When enabling message packaging the message status will stay in status ldquoDeliveringrdquo throughout all steps
described above In the audit log you can see the time it spends in packaging The audit log shown below
shows eg that the message was almost waiting one minute before the package was built and 9 IDocs were
sent with this package
Packaging can be enabled globally by setting the following parameters in Messaging System service as
described in Note 1913972
o messagingsystemmsgcollectorenabled Enable packaging or disable it globally
o messagingsystemmsgcollectormaxMemPerBulk The maximum size of a bulk message
o messagingsystemmsgcollectorbulkTimeout The wait time per bulk - default 60 seconds
o messagingsystemmsgcollectormaxMemTotal Maximum memory which can be used by message collector
o messagingsystemmsgcollectorpoolSize Number of parallel threads used to send out packages to the backend This value has to be tuned based on the general performance of the receiver system the network latency between the systems or the configuration of the IDoc posting on the ERP sender side (described in chapter IDoc posting on receiver side) Therefore tuning of these threads might be very important These threads can unfortunately not be monitored yet with any PI tool or Wily
SAP NETWEAVER 71 AND HIGHER PERFORMANCE CHECK GUIDE
58
Introscope To verify that not all packaging threads are in use you can use the Thread monitoring in the SAP Management Console and check for threads named ldquoBULK_EXECUTORrdquo as shown below
If you would like to adapt the packaging for specific communication channel this can also be done using the
configuration options in the Integration Directory
While in the SOAP adapter in XI 30 protocol you can define three different packaging KPIs this is currently
not possible for the IDoc adapter There you can only specify the package size based on number of
messages
616 Adapter Framework Scheduler
For polling adapters like File JDBC and JMS the Adapter Framework Scheduler determines on which server
node the polling takes place Per default a File or JDBC sender only works on one server node and the
Adapter Framework (AFW) Scheduler determines on which one the job is scheduled
The Adapter Frameworks scheduler had several performance and reliability issues in a cluster environment
especially in systems having many Java server nodes and many polling communication channels Based on
this and the symptoms described in Note 1355715 - AF Scheduler to avoid using cluster communication a
new scheduler was released We highly recommend using the new version of the AFW scheduler To
activate the new scheduler you have to set the parameter schedulerrelocMode of the Adapter framework
SAP NETWEAVER 71 AND HIGHER PERFORMANCE CHECK GUIDE
59
service property to some negative value For instance by setting the value to -15 after every 15th polling
interval a rebalancing of the channel within the J2EE cluster might happen This can allow for better
balancing of the incoming load across the available server nodes if the files are coming in on regular
intervals The balancing is achieved by doing a servlet call Based on the HTTP load balancing the channel
might then be dispatched to another server node To avoid the balancing overhead this value should not be
set too low A value between -10 and -15 should be acceptable in most cases For very short polling intervals
(eg every second) even lower values (eg -50) can be configured
In case many files are put at one given time on the directory (by eg using a batch process) all these files will
be processed by one polling process only Hence a proper load balancing cannot be achieved by the AFW
scheduler In such a case the only option is to use write the files with different names or different directories
so that you can configure multiple sender channels to pick up the files
Starting from PI 731 you can monitor the Adapter Framework Scheduler in pimon Monitoring
Background Job Processing Monitor Adapter Framework Scheduler Jobs There you can check on which
server node the Communication Channel is polling (Status=rdquoActiverdquo) Also you can see the time the channel
was polling the last time and will poll next time
You cannot influence the server node on which the channel is polling This is determined via the AFW
scheduler You can only influence the frequency after which a channel can potentially move to another
server node by tuning the parameter relocMode as outlined above
Prior to PI 731 you have to use the following URL to monitor the Adapter Framework Scheduler
httpserverportAdapterFrameworkschedulerschedulerjsp
Above you see an example of a File sender channel The type value determines if the channel runs only on
one server node (type = L (local)) or on all server nodes (Type = G (global)) The time in the brackets
[60000] determines the polling interval in ms ndash in this case 60 seconds The Status column shows the
status of the channel
o ldquoONrdquo Currently polling
o ldquoonrdquo Currently waiting for the next polling
SAP NETWEAVER 71 AND HIGHER PERFORMANCE CHECK GUIDE
60
o ldquooffrdquo not scheduled any longer (eg channel deactivated or scheduled on another server node)
62 Messaging System Bottleneck
As described earlier the Messaging System is responsible for persisting and queuing messages that come
from any sender adapter and go to the Integration Server pipeline or Java only interfaces (ICO) or that come
from the Integration Server pipeline and go to any receiver adapter The time difference between receiving
the message from the one side and delivering it to the other side is the value that can be used to analyze
bottlenecks in the Messaging System The following chapters describe how to determine the time difference
for both directions
A bottleneck (or rather a ldquofakerdquo bottleneck) in the Messaging System can usually be closely connected with a
performance problem in the receiver adapter You must therefore make sure you execute the check
described in chapter 613 If the receiver adapter needs a lot of time to process messages then of course
the messages get queued in the messaging system and remain there for a long time since the adapter is not
ready to process the next one yet It looks like the messaging system is not fast enough but actually the
receiver adapter is the limiting factor
Execute the checks described in chapter 621 and 622 to get an overview of the situation you should do this for multiple messages
Decide if a specific receiver adapter is causing long waiting times in the messaging system by executing the check described in chapter 613 An additional hint at a receiver adapter problem is if only messages to specific receivers show a long wait time in the queue
Use the queue monitoring in the Runtime Workbench (RWB) to analyze how many threads are active for each of the queue types and how large the queue size currently is To do so choose Component Monitoring Adapter Engine Press the Engine Status button and choose tab ldquoAdditional Datardquo This will open the page below showing the number of messages in a queue the threads currently working and the maximum available threads Note This view only shows the Messaging System of one J2EE server node To get the whole picture you have to check all the server nodes that are available in your system via the drop down list box
SAP NETWEAVER 71 AND HIGHER PERFORMANCE CHECK GUIDE
61
o Since checking all the server nodes with this browser frontend can be very tedious it is better to use Wily Introscope since it allows easy graphical analysis of the queues and thread usage of the messaging system across Java server nodes
The starting point in Wily Introscope is usually the PI triage showing all the backlogs in the queue In the screenshot below a backlog in the dispatcher queue (for 71 and higher only) can be seen
The dispatcher queue is not the problem here since it will forward messages to the adapter queue if any free
threads are available on the adapter specific consumer threads The analysis must start in the PI inbound
queues By using the navigation button in the upper right corner of the inbound queue size you can directly
jump to a more detailed view where you can see that the file adapter was causing the backlog
SAP NETWEAVER 71 AND HIGHER PERFORMANCE CHECK GUIDE
62
To see the consumer thread usage you can then follow the link to the file adapter In the screenshot below
you can see that all consumer threads were exceeded during the time of the backlog Thus increasing the
number of consumer threads could be a solution if the resulting delay is not acceptable for business
o If it is obvious that the messaging system does not have enough resources as in the case above increase the number of consumers for the queue in question Use the results of the previous check to decide which adapter queues need more consumers
The adapter specific queues in the messaging system have to be configured in the NWA using
service ldquoXPI Service AF Corerdquo and property messagingconnectionDefinition The default
values for the sending and receiving consumer threads are set as follows
(name=global messageListener=localejbsAFWListener exceptionListener=
localejbsAFWListener pollInterval=60000 pollAttempts=60
SendmaxConsumers=5 RecvmaxConsumers=5 CallmaxConsumers=5
RqstmaxConsumers=5)
To set individual values for a specific adapter type you have to add a new property set to the default set with the name of the respective adapter type for example
(name=JMS_httpsapcomxiXISystem
messageListener=localejbsAFWListener
exceptionListener=localejbsAFWListener pollInterval=60000
pollAttempts=60 SendmaxConsumers=7 RecvmaxConsumers=7
CallmaxConsumers=7 RqstmaxConsumers=7)
The name of the adapter specific queue is based on the pattern ltadapter_namegt_ ltnamespacegt for
example RFC_httpsapcomxiXISystem
Note that you must not change parameters such as pollInterval and pollAttempts For more details see SAP Note 791655 - Documentation of the XI Messaging System Service Properties
o Not all adapters use the parameter above Some special adapters like CIDX RNIF or Java Proxy can be changed by using the service ldquoXPI Service Messaging Systemrdquo and property messagingconnectionParams by adding the relevant lines for the adapter in question as described above
o A performance problem on the Messaging System can also be caused by a high logging as described in chapter Logging Staging on the AAE (PI 73 and higher)
o Important Make sure that your system is able to handle the additional threads that is monitor the CPU usage and application thread availability as well as the memory of the J2EE Engine after you have applied the change
SAP NETWEAVER 71 AND HIGHER PERFORMANCE CHECK GUIDE
63
o Important Keep in mind that not all adapters are able to handle requests in parallel even if you assign more threads on the Messaging System queues In such a case adding additional threads will not speed up processing significantly See chapter Adapter Parallelism for details
o A backlog of messages in the messaging system is highly critical for synchronous scenarios due to timeouts that might occur Therefore the number of synchronous threads always has to be tuned so that no bottleneck occurs Often a backlog in synchronous queues is caused due to bad performance on the receiving backend system
o More information is provided in the blog Tuning the PI Messaging System Queues
621 Messaging System in between AFW Sender Adapter and Integration Server (Outbound)
Open the Audit Log of a message and look for the following entry ldquoThe message was successfully retrieved
from the send queuerdquo Note that the queue name would be ldquoCall Queuerdquo if the message was synchronous
To determine how long the message waited to be picked up from the queue compare the timestamp of the
above entry with the timestamp for the step ldquoMessage successfully put into the queuerdquo A large time
difference between those two timestamps would therefore indicate a bottleneck for consumer threads on the
sender queues in the Messaging System
Instead of checking the latency of single messages we recommend using Wily Introscope to monitor the
queue behavior as shown above
Asynchronous messages only use one thread for processing in the messaging system Multiple threads are
used for synchronous messages The adapter thread puts the message into the messaging system queue
and will wait till the messaging system delivers the response The adapter thread is therefore not available
for other tasks until the response is returned A consumer thread on the call queue sends the message to the
Integration Engine The response will be received by a third thread (consumer thread of send queue) which
correlates the response with the original request After this the initiating adapter thread will be notified to
send the response to the original sender system This correlation can be seen in the audit log of the
synchronous message below
SAP NETWEAVER 71 AND HIGHER PERFORMANCE CHECK GUIDE
64
622 Messaging System in Between Integration Server and AFW Receiver Adapter (Inbound)
Open the Audit Log of a message and look for the following entry ldquoMessage successfully put into the
queuerdquo Compare this timestamp with the timestamp for the step ldquoThe message was successfully retrieved
from the receive queuerdquo The time difference between these two timestamps is the time that the message
waited in the messaging system for a free consumer thread A large time difference between those two
timestamps indicates a bottleneck in the adapter specific inbound queues of the Messaging System
623 Interface Prioritization in the Messaging System
SAP NetWeaver PI 71 and higher offers the possibility for prioritization of interfaces similar to the ABAP
stack This feature is especially helpful if high volume interfaces run at the same time with business critical
interfaces To minimize the delay for critical messages the Messaging System now makes it possible for you
to define high medium and low priority processing at interface level Based on the priority the Dispatcher
Queue of the messaging system (which will be the first entry point for all messages) will forward the
messages to the standard adapter-specific queues The priority assigned to an interface determines the
number of messages that are forwarded once the adapter-specific queues have free consumer threads
available This is done based on a weighting of the messages to be reloaded The weights for the different
priorities are as follows High 75 Medium 20 Low 5
Based on this approach you can ensure that more resources can be used for high priority interfaces The
screenshot below shows the UI for message prioritization available in pimon Configuration and
Administration Message Prioritization
SAP NETWEAVER 71 AND HIGHER PERFORMANCE CHECK GUIDE
65
The number of messages per priority can be seen in a dashboard in Wily as shown below
You can find more details on configuring usage prioritization within the AAE at SAP Online Help navigate to
SAP NetWeaver SAP NetWeaver PI SAP NetWeaver Process Integration 71 Including Enhancement
Package 1 SAP NetWeaver Process Integration Library Function-Oriented View Process Integration
Process Integration Monitoring Component Monitoring Prioritizing the Processing of Messages
624 Avoid Blocking Caused by Single SlowHanging Receiver Interface
As already discussed above some receiver adapters process messages sequentially on one server node by
default This is independent of the number of consumer threads defined for the corresponding receiver
queue in the messaging system For example even though you have configured 20 threads for the JDBC
Receiver one Communication Channel will only be able to send one request to the remote database at a
given time If there are many messages for the same interface all of them will get a thread from the
messaging system but will be blocked when performing the adapter call
In the case of a slow message transmission for example for EDI interfaces using ISDN technology or
remote system with small network bandwidth this behavior can cause a ldquohangingrdquo situation for a specific
adapter since one interface can block all messaging threads As a result all the other interfaces will not get
any resources and will be blocked
SAP NETWEAVER 71 AND HIGHER PERFORMANCE CHECK GUIDE
66
Based on this a parameter messagingsystemqueueParallelismmaxReceivers was introduced which can
be set in NWA in service XPI Service Messaging System With this parameter you can restrict the maximum
number of receiver consumer threads that can be used by one interface In older releases (lower 731 SP11
and 74 SP6) this is a global parameter at the moment that affects all adapters It should therefore not be set
too restrictively If you need high parallel throughput one option is to set the maxReceiver parameter to 5 (so
that each interface can use 5 consumer threads for each server node) and increase the overall number of
threads on the receive queue for the adapter in question (for example JDBC) to 20 With this configuration it
will be possible for four interfaces to get resources in parallel before all threads are blocked For more
information see Note 1136790 - Blocking Receiver Channel May Affect the Whole Adapter Type and SDN
blog Tuning the PI Messaging System Queues
In the screenshot below you see the impact of maxReceivers parameter when a backlog for one interface
occurs Even though there are more free SOAP threads available they are not consumed Hence the free
SOAP threads could be assigned to other interfaces running in parallel
This parameter has a direct impact on the queue where message backlogs occur As mentioned earlier
usually a backlog should occur on the Dispatcher queue only since it is responsible to dispatch threads only
if there are free consumer threads in the adapter specific queue When setting maxReceiver you restrict the
threads per interface and this means that less consumer threads are blocked When one interface is facing a
high backlog there will always be free consumer threads and therefore the dispatcher queue can dispatch
the message to the adapter specific queue Hence the backlog will appear in the adapter specific queue so
that the message prioritization would not work properly any longer
SAP NETWEAVER 71 AND HIGHER PERFORMANCE CHECK GUIDE
67
Per default the maxReceiver parameter is only relevant for asynchronous message processing (ICo and
classical dual-stack scenarios) The reason here is that a wait time for synchronous scenarios should be
avoided by all means and therefore additional restrictions in the number of available threads can be very
critical Therefore it is usually advisable to not limit the threads per interface but increase the overall number
of available threads In case you have many high volume synchronous scenarios with different priority that
run in parallel it might be advisable to limit the threads each interface can use To do so you have to set the
parameter messagingsystemqueueParallelismqueueTypes to Recv ICoAll as described in SAP Note
1493502 - Max Receiver Parameter for Integrated Configurations
Enhancement with 731 SP11 and 74 SP6
With Note 1916598 - NF Receiver Parallelism per Interface an enhancement was introduced that allows
the specification of the maximum parallelization on more granular level This new feature has to be activated
by setting the parameter messagingsystemqueueParallelismperInterface to true Using a configuration UI
you can specify rules to determine the parallelization for all interfaces of a given receiver service If no rule
for a given interface is specified the global maxReceivers value will be considered If the receiver service
corresponds to a technical business system this configuration would help to restrict the parallel requests
from PI to that system This also works across protocols so that eg it could be used to restrict the number of
parallel requests using Proxy or IDoc to the same ERP receiver system Below you can find a screenshot of
the configuration UI in NWA SOA Monitoring
With the improvement mentioned above also the dispatching mechanism in the dispatcher queue is
changed so that it is aware of the maxReceiver settings This means that now again the backlog will now be
placed in the dispatcher queue and the prioritization will work properly
625 Overhead based on interface pattern being used
Also the interface pattern configured can cause some overhead When choosing the interface pattern
ldquoStateless Operationrdquo each message is parsed against its data type during inbound processing This can
cause performance and memory overhead but gives a syntactical check of the data received
When choosing ldquoStateless (XI30-Compatible)rdquo no check of the data type is performed and therefore the
overhead is avoided Therefore for interface with good data quality and high message throughput this
interface pattern should be chosen
SAP NETWEAVER 71 AND HIGHER PERFORMANCE CHECK GUIDE
68
63 Performance of Module Processing
If your analysis in chapter Adapter Performance Problem pointed to a problem in the Module Processing
then you must analyze the runtime of the modules used in the Communication Channel Adapter modules
can be combined so that one CC calls multiple modules in a defined sequence Adapter modules can be
custom-developed or SAP standard and can be used for many different purposes ndash like to transform the EDI
message before sending it to the partner or to change header attributes of a PI message before forwarding it
to a legacy application Due to the flexible usage of adapter modules there is also no standard way to
approach performance problems
In the audit log shown below you can see two adapter modules One module is a customer-developed
module called SimpleWaitModule The next module called CallSAPAdapter which is a standard module that
inserts the data into the messaging system queues
In the audit log you will get a first impression of the duration of the module In the example above you can
see that the SimpleWaitModule requires 4 seconds of processing time
Once again Wily Introscope offers a better overview of the processing time of modules In the screenshot
below you can see a dashboard showing the cumulativeaverage response times and number of invocations
of different modules If there is one that has been running for a very long time then it would be very easy to
identify since there will be a line indicating a much higher average response time The tooltip displays the
name of the module
Module
Processing
SAP NETWEAVER 71 AND HIGHER PERFORMANCE CHECK GUIDE
69
Once you have identified the module with the long running time you have to talk to the responsible developer
to understand why it is taking that long Eventually the module executes a look-up to a remote system using
JCo or JDBC which could be responsible for the delay In the best case the module will print out information
in addition to the audit log to detect such steps If not use the Wily Introscope transaction trace as explained
in appendix Wily Transaction Trace
64 Java only scenarios Integrated Configuration objects
From SAP NetWeaver PI 71 on you can configure scenarios that only run on the Java stack using the
Advance Adapter Engine (AAE) when only Java-based adapters are used A new configuration object is
used for this that is called Integrated Configuration When using this the steps executed so far in the ABAP
pipeline (Receiver Determination Interface Determination and Mapping) are also executed by the services in
the Adapter Engine
641 General performance gain when using Java only scenarios
The major advantage of AAE processing is a reduced overhead due to the context switches between ABAP
and Java Thus the overall throughput can be increased significantly and the overall latency of a PI
message can be reduced greatly If possible interfaces should always use the Integrated Configuration to
achieve best performance Therefore the best tuning option is to change a scenario that is using Java based
sender and receiver adapters from a classical ABAP-based scenario to an AAE-based one
SAP NETWEAVER 71 AND HIGHER PERFORMANCE CHECK GUIDE
70
Based on SAP internal measurements performed on 71 releases the throughput as well as the response
time could be improved significantly as shown in the diagrams below
SAP NETWEAVER 71 AND HIGHER PERFORMANCE CHECK GUIDE
71
Based on these measurements the following statements can be made
1) Significant performance improvements can be achieved always with local processing (if available) for a certain scenario
2) This is valid for all adapter types huge mapping runtimes slow networks slow (receiver) applications reduce the throughput and therefore rated for the overall scenario also reduce the benefit of local processing in terms of overall throughput and response time measurements
3) Greatest benefit is recognized for small payloads (comparison 10k 50k 500k) and asynchronous messages
642 Message Flow of Java only scenarios
All the Java based tuning options mentioned in chapter Analyzing the (Advanced) Adapter Engine and Long
Processing Times for ldquoPLSRV_MAPPING_REQUESTrdquo are still valid Just the calling sequence is different
The following describes the steps used in Integrated Configuration to help you better understand the
message flow of an interface The example is JMS to Mail
1) Enter the JMS sender adapter
2) Put into the dispatcher queue of the messaging system
3) Forwarded to the JMS send queue of the messaging system
4) Message is taken by JMS send consumer thread
a No message split used
In this case the JMS consumer thread will do all the necessary steps previously done in the ABAP pipeline (like receiver determination interface determination and mapping) and will then also transfer the message to the backend system (remote database in our example) Thus all the steps are executed by one thread only
b Message split used (1n message relation)
In this case there is a context switch The thread taking the message out of the queue will process the message up to the message split step It will create the new message and put it in the Send queue again from where it will be taken by different threads (which will then map the child message and finally send it to the receiving system)
As we can see in this example for Integrated Configuration only one thread does all the different steps of a
message The consumer thread will not be available for other messages during the execution of these steps
The tuning of the Send queue (Call for synchronous messages) is therefore much more important for
scenarios using Integrated Configuration than for ABAP-based scenarios
The different steps of the message processing can be seen in the audit log of a message If for example a
long-running mapping or adapter module is indicated then you can use the relevant chapter of this guide
There is no difference in the analysis except that for mappings no JCo connection is required since the
mapping call is done directly from the Java stack
SAP NETWEAVER 71 AND HIGHER PERFORMANCE CHECK GUIDE
72
The example audit logs below are based on a Java only synchronous SOAP to SOAP scenario
In the highlighted areas you can see that all the steps are very fast except the mapping call which lasts
around 7 seconds To analyze the long duration of the mapping now the same steps as discussed in chapter
Long Processing Times for ldquoPLSRV_MAPPING_REQUESTrdquo have to be followed
SAP NETWEAVER 71 AND HIGHER PERFORMANCE CHECK GUIDE
73
643 Avoid blocking of Java only scenarios
Like classical ABAP based scenarios Java only scenarios can face backlog situations in case of a slow or
hanging receiver backend Since the Java only interfaces are only using send queues the restriction of
consumer threads on the receiver queue as described in chapter Avoid Blocking Caused by Single
SlowHanging Receiver Interface is no solution
Based on that an additional property messagingsystemqueueParallelismqueueTypes of service SAP XI AF
MESSAGING was introduced via Note 1493502 - Max Receiver Parameter for Integrated Configurations
The parameter can be set for synchronous and asynchronous interfaces Please keep in mind that
messagingsystemqueueParallelismmaxReceivers is a global parameter for all adapters and for all
configured Quality of Service This global restriction can be avoided starting with 731 SP11 740 SP06 as
per SAP Note 1916598 - NF Receiver Parallelism per Interface Usually a restriction for the parallelization
can be highly critical for synchronous interfaces Therefore we generally recommend to set
messagingsystemqueueParallelismqueueTypes in most cases to Recv IcoAsync only
644 Logging Staging on the AAE (PI 73 and higher)
Up to PI 711 on the PI Adapter Engine only one message version was persisted Especially for Java only
scenarios this was often not sufficient for troubleshooting since for instance the result of a mapping could not
be verified
Starting from PI 73 the persistence steps can be configured globally in the Adapter Engine for synchronous
and asynchronous interfaces This is similar to the LOGGING or LOGGING_SYNC on the ABAP stack In
later version of PI you will be able to do the configuration on interface level
The versions that can be persisted are shown in the diagram below (the abbreviations in green are the
values for the configuration)
SAP NETWEAVER 71 AND HIGHER PERFORMANCE CHECK GUIDE
74
In the Messaging System we generally distinguish Staging (versioning) and Logging An overview is given
below
For details about the configuration please refer to the SAP online help Saving Message Versions
Similar to the LOGGING on the ABAP Integration Server persisting several versions of the Java message
can cause a high overhead on the DB and can cause a decrease in performance
The persistence steps can be seen directly in the audit log of a message
Also the Message Monitor shows the persisted versions
SAP NETWEAVER 71 AND HIGHER PERFORMANCE CHECK GUIDE
75
While this additional monitoring attributes are extremely helpful for troubleshooting they should be used
carefully from a performance perspective Especially the number of message versions and the
loggingstaging mode you choose can have a severe impact on performance Therefore you have to find the
balance between business requirement and performance overhead Some guidelines on how to use staging
and logging are summarized in SAP Note 1760915 - FAQ Staging and Logging in PI 73 and higher
65 J2EE HTTP load balancing
With NetWeaver version 71 and higher the Java HTTP load balancing is no longer done by the Java
Dispatcher but by the ICM The default load balancing rules of the ICM are designed with a stateful
application in mind giving priority to the balancing of HTTP sessions These default rules are not optimal for
stateless applications such as SAP PI
In the past we could observe an unequal load distribution across Java server nodes caused by this In case
of high backlogs this can cause a delay in the overall message processing of the interface because one
server node has more messages assigned than others and therefore not all available resources are used
A typical example can be seen in the Wily screenshot below
SAP Note 1596109 ndash Uneven distribution of HTTP requests on Java server nodes introduces new load
balancing rules for stateless applications like PI Please follow the description in the Note to ensure the
messages are distributed equally across the available server nodes In the meantime these load balancing
rules can also be executed using the CTC templates as described in Notes 1756963 and 1757922 Also this
has been included in the PI Initial Setup wizard in order to execute this task automatically as a post-
installation step (see Note 1760700 - PI CTC Add HTTP loadbalancing to initial setup)
SAP NETWEAVER 71 AND HIGHER PERFORMANCE CHECK GUIDE
76
For the example given above we could see a much better load balancing after the new load balancing rules
were implemented This can be seen in the following screenshot
Please Note The load balancing rules mentioned above are only responsible to balance the messages
across the available server nodes of one instance HTTP load balancing across application servers is done
by the SAP Web Dispatcher More information about this is provided in the Guide How To Scale SAP PI 71
66 J2EE Engine Bottleneck
All tuning that can be done in the AFW is limited by the ability of the J2EE Engine to handle a given amount
of threads and to provide enough memory that is needed to process all requests Of course the CPU is also
a limiting factor but this will be discussed in Chapter 91
From SAP NetWeaver PI 71 onwards the SAP VM is used on all platforms Therefore the analysis of all
platforms can use the same tools
661 Java Memory
The first analysis of the J2EE memory is usually done using the garbage collection (GC) behavior of the
Java Virtual Machine (JVM) To get the information of the GC written to the standard log file the JVM has to
be started with the parameter ndashverbosegc
Analyze the file std_serverltngtout for the frequency of GCs their duration and the allocated memory
Look for unusual patterns indicating an Out-of-Memory error or an unintentional restart of your J2EE engine This would be visible if the allocated memory drops to 0 at a given point in time A healthy Garbage Collection output would display a saw tooth pattern ndash that is the memory usage would increase over time but then go down to its original value as soon as a full Garbage Collection is triggered You should see the memory usage go down to initial values during low volume times (night-time)
Pay attention to GCs with a high duration This is important because no PI message can be mapped or processed by the J2EE Adapter Framework during a GC in a JAVA VM One of the many reasons for long GCs that should be mentioned here is paging (see chapter 92) If the heap space of the J2EE Engine is exhausted all objects in the heap are evaluated for their references If there is still a reference the object is kept If there is no reference the object is deleted If some or all of the objects have been swapped out due to insufficient RAM then they have to be swapped in to be evaluated This leads to very long runtimes for GCs GCs of more than 15 minutes have been observed on swapping systems
SAP NETWEAVER 71 AND HIGHER PERFORMANCE CHECK GUIDE
77
Different tools exist for the Garbage Collection Analysis
1) Solution Manager Diagnostics
Solution Manager Diagnostics (SMD) offers a memory analysis application that is able to read the GC output in the std_serverltngtout files To start call the Root Cause Analysis section In the Common Task list you find the entry Java Memory Analysis which will give you the chance to upload your std_serverltngtout file It shows the memory allocated after the GC and also prints the duration of each GC (black dots with duration scale on right axis) A normal GC output should show a saw tooth pattern where the memory always goes down to an initial value (especially during low volume times) This is shown in the example screenshot below
2) Wily Introscope
Again Wily Introscope offers different dashboards that can be used to check the Garbage Collection behavior on the J2EE engine The dashboard can be found using the J2EE Overview J2EE GC Overview and shows important KPIs for the GC such as the count of GC or the duration for each interval The GC Time dashboards shows the ratio of time spent in GC An example is shown in the screenshot below
SAP NETWEAVER 71 AND HIGHER PERFORMANCE CHECK GUIDE
78
3) Netweaver Administrator
The NWA also offers a view to monitor the Java heap usage However the important information about the duration of the GC is not available This monitor can be found by navigating to Availability and Performance Management Java System Reports Choose Report System Health
In NetWeaver 73 you find this data in Availability and Performance Management Resource Monitoring History Reports There you can build your own Memory report of the monitoring data provided The screenshot below eg shows the Used Memory per server node
SAP NETWEAVER 71 AND HIGHER PERFORMANCE CHECK GUIDE
79
4) SAP JVM Profiler
The SAP JVM profiler allows the analysis of the extensive GC information stored in the sapjvm_gcprf files of the server node folders or to directly connect to the server node to retrieve this information More information can be found at httpwikiscnsapcomwikidisplayASJAVAJava+Profiling
SAP NETWEAVER 71 AND HIGHER PERFORMANCE CHECK GUIDE
80
Procedure
o Search for restarts of the J2EE Engine by searching for the string ldquois startingrdquo in the file std_serverltngtout Apart from the first of these entries (which simply marks the initial start of the J2EE Engine) the second and any later entries mark a fatal situation after which the J2EE server node had to be restarted This could for example be an outndashof-memory situation Search the log above those entries for a possible reason
o Search for exceptions and fatal entries Was an out-of-memory error reported (search for pattern OutOfMemory) Was a thread shortage reported
o This document does not deal with tuning the J2EE Engine If at this point it becomes clear that the J2EE Engine is the limiting factor proceed with SAP Notes or open a customer incident Only some very basic recommendations are given here
o The parameters for the SAP VM are defined by Zero Admin templates From time to time new Zero Admin templates might be released which change important parameters for the SAP VM Thus you should check SAP Note 1248926 - AS Java VM Parameters for NetWeaver 71-based Products regularly and apply the changes accordingly
o The problem might be caused by too high parallelization when processing large messages This should be restricted to avoid overloading of the Java heap memory
1) In case the interfaces are using the ABAP Integration Server use the large message queue filters to restrict the parallelization of mapping calls from ABAP queues To do so set parameter EO_MSG_SIZE_LIMIT to eg 5000 to direct all large messages to dedicated XBTL or XBTM queues
2) To restrict the parallelization on the Java Messaging System you can use the large message queue mechanism described in chapter Large message queues on the Messaging System
o If it is already obvious that the memory of your J2EE Engine is getting short and nothing can be changed on the scenarios itself you have several options for scaling your PI landscape Especially for large PI installations with high message throughput or large messages SAP Note 1502676 - Scaling up large PI installations describes potential options
1) Increase the Java Heap of your server node If sufficient physical memory is available increase the default heap size of 2 GB to a higher value such as 3 or 4 GB Experience shows that the SAP VM can handle these heap sizes without major impact on performance Larger heap sizes can cause longer processing time of GCs which in turn can affect the PI application negatively Increasing the maximum heap size on the J2EE engine will automatically adapt the new area of the heap due to a dynamic configuration (in newer J2EE versions this will be per default set to 16 of the overall heap) After increasing the heap size monitor the duration of the GC execution
2) Add an additional server node to distribute the load over more processes SAP recommends that productive systems have at least 2 Java server nodes per instance Prerequisite is that your physical host has enough RAM and CPU To minimize the overhead for J2EE cluster communication it is in general recommended configuring larger server nodes (as described above) then a high number of server nodes
3) Add an additional application server consisting of a double stack Web Application Server (ABAP and J2EE Engine) to distribute the load to an additional hardware Find details on the scaling of PI with multiple instances in the Guide How To Scale up SAP NetWeaver Process Integration
4) Use a non-central Adapter Engine to separate large messages that cause the memory problem from business critical scenarios
662 Java System and Application Threads
A system or application thread is required for every task that the J2EE Engine executes Each of these
thread types are maintained using a thread pool If the pool of available threads is expired no more requests
can be processed It is therefore important that you have enough threads available at all times
SAP NETWEAVER 71 AND HIGHER PERFORMANCE CHECK GUIDE
81
o In general SAP recommends that you increase the system and application thread count for a PI system As described in SAP Note 937159 - XI Adapter Engine is stuck the application threads should be increased to 350 and the system threads to lsquo120rsquo for all J2EE server nodes
o There are two options for checking the thread usage
1) Wily Introscope
Wily Introscope provides a dashboard in the J2EE Overview section called J2EE CPU and Memory Detail that can also be used to monitor the thread usage on a PI engine Different views exist for Application and System Threads as shown in the screenshot below
2) NetWeaver Administrator (NWA)
The NWA also offers a monitor similar to the one available for the memory mentioned above This monitor can be found by navigating to Availability and Performance Management Java System Reports Choose Report System Health and looking at the windows shown in the screenshot below
Again in NetWeaver 73 and higher the monitor can be found at Availability and Performance
Management Resource Monitoring History Report An example for the Application Thread
Usage is shown below
SAP NETWEAVER 71 AND HIGHER PERFORMANCE CHECK GUIDE
82
Check if the ThreadPoolUsageRate is below 80 for both the application threads and the system threads Also check the maximum value by choosing a longer history in Wily Introscope
Has the thread usage increased over the last daysweeks
Is there one server node that shows a higher thread usage than others
3) SAP Management Console
The SAP Management Console is an essential tool to analyze different aspects of the J2EE engine It also offers a thread dump view similar to SM50 in ABAP showing the activity of all the threads of a given Java Application Server More information about the SAP MC can be found in Note 1014480 - SAP Management Console (SAP-MC) and the online help The SAP Management Console can be started as Java web-start application using httpltservergt5ltInstanc_numbergt13
Navigate to AS Java Threads and check for any threads in red status (gt20 secs running time) This indicates long running threads and you should check for the related thread stacks The example below shows a long running thread related to the PI directory You can see the user doing the request and can see that the thread is waiting for an HTTP response from the CPACache
SAP NETWEAVER 71 AND HIGHER PERFORMANCE CHECK GUIDE
83
If you are not sure what is causing the problem you should take multiple thread dumps (at least 3 every 30 seconds) for all server nodes This can be done in the Management Console navigating to AS Java Process Table
The Thread Dump Viewer tool (TDV) from Note 1020246 - Thread Dump Viewer for SAP Java Engine can be used to analyze the produced thread dumps (inside the results archive that can be downloaded to your local PC)
663 FCA Server Threads
An additional type of thread was introduced with SAP NetWeaver PI 71 that is responsible for HTTP traffic
FCA Server Threads The FCA Server Threads are responsible for receiving HTTP calls at the Java side
(after the Java dispatcher is no longer available) Also FCA Threads use a Thread Pool Fifteen FCA
Threads are configured by default but based on SAP Note 1375656 - SAP Netweaver PI System Parameters
we recommend that you increase it to 50 This can be done in the NWA by changing the parameter
FCAServerThreadCount of service HTTP Provider
FCA Server Threads are particularly crucial for synchronous message transfer and for HTTP-based
scenarios like WebServices or calls from the ABAP engine to the Adapter Engine If there is a long duration
of the HTTP call due to a slow backend system then the thread is blocked for the whole time and not
available to send other HTTP requests (other PI messages)
SAP NETWEAVER 71 AND HIGHER PERFORMANCE CHECK GUIDE
84
The configured FCAServerThreadCount represents the maximum number of threads working on a single
entry point An entry point in the PI sense could eg be the SOAP Adapter Servlet (share with all channels
as described in Tuning SOAP sender adapter)
o If response times for specific entry point are high (gt15 seconds) additional FCA threads will be spawned to be available for parallel HTTP based incoming requests using different entry points only This ensures that in case of problems with one application not all other applications will be blocked constantly
o An overall maximum of 20xFCAServerThreadCount may be used in the J2EE engine
There is currently no standard monitor available for FCA Threads except the thread view in the SAP
Management Console A new dashboard will be integrated into Wily Introscope soon and will also show the
FCA Server Threads that are in use
664 Switch Off VMC
The Virtual Machine Container (VMC) is enabled by default for an ABAP WebAS 71 Since PI does not use
VMC at runtime the VMC can be switched off on a PI system to avoid resource overhead This
recommendation is based on SAP Note 1375656 - SAP NetWeaver PI System Parameters
You can activate the VM Container setting the profile parameters vmcjenable = off which can be changed
using profile maintenance (transaction RZ10) Once you have made the change you need to restart the SAP
Web Application Server instance
SAP NETWEAVER 71 AND HIGHER PERFORMANCE CHECK GUIDE
85
7 ABAP PROXY SYSTEM TUNING
Every ABAP WebAS gt 620 includes an ABAP Proxy runtime This enables a SAP system to talk native PI
protocol (XI-SOAP) so that no costly transformation is necessary
In general ABAP proxy is just a framework that is triggered by (sender) or triggers (receiver) application-
specific coding It is not possible to give a general tuning recommendation because the applications and use
cases of ABAP proxy can differ so greatly
In this section we would like to highlight the system tuning options that can be applied to improve the
throughput at the ABAP Proxy backend side
In general you can increase the throughput of EO interfaces by changing the queue parallelization Two
different parameters exist to change the number of qRFC queues on the ABAP Proxy backend As in PI
ABAP Proxy processing is based on qRFC inbound queues (SMQ2) with specific names A sender proxy
uses XBTS queues (10 parallel by default) and a receiver proxy XBTR (20 parallel by default)
The sender proxy only forwards the message to PI by executing an HTTP call that must not take too much
time and which is not resource-critical On the other hand the receiver proxy executes the inbound
processing of the messages based on the application context (and which can be very time-consuming) It is
therefore more likely to face a backlog situation in the Receiver Proxy queues In the screenshot below you
can see the performance header of a receiver proxy message that required around 20 minutes in the
PLSRV_CALL_INBOUND_PROXY (which corresponds to the posting of the application data)
Of course such a long-running message will block the queue and all messages behind it will face a higher
latency Since this step is purely application-related it is only possible to perform tuning at the application
side
The number of sender and receiver ABAP Proxy queues can be changed in transaction SXMB_ADM on the
proxy backend with parameter EO_INBOUND_PARALLEL and sub parameter SENDER (XBTS queues)
and RECEIVER (XBTR queues) The prerequisite for increasing the number of queues is that there are
enough qRFC resources are available at the proxy system (as discussed in section qRFC Resources
(SARFC))
Also as described in chapter Message Prioritization on the ABAP Stack prioritization can be configured in
the ABAP Proxy system This can be used to separate runtime-critical interfaces from interfaces with a long
application processing (as shown above)
SAP NETWEAVER 71 AND HIGHER PERFORMANCE CHECK GUIDE
86
71 New enhancements in Proxy queuing
The queuing mechanism was enhanced for sender and receiver proxy systems with Note 1802294
(Receiver) and Note 1831889 (Sender) After implementing these two Notes interface specific queues will be
used and tuning of these queues on interface level will be possible This can be very helpful in cases where
one receiver interface shows very long posting time in the application coding that cannot be further
improved Other messages for more business critical interfaces will eventually be blocked by this message
due to the common usage of the XBTR queues On the sender side of a Proxy system the processing of the
queues call the central PI hub In general the processing time there should be fast But in case of high
volume interfaces you might want to slow down less business critical interfaces to avoid overloading of your
central PI hub The prioritization mechanisms available prior to these Notes did not provide such options
This is achieved by adding an interface specific identifier to the queue-name In the screenshot below you
see a comparison in the queue names for the old framework (red) and the new framework (blue)
For the sender queues the following new parameters are introduced
o Parameter EO_QUEUE_PREFIX_INTERFACE with sub parameter SENDERSENDER_BACK Should be set to lsquo1rsquo to active interface specific queue This is a global switch affecting all sender interfaces
o Parameter EO_INBOUND_PARALLEL_SENDER without sub parameter determines the general number of queues per interface
Using a sub parameter ltsender IDgt the parallelization of individual interfaces can be changed This can eg be used to assign more queues for high priority interfaces
Wildcards can be used in the ltsender IDgt to group interfaces sharing eg the same service name or the same interface name but different services
For the receiver queues the following new parameters are introduced
o Parameter EO_QUEUE_PREFIX_INTERFACE with sub parameter RECEIVER Should be set to lsquo1rsquo to active interface specific queue This is a global switch affecting all receiver interfaces
o Parameter EO_INBOUND_PARALLEL_RECEIVER without sub parameter determines the general number of queues per interface
Using a sub parameter ltsender IDgt the parallelization of individual interfaces can be changed This can eg be used to assign more queues for high priority interfaces
Wildcards can be used in the ltsender IDgt to group interfaces sharing eg the same service name or the same interface name but different services
This new feature also replaces the currently existing prioritization since it is in general more flexible and
powerful We therefore recommend adjusting existing prioritization rules using the new queuing possibilities
described above
SAP NETWEAVER 71 AND HIGHER PERFORMANCE CHECK GUIDE
87
8 MESSAGE SIZE AS SOURCE OF PERFORMANCE PROBLEMS
The message size directly influences the performance of an interface The size of a PI message depends on
two elements The PI header elements with a rather static size and the payload which can vary greatly
between interfaces or over time for one interface (for example larger messages during year-end closing)
The size of the PI message header can cause a major overhead for small messages of only a few kB and
can cause a decrease in the overall throughput of the interface Furthermore many system operations (like
context switches or database operations) are necessary for only a small payload The larger the message
payload the smaller the overhead due to the PI message header On the other hand large messages
require a lot of memory on the Java stack which can cause heavy memory usage on ABAP or excessive
garbage collection activity (see section Java Memory) that will also reduce the overall system performance
Very large messages can even crash the PI system by causing an Out-of-Memory exception for example
You therefore have to find a compromise for the PI message size
Below you see throughput measurements performed by SAP In general the best throughput was identified
for messages sizes of 1 to 5 MB
The message size in these measurements corresponds to the XML message size processed in PI and not
the size of the file or IDoc being sent to PI You can use the Runtime Header of the ABAP stack to check the
message size Below you can see an example of a very small message While the MessageSizePayload
field describes the size of the payload in bytes (here 433 bytes) the MessageSizeTotal describes the total
message size (header + payload) In the example this is around 14 KB demonstrating the overhead by the PI
header for small messages The next two lines describe the payload size before and after the mapping In
the example below the mapping reduces the payload size The last two lines determine the size of the
response message that is sent back to PI before and after the response mapping for synchronous
messages
SAP NETWEAVER 71 AND HIGHER PERFORMANCE CHECK GUIDE
88
Based on the above observations we highly recommend that you use a reasonable message size for your
interfaces During the design and implementation of the interface we therefore recommend using a message
size of 1 to 5 MB if possible Messages can be collected at the sender side or by using IDoc packaging as
described in Tuning the IDoc Adapter to achieve this In case of large messages a split has to be performed
by changing the sender processing or by using the split functions available in the structure conversion of the
File adapter
81 Large message queues on PI ABAP
In case the interfaces are using the ABAP Integration Server use the large message queue filters to restrict
the parallelization of mapping calls from ABAP queues To do so set the parameter EO_MSG_SIZE_LIMIT of
category TUNING to eg 5000 to direct all messages larger 5 MB to dedicated XBTL or XBTM queues
The value of the parameter depends on the number of large messages and the acceptable delay that might
be caused due to a backlog in the large message queue
To reduce the backlog the number of large message queues can also be configured via parameter
EO_MSG_SIZE_LIMIT_PARALLEL of category TUNING The default value is 1 so that all messages larger
than the defined threshold will be processed in one single queue Naturally the parallelization should not be
set higher than 2 or 3 to avoid overloading of the Java memory due to parallel large message requests
82 Large message queues on PI Adapter Engine
SAP Note 1727870 - Handling of large messages in the Messaging System introduces large message
queues (virtual queues no adapter behind) also for the Java based Adapter Engine Contrary to the
Integration Engine it is not the size of a single large message only that determines the parallelization
Instead the sum of the size of the large messages across all adapters on a given Java server node is limited
to avoid overloading the Java heap This is based on so called permits that define a threshold of a message
size Each message larger than the permit threshold is considered as large message The number of permits
can be configured as well to determine the degree of parallelization Per default the permit size is 10 MB and
10 permits are available This means that large messages will be processed in parallel if 100 MB are not
exceeded
To show this let us look at an example using the default values Let us assume we have 5 messages waiting
to be processed (status ldquoTo Be Deliveredrdquo on one server node Message A has 5 MB message B has 10
MB message C has 50 MB message D 150 MB message E 50 MB and message F 40 MB Message A is
not considered large since the size is smaller than the permit size and is not considered large and can be
immediately processed Message B requires 1 permit message C requires 5 Since enough permits are
available processing will start (status DLNG) Hence for message D all available 10 permits would be
required Since the permits are currently not available it cannot be scheduled If blacklisting is enabled the
message will be put to error status (NDLV) since it exceed the maximum number of defined permits In that
case the message would have to be restarted manually Message E requires 5 permits and can also not be
scheduled But since there are 4 permits left message F is put to DLNG Due to the smaller size message B
and message F finish first releasing 5 permits This is sufficient to schedule message E which requires 5
SAP NETWEAVER 71 AND HIGHER PERFORMANCE CHECK GUIDE
89
permits Only after message E and C have finished message D can be scheduled consuming all available
permits
The example above shows a potential delay a large message could face due to the waiting time for the
permits But the assumption is that large messages are not time critical and therefore additional delay is less
critical than potential overload of the system
The large message queue handling is based on the Messaging System queues This means that restricting
the parallelization is only possible after the initial persistence of the message in the Messaging System
queues Per default this is only done after the Receiver Determination Therefore if you have a very high
parallel load of incoming large requests this feature will not help Instead you would have to restrict the size
of incoming requests on the sender channel (eg file size limit in the file adapter or the
icmHTTPmax_request_size_KB limit in the ICM for incoming HTTP requests) If you have very complex
extended receiver determination or complex content based routing it might be useful to configure staging in
the first processing step of the Messaging System (BI=3) as described in Logging Staging on the AAE (PI
73 and higher)
The number of permits consumed can be monitored in PIMON Monitoring Adapter Engine Status The
number of threads corresponds to the number of consumed permits
In newer Wily versions there is also a dashboard showing the number of consumed permits as well The
Worker Threads on the right hand side of the screenshot correspond to the permits
SAP NETWEAVER 71 AND HIGHER PERFORMANCE CHECK GUIDE
90
9 GENERAL HARDWARE BOTTLENECK
During all tuning actions discussed in the previous chapters you must keep in mind that the limitation of all
activities is set by the underlying CPU and memory capacity The physical server and its hardware have to
provide resources for three PI runtimes the Adapter Engine the Integration Engine and the Business
Process Engine Tuning one of the engines for high throughput leaves fewer resources for the remaining
engines Thus the hardware capacity has to be monitored closely
91 Monitoring CPU Capacity
When monitoring the CPU capacity it is not enough to use the average that is displayed in the ldquoPrevious
Hoursrdquo section of transaction ST06 Instead you should start your interface and monitor the CPU while it is
running The best procedure is to use operating system tools to monitor the CPU usage (particularly if using
hardware virtualization)
The SMD Host Agent also reports CPU data to Wily Introscope which can be viewed using dashboards as
shown below This example shows two systems where one is facing a temporary CPU overload and the
other a permanent one
Also the NWA offers a view on the CPU activity from NetWeaver 73 on via Availability and Performance
Management Resource Monitoring History Reports There you can build your own report based on the
ldquoCPU utilizationrdquo data as shown in the screenshot
SAP NETWEAVER 71 AND HIGHER PERFORMANCE CHECK GUIDE
91
You can also monitor the CPU usage in ST06 as described below
Procedure
Log on to your Integration Server and call transaction ST06 Take a look at the snapshot that is provided on
the entry screen than navigate to ldquoDetailed Analysis Menurdquo
Snapshot view Is the idle time (upper left corner) at a reasonable value at all times for example around 10 or higher
Snapshot view The load average is a good indicator of the dimension of the bottleneck It describes the number of processes for each CPU that are in a wait queue before they are assigned to a free CPU As long as the average remains at one process for each available CPU the CPU resources are sufficient Once there is an average of around three processes for each available CPU there is a bottleneck at the CPU resources In connection with a high CPU usage a high value here can indicate that too many processes are active on the server In connection with a low CPU usage a high value here can indicate that the main memory is too small The processes are then waiting due to excessive paging
Detailed Analysis View TOP CPU Which thread uses up the highest amount of CPU Is it the J2EE Engine the work processes or the database
o There are different follow-up actions to be taken depending on the findings of the second check The first option is of course to simply increase the hardware This should be accompanied by a thorough sizing (for which SAP provides the Quicksizer in the Service Marketplace httpservicesapcomquicksizer )
o The second option is to identify the CPU-consuming threads and to think about a reduction of the load in this component For example if the J2EE Engine is the largest consumer then it is worth re-evaluating the number of concurrent mapping threads andor consumer queues as described in the previous chapters
o SAP Note 742395 - Analyzing High CPU Usage by the J2EE Engine provides a good entry point if the J2EE Engine consumes too much CPU
o If it is the work processes that consume a lot of CPU use transaction ST03N to figure out if it is the Integration Server or the Business Process Engine You can do that by looking at the CPU usage per user BPE uses the user WF-BATCH while the Integration Server uses the last user who activated a qRFC queue (typically PIAFUSER or PIAPPLUSER) Use the previous chapter to restrict these activities
92 Monitoring Memory and Paging Activity
As stated above paging is very critical for the Java stack since it influence the Java GC behavior directly
Therefore paging should be avoided in every case for a Java-based system
The OS tools are the most reliable for monitoring the paging activity on your system Transaction ST06 can
also be used to perform a snapshot analysis Take a look at the snapshot that is provided on the entry
screen
Snapshot view Is there enough physical memory available
Snapshot view Is there considerable paging Paging can have a negative influence on your J2EE Engine If it does this can be seen in long GC times as described in Chapter 661
93 Monitoring the Database
Monitoring database performance is a rather complex task and requires information to be gathered from a
variety of sources Only a basic set of indicators is given for the purpose of this guide A more detailed
SAP NETWEAVER 71 AND HIGHER PERFORMANCE CHECK GUIDE
92
analysis is required if these indicators point to a major performance problem in the database If assistance is
needed open a support message under the component BC-DB-ORA (or MSS SDB DB6 respectively)
931 Generic J2EE database monitoring in NWA
The next sections of this chapter will be mainly based on ABAP transactions to do a detailed analysis of the
database performanceThe NWA however offers possibilities to monitor the database performance for the
Java based tables This is especially helpful for Java only AEXPO or Non-Central AAEs In the NWA you
can use the ldquoOpen SQL Monitorrdquo in the Troubleshooting section of NWA The official documentation can be
found in the Online Help Monitoring DB via DBACOCKPIT transaction (ABAP based) is possible also for the
Java-only systems from SAP Solution Manager (DBA Cockpit must be configured in the Managed System
Setup)
It will be too much to outline all the available functionalities here Instead only a few key capabilities will be
demonstrated If you want to eg see the number of select update or insert statements in your system you
can use the ldquoTable Statistics Monitorrdquo It clearly shows you which tables in your system are accessed the
most frequently
To see the processing time of the different statements on your system you can use the ldquoOpen SQL statisticsrdquo
monitor There you can see the count the total average and max processing time of the individual SQL
SAP NETWEAVER 71 AND HIGHER PERFORMANCE CHECK GUIDE
93
statements and can therefore identify the expensive statements on your system
Per default the recorded period is always from the last restart of the system If you would like to just look at
the statistics for a specific time period (eg during a test) you have the option of resetting the statistics in the
individual monitor prior to the test
932 Monitoring Database (Oracle)
Procedure
Log on to your Integration Server and call transaction ST04
SAP NETWEAVER 71 AND HIGHER PERFORMANCE CHECK GUIDE
94
Many of the numbers in the screenshot above depend on each other The following checklist names a few
key performance figures of your Oracle database
The data buffer quality for instance is based on the ratio of physical reads versus the total number of reads The lower the ratio the better the buffer quality The data buffer quality should be better than 94 the statistics should be based on 15 million total reads This number of reads ensures that the database is in an equilibrated state
Ratio of user and recursive calls A good performance is indicated by ratio values greater than 2 Otherwise the number of recursive calls compared to the number of user calls is too high Over time this ratio always declines because more and more SQL statements get parsed in the meantime
Number of reads for each user call If this value exceeds 30 blocks for each user call this indicates an expensive SQL statement
Check the value of TimeUser call Values larger than 15 ms often indicate an optimization issue
Compare busy wait time versus CPU time A ratio of 6040 generally indicates a well-tuned system Significantly higher values (for example 8020) indicate room for improvement
The DD-cache quality should be better than 80
933 Monitoring Database (MS SQL)
Procedure
To display the most important performance parameters of the database call Transaction ST04 or choose
Tools Administration Monitor Performance Database Activity An analysis is only meaningful if
the database has been running for several hours with a typical workload To ensure a significant database
SAP NETWEAVER 71 AND HIGHER PERFORMANCE CHECK GUIDE
95
workload we recommend a minimum of 500 CPU busy seconds Note The default values displayed in
section Server Engine are relative values To display the absolute values press button Absolute values
Check the values in (1)
The cache hit ratio (2) which is the main performance indicator for the data cache shows the
average percentage of requested data pages found in the cache This is the average value since startup The value should always be above 98 (even during heavy workload) If it is significantly below 98 the data cache could be too small To check the history of these values use Transaction ST04 and choose Detail Analysis Menu Performance Database A snapshot is collected every 2 hours
Memory setting (5) shows the memory allocation strategy used and shows the following
FIXED SQL Server has a constant amount of memory allocated which is set by SQL Server configuration parameters min server memory (MB) = max server memory (MB)
RANGE SQL Server dynamically allocates memory between min server memory (MB) lt gt max server memory (MB)
AUTO SQL Server dynamically allocates memory between 4 MB and 2 PB which is set by min server memory (MB) = 0 and max server memory (MB) = 2147483647
FIXED-AWE SQL Server has a constant amount of memory allocated which is set by min server memory (MB) = max server memory (MB) In addition the address windowing extension functionality of Windows 2000 is enabled
934 Monitoring Database (DB2)
Procedure
To get an overview of the overall buffer pool usage catalog and package cache information go to
transaction ST04 choose Performance Database section Buffer Pool (or section Cache respectively)
1 1
1 2
1 3
1 5
1 4
gt 6h
gt 98
SAP NETWEAVER 71 AND HIGHER PERFORMANCE CHECK GUIDE
96
Buffer Pools Number Number of buffer pools configured in this system
Buffer Pools Total Size The total size of all configured buffer pools in KB If more than one buffer pool is used choose Performance Buffer Pools to get the size and buffer quality for every single buffer pool
Overall buffer quality This represents the ratio of physical reads to logical reads of all buffer pools
Data hit ratio In addition to overall buffer quality you can use the data hit ratio to monitor the database (data logical reads - data physical reads) (data logical reads) 100
Index hit ratio In addition to overall buffer quality you can use the index hit ratio to monitor the database (index logical reads - index physical reads) (index logical reads) 100
Data or Index logical reads The total number of read requests for data or index pages that went through the buffer pool
Data or Index physical reads The total number of read requests that required IO to place data or index pages in the buffer pool
Data synchronous reads or writes Read or write requests performed by db2agents
SAP NETWEAVER 71 AND HIGHER PERFORMANCE CHECK GUIDE
97
Catalog cache size Maximum size of the catalog cache that is used to maintain the most frequently accessed sections of the catalog
Catalog cache quality Ratio of catalog entries (inserts) to reused catalog entries (lookups)
Catalog cache overflows Number of times that an insert in the catalog cache failed because the catalog cache was full (increase catalog cache size)
Package cache size Maximum size of the package cache that is used to maintain the most frequently accessed sections of the package
Package cache quality Ratio of package entries (inserts) to reused package entries (lookups)
Package cache overflows Number of times that an insert in the package cache failed because the package cache was full (increase package cache size)
935 Monitoring Database (MaxDB SAP DB)
Procedure
As with the other database types call transaction ST04 to display the most important performance
parameters
SAP NETWEAVER 71 AND HIGHER PERFORMANCE CHECK GUIDE
98
With the Database Performance Monitor (transaction ST04) and its submonitors the CCMS in the SAP R3
System allows you to view in the SAP R3 System all of the information that can be used to identify
bottleneck situations
The SQL Statements section provides information about the number of SQL statements executed and related sizes
The IO Activity section lists physical and logical read and write accesses to the database
The Lock Activity section (in transaction ST04) allows you to identify possible bottlenecks in the assignment of locks by the database
The Logging Activity section combines information about the log area
The Scan and sort activity section can be helpful in identifying that suitable indexes are missing
The Cache Activity section provides information about the usage of the caches and the associated hit rates
o The data cache Hit rate should be 99 in a balanced system If this is not the case you need to check if the low hit rate is due to the size of the data cache being too small or due to an unsuitable SQL statement If necessary you can increase the data cache by increasing the MaxDB parameter Data_Cache_Size (lower than 74) or Cache_Size (74 or higher)
o The catalog cache hit rate should be 85 in a balanced system It is not a cause for concern if the catalog hit rate is temporarily lower since accesses to the system tables and an active command monitor can temporarily impair the hit rate If the catalog cache is busy the pages are paged out in the data cache rather than on the hard disk
o Log entries are not written directly to the log volume but first into a buffer (LOG_IO_QUEUE) so as to be able to write several log entries together asynchronously with one IO on the hard disk Only once a LOG_IO_QUEUE page is full is it written to the hard disk However there are situations in which you need to write LOG entries from the LOG_QUEUE onto the hard disk as quickly as possible for example if transactions are completed (COMMITROLLBACK) The transactions wait until the log writer reports the OK informing them that the log entry is on the hard disk Firstly this means that is important to use the quickest possible hard disks for the log volume(s) and secondly you must ensure that no LOG_QUEUE_OVERFLOWS occur in production operation If the LOG_IO_QUEUE is full then all transactions that want to write LOG entries must wait until free memory becomes available again in the LOG_IO_QUEUE At LOG_QUEUE_OVERFOLWS (Transaction DB50 -gt Current Status -gt Activities Overview -gt LOG_IO_QUEUE Overflow) you need to increase the LOG_IO_QUEUE parameter
SAP NETWEAVER 71 AND HIGHER PERFORMANCE CHECK GUIDE
99
o In accordance with Note 819324 - FAQ MaxDB SQL optimization check which SQL statements are responsible for the most disk accesses and whether they can be optimized You should also optimize SQL statements that have a poor runtime and poor selectivity
Bottleneck Analysis
The Bottleneck Analysis function is available in transaction ST04 under the Problem Analyzes
Performance Database Analyzer Bottlenecks You can use this function to activate the corresponding
analysis tool dbanalyzer
The dbanalyzer then collects important performance data every 15 minutes and evaluates this for possible
bottlenecks
The result of the bottleneck analysis is output in text format to provide a quick overview of possible causes of
performance problems For a more detailed description of the bottleneck messages see the online
documentation (httphelpsapcom) in the SAP Web Application Server area and search for SAP DB
bottleneck analysis messages
The dbanalyzer tool can also be started at operating system level It logs its analysis results in files with date
stamps in the subdirectory ltrundirectorygtanalyzer (you can find the actual directory by double-clicking on
lsquoPropertiesrsquo in DB50) of the relevant database instance
94 Monitoring Database Tables
Some of the tables of SAP PI grow very quickly and can cause severe performance problems if archiving or
deletion does not take place frequently For troubleshooting see SAP Note 872388 ndash Troubleshooting
Archiving and Deletion in PI
Procedure
Log on to your Integration Server and call transaction SE16 Enter the table names as listed below and execute In the following screen simply press the button ldquoNumber of Entriesrdquo The most important tables are SXMSPMAST (cleaned up by XML message archivingdeletion)
If you use the switch procedure you have to check SXMSPMAST2 as well
SXMSCLUR SXMSCLUP (cleaned up by XML message archivingdeletion)
If you use the switch procedure you have to check SXMSPCLUR2 and SXMSCLUP2 as well
SAP NETWEAVER 71 AND HIGHER PERFORMANCE CHECK GUIDE
100
SXMSPHIST (cleaned up by the deletion of history entries)
If you use the switch procedure you have to check SXMSPHIST2 as well
SXMSPFRAWH and SXMSPFRAWD (cleaned up by the performance jobs see SAP Note 820622 ndash Standard Jobs for XI Performance Monitoring)
SWFRXI (cleaned up by specific jobs see SAP Note 874708 - BPE HT Deleting Message Persistence Data in SWFRXI)
SWWWIHEAD (cleaned up by work item archivingdeletion)
Use an appropriate database tool for example SQLPLUS for Oracle for the database tables of the J2EE schema Main tables that could be affected of growth
PI Message tables BC_MSG and BC_MSG_AUDIT (when audit log persistence is enabled)
PI message logging information when stagingloging is used BC_MSG_LOG_VERSION
XI IDoc tables (if IDoc persistence is activated) XI_IDOC_IN_MSG and XI_IDCO_OUT_MSG
Check for all tables if the number of entries is reasonably small or remains roughly constant over a period of time If that is not the case check your archivingdeletion setup
SAP NETWEAVER 71 AND HIGHER PERFORMANCE CHECK GUIDE
101
10 TRACES LOGS AND MONITORING DECREASING PERFORMANCE
101 Integration Engine
There are three important locations for the configuration of tracing logging in the Integration Engine The
pipeline settings of PI itself the Internet Communication Manager (ICM) and the gateway All three are
heavily involved in message processing and therefore their tracing or logging settings can have an impact on
performance On top of this you might have changed the SM59 RFC destinations and have switched on the
trace in order to analyze a problem If so then this needs to be reset as well
Procedure
Start transaction SXMB_ADM and navigate to Integration Engine Configuration Specific Configuration and search for the following entries
Category Parameter Subparameter Current Value Default
RUNTIME TRACE_LEVEL ltnonegt ltyour valuegt 1
RUNTIME LOGGING ltnonegt ltyour valuegt 0
RUNTIME LOGGING_SYNC ltnonegt ltyour valuegt 0
Set the above parameters back to the default value which is the recommended value by SAP
Start transaction SMICM and check the value of the Trace Level that is displayed in the overview
(third line) Set the trace level to lsquo1rsquo if not already the case You can do so by navigating to Goto Trace Level Set
Start transaction SMGW navigate to Goto Parameters Display and check the parameter Trace Level Set the trace level to lsquo1rsquo if not already the case You can do so by navigating to Goto Trace Gateway Reduce Level (or Increase Level respectively)
Start transaction SM59 and search the following RFC destination for the flag ldquoTracerdquo on the tab Special Options and remove the Flag ldquoTracerdquo if it has been set
AI_RUNTIME_JCOSERVER
AI_DIRECTORY_JCOSERVER
LCRSAPRFC
SAPSLDAPI It is possible that other RFC destinations are used for sending out IDocs and similar
SAP NETWEAVER 71 AND HIGHER PERFORMANCE CHECK GUIDE
102
102 Business Process Engine
You only have to check the Event Trace in the Business Process Engine
Procedure
Call transaction SWELS and check if the Event Trace is switched on The recommended setting is lsquooffrsquo (as shown in the screenshot below)
103 Adapter Framework
Since the Adapter Framework runs on the J2EE Engine the tracing and logging can be conveniently
checked and controlled using NetWeaver Administrator To improve the performance SAP recommends that
you set all trace levels to default Higher trace levels are only acceptable in productive usage during problem
analysis Below you will find a description on how to set the default trace level for all locations at once It is of
possible to do it for every location separately but this way you might forget to reset one of the locations
Procedure
Start the NetWeaver Administrator and navigate to Problem Management (or Troubleshooting in NW 73 and higher) Logs and Traces and choose Log Configuration In the Show drop down list box choose Tracing Locations Select the Root Location in the tree and press the button Default Configuration This will set the default configuration for all locations
Start the NetWeaver Administrator and navigate to Troubleshooting Logviewer (direct link nwalinks) Open the View ldquoDeveloper Tracerdquo and check if you have very frequent reoccurring exceptions that fill up the trace Analyze the exception and check what is causing this (eg a wrong configuration of a Communication Channel causing repeated traces If you see very frequent errors for which you cannot find the root cause open a customer incident at SAP
SAP NETWEAVER 71 AND HIGHER PERFORMANCE CHECK GUIDE
103
An aggregated view of Java exceptions (by number date instance server node etc) are reported and available in SAP Solution Manager Root Cause Analysis Exception Analysis functionality
1031 Persistence of Audit Log information in PI 710 and higher
With SAP NetWeaver PI 71 the audit log is not persisted for successful messages in the database by default
to avoid performance overhead Therefore the audit log is only available in the cache for a limited period of
time (based on the overall message volume)
Audit log persistence can be activated temporarily for performance troubleshooting where audit log
information is required To do so use the NWA and change the parameter
ldquomessagingauditLogmemoryCacherdquo to false in service XPI Service Messaging System by setting the
parameter to false Details can be found in SAP Note 1314974 - PI 71 AF Messaging System audit log
persistence Only do so temporarily during the time of troubleshooting to avoid any performance problems
from the additional persistence
After implementing Note 1611347 - New data columns in Message Monitoring additional information like
message processing time in ms and server node is visible in the message monitor
SAP NETWEAVER 71 AND HIGHER PERFORMANCE CHECK GUIDE
104
11 ERRORS AS SOURCE OF PERFORMANCE PROBLEMS
If errors occur within messages or within technical components of the SAP Process Integration then this can
have a severe impact on the overall performance Thus to solve performance problems it is sometimes
necessary to analyze the log files of technical components and to search for messages with errors To
search for messages with errors use the PI Admin Check which is available using SAP Note 884865 - PIXI
Admin Check
Procedure
ICM (Internet Communication Manager)
Start transaction SMICM open the log file (Shift + F5 or GoTo Trace File Show All) and check for errors
Gateway
Start transaction SMGW open the Log File (CTRL + Shift + F10 or Goto Trace Gateway Display File) and check for errors
System Log
Start transaction SM21 choose an appropriate time interval and search the log entries for errors Repeat the procedure for remote systems if you are using dialog instances
ABAP Runtime Errors
Start transaction ST22 choose an appropriate time interval and search for PI-related dumps In general the number of ABAP dumps should be very small on a PI system and therefore all occurring dumps should be analyzed
Alerts CCMS
Start transaction RZ20 and search for recent alerts
Work Process and RFC trace
In the PI work directory check all files which begin with dev_rfc or dev_w for errors
J2EE Engine
In the PI work directory search for errors in file dev_server0out If you are using more than one J2EE server node check dev_serverltngtout as well
Applications running on the J2EE Engine
The traces for application-related errors are the defaulttrc files located in j2eeclusterserverltngtlog directory To monitor exceptions across multiple server nodes the best tool to use is the LogViewer service of the NWA This is available via Problem Management Logs and Traces and choose Log Viewer Search for exceptions in the area of the performance problem for example the PI Messaging system
SAP NETWEAVER 71 AND HIGHER PERFORMANCE CHECK GUIDE
105
APPENDIX A
A1 Wily Introscope Transaction Trace
As mentioned above the Wily Transaction trace can be used to trace expensive steps that were noticed
during the mapping or module processing The transaction trace will allow you to drill down further into Java
performance problems and to distinguish if it is a pure coding problem or caused by a look-up to a remote
system or a slow connection to the local database
The Wily Transaction trace can be used to trace all steps that exceed a specific duration on the Java stack If
a user is known (for example for SAP Enterprise Portal) the tracing can be restricted to a specific user In PI
if you encounter a module that lasts several seconds then you can restrict the tracing as shown below
Note Starting the Transaction Trace increases the data collection on the satellite system (PI) and is
therefore only recommended in productive environment for troubleshooting purposes
With the selection above the trace will run for 10 minutes (this is the maximum and it can be canceled earlier)
and will trace all steps exceeding 3 seconds for the agents of the PI system If such long-running steps are
found then a new window will be displayed listing these steps
In the screenshot below you can see the result in the Trace View The Trace View shows the elapsed time
from left to rightndash in the example below around 48 seconds From top to bottom we can see the call stack of
the thread In general we are interested in long-running threads on the bottom of the trace view A long-
running block at the bottom means that this is the lowest level coding that was instrumented and which is
consuming all the time
In the example below we see a mapping call that is performing many individual database statements ndash this
will become visible by highlighting the lowest level In such a case you have to review the coding of the
mapping to see if the high amount of database calls can be summarized in one call
SAP NETWEAVER 71 AND HIGHER PERFORMANCE CHECK GUIDE
106
Another case that is often seen is that a lookup using JDBC to a remote database or RFC to an ABAP
system takes a long time in the mapping or adapter module In such a case there will be one long block at
the bottom of the transaction trace that also gives you some details about the statement that was executed
A2 XPI inspector for troubleshooting and performance analysis
The XPI Inspector is an additional tool that provides enhanced logging and tracing capabilities with a main
focus on troubleshooting But the tool can also be used for troubleshooting of performance issues
General information about the tool can be found at Note 1514898 - XPI Inspector for troubleshooting PI The
tool can be called using the following URL on your system httphostjava-portxpi_inspector
To analyze performance problems typically the example ldquo51 ndash ldquoPerformance Problem)rdquo is used As a basic
measurement it allows you to take multiple thread dumps in specific time intervals These thread dumps can
be analyzed later by your administrators or SAP support to identify what is causing the problem The Thread
Dump Viewer tool (TDV) from Note 1020246 - Thread Dump Viewer for SAP Java Engine can be used to
analyze the produced thread dumps (inside the results archive that can be downloaded to your local PC)
SAP NETWEAVER 71 AND HIGHER PERFORMANCE CHECK GUIDE
107
In addition the tool allows you to do JVM profiling be either doing JVM Performance tracing or JVM Memory
Allocation tracing This can help to understand in detail which steps of the processing are taking a long time
As output the tool provides prf files that can be loaded into the JVM Profiler More information can be found
at httpwikiscnsapcomwikidisplayASJAVAJava+Profiling Please Note that these traces (especially the
memory profiling) will cause a high overhead on the J2EE engine and are therefore not recommended to be
used in production Instead it is advisable to reproduce the problem on your QA system and use the tool
there
Document Version 30 March 2014
wwwsapcom
copy 2014 SAP AG All rights reserved
SAP R3 SAP NetWeaver Duet PartnerEdge ByDesign SAP
BusinessObjects Explorer StreamWork SAP HANA and other SAP
products and services mentioned herein as well as their respective
logos are trademarks or registered trademarks of SAP AG in Germany
and other countries
Business Objects and the Business Objects logo BusinessObjects
Crystal Reports Crystal Decisions Web Intelligence Xcelsius and
other Business Objects products and services mentioned herein as
well as their respective logos are trademarks or registered trademarks
of Business Objects Software Ltd Business Objects is an SAP
company
Sybase and Adaptive Server iAnywhere Sybase 365 SQL
Anywhere and other Sybase products and services mentioned herein
as well as their respective logos are trademarks or registered
trademarks of Sybase Inc Sybase is an SAP company
Crossgate mgic EDDY B2B 360deg and B2B 360deg Services are
registered trademarks of Crossgate AG in Germany and other
countries Crossgate is an SAP company
All other product and service names mentioned are the trademarks of
their respective companies Data contained in this document serves
informational purposes only National product specifications may vary
These materials are subject to change without notice These materials
are provided by SAP AG and its affiliated companies (SAP Group)
for informational purposes only without representation or warranty of
any kind and SAP Group shall not be liable for errors or omissions
with respect to the materials The only warranties for SAP Group
products and services are those that are set forth in the express
warranty statements accompanying such products and services if
any Nothing herein should be construed as constituting an additional
warranty
wwwsapcom
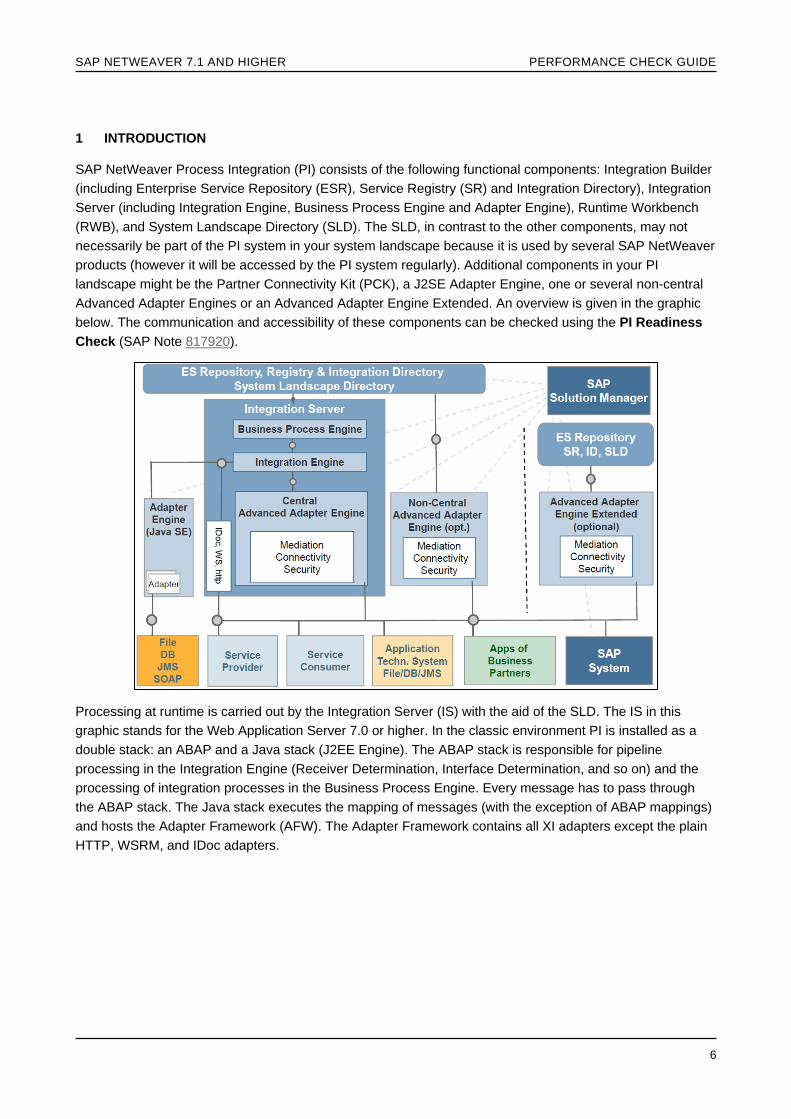
SAP NETWEAVER 71 AND HIGHER PERFORMANCE CHECK GUIDE
7
With 71 the so called Advanced Adapter Engine (AAE) was introduced The Adapter Engine was enhanced
to provide additional routing and mapping call functionality so that it is possible to process messages locally
This means that a message that is handled by a sender and receiver adapter based on J2EE does not need
to be forwarded to the ABAP Integration Engine This saves a lot of internal communication reduces the
response time and significantly increases the overall throughput The deployment options and the message
flow for 71 based systems and higher are shown below Currently not all the functionalities available in the
PI ABAP stack are available on the AAE but each new PI release closes the gap further
In SAP PI 73 and higher the Adapter Engine Extended (AEX) was introduced In addition to the AAE the
Adapter Engine Extended also allows local configuration of the PI objects The AEX can therefore be seen
as a complete PI installation running on Java only From the runtime perspective no major differences can be
seen compared to the AAE and therefore no differentiation is made in this guide
SAP NETWEAVER 71 AND HIGHER PERFORMANCE CHECK GUIDE
8
Looking at the different involved components we get a first impression of where a performance problem
might be located In the Integration Engine itself in the Business Process Engine or in one of the Advanced
Adapter Engines (central non-central plain PCK) Of course a performance problem could also occur
anywhere in between for example in the network or around a firewall Note that there is a separation
between a performance issue ldquoin PIrdquo and a performance issue in any attached systems If viewed ldquothrough
the eyesrdquo of a message (that is from the point of view of the message flow) then the PI system technically
starts as soon as the message enters an adapter or (if HTTP communication is used) as soon as the
message enters the pipeline of the Integration Engine Any delay prior to this must be handled by the
sending system The PI system technically ends as soon as the message reaches the target system for
example a given receiver adapter (or in case of HTTP communication the pipeline of the Integration Server)
has received the success message of the receiver Any delay after this point in time must be analyzed in the
receiving system
There are generally two types of performance problems The first is a more general statement that the PI
system is slow and has a low performance level or does not reach the expected throughput The second is
typically connected to a specific interface failing to meet the business expectation with regard to the
processing time The layout of this check is based on the latter First you should try to determine the
component that is responsible for the long processing time or the component that needs the highest absolute
time for processing Once this has been clarified there is a set of transactions that will help you to analyze
the origin of the performance problem
If the recommendations given in this guide are not sufficient SAP can help you to optimize the service via
SAP consulting or SAP MaxAttention services SAP might also handle smaller problems restricted to a
specific interface if you describe your problem in a SAP customer incident Support offerings like ldquoSAP
Going Live Analysis (GA)rdquo and ldquoSAP Going Live Verification (GV)rdquo can be used to ensure that the main
system parameters are configured according to SAP best practice You can order any type of service using
SAP Service Marketplace or your local SAP contacts
If you have already worked with the PI Admin Check (SAP Note 884865) you will recognize some of the
transactions This is because SAP considers the regular checking of the performance to be an important
administrational task However this check tries to show the methodology to approach performance problems
to its reader Also it offers the most common reasons for performance problems and links to possible follow-
up actions but does not refer to any regular administrational transactions
SAP NETWEAVER 71 AND HIGHER PERFORMANCE CHECK GUIDE
9
Wily Introscope is a prerequisite for analyzing performance problems at the Java side It allows you to
monitor the resource usage of multiple J2EE server nodes and provides information about all the important
components on the Java stack like mapping runtime messaging system or module processor Furthermore
the data collected by Wily is stored for several days so it is still possible to analyze a performance problem at
a later date Wily Introscope is provided free-of-charge for SAP customers It is delivered as part of Solution
Manager Diagnostics but can also be installed separately For more information see
httpservicesapcomdiagnostics or SAP Note 797147
SAP NETWEAVER 71 AND HIGHER PERFORMANCE CHECK GUIDE
10
2 WORKING WITH THIS DOCUMENT
If you are experiencing performance problems on your Process Integration system start with Chapter 3
Determining the Bottleneck It helps you to determine the processing time for the different runtimes within PI
Integration Engine Business Process Engine and Adapter Engine or connected Proxy System Once you
have identified the area in which the bottleneck is most probably located continue with the relevant chapter
This is not always easy to do because a long processing time is not always an indication for a bottleneck It
can make sense to do this if a complicated step is involved (Business Process Engine) if an extensive
mapping is to be executed (IS) or if the payload is quite large (all runtimes) For this reason you need to
compare the value that you retrieve from Chapter 3 with values that you have received previously for
example The history data provided for the Java components by Wily Introscope is a big help If this is not
possible you will have to work with a hypothesis
Once the area of concern has been identified (or your first assumption leads you there) Chapters 4 5 6
and 7 will help you to analyze the Integration Engine the Business Process Engine the PI Adapter
Framework and the ABAP Proxy runtime
After (or preferably during) the analysis of the different process components it is important to keep in mind
that the bottlenecks you have observed could also be caused by other interfaces processing at the same
time It will lead you to slightly different conclusions and tuning measures You therefore have to distinguish
the following cases based on where the problem occurs
A with regard to the interface itself that is it occurs even if a single message of this interface is processed
B or with regard to the volume of this interface that is many messages of this interface are processed at the same time
C or with regard to the overall message volume processed on PI
This can be analyzed by repeating the procedure of Chapter 3 for A) a single message that is processed
while no other messages of this interface are processed and while no other interfaces are running Then
compare this value with B) the processing time for a typical amount of messages of this interface not simply
one message as before If the values of measurement A) and B) are similar repeat the procedure with C) a
typical volume of all interfaces that is during a representative timeframe on your productive PI system or
with the help of a tailored volume test
These three measurements ndash A) processing time of a single message B) processing time of a typical
amount of messages of a single interface and C) processing time of a typical amount of messages of all
interfaces ndash should enable you to distinguish between the three possible situations
o A specific interface has long processing steps that need to be identified and improved The tuning options are usually limited and a re-design of the interface might be required
o The mass processing of an interface leads to high processing times This situation typically calls for tuning measures
o The long processing time is a result of the overall load on the system This situation can be solved by tuning measures and by taking advantage of PI features for example to establish separation of interfaces If the bottleneck is hardware-related it could also require a re-sizing of the hardware that is used
SAP NETWEAVER 71 AND HIGHER PERFORMANCE CHECK GUIDE
11
Chapters 8 9 10 and 11 deal with more general reasons for bad performance such as heavy
tracinglogging error situations and general hardware problems They should be taken into account if the
reason for slow processing cannot be found easily or if situation C from above applies (long processing times
due to a high overall load)
Important
Chapter 9 provides the basic checks for the hardware of the PI server It should not only be used when
analyzing a hardware bottleneck due to a high overall load andor an insufficient sizing but should also be
used after every change made to the configuration of PI to ensure that the hardware is able to handle the
new situation This is important because a classical PI system uses three runtime engines (IS BPE AFW)
Tuning one engine for high throughput might have a direct impact on the others With every tuning action
applied you have to be aware of the consequences on the other runtimes or the available hardware
resources
SAP NETWEAVER 71 AND HIGHER PERFORMANCE CHECK GUIDE
12
3 DETERMINING THE BOTTLENECK
The total processing time in PI consists of the processing time in the Integration Server processing time in
the Business Process Engine (if ccBPM is used) as well as the processing time in the Adapter Framework (if
adapters except IDoc plain HTTP or ABAP proxies are used) In the subsequent chapters you will find a
detailed description of how to obtain these processing times
For reasons of completeness we will also have a look at the ABAP Proxy runtime and the available
performance evaluations
31 Integration Engine Processing Time
You can use an aggregated view of the performance (details about activation in Note 820622 - Standard jobs
for XI performance monitoring) data for the Integration Engine as shown below
Procedure
Log on to your Integration Engine and call transaction SXMB_IFR In the browser window follow the link to
the Runtime Workbench In there click ldquoPerformance Monitoringrdquo Change the display to ldquoDetailed Data
Aggregatedrdquo select lsquoISrsquo as the Data Source (or lsquoPMIrsquo if you have configured the Process Monitoring
Infrastructurersquo) and ldquoXIIntegrationServerltyour_hostgtrdquo as the component Then choose an appropriate time
interval for example the last day You have to enter the details of the specific interface you want to monitor
here
The interesting value is the ldquoProcessing Time [s]rdquo in the fifth column It is the sum of the processing time of the single steps in the Integration Server For now you are not interested in the single steps that are listed on the right side since you are still trying to find out the part of the PI system where the most time is lost Chapter 44 will work with the individual steps
SAP NETWEAVER 71 AND HIGHER PERFORMANCE CHECK GUIDE
13
If you do not know which interface is affected yet you first have to get an overview Instead of navigating to
Detailed Data Aggregated in the Runtime Workbench choose Overview Aggregated Use the button Display
Options and check the options for sender component receiver component sender interface and receiver
interface Check the processing times as described above
32 Adapter Engine Processing Time
Procedure
Log on to your Integration Server and call transaction SXMB_IFR In the browser window follow the link to
the Runtime Workbench In there click Message Monitoring choose Adapter Engine lthostgt from Database
from the drop down lists and press Display Enter your interface details and ldquoStartrdquo the selection Select one
message using the radio button and press Details
Calculate the difference between the start and end timestamp indicated on the screen
Do the above calculation for the outbound (AFW IS) as well as the inbound (IS AFW) messages
The audit log of successful message is no longer persisted in SAP NetWeaver PI 71 by default in order to minimize the load on the database The audit log has a high impact on the database load since it usually consists of many rows that are inserted individually in the database In newer releases therefore a cache was implemented that keeps the audit log information for a period of time only Thus no detailed information is available any longer from a historical point of view Instead you should use Wily Introscope for historical analyses of the performance of successful messages
The audit log can be persisted on the database to allow historical analysis of performance problems
on the Java stack To do so change the parameter ldquomessagingauditLogmemoryCacherdquo from
true to false for service ldquoXPI Service Messaging Systemrdquo using NetWeaver Administrator (NWA) as described in SAP Note 1314974 Note Only do this temporarily if you have identified the bottleneck on the AFW First try using Wily to determine the root cause of the problem
SAP NETWEAVER 71 AND HIGHER PERFORMANCE CHECK GUIDE
14
Due to above mentioned limitations Wily Introscope is the right tool for performance analysis of the Adapter Engine Wily persists the most important steps like queuing module processing and average response time in historical dashboards (aggregated data per intervals for all server nodes of a system or all systems with filters possible etc)
SAP NETWEAVER 71 AND HIGHER PERFORMANCE CHECK GUIDE
15
Especially for Java-Only runtime using Integrated Configuration Wily shows the complete processing time after the initial sender adapter steps (receiver determination mapping and time in the backend call) as can be seen in the Message Processing Time dashboard below
Using the ldquoShow Minimum and Maximumrdquo functionality deviations from the average processing time can be seen In the example below a message processing step takes up to 22 seconds The reason for this could either be a slow mapping or a delay in the call to the receiver system (in the example below Java IDoc adapter is used to transfer the data to ERP)
In case of high processing times in one of your steps further analysis might be required using thread dumps or the Java Profiler as outlined in the appendix section A2 XPI inspector for troubleshooting and performance analysis
321 Adapter Engine Performance monitor in PI 731 and higher
Starting from PI 731 SP4 there is a new performance monitor available for the Adapter Engine More
information on the activation of the performance monitor can be found at Note 1636215 ndash Performance
Monitoring for the Adapter Engine Similar to the ABAP monitor in the RWB the data is displayed in an
aggregated format On the PI start page use the link ldquoConfiguration and Monitoring Homerdquo Go to ldquoAdapter
Enginerdquo and select ldquoPerformance Monitorrdquo The data is persisted on an hourly basis for the last 24 hours and
on a daily basis for the last 7 days The data is further grouped on interface level and per Java server node
With the information provided you can therefore see the minimum maximum and average response time of
an individual interface on a specific Java server node All individual steps of the message processing like
time spent in the Messaging System queues or Adapter modules are listed In the example below you can
SAP NETWEAVER 71 AND HIGHER PERFORMANCE CHECK GUIDE
16
see that most of the time (5 seconds) is spent in a module called SimpleWaitModule This would be the entry
point for the further analysis
Starting with 731 SP10 (740 SP05) this data can be exported to excel in two ways Overview or Detailed (details in SAP Note 1886761)
33 Processing Time in the Business Process Engine
Procedure
Log on to your integration server and call transaction SXMB_MONI Adjust your selection in a way that you
select one or more messages of the respective interface Once the messages are listed navigate to the
Outbound column (or Inbound if your integration process is the sender) and click on PE Alternatively you
can select the radio button for ldquoProcess Viewrdquo on the entranceselection screen of SXMB_MONI
To judge the performance of an integration process it is essential to understand the steps that are executed A long-running integration process in itself is not critical because it can wait for a trigger event or can include a synchronous call to a backend Therefore it is important to understand the steps that are included before analyzing an individual workflow log For example the screenshot below shows a long waiting time after the mapping This is perhaps due to an integrated wait step
Calculate the time difference between the first and the last entry Note that this time for the workflow does not include the duration of RFC calls for example To see this processing time navigate to the ldquoList with Technical Detailsrdquo (second button from the left on the screenshot below or shift + F9) Repeat this step for several messages to get an overview about the most time consuming steps
Please Note that the processing time mentioned above does not include the waiting time of the messages in the ccBPM queues Therefore it is essential to monitor a queue backlog in ccBPM queues as discussed in section ldquoQueuing and ccBPM (or increasing Parallelism for ccBPM Processes)rdquo
SAP NETWEAVER 71 AND HIGHER PERFORMANCE CHECK GUIDE
17
Via transaction SWI2_DURA you can display an aggregated performance overview across all ccBPM
processes running on your PI system In the initial screen you have to choose ldquo(Sub-) Workflow and the time
range you would like to look at
SAP NETWEAVER 71 AND HIGHER PERFORMANCE CHECK GUIDE
18
The results here allow you to compare the average performance of a process It shows you the processing
time based on barriers The 50 barrier means that 50 of the messages were processed faster than the
value specified Furthermore you also see a comparison of the processing time to eg the day before By
adjusting the selection criteria of the transaction you can therefore get a good overview about the normal
processing time of the Integration process and can judge if there is a general performance problem or just a
temporary one
The number of process instances per integration process can be easily checked via transaction
SWI2_FREQ The data shown allows you to check the volume of the Integration Processes and allow you to
judge if your performance problem is caused by an increase of volume which could cause a higher latency in
the ccBPM queues
New in PI 73 and higher
Starting from PI 73 a new monitoring for ccBPM processes is available This monitor can be started from
transaction SXMB_MONI_BPE Integration Process Monitoring (also available in ldquoConfiguration and
Monitoring Homerdquo on PI start page) This is new browser based view that allows a simplified and aggregated
view on the PI Integration Processes
On the initial screen you get an overview about all the Integration Processes executed in the selected time
interval Therefore you can immediately see the volume of each Integration Process
From there you can navigate to the Integration process facing the performance issues and look at the
individual process instances and the start and end time Furthermore there is a direct entry point to see the
PI messages that are assigned to this process
SAP NETWEAVER 71 AND HIGHER PERFORMANCE CHECK GUIDE
19
Choosing one special process instance ID you will see the time spend in each individual processing step
within the process In the example below you can see that most of the time is spend in the Wait Step
SAP NETWEAVER 71 AND HIGHER PERFORMANCE CHECK GUIDE
20
4 ANALYZING THE INTEGRATION ENGINE
If chapter Determining the Bottleneck has shown that the bottleneck is clearly in the Integration Engine there
are several transactions that can help you to analyze the reason for this To understand why this selection of
transactions helps to analyze the problem it is important to know that the processing within the Integration
Engine is done within the pipeline The central pipeline of the Integration Server executes the following main
steps
Central Pipeline Steps Description of Central Pipeline Steps
PLSRV_XML_VALIDATION_RQ_INB XML Validation Inbound Channel Request
PLSRV_RECEIVER_DETERMINATION Receiver Determination
PLSRV_INTERFACE_DETERMINATION Interface Determination
PLSRV_RECEIVER_MESSAGE_SPLIT Branching of Messages
PLSRV_MAPPING_REQUEST Mapping
PLSRV_OUTBOUND_BINDING Technical Routing
PLSRV_XML_VALIDATION_RQ_OUT XML Validation Outbound Channel Request
PLSRV_CALL_ADAPTER Transfer to Respective Adapter IDoc HTTP Proxy AFW
PLSRV_XML_VALIDATION_RS_INBXML Validation Inbound Channel Response
PLSRV_MAPPING_RESPONSE Response Message Mapping
PLSRV_XML_VALIDATION_RS_OUT Validation Outbound Channel Response
The last three steps highlighted in bold are available in case of synchronous messages only and reflect the
time spent in the mapping of the synchronous response message
The steps indicated in red are new in SAP NetWeaver PI 71 and higher and can be used to validate the
payload of a PI message against an XML schema These steps are optional and can be executed at different
times in the PI pipeline processing for example before and after a mapping (as shown above)
With PI 731 an additional option of using an external Virus Scan during PI message processing can be
activated as described in the Online Help The Virus Scan can be configured on multiple steps in the pipeline
ndash eg after the mapping (Virus Scan Outbound Channel Request) when receiving a synchronous response
(Virus Scan Inbound Channel Response) and after the response mapping (Virus Scan Outbound Channel
Response)
It is important to know is that these pipeline steps are executed based on qRFC Logical Unit of Work (LUW)
by using dialog work processes
SAP NETWEAVER 71 AND HIGHER PERFORMANCE CHECK GUIDE
21
With 711 and higher versions you can activate the Lean Message Search (LMS) to be able to search for
payload content This is described in more detail in chapter Long Processing Times for
ldquoLMS_EXTRACTIONrdquo
41 Work Process Overview (SM50SM66)
The work process overview is the central transaction to get an overview of the current processes running in
the Integration Engine For message processing PI is only using Dialog work processes (DIA WP) Therefore
it is essential to ensure that enough DIA WPs available
The process overview is only a snapshot analysis You therefore have to refresh the data multiple times to
get a feeling for the dynamics of the processes The most important questions to be asked are as follows
How many work processes are being used on average Use the CPU Time (clock symbol) to check that not all DIA WPs are used In case all DIA WPs have a high CPU time this indicates a WP bottleneck
Which users are using these processes It depends on the usage of your PI system All asynchronous messages are processed by the QIN scheduler who will start the message processing in DIA WPs The user that is shown in SM66 will be the one that triggered the QIN scheduler This can eg be a communication user for a connected backend (usually a copy of PIAPPLUSER) or the user used to send data from the Adapter Engine (per default PIAFUSER)
Activities related to the Business Process Engine (ccBPM) will be indicated by user WF-BATCH If you see high WF-BATCH activity take a look at chapter 51
Are there any long running processes and if so what are these processes doing with regard to the reports used and the tables accessed
o As a rule of thumb for the initial configuration the number of DIA work processes should be around six times the value of CPU in your PI system (rdispwp_no_dia = 6 to 8 times CPUs cores based on SAP Note 1375656 - SAP NetWeaver PI System Parameters)
If you would like to get an overview for an extended period of time without actually refreshing the transaction
at regular intervals use report SDFMON and schedule the Daily Monitoring It allows you to collect metrics
such as CPU usage amount of free Dialog work processes and most importantly a snapshot of the work
process activity as provided in transactions SM50 and SM66 The frequency for the data collection can be as
low as 10 seconds and the data can be viewed after the configurable timeframe of the analysis Note
SDFMON is only intended for analysis of performance issues and should only be scheduled for a limited
period of time
If you have Solution Manager Diagnostics installed and all the agents connected to PI you can also monitor
the ABAP resource usage using Wily Introscope As you can see in the dashboard below you can use it to
monitor the number of free work processes (prerequisite is that the SMD agent is running on the PI system)
The major advantage of Wily Introscope is that this information is also available from the past and allows
analysis after the problem has occurred in the system
SAP NETWEAVER 71 AND HIGHER PERFORMANCE CHECK GUIDE
22
42 qRFC Resources (SARFC)
Depending on the configuration of the RFC server group not all dialog work processes can be used for
qRFC processing in the Integration Server As stated earlier all (ABAP based) asynchronous messages are
processed using qRFC Therefore tuning the RFC layer is one of the most important tasks to achieve good
PI performance
In case you have a high volume of (usually runtime critical) synchronous scenarios you have to ensure that
enough DIA WPs are kept free by the asynchronous interfaces running at the same time Since this is a very
difficult tuning exercise we usually recommend implementing runtime critical synchronous interfaces using
Java only configuration (ICO) whenever possible If this is not possible you have to ensure via SARFC tuning
that enough work processes are kept free to process the synchronous messages
The current resource situation in the system can be monitored using transaction SARFC
Procedure
First check which application servers can be used for qRFC inbound processing by checking the AS Group
assigned in transaction SMQR
Call transaction SARFC and refresh several times since the values are only snapshot values
Is the value for ldquoMax Resourcesrdquo close to your overall number of dialog work processes Max Resources is a fixed value and describes how many DIA work processes may be used for RFC communication If the value is too low your RFC parameters need tuning to provide the Integration Server with enough resource for the pipeline processing The RFC parameters can be displayed by double-clicking on ldquoServer Namerdquo
o A good starting point is to set the values as follows
Max no of logons = 90
Max disp of own logons = 90
Max no of WPs used = 90
Max wait time = 5
Min no of free WP = 3-10 (depending on the size of the application server)
These values are specified in SAP Note 1375656 ndash SAP NetWeaver PI System Parameters (this parameter must be increased if you plan to have synchronous interfaces) To avoid any bottleneck and blocking situation free DIA WPs should always be available The value should be adjusted based on the overall number of DIA WPs available at the system and the above requirements
SAP NETWEAVER 71 AND HIGHER PERFORMANCE CHECK GUIDE
23
Note You have to set the parameters using the SAP instance profile Otherwise the changes are lost
after the server is restarted
The field ldquoResourcesrdquo shows the number of DIA WPs available for RFC processing Is this value reasonably high for example above zero all the time If the ldquoResourcesrdquo value is zero then the Integration Server cannot process XML messages because no dialog work process is free to execute the necessary qRFC There are several conclusions that can be drawn from this observation as follows
1) Depending on the CPU usage (see Chapter ldquoMonitoring CPU Capacityrdquo) it might be necessary at this time to increase the number of dialog work processes in your system If the CPU usage however is already very high increasing the number of DIA will not solve the bottleneck
2) Depending on the number of concurrent PI queues (see Chapter qRFC Queues (SMQ2)) it might be necessary to decrease the degree of parallelism in your Integration Server because the resources are obviously not sufficient to handle the load The next section describes how to tune PI inbound and outbound queues
The data provided in SARFC is also collected and shown in a graphical and historical way using Solution
Manager Diagnostic and Wily Introscope (as can be seen in the screenshot below) This allows easy
monitoring of the RFC resources across all available PI application servers
43 Parallelization of PI qRFC Queues
The qRFC inbound queues on the ABAP stack are one of the most important areas in PI tuning Therefore it
is essential to understand the PI queuing concept
PI generally uses two types of queues for message processing ndash PI inbound and PI outbound queues Both
types are technical qRFC inbound queues and can therefore be monitored using SMQ2 PI inbound queues
are named XBTI (EO) or XBQI (EOIO) and are shared between all interfaces running on PI by default The
PI outbound queues are named XBTO (EO) and XBQO (EOIO) The queue suffix (in red XBTO0___0004)
specifies the receiver business system This way PI is using dedicated outbound queues for each receiver
SAP NETWEAVER 71 AND HIGHER PERFORMANCE CHECK GUIDE
24
system All interfaces belonging to the same receiver business system are contained in the same outbound
queue Furthermore there are dedicated queues for prioritization of separation of large messages To get an
overview about the available queues use SXMB_ADM Manage Queues
PI inbound and outbound queues execute different pipeline steps
PI Inbound Queues
Pipeline Steps Description of Pipeline Steps
PLSRV_XML_VALIDATION_RQ_INB XML Validation Inbound Channel Request
PLSRV_RECEIVER_DETERMINATION Receiver Determination
PLSRV_INTERFACE_DETERMINATION Interface Determination
PLSRV_RECEIVER_MESSAGE_SPLIT Branching of Messages
PI Outbound Queues
Pipeline Steps Description of Pipeline Steps
PLSRV_MAPPING_REQUEST Mapping
PLSRV_OUTBOUND_BINDING Technical Routing
PLSRV_XML_VALIDATION_RQ_OUT XML Validation Outbound Channel Request
PLSRV_CALL_ADAPTER Transfer to Respective Adapter IDoc HTTP Proxy AFW
Before the steps above are executed the messages are placed in a qRFC queue (SMQ2) The messages
will wait till they are first in queue and till a free DIA work process is assigned to a queue The wait time in the
queue are recorded in the performance header in DB_ENTRY_QUEUING (PI inbound queue) and
DB_SPLITTER_QUEUING (PI outbound queue) Most often you will see the long processing times there as
discussed in chapter Long Processing Times for ldquoDB_ENTRY_QUEUEINGrdquo and Long Processing Times for
ldquoDB_SPLITTER_QUEUEINGrdquo
Looking at the steps above it is clear that tuning the queues will have a direct impact on the connected PI
components and also backend systems For example by increasing the number of parallel outbound queues
more mappings will be executed in parallel which will in turn put a greater load on the Java stack or more
messages will be forwarded in parallel to the backend system in case of a Proxy call Thus when tuning PI
queues you must always keep the implications for the connected systems in mind
The tuning of PI ABAP queue parameters is done in transaction SXMB_ADM Integration Engine
Configuration and by selecting the category TUNING
For productive usage we always recommend to use inbound and outbound queues (parameter
EO_INBOUND_TO_OUTBOUND=1) Otherwise only inbound queues will be used which are shared across
SAP NETWEAVER 71 AND HIGHER PERFORMANCE CHECK GUIDE
25
all interfaces Hence a problem with one single backend system will affect all interfaces running on the
system
The principle of less is sometimes more also applies for tuning the number of parallel PI queues Increasing
the number of parallel queues will result in more parallel queues with fewer entries per queue In theory this
should result in a lower latency if enough DIA WPs are available
But practically this is not true for high volume systems The main reason for this is the overhead involved in
the reloading of queues (see details below) Furthermore important tuning measures like PI packaging (see
Chapter ldquoPI Message Packagingrdquo) aim to increase the throughput based on a higher number of messages in
the queue Thus from a throughput perspective it is definitely advisable to configure fewer queues
If you have very high runtime requirements you should prioritize these interfaces and assign a different
parallelism for high priority queues only This can be done using parameters
EO_INBOUND_PARALLEL_HIGH_PRIO and EO_OUTBOUND_PARALLEL_HIGH_PRIO as described in
section ldquoMessage Prioritization on the ABAP Stackrdquo
To tune the parallelism of inbound and outbound queues the relevant parameters are
EO_INBOUND_PARALLEL and EO_OUTBOUND_PARALLEL have to be used
Below you can see a screenshot of SMQ2 You can see the PI inbound queues and outbound queues Also
ccBPM queues (XBQO$PE) are displayed and will be discussed in section 5
Procedure
Log on to your Integration Server call transaction SMQ2 and execute If you are running ABAP proxies on a
separate client on the same system enter lsquorsquo for the client Transaction SMQ2 provides snapshots only and
must therefore be refreshed several times to get viable information
o The first value to check is the number of queues concurrently active over a period of time Since each queue needs a dialog work process to be worked on the number of concurrent queues must not be too high compared to the number of dialog work processes usable for RFC communication (see Chapter qRFC Resources (SARFC)) The optimum throughput can be achieved if the number of active queues is equal to or slightly higher than the number of dialog work processes (provided that the number of DIA work processes can be handled by the CPU of the system see transaction ST06)
In case many of the queues are EOIO queues (eg because the serialization is done on the material number) try to reduce the queues by following Chapter EOIO tuning
o The second value of importance is the number of entries per queue Hit refresh a few times to check if the numbers increasedecreaseremain the same An increase of entries for all queues or a specific
SAP NETWEAVER 71 AND HIGHER PERFORMANCE CHECK GUIDE
26
queue points to a bottleneck or a general problem on the system The conclusion that can be drawn from this is not simple Possible reasons have been found to include
1) A slow step in a specific interface
Bad processing time of a single message or a whole interface can be caused by expensive processing steps as for example the mapping step or receiver determination This can be confirmed by looking at the processing time for each step as shown in ldquoAnalyzing the runtime of pipeline stepsrdquo
2) Backlog in Queues
Check if inbound or outbound queues face a backlog A backlog in a queue is generally nothing critical since the queues ensure that the PI components as well as the backend systems are not overloaded For instance batch triggered interfaces are usually causing high backlogs that get processed over time Only in case the backlog prevents you to meet the business requirements for an interface this should be analyzed
If the backlog is caused by a high volume of messages arriving in a short period of time one solution to minimize the backlog is to increase the number of queues available for this interface (if sufficient hardware is available) If one interface is having a backlog in the outbound queues you could eg specify EO_OUTBOUND_PARALLEL with a sub parameter specifying your interface to increase the parallelism for this interface
But in general a backlog can also be caused by a long processing time in one of the pipeline steps as discussed in 1) or a performance problem with one of the connected components like PI Java stack or connected backend systems Due to the steps performed in the outbound queues (mapping or call adapter) it is more likely that a backlog will be seen in the outbound queues Inbound queue processing is only expensive if Content Based Routing or Extended Receiver Determination is used To understand which step is taking long follow once more chapter ldquoAnalyzing the runtime of pipeline stepsrdquo
In addition to tuning of the number of inbound and outbound queues also ldquoMessage Prioritization on the ABAP Stackrdquo and ldquoPI Message Packagingrdquo can help
The screenshot below shows such a backlog situation in Wily Introscope Please Note that the information about the queues is only collected by Wily in 5 minutes intervals explaining the gaps between the measurement points On the dashboard ldquoTotal qRFC Inbound Queue Entriesrdquo you can see that the number of messages in SMQ2 is increasing The number of inbound queues does not increase at the same time It also offers a dashboard for the number of entries by queue name and the time entries remain in SMQ2 With the information provided here it is also possible to distinguish a blocking situation or a general resource problem after the problem is no longer present in the system
SAP NETWEAVER 71 AND HIGHER PERFORMANCE CHECK GUIDE
27
3) Queues stay in status READY in SMQ2
To see the status of the queues use the filter button in SMQ2 as shown below
It is a normal situation to see many queues in READY status for a limited amount of time The reason for this is the way the QIN scheduler reloads LUWs (see point 2 below) A waiting time of up to 5 seconds per queuing step is considered normal during normal load situation (even if there is no backlog in the queue and enough resources are available) If you observe a situation where many queues are in READY status for longer period of time the following situations can apply
A resource bottleneck with regard to RFC resources Confirm by following section qRFC Resources (SARFC)
To avoid overloading a system with RFC load the QIN scheduler only reloads new queues after a certain amount of queues have finished processing This can lead to long waiting times in the queues as explained in SAP Note 1115861 - Behaviour of Inbound Scheduler after Resource Bottleneck Since PI is a non-user system we recommend setting rfcinb_sched_resource_threshold to 3 as described in SAP Note 1375656 ndash SAP NetWeaver PI System Parameters
Long DB loading times for RFC tables If using Oracle ensure that SAP Note 1020260 - Delivery of Oracle statistics is applied
Additional overhead during the pipeline executions occurs due to PI internal mechanisms Per default a lock is set during processing of each message This is no longer necessary and should
SAP NETWEAVER 71 AND HIGHER PERFORMANCE CHECK GUIDE
28
be switched off by setting the parameter LOCK_MESSAGE of category RUNTIME to 0 as described in SAP Note 1058915 In addition during the processing of an individual message the message repeatedly calls an enqueue which leads to a deterioration of the throughput This can be avoided by setting parameter CACHE_ENQUEUE to 0 as described in SAP Note 1366904
Sometimes a queue stays in READY status for a very long time while other queues are getting processed fine After manual unlocking the queue is processed but then stops after some time again A potential reason is described in Note 1500048 - SMQ2 inbound Queue remains in READY state In a PI environment queues in status RUNNING for more than 30 minutes usually happen due to one individual step taking long (as discussed in step 1) or a problem on the infrastructure (eg memory problems on Java or HTTP 200 lost on network) After 30 minutes the QIN scheduler removes this queue from the scheduling and therefore it remains in READY To solve such cases the root cause for the blocking has to be understood
4) Queue in READY status due to queue blacklisting
If a queue is for a very long time in status RUNNING (eg due to a problem with a mapping or due to a very slow backend) it is possible that the QIN scheduler excludes this queue from queue scheduling Hence the queue stays in status READY even though enough work processes are available The ldquoblacklistingrdquo of queues takes place when the runtime of a queue exceeds the ldquoMonitoring thresholdrdquo configured on this queue Notes 1500048 - queues stay in ready (schedule_monitor) and Note 1745298 - SMQR Inbound queue scheduler identify excluded entries provide more input on this topic The screenshot below shows a setting of 2400 seconds (40 minutes) for this parameter
Check if a queue stays in READY status for a long time while others are processing without any issue Ensure Note 1745298 is implemented and check the system log for the following exception ldquoQINEXCLUDE ltqueue namegt lttimedate at which the queue scheduler startedgt If this is the case check why the long runtime occurs (see section Analyzing the runtime of PI pipeline steps) or increase the schedule_monitor in exceptional cases only (if eg the runtime of an individual processing step cannot be improved further)
5) An error situation is blocking one or more queues
Click the Alarm Bell (Change View) push button once to see only queues with error status Errors delay the queue processing within the Integration Server and may decrease the throughput if for example multiple retries occur Navigate to the first entry of the queue and analyze the problem by forward navigation to the relevant message in SXMB_MONI
Often you see EO queues in SYSFAIL or RETRY due to the problems during the processing of an individual message This can be prevented by following the description of Chapter Prevent blocking of EO queues
SAP NETWEAVER 71 AND HIGHER PERFORMANCE CHECK GUIDE
29
44 Analyzing the runtime of PI pipeline steps
The duration of the pipeline steps is the ultimate answer to long processing times in the Integration Engine
since it describes exactly how much time was spent at which point The recommended way to retrieve the
duration of the pipeline steps is the RWB and will be described below Advanced users may use the
Performance Header of the SOAP message using transaction SXMB_MONI but the timestamps are not
easy to read If you still prefer the latter method here is the explanation 20110409092656165 must be read
as yyyymmddhh(min)(min)(sec)(sec)(microseconds) that is the timestamp corresponds to April 9 2011 at
092656 and 165 microseconds Please note that these timestamps in Performance Header of
SXI_MONITOR transaction are stored and displayed in UTC time therefore conversion to system time must
be done when analyzing them
In case PI message packaging is configured the performance header will always reflect the processing time
per package Hence a duration of 50 seconds does not mean a single message took 50 seconds but
eventually the package contained 100 messages so that every message took 05 ms More details about
this can be found in section PI Message Packaging
Procedure
Log on to your Integration Server and call transaction SXMB_IFR In the browser window follow the link to
the Runtime Workbench In there click Performance Monitoring Change the display to Detailed Data
Aggregated and choose an appropriate time interval for example the last day For this selection you have to
enter the details of the specific interface you want to monitor
You will now see in the lowerndashpart of the screen a split of the processing time into single steps Check the time difference between the steps Does any step take longer than expected In the example in the screenshot below the DB_ENTRY_QUEUEING starts after 0032 seconds and ends after 0243 seconds which means it took 0211 seconds (211ms)
SAP NETWEAVER 71 AND HIGHER PERFORMANCE CHECK GUIDE
30
Compare the processing times for the single steps for different measurements as outlined in Chapter
Pipeline Steps (SXMB_MONI or RWB) For example is a single step only long if many messages
are processed or if a single message is processed This helps you to decide if the problem is a
general design problem (single message has long processing step) or if it is related to the message
volume (only for a high number of messages this process step has large values)
Each step has different follow-up actions that are described next
441 Long Processing Times for ldquoPLSRV_RECEIVER_ DETERMINATIONrdquo PLSRV_INTERFACE_DETERMINATION
Steps that can take a long time in inbound processing are the Receiver and Interface Determination In these
steps the receiver system and interface is calculated Normally this is very fast but PI offers the possibility of
enhanced receiver determinations In these cases the calculation is based on the payload of a message
There are different implementation options
o Content-Based Routing (CBR)
CBR allows defining XPath expressions that are evaluated during runtime These expressions can be combined by logical operators for example to check the value for multiple fields The processing time of such a request directly correlates to the number and complexity of the conditions defined
No tuning options exist for the system in regard to CBR The performance of this step can only be changed by reducing the number of rules by changing the design of the interfaces Another option is to use an extended receiver determination (executing a mapping program) since this is faster than CBR using many rules
o Mapping to determine Receivers
A standard PI mapping (ABAP Java XSLT) can also be used to determine the receiver If you observe high runtimes in such a receiver determination follow the steps outlined in the next section since the same mapping runtime is used
442 Long Processing Times for ldquoPLSRV_MAPPING_REQUESTrdquo
Before analyzing the mapping you must understand which runtime is used Mappings can be implemented
in ABAP as graphical mappings in the Enterprise Service Builder as self-developed Java mappings or
XSLT mappings One interface can also be configured to use a sequence of mappings executed
sequentially In such a case analysis is more difficult because it is not clear which mapping in the sequence
is taking a long time
Normal debugging and tracing tools (transaction ST12) can be used for mappings executed in ABAP Any
type of mapping can be tested from ABAP using transaction SXI_MAPPING_TEST Knowing
senderreceiver partyserviceinterfacenamespace and source message payload it is possible to check the
target message (after mapping execution) and detailed trace output (similar to contents of trace of the
message in SXMB_MONI with TRACE_LEVEL = 3) It can also be used for debugging at runtime by using
the standard debugging functionality
For ABAP based XSLT mappings it is also possible via transaction XSLT_TOOL to test trace and debug
XSLT transformations on the ABAP stack
In general the mapping response time is heavily influenced by the complexity of the mapping and the
message size Therefore to analyze a performance problem in the mapping environment you should
compare the mapping runtime during the time of the problem with values reported several days earlier to get
a better understanding
SAP NETWEAVER 71 AND HIGHER PERFORMANCE CHECK GUIDE
31
If no AAE is used the starting point of a mapping is the Integration Engine that will send the request by RFC
destination AI_RUNTIME_JCOSERVER to the gateway There it will be picked up by a registered server
program The registered server program belongs to the J2EE Engine The request will be forwarded to the
J2EE Engine by a JCo call and then executed by the Java runtime When the mapping has been executed
the result is sent back to the ABAP pipeline There are therefore multiple places to check when trying to
determine why the mapping step took so long
Before analyzing the mapping runtime of the PI system check if only one interface is affected or if you face a
long mapping runtime for different interfaces To do so check the mapping runtime of messages being
processed at the same time in the system
The best tool for such an analysis is Wily Introscope which offers a dashboard for all mappings being
executed at a given time Each line in the dashboard represents one mapping and shows the average
response time and the number of invocations
In the screenshot below you can see that many different mapping steps have required around 500 seconds
for processing Comparing the data during the incident with the data from the day before will allow you to
judge if this might be a problem of the underlying J2EE engine as described in section J2EE Engine
Bottleneck
If there is only one mapping that faces performance problems there would be just one line sticking out in the
Wily graphs If you face a general problem that affects different interfaces you can choose a longer
timeframe that allows you to compare the processing times in a different time period and verify if it is only a
ldquotemporaryrdquo issue ndash this would for example indicate an overload of the mapping runtime
If you have found out that only one interface is affected then it is very unlikely to be a system problem but
rather a problem in the implementation of the mapping of that specific interface
SAP NETWEAVER 71 AND HIGHER PERFORMANCE CHECK GUIDE
32
Check the message size of the mapping in the runtime header using SXMB_MONI Verify if the message size is larger than usual (which would explain the longer runtime)
There can also be one or many lookups to a remote system (using RFC or JDBC) causing the long processing time of a mapping Together with the application you then have to check if the connection to the backend is working properly Such a mapping with lookups can be analyzed using Wily Transaction Trace as explained in the appendix section Wily Transaction Trace
If not one but several interfaces are affected a potential system bottleneck occurs and this is described in
the following
o Not enough resources (registered server programs) available That could either be the case if too many mapping requests are issued at the same time or if one J2EE server node is down and has not registered any server programs
To check if there were too many mapping requests for the available registered server programs compare the number of outbound queues that are concurrently active with the number of registered server programs The number of outbound queues that are concurrently active can be monitored with transaction SMQ2 and counting queues with the names XBTO amp XBQOXB2O XBTA and XBQAXB2A (high priority) XBTZ and XBQZXB2Z (low priority) and XBTM (large messages) In addition to this you have to take into account mapping steps that are executed by synchronous messages or in a ccBPM process Mappings executed by a ccBPM process are not queued but the ccBPM process calls the mapping program directly using tRFC The number of registered server programs can be determined with transaction SMGW Goto Logged On Clients and filtering by the program (ldquoTP Namerdquo) AI_RUNTIME_ltSIDgt In general we recommend configuring 20 parallel mapping connections per server node
If the problem occurred in the past it is more difficult to determine the number of queues that are concurrently active One way is to use transaction SXMB_MONI and specify every possible outbound queue (field ldquoQueue IDrdquo) in the advanced selection criteria (Note wildcard search not available) The timeframe can be restricted in the upper-part of the advanced selection criteria Advanced users could use transaction SE16 to search directly in table SXMSPMAST using the field ldquoQUEUEINTrdquo
The other option is to use the Wily ldquoqRFC Inbound Queue Detailrdquo dashboard as described in qRFC Queue Monitoring (SMQ2)
To check if the J2EE is not available or if the server program is not registered for a different reason use transaction SM59 to test the RFC destination AI_RUNTIME_JCOSERVER If the problem occurred in the past search the gateway trace (transaction SMGW GoTo Trace Gateway Display File) and the RFC developer traces dev_rfc files available in the work directory for the string ldquoAI_RUNTIMErdquo In addition check the std_serverltngtout in the work directory for restarts of the J2EE Engine
SAP NETWEAVER 71 AND HIGHER PERFORMANCE CHECK GUIDE
33
o Depending on the checks above there are two options to resolve the bottleneck Of course if the J2EE was not available the reason for this has to be found and prevented in the future
The two options for tuning are
1) the number of outbound queues that are concurrently active and
2) the number of mapping connections from the J2EE server to the ABAP gateway
The increase of mapping connections is only recommended for strong J2EE servers since each mapping thread needs resources like CPU and Heap memory Too many mapping connections mean too many mappings being executed on the J2EE Engine In turn this might reduce the performance of other parts of the PI system for example the pipeline processing in the Integration Engine or the processing within the adapters of the AFW or can even cause out-of-memory errors on the J2EE engine Add additional J2EE server nodes to balance the parallel requests Each J2EE server node will
register new destinations at the gateway and will therefore take a part of the mapping load
Another option is to reduce the number of outbound queues that are concurrently active to solve the bottleneck This will certainly result in higher backlogs in the queue and is therefore only applicable for less runtime critical interfaces This option can be used if the backlog is caused by a master data interface with high volume but no critical processing time requirements In such a case you can only lower the number of parallel queues for this interface by using a sub-parameter of EO_OUTBOUND_PARALLEL in transaction SXMB_ADM By doing so you slow down one interface to ensure other (more critical) interfaces have sufficient resources available
o If multiple application servers configured on the PI system ensure that all the server nodes are connected to their local gateway (local bundle option) as described in the guide How To Scale PI
443 Long Processing Times for ldquoPLSRV_CALL_ADAPTERrdquo
Call adapter is the last step executed in the PI pipeline and forwards the message to the next component
along the message flow In most cases (local Adapter Engine IDoc or BPE) this is a local call The IDoc
adapter only puts the message on the tRFC layer (SM58) of the PI system so that the actual transfer of the
IDoc is not included in the performance header For ABAP Proxies plain HTTP or calls to a central or
decentral Adapter Engine an HTTP call is made so that network time can have an influence here
Looking at the processing time we have to distinguish asynchronous (EO and EOIO) and synchronous (BE)
interfaces
In asynchronous interfaces the call adapter step includes the transfer of the message by the network and
the initial steps on the receiver side (in most cases this just means persisting the message on the receiverrsquos
database) A long duration can therefore have two reasons
o Network latency For large messages of several MB in particular the network latency is an important factor (especially if the receiving ABAP proxy system is located on another continent for example) Network latency has to be checked in case of a long call adapter step In case HTTP load balancers are used they are considered as part of the network
o Insufficient resources on receiver side Enough resources must be available at the receiver side to ensure quick processing of a message For instance enough ICM threads and dialog work processes must be available in the case of an ABAP proxy system Therefore the analysis of long call adapter steps always has to include the relevant backend system
For synchronous messages (requestresponse behavior) the call adapter step also includes the processing
time on the backend to generate the response message Therefore the call adapter for synchronous
messages includes the time of the transfer of the request message the calculation of the corresponding
response message at the receiver side and the transfer back to PI Therefore the processing time to
process a request at the receiving target system for synchronous messages must always be analyzed to find
the most costly processing steps
SAP NETWEAVER 71 AND HIGHER PERFORMANCE CHECK GUIDE
34
444 Long Processing Times for ldquoDB_ENTRY_QUEUEINGrdquo
The value for DB_ENTRY_QUEUEING describes the time that a message has spent waiting in a PI inbound
queue before processing started In case of errors the time also includes the wait time for restart of the LUW
in the queue The inbound queues (XBTI XBT1 XBT9 XBTL for EO messages and XBQIXB2I
XBQ1XB21 XBQ9XB29 for EOIO messages) process the pipeline steps for the Receiver
Determination the Interface Determination and the Message Split (and optionally XML inbound validation)
Thus if the step DB_ENTRY_QUEUEING has a high value the inbound queues have to be monitored using
transactions SMQ2 and SARFC The reasons are similar as those outlined in chapter qRFC Resources
(SARFC) and qRFC Queues (SMQ2)
o Not enough resources (DIA work processes for RFC communication) available
o A backlog in the queues caused by one of the following reasons
The number of parallel inbound queues is too low to handle the incoming messages in parallel Note that a simple increase of the parameter EO_INBOUND_PARALLEL might not always be the solution (as enough work processes also have to be available to process the queues in parallel) The number of work processes is in turn restricted by the number of CPUs that are available for your system If you would like to separate critical from non-critical sender systems define a dedicated set of inbound queues by specifying a sender ID as a sub parameter of EO_INBOUND_PARALLEL For example by doing so you can separate master data interfaces from business critical interfaces Please note that the separation on inbound queues only works on Business System level and not on interface level
The inbound queues were blocked by the first LUW Use transaction SMQ2 to check if that is still the case To identify if such a situation occurred in the past use the Wily Introscope dashboard ldquoABAP System qRFC Inbound Detailldquo It is generally not easy to find the one message that is blocking the queue It might be achieved by checking RFC traces or by searching for a single message with a long pipeline processing step For EO queues there is no business reason to block the queues in case of a single message error To prevent this follow the description in section Prevent blocking of EO queues
In case you have a different runtime of the messages in the queues (eg due to complex extended Receiver Determinations) the number of messages per queue might be uneven distributed between the queues In PI 73 a new balancing option is available as discussed in Avoid uneven backlogs with queue balancing
Problems when loading the LUW by the QIN scheduler as described in qRFC Queues (SMQ2)
Note If your system uses the parameter EO_INBOUND_TO_OUTBOUND = 0 you must also read chapter
445 for analyzing the reasons EO_INBOUND_TO_OUTBOUND only determines whether inbound queues
(value lsquo0rsquo) or inbound and outbound queues (value lsquo1rsquo) are used for the pipeline processing in the integration
server Check the value with transaction SXMB_ADM Integration Engine Configuration Specific
Configuration The default value is lsquo1rsquo meaning the usage of inbound and outbound queues (the
recommended behavior)
445 Long Processing Times for ldquoDB_SPLITTER_QUEUEINGrdquo
The value for DB_SPLITTER_QUEUEING describes the time that a message has spent waiting in a PI
outbound queue until a work process was assigned In case of errors the time also includes the wait time for
the restart of the LUW in the queue
The outbound queues (XBTO XBTA XBTZ XBTM for EO messages and XBQOXB2O
XBQAXB2A XBQZXB2Z for EOIO messages) process the pipeline steps for the mapping outbound
binding and call adapter
SAP NETWEAVER 71 AND HIGHER PERFORMANCE CHECK GUIDE
35
Thus if the step DB_SPLITTER_QUEUEING has a high value the outbound queues have to be monitored
using transactions SMQ2 and SARFC The reasons are similar as outlined in chapters qRFC Resources
(SARFC) and qRFC Queues (SMQ2) or described in the section above for PI inbound queues
o Not enough resources (DIA work processes for RFC communication) available
o A backlog in the queues caused by one of the following reasons
The number of parallel outbound queues is too low to handle the outgoing messages in parallel Note that simply increasing the parameter EO_OUTBOUND_ PARALLEL might not always be the solution as enough work processes have to be available to process the queues in parallel The number of work processes in turn is limited by the number of CPUs available for the system Also the parameter EO_OUTBOUND_PARALLEL is used differently than the parameter EO_INBOUND_ PARALLEL because it determines the degree of parallelism for each receiver system Thus it is possible to increase the number of parallel outbound queues for specific receivers whereas other receivers are handled with a lower degree of parallelism Note that not every receiver backend is able to handle a high degree of parallelism so that in case of an ABAP Proxy system it might not indicate a problem on PI in case you observe a high value for DB_SPLITTER_QUEUING
The outbound queues were blocked by the first LUW To identify if such a situation occurred in the past use the Wily Introscope dashboard ldquoABAP System qRFC Inbound Detailldquo In general it is not easy to find the one message that is blocking the queue It might be achieved by checking RFC traces or by searching for a single message with a long pipeline processing step For EO queues there is no business reason to block the queues in case of a single message error To prevent this follow the description in section Prevent blocking of EO queues
Since the outbound queues include a processing step that is bound to take longer than the other steps (that is the mapping and the call adapter step) this might mean a long waiting time for all subsequent messages As an example assume that a mapping takes 1 second and that 100 messages are waiting in a queue The first message gets executed at once the second message has to wait about 1 second (a bit more since more steps are executed than just the mapping but this should be ignored at the moment) the third takes 3 seconds and so on The 100
th message
has to wait 100 seconds until it is processed that is the value for DB_SPLITTER_QUEUING is as high as 100 For a given outbound queue you would therefore see an increase for the DB_SPLITTER_QUEUING value over time If you experience this situation proceed with Chapter 442
In case you have a different runtime of the messages in the queues (eg due to different message size) the number of messages per queue might be uneven distributed between the queues In PI 73 a new balancing option is available as discussed in Avoid uneven backlogs with queue balancing
o Problems when loading the LUW by the QIN scheduler as described in qRFC Queues (SMQ2)
Note The number of parallel outbound queues is also connected with the ability of the receiving system to
process a specific amount of messages for each time unit
In section Adapter Parallelism default restrictions of the specific adapters of the J2EE Engine are explained Some adapters (JDBC File Mail) can process only one message for each server node at a time (this can be changed) It does not make sense for such adapters to have too many parallel qRFC queues since this will only move the message backlog from ABAP to Java
For messages that are directed to the IDoc outbound adapter the value for EO_OUTBOUND_PARALLEL is connected to the MAXCONN value of the corresponding outbound destination You can define the maximum number of connections using transaction SMQS ndash the default value is 10 parallel connections If applicable SAP highly recommends that you use IDoc packaging in the outbound IDoc adapter to reduce the load during the transmission of tRFC calls from the PI system to the receiving system
For ABAP proxy systems the number of outbound queues directly determines the number of messages sent in parallel to the receiving system Thus you have to ensure that the resources
SAP NETWEAVER 71 AND HIGHER PERFORMANCE CHECK GUIDE
36
available on PI are aligned with those on the sendingreceiving ABAP proxy system
446 Long Processing Times for ldquoLMS_EXTRACTIONrdquo
Lean Message Search can be configured for newer PI releases as described in the Online Help After
applying Note 1761133 - PI runtime Enhancement of performance measurement an additional header for
LMS will be written to the performance header
The header could look like this indicating that around 25 seconds were spent in the LMS analysis
When using trace level two additional timestamps are written to provide details about this overall runtime
LMS_EXTRACTION_GET_VALUES
This timestamp describes the evaluation of the message according to user-defined filter criteria
LMS_EXTRACTION_ADJUST_VALUES
This timestamp describes the post-processing of the previously found values in the BAdI (as of PI 730)
The runtime of the LMS heavily depends on the number of payload attributes to be extracted Also the
payload size and the complexity of the XPath expression has a direct impact on the performance of the LMS
In general the number of elements to be indexed should be kept at a minimum and very deep and complex
XPath expressions should be avoided
If you want to minimize the impact of LMS on the PI message processing time you can define the extraction
method to use an external job In that case the messages will be indexed after processing only and it will
therefore have no performance impact during runtime Of course this method imposes a delay in the
indexing (based on the frequency of job SXMS_EXTRACT_MESSAGES) so that newly processed
messages cannot be searched using LMS If this delay is acceptable for the monitoring responsible the
messages should be indexed using an external job
447 Other step performed in the ABAP pipeline
As discussed earlier there are additional steps in the ABAP pipeline that can be executed based on the
configuration of your scenario Per default these steps will not be activated and should therefore not
consume any time All these steps are traced in the performance header of the message Below you can see
the details for
- XML validation
SAP NETWEAVER 71 AND HIGHER PERFORMANCE CHECK GUIDE
37
- Virus Scan
In case one of these steps is taking long you have to check the configuration of your scenario In the
example of the Virus scan the problem might be related to the external virus scanner used and tuning has to
happen on that side
45 PI Message Packaging for Integration Engine
PI message packaging was introduced with SAP NetWeaver PI 70 SP13 and is per default activated in PI
71 and higher Message packaging in BPE is independent of message packaging in PI (see chapter 56)
but they can be used together
To improve performance and message throughput asynchronous messages can be assembled to packages
and processed as one entity For this the qRFC scheduler was enabled to process a set of messages (a
package) in one LUW Thus instead of sending one message to the different pipeline steps (for example
mappingrouting) a package of messages will be sent that will reduce the number of context switches that is
required Furthermore access to databases is more efficient since requests can be bundled in one database
operation Depending on the number and size of messages in the queue this procedure improves
performance considerably In return message packaging can increase the runtime for individual messages
(latency) due to the delay in the packaging process
Message packaging is only applicable for asynchronous scenarios (QoS EO and EOIO) Due to the potential
latency of individual messages packaging is not suitable for interfaces with very high runtime requirements
In general packaging has the highest benefit for interfaces with high volume and small message size
The performance improvement achieved directly relates to the number of the messages bundled in each
package Message packaging must not solely be used in the PI system Tests have shown that the
performance improvement significantly increases if message packaging is configured end-to-end - that is
from the sending system using PI to the receiving system Message packaging is mainly applicable for
application systems connected to PI by ABAP proxy
From the runtime perspective no major changes are introduced when activating packaging Messages
remain individual entities in regards to persistence and monitoring Additional transactions are introduced
allowing the monitoring of the packaging process
Messages are also treated individually for error handling If an error occurs in a message processed in a
package then the package will be disassembled and all messages will be processed as single messages Of
course in a case where many errors occur (for example due to interface design) this will reduce the benefits
of message packaging SAP systems connected to PI via ABAP Proxy can also make use of the message
packaging to reduce the HTTP calls necessary to transmit messages between the systems Other sending
and receiving applications in particular will not see any changes because they send and receive individual
messages and receive individual commits
The PI message packaging can be adapted to meet your specific needs In general the packaging is
determined by three parameters
SAP NETWEAVER 71 AND HIGHER PERFORMANCE CHECK GUIDE
38
1) Message count Maximum number of messages in a package (default 100)
2) Maximum package size Sum of all messages in kilobytes (default 1 MB)
3) Delay time Time to wait before the queue is processed if the number of messages does not reach
the message count (default 0 meaning no waiting time)
These values can be adjusted using transactions SXMS_BCONF and SXMS_BCM To better use the
performance improvements offered by packaging you could for example define a specific packaging for
interfaces with very small messages to allow up to 1000 messages for each package Another option could
be to increase the waiting time (only if latency is not critical) to create bigger packages
See SAP Note 1037176 - XI Runtime Message Packaging for more details about the necessary
prerequisites and configuration of message packaging More information is also available at
httphelpsapcom SAP NetWeaver SAP NetWeaver PIMobileIdM 71 SAP NetWeaver Process
Integration 71 Including Enhancement Package 1 SAP NetWeaver Process Integration Library
Function-Oriented View Process Integration Integration Engine Message Packaging
46 Prevent blocking of EO queues
In general messages for interfaces using Quality of Service Exactly Once are independent of each other In
case of an error in one message there is no business reason to stop the processing of other messages But
exactly this happens in case an EO queue goes into error due to an error in the processing of a single
message The queue will then be automatically retried in configurable intervals This retry will cause a delay
of all other messages in the queue which cannot be processed due to the error of the first message in the
queue
To avoid this a new error handling was introduced in SAP Notes 1298448 - XI runtime No automatic retry
for EO message processing (set EO_RETRY_AUTOMATIC = 0 and schedule restart job
RSXMB_RESTART_MESSAGES) and SAP Note 1393039 - XI runtime Dump stops XI queue After
applying this Note EO queues will not go in SYSFAIL status any longer These Notes are recommended for
all PI systems and are per default activated on PI 73 systems By specifying a receiver ID as sub parameter
this behavior can be configured for individual interfaces only
In PI 73 you can also configure the number of messages that would go into error before the whole queue
would be stopped For permanent errors (eg due to a problem with the receiving backend) the queue would
go into SYSFAIL so that not too many messages are going into error This also reduces the number of alerts
for Message Based Alerting To define the threshold the parameter EO_RETRY_AUT_COUNT can be set
The default value is 0 and indicates that the number of messages is not restricted
47 Avoid uneven backlogs with queue balancing
From PI 73 on a new mechanism is available to address the distribution of messages in queues Per default
in all PI versions the messages are getting assigned to the different queues randomly In case of different
runtimes of LUWs caused by eg different message sizes or different runtimes in mappings this can cause
an uneven distribution of messages within the different queues This can increase the latency of the
messages waiting at the end of that queue
To avoid such an unequal distribution the system checks the queue length before putting a new message in
the queue Hence it tries to achieve an equal balancing during inbound processing A queue which has a
higher backlog will get less new messages assigned Queues with fewer entries will get more messages
assigned Therefore it is different than the old BALANCING parameter of category TUNING) which was used
SAP NETWEAVER 71 AND HIGHER PERFORMANCE CHECK GUIDE
39
to rebalance messages already assigned to a queue The assignment of messages to queues is shown in
the diagram below
To activate the new queue balancing you have to set the parameters EO_QUEUE_BALANCING_READ and
EO_QUEUE_BALANCING_SELECT of category TUNING in SXMB_ADM If the value of the parameter
EO_QUEUE_BALANCING_READ is 0 (default value) then the messages are distributed randomly across
the queues that are available If however EO_QUEUE_BALANCING_READ is set to a value n greater than
zero then on average the current fill level of the queue is determined after every nth message and stored in
the shared memory of the application server This data is used as the basis for determining the queue (see
description of parameter EO_QUEUE_BALANCING_SELECT) relevant for balancing
The parameter EO_QUEUE_BALANCING_SELECT specifies the relative fill levels of the queues in percent
Relative here means in relation to the maximum filled queue If there are queues with a lower fill level than
defined here then only these are taken into consideration for distribution If all queues have a higher fill level
then all queues are taken into consideration
Please note that determining the fill level takes place using database access and therefore impacts system
performance The value of EO_QUEUE_BALANCING_READ should for this reason be oriented towards the
message throughput and specific requirements or even distribution For higher volume system a higher value
should be chosen
Letrsquos look at an example In case you set the parameter EO_QUEUE_BALANCING_READ to 1000 after
every 1000th incoming message the queue distribution will be checked This requires a database access
and can therefore cause a performance impact The fill level for each queue will then be written to shared
memory In our example we configured EO_QUEUE_BALANCING_SELECT to 20 At a given point in time
you have three outbound queues on the system XBTO__A contains 500 entries XBTO__B 150 and
XBTO__C contains 50 messages Therefore XBTO__B has a fill level of 30 and XBTO__C of 10 That
means the only queue relevant for balancing is XBTO__C which will get more messages assigned
Based on this example you can see that it is important to find the correct values As a general guideline to
minimize performance impact you should set EO_QUEUE_BALANCING_READ to a rather large value The
correct value of EO_QUEUE_BALANCING_SELECT depends on the criticality of a delay caused by a
backlog
SAP NETWEAVER 71 AND HIGHER PERFORMANCE CHECK GUIDE
40
48 Reduce the number of parallel EOIO queues
As discussed in Chapter Parallelization of PI qRFC Queues it is important to keep the number of queues
limited As a rule of thumb the number of active queues should be equal to the number of available work
processes in the system It is especially crucial to not have a lot of queues containing only one message
since this will cause a high overhead on the QIN scheduler due to very frequent reloading of the queues
Especially for EOIO queues we often see a high number of parallel queues containing only one message
The reason for this is for example that the serialization has to be done on document number to eg ensure
that updates to the same material are not transferred out of sequence Typically during a batch triggered
load of master data this can result in hundreds of EOIO queues in SMQ2 just containing only one or two
messages This is very bad from a performance point of view and will cause significant performance
degradation for all other interfaces running at the same time To overcome this situation the overall number
of EOIO queues (for all interfaces) can be limited as of PI 71 as described in Change Number of EOIO
Queues
The maximum number of queues can be set in SXMB_ADM Configure Filter for Queue Prioritization
Number of EOIO queues
During runtime a new set of queues will be used with the name XB2 as can be seen below for the outbound
queues
These queues will be shared between all EOIO interfaces for the given interface priority and by setting the
number of queues the parallelization for all EOIO interfaces is limited Thus more messages will be using the
same EOIO queue and therefore PI message packaging will work better and also the reloading of the
queues by the QIN scheduler will show much better performance
In case of errors the messages will be removed from the XB2 queues and will be moved to the standard
XBQ queues All other messages for the same serialization context will be moved to the XBQ queue
directly to ensure the serialization is maintained This means that in case of an error the shared EOIO
queues will not be blocked and messages for other serialization contexts will be not delayed
SAP NETWEAVER 71 AND HIGHER PERFORMANCE CHECK GUIDE
41
49 Tuning the ABAP IDoc Adapter
Very often the IDoc adapter deals with very high message volume and tuning of this is very essential
491 ABAP basis tuning
As stated above the IDoc adapter uses the tRFC layer to transfer messages from PI to the receiver system
The IDoc adapter will only put the message in SM58 and from there the standard tRFC layer forwards the
LUW You therefore have to ensure that sufficient resources (mainly DIA WPs) are available for processing
tRFC requests
Wily Introscope also offers a dashboard (shown below) for the tRFC layer which shows the tRFC entries and
their different statuses With these dashboards you are also able to identify history backlogs on tRFC
In order to control the resources used when sending the IDocs from sender system to PI or from PI to the
receiver backend you can also think about registering the RFC destinations in SMQS in PI as known from
standard ALE tuning By changing the Max Conn or the Max Runtime values in SMQS you can limit or
increase the number of DIA WPs used by the tRFC layer to send the IDocs for a given destination This will
mitigate the risk of system overload on sender and receiver side
SAP NETWEAVER 71 AND HIGHER PERFORMANCE CHECK GUIDE
42
492 Packaging on sender and receiver side
One option for improving the performance of messages processed with the IDoc adapter is to use IDoc
packaging
The receiver IDoc adapter in PI (for sending messages from PI to the receiving application system) already
had the option for packaging IDocs in previous releases For this messages processed in the IDoc adapter
are bundled together before being sent out to the receiving system Thus only one tRFC call is required to
send multiple IDocs The message packaging that is being discussed in section PI Message Packaging uses
a similar approach and therefore replaces the ldquooldrdquo packaging of IDocs in the receiver IDoc adapter
Therefore we highly recommend configuring Message Packaging since this helps transferring data for the
IDoc adapter as well as the ABAP Proxy
For the sender IDoc adapter there was previously the option to activate packaging in the partner profile of
the sending system in case IDocs are not send immediately but in batch By specifying the ldquoMaximum
Number of IDocsrdquo in the report RSEOUT00 multiple IDocs are bundled in one tRFC calls At the PI side
these packages will be disassembled by the IDoc adapter and the messages will be processed individually
Therefore this will help mainly to reduce the tRFC resources involved in transferring the data between the
systems but not within PI
This behavior was changed with SAP NetWeaver PI 711 and higher If the sender backend sends an IDoc
package to PI a new option has been introduced which allows the processing of IDocs as a package on PI
as well You can specify an IDoc package size on the sender IDoc Communication Channel The necessary
configuration is described in detail in the following SDN blog - IDoc Package Processing Using Sender IDoc
Adapter in PI EhP1 A significant increase in throughput was recorded for high volume interfaces with small
IDocs
493 Configuration of IDoc posting on receiver side
As described in SAP Note 1828282 - IDoc adapter long runtime XI -gt IDoc-gt ALE also the way the IDocs
are posted on the receiver ERP backend will directly influence the processing of the LUW on the PI side In
general two options exist for IDoc posting
Trigger immediately The IDoc will be posted directly when it is received For this a free dialog workprocess will be required
Trigger by background program If this option is chosen the IDoc is persisted on the ERP side and the posting of the application data will happen asynchronously using report RBDAPP01 via a background job
SAP NETWEAVER 71 AND HIGHER PERFORMANCE CHECK GUIDE
43
When ldquotrigger immediatelyrdquo is configured the sender system (PI) has to wait till the IDoc is posted While the
workprocess will roll out you will see the LUW in ldquoTransaction Executingrdquo during this time For the
IDOC_AAE the RFC connection and the java threads will be kept busy until the IDOC is posted in the
backend therefore leading to backlogs on the IDOC_AAE
The coding for posting the application data can be very complex and therefore this operation can take a long
time consuming unnecessary resources also on the sender side With background processing of the IDocs
the sender and receiver systems are decoupled from each other
Due to this we generally recommend to use ldquotrigger immediatelyrdquo in exceptional cases where the data has to
be posted without any delay In all other cases like high volume replication of master data background
processing of IDocs should be chosen
With Note 1793313 and 1855518 a third option for posting IDocs on the ERP side was introduced This
option is using bgRFC on the ERP side to queue the IDocs As soon as the configured resources for the
bgRFC destination are available the IDocs will be posted By doing so the IDocs will be posted based on
resource availability on the receiver system and no additional background jobs will be required Furthermore
storing the LUWs in bgRFC will ensure that the sender and receiver systems are decoupled This option
therefore guarantees that the IDocs will be posted as soon as possible based on the available resources on
the receiver system without the requirement to schedule many background jobs This new option is therefore
the recommended way of IDoc posting in systems that fulfill the necessary requirements
SAP NETWEAVER 71 AND HIGHER PERFORMANCE CHECK GUIDE
44
410 Message Prioritization on the ABAP Stack
A performance problem is often caused by an overload of the system for example due to a high volume
master interface If business critical interfaces with a maximum response time are running at the same time
then they might face delays due to a lack of resources Furthermore as described in qRFC Queues (SMQ2)
messages of different interfaces use the same inbound queue by default which means that critical and less-
critical messages are mixed up in the same queue
We highly recommend using message prioritization on the ABAP stack to prevent such delays for critical
interfaces (for Java see Interface Prioritization in the Messaging System )
For more information about PI prioritization see httphelpsapcom and navigate to SAP NetWeaver SAP
NetWeaver PIMobileIdM 71 SAP NetWeaver Process Integration 71 Including Enhancement Package 1
SAP NetWeaver Process Integration Library Function-Oriented View Process Integration
Integration Engine Prioritized Message Processing
To balance the available resources further between the configured interfaces you can also configure a
different parallelization level for queues with different priorities Details for this can be found in SAP Note
1333028 ndash Different Parallelization for HP Queues
SAP NETWEAVER 71 AND HIGHER PERFORMANCE CHECK GUIDE
45
5 ANALYZING THE BUSINESS PROCESS ENGINE (BPE)
This chapter helps to analyze performance problems if Chapter Determining the Bottleneck has shown that
the BPE is the slowest step for a message during its time in the PI system Of course this type of runtime
engine is very susceptible to inefficient design of the implemented integration process Information about
best practices for designing BPE processes can be found in the documentation Making Correct Use of
Integration Processes In general the memory and resource consumption is higher than for a simple pipeline
processing in the Integration Engine As outlined in the document linked above every message that is sent
to BPE and every message that is sent from BPE is duplicated In addition work items are created for the
integration process itself as well as for every step More database space is therefore required than
previously expected and more CPU time is needed for the additional steps
51 Work Process Overview
The Business Process Engine executes the steps (work items) of an integration process using tRFC calls to
the RFC destination WORKFLOW_LOCAL_ltclientgt To check if there are enough resources available to
process the work items call transaction SM50 (on each application server) while one of the integration
processes is running
o Look for the user ldquoWF-BATCHrdquo and follow its activities by refreshing the transaction
o Are there always dialog work processes available
The most important point to keep in mind here is the concurrent activity of the Business Process Engine (for
ccBPM processes) and the Integration Engine (for pipeline processing) Both runtime environments need
dialog work processes Thus performance problems in one of the engines cannot be solved by restricting
the other Rather an appropriate balance between the two runtimes has to be found
The activity of the WF-BATCH user is not restricted by default It is highly recommended that you register the
RFC destination WORKFLOW_LOCAL_ltclientgt with transaction SMQS and assign a suitable amount of
maximum connections Otherwise ccBPM activity may block the pipeline processing of the Integration
Server and reduce the throughput of PI drastically SAP Note 888279 - Regulatingdistributing the Workflow
Load gives more details
In addition it might help to use specific servers (dialog instances) to carry out a given workflow or to use load
balancing Of course both options only apply for larger PI systems that consist of at least a central instance
and one dialog instance
52 Duration of Integration Process Steps
As described in section Processing Time in the Business Process Engine with PI 73 there is a new monitor
available in ldquoConfiguration and Monitoring Homerdquo on PI start page It shows the duration of individual steps
of an integration process in a very easy way and is the now tool to analyze performance related issues on
the ccBPM
SAP NETWEAVER 71 AND HIGHER PERFORMANCE CHECK GUIDE
46
For releases prior than PI 73 check in the workflow log for long-running steps as described in the previous
chapter Use the ldquoList with Technical Detailsrdquo to do so Since the design of integration processes varies
significantly there is no general rule for the duration of a step or for specific sequences of steps Instead
you have to get a feeling for your implemented integration processes
Did a specific process step decrease in performance over a period of time
Does one specific process step stick out with regard to the other steps of the same integration process
Do you observe long durations for a transformation step (ldquomappingrdquo)
Do you observe long durations of synchronous sendreceive steps in the integration process which correlates for example to a slow response from a connected remote system
Use the SAP Notes database to learn about recommendations and hints SAP Note 857530 - BPE
Composite Note Regarding Performance acts as a central note for all performance notes and might be used
as the entry point
Once you are able to answer the above questions there are several paths to follow
o Two common reasons should be taken into consideration for a performance decrease over time Firstly the load on PI might have increased over time as well Check the hardware resources (chapter 9) and carefully monitor the work process availability (chapter 51) Alternatively the underlying databases might slow down the integration processes Use chapter 54 to check this possibility
o If it is a specific process step that sticks out the process design itself has to be reviewed The SAP Notes mentioned above might help here
o If the mapping step takes a long time it is worth having a look at chapter 442 since the BPE and the IE use the same resources (mapping connections from the ABAP gateway to the J2EE server) to execute their mapping
o If there is a long processing time for a synchronous sendreceive step check the connected backend system for any performance issues
SAP NETWEAVER 71 AND HIGHER PERFORMANCE CHECK GUIDE
47
53 Advanced Analysis Load Created by the Business Process Engine (ST03N)
Since the Business Process Engine runs on the ABAP part of the PI Integration Server you can use the
statistical data written by the dialog work processes to analyze a performance problem
Procedure
Log in to your Integration Server and call transaction ST03N Switch to ldquoExpert Moderdquo and choose the
appropriate timeframe (this could be the ldquoLast Minutersquos Loadrdquo from the Detailed Analysis menu or a specific
day or week from the Workload menu) In the Analysis View navigate to User and Settlement Statistics and
then to User Profile The user you are interested in is the WF-BATCH user who does all ccBPM-related work
Compare the total CPU Time (in seconds) to the time frame (in seconds) of the analysis In the above example an analysis time frame of 1 hour has been chosen which corresponds to 3600 seconds To be exact these 3600 seconds have to be multiplied by the number of available CPUs Out of these 3600CPU seconds the WF-BATCH user used up 36 seconds
o The above value gives you a good idea of how much load the Business Process Engine creates on your PI Integration Server By comparison with the other users (as well as the CPU utilization from transaction ST06) you can determine if the Integration Server is able to handle this load with the available number of CPUs or not This does not help you to optimize the load but it does provide support when deciding how to distribute the workload of the BPE and the workload of the Integration Server (see Chapter 51)
Experienced ABAP administrators should also analyze the database time wait time and compare these values
54 Database Reorganization
The database is accessed many times during the processing of an Integration Process This is not usually
connected with performance problems but if a specific database table is large then statements may take
longer than for small database tables
Use transaction ST05 to collect a SQL trace while the integration process in question is being executed Restrict the trace to user WF-BATCH When the integration process is finished stop the trace and view it Look for high values in the duration column especially for SELECT statements
Use transaction SE16 to determine the number of entries for the typical workflow tables SWW_WI2OBJ and SWFRXI There are many more database tables used by BPE but if the number of entries is high for the above tables they are high for the rest as well See SAP Note 872388 - Troubleshooting Archiving and Deletion in XI and the links given in this note if you find high amounts of entries
SAP NETWEAVER 71 AND HIGHER PERFORMANCE CHECK GUIDE
48
55 Queuing and ccBPM (or increasing Parallelism for ccBPM Processes)
Until recently ccBPM processes accepted messages from only one queue (one queue XBQO$PEWS for
each workflow) If there was a high message throughput for this workflow then a high backlog occurred for
these queues A couple of enhancements have therefore been implemented to improve scalability if the
ccBPM runtime
o Inbound processing without buffering
o Use of one configurable queue that can be prioritized or assigned to a dedicated server
o Use of multiple inbound queues (queue name will be XBPE_WS)
o Configure transactional behavior of ccBPM process steps to reduce number of persistency steps
Details about the configuration and tuning of the ccBPM runtime are described at
httpswwwsdnsapcomirjsdnhowtoguides SAP Netweaver 70 End-to-End Process Integration
o How to Configure Inbound Processing in ccBPM Part I Delivery Mode
o How to Configure Inbound Processing in ccBPM Part II Queue Assignment
o How to Configure ccBPM Runtime Part III Transactional Behavior of an Integration Process
Procedure
Use transaction SMQ2 to check if the queues of type XBQO$PE show a high backlog
o Based on this information verify if the ccBPM process is suitable to run with multiple queues This is especially the case for collect patterns realized in BPE If you can use multiple queues configure the workflow based on the above guides
56 Message Packaging in BPE
Inbound processing takes up the most amount of processing time in many scenarios within BPE
Message packaging in BPE helps to improve performance by delivering multiple messages to BPE process
instances in one transaction This can lead to an increased throughput which means that the number of
messages that can be processed in a specific amount of time can increase significantly Message packaging
can also increase the runtime for individual messages (latency) due to the delay in the packaging process
The sending of packages can be triggered when the packages exceed a certain number of messages a
specific package size (in kB) or a maximum waiting time The extent of the performance improvement that
can be obtained depends on the type of scenario Scenarios with the following prerequisites are generally
most suitable
o Many messages are received for each process instance
o Messages that are sent to a process instance arrive together in a short period of time
o Generally high load on the process type
o Messages do not have to be delivered immediately
For example collect scenarios are particularly suitable for message packaging The higher the number of
messages is in a package the higher the potential performance improvements will be
Tests that have been performed have shown a high potential for throughput improvements up to factor 47 in
tested Collect Scenarios depending on the packaging size that has been configured For more details about
the functionality of Message Packaging in BPE and its configuration see SAP Note 1058623 - BPE
Message Packaging
SAP NETWEAVER 71 AND HIGHER PERFORMANCE CHECK GUIDE
49
Message packaging in BPE is independent of message packaging in PI (see Chapter 45) but they can be
used together
SAP NETWEAVER 71 AND HIGHER PERFORMANCE CHECK GUIDE
50
6 ANALYZING THE (ADVANCED) ADAPTER ENGINE
This chapter describes further checks and possible reasons for bottlenecks in the (Advanced) Adapter
Engine Although this is not the place to describe the architecture of the Adapter Framework in detail the
following aspects are important to know for the analysis of a performance problem on the AFW
o The AFW contains the Messaging System that is responsible for the persistence and queuing of messages Within the flow of a message it is placed in between the sender adapter (for example a file adapter that polls from a folder) and the Integration Server as well as between the Integration Server and the receiver adapter (for example a JMS adapter that sends a message out to an external system)
o The Messaging System uses 4 queues for each adapter type and these are responsible for receiving and sending messages To separate the message transfer each adapter (for example JMS SOAP JDBC and so on) has its own set of queues One queue for receiving synchronous messages (Request queue) one queue for sending synchronous messages (Call queue) one queue for receiving asynchronous messages (Receive queue) and one queue for sending asynchronous messages (Send queue) The name of the queue always states the adapter type and the queue name (for example JMS_httpsapcomxiXISystemReceive for the JMS receiver asynchronous queues)
o A configurable number of consumer threads are assigned on each queue These threads work on the queue in parallel meaning that the Messaging Queues are not strictly FirstIn-FirstOut Five threads are assigned by default to each queue and thus five messages can be processed in parallel But as will be discussed later the parallel execution of requests to the backend depends heavily on the adapter being used since not every adapter can work in parallel by default
o SAP NetWeaver PI 71 introduced a new queue The dispatcher queue The dispatcher queue is used to realize prioritization on the AAE (see chapter Prioritization in the Messaging System) Every message in the PI system is first assigned to the dispatcher queue before it is assigned to the adapter-specific queues
Viewed from the perspective of a message that enters the PI system using a J2EE Engine adapter (for
example File) and leaves the PI system using a J2EE Engine adapter (for example JDBC) asynchronously
the steps are as follows
1) Enter the sender adapter
2) Put into the dispatcher queue of the messaging system
3) Forwarded to the File send queue of the messaging system (based on Interface priority)
4) Retrieved from the send queue by a consumer thread
5) Sent from the messaging system to the pipeline of the ABAP Integration Engine (if no Integrated Configuration (AAE) is used
6) Processed by the pipeline steps of the Integration Engine
7) Sent to the messaging system by the Integration Engine
8) Put into the dispatcher queue of the messaging system
9) Forwarded to the JDBC receive queue of the messaging system (based on Interface priority)
10) Retrieved from the receive queue (based on the maxReceivers)
11) Sent to the receiver adapter
12) Sent to the final receiver
SAP NETWEAVER 71 AND HIGHER PERFORMANCE CHECK GUIDE
51
All the analysis is based on the information provided in the Audit Log With SAP NetWeaver PI 71 the audit
log is not persisted for successful messages in the database by default to avoid performance overhead
Therefore the audit log is only available in the cache for a limited period of time (based on the overall
message volume) More details can be found in chapter Persistence of Audit Log information in PI 710 and
higher
As described in chapter Adapter Engine Performance monitor in PI 731 and higher a new performance
monitor is available from PI 731 SP4 With this monitor you can display the processing time per interface in
a given interval and identify the processing steps in which a lot of time is spend
With 731 SP10 and 74 SP5 a download functionality for the performance monitor is provided as described
in SAP Note 1886761
61 Adapter Performance Problem
Compared to a bottleneck in the Messaging System it is relatively easy to detect a performance
problembottleneck in the adapter Since the timestamps for inbound and outbound messages are written at
different points in time the procedure is described separately for sender and receiver adapters
Note It is not generally possible for all sender and receiver adapters to work in parallel (discussed in section
Adapter Parallelism)
611 Adapter Parallelism
As mentioned before not all adapters are able to handle requests in parallel Thus increasing the number of
threads working on a queue in the messaging system will not solve a performance problembottleneck
There are 3 strategies to work around these restrictions
1) Create additional communication channels with a different name and adjust the respective senderreceiver agreements to use them in parallel
2) Add a second server node that will automatically have the same adapters and communication channel running as the first server node This does not work for polling sender adapters (File JDBC or Mail) since the adapter framework scheduler assigns only one server node to a polling communication channel
3) Install and use a non-central Adapter Framework for performance-critical interfaces to achieve better separation of interfaces
SAP NETWEAVER 71 AND HIGHER PERFORMANCE CHECK GUIDE
52
Some of the most frequently-used adapters and the possible options are discussed below
o Polling Adapters (JDBC Mail File)
At the sender side these adapters use an Adapter Framework Scheduler which assigns a server node that does the polling at the specified interval Thus only one server node in the J2EE cluster does the polling and no parallelization can be achieved Therefore scaling via additional server node is not possible More details will be presented in section Adapter Framework Scheduler For example since the channels are doing the same SELECT statement on the database or pick up files with the same file name parallel processing will only result in locking problems To increase the throughput for such interfaces the polling interval has to be reduced to avoid a big backlog of data that is to be polled If the volume is still too high you should think about creating a second interface for example the new interface would poll the data from a different directory or database table to avoid locking
At the receiver side the adapters work sequentially on each server node by default For example only one UPDATE statement can be executed for JDBC for each Communication Channel (independent of the number of consumer threads configured in the Messaging System) and all the other messages for the same Communication Channel will wait until the first one is finished This is done to avoid blocking situations on the remote database On the other hand this can cause blocking situations for whole adapters as discussed in section Avoid Blocking Caused by Single SlowHanging Receiver Interface
To allow better throughput for these adapters you can configure the degree of parallelism at the receiver side In the Processing tab of the Communication Channel in the field ldquoMaximum Concurrencyrdquo enter the number of messages to be processed in parallel by the receiver channel For example if you enter the value 2 then two messages are processed in parallel on one J2EE server node The parallel execution of these statements at database level of course depends on the nature of the statements and the isolation level defined on the database If all statements update the same database record database locking will occur and no parallelization can be achieved
o JMS Adapter
The JMS adapter is per default using a push mechanism on the PI sender side This means the data is pushed by the sending MQ provider Per default every Communication channel has one JMS connection established per J2EE server node On each connection it processes one message after the other so that the processing is sequential Since there is one connection per server node scaling via additional server nodes is an option
With Note 1502046 - JMS Adapter message pull mechanism the JMS protocol can be changed to use a pull mechanism By doing so you can specify a polling interval in the PI Communication Channel and PI will be the initiator of the communication Also here the Adapter Framework Scheduler is used which implies sequential processing But in contrary to JDBC or File sender channels the JMS polling sender channel will allow parallel processing on all server nodes of the J2EE cluster Therefore scaling via additional J2EE server nodes is an option
The JMS receiver side supports parallel operation out of the box Only some small parts during message processing (pure sending of the message to the JMS provider) are synchronized Therefore to enable parallel processing on the JMS receiver side no actions are necessary
o SOAP Adapter
The SOAP adapter is able to process requests in parallel The SOAP sender side has in general no limitations in the number of requests it can execute in parallel The limiting factor here is the FCAThreads available to process the incoming HTTP calls This is discussed in more detail in chapter Tuning SOAP sender adapter On the receiver side the parallelism depends on the number of the threads defined in the messaging system and the ability of the receiving system to cope with the load
SAP NETWEAVER 71 AND HIGHER PERFORMANCE CHECK GUIDE
53
o RFC Adapter
The RFC adapter offers parameters to adjust the degree of parallelism by defining the number of initial and maximum connections to be used The initial threads are allocated from the Application thread pool directly and are therefore not available for any other tasks Therefore the number of initial thread should be kept minimal To avoid bottlenecks during the peak time the maximum connections can be used A bottleneck is indicated by the following exception in the Audit Log
comsapaiiaframsapiDeliveryException error while processing message to remote systemcomsapaiiafrfccoreclientRfcClientException resource error could not get a client from JCOPool comsapmwjcoJCO$Exception (106) JCO_ERROR_RESOURCE Connection pool RfcClient hellip is exhausted The current pool size limit (max connections) is 1 connections
Also this should be done carefully since these threads will be taken from the J2EE application thread pool Therefore a very high value there can cause a bottleneck on the J2EE engine and therefore cause a major instability of the system As per RFC adapter online help the maximum number of connections are restricted to 50
o IDoc_AAE Adapter
The IDoc adapter on Java (IDoc_AAE) was introduced with PI 73 On the sender side the parallelization depends on the configuration mode chosen In Manual Mode the adapter works sequential per server node For channels in ldquoDefault Moderdquo it depends on the configuration of the inbound Resource Adapter (RA) Via the parameter MaxReaderThreadCount of the inbound RA you can configure how many threads are globally available for all IDoc adapters running in Default Mode Hence this determines the overall parallelization of the IDoc sender adapter per Java server node Currently the recommended maximum number of threads is 10
The receiver side of the Java IDoc adapter is working parallel per default
The table below gives a summary of the parallelism for the different adapter types
SAP NETWEAVER 71 AND HIGHER PERFORMANCE CHECK GUIDE
54
612 Sender Adapter
The first step(s) to be taken for a sender adapter depend on the type of adapter itself Afterwards however
the message flow is always the same First the message is processed in the Module Processor and
afterwards put into the queue of the Messaging System If the message is synchronous then it is the call
queue if the message is asynchronous that it is the send queue The final action of the Adapter Framework
is then to send the message from the messaging system to the Integration Server (for Non ICO interfaces)
Only the first entries of the audit log are of interest to establish if the sender adapter has a performance
problem From the first entry to the entry ldquoMessage successfully put into the queuerdquo These steps logically
belong to the sender adapter and the Module Processor while the subsequent steps belong to the
Messaging System The sender adapter uses one J2EE Engine application thread to execute its work This
is generally the same thread for all steps involved
Select the ldquoDetailsrdquo of a message in the AFW The first entry of the audit log will be the beginning of the activity of the sender adapter The end of the adapterrsquos activity is marked by the entry ldquoThe application sent the message asynchronously using connection Returning to applicationrdquo
6121 Tuning SOAP sender adapter As described above in general there is no limitation in the parallelization of the SOAP sender adapter itself
The incoming SOAP requests are limited by the available FCA Threads for HTTP processing The FCA
Threads are discussed in more detail in FCA Server Threads
Per default all interfaces using the SOAP adapter are using the same set of FCA Threads since they are all
using the same URL httplthostgtltportgtMessageServlet In case one interface is facing a very high load or
slow backend connections this can cause a blockage of the available FCA Threads and could cause a heavy
impact on the processing time of other interfaces
To avoid this SAP Note 1903431 allows the usage of different URLs for specific interfaces This way you
could isolate interfaces with a very high volume on a dedicated entry point using its own set of FCA Threads
In case of high load for this interface the other SOAP sender interfaces would not be affected by a shortage
of FCA Threads
SAP NETWEAVER 71 AND HIGHER PERFORMANCE CHECK GUIDE
55
To use this new feature you can specify on the sender system the following two entry points
o MessageServletInternal
o MessageServletExternal
More information about the URL of the SOAP adapter can be found here
613 Receiver Adapter
For a receiver adapter it is just the other way around when compared to the sender adapter First the
message is received from the Integration Server and then put into a queue of the Messaging System this
time either the request or the receive queue for asynchronous and the request queue for synchronous
messages The last step is then the activity of the receiver adapter itself
Select the ldquoDetailsrdquo of a message in the AFW The adapter activity starts after the entry ldquoThe message status set to DLNGrdquo The message will then be forwarded to the entry point of the AFW ldquoDelivering to channel ltchannel_namegtrdquo enters the Module Processor ldquoMP Entering Module Processorrdquo and ends with ldquoThe message was successfully delivered to the application using connection rdquo
Depending on the type of the adapter you now have to investigate why the receiver adapter needs a high amount of processing time This could be a complicated operating system command a bad network connection or a slow backend system among many other reasons
Here too custom modules can be the reason for a prolonged processing time Check Performance of Module Processing for more details
Note From 71 the audit log is not persisted any longer for performance reasons as described in Persistence of Audit Log information in PI 710 and higher
SAP NETWEAVER 71 AND HIGHER PERFORMANCE CHECK GUIDE
56
614 IDoc_AAE adapter tuning
A comprehensive and up-to date description about the tuning of the IDoc adapter is summarized in Note
1641541 - IDoc_AAE Adapter performance tuning Please refer to this Note for details
Similar to all other adapters running on the Adapter Engine also the IDOC_AAE adapter is using the Messaging System queues and the explanations of the next chapter Messaging System Bottleneck are also valid for the IDOC_AAE adapter Note that the IDOC_AAE adapter only supports async Scenarios ndash so it is only using the ldquoSendrdquo queue in Java-only scenarios and the ldquoSendrdquo and ldquoReceiverdquo queue in dual-stack scenariosrdquo
For the IDoc_AAE sender you can configure in addition bulk support as indicated in the screenshot below By doing so all messages received by PI in one RFC call from ERP will be processed as one message This is similar to the mechanism of the ABAP IDoc adapter described in the chapter Packaging on sender and receiver side except with the difference that the number of messages in one bulk cannot be further limited
It is also essential to ensure that the size of the IDocs or IDoc packages for sender or receiver IDocs is not
getting too large to avoid any negative impact on the Java heap memory and Garbage Collection In the
case of the IDoc_AAE adapter the XML size of the IDoc is less critical it is the number of segments in an
IDoc or the overall number of segments in all IDocs of an IDoc package that will influence the memory
allocation during message processing Based on the current implementation per IDoc segment around 5 KB
of memory during processing is required A package of 5 IDocs with 2000 segments for each IDoc would
consume roughly 500 MB during processing In such cases it is important to eg lower the package size
andor use large message queues as outlined in chapter Large message queues on PI Adapter Engine
615 Packaging for Proxy (SOAP in XI 30 protocol) and Java IDoc adapter
Due to message packaging in the Integration Engine (see PI Message Packaging for Integration Engine) the
ABAP based IDoc and Proxy adapter was always using packaging when sending asynchronous messages
to the receiver system With PI 731 packaging was also introduced for Java based IDoc and Proxy (SOAP in
XI 30 protocol) adapter The aim of packaging is to achieve similar benefits to packaging already existing in
ABAP pipeline
o Less calls to backend consuming less parallel Dialog Work Processes on the receiver
o Less overhead due to context switches authentication when calling the backend
Especially for high volume interfaces packaging should be enabled to avoid overloading of the backend
systems and impact on users operating on the system
SAP NETWEAVER 71 AND HIGHER PERFORMANCE CHECK GUIDE
57
Important
In the ABAP stack the packaging is active per default (in 71 and higher) as described in chapter PI
Message Packaging for Integration Engine Experience shows that packaging can have a very high impact
on the DIA Work process usage on the ERP receiver side Especially for migration projects from dual-stack
PI to AEXPO it is important to evaluate packaging to avoid any negative impact on the receiving ECC due
to missing packaging
The packaging on Java works in general different then on ABAP While in ABAP the aggregation is done on
the individual qRFC queue level (which always contains messages to one receiver system only) this is not
possible on the Adapter Engine since messages for all receivers are located in the same queue Therefore
packages are built outside of the Adapter Engine queues The messages to be packaged will be forwarded
to a bulk handler which waits till either the time for the package is exceeded or the number of messages or
data size is reached After this the message is send by a bulk thread to the receiving backend system
Packaging on Java is always done for a server node individually If you have a high number of server nodes
packaging will work less efficiently due to the load balancing of messages across the available server nodes
When enabling message packaging the message status will stay in status ldquoDeliveringrdquo throughout all steps
described above In the audit log you can see the time it spends in packaging The audit log shown below
shows eg that the message was almost waiting one minute before the package was built and 9 IDocs were
sent with this package
Packaging can be enabled globally by setting the following parameters in Messaging System service as
described in Note 1913972
o messagingsystemmsgcollectorenabled Enable packaging or disable it globally
o messagingsystemmsgcollectormaxMemPerBulk The maximum size of a bulk message
o messagingsystemmsgcollectorbulkTimeout The wait time per bulk - default 60 seconds
o messagingsystemmsgcollectormaxMemTotal Maximum memory which can be used by message collector
o messagingsystemmsgcollectorpoolSize Number of parallel threads used to send out packages to the backend This value has to be tuned based on the general performance of the receiver system the network latency between the systems or the configuration of the IDoc posting on the ERP sender side (described in chapter IDoc posting on receiver side) Therefore tuning of these threads might be very important These threads can unfortunately not be monitored yet with any PI tool or Wily
SAP NETWEAVER 71 AND HIGHER PERFORMANCE CHECK GUIDE
58
Introscope To verify that not all packaging threads are in use you can use the Thread monitoring in the SAP Management Console and check for threads named ldquoBULK_EXECUTORrdquo as shown below
If you would like to adapt the packaging for specific communication channel this can also be done using the
configuration options in the Integration Directory
While in the SOAP adapter in XI 30 protocol you can define three different packaging KPIs this is currently
not possible for the IDoc adapter There you can only specify the package size based on number of
messages
616 Adapter Framework Scheduler
For polling adapters like File JDBC and JMS the Adapter Framework Scheduler determines on which server
node the polling takes place Per default a File or JDBC sender only works on one server node and the
Adapter Framework (AFW) Scheduler determines on which one the job is scheduled
The Adapter Frameworks scheduler had several performance and reliability issues in a cluster environment
especially in systems having many Java server nodes and many polling communication channels Based on
this and the symptoms described in Note 1355715 - AF Scheduler to avoid using cluster communication a
new scheduler was released We highly recommend using the new version of the AFW scheduler To
activate the new scheduler you have to set the parameter schedulerrelocMode of the Adapter framework
SAP NETWEAVER 71 AND HIGHER PERFORMANCE CHECK GUIDE
59
service property to some negative value For instance by setting the value to -15 after every 15th polling
interval a rebalancing of the channel within the J2EE cluster might happen This can allow for better
balancing of the incoming load across the available server nodes if the files are coming in on regular
intervals The balancing is achieved by doing a servlet call Based on the HTTP load balancing the channel
might then be dispatched to another server node To avoid the balancing overhead this value should not be
set too low A value between -10 and -15 should be acceptable in most cases For very short polling intervals
(eg every second) even lower values (eg -50) can be configured
In case many files are put at one given time on the directory (by eg using a batch process) all these files will
be processed by one polling process only Hence a proper load balancing cannot be achieved by the AFW
scheduler In such a case the only option is to use write the files with different names or different directories
so that you can configure multiple sender channels to pick up the files
Starting from PI 731 you can monitor the Adapter Framework Scheduler in pimon Monitoring
Background Job Processing Monitor Adapter Framework Scheduler Jobs There you can check on which
server node the Communication Channel is polling (Status=rdquoActiverdquo) Also you can see the time the channel
was polling the last time and will poll next time
You cannot influence the server node on which the channel is polling This is determined via the AFW
scheduler You can only influence the frequency after which a channel can potentially move to another
server node by tuning the parameter relocMode as outlined above
Prior to PI 731 you have to use the following URL to monitor the Adapter Framework Scheduler
httpserverportAdapterFrameworkschedulerschedulerjsp
Above you see an example of a File sender channel The type value determines if the channel runs only on
one server node (type = L (local)) or on all server nodes (Type = G (global)) The time in the brackets
[60000] determines the polling interval in ms ndash in this case 60 seconds The Status column shows the
status of the channel
o ldquoONrdquo Currently polling
o ldquoonrdquo Currently waiting for the next polling
SAP NETWEAVER 71 AND HIGHER PERFORMANCE CHECK GUIDE
60
o ldquooffrdquo not scheduled any longer (eg channel deactivated or scheduled on another server node)
62 Messaging System Bottleneck
As described earlier the Messaging System is responsible for persisting and queuing messages that come
from any sender adapter and go to the Integration Server pipeline or Java only interfaces (ICO) or that come
from the Integration Server pipeline and go to any receiver adapter The time difference between receiving
the message from the one side and delivering it to the other side is the value that can be used to analyze
bottlenecks in the Messaging System The following chapters describe how to determine the time difference
for both directions
A bottleneck (or rather a ldquofakerdquo bottleneck) in the Messaging System can usually be closely connected with a
performance problem in the receiver adapter You must therefore make sure you execute the check
described in chapter 613 If the receiver adapter needs a lot of time to process messages then of course
the messages get queued in the messaging system and remain there for a long time since the adapter is not
ready to process the next one yet It looks like the messaging system is not fast enough but actually the
receiver adapter is the limiting factor
Execute the checks described in chapter 621 and 622 to get an overview of the situation you should do this for multiple messages
Decide if a specific receiver adapter is causing long waiting times in the messaging system by executing the check described in chapter 613 An additional hint at a receiver adapter problem is if only messages to specific receivers show a long wait time in the queue
Use the queue monitoring in the Runtime Workbench (RWB) to analyze how many threads are active for each of the queue types and how large the queue size currently is To do so choose Component Monitoring Adapter Engine Press the Engine Status button and choose tab ldquoAdditional Datardquo This will open the page below showing the number of messages in a queue the threads currently working and the maximum available threads Note This view only shows the Messaging System of one J2EE server node To get the whole picture you have to check all the server nodes that are available in your system via the drop down list box
SAP NETWEAVER 71 AND HIGHER PERFORMANCE CHECK GUIDE
61
o Since checking all the server nodes with this browser frontend can be very tedious it is better to use Wily Introscope since it allows easy graphical analysis of the queues and thread usage of the messaging system across Java server nodes
The starting point in Wily Introscope is usually the PI triage showing all the backlogs in the queue In the screenshot below a backlog in the dispatcher queue (for 71 and higher only) can be seen
The dispatcher queue is not the problem here since it will forward messages to the adapter queue if any free
threads are available on the adapter specific consumer threads The analysis must start in the PI inbound
queues By using the navigation button in the upper right corner of the inbound queue size you can directly
jump to a more detailed view where you can see that the file adapter was causing the backlog
SAP NETWEAVER 71 AND HIGHER PERFORMANCE CHECK GUIDE
62
To see the consumer thread usage you can then follow the link to the file adapter In the screenshot below
you can see that all consumer threads were exceeded during the time of the backlog Thus increasing the
number of consumer threads could be a solution if the resulting delay is not acceptable for business
o If it is obvious that the messaging system does not have enough resources as in the case above increase the number of consumers for the queue in question Use the results of the previous check to decide which adapter queues need more consumers
The adapter specific queues in the messaging system have to be configured in the NWA using
service ldquoXPI Service AF Corerdquo and property messagingconnectionDefinition The default
values for the sending and receiving consumer threads are set as follows
(name=global messageListener=localejbsAFWListener exceptionListener=
localejbsAFWListener pollInterval=60000 pollAttempts=60
SendmaxConsumers=5 RecvmaxConsumers=5 CallmaxConsumers=5
RqstmaxConsumers=5)
To set individual values for a specific adapter type you have to add a new property set to the default set with the name of the respective adapter type for example
(name=JMS_httpsapcomxiXISystem
messageListener=localejbsAFWListener
exceptionListener=localejbsAFWListener pollInterval=60000
pollAttempts=60 SendmaxConsumers=7 RecvmaxConsumers=7
CallmaxConsumers=7 RqstmaxConsumers=7)
The name of the adapter specific queue is based on the pattern ltadapter_namegt_ ltnamespacegt for
example RFC_httpsapcomxiXISystem
Note that you must not change parameters such as pollInterval and pollAttempts For more details see SAP Note 791655 - Documentation of the XI Messaging System Service Properties
o Not all adapters use the parameter above Some special adapters like CIDX RNIF or Java Proxy can be changed by using the service ldquoXPI Service Messaging Systemrdquo and property messagingconnectionParams by adding the relevant lines for the adapter in question as described above
o A performance problem on the Messaging System can also be caused by a high logging as described in chapter Logging Staging on the AAE (PI 73 and higher)
o Important Make sure that your system is able to handle the additional threads that is monitor the CPU usage and application thread availability as well as the memory of the J2EE Engine after you have applied the change
SAP NETWEAVER 71 AND HIGHER PERFORMANCE CHECK GUIDE
63
o Important Keep in mind that not all adapters are able to handle requests in parallel even if you assign more threads on the Messaging System queues In such a case adding additional threads will not speed up processing significantly See chapter Adapter Parallelism for details
o A backlog of messages in the messaging system is highly critical for synchronous scenarios due to timeouts that might occur Therefore the number of synchronous threads always has to be tuned so that no bottleneck occurs Often a backlog in synchronous queues is caused due to bad performance on the receiving backend system
o More information is provided in the blog Tuning the PI Messaging System Queues
621 Messaging System in between AFW Sender Adapter and Integration Server (Outbound)
Open the Audit Log of a message and look for the following entry ldquoThe message was successfully retrieved
from the send queuerdquo Note that the queue name would be ldquoCall Queuerdquo if the message was synchronous
To determine how long the message waited to be picked up from the queue compare the timestamp of the
above entry with the timestamp for the step ldquoMessage successfully put into the queuerdquo A large time
difference between those two timestamps would therefore indicate a bottleneck for consumer threads on the
sender queues in the Messaging System
Instead of checking the latency of single messages we recommend using Wily Introscope to monitor the
queue behavior as shown above
Asynchronous messages only use one thread for processing in the messaging system Multiple threads are
used for synchronous messages The adapter thread puts the message into the messaging system queue
and will wait till the messaging system delivers the response The adapter thread is therefore not available
for other tasks until the response is returned A consumer thread on the call queue sends the message to the
Integration Engine The response will be received by a third thread (consumer thread of send queue) which
correlates the response with the original request After this the initiating adapter thread will be notified to
send the response to the original sender system This correlation can be seen in the audit log of the
synchronous message below
SAP NETWEAVER 71 AND HIGHER PERFORMANCE CHECK GUIDE
64
622 Messaging System in Between Integration Server and AFW Receiver Adapter (Inbound)
Open the Audit Log of a message and look for the following entry ldquoMessage successfully put into the
queuerdquo Compare this timestamp with the timestamp for the step ldquoThe message was successfully retrieved
from the receive queuerdquo The time difference between these two timestamps is the time that the message
waited in the messaging system for a free consumer thread A large time difference between those two
timestamps indicates a bottleneck in the adapter specific inbound queues of the Messaging System
623 Interface Prioritization in the Messaging System
SAP NetWeaver PI 71 and higher offers the possibility for prioritization of interfaces similar to the ABAP
stack This feature is especially helpful if high volume interfaces run at the same time with business critical
interfaces To minimize the delay for critical messages the Messaging System now makes it possible for you
to define high medium and low priority processing at interface level Based on the priority the Dispatcher
Queue of the messaging system (which will be the first entry point for all messages) will forward the
messages to the standard adapter-specific queues The priority assigned to an interface determines the
number of messages that are forwarded once the adapter-specific queues have free consumer threads
available This is done based on a weighting of the messages to be reloaded The weights for the different
priorities are as follows High 75 Medium 20 Low 5
Based on this approach you can ensure that more resources can be used for high priority interfaces The
screenshot below shows the UI for message prioritization available in pimon Configuration and
Administration Message Prioritization
SAP NETWEAVER 71 AND HIGHER PERFORMANCE CHECK GUIDE
65
The number of messages per priority can be seen in a dashboard in Wily as shown below
You can find more details on configuring usage prioritization within the AAE at SAP Online Help navigate to
SAP NetWeaver SAP NetWeaver PI SAP NetWeaver Process Integration 71 Including Enhancement
Package 1 SAP NetWeaver Process Integration Library Function-Oriented View Process Integration
Process Integration Monitoring Component Monitoring Prioritizing the Processing of Messages
624 Avoid Blocking Caused by Single SlowHanging Receiver Interface
As already discussed above some receiver adapters process messages sequentially on one server node by
default This is independent of the number of consumer threads defined for the corresponding receiver
queue in the messaging system For example even though you have configured 20 threads for the JDBC
Receiver one Communication Channel will only be able to send one request to the remote database at a
given time If there are many messages for the same interface all of them will get a thread from the
messaging system but will be blocked when performing the adapter call
In the case of a slow message transmission for example for EDI interfaces using ISDN technology or
remote system with small network bandwidth this behavior can cause a ldquohangingrdquo situation for a specific
adapter since one interface can block all messaging threads As a result all the other interfaces will not get
any resources and will be blocked
SAP NETWEAVER 71 AND HIGHER PERFORMANCE CHECK GUIDE
66
Based on this a parameter messagingsystemqueueParallelismmaxReceivers was introduced which can
be set in NWA in service XPI Service Messaging System With this parameter you can restrict the maximum
number of receiver consumer threads that can be used by one interface In older releases (lower 731 SP11
and 74 SP6) this is a global parameter at the moment that affects all adapters It should therefore not be set
too restrictively If you need high parallel throughput one option is to set the maxReceiver parameter to 5 (so
that each interface can use 5 consumer threads for each server node) and increase the overall number of
threads on the receive queue for the adapter in question (for example JDBC) to 20 With this configuration it
will be possible for four interfaces to get resources in parallel before all threads are blocked For more
information see Note 1136790 - Blocking Receiver Channel May Affect the Whole Adapter Type and SDN
blog Tuning the PI Messaging System Queues
In the screenshot below you see the impact of maxReceivers parameter when a backlog for one interface
occurs Even though there are more free SOAP threads available they are not consumed Hence the free
SOAP threads could be assigned to other interfaces running in parallel
This parameter has a direct impact on the queue where message backlogs occur As mentioned earlier
usually a backlog should occur on the Dispatcher queue only since it is responsible to dispatch threads only
if there are free consumer threads in the adapter specific queue When setting maxReceiver you restrict the
threads per interface and this means that less consumer threads are blocked When one interface is facing a
high backlog there will always be free consumer threads and therefore the dispatcher queue can dispatch
the message to the adapter specific queue Hence the backlog will appear in the adapter specific queue so
that the message prioritization would not work properly any longer
SAP NETWEAVER 71 AND HIGHER PERFORMANCE CHECK GUIDE
67
Per default the maxReceiver parameter is only relevant for asynchronous message processing (ICo and
classical dual-stack scenarios) The reason here is that a wait time for synchronous scenarios should be
avoided by all means and therefore additional restrictions in the number of available threads can be very
critical Therefore it is usually advisable to not limit the threads per interface but increase the overall number
of available threads In case you have many high volume synchronous scenarios with different priority that
run in parallel it might be advisable to limit the threads each interface can use To do so you have to set the
parameter messagingsystemqueueParallelismqueueTypes to Recv ICoAll as described in SAP Note
1493502 - Max Receiver Parameter for Integrated Configurations
Enhancement with 731 SP11 and 74 SP6
With Note 1916598 - NF Receiver Parallelism per Interface an enhancement was introduced that allows
the specification of the maximum parallelization on more granular level This new feature has to be activated
by setting the parameter messagingsystemqueueParallelismperInterface to true Using a configuration UI
you can specify rules to determine the parallelization for all interfaces of a given receiver service If no rule
for a given interface is specified the global maxReceivers value will be considered If the receiver service
corresponds to a technical business system this configuration would help to restrict the parallel requests
from PI to that system This also works across protocols so that eg it could be used to restrict the number of
parallel requests using Proxy or IDoc to the same ERP receiver system Below you can find a screenshot of
the configuration UI in NWA SOA Monitoring
With the improvement mentioned above also the dispatching mechanism in the dispatcher queue is
changed so that it is aware of the maxReceiver settings This means that now again the backlog will now be
placed in the dispatcher queue and the prioritization will work properly
625 Overhead based on interface pattern being used
Also the interface pattern configured can cause some overhead When choosing the interface pattern
ldquoStateless Operationrdquo each message is parsed against its data type during inbound processing This can
cause performance and memory overhead but gives a syntactical check of the data received
When choosing ldquoStateless (XI30-Compatible)rdquo no check of the data type is performed and therefore the
overhead is avoided Therefore for interface with good data quality and high message throughput this
interface pattern should be chosen
SAP NETWEAVER 71 AND HIGHER PERFORMANCE CHECK GUIDE
68
63 Performance of Module Processing
If your analysis in chapter Adapter Performance Problem pointed to a problem in the Module Processing
then you must analyze the runtime of the modules used in the Communication Channel Adapter modules
can be combined so that one CC calls multiple modules in a defined sequence Adapter modules can be
custom-developed or SAP standard and can be used for many different purposes ndash like to transform the EDI
message before sending it to the partner or to change header attributes of a PI message before forwarding it
to a legacy application Due to the flexible usage of adapter modules there is also no standard way to
approach performance problems
In the audit log shown below you can see two adapter modules One module is a customer-developed
module called SimpleWaitModule The next module called CallSAPAdapter which is a standard module that
inserts the data into the messaging system queues
In the audit log you will get a first impression of the duration of the module In the example above you can
see that the SimpleWaitModule requires 4 seconds of processing time
Once again Wily Introscope offers a better overview of the processing time of modules In the screenshot
below you can see a dashboard showing the cumulativeaverage response times and number of invocations
of different modules If there is one that has been running for a very long time then it would be very easy to
identify since there will be a line indicating a much higher average response time The tooltip displays the
name of the module
Module
Processing
SAP NETWEAVER 71 AND HIGHER PERFORMANCE CHECK GUIDE
69
Once you have identified the module with the long running time you have to talk to the responsible developer
to understand why it is taking that long Eventually the module executes a look-up to a remote system using
JCo or JDBC which could be responsible for the delay In the best case the module will print out information
in addition to the audit log to detect such steps If not use the Wily Introscope transaction trace as explained
in appendix Wily Transaction Trace
64 Java only scenarios Integrated Configuration objects
From SAP NetWeaver PI 71 on you can configure scenarios that only run on the Java stack using the
Advance Adapter Engine (AAE) when only Java-based adapters are used A new configuration object is
used for this that is called Integrated Configuration When using this the steps executed so far in the ABAP
pipeline (Receiver Determination Interface Determination and Mapping) are also executed by the services in
the Adapter Engine
641 General performance gain when using Java only scenarios
The major advantage of AAE processing is a reduced overhead due to the context switches between ABAP
and Java Thus the overall throughput can be increased significantly and the overall latency of a PI
message can be reduced greatly If possible interfaces should always use the Integrated Configuration to
achieve best performance Therefore the best tuning option is to change a scenario that is using Java based
sender and receiver adapters from a classical ABAP-based scenario to an AAE-based one
SAP NETWEAVER 71 AND HIGHER PERFORMANCE CHECK GUIDE
70
Based on SAP internal measurements performed on 71 releases the throughput as well as the response
time could be improved significantly as shown in the diagrams below
SAP NETWEAVER 71 AND HIGHER PERFORMANCE CHECK GUIDE
71
Based on these measurements the following statements can be made
1) Significant performance improvements can be achieved always with local processing (if available) for a certain scenario
2) This is valid for all adapter types huge mapping runtimes slow networks slow (receiver) applications reduce the throughput and therefore rated for the overall scenario also reduce the benefit of local processing in terms of overall throughput and response time measurements
3) Greatest benefit is recognized for small payloads (comparison 10k 50k 500k) and asynchronous messages
642 Message Flow of Java only scenarios
All the Java based tuning options mentioned in chapter Analyzing the (Advanced) Adapter Engine and Long
Processing Times for ldquoPLSRV_MAPPING_REQUESTrdquo are still valid Just the calling sequence is different
The following describes the steps used in Integrated Configuration to help you better understand the
message flow of an interface The example is JMS to Mail
1) Enter the JMS sender adapter
2) Put into the dispatcher queue of the messaging system
3) Forwarded to the JMS send queue of the messaging system
4) Message is taken by JMS send consumer thread
a No message split used
In this case the JMS consumer thread will do all the necessary steps previously done in the ABAP pipeline (like receiver determination interface determination and mapping) and will then also transfer the message to the backend system (remote database in our example) Thus all the steps are executed by one thread only
b Message split used (1n message relation)
In this case there is a context switch The thread taking the message out of the queue will process the message up to the message split step It will create the new message and put it in the Send queue again from where it will be taken by different threads (which will then map the child message and finally send it to the receiving system)
As we can see in this example for Integrated Configuration only one thread does all the different steps of a
message The consumer thread will not be available for other messages during the execution of these steps
The tuning of the Send queue (Call for synchronous messages) is therefore much more important for
scenarios using Integrated Configuration than for ABAP-based scenarios
The different steps of the message processing can be seen in the audit log of a message If for example a
long-running mapping or adapter module is indicated then you can use the relevant chapter of this guide
There is no difference in the analysis except that for mappings no JCo connection is required since the
mapping call is done directly from the Java stack
SAP NETWEAVER 71 AND HIGHER PERFORMANCE CHECK GUIDE
72
The example audit logs below are based on a Java only synchronous SOAP to SOAP scenario
In the highlighted areas you can see that all the steps are very fast except the mapping call which lasts
around 7 seconds To analyze the long duration of the mapping now the same steps as discussed in chapter
Long Processing Times for ldquoPLSRV_MAPPING_REQUESTrdquo have to be followed
SAP NETWEAVER 71 AND HIGHER PERFORMANCE CHECK GUIDE
73
643 Avoid blocking of Java only scenarios
Like classical ABAP based scenarios Java only scenarios can face backlog situations in case of a slow or
hanging receiver backend Since the Java only interfaces are only using send queues the restriction of
consumer threads on the receiver queue as described in chapter Avoid Blocking Caused by Single
SlowHanging Receiver Interface is no solution
Based on that an additional property messagingsystemqueueParallelismqueueTypes of service SAP XI AF
MESSAGING was introduced via Note 1493502 - Max Receiver Parameter for Integrated Configurations
The parameter can be set for synchronous and asynchronous interfaces Please keep in mind that
messagingsystemqueueParallelismmaxReceivers is a global parameter for all adapters and for all
configured Quality of Service This global restriction can be avoided starting with 731 SP11 740 SP06 as
per SAP Note 1916598 - NF Receiver Parallelism per Interface Usually a restriction for the parallelization
can be highly critical for synchronous interfaces Therefore we generally recommend to set
messagingsystemqueueParallelismqueueTypes in most cases to Recv IcoAsync only
644 Logging Staging on the AAE (PI 73 and higher)
Up to PI 711 on the PI Adapter Engine only one message version was persisted Especially for Java only
scenarios this was often not sufficient for troubleshooting since for instance the result of a mapping could not
be verified
Starting from PI 73 the persistence steps can be configured globally in the Adapter Engine for synchronous
and asynchronous interfaces This is similar to the LOGGING or LOGGING_SYNC on the ABAP stack In
later version of PI you will be able to do the configuration on interface level
The versions that can be persisted are shown in the diagram below (the abbreviations in green are the
values for the configuration)
SAP NETWEAVER 71 AND HIGHER PERFORMANCE CHECK GUIDE
74
In the Messaging System we generally distinguish Staging (versioning) and Logging An overview is given
below
For details about the configuration please refer to the SAP online help Saving Message Versions
Similar to the LOGGING on the ABAP Integration Server persisting several versions of the Java message
can cause a high overhead on the DB and can cause a decrease in performance
The persistence steps can be seen directly in the audit log of a message
Also the Message Monitor shows the persisted versions
SAP NETWEAVER 71 AND HIGHER PERFORMANCE CHECK GUIDE
75
While this additional monitoring attributes are extremely helpful for troubleshooting they should be used
carefully from a performance perspective Especially the number of message versions and the
loggingstaging mode you choose can have a severe impact on performance Therefore you have to find the
balance between business requirement and performance overhead Some guidelines on how to use staging
and logging are summarized in SAP Note 1760915 - FAQ Staging and Logging in PI 73 and higher
65 J2EE HTTP load balancing
With NetWeaver version 71 and higher the Java HTTP load balancing is no longer done by the Java
Dispatcher but by the ICM The default load balancing rules of the ICM are designed with a stateful
application in mind giving priority to the balancing of HTTP sessions These default rules are not optimal for
stateless applications such as SAP PI
In the past we could observe an unequal load distribution across Java server nodes caused by this In case
of high backlogs this can cause a delay in the overall message processing of the interface because one
server node has more messages assigned than others and therefore not all available resources are used
A typical example can be seen in the Wily screenshot below
SAP Note 1596109 ndash Uneven distribution of HTTP requests on Java server nodes introduces new load
balancing rules for stateless applications like PI Please follow the description in the Note to ensure the
messages are distributed equally across the available server nodes In the meantime these load balancing
rules can also be executed using the CTC templates as described in Notes 1756963 and 1757922 Also this
has been included in the PI Initial Setup wizard in order to execute this task automatically as a post-
installation step (see Note 1760700 - PI CTC Add HTTP loadbalancing to initial setup)
SAP NETWEAVER 71 AND HIGHER PERFORMANCE CHECK GUIDE
76
For the example given above we could see a much better load balancing after the new load balancing rules
were implemented This can be seen in the following screenshot
Please Note The load balancing rules mentioned above are only responsible to balance the messages
across the available server nodes of one instance HTTP load balancing across application servers is done
by the SAP Web Dispatcher More information about this is provided in the Guide How To Scale SAP PI 71
66 J2EE Engine Bottleneck
All tuning that can be done in the AFW is limited by the ability of the J2EE Engine to handle a given amount
of threads and to provide enough memory that is needed to process all requests Of course the CPU is also
a limiting factor but this will be discussed in Chapter 91
From SAP NetWeaver PI 71 onwards the SAP VM is used on all platforms Therefore the analysis of all
platforms can use the same tools
661 Java Memory
The first analysis of the J2EE memory is usually done using the garbage collection (GC) behavior of the
Java Virtual Machine (JVM) To get the information of the GC written to the standard log file the JVM has to
be started with the parameter ndashverbosegc
Analyze the file std_serverltngtout for the frequency of GCs their duration and the allocated memory
Look for unusual patterns indicating an Out-of-Memory error or an unintentional restart of your J2EE engine This would be visible if the allocated memory drops to 0 at a given point in time A healthy Garbage Collection output would display a saw tooth pattern ndash that is the memory usage would increase over time but then go down to its original value as soon as a full Garbage Collection is triggered You should see the memory usage go down to initial values during low volume times (night-time)
Pay attention to GCs with a high duration This is important because no PI message can be mapped or processed by the J2EE Adapter Framework during a GC in a JAVA VM One of the many reasons for long GCs that should be mentioned here is paging (see chapter 92) If the heap space of the J2EE Engine is exhausted all objects in the heap are evaluated for their references If there is still a reference the object is kept If there is no reference the object is deleted If some or all of the objects have been swapped out due to insufficient RAM then they have to be swapped in to be evaluated This leads to very long runtimes for GCs GCs of more than 15 minutes have been observed on swapping systems
SAP NETWEAVER 71 AND HIGHER PERFORMANCE CHECK GUIDE
77
Different tools exist for the Garbage Collection Analysis
1) Solution Manager Diagnostics
Solution Manager Diagnostics (SMD) offers a memory analysis application that is able to read the GC output in the std_serverltngtout files To start call the Root Cause Analysis section In the Common Task list you find the entry Java Memory Analysis which will give you the chance to upload your std_serverltngtout file It shows the memory allocated after the GC and also prints the duration of each GC (black dots with duration scale on right axis) A normal GC output should show a saw tooth pattern where the memory always goes down to an initial value (especially during low volume times) This is shown in the example screenshot below
2) Wily Introscope
Again Wily Introscope offers different dashboards that can be used to check the Garbage Collection behavior on the J2EE engine The dashboard can be found using the J2EE Overview J2EE GC Overview and shows important KPIs for the GC such as the count of GC or the duration for each interval The GC Time dashboards shows the ratio of time spent in GC An example is shown in the screenshot below
SAP NETWEAVER 71 AND HIGHER PERFORMANCE CHECK GUIDE
78
3) Netweaver Administrator
The NWA also offers a view to monitor the Java heap usage However the important information about the duration of the GC is not available This monitor can be found by navigating to Availability and Performance Management Java System Reports Choose Report System Health
In NetWeaver 73 you find this data in Availability and Performance Management Resource Monitoring History Reports There you can build your own Memory report of the monitoring data provided The screenshot below eg shows the Used Memory per server node
SAP NETWEAVER 71 AND HIGHER PERFORMANCE CHECK GUIDE
79
4) SAP JVM Profiler
The SAP JVM profiler allows the analysis of the extensive GC information stored in the sapjvm_gcprf files of the server node folders or to directly connect to the server node to retrieve this information More information can be found at httpwikiscnsapcomwikidisplayASJAVAJava+Profiling
SAP NETWEAVER 71 AND HIGHER PERFORMANCE CHECK GUIDE
80
Procedure
o Search for restarts of the J2EE Engine by searching for the string ldquois startingrdquo in the file std_serverltngtout Apart from the first of these entries (which simply marks the initial start of the J2EE Engine) the second and any later entries mark a fatal situation after which the J2EE server node had to be restarted This could for example be an outndashof-memory situation Search the log above those entries for a possible reason
o Search for exceptions and fatal entries Was an out-of-memory error reported (search for pattern OutOfMemory) Was a thread shortage reported
o This document does not deal with tuning the J2EE Engine If at this point it becomes clear that the J2EE Engine is the limiting factor proceed with SAP Notes or open a customer incident Only some very basic recommendations are given here
o The parameters for the SAP VM are defined by Zero Admin templates From time to time new Zero Admin templates might be released which change important parameters for the SAP VM Thus you should check SAP Note 1248926 - AS Java VM Parameters for NetWeaver 71-based Products regularly and apply the changes accordingly
o The problem might be caused by too high parallelization when processing large messages This should be restricted to avoid overloading of the Java heap memory
1) In case the interfaces are using the ABAP Integration Server use the large message queue filters to restrict the parallelization of mapping calls from ABAP queues To do so set parameter EO_MSG_SIZE_LIMIT to eg 5000 to direct all large messages to dedicated XBTL or XBTM queues
2) To restrict the parallelization on the Java Messaging System you can use the large message queue mechanism described in chapter Large message queues on the Messaging System
o If it is already obvious that the memory of your J2EE Engine is getting short and nothing can be changed on the scenarios itself you have several options for scaling your PI landscape Especially for large PI installations with high message throughput or large messages SAP Note 1502676 - Scaling up large PI installations describes potential options
1) Increase the Java Heap of your server node If sufficient physical memory is available increase the default heap size of 2 GB to a higher value such as 3 or 4 GB Experience shows that the SAP VM can handle these heap sizes without major impact on performance Larger heap sizes can cause longer processing time of GCs which in turn can affect the PI application negatively Increasing the maximum heap size on the J2EE engine will automatically adapt the new area of the heap due to a dynamic configuration (in newer J2EE versions this will be per default set to 16 of the overall heap) After increasing the heap size monitor the duration of the GC execution
2) Add an additional server node to distribute the load over more processes SAP recommends that productive systems have at least 2 Java server nodes per instance Prerequisite is that your physical host has enough RAM and CPU To minimize the overhead for J2EE cluster communication it is in general recommended configuring larger server nodes (as described above) then a high number of server nodes
3) Add an additional application server consisting of a double stack Web Application Server (ABAP and J2EE Engine) to distribute the load to an additional hardware Find details on the scaling of PI with multiple instances in the Guide How To Scale up SAP NetWeaver Process Integration
4) Use a non-central Adapter Engine to separate large messages that cause the memory problem from business critical scenarios
662 Java System and Application Threads
A system or application thread is required for every task that the J2EE Engine executes Each of these
thread types are maintained using a thread pool If the pool of available threads is expired no more requests
can be processed It is therefore important that you have enough threads available at all times
SAP NETWEAVER 71 AND HIGHER PERFORMANCE CHECK GUIDE
81
o In general SAP recommends that you increase the system and application thread count for a PI system As described in SAP Note 937159 - XI Adapter Engine is stuck the application threads should be increased to 350 and the system threads to lsquo120rsquo for all J2EE server nodes
o There are two options for checking the thread usage
1) Wily Introscope
Wily Introscope provides a dashboard in the J2EE Overview section called J2EE CPU and Memory Detail that can also be used to monitor the thread usage on a PI engine Different views exist for Application and System Threads as shown in the screenshot below
2) NetWeaver Administrator (NWA)
The NWA also offers a monitor similar to the one available for the memory mentioned above This monitor can be found by navigating to Availability and Performance Management Java System Reports Choose Report System Health and looking at the windows shown in the screenshot below
Again in NetWeaver 73 and higher the monitor can be found at Availability and Performance
Management Resource Monitoring History Report An example for the Application Thread
Usage is shown below
SAP NETWEAVER 71 AND HIGHER PERFORMANCE CHECK GUIDE
82
Check if the ThreadPoolUsageRate is below 80 for both the application threads and the system threads Also check the maximum value by choosing a longer history in Wily Introscope
Has the thread usage increased over the last daysweeks
Is there one server node that shows a higher thread usage than others
3) SAP Management Console
The SAP Management Console is an essential tool to analyze different aspects of the J2EE engine It also offers a thread dump view similar to SM50 in ABAP showing the activity of all the threads of a given Java Application Server More information about the SAP MC can be found in Note 1014480 - SAP Management Console (SAP-MC) and the online help The SAP Management Console can be started as Java web-start application using httpltservergt5ltInstanc_numbergt13
Navigate to AS Java Threads and check for any threads in red status (gt20 secs running time) This indicates long running threads and you should check for the related thread stacks The example below shows a long running thread related to the PI directory You can see the user doing the request and can see that the thread is waiting for an HTTP response from the CPACache
SAP NETWEAVER 71 AND HIGHER PERFORMANCE CHECK GUIDE
83
If you are not sure what is causing the problem you should take multiple thread dumps (at least 3 every 30 seconds) for all server nodes This can be done in the Management Console navigating to AS Java Process Table
The Thread Dump Viewer tool (TDV) from Note 1020246 - Thread Dump Viewer for SAP Java Engine can be used to analyze the produced thread dumps (inside the results archive that can be downloaded to your local PC)
663 FCA Server Threads
An additional type of thread was introduced with SAP NetWeaver PI 71 that is responsible for HTTP traffic
FCA Server Threads The FCA Server Threads are responsible for receiving HTTP calls at the Java side
(after the Java dispatcher is no longer available) Also FCA Threads use a Thread Pool Fifteen FCA
Threads are configured by default but based on SAP Note 1375656 - SAP Netweaver PI System Parameters
we recommend that you increase it to 50 This can be done in the NWA by changing the parameter
FCAServerThreadCount of service HTTP Provider
FCA Server Threads are particularly crucial for synchronous message transfer and for HTTP-based
scenarios like WebServices or calls from the ABAP engine to the Adapter Engine If there is a long duration
of the HTTP call due to a slow backend system then the thread is blocked for the whole time and not
available to send other HTTP requests (other PI messages)
SAP NETWEAVER 71 AND HIGHER PERFORMANCE CHECK GUIDE
84
The configured FCAServerThreadCount represents the maximum number of threads working on a single
entry point An entry point in the PI sense could eg be the SOAP Adapter Servlet (share with all channels
as described in Tuning SOAP sender adapter)
o If response times for specific entry point are high (gt15 seconds) additional FCA threads will be spawned to be available for parallel HTTP based incoming requests using different entry points only This ensures that in case of problems with one application not all other applications will be blocked constantly
o An overall maximum of 20xFCAServerThreadCount may be used in the J2EE engine
There is currently no standard monitor available for FCA Threads except the thread view in the SAP
Management Console A new dashboard will be integrated into Wily Introscope soon and will also show the
FCA Server Threads that are in use
664 Switch Off VMC
The Virtual Machine Container (VMC) is enabled by default for an ABAP WebAS 71 Since PI does not use
VMC at runtime the VMC can be switched off on a PI system to avoid resource overhead This
recommendation is based on SAP Note 1375656 - SAP NetWeaver PI System Parameters
You can activate the VM Container setting the profile parameters vmcjenable = off which can be changed
using profile maintenance (transaction RZ10) Once you have made the change you need to restart the SAP
Web Application Server instance
SAP NETWEAVER 71 AND HIGHER PERFORMANCE CHECK GUIDE
85
7 ABAP PROXY SYSTEM TUNING
Every ABAP WebAS gt 620 includes an ABAP Proxy runtime This enables a SAP system to talk native PI
protocol (XI-SOAP) so that no costly transformation is necessary
In general ABAP proxy is just a framework that is triggered by (sender) or triggers (receiver) application-
specific coding It is not possible to give a general tuning recommendation because the applications and use
cases of ABAP proxy can differ so greatly
In this section we would like to highlight the system tuning options that can be applied to improve the
throughput at the ABAP Proxy backend side
In general you can increase the throughput of EO interfaces by changing the queue parallelization Two
different parameters exist to change the number of qRFC queues on the ABAP Proxy backend As in PI
ABAP Proxy processing is based on qRFC inbound queues (SMQ2) with specific names A sender proxy
uses XBTS queues (10 parallel by default) and a receiver proxy XBTR (20 parallel by default)
The sender proxy only forwards the message to PI by executing an HTTP call that must not take too much
time and which is not resource-critical On the other hand the receiver proxy executes the inbound
processing of the messages based on the application context (and which can be very time-consuming) It is
therefore more likely to face a backlog situation in the Receiver Proxy queues In the screenshot below you
can see the performance header of a receiver proxy message that required around 20 minutes in the
PLSRV_CALL_INBOUND_PROXY (which corresponds to the posting of the application data)
Of course such a long-running message will block the queue and all messages behind it will face a higher
latency Since this step is purely application-related it is only possible to perform tuning at the application
side
The number of sender and receiver ABAP Proxy queues can be changed in transaction SXMB_ADM on the
proxy backend with parameter EO_INBOUND_PARALLEL and sub parameter SENDER (XBTS queues)
and RECEIVER (XBTR queues) The prerequisite for increasing the number of queues is that there are
enough qRFC resources are available at the proxy system (as discussed in section qRFC Resources
(SARFC))
Also as described in chapter Message Prioritization on the ABAP Stack prioritization can be configured in
the ABAP Proxy system This can be used to separate runtime-critical interfaces from interfaces with a long
application processing (as shown above)
SAP NETWEAVER 71 AND HIGHER PERFORMANCE CHECK GUIDE
86
71 New enhancements in Proxy queuing
The queuing mechanism was enhanced for sender and receiver proxy systems with Note 1802294
(Receiver) and Note 1831889 (Sender) After implementing these two Notes interface specific queues will be
used and tuning of these queues on interface level will be possible This can be very helpful in cases where
one receiver interface shows very long posting time in the application coding that cannot be further
improved Other messages for more business critical interfaces will eventually be blocked by this message
due to the common usage of the XBTR queues On the sender side of a Proxy system the processing of the
queues call the central PI hub In general the processing time there should be fast But in case of high
volume interfaces you might want to slow down less business critical interfaces to avoid overloading of your
central PI hub The prioritization mechanisms available prior to these Notes did not provide such options
This is achieved by adding an interface specific identifier to the queue-name In the screenshot below you
see a comparison in the queue names for the old framework (red) and the new framework (blue)
For the sender queues the following new parameters are introduced
o Parameter EO_QUEUE_PREFIX_INTERFACE with sub parameter SENDERSENDER_BACK Should be set to lsquo1rsquo to active interface specific queue This is a global switch affecting all sender interfaces
o Parameter EO_INBOUND_PARALLEL_SENDER without sub parameter determines the general number of queues per interface
Using a sub parameter ltsender IDgt the parallelization of individual interfaces can be changed This can eg be used to assign more queues for high priority interfaces
Wildcards can be used in the ltsender IDgt to group interfaces sharing eg the same service name or the same interface name but different services
For the receiver queues the following new parameters are introduced
o Parameter EO_QUEUE_PREFIX_INTERFACE with sub parameter RECEIVER Should be set to lsquo1rsquo to active interface specific queue This is a global switch affecting all receiver interfaces
o Parameter EO_INBOUND_PARALLEL_RECEIVER without sub parameter determines the general number of queues per interface
Using a sub parameter ltsender IDgt the parallelization of individual interfaces can be changed This can eg be used to assign more queues for high priority interfaces
Wildcards can be used in the ltsender IDgt to group interfaces sharing eg the same service name or the same interface name but different services
This new feature also replaces the currently existing prioritization since it is in general more flexible and
powerful We therefore recommend adjusting existing prioritization rules using the new queuing possibilities
described above
SAP NETWEAVER 71 AND HIGHER PERFORMANCE CHECK GUIDE
87
8 MESSAGE SIZE AS SOURCE OF PERFORMANCE PROBLEMS
The message size directly influences the performance of an interface The size of a PI message depends on
two elements The PI header elements with a rather static size and the payload which can vary greatly
between interfaces or over time for one interface (for example larger messages during year-end closing)
The size of the PI message header can cause a major overhead for small messages of only a few kB and
can cause a decrease in the overall throughput of the interface Furthermore many system operations (like
context switches or database operations) are necessary for only a small payload The larger the message
payload the smaller the overhead due to the PI message header On the other hand large messages
require a lot of memory on the Java stack which can cause heavy memory usage on ABAP or excessive
garbage collection activity (see section Java Memory) that will also reduce the overall system performance
Very large messages can even crash the PI system by causing an Out-of-Memory exception for example
You therefore have to find a compromise for the PI message size
Below you see throughput measurements performed by SAP In general the best throughput was identified
for messages sizes of 1 to 5 MB
The message size in these measurements corresponds to the XML message size processed in PI and not
the size of the file or IDoc being sent to PI You can use the Runtime Header of the ABAP stack to check the
message size Below you can see an example of a very small message While the MessageSizePayload
field describes the size of the payload in bytes (here 433 bytes) the MessageSizeTotal describes the total
message size (header + payload) In the example this is around 14 KB demonstrating the overhead by the PI
header for small messages The next two lines describe the payload size before and after the mapping In
the example below the mapping reduces the payload size The last two lines determine the size of the
response message that is sent back to PI before and after the response mapping for synchronous
messages
SAP NETWEAVER 71 AND HIGHER PERFORMANCE CHECK GUIDE
88
Based on the above observations we highly recommend that you use a reasonable message size for your
interfaces During the design and implementation of the interface we therefore recommend using a message
size of 1 to 5 MB if possible Messages can be collected at the sender side or by using IDoc packaging as
described in Tuning the IDoc Adapter to achieve this In case of large messages a split has to be performed
by changing the sender processing or by using the split functions available in the structure conversion of the
File adapter
81 Large message queues on PI ABAP
In case the interfaces are using the ABAP Integration Server use the large message queue filters to restrict
the parallelization of mapping calls from ABAP queues To do so set the parameter EO_MSG_SIZE_LIMIT of
category TUNING to eg 5000 to direct all messages larger 5 MB to dedicated XBTL or XBTM queues
The value of the parameter depends on the number of large messages and the acceptable delay that might
be caused due to a backlog in the large message queue
To reduce the backlog the number of large message queues can also be configured via parameter
EO_MSG_SIZE_LIMIT_PARALLEL of category TUNING The default value is 1 so that all messages larger
than the defined threshold will be processed in one single queue Naturally the parallelization should not be
set higher than 2 or 3 to avoid overloading of the Java memory due to parallel large message requests
82 Large message queues on PI Adapter Engine
SAP Note 1727870 - Handling of large messages in the Messaging System introduces large message
queues (virtual queues no adapter behind) also for the Java based Adapter Engine Contrary to the
Integration Engine it is not the size of a single large message only that determines the parallelization
Instead the sum of the size of the large messages across all adapters on a given Java server node is limited
to avoid overloading the Java heap This is based on so called permits that define a threshold of a message
size Each message larger than the permit threshold is considered as large message The number of permits
can be configured as well to determine the degree of parallelization Per default the permit size is 10 MB and
10 permits are available This means that large messages will be processed in parallel if 100 MB are not
exceeded
To show this let us look at an example using the default values Let us assume we have 5 messages waiting
to be processed (status ldquoTo Be Deliveredrdquo on one server node Message A has 5 MB message B has 10
MB message C has 50 MB message D 150 MB message E 50 MB and message F 40 MB Message A is
not considered large since the size is smaller than the permit size and is not considered large and can be
immediately processed Message B requires 1 permit message C requires 5 Since enough permits are
available processing will start (status DLNG) Hence for message D all available 10 permits would be
required Since the permits are currently not available it cannot be scheduled If blacklisting is enabled the
message will be put to error status (NDLV) since it exceed the maximum number of defined permits In that
case the message would have to be restarted manually Message E requires 5 permits and can also not be
scheduled But since there are 4 permits left message F is put to DLNG Due to the smaller size message B
and message F finish first releasing 5 permits This is sufficient to schedule message E which requires 5
SAP NETWEAVER 71 AND HIGHER PERFORMANCE CHECK GUIDE
89
permits Only after message E and C have finished message D can be scheduled consuming all available
permits
The example above shows a potential delay a large message could face due to the waiting time for the
permits But the assumption is that large messages are not time critical and therefore additional delay is less
critical than potential overload of the system
The large message queue handling is based on the Messaging System queues This means that restricting
the parallelization is only possible after the initial persistence of the message in the Messaging System
queues Per default this is only done after the Receiver Determination Therefore if you have a very high
parallel load of incoming large requests this feature will not help Instead you would have to restrict the size
of incoming requests on the sender channel (eg file size limit in the file adapter or the
icmHTTPmax_request_size_KB limit in the ICM for incoming HTTP requests) If you have very complex
extended receiver determination or complex content based routing it might be useful to configure staging in
the first processing step of the Messaging System (BI=3) as described in Logging Staging on the AAE (PI
73 and higher)
The number of permits consumed can be monitored in PIMON Monitoring Adapter Engine Status The
number of threads corresponds to the number of consumed permits
In newer Wily versions there is also a dashboard showing the number of consumed permits as well The
Worker Threads on the right hand side of the screenshot correspond to the permits
SAP NETWEAVER 71 AND HIGHER PERFORMANCE CHECK GUIDE
90
9 GENERAL HARDWARE BOTTLENECK
During all tuning actions discussed in the previous chapters you must keep in mind that the limitation of all
activities is set by the underlying CPU and memory capacity The physical server and its hardware have to
provide resources for three PI runtimes the Adapter Engine the Integration Engine and the Business
Process Engine Tuning one of the engines for high throughput leaves fewer resources for the remaining
engines Thus the hardware capacity has to be monitored closely
91 Monitoring CPU Capacity
When monitoring the CPU capacity it is not enough to use the average that is displayed in the ldquoPrevious
Hoursrdquo section of transaction ST06 Instead you should start your interface and monitor the CPU while it is
running The best procedure is to use operating system tools to monitor the CPU usage (particularly if using
hardware virtualization)
The SMD Host Agent also reports CPU data to Wily Introscope which can be viewed using dashboards as
shown below This example shows two systems where one is facing a temporary CPU overload and the
other a permanent one
Also the NWA offers a view on the CPU activity from NetWeaver 73 on via Availability and Performance
Management Resource Monitoring History Reports There you can build your own report based on the
ldquoCPU utilizationrdquo data as shown in the screenshot
SAP NETWEAVER 71 AND HIGHER PERFORMANCE CHECK GUIDE
91
You can also monitor the CPU usage in ST06 as described below
Procedure
Log on to your Integration Server and call transaction ST06 Take a look at the snapshot that is provided on
the entry screen than navigate to ldquoDetailed Analysis Menurdquo
Snapshot view Is the idle time (upper left corner) at a reasonable value at all times for example around 10 or higher
Snapshot view The load average is a good indicator of the dimension of the bottleneck It describes the number of processes for each CPU that are in a wait queue before they are assigned to a free CPU As long as the average remains at one process for each available CPU the CPU resources are sufficient Once there is an average of around three processes for each available CPU there is a bottleneck at the CPU resources In connection with a high CPU usage a high value here can indicate that too many processes are active on the server In connection with a low CPU usage a high value here can indicate that the main memory is too small The processes are then waiting due to excessive paging
Detailed Analysis View TOP CPU Which thread uses up the highest amount of CPU Is it the J2EE Engine the work processes or the database
o There are different follow-up actions to be taken depending on the findings of the second check The first option is of course to simply increase the hardware This should be accompanied by a thorough sizing (for which SAP provides the Quicksizer in the Service Marketplace httpservicesapcomquicksizer )
o The second option is to identify the CPU-consuming threads and to think about a reduction of the load in this component For example if the J2EE Engine is the largest consumer then it is worth re-evaluating the number of concurrent mapping threads andor consumer queues as described in the previous chapters
o SAP Note 742395 - Analyzing High CPU Usage by the J2EE Engine provides a good entry point if the J2EE Engine consumes too much CPU
o If it is the work processes that consume a lot of CPU use transaction ST03N to figure out if it is the Integration Server or the Business Process Engine You can do that by looking at the CPU usage per user BPE uses the user WF-BATCH while the Integration Server uses the last user who activated a qRFC queue (typically PIAFUSER or PIAPPLUSER) Use the previous chapter to restrict these activities
92 Monitoring Memory and Paging Activity
As stated above paging is very critical for the Java stack since it influence the Java GC behavior directly
Therefore paging should be avoided in every case for a Java-based system
The OS tools are the most reliable for monitoring the paging activity on your system Transaction ST06 can
also be used to perform a snapshot analysis Take a look at the snapshot that is provided on the entry
screen
Snapshot view Is there enough physical memory available
Snapshot view Is there considerable paging Paging can have a negative influence on your J2EE Engine If it does this can be seen in long GC times as described in Chapter 661
93 Monitoring the Database
Monitoring database performance is a rather complex task and requires information to be gathered from a
variety of sources Only a basic set of indicators is given for the purpose of this guide A more detailed
SAP NETWEAVER 71 AND HIGHER PERFORMANCE CHECK GUIDE
92
analysis is required if these indicators point to a major performance problem in the database If assistance is
needed open a support message under the component BC-DB-ORA (or MSS SDB DB6 respectively)
931 Generic J2EE database monitoring in NWA
The next sections of this chapter will be mainly based on ABAP transactions to do a detailed analysis of the
database performanceThe NWA however offers possibilities to monitor the database performance for the
Java based tables This is especially helpful for Java only AEXPO or Non-Central AAEs In the NWA you
can use the ldquoOpen SQL Monitorrdquo in the Troubleshooting section of NWA The official documentation can be
found in the Online Help Monitoring DB via DBACOCKPIT transaction (ABAP based) is possible also for the
Java-only systems from SAP Solution Manager (DBA Cockpit must be configured in the Managed System
Setup)
It will be too much to outline all the available functionalities here Instead only a few key capabilities will be
demonstrated If you want to eg see the number of select update or insert statements in your system you
can use the ldquoTable Statistics Monitorrdquo It clearly shows you which tables in your system are accessed the
most frequently
To see the processing time of the different statements on your system you can use the ldquoOpen SQL statisticsrdquo
monitor There you can see the count the total average and max processing time of the individual SQL
SAP NETWEAVER 71 AND HIGHER PERFORMANCE CHECK GUIDE
93
statements and can therefore identify the expensive statements on your system
Per default the recorded period is always from the last restart of the system If you would like to just look at
the statistics for a specific time period (eg during a test) you have the option of resetting the statistics in the
individual monitor prior to the test
932 Monitoring Database (Oracle)
Procedure
Log on to your Integration Server and call transaction ST04
SAP NETWEAVER 71 AND HIGHER PERFORMANCE CHECK GUIDE
94
Many of the numbers in the screenshot above depend on each other The following checklist names a few
key performance figures of your Oracle database
The data buffer quality for instance is based on the ratio of physical reads versus the total number of reads The lower the ratio the better the buffer quality The data buffer quality should be better than 94 the statistics should be based on 15 million total reads This number of reads ensures that the database is in an equilibrated state
Ratio of user and recursive calls A good performance is indicated by ratio values greater than 2 Otherwise the number of recursive calls compared to the number of user calls is too high Over time this ratio always declines because more and more SQL statements get parsed in the meantime
Number of reads for each user call If this value exceeds 30 blocks for each user call this indicates an expensive SQL statement
Check the value of TimeUser call Values larger than 15 ms often indicate an optimization issue
Compare busy wait time versus CPU time A ratio of 6040 generally indicates a well-tuned system Significantly higher values (for example 8020) indicate room for improvement
The DD-cache quality should be better than 80
933 Monitoring Database (MS SQL)
Procedure
To display the most important performance parameters of the database call Transaction ST04 or choose
Tools Administration Monitor Performance Database Activity An analysis is only meaningful if
the database has been running for several hours with a typical workload To ensure a significant database
SAP NETWEAVER 71 AND HIGHER PERFORMANCE CHECK GUIDE
95
workload we recommend a minimum of 500 CPU busy seconds Note The default values displayed in
section Server Engine are relative values To display the absolute values press button Absolute values
Check the values in (1)
The cache hit ratio (2) which is the main performance indicator for the data cache shows the
average percentage of requested data pages found in the cache This is the average value since startup The value should always be above 98 (even during heavy workload) If it is significantly below 98 the data cache could be too small To check the history of these values use Transaction ST04 and choose Detail Analysis Menu Performance Database A snapshot is collected every 2 hours
Memory setting (5) shows the memory allocation strategy used and shows the following
FIXED SQL Server has a constant amount of memory allocated which is set by SQL Server configuration parameters min server memory (MB) = max server memory (MB)
RANGE SQL Server dynamically allocates memory between min server memory (MB) lt gt max server memory (MB)
AUTO SQL Server dynamically allocates memory between 4 MB and 2 PB which is set by min server memory (MB) = 0 and max server memory (MB) = 2147483647
FIXED-AWE SQL Server has a constant amount of memory allocated which is set by min server memory (MB) = max server memory (MB) In addition the address windowing extension functionality of Windows 2000 is enabled
934 Monitoring Database (DB2)
Procedure
To get an overview of the overall buffer pool usage catalog and package cache information go to
transaction ST04 choose Performance Database section Buffer Pool (or section Cache respectively)
1 1
1 2
1 3
1 5
1 4
gt 6h
gt 98
SAP NETWEAVER 71 AND HIGHER PERFORMANCE CHECK GUIDE
96
Buffer Pools Number Number of buffer pools configured in this system
Buffer Pools Total Size The total size of all configured buffer pools in KB If more than one buffer pool is used choose Performance Buffer Pools to get the size and buffer quality for every single buffer pool
Overall buffer quality This represents the ratio of physical reads to logical reads of all buffer pools
Data hit ratio In addition to overall buffer quality you can use the data hit ratio to monitor the database (data logical reads - data physical reads) (data logical reads) 100
Index hit ratio In addition to overall buffer quality you can use the index hit ratio to monitor the database (index logical reads - index physical reads) (index logical reads) 100
Data or Index logical reads The total number of read requests for data or index pages that went through the buffer pool
Data or Index physical reads The total number of read requests that required IO to place data or index pages in the buffer pool
Data synchronous reads or writes Read or write requests performed by db2agents
SAP NETWEAVER 71 AND HIGHER PERFORMANCE CHECK GUIDE
97
Catalog cache size Maximum size of the catalog cache that is used to maintain the most frequently accessed sections of the catalog
Catalog cache quality Ratio of catalog entries (inserts) to reused catalog entries (lookups)
Catalog cache overflows Number of times that an insert in the catalog cache failed because the catalog cache was full (increase catalog cache size)
Package cache size Maximum size of the package cache that is used to maintain the most frequently accessed sections of the package
Package cache quality Ratio of package entries (inserts) to reused package entries (lookups)
Package cache overflows Number of times that an insert in the package cache failed because the package cache was full (increase package cache size)
935 Monitoring Database (MaxDB SAP DB)
Procedure
As with the other database types call transaction ST04 to display the most important performance
parameters
SAP NETWEAVER 71 AND HIGHER PERFORMANCE CHECK GUIDE
98
With the Database Performance Monitor (transaction ST04) and its submonitors the CCMS in the SAP R3
System allows you to view in the SAP R3 System all of the information that can be used to identify
bottleneck situations
The SQL Statements section provides information about the number of SQL statements executed and related sizes
The IO Activity section lists physical and logical read and write accesses to the database
The Lock Activity section (in transaction ST04) allows you to identify possible bottlenecks in the assignment of locks by the database
The Logging Activity section combines information about the log area
The Scan and sort activity section can be helpful in identifying that suitable indexes are missing
The Cache Activity section provides information about the usage of the caches and the associated hit rates
o The data cache Hit rate should be 99 in a balanced system If this is not the case you need to check if the low hit rate is due to the size of the data cache being too small or due to an unsuitable SQL statement If necessary you can increase the data cache by increasing the MaxDB parameter Data_Cache_Size (lower than 74) or Cache_Size (74 or higher)
o The catalog cache hit rate should be 85 in a balanced system It is not a cause for concern if the catalog hit rate is temporarily lower since accesses to the system tables and an active command monitor can temporarily impair the hit rate If the catalog cache is busy the pages are paged out in the data cache rather than on the hard disk
o Log entries are not written directly to the log volume but first into a buffer (LOG_IO_QUEUE) so as to be able to write several log entries together asynchronously with one IO on the hard disk Only once a LOG_IO_QUEUE page is full is it written to the hard disk However there are situations in which you need to write LOG entries from the LOG_QUEUE onto the hard disk as quickly as possible for example if transactions are completed (COMMITROLLBACK) The transactions wait until the log writer reports the OK informing them that the log entry is on the hard disk Firstly this means that is important to use the quickest possible hard disks for the log volume(s) and secondly you must ensure that no LOG_QUEUE_OVERFLOWS occur in production operation If the LOG_IO_QUEUE is full then all transactions that want to write LOG entries must wait until free memory becomes available again in the LOG_IO_QUEUE At LOG_QUEUE_OVERFOLWS (Transaction DB50 -gt Current Status -gt Activities Overview -gt LOG_IO_QUEUE Overflow) you need to increase the LOG_IO_QUEUE parameter
SAP NETWEAVER 71 AND HIGHER PERFORMANCE CHECK GUIDE
99
o In accordance with Note 819324 - FAQ MaxDB SQL optimization check which SQL statements are responsible for the most disk accesses and whether they can be optimized You should also optimize SQL statements that have a poor runtime and poor selectivity
Bottleneck Analysis
The Bottleneck Analysis function is available in transaction ST04 under the Problem Analyzes
Performance Database Analyzer Bottlenecks You can use this function to activate the corresponding
analysis tool dbanalyzer
The dbanalyzer then collects important performance data every 15 minutes and evaluates this for possible
bottlenecks
The result of the bottleneck analysis is output in text format to provide a quick overview of possible causes of
performance problems For a more detailed description of the bottleneck messages see the online
documentation (httphelpsapcom) in the SAP Web Application Server area and search for SAP DB
bottleneck analysis messages
The dbanalyzer tool can also be started at operating system level It logs its analysis results in files with date
stamps in the subdirectory ltrundirectorygtanalyzer (you can find the actual directory by double-clicking on
lsquoPropertiesrsquo in DB50) of the relevant database instance
94 Monitoring Database Tables
Some of the tables of SAP PI grow very quickly and can cause severe performance problems if archiving or
deletion does not take place frequently For troubleshooting see SAP Note 872388 ndash Troubleshooting
Archiving and Deletion in PI
Procedure
Log on to your Integration Server and call transaction SE16 Enter the table names as listed below and execute In the following screen simply press the button ldquoNumber of Entriesrdquo The most important tables are SXMSPMAST (cleaned up by XML message archivingdeletion)
If you use the switch procedure you have to check SXMSPMAST2 as well
SXMSCLUR SXMSCLUP (cleaned up by XML message archivingdeletion)
If you use the switch procedure you have to check SXMSPCLUR2 and SXMSCLUP2 as well
SAP NETWEAVER 71 AND HIGHER PERFORMANCE CHECK GUIDE
100
SXMSPHIST (cleaned up by the deletion of history entries)
If you use the switch procedure you have to check SXMSPHIST2 as well
SXMSPFRAWH and SXMSPFRAWD (cleaned up by the performance jobs see SAP Note 820622 ndash Standard Jobs for XI Performance Monitoring)
SWFRXI (cleaned up by specific jobs see SAP Note 874708 - BPE HT Deleting Message Persistence Data in SWFRXI)
SWWWIHEAD (cleaned up by work item archivingdeletion)
Use an appropriate database tool for example SQLPLUS for Oracle for the database tables of the J2EE schema Main tables that could be affected of growth
PI Message tables BC_MSG and BC_MSG_AUDIT (when audit log persistence is enabled)
PI message logging information when stagingloging is used BC_MSG_LOG_VERSION
XI IDoc tables (if IDoc persistence is activated) XI_IDOC_IN_MSG and XI_IDCO_OUT_MSG
Check for all tables if the number of entries is reasonably small or remains roughly constant over a period of time If that is not the case check your archivingdeletion setup
SAP NETWEAVER 71 AND HIGHER PERFORMANCE CHECK GUIDE
101
10 TRACES LOGS AND MONITORING DECREASING PERFORMANCE
101 Integration Engine
There are three important locations for the configuration of tracing logging in the Integration Engine The
pipeline settings of PI itself the Internet Communication Manager (ICM) and the gateway All three are
heavily involved in message processing and therefore their tracing or logging settings can have an impact on
performance On top of this you might have changed the SM59 RFC destinations and have switched on the
trace in order to analyze a problem If so then this needs to be reset as well
Procedure
Start transaction SXMB_ADM and navigate to Integration Engine Configuration Specific Configuration and search for the following entries
Category Parameter Subparameter Current Value Default
RUNTIME TRACE_LEVEL ltnonegt ltyour valuegt 1
RUNTIME LOGGING ltnonegt ltyour valuegt 0
RUNTIME LOGGING_SYNC ltnonegt ltyour valuegt 0
Set the above parameters back to the default value which is the recommended value by SAP
Start transaction SMICM and check the value of the Trace Level that is displayed in the overview
(third line) Set the trace level to lsquo1rsquo if not already the case You can do so by navigating to Goto Trace Level Set
Start transaction SMGW navigate to Goto Parameters Display and check the parameter Trace Level Set the trace level to lsquo1rsquo if not already the case You can do so by navigating to Goto Trace Gateway Reduce Level (or Increase Level respectively)
Start transaction SM59 and search the following RFC destination for the flag ldquoTracerdquo on the tab Special Options and remove the Flag ldquoTracerdquo if it has been set
AI_RUNTIME_JCOSERVER
AI_DIRECTORY_JCOSERVER
LCRSAPRFC
SAPSLDAPI It is possible that other RFC destinations are used for sending out IDocs and similar
SAP NETWEAVER 71 AND HIGHER PERFORMANCE CHECK GUIDE
102
102 Business Process Engine
You only have to check the Event Trace in the Business Process Engine
Procedure
Call transaction SWELS and check if the Event Trace is switched on The recommended setting is lsquooffrsquo (as shown in the screenshot below)
103 Adapter Framework
Since the Adapter Framework runs on the J2EE Engine the tracing and logging can be conveniently
checked and controlled using NetWeaver Administrator To improve the performance SAP recommends that
you set all trace levels to default Higher trace levels are only acceptable in productive usage during problem
analysis Below you will find a description on how to set the default trace level for all locations at once It is of
possible to do it for every location separately but this way you might forget to reset one of the locations
Procedure
Start the NetWeaver Administrator and navigate to Problem Management (or Troubleshooting in NW 73 and higher) Logs and Traces and choose Log Configuration In the Show drop down list box choose Tracing Locations Select the Root Location in the tree and press the button Default Configuration This will set the default configuration for all locations
Start the NetWeaver Administrator and navigate to Troubleshooting Logviewer (direct link nwalinks) Open the View ldquoDeveloper Tracerdquo and check if you have very frequent reoccurring exceptions that fill up the trace Analyze the exception and check what is causing this (eg a wrong configuration of a Communication Channel causing repeated traces If you see very frequent errors for which you cannot find the root cause open a customer incident at SAP
SAP NETWEAVER 71 AND HIGHER PERFORMANCE CHECK GUIDE
103
An aggregated view of Java exceptions (by number date instance server node etc) are reported and available in SAP Solution Manager Root Cause Analysis Exception Analysis functionality
1031 Persistence of Audit Log information in PI 710 and higher
With SAP NetWeaver PI 71 the audit log is not persisted for successful messages in the database by default
to avoid performance overhead Therefore the audit log is only available in the cache for a limited period of
time (based on the overall message volume)
Audit log persistence can be activated temporarily for performance troubleshooting where audit log
information is required To do so use the NWA and change the parameter
ldquomessagingauditLogmemoryCacherdquo to false in service XPI Service Messaging System by setting the
parameter to false Details can be found in SAP Note 1314974 - PI 71 AF Messaging System audit log
persistence Only do so temporarily during the time of troubleshooting to avoid any performance problems
from the additional persistence
After implementing Note 1611347 - New data columns in Message Monitoring additional information like
message processing time in ms and server node is visible in the message monitor
SAP NETWEAVER 71 AND HIGHER PERFORMANCE CHECK GUIDE
104
11 ERRORS AS SOURCE OF PERFORMANCE PROBLEMS
If errors occur within messages or within technical components of the SAP Process Integration then this can
have a severe impact on the overall performance Thus to solve performance problems it is sometimes
necessary to analyze the log files of technical components and to search for messages with errors To
search for messages with errors use the PI Admin Check which is available using SAP Note 884865 - PIXI
Admin Check
Procedure
ICM (Internet Communication Manager)
Start transaction SMICM open the log file (Shift + F5 or GoTo Trace File Show All) and check for errors
Gateway
Start transaction SMGW open the Log File (CTRL + Shift + F10 or Goto Trace Gateway Display File) and check for errors
System Log
Start transaction SM21 choose an appropriate time interval and search the log entries for errors Repeat the procedure for remote systems if you are using dialog instances
ABAP Runtime Errors
Start transaction ST22 choose an appropriate time interval and search for PI-related dumps In general the number of ABAP dumps should be very small on a PI system and therefore all occurring dumps should be analyzed
Alerts CCMS
Start transaction RZ20 and search for recent alerts
Work Process and RFC trace
In the PI work directory check all files which begin with dev_rfc or dev_w for errors
J2EE Engine
In the PI work directory search for errors in file dev_server0out If you are using more than one J2EE server node check dev_serverltngtout as well
Applications running on the J2EE Engine
The traces for application-related errors are the defaulttrc files located in j2eeclusterserverltngtlog directory To monitor exceptions across multiple server nodes the best tool to use is the LogViewer service of the NWA This is available via Problem Management Logs and Traces and choose Log Viewer Search for exceptions in the area of the performance problem for example the PI Messaging system
SAP NETWEAVER 71 AND HIGHER PERFORMANCE CHECK GUIDE
105
APPENDIX A
A1 Wily Introscope Transaction Trace
As mentioned above the Wily Transaction trace can be used to trace expensive steps that were noticed
during the mapping or module processing The transaction trace will allow you to drill down further into Java
performance problems and to distinguish if it is a pure coding problem or caused by a look-up to a remote
system or a slow connection to the local database
The Wily Transaction trace can be used to trace all steps that exceed a specific duration on the Java stack If
a user is known (for example for SAP Enterprise Portal) the tracing can be restricted to a specific user In PI
if you encounter a module that lasts several seconds then you can restrict the tracing as shown below
Note Starting the Transaction Trace increases the data collection on the satellite system (PI) and is
therefore only recommended in productive environment for troubleshooting purposes
With the selection above the trace will run for 10 minutes (this is the maximum and it can be canceled earlier)
and will trace all steps exceeding 3 seconds for the agents of the PI system If such long-running steps are
found then a new window will be displayed listing these steps
In the screenshot below you can see the result in the Trace View The Trace View shows the elapsed time
from left to rightndash in the example below around 48 seconds From top to bottom we can see the call stack of
the thread In general we are interested in long-running threads on the bottom of the trace view A long-
running block at the bottom means that this is the lowest level coding that was instrumented and which is
consuming all the time
In the example below we see a mapping call that is performing many individual database statements ndash this
will become visible by highlighting the lowest level In such a case you have to review the coding of the
mapping to see if the high amount of database calls can be summarized in one call
SAP NETWEAVER 71 AND HIGHER PERFORMANCE CHECK GUIDE
106
Another case that is often seen is that a lookup using JDBC to a remote database or RFC to an ABAP
system takes a long time in the mapping or adapter module In such a case there will be one long block at
the bottom of the transaction trace that also gives you some details about the statement that was executed
A2 XPI inspector for troubleshooting and performance analysis
The XPI Inspector is an additional tool that provides enhanced logging and tracing capabilities with a main
focus on troubleshooting But the tool can also be used for troubleshooting of performance issues
General information about the tool can be found at Note 1514898 - XPI Inspector for troubleshooting PI The
tool can be called using the following URL on your system httphostjava-portxpi_inspector
To analyze performance problems typically the example ldquo51 ndash ldquoPerformance Problem)rdquo is used As a basic
measurement it allows you to take multiple thread dumps in specific time intervals These thread dumps can
be analyzed later by your administrators or SAP support to identify what is causing the problem The Thread
Dump Viewer tool (TDV) from Note 1020246 - Thread Dump Viewer for SAP Java Engine can be used to
analyze the produced thread dumps (inside the results archive that can be downloaded to your local PC)
SAP NETWEAVER 71 AND HIGHER PERFORMANCE CHECK GUIDE
107
In addition the tool allows you to do JVM profiling be either doing JVM Performance tracing or JVM Memory
Allocation tracing This can help to understand in detail which steps of the processing are taking a long time
As output the tool provides prf files that can be loaded into the JVM Profiler More information can be found
at httpwikiscnsapcomwikidisplayASJAVAJava+Profiling Please Note that these traces (especially the
memory profiling) will cause a high overhead on the J2EE engine and are therefore not recommended to be
used in production Instead it is advisable to reproduce the problem on your QA system and use the tool
there
Document Version 30 March 2014
wwwsapcom
copy 2014 SAP AG All rights reserved
SAP R3 SAP NetWeaver Duet PartnerEdge ByDesign SAP
BusinessObjects Explorer StreamWork SAP HANA and other SAP
products and services mentioned herein as well as their respective
logos are trademarks or registered trademarks of SAP AG in Germany
and other countries
Business Objects and the Business Objects logo BusinessObjects
Crystal Reports Crystal Decisions Web Intelligence Xcelsius and
other Business Objects products and services mentioned herein as
well as their respective logos are trademarks or registered trademarks
of Business Objects Software Ltd Business Objects is an SAP
company
Sybase and Adaptive Server iAnywhere Sybase 365 SQL
Anywhere and other Sybase products and services mentioned herein
as well as their respective logos are trademarks or registered
trademarks of Sybase Inc Sybase is an SAP company
Crossgate mgic EDDY B2B 360deg and B2B 360deg Services are
registered trademarks of Crossgate AG in Germany and other
countries Crossgate is an SAP company
All other product and service names mentioned are the trademarks of
their respective companies Data contained in this document serves
informational purposes only National product specifications may vary
These materials are subject to change without notice These materials
are provided by SAP AG and its affiliated companies (SAP Group)
for informational purposes only without representation or warranty of
any kind and SAP Group shall not be liable for errors or omissions
with respect to the materials The only warranties for SAP Group
products and services are those that are set forth in the express
warranty statements accompanying such products and services if
any Nothing herein should be construed as constituting an additional
warranty
wwwsapcom
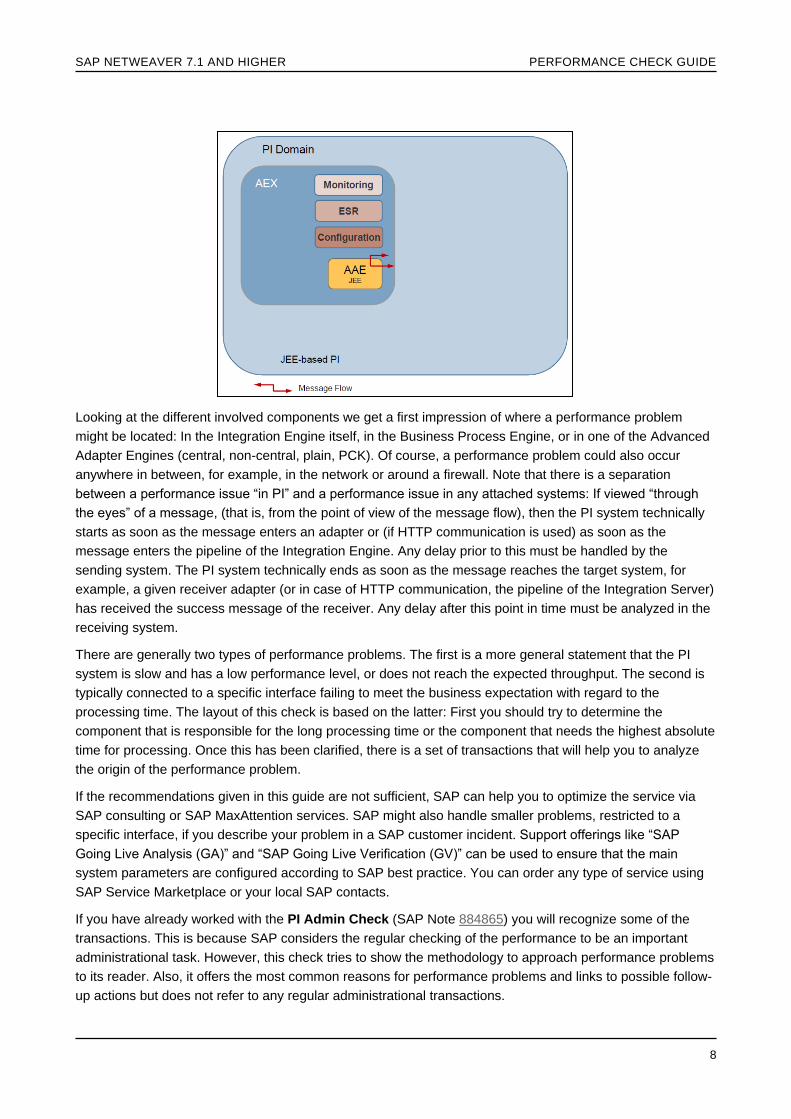
SAP NETWEAVER 71 AND HIGHER PERFORMANCE CHECK GUIDE
9
Wily Introscope is a prerequisite for analyzing performance problems at the Java side It allows you to
monitor the resource usage of multiple J2EE server nodes and provides information about all the important
components on the Java stack like mapping runtime messaging system or module processor Furthermore
the data collected by Wily is stored for several days so it is still possible to analyze a performance problem at
a later date Wily Introscope is provided free-of-charge for SAP customers It is delivered as part of Solution
Manager Diagnostics but can also be installed separately For more information see
httpservicesapcomdiagnostics or SAP Note 797147
SAP NETWEAVER 71 AND HIGHER PERFORMANCE CHECK GUIDE
10
2 WORKING WITH THIS DOCUMENT
If you are experiencing performance problems on your Process Integration system start with Chapter 3
Determining the Bottleneck It helps you to determine the processing time for the different runtimes within PI
Integration Engine Business Process Engine and Adapter Engine or connected Proxy System Once you
have identified the area in which the bottleneck is most probably located continue with the relevant chapter
This is not always easy to do because a long processing time is not always an indication for a bottleneck It
can make sense to do this if a complicated step is involved (Business Process Engine) if an extensive
mapping is to be executed (IS) or if the payload is quite large (all runtimes) For this reason you need to
compare the value that you retrieve from Chapter 3 with values that you have received previously for
example The history data provided for the Java components by Wily Introscope is a big help If this is not
possible you will have to work with a hypothesis
Once the area of concern has been identified (or your first assumption leads you there) Chapters 4 5 6
and 7 will help you to analyze the Integration Engine the Business Process Engine the PI Adapter
Framework and the ABAP Proxy runtime
After (or preferably during) the analysis of the different process components it is important to keep in mind
that the bottlenecks you have observed could also be caused by other interfaces processing at the same
time It will lead you to slightly different conclusions and tuning measures You therefore have to distinguish
the following cases based on where the problem occurs
A with regard to the interface itself that is it occurs even if a single message of this interface is processed
B or with regard to the volume of this interface that is many messages of this interface are processed at the same time
C or with regard to the overall message volume processed on PI
This can be analyzed by repeating the procedure of Chapter 3 for A) a single message that is processed
while no other messages of this interface are processed and while no other interfaces are running Then
compare this value with B) the processing time for a typical amount of messages of this interface not simply
one message as before If the values of measurement A) and B) are similar repeat the procedure with C) a
typical volume of all interfaces that is during a representative timeframe on your productive PI system or
with the help of a tailored volume test
These three measurements ndash A) processing time of a single message B) processing time of a typical
amount of messages of a single interface and C) processing time of a typical amount of messages of all
interfaces ndash should enable you to distinguish between the three possible situations
o A specific interface has long processing steps that need to be identified and improved The tuning options are usually limited and a re-design of the interface might be required
o The mass processing of an interface leads to high processing times This situation typically calls for tuning measures
o The long processing time is a result of the overall load on the system This situation can be solved by tuning measures and by taking advantage of PI features for example to establish separation of interfaces If the bottleneck is hardware-related it could also require a re-sizing of the hardware that is used
SAP NETWEAVER 71 AND HIGHER PERFORMANCE CHECK GUIDE
11
Chapters 8 9 10 and 11 deal with more general reasons for bad performance such as heavy
tracinglogging error situations and general hardware problems They should be taken into account if the
reason for slow processing cannot be found easily or if situation C from above applies (long processing times
due to a high overall load)
Important
Chapter 9 provides the basic checks for the hardware of the PI server It should not only be used when
analyzing a hardware bottleneck due to a high overall load andor an insufficient sizing but should also be
used after every change made to the configuration of PI to ensure that the hardware is able to handle the
new situation This is important because a classical PI system uses three runtime engines (IS BPE AFW)
Tuning one engine for high throughput might have a direct impact on the others With every tuning action
applied you have to be aware of the consequences on the other runtimes or the available hardware
resources
SAP NETWEAVER 71 AND HIGHER PERFORMANCE CHECK GUIDE
12
3 DETERMINING THE BOTTLENECK
The total processing time in PI consists of the processing time in the Integration Server processing time in
the Business Process Engine (if ccBPM is used) as well as the processing time in the Adapter Framework (if
adapters except IDoc plain HTTP or ABAP proxies are used) In the subsequent chapters you will find a
detailed description of how to obtain these processing times
For reasons of completeness we will also have a look at the ABAP Proxy runtime and the available
performance evaluations
31 Integration Engine Processing Time
You can use an aggregated view of the performance (details about activation in Note 820622 - Standard jobs
for XI performance monitoring) data for the Integration Engine as shown below
Procedure
Log on to your Integration Engine and call transaction SXMB_IFR In the browser window follow the link to
the Runtime Workbench In there click ldquoPerformance Monitoringrdquo Change the display to ldquoDetailed Data
Aggregatedrdquo select lsquoISrsquo as the Data Source (or lsquoPMIrsquo if you have configured the Process Monitoring
Infrastructurersquo) and ldquoXIIntegrationServerltyour_hostgtrdquo as the component Then choose an appropriate time
interval for example the last day You have to enter the details of the specific interface you want to monitor
here
The interesting value is the ldquoProcessing Time [s]rdquo in the fifth column It is the sum of the processing time of the single steps in the Integration Server For now you are not interested in the single steps that are listed on the right side since you are still trying to find out the part of the PI system where the most time is lost Chapter 44 will work with the individual steps
SAP NETWEAVER 71 AND HIGHER PERFORMANCE CHECK GUIDE
13
If you do not know which interface is affected yet you first have to get an overview Instead of navigating to
Detailed Data Aggregated in the Runtime Workbench choose Overview Aggregated Use the button Display
Options and check the options for sender component receiver component sender interface and receiver
interface Check the processing times as described above
32 Adapter Engine Processing Time
Procedure
Log on to your Integration Server and call transaction SXMB_IFR In the browser window follow the link to
the Runtime Workbench In there click Message Monitoring choose Adapter Engine lthostgt from Database
from the drop down lists and press Display Enter your interface details and ldquoStartrdquo the selection Select one
message using the radio button and press Details
Calculate the difference between the start and end timestamp indicated on the screen
Do the above calculation for the outbound (AFW IS) as well as the inbound (IS AFW) messages
The audit log of successful message is no longer persisted in SAP NetWeaver PI 71 by default in order to minimize the load on the database The audit log has a high impact on the database load since it usually consists of many rows that are inserted individually in the database In newer releases therefore a cache was implemented that keeps the audit log information for a period of time only Thus no detailed information is available any longer from a historical point of view Instead you should use Wily Introscope for historical analyses of the performance of successful messages
The audit log can be persisted on the database to allow historical analysis of performance problems
on the Java stack To do so change the parameter ldquomessagingauditLogmemoryCacherdquo from
true to false for service ldquoXPI Service Messaging Systemrdquo using NetWeaver Administrator (NWA) as described in SAP Note 1314974 Note Only do this temporarily if you have identified the bottleneck on the AFW First try using Wily to determine the root cause of the problem
SAP NETWEAVER 71 AND HIGHER PERFORMANCE CHECK GUIDE
14
Due to above mentioned limitations Wily Introscope is the right tool for performance analysis of the Adapter Engine Wily persists the most important steps like queuing module processing and average response time in historical dashboards (aggregated data per intervals for all server nodes of a system or all systems with filters possible etc)
SAP NETWEAVER 71 AND HIGHER PERFORMANCE CHECK GUIDE
15
Especially for Java-Only runtime using Integrated Configuration Wily shows the complete processing time after the initial sender adapter steps (receiver determination mapping and time in the backend call) as can be seen in the Message Processing Time dashboard below
Using the ldquoShow Minimum and Maximumrdquo functionality deviations from the average processing time can be seen In the example below a message processing step takes up to 22 seconds The reason for this could either be a slow mapping or a delay in the call to the receiver system (in the example below Java IDoc adapter is used to transfer the data to ERP)
In case of high processing times in one of your steps further analysis might be required using thread dumps or the Java Profiler as outlined in the appendix section A2 XPI inspector for troubleshooting and performance analysis
321 Adapter Engine Performance monitor in PI 731 and higher
Starting from PI 731 SP4 there is a new performance monitor available for the Adapter Engine More
information on the activation of the performance monitor can be found at Note 1636215 ndash Performance
Monitoring for the Adapter Engine Similar to the ABAP monitor in the RWB the data is displayed in an
aggregated format On the PI start page use the link ldquoConfiguration and Monitoring Homerdquo Go to ldquoAdapter
Enginerdquo and select ldquoPerformance Monitorrdquo The data is persisted on an hourly basis for the last 24 hours and
on a daily basis for the last 7 days The data is further grouped on interface level and per Java server node
With the information provided you can therefore see the minimum maximum and average response time of
an individual interface on a specific Java server node All individual steps of the message processing like
time spent in the Messaging System queues or Adapter modules are listed In the example below you can
SAP NETWEAVER 71 AND HIGHER PERFORMANCE CHECK GUIDE
16
see that most of the time (5 seconds) is spent in a module called SimpleWaitModule This would be the entry
point for the further analysis
Starting with 731 SP10 (740 SP05) this data can be exported to excel in two ways Overview or Detailed (details in SAP Note 1886761)
33 Processing Time in the Business Process Engine
Procedure
Log on to your integration server and call transaction SXMB_MONI Adjust your selection in a way that you
select one or more messages of the respective interface Once the messages are listed navigate to the
Outbound column (or Inbound if your integration process is the sender) and click on PE Alternatively you
can select the radio button for ldquoProcess Viewrdquo on the entranceselection screen of SXMB_MONI
To judge the performance of an integration process it is essential to understand the steps that are executed A long-running integration process in itself is not critical because it can wait for a trigger event or can include a synchronous call to a backend Therefore it is important to understand the steps that are included before analyzing an individual workflow log For example the screenshot below shows a long waiting time after the mapping This is perhaps due to an integrated wait step
Calculate the time difference between the first and the last entry Note that this time for the workflow does not include the duration of RFC calls for example To see this processing time navigate to the ldquoList with Technical Detailsrdquo (second button from the left on the screenshot below or shift + F9) Repeat this step for several messages to get an overview about the most time consuming steps
Please Note that the processing time mentioned above does not include the waiting time of the messages in the ccBPM queues Therefore it is essential to monitor a queue backlog in ccBPM queues as discussed in section ldquoQueuing and ccBPM (or increasing Parallelism for ccBPM Processes)rdquo
SAP NETWEAVER 71 AND HIGHER PERFORMANCE CHECK GUIDE
17
Via transaction SWI2_DURA you can display an aggregated performance overview across all ccBPM
processes running on your PI system In the initial screen you have to choose ldquo(Sub-) Workflow and the time
range you would like to look at
SAP NETWEAVER 71 AND HIGHER PERFORMANCE CHECK GUIDE
18
The results here allow you to compare the average performance of a process It shows you the processing
time based on barriers The 50 barrier means that 50 of the messages were processed faster than the
value specified Furthermore you also see a comparison of the processing time to eg the day before By
adjusting the selection criteria of the transaction you can therefore get a good overview about the normal
processing time of the Integration process and can judge if there is a general performance problem or just a
temporary one
The number of process instances per integration process can be easily checked via transaction
SWI2_FREQ The data shown allows you to check the volume of the Integration Processes and allow you to
judge if your performance problem is caused by an increase of volume which could cause a higher latency in
the ccBPM queues
New in PI 73 and higher
Starting from PI 73 a new monitoring for ccBPM processes is available This monitor can be started from
transaction SXMB_MONI_BPE Integration Process Monitoring (also available in ldquoConfiguration and
Monitoring Homerdquo on PI start page) This is new browser based view that allows a simplified and aggregated
view on the PI Integration Processes
On the initial screen you get an overview about all the Integration Processes executed in the selected time
interval Therefore you can immediately see the volume of each Integration Process
From there you can navigate to the Integration process facing the performance issues and look at the
individual process instances and the start and end time Furthermore there is a direct entry point to see the
PI messages that are assigned to this process
SAP NETWEAVER 71 AND HIGHER PERFORMANCE CHECK GUIDE
19
Choosing one special process instance ID you will see the time spend in each individual processing step
within the process In the example below you can see that most of the time is spend in the Wait Step
SAP NETWEAVER 71 AND HIGHER PERFORMANCE CHECK GUIDE
20
4 ANALYZING THE INTEGRATION ENGINE
If chapter Determining the Bottleneck has shown that the bottleneck is clearly in the Integration Engine there
are several transactions that can help you to analyze the reason for this To understand why this selection of
transactions helps to analyze the problem it is important to know that the processing within the Integration
Engine is done within the pipeline The central pipeline of the Integration Server executes the following main
steps
Central Pipeline Steps Description of Central Pipeline Steps
PLSRV_XML_VALIDATION_RQ_INB XML Validation Inbound Channel Request
PLSRV_RECEIVER_DETERMINATION Receiver Determination
PLSRV_INTERFACE_DETERMINATION Interface Determination
PLSRV_RECEIVER_MESSAGE_SPLIT Branching of Messages
PLSRV_MAPPING_REQUEST Mapping
PLSRV_OUTBOUND_BINDING Technical Routing
PLSRV_XML_VALIDATION_RQ_OUT XML Validation Outbound Channel Request
PLSRV_CALL_ADAPTER Transfer to Respective Adapter IDoc HTTP Proxy AFW
PLSRV_XML_VALIDATION_RS_INBXML Validation Inbound Channel Response
PLSRV_MAPPING_RESPONSE Response Message Mapping
PLSRV_XML_VALIDATION_RS_OUT Validation Outbound Channel Response
The last three steps highlighted in bold are available in case of synchronous messages only and reflect the
time spent in the mapping of the synchronous response message
The steps indicated in red are new in SAP NetWeaver PI 71 and higher and can be used to validate the
payload of a PI message against an XML schema These steps are optional and can be executed at different
times in the PI pipeline processing for example before and after a mapping (as shown above)
With PI 731 an additional option of using an external Virus Scan during PI message processing can be
activated as described in the Online Help The Virus Scan can be configured on multiple steps in the pipeline
ndash eg after the mapping (Virus Scan Outbound Channel Request) when receiving a synchronous response
(Virus Scan Inbound Channel Response) and after the response mapping (Virus Scan Outbound Channel
Response)
It is important to know is that these pipeline steps are executed based on qRFC Logical Unit of Work (LUW)
by using dialog work processes
SAP NETWEAVER 71 AND HIGHER PERFORMANCE CHECK GUIDE
21
With 711 and higher versions you can activate the Lean Message Search (LMS) to be able to search for
payload content This is described in more detail in chapter Long Processing Times for
ldquoLMS_EXTRACTIONrdquo
41 Work Process Overview (SM50SM66)
The work process overview is the central transaction to get an overview of the current processes running in
the Integration Engine For message processing PI is only using Dialog work processes (DIA WP) Therefore
it is essential to ensure that enough DIA WPs available
The process overview is only a snapshot analysis You therefore have to refresh the data multiple times to
get a feeling for the dynamics of the processes The most important questions to be asked are as follows
How many work processes are being used on average Use the CPU Time (clock symbol) to check that not all DIA WPs are used In case all DIA WPs have a high CPU time this indicates a WP bottleneck
Which users are using these processes It depends on the usage of your PI system All asynchronous messages are processed by the QIN scheduler who will start the message processing in DIA WPs The user that is shown in SM66 will be the one that triggered the QIN scheduler This can eg be a communication user for a connected backend (usually a copy of PIAPPLUSER) or the user used to send data from the Adapter Engine (per default PIAFUSER)
Activities related to the Business Process Engine (ccBPM) will be indicated by user WF-BATCH If you see high WF-BATCH activity take a look at chapter 51
Are there any long running processes and if so what are these processes doing with regard to the reports used and the tables accessed
o As a rule of thumb for the initial configuration the number of DIA work processes should be around six times the value of CPU in your PI system (rdispwp_no_dia = 6 to 8 times CPUs cores based on SAP Note 1375656 - SAP NetWeaver PI System Parameters)
If you would like to get an overview for an extended period of time without actually refreshing the transaction
at regular intervals use report SDFMON and schedule the Daily Monitoring It allows you to collect metrics
such as CPU usage amount of free Dialog work processes and most importantly a snapshot of the work
process activity as provided in transactions SM50 and SM66 The frequency for the data collection can be as
low as 10 seconds and the data can be viewed after the configurable timeframe of the analysis Note
SDFMON is only intended for analysis of performance issues and should only be scheduled for a limited
period of time
If you have Solution Manager Diagnostics installed and all the agents connected to PI you can also monitor
the ABAP resource usage using Wily Introscope As you can see in the dashboard below you can use it to
monitor the number of free work processes (prerequisite is that the SMD agent is running on the PI system)
The major advantage of Wily Introscope is that this information is also available from the past and allows
analysis after the problem has occurred in the system
SAP NETWEAVER 71 AND HIGHER PERFORMANCE CHECK GUIDE
22
42 qRFC Resources (SARFC)
Depending on the configuration of the RFC server group not all dialog work processes can be used for
qRFC processing in the Integration Server As stated earlier all (ABAP based) asynchronous messages are
processed using qRFC Therefore tuning the RFC layer is one of the most important tasks to achieve good
PI performance
In case you have a high volume of (usually runtime critical) synchronous scenarios you have to ensure that
enough DIA WPs are kept free by the asynchronous interfaces running at the same time Since this is a very
difficult tuning exercise we usually recommend implementing runtime critical synchronous interfaces using
Java only configuration (ICO) whenever possible If this is not possible you have to ensure via SARFC tuning
that enough work processes are kept free to process the synchronous messages
The current resource situation in the system can be monitored using transaction SARFC
Procedure
First check which application servers can be used for qRFC inbound processing by checking the AS Group
assigned in transaction SMQR
Call transaction SARFC and refresh several times since the values are only snapshot values
Is the value for ldquoMax Resourcesrdquo close to your overall number of dialog work processes Max Resources is a fixed value and describes how many DIA work processes may be used for RFC communication If the value is too low your RFC parameters need tuning to provide the Integration Server with enough resource for the pipeline processing The RFC parameters can be displayed by double-clicking on ldquoServer Namerdquo
o A good starting point is to set the values as follows
Max no of logons = 90
Max disp of own logons = 90
Max no of WPs used = 90
Max wait time = 5
Min no of free WP = 3-10 (depending on the size of the application server)
These values are specified in SAP Note 1375656 ndash SAP NetWeaver PI System Parameters (this parameter must be increased if you plan to have synchronous interfaces) To avoid any bottleneck and blocking situation free DIA WPs should always be available The value should be adjusted based on the overall number of DIA WPs available at the system and the above requirements
SAP NETWEAVER 71 AND HIGHER PERFORMANCE CHECK GUIDE
23
Note You have to set the parameters using the SAP instance profile Otherwise the changes are lost
after the server is restarted
The field ldquoResourcesrdquo shows the number of DIA WPs available for RFC processing Is this value reasonably high for example above zero all the time If the ldquoResourcesrdquo value is zero then the Integration Server cannot process XML messages because no dialog work process is free to execute the necessary qRFC There are several conclusions that can be drawn from this observation as follows
1) Depending on the CPU usage (see Chapter ldquoMonitoring CPU Capacityrdquo) it might be necessary at this time to increase the number of dialog work processes in your system If the CPU usage however is already very high increasing the number of DIA will not solve the bottleneck
2) Depending on the number of concurrent PI queues (see Chapter qRFC Queues (SMQ2)) it might be necessary to decrease the degree of parallelism in your Integration Server because the resources are obviously not sufficient to handle the load The next section describes how to tune PI inbound and outbound queues
The data provided in SARFC is also collected and shown in a graphical and historical way using Solution
Manager Diagnostic and Wily Introscope (as can be seen in the screenshot below) This allows easy
monitoring of the RFC resources across all available PI application servers
43 Parallelization of PI qRFC Queues
The qRFC inbound queues on the ABAP stack are one of the most important areas in PI tuning Therefore it
is essential to understand the PI queuing concept
PI generally uses two types of queues for message processing ndash PI inbound and PI outbound queues Both
types are technical qRFC inbound queues and can therefore be monitored using SMQ2 PI inbound queues
are named XBTI (EO) or XBQI (EOIO) and are shared between all interfaces running on PI by default The
PI outbound queues are named XBTO (EO) and XBQO (EOIO) The queue suffix (in red XBTO0___0004)
specifies the receiver business system This way PI is using dedicated outbound queues for each receiver
SAP NETWEAVER 71 AND HIGHER PERFORMANCE CHECK GUIDE
24
system All interfaces belonging to the same receiver business system are contained in the same outbound
queue Furthermore there are dedicated queues for prioritization of separation of large messages To get an
overview about the available queues use SXMB_ADM Manage Queues
PI inbound and outbound queues execute different pipeline steps
PI Inbound Queues
Pipeline Steps Description of Pipeline Steps
PLSRV_XML_VALIDATION_RQ_INB XML Validation Inbound Channel Request
PLSRV_RECEIVER_DETERMINATION Receiver Determination
PLSRV_INTERFACE_DETERMINATION Interface Determination
PLSRV_RECEIVER_MESSAGE_SPLIT Branching of Messages
PI Outbound Queues
Pipeline Steps Description of Pipeline Steps
PLSRV_MAPPING_REQUEST Mapping
PLSRV_OUTBOUND_BINDING Technical Routing
PLSRV_XML_VALIDATION_RQ_OUT XML Validation Outbound Channel Request
PLSRV_CALL_ADAPTER Transfer to Respective Adapter IDoc HTTP Proxy AFW
Before the steps above are executed the messages are placed in a qRFC queue (SMQ2) The messages
will wait till they are first in queue and till a free DIA work process is assigned to a queue The wait time in the
queue are recorded in the performance header in DB_ENTRY_QUEUING (PI inbound queue) and
DB_SPLITTER_QUEUING (PI outbound queue) Most often you will see the long processing times there as
discussed in chapter Long Processing Times for ldquoDB_ENTRY_QUEUEINGrdquo and Long Processing Times for
ldquoDB_SPLITTER_QUEUEINGrdquo
Looking at the steps above it is clear that tuning the queues will have a direct impact on the connected PI
components and also backend systems For example by increasing the number of parallel outbound queues
more mappings will be executed in parallel which will in turn put a greater load on the Java stack or more
messages will be forwarded in parallel to the backend system in case of a Proxy call Thus when tuning PI
queues you must always keep the implications for the connected systems in mind
The tuning of PI ABAP queue parameters is done in transaction SXMB_ADM Integration Engine
Configuration and by selecting the category TUNING
For productive usage we always recommend to use inbound and outbound queues (parameter
EO_INBOUND_TO_OUTBOUND=1) Otherwise only inbound queues will be used which are shared across
SAP NETWEAVER 71 AND HIGHER PERFORMANCE CHECK GUIDE
25
all interfaces Hence a problem with one single backend system will affect all interfaces running on the
system
The principle of less is sometimes more also applies for tuning the number of parallel PI queues Increasing
the number of parallel queues will result in more parallel queues with fewer entries per queue In theory this
should result in a lower latency if enough DIA WPs are available
But practically this is not true for high volume systems The main reason for this is the overhead involved in
the reloading of queues (see details below) Furthermore important tuning measures like PI packaging (see
Chapter ldquoPI Message Packagingrdquo) aim to increase the throughput based on a higher number of messages in
the queue Thus from a throughput perspective it is definitely advisable to configure fewer queues
If you have very high runtime requirements you should prioritize these interfaces and assign a different
parallelism for high priority queues only This can be done using parameters
EO_INBOUND_PARALLEL_HIGH_PRIO and EO_OUTBOUND_PARALLEL_HIGH_PRIO as described in
section ldquoMessage Prioritization on the ABAP Stackrdquo
To tune the parallelism of inbound and outbound queues the relevant parameters are
EO_INBOUND_PARALLEL and EO_OUTBOUND_PARALLEL have to be used
Below you can see a screenshot of SMQ2 You can see the PI inbound queues and outbound queues Also
ccBPM queues (XBQO$PE) are displayed and will be discussed in section 5
Procedure
Log on to your Integration Server call transaction SMQ2 and execute If you are running ABAP proxies on a
separate client on the same system enter lsquorsquo for the client Transaction SMQ2 provides snapshots only and
must therefore be refreshed several times to get viable information
o The first value to check is the number of queues concurrently active over a period of time Since each queue needs a dialog work process to be worked on the number of concurrent queues must not be too high compared to the number of dialog work processes usable for RFC communication (see Chapter qRFC Resources (SARFC)) The optimum throughput can be achieved if the number of active queues is equal to or slightly higher than the number of dialog work processes (provided that the number of DIA work processes can be handled by the CPU of the system see transaction ST06)
In case many of the queues are EOIO queues (eg because the serialization is done on the material number) try to reduce the queues by following Chapter EOIO tuning
o The second value of importance is the number of entries per queue Hit refresh a few times to check if the numbers increasedecreaseremain the same An increase of entries for all queues or a specific
SAP NETWEAVER 71 AND HIGHER PERFORMANCE CHECK GUIDE
26
queue points to a bottleneck or a general problem on the system The conclusion that can be drawn from this is not simple Possible reasons have been found to include
1) A slow step in a specific interface
Bad processing time of a single message or a whole interface can be caused by expensive processing steps as for example the mapping step or receiver determination This can be confirmed by looking at the processing time for each step as shown in ldquoAnalyzing the runtime of pipeline stepsrdquo
2) Backlog in Queues
Check if inbound or outbound queues face a backlog A backlog in a queue is generally nothing critical since the queues ensure that the PI components as well as the backend systems are not overloaded For instance batch triggered interfaces are usually causing high backlogs that get processed over time Only in case the backlog prevents you to meet the business requirements for an interface this should be analyzed
If the backlog is caused by a high volume of messages arriving in a short period of time one solution to minimize the backlog is to increase the number of queues available for this interface (if sufficient hardware is available) If one interface is having a backlog in the outbound queues you could eg specify EO_OUTBOUND_PARALLEL with a sub parameter specifying your interface to increase the parallelism for this interface
But in general a backlog can also be caused by a long processing time in one of the pipeline steps as discussed in 1) or a performance problem with one of the connected components like PI Java stack or connected backend systems Due to the steps performed in the outbound queues (mapping or call adapter) it is more likely that a backlog will be seen in the outbound queues Inbound queue processing is only expensive if Content Based Routing or Extended Receiver Determination is used To understand which step is taking long follow once more chapter ldquoAnalyzing the runtime of pipeline stepsrdquo
In addition to tuning of the number of inbound and outbound queues also ldquoMessage Prioritization on the ABAP Stackrdquo and ldquoPI Message Packagingrdquo can help
The screenshot below shows such a backlog situation in Wily Introscope Please Note that the information about the queues is only collected by Wily in 5 minutes intervals explaining the gaps between the measurement points On the dashboard ldquoTotal qRFC Inbound Queue Entriesrdquo you can see that the number of messages in SMQ2 is increasing The number of inbound queues does not increase at the same time It also offers a dashboard for the number of entries by queue name and the time entries remain in SMQ2 With the information provided here it is also possible to distinguish a blocking situation or a general resource problem after the problem is no longer present in the system
SAP NETWEAVER 71 AND HIGHER PERFORMANCE CHECK GUIDE
27
3) Queues stay in status READY in SMQ2
To see the status of the queues use the filter button in SMQ2 as shown below
It is a normal situation to see many queues in READY status for a limited amount of time The reason for this is the way the QIN scheduler reloads LUWs (see point 2 below) A waiting time of up to 5 seconds per queuing step is considered normal during normal load situation (even if there is no backlog in the queue and enough resources are available) If you observe a situation where many queues are in READY status for longer period of time the following situations can apply
A resource bottleneck with regard to RFC resources Confirm by following section qRFC Resources (SARFC)
To avoid overloading a system with RFC load the QIN scheduler only reloads new queues after a certain amount of queues have finished processing This can lead to long waiting times in the queues as explained in SAP Note 1115861 - Behaviour of Inbound Scheduler after Resource Bottleneck Since PI is a non-user system we recommend setting rfcinb_sched_resource_threshold to 3 as described in SAP Note 1375656 ndash SAP NetWeaver PI System Parameters
Long DB loading times for RFC tables If using Oracle ensure that SAP Note 1020260 - Delivery of Oracle statistics is applied
Additional overhead during the pipeline executions occurs due to PI internal mechanisms Per default a lock is set during processing of each message This is no longer necessary and should
SAP NETWEAVER 71 AND HIGHER PERFORMANCE CHECK GUIDE
28
be switched off by setting the parameter LOCK_MESSAGE of category RUNTIME to 0 as described in SAP Note 1058915 In addition during the processing of an individual message the message repeatedly calls an enqueue which leads to a deterioration of the throughput This can be avoided by setting parameter CACHE_ENQUEUE to 0 as described in SAP Note 1366904
Sometimes a queue stays in READY status for a very long time while other queues are getting processed fine After manual unlocking the queue is processed but then stops after some time again A potential reason is described in Note 1500048 - SMQ2 inbound Queue remains in READY state In a PI environment queues in status RUNNING for more than 30 minutes usually happen due to one individual step taking long (as discussed in step 1) or a problem on the infrastructure (eg memory problems on Java or HTTP 200 lost on network) After 30 minutes the QIN scheduler removes this queue from the scheduling and therefore it remains in READY To solve such cases the root cause for the blocking has to be understood
4) Queue in READY status due to queue blacklisting
If a queue is for a very long time in status RUNNING (eg due to a problem with a mapping or due to a very slow backend) it is possible that the QIN scheduler excludes this queue from queue scheduling Hence the queue stays in status READY even though enough work processes are available The ldquoblacklistingrdquo of queues takes place when the runtime of a queue exceeds the ldquoMonitoring thresholdrdquo configured on this queue Notes 1500048 - queues stay in ready (schedule_monitor) and Note 1745298 - SMQR Inbound queue scheduler identify excluded entries provide more input on this topic The screenshot below shows a setting of 2400 seconds (40 minutes) for this parameter
Check if a queue stays in READY status for a long time while others are processing without any issue Ensure Note 1745298 is implemented and check the system log for the following exception ldquoQINEXCLUDE ltqueue namegt lttimedate at which the queue scheduler startedgt If this is the case check why the long runtime occurs (see section Analyzing the runtime of PI pipeline steps) or increase the schedule_monitor in exceptional cases only (if eg the runtime of an individual processing step cannot be improved further)
5) An error situation is blocking one or more queues
Click the Alarm Bell (Change View) push button once to see only queues with error status Errors delay the queue processing within the Integration Server and may decrease the throughput if for example multiple retries occur Navigate to the first entry of the queue and analyze the problem by forward navigation to the relevant message in SXMB_MONI
Often you see EO queues in SYSFAIL or RETRY due to the problems during the processing of an individual message This can be prevented by following the description of Chapter Prevent blocking of EO queues
SAP NETWEAVER 71 AND HIGHER PERFORMANCE CHECK GUIDE
29
44 Analyzing the runtime of PI pipeline steps
The duration of the pipeline steps is the ultimate answer to long processing times in the Integration Engine
since it describes exactly how much time was spent at which point The recommended way to retrieve the
duration of the pipeline steps is the RWB and will be described below Advanced users may use the
Performance Header of the SOAP message using transaction SXMB_MONI but the timestamps are not
easy to read If you still prefer the latter method here is the explanation 20110409092656165 must be read
as yyyymmddhh(min)(min)(sec)(sec)(microseconds) that is the timestamp corresponds to April 9 2011 at
092656 and 165 microseconds Please note that these timestamps in Performance Header of
SXI_MONITOR transaction are stored and displayed in UTC time therefore conversion to system time must
be done when analyzing them
In case PI message packaging is configured the performance header will always reflect the processing time
per package Hence a duration of 50 seconds does not mean a single message took 50 seconds but
eventually the package contained 100 messages so that every message took 05 ms More details about
this can be found in section PI Message Packaging
Procedure
Log on to your Integration Server and call transaction SXMB_IFR In the browser window follow the link to
the Runtime Workbench In there click Performance Monitoring Change the display to Detailed Data
Aggregated and choose an appropriate time interval for example the last day For this selection you have to
enter the details of the specific interface you want to monitor
You will now see in the lowerndashpart of the screen a split of the processing time into single steps Check the time difference between the steps Does any step take longer than expected In the example in the screenshot below the DB_ENTRY_QUEUEING starts after 0032 seconds and ends after 0243 seconds which means it took 0211 seconds (211ms)
SAP NETWEAVER 71 AND HIGHER PERFORMANCE CHECK GUIDE
30
Compare the processing times for the single steps for different measurements as outlined in Chapter
Pipeline Steps (SXMB_MONI or RWB) For example is a single step only long if many messages
are processed or if a single message is processed This helps you to decide if the problem is a
general design problem (single message has long processing step) or if it is related to the message
volume (only for a high number of messages this process step has large values)
Each step has different follow-up actions that are described next
441 Long Processing Times for ldquoPLSRV_RECEIVER_ DETERMINATIONrdquo PLSRV_INTERFACE_DETERMINATION
Steps that can take a long time in inbound processing are the Receiver and Interface Determination In these
steps the receiver system and interface is calculated Normally this is very fast but PI offers the possibility of
enhanced receiver determinations In these cases the calculation is based on the payload of a message
There are different implementation options
o Content-Based Routing (CBR)
CBR allows defining XPath expressions that are evaluated during runtime These expressions can be combined by logical operators for example to check the value for multiple fields The processing time of such a request directly correlates to the number and complexity of the conditions defined
No tuning options exist for the system in regard to CBR The performance of this step can only be changed by reducing the number of rules by changing the design of the interfaces Another option is to use an extended receiver determination (executing a mapping program) since this is faster than CBR using many rules
o Mapping to determine Receivers
A standard PI mapping (ABAP Java XSLT) can also be used to determine the receiver If you observe high runtimes in such a receiver determination follow the steps outlined in the next section since the same mapping runtime is used
442 Long Processing Times for ldquoPLSRV_MAPPING_REQUESTrdquo
Before analyzing the mapping you must understand which runtime is used Mappings can be implemented
in ABAP as graphical mappings in the Enterprise Service Builder as self-developed Java mappings or
XSLT mappings One interface can also be configured to use a sequence of mappings executed
sequentially In such a case analysis is more difficult because it is not clear which mapping in the sequence
is taking a long time
Normal debugging and tracing tools (transaction ST12) can be used for mappings executed in ABAP Any
type of mapping can be tested from ABAP using transaction SXI_MAPPING_TEST Knowing
senderreceiver partyserviceinterfacenamespace and source message payload it is possible to check the
target message (after mapping execution) and detailed trace output (similar to contents of trace of the
message in SXMB_MONI with TRACE_LEVEL = 3) It can also be used for debugging at runtime by using
the standard debugging functionality
For ABAP based XSLT mappings it is also possible via transaction XSLT_TOOL to test trace and debug
XSLT transformations on the ABAP stack
In general the mapping response time is heavily influenced by the complexity of the mapping and the
message size Therefore to analyze a performance problem in the mapping environment you should
compare the mapping runtime during the time of the problem with values reported several days earlier to get
a better understanding
SAP NETWEAVER 71 AND HIGHER PERFORMANCE CHECK GUIDE
31
If no AAE is used the starting point of a mapping is the Integration Engine that will send the request by RFC
destination AI_RUNTIME_JCOSERVER to the gateway There it will be picked up by a registered server
program The registered server program belongs to the J2EE Engine The request will be forwarded to the
J2EE Engine by a JCo call and then executed by the Java runtime When the mapping has been executed
the result is sent back to the ABAP pipeline There are therefore multiple places to check when trying to
determine why the mapping step took so long
Before analyzing the mapping runtime of the PI system check if only one interface is affected or if you face a
long mapping runtime for different interfaces To do so check the mapping runtime of messages being
processed at the same time in the system
The best tool for such an analysis is Wily Introscope which offers a dashboard for all mappings being
executed at a given time Each line in the dashboard represents one mapping and shows the average
response time and the number of invocations
In the screenshot below you can see that many different mapping steps have required around 500 seconds
for processing Comparing the data during the incident with the data from the day before will allow you to
judge if this might be a problem of the underlying J2EE engine as described in section J2EE Engine
Bottleneck
If there is only one mapping that faces performance problems there would be just one line sticking out in the
Wily graphs If you face a general problem that affects different interfaces you can choose a longer
timeframe that allows you to compare the processing times in a different time period and verify if it is only a
ldquotemporaryrdquo issue ndash this would for example indicate an overload of the mapping runtime
If you have found out that only one interface is affected then it is very unlikely to be a system problem but
rather a problem in the implementation of the mapping of that specific interface
SAP NETWEAVER 71 AND HIGHER PERFORMANCE CHECK GUIDE
32
Check the message size of the mapping in the runtime header using SXMB_MONI Verify if the message size is larger than usual (which would explain the longer runtime)
There can also be one or many lookups to a remote system (using RFC or JDBC) causing the long processing time of a mapping Together with the application you then have to check if the connection to the backend is working properly Such a mapping with lookups can be analyzed using Wily Transaction Trace as explained in the appendix section Wily Transaction Trace
If not one but several interfaces are affected a potential system bottleneck occurs and this is described in
the following
o Not enough resources (registered server programs) available That could either be the case if too many mapping requests are issued at the same time or if one J2EE server node is down and has not registered any server programs
To check if there were too many mapping requests for the available registered server programs compare the number of outbound queues that are concurrently active with the number of registered server programs The number of outbound queues that are concurrently active can be monitored with transaction SMQ2 and counting queues with the names XBTO amp XBQOXB2O XBTA and XBQAXB2A (high priority) XBTZ and XBQZXB2Z (low priority) and XBTM (large messages) In addition to this you have to take into account mapping steps that are executed by synchronous messages or in a ccBPM process Mappings executed by a ccBPM process are not queued but the ccBPM process calls the mapping program directly using tRFC The number of registered server programs can be determined with transaction SMGW Goto Logged On Clients and filtering by the program (ldquoTP Namerdquo) AI_RUNTIME_ltSIDgt In general we recommend configuring 20 parallel mapping connections per server node
If the problem occurred in the past it is more difficult to determine the number of queues that are concurrently active One way is to use transaction SXMB_MONI and specify every possible outbound queue (field ldquoQueue IDrdquo) in the advanced selection criteria (Note wildcard search not available) The timeframe can be restricted in the upper-part of the advanced selection criteria Advanced users could use transaction SE16 to search directly in table SXMSPMAST using the field ldquoQUEUEINTrdquo
The other option is to use the Wily ldquoqRFC Inbound Queue Detailrdquo dashboard as described in qRFC Queue Monitoring (SMQ2)
To check if the J2EE is not available or if the server program is not registered for a different reason use transaction SM59 to test the RFC destination AI_RUNTIME_JCOSERVER If the problem occurred in the past search the gateway trace (transaction SMGW GoTo Trace Gateway Display File) and the RFC developer traces dev_rfc files available in the work directory for the string ldquoAI_RUNTIMErdquo In addition check the std_serverltngtout in the work directory for restarts of the J2EE Engine
SAP NETWEAVER 71 AND HIGHER PERFORMANCE CHECK GUIDE
33
o Depending on the checks above there are two options to resolve the bottleneck Of course if the J2EE was not available the reason for this has to be found and prevented in the future
The two options for tuning are
1) the number of outbound queues that are concurrently active and
2) the number of mapping connections from the J2EE server to the ABAP gateway
The increase of mapping connections is only recommended for strong J2EE servers since each mapping thread needs resources like CPU and Heap memory Too many mapping connections mean too many mappings being executed on the J2EE Engine In turn this might reduce the performance of other parts of the PI system for example the pipeline processing in the Integration Engine or the processing within the adapters of the AFW or can even cause out-of-memory errors on the J2EE engine Add additional J2EE server nodes to balance the parallel requests Each J2EE server node will
register new destinations at the gateway and will therefore take a part of the mapping load
Another option is to reduce the number of outbound queues that are concurrently active to solve the bottleneck This will certainly result in higher backlogs in the queue and is therefore only applicable for less runtime critical interfaces This option can be used if the backlog is caused by a master data interface with high volume but no critical processing time requirements In such a case you can only lower the number of parallel queues for this interface by using a sub-parameter of EO_OUTBOUND_PARALLEL in transaction SXMB_ADM By doing so you slow down one interface to ensure other (more critical) interfaces have sufficient resources available
o If multiple application servers configured on the PI system ensure that all the server nodes are connected to their local gateway (local bundle option) as described in the guide How To Scale PI
443 Long Processing Times for ldquoPLSRV_CALL_ADAPTERrdquo
Call adapter is the last step executed in the PI pipeline and forwards the message to the next component
along the message flow In most cases (local Adapter Engine IDoc or BPE) this is a local call The IDoc
adapter only puts the message on the tRFC layer (SM58) of the PI system so that the actual transfer of the
IDoc is not included in the performance header For ABAP Proxies plain HTTP or calls to a central or
decentral Adapter Engine an HTTP call is made so that network time can have an influence here
Looking at the processing time we have to distinguish asynchronous (EO and EOIO) and synchronous (BE)
interfaces
In asynchronous interfaces the call adapter step includes the transfer of the message by the network and
the initial steps on the receiver side (in most cases this just means persisting the message on the receiverrsquos
database) A long duration can therefore have two reasons
o Network latency For large messages of several MB in particular the network latency is an important factor (especially if the receiving ABAP proxy system is located on another continent for example) Network latency has to be checked in case of a long call adapter step In case HTTP load balancers are used they are considered as part of the network
o Insufficient resources on receiver side Enough resources must be available at the receiver side to ensure quick processing of a message For instance enough ICM threads and dialog work processes must be available in the case of an ABAP proxy system Therefore the analysis of long call adapter steps always has to include the relevant backend system
For synchronous messages (requestresponse behavior) the call adapter step also includes the processing
time on the backend to generate the response message Therefore the call adapter for synchronous
messages includes the time of the transfer of the request message the calculation of the corresponding
response message at the receiver side and the transfer back to PI Therefore the processing time to
process a request at the receiving target system for synchronous messages must always be analyzed to find
the most costly processing steps
SAP NETWEAVER 71 AND HIGHER PERFORMANCE CHECK GUIDE
34
444 Long Processing Times for ldquoDB_ENTRY_QUEUEINGrdquo
The value for DB_ENTRY_QUEUEING describes the time that a message has spent waiting in a PI inbound
queue before processing started In case of errors the time also includes the wait time for restart of the LUW
in the queue The inbound queues (XBTI XBT1 XBT9 XBTL for EO messages and XBQIXB2I
XBQ1XB21 XBQ9XB29 for EOIO messages) process the pipeline steps for the Receiver
Determination the Interface Determination and the Message Split (and optionally XML inbound validation)
Thus if the step DB_ENTRY_QUEUEING has a high value the inbound queues have to be monitored using
transactions SMQ2 and SARFC The reasons are similar as those outlined in chapter qRFC Resources
(SARFC) and qRFC Queues (SMQ2)
o Not enough resources (DIA work processes for RFC communication) available
o A backlog in the queues caused by one of the following reasons
The number of parallel inbound queues is too low to handle the incoming messages in parallel Note that a simple increase of the parameter EO_INBOUND_PARALLEL might not always be the solution (as enough work processes also have to be available to process the queues in parallel) The number of work processes is in turn restricted by the number of CPUs that are available for your system If you would like to separate critical from non-critical sender systems define a dedicated set of inbound queues by specifying a sender ID as a sub parameter of EO_INBOUND_PARALLEL For example by doing so you can separate master data interfaces from business critical interfaces Please note that the separation on inbound queues only works on Business System level and not on interface level
The inbound queues were blocked by the first LUW Use transaction SMQ2 to check if that is still the case To identify if such a situation occurred in the past use the Wily Introscope dashboard ldquoABAP System qRFC Inbound Detailldquo It is generally not easy to find the one message that is blocking the queue It might be achieved by checking RFC traces or by searching for a single message with a long pipeline processing step For EO queues there is no business reason to block the queues in case of a single message error To prevent this follow the description in section Prevent blocking of EO queues
In case you have a different runtime of the messages in the queues (eg due to complex extended Receiver Determinations) the number of messages per queue might be uneven distributed between the queues In PI 73 a new balancing option is available as discussed in Avoid uneven backlogs with queue balancing
Problems when loading the LUW by the QIN scheduler as described in qRFC Queues (SMQ2)
Note If your system uses the parameter EO_INBOUND_TO_OUTBOUND = 0 you must also read chapter
445 for analyzing the reasons EO_INBOUND_TO_OUTBOUND only determines whether inbound queues
(value lsquo0rsquo) or inbound and outbound queues (value lsquo1rsquo) are used for the pipeline processing in the integration
server Check the value with transaction SXMB_ADM Integration Engine Configuration Specific
Configuration The default value is lsquo1rsquo meaning the usage of inbound and outbound queues (the
recommended behavior)
445 Long Processing Times for ldquoDB_SPLITTER_QUEUEINGrdquo
The value for DB_SPLITTER_QUEUEING describes the time that a message has spent waiting in a PI
outbound queue until a work process was assigned In case of errors the time also includes the wait time for
the restart of the LUW in the queue
The outbound queues (XBTO XBTA XBTZ XBTM for EO messages and XBQOXB2O
XBQAXB2A XBQZXB2Z for EOIO messages) process the pipeline steps for the mapping outbound
binding and call adapter
SAP NETWEAVER 71 AND HIGHER PERFORMANCE CHECK GUIDE
35
Thus if the step DB_SPLITTER_QUEUEING has a high value the outbound queues have to be monitored
using transactions SMQ2 and SARFC The reasons are similar as outlined in chapters qRFC Resources
(SARFC) and qRFC Queues (SMQ2) or described in the section above for PI inbound queues
o Not enough resources (DIA work processes for RFC communication) available
o A backlog in the queues caused by one of the following reasons
The number of parallel outbound queues is too low to handle the outgoing messages in parallel Note that simply increasing the parameter EO_OUTBOUND_ PARALLEL might not always be the solution as enough work processes have to be available to process the queues in parallel The number of work processes in turn is limited by the number of CPUs available for the system Also the parameter EO_OUTBOUND_PARALLEL is used differently than the parameter EO_INBOUND_ PARALLEL because it determines the degree of parallelism for each receiver system Thus it is possible to increase the number of parallel outbound queues for specific receivers whereas other receivers are handled with a lower degree of parallelism Note that not every receiver backend is able to handle a high degree of parallelism so that in case of an ABAP Proxy system it might not indicate a problem on PI in case you observe a high value for DB_SPLITTER_QUEUING
The outbound queues were blocked by the first LUW To identify if such a situation occurred in the past use the Wily Introscope dashboard ldquoABAP System qRFC Inbound Detailldquo In general it is not easy to find the one message that is blocking the queue It might be achieved by checking RFC traces or by searching for a single message with a long pipeline processing step For EO queues there is no business reason to block the queues in case of a single message error To prevent this follow the description in section Prevent blocking of EO queues
Since the outbound queues include a processing step that is bound to take longer than the other steps (that is the mapping and the call adapter step) this might mean a long waiting time for all subsequent messages As an example assume that a mapping takes 1 second and that 100 messages are waiting in a queue The first message gets executed at once the second message has to wait about 1 second (a bit more since more steps are executed than just the mapping but this should be ignored at the moment) the third takes 3 seconds and so on The 100
th message
has to wait 100 seconds until it is processed that is the value for DB_SPLITTER_QUEUING is as high as 100 For a given outbound queue you would therefore see an increase for the DB_SPLITTER_QUEUING value over time If you experience this situation proceed with Chapter 442
In case you have a different runtime of the messages in the queues (eg due to different message size) the number of messages per queue might be uneven distributed between the queues In PI 73 a new balancing option is available as discussed in Avoid uneven backlogs with queue balancing
o Problems when loading the LUW by the QIN scheduler as described in qRFC Queues (SMQ2)
Note The number of parallel outbound queues is also connected with the ability of the receiving system to
process a specific amount of messages for each time unit
In section Adapter Parallelism default restrictions of the specific adapters of the J2EE Engine are explained Some adapters (JDBC File Mail) can process only one message for each server node at a time (this can be changed) It does not make sense for such adapters to have too many parallel qRFC queues since this will only move the message backlog from ABAP to Java
For messages that are directed to the IDoc outbound adapter the value for EO_OUTBOUND_PARALLEL is connected to the MAXCONN value of the corresponding outbound destination You can define the maximum number of connections using transaction SMQS ndash the default value is 10 parallel connections If applicable SAP highly recommends that you use IDoc packaging in the outbound IDoc adapter to reduce the load during the transmission of tRFC calls from the PI system to the receiving system
For ABAP proxy systems the number of outbound queues directly determines the number of messages sent in parallel to the receiving system Thus you have to ensure that the resources
SAP NETWEAVER 71 AND HIGHER PERFORMANCE CHECK GUIDE
36
available on PI are aligned with those on the sendingreceiving ABAP proxy system
446 Long Processing Times for ldquoLMS_EXTRACTIONrdquo
Lean Message Search can be configured for newer PI releases as described in the Online Help After
applying Note 1761133 - PI runtime Enhancement of performance measurement an additional header for
LMS will be written to the performance header
The header could look like this indicating that around 25 seconds were spent in the LMS analysis
When using trace level two additional timestamps are written to provide details about this overall runtime
LMS_EXTRACTION_GET_VALUES
This timestamp describes the evaluation of the message according to user-defined filter criteria
LMS_EXTRACTION_ADJUST_VALUES
This timestamp describes the post-processing of the previously found values in the BAdI (as of PI 730)
The runtime of the LMS heavily depends on the number of payload attributes to be extracted Also the
payload size and the complexity of the XPath expression has a direct impact on the performance of the LMS
In general the number of elements to be indexed should be kept at a minimum and very deep and complex
XPath expressions should be avoided
If you want to minimize the impact of LMS on the PI message processing time you can define the extraction
method to use an external job In that case the messages will be indexed after processing only and it will
therefore have no performance impact during runtime Of course this method imposes a delay in the
indexing (based on the frequency of job SXMS_EXTRACT_MESSAGES) so that newly processed
messages cannot be searched using LMS If this delay is acceptable for the monitoring responsible the
messages should be indexed using an external job
447 Other step performed in the ABAP pipeline
As discussed earlier there are additional steps in the ABAP pipeline that can be executed based on the
configuration of your scenario Per default these steps will not be activated and should therefore not
consume any time All these steps are traced in the performance header of the message Below you can see
the details for
- XML validation
SAP NETWEAVER 71 AND HIGHER PERFORMANCE CHECK GUIDE
37
- Virus Scan
In case one of these steps is taking long you have to check the configuration of your scenario In the
example of the Virus scan the problem might be related to the external virus scanner used and tuning has to
happen on that side
45 PI Message Packaging for Integration Engine
PI message packaging was introduced with SAP NetWeaver PI 70 SP13 and is per default activated in PI
71 and higher Message packaging in BPE is independent of message packaging in PI (see chapter 56)
but they can be used together
To improve performance and message throughput asynchronous messages can be assembled to packages
and processed as one entity For this the qRFC scheduler was enabled to process a set of messages (a
package) in one LUW Thus instead of sending one message to the different pipeline steps (for example
mappingrouting) a package of messages will be sent that will reduce the number of context switches that is
required Furthermore access to databases is more efficient since requests can be bundled in one database
operation Depending on the number and size of messages in the queue this procedure improves
performance considerably In return message packaging can increase the runtime for individual messages
(latency) due to the delay in the packaging process
Message packaging is only applicable for asynchronous scenarios (QoS EO and EOIO) Due to the potential
latency of individual messages packaging is not suitable for interfaces with very high runtime requirements
In general packaging has the highest benefit for interfaces with high volume and small message size
The performance improvement achieved directly relates to the number of the messages bundled in each
package Message packaging must not solely be used in the PI system Tests have shown that the
performance improvement significantly increases if message packaging is configured end-to-end - that is
from the sending system using PI to the receiving system Message packaging is mainly applicable for
application systems connected to PI by ABAP proxy
From the runtime perspective no major changes are introduced when activating packaging Messages
remain individual entities in regards to persistence and monitoring Additional transactions are introduced
allowing the monitoring of the packaging process
Messages are also treated individually for error handling If an error occurs in a message processed in a
package then the package will be disassembled and all messages will be processed as single messages Of
course in a case where many errors occur (for example due to interface design) this will reduce the benefits
of message packaging SAP systems connected to PI via ABAP Proxy can also make use of the message
packaging to reduce the HTTP calls necessary to transmit messages between the systems Other sending
and receiving applications in particular will not see any changes because they send and receive individual
messages and receive individual commits
The PI message packaging can be adapted to meet your specific needs In general the packaging is
determined by three parameters
SAP NETWEAVER 71 AND HIGHER PERFORMANCE CHECK GUIDE
38
1) Message count Maximum number of messages in a package (default 100)
2) Maximum package size Sum of all messages in kilobytes (default 1 MB)
3) Delay time Time to wait before the queue is processed if the number of messages does not reach
the message count (default 0 meaning no waiting time)
These values can be adjusted using transactions SXMS_BCONF and SXMS_BCM To better use the
performance improvements offered by packaging you could for example define a specific packaging for
interfaces with very small messages to allow up to 1000 messages for each package Another option could
be to increase the waiting time (only if latency is not critical) to create bigger packages
See SAP Note 1037176 - XI Runtime Message Packaging for more details about the necessary
prerequisites and configuration of message packaging More information is also available at
httphelpsapcom SAP NetWeaver SAP NetWeaver PIMobileIdM 71 SAP NetWeaver Process
Integration 71 Including Enhancement Package 1 SAP NetWeaver Process Integration Library
Function-Oriented View Process Integration Integration Engine Message Packaging
46 Prevent blocking of EO queues
In general messages for interfaces using Quality of Service Exactly Once are independent of each other In
case of an error in one message there is no business reason to stop the processing of other messages But
exactly this happens in case an EO queue goes into error due to an error in the processing of a single
message The queue will then be automatically retried in configurable intervals This retry will cause a delay
of all other messages in the queue which cannot be processed due to the error of the first message in the
queue
To avoid this a new error handling was introduced in SAP Notes 1298448 - XI runtime No automatic retry
for EO message processing (set EO_RETRY_AUTOMATIC = 0 and schedule restart job
RSXMB_RESTART_MESSAGES) and SAP Note 1393039 - XI runtime Dump stops XI queue After
applying this Note EO queues will not go in SYSFAIL status any longer These Notes are recommended for
all PI systems and are per default activated on PI 73 systems By specifying a receiver ID as sub parameter
this behavior can be configured for individual interfaces only
In PI 73 you can also configure the number of messages that would go into error before the whole queue
would be stopped For permanent errors (eg due to a problem with the receiving backend) the queue would
go into SYSFAIL so that not too many messages are going into error This also reduces the number of alerts
for Message Based Alerting To define the threshold the parameter EO_RETRY_AUT_COUNT can be set
The default value is 0 and indicates that the number of messages is not restricted
47 Avoid uneven backlogs with queue balancing
From PI 73 on a new mechanism is available to address the distribution of messages in queues Per default
in all PI versions the messages are getting assigned to the different queues randomly In case of different
runtimes of LUWs caused by eg different message sizes or different runtimes in mappings this can cause
an uneven distribution of messages within the different queues This can increase the latency of the
messages waiting at the end of that queue
To avoid such an unequal distribution the system checks the queue length before putting a new message in
the queue Hence it tries to achieve an equal balancing during inbound processing A queue which has a
higher backlog will get less new messages assigned Queues with fewer entries will get more messages
assigned Therefore it is different than the old BALANCING parameter of category TUNING) which was used
SAP NETWEAVER 71 AND HIGHER PERFORMANCE CHECK GUIDE
39
to rebalance messages already assigned to a queue The assignment of messages to queues is shown in
the diagram below
To activate the new queue balancing you have to set the parameters EO_QUEUE_BALANCING_READ and
EO_QUEUE_BALANCING_SELECT of category TUNING in SXMB_ADM If the value of the parameter
EO_QUEUE_BALANCING_READ is 0 (default value) then the messages are distributed randomly across
the queues that are available If however EO_QUEUE_BALANCING_READ is set to a value n greater than
zero then on average the current fill level of the queue is determined after every nth message and stored in
the shared memory of the application server This data is used as the basis for determining the queue (see
description of parameter EO_QUEUE_BALANCING_SELECT) relevant for balancing
The parameter EO_QUEUE_BALANCING_SELECT specifies the relative fill levels of the queues in percent
Relative here means in relation to the maximum filled queue If there are queues with a lower fill level than
defined here then only these are taken into consideration for distribution If all queues have a higher fill level
then all queues are taken into consideration
Please note that determining the fill level takes place using database access and therefore impacts system
performance The value of EO_QUEUE_BALANCING_READ should for this reason be oriented towards the
message throughput and specific requirements or even distribution For higher volume system a higher value
should be chosen
Letrsquos look at an example In case you set the parameter EO_QUEUE_BALANCING_READ to 1000 after
every 1000th incoming message the queue distribution will be checked This requires a database access
and can therefore cause a performance impact The fill level for each queue will then be written to shared
memory In our example we configured EO_QUEUE_BALANCING_SELECT to 20 At a given point in time
you have three outbound queues on the system XBTO__A contains 500 entries XBTO__B 150 and
XBTO__C contains 50 messages Therefore XBTO__B has a fill level of 30 and XBTO__C of 10 That
means the only queue relevant for balancing is XBTO__C which will get more messages assigned
Based on this example you can see that it is important to find the correct values As a general guideline to
minimize performance impact you should set EO_QUEUE_BALANCING_READ to a rather large value The
correct value of EO_QUEUE_BALANCING_SELECT depends on the criticality of a delay caused by a
backlog
SAP NETWEAVER 71 AND HIGHER PERFORMANCE CHECK GUIDE
40
48 Reduce the number of parallel EOIO queues
As discussed in Chapter Parallelization of PI qRFC Queues it is important to keep the number of queues
limited As a rule of thumb the number of active queues should be equal to the number of available work
processes in the system It is especially crucial to not have a lot of queues containing only one message
since this will cause a high overhead on the QIN scheduler due to very frequent reloading of the queues
Especially for EOIO queues we often see a high number of parallel queues containing only one message
The reason for this is for example that the serialization has to be done on document number to eg ensure
that updates to the same material are not transferred out of sequence Typically during a batch triggered
load of master data this can result in hundreds of EOIO queues in SMQ2 just containing only one or two
messages This is very bad from a performance point of view and will cause significant performance
degradation for all other interfaces running at the same time To overcome this situation the overall number
of EOIO queues (for all interfaces) can be limited as of PI 71 as described in Change Number of EOIO
Queues
The maximum number of queues can be set in SXMB_ADM Configure Filter for Queue Prioritization
Number of EOIO queues
During runtime a new set of queues will be used with the name XB2 as can be seen below for the outbound
queues
These queues will be shared between all EOIO interfaces for the given interface priority and by setting the
number of queues the parallelization for all EOIO interfaces is limited Thus more messages will be using the
same EOIO queue and therefore PI message packaging will work better and also the reloading of the
queues by the QIN scheduler will show much better performance
In case of errors the messages will be removed from the XB2 queues and will be moved to the standard
XBQ queues All other messages for the same serialization context will be moved to the XBQ queue
directly to ensure the serialization is maintained This means that in case of an error the shared EOIO
queues will not be blocked and messages for other serialization contexts will be not delayed
SAP NETWEAVER 71 AND HIGHER PERFORMANCE CHECK GUIDE
41
49 Tuning the ABAP IDoc Adapter
Very often the IDoc adapter deals with very high message volume and tuning of this is very essential
491 ABAP basis tuning
As stated above the IDoc adapter uses the tRFC layer to transfer messages from PI to the receiver system
The IDoc adapter will only put the message in SM58 and from there the standard tRFC layer forwards the
LUW You therefore have to ensure that sufficient resources (mainly DIA WPs) are available for processing
tRFC requests
Wily Introscope also offers a dashboard (shown below) for the tRFC layer which shows the tRFC entries and
their different statuses With these dashboards you are also able to identify history backlogs on tRFC
In order to control the resources used when sending the IDocs from sender system to PI or from PI to the
receiver backend you can also think about registering the RFC destinations in SMQS in PI as known from
standard ALE tuning By changing the Max Conn or the Max Runtime values in SMQS you can limit or
increase the number of DIA WPs used by the tRFC layer to send the IDocs for a given destination This will
mitigate the risk of system overload on sender and receiver side
SAP NETWEAVER 71 AND HIGHER PERFORMANCE CHECK GUIDE
42
492 Packaging on sender and receiver side
One option for improving the performance of messages processed with the IDoc adapter is to use IDoc
packaging
The receiver IDoc adapter in PI (for sending messages from PI to the receiving application system) already
had the option for packaging IDocs in previous releases For this messages processed in the IDoc adapter
are bundled together before being sent out to the receiving system Thus only one tRFC call is required to
send multiple IDocs The message packaging that is being discussed in section PI Message Packaging uses
a similar approach and therefore replaces the ldquooldrdquo packaging of IDocs in the receiver IDoc adapter
Therefore we highly recommend configuring Message Packaging since this helps transferring data for the
IDoc adapter as well as the ABAP Proxy
For the sender IDoc adapter there was previously the option to activate packaging in the partner profile of
the sending system in case IDocs are not send immediately but in batch By specifying the ldquoMaximum
Number of IDocsrdquo in the report RSEOUT00 multiple IDocs are bundled in one tRFC calls At the PI side
these packages will be disassembled by the IDoc adapter and the messages will be processed individually
Therefore this will help mainly to reduce the tRFC resources involved in transferring the data between the
systems but not within PI
This behavior was changed with SAP NetWeaver PI 711 and higher If the sender backend sends an IDoc
package to PI a new option has been introduced which allows the processing of IDocs as a package on PI
as well You can specify an IDoc package size on the sender IDoc Communication Channel The necessary
configuration is described in detail in the following SDN blog - IDoc Package Processing Using Sender IDoc
Adapter in PI EhP1 A significant increase in throughput was recorded for high volume interfaces with small
IDocs
493 Configuration of IDoc posting on receiver side
As described in SAP Note 1828282 - IDoc adapter long runtime XI -gt IDoc-gt ALE also the way the IDocs
are posted on the receiver ERP backend will directly influence the processing of the LUW on the PI side In
general two options exist for IDoc posting
Trigger immediately The IDoc will be posted directly when it is received For this a free dialog workprocess will be required
Trigger by background program If this option is chosen the IDoc is persisted on the ERP side and the posting of the application data will happen asynchronously using report RBDAPP01 via a background job
SAP NETWEAVER 71 AND HIGHER PERFORMANCE CHECK GUIDE
43
When ldquotrigger immediatelyrdquo is configured the sender system (PI) has to wait till the IDoc is posted While the
workprocess will roll out you will see the LUW in ldquoTransaction Executingrdquo during this time For the
IDOC_AAE the RFC connection and the java threads will be kept busy until the IDOC is posted in the
backend therefore leading to backlogs on the IDOC_AAE
The coding for posting the application data can be very complex and therefore this operation can take a long
time consuming unnecessary resources also on the sender side With background processing of the IDocs
the sender and receiver systems are decoupled from each other
Due to this we generally recommend to use ldquotrigger immediatelyrdquo in exceptional cases where the data has to
be posted without any delay In all other cases like high volume replication of master data background
processing of IDocs should be chosen
With Note 1793313 and 1855518 a third option for posting IDocs on the ERP side was introduced This
option is using bgRFC on the ERP side to queue the IDocs As soon as the configured resources for the
bgRFC destination are available the IDocs will be posted By doing so the IDocs will be posted based on
resource availability on the receiver system and no additional background jobs will be required Furthermore
storing the LUWs in bgRFC will ensure that the sender and receiver systems are decoupled This option
therefore guarantees that the IDocs will be posted as soon as possible based on the available resources on
the receiver system without the requirement to schedule many background jobs This new option is therefore
the recommended way of IDoc posting in systems that fulfill the necessary requirements
SAP NETWEAVER 71 AND HIGHER PERFORMANCE CHECK GUIDE
44
410 Message Prioritization on the ABAP Stack
A performance problem is often caused by an overload of the system for example due to a high volume
master interface If business critical interfaces with a maximum response time are running at the same time
then they might face delays due to a lack of resources Furthermore as described in qRFC Queues (SMQ2)
messages of different interfaces use the same inbound queue by default which means that critical and less-
critical messages are mixed up in the same queue
We highly recommend using message prioritization on the ABAP stack to prevent such delays for critical
interfaces (for Java see Interface Prioritization in the Messaging System )
For more information about PI prioritization see httphelpsapcom and navigate to SAP NetWeaver SAP
NetWeaver PIMobileIdM 71 SAP NetWeaver Process Integration 71 Including Enhancement Package 1
SAP NetWeaver Process Integration Library Function-Oriented View Process Integration
Integration Engine Prioritized Message Processing
To balance the available resources further between the configured interfaces you can also configure a
different parallelization level for queues with different priorities Details for this can be found in SAP Note
1333028 ndash Different Parallelization for HP Queues
SAP NETWEAVER 71 AND HIGHER PERFORMANCE CHECK GUIDE
45
5 ANALYZING THE BUSINESS PROCESS ENGINE (BPE)
This chapter helps to analyze performance problems if Chapter Determining the Bottleneck has shown that
the BPE is the slowest step for a message during its time in the PI system Of course this type of runtime
engine is very susceptible to inefficient design of the implemented integration process Information about
best practices for designing BPE processes can be found in the documentation Making Correct Use of
Integration Processes In general the memory and resource consumption is higher than for a simple pipeline
processing in the Integration Engine As outlined in the document linked above every message that is sent
to BPE and every message that is sent from BPE is duplicated In addition work items are created for the
integration process itself as well as for every step More database space is therefore required than
previously expected and more CPU time is needed for the additional steps
51 Work Process Overview
The Business Process Engine executes the steps (work items) of an integration process using tRFC calls to
the RFC destination WORKFLOW_LOCAL_ltclientgt To check if there are enough resources available to
process the work items call transaction SM50 (on each application server) while one of the integration
processes is running
o Look for the user ldquoWF-BATCHrdquo and follow its activities by refreshing the transaction
o Are there always dialog work processes available
The most important point to keep in mind here is the concurrent activity of the Business Process Engine (for
ccBPM processes) and the Integration Engine (for pipeline processing) Both runtime environments need
dialog work processes Thus performance problems in one of the engines cannot be solved by restricting
the other Rather an appropriate balance between the two runtimes has to be found
The activity of the WF-BATCH user is not restricted by default It is highly recommended that you register the
RFC destination WORKFLOW_LOCAL_ltclientgt with transaction SMQS and assign a suitable amount of
maximum connections Otherwise ccBPM activity may block the pipeline processing of the Integration
Server and reduce the throughput of PI drastically SAP Note 888279 - Regulatingdistributing the Workflow
Load gives more details
In addition it might help to use specific servers (dialog instances) to carry out a given workflow or to use load
balancing Of course both options only apply for larger PI systems that consist of at least a central instance
and one dialog instance
52 Duration of Integration Process Steps
As described in section Processing Time in the Business Process Engine with PI 73 there is a new monitor
available in ldquoConfiguration and Monitoring Homerdquo on PI start page It shows the duration of individual steps
of an integration process in a very easy way and is the now tool to analyze performance related issues on
the ccBPM
SAP NETWEAVER 71 AND HIGHER PERFORMANCE CHECK GUIDE
46
For releases prior than PI 73 check in the workflow log for long-running steps as described in the previous
chapter Use the ldquoList with Technical Detailsrdquo to do so Since the design of integration processes varies
significantly there is no general rule for the duration of a step or for specific sequences of steps Instead
you have to get a feeling for your implemented integration processes
Did a specific process step decrease in performance over a period of time
Does one specific process step stick out with regard to the other steps of the same integration process
Do you observe long durations for a transformation step (ldquomappingrdquo)
Do you observe long durations of synchronous sendreceive steps in the integration process which correlates for example to a slow response from a connected remote system
Use the SAP Notes database to learn about recommendations and hints SAP Note 857530 - BPE
Composite Note Regarding Performance acts as a central note for all performance notes and might be used
as the entry point
Once you are able to answer the above questions there are several paths to follow
o Two common reasons should be taken into consideration for a performance decrease over time Firstly the load on PI might have increased over time as well Check the hardware resources (chapter 9) and carefully monitor the work process availability (chapter 51) Alternatively the underlying databases might slow down the integration processes Use chapter 54 to check this possibility
o If it is a specific process step that sticks out the process design itself has to be reviewed The SAP Notes mentioned above might help here
o If the mapping step takes a long time it is worth having a look at chapter 442 since the BPE and the IE use the same resources (mapping connections from the ABAP gateway to the J2EE server) to execute their mapping
o If there is a long processing time for a synchronous sendreceive step check the connected backend system for any performance issues
SAP NETWEAVER 71 AND HIGHER PERFORMANCE CHECK GUIDE
47
53 Advanced Analysis Load Created by the Business Process Engine (ST03N)
Since the Business Process Engine runs on the ABAP part of the PI Integration Server you can use the
statistical data written by the dialog work processes to analyze a performance problem
Procedure
Log in to your Integration Server and call transaction ST03N Switch to ldquoExpert Moderdquo and choose the
appropriate timeframe (this could be the ldquoLast Minutersquos Loadrdquo from the Detailed Analysis menu or a specific
day or week from the Workload menu) In the Analysis View navigate to User and Settlement Statistics and
then to User Profile The user you are interested in is the WF-BATCH user who does all ccBPM-related work
Compare the total CPU Time (in seconds) to the time frame (in seconds) of the analysis In the above example an analysis time frame of 1 hour has been chosen which corresponds to 3600 seconds To be exact these 3600 seconds have to be multiplied by the number of available CPUs Out of these 3600CPU seconds the WF-BATCH user used up 36 seconds
o The above value gives you a good idea of how much load the Business Process Engine creates on your PI Integration Server By comparison with the other users (as well as the CPU utilization from transaction ST06) you can determine if the Integration Server is able to handle this load with the available number of CPUs or not This does not help you to optimize the load but it does provide support when deciding how to distribute the workload of the BPE and the workload of the Integration Server (see Chapter 51)
Experienced ABAP administrators should also analyze the database time wait time and compare these values
54 Database Reorganization
The database is accessed many times during the processing of an Integration Process This is not usually
connected with performance problems but if a specific database table is large then statements may take
longer than for small database tables
Use transaction ST05 to collect a SQL trace while the integration process in question is being executed Restrict the trace to user WF-BATCH When the integration process is finished stop the trace and view it Look for high values in the duration column especially for SELECT statements
Use transaction SE16 to determine the number of entries for the typical workflow tables SWW_WI2OBJ and SWFRXI There are many more database tables used by BPE but if the number of entries is high for the above tables they are high for the rest as well See SAP Note 872388 - Troubleshooting Archiving and Deletion in XI and the links given in this note if you find high amounts of entries
SAP NETWEAVER 71 AND HIGHER PERFORMANCE CHECK GUIDE
48
55 Queuing and ccBPM (or increasing Parallelism for ccBPM Processes)
Until recently ccBPM processes accepted messages from only one queue (one queue XBQO$PEWS for
each workflow) If there was a high message throughput for this workflow then a high backlog occurred for
these queues A couple of enhancements have therefore been implemented to improve scalability if the
ccBPM runtime
o Inbound processing without buffering
o Use of one configurable queue that can be prioritized or assigned to a dedicated server
o Use of multiple inbound queues (queue name will be XBPE_WS)
o Configure transactional behavior of ccBPM process steps to reduce number of persistency steps
Details about the configuration and tuning of the ccBPM runtime are described at
httpswwwsdnsapcomirjsdnhowtoguides SAP Netweaver 70 End-to-End Process Integration
o How to Configure Inbound Processing in ccBPM Part I Delivery Mode
o How to Configure Inbound Processing in ccBPM Part II Queue Assignment
o How to Configure ccBPM Runtime Part III Transactional Behavior of an Integration Process
Procedure
Use transaction SMQ2 to check if the queues of type XBQO$PE show a high backlog
o Based on this information verify if the ccBPM process is suitable to run with multiple queues This is especially the case for collect patterns realized in BPE If you can use multiple queues configure the workflow based on the above guides
56 Message Packaging in BPE
Inbound processing takes up the most amount of processing time in many scenarios within BPE
Message packaging in BPE helps to improve performance by delivering multiple messages to BPE process
instances in one transaction This can lead to an increased throughput which means that the number of
messages that can be processed in a specific amount of time can increase significantly Message packaging
can also increase the runtime for individual messages (latency) due to the delay in the packaging process
The sending of packages can be triggered when the packages exceed a certain number of messages a
specific package size (in kB) or a maximum waiting time The extent of the performance improvement that
can be obtained depends on the type of scenario Scenarios with the following prerequisites are generally
most suitable
o Many messages are received for each process instance
o Messages that are sent to a process instance arrive together in a short period of time
o Generally high load on the process type
o Messages do not have to be delivered immediately
For example collect scenarios are particularly suitable for message packaging The higher the number of
messages is in a package the higher the potential performance improvements will be
Tests that have been performed have shown a high potential for throughput improvements up to factor 47 in
tested Collect Scenarios depending on the packaging size that has been configured For more details about
the functionality of Message Packaging in BPE and its configuration see SAP Note 1058623 - BPE
Message Packaging
SAP NETWEAVER 71 AND HIGHER PERFORMANCE CHECK GUIDE
49
Message packaging in BPE is independent of message packaging in PI (see Chapter 45) but they can be
used together
SAP NETWEAVER 71 AND HIGHER PERFORMANCE CHECK GUIDE
50
6 ANALYZING THE (ADVANCED) ADAPTER ENGINE
This chapter describes further checks and possible reasons for bottlenecks in the (Advanced) Adapter
Engine Although this is not the place to describe the architecture of the Adapter Framework in detail the
following aspects are important to know for the analysis of a performance problem on the AFW
o The AFW contains the Messaging System that is responsible for the persistence and queuing of messages Within the flow of a message it is placed in between the sender adapter (for example a file adapter that polls from a folder) and the Integration Server as well as between the Integration Server and the receiver adapter (for example a JMS adapter that sends a message out to an external system)
o The Messaging System uses 4 queues for each adapter type and these are responsible for receiving and sending messages To separate the message transfer each adapter (for example JMS SOAP JDBC and so on) has its own set of queues One queue for receiving synchronous messages (Request queue) one queue for sending synchronous messages (Call queue) one queue for receiving asynchronous messages (Receive queue) and one queue for sending asynchronous messages (Send queue) The name of the queue always states the adapter type and the queue name (for example JMS_httpsapcomxiXISystemReceive for the JMS receiver asynchronous queues)
o A configurable number of consumer threads are assigned on each queue These threads work on the queue in parallel meaning that the Messaging Queues are not strictly FirstIn-FirstOut Five threads are assigned by default to each queue and thus five messages can be processed in parallel But as will be discussed later the parallel execution of requests to the backend depends heavily on the adapter being used since not every adapter can work in parallel by default
o SAP NetWeaver PI 71 introduced a new queue The dispatcher queue The dispatcher queue is used to realize prioritization on the AAE (see chapter Prioritization in the Messaging System) Every message in the PI system is first assigned to the dispatcher queue before it is assigned to the adapter-specific queues
Viewed from the perspective of a message that enters the PI system using a J2EE Engine adapter (for
example File) and leaves the PI system using a J2EE Engine adapter (for example JDBC) asynchronously
the steps are as follows
1) Enter the sender adapter
2) Put into the dispatcher queue of the messaging system
3) Forwarded to the File send queue of the messaging system (based on Interface priority)
4) Retrieved from the send queue by a consumer thread
5) Sent from the messaging system to the pipeline of the ABAP Integration Engine (if no Integrated Configuration (AAE) is used
6) Processed by the pipeline steps of the Integration Engine
7) Sent to the messaging system by the Integration Engine
8) Put into the dispatcher queue of the messaging system
9) Forwarded to the JDBC receive queue of the messaging system (based on Interface priority)
10) Retrieved from the receive queue (based on the maxReceivers)
11) Sent to the receiver adapter
12) Sent to the final receiver
SAP NETWEAVER 71 AND HIGHER PERFORMANCE CHECK GUIDE
51
All the analysis is based on the information provided in the Audit Log With SAP NetWeaver PI 71 the audit
log is not persisted for successful messages in the database by default to avoid performance overhead
Therefore the audit log is only available in the cache for a limited period of time (based on the overall
message volume) More details can be found in chapter Persistence of Audit Log information in PI 710 and
higher
As described in chapter Adapter Engine Performance monitor in PI 731 and higher a new performance
monitor is available from PI 731 SP4 With this monitor you can display the processing time per interface in
a given interval and identify the processing steps in which a lot of time is spend
With 731 SP10 and 74 SP5 a download functionality for the performance monitor is provided as described
in SAP Note 1886761
61 Adapter Performance Problem
Compared to a bottleneck in the Messaging System it is relatively easy to detect a performance
problembottleneck in the adapter Since the timestamps for inbound and outbound messages are written at
different points in time the procedure is described separately for sender and receiver adapters
Note It is not generally possible for all sender and receiver adapters to work in parallel (discussed in section
Adapter Parallelism)
611 Adapter Parallelism
As mentioned before not all adapters are able to handle requests in parallel Thus increasing the number of
threads working on a queue in the messaging system will not solve a performance problembottleneck
There are 3 strategies to work around these restrictions
1) Create additional communication channels with a different name and adjust the respective senderreceiver agreements to use them in parallel
2) Add a second server node that will automatically have the same adapters and communication channel running as the first server node This does not work for polling sender adapters (File JDBC or Mail) since the adapter framework scheduler assigns only one server node to a polling communication channel
3) Install and use a non-central Adapter Framework for performance-critical interfaces to achieve better separation of interfaces
SAP NETWEAVER 71 AND HIGHER PERFORMANCE CHECK GUIDE
52
Some of the most frequently-used adapters and the possible options are discussed below
o Polling Adapters (JDBC Mail File)
At the sender side these adapters use an Adapter Framework Scheduler which assigns a server node that does the polling at the specified interval Thus only one server node in the J2EE cluster does the polling and no parallelization can be achieved Therefore scaling via additional server node is not possible More details will be presented in section Adapter Framework Scheduler For example since the channels are doing the same SELECT statement on the database or pick up files with the same file name parallel processing will only result in locking problems To increase the throughput for such interfaces the polling interval has to be reduced to avoid a big backlog of data that is to be polled If the volume is still too high you should think about creating a second interface for example the new interface would poll the data from a different directory or database table to avoid locking
At the receiver side the adapters work sequentially on each server node by default For example only one UPDATE statement can be executed for JDBC for each Communication Channel (independent of the number of consumer threads configured in the Messaging System) and all the other messages for the same Communication Channel will wait until the first one is finished This is done to avoid blocking situations on the remote database On the other hand this can cause blocking situations for whole adapters as discussed in section Avoid Blocking Caused by Single SlowHanging Receiver Interface
To allow better throughput for these adapters you can configure the degree of parallelism at the receiver side In the Processing tab of the Communication Channel in the field ldquoMaximum Concurrencyrdquo enter the number of messages to be processed in parallel by the receiver channel For example if you enter the value 2 then two messages are processed in parallel on one J2EE server node The parallel execution of these statements at database level of course depends on the nature of the statements and the isolation level defined on the database If all statements update the same database record database locking will occur and no parallelization can be achieved
o JMS Adapter
The JMS adapter is per default using a push mechanism on the PI sender side This means the data is pushed by the sending MQ provider Per default every Communication channel has one JMS connection established per J2EE server node On each connection it processes one message after the other so that the processing is sequential Since there is one connection per server node scaling via additional server nodes is an option
With Note 1502046 - JMS Adapter message pull mechanism the JMS protocol can be changed to use a pull mechanism By doing so you can specify a polling interval in the PI Communication Channel and PI will be the initiator of the communication Also here the Adapter Framework Scheduler is used which implies sequential processing But in contrary to JDBC or File sender channels the JMS polling sender channel will allow parallel processing on all server nodes of the J2EE cluster Therefore scaling via additional J2EE server nodes is an option
The JMS receiver side supports parallel operation out of the box Only some small parts during message processing (pure sending of the message to the JMS provider) are synchronized Therefore to enable parallel processing on the JMS receiver side no actions are necessary
o SOAP Adapter
The SOAP adapter is able to process requests in parallel The SOAP sender side has in general no limitations in the number of requests it can execute in parallel The limiting factor here is the FCAThreads available to process the incoming HTTP calls This is discussed in more detail in chapter Tuning SOAP sender adapter On the receiver side the parallelism depends on the number of the threads defined in the messaging system and the ability of the receiving system to cope with the load
SAP NETWEAVER 71 AND HIGHER PERFORMANCE CHECK GUIDE
53
o RFC Adapter
The RFC adapter offers parameters to adjust the degree of parallelism by defining the number of initial and maximum connections to be used The initial threads are allocated from the Application thread pool directly and are therefore not available for any other tasks Therefore the number of initial thread should be kept minimal To avoid bottlenecks during the peak time the maximum connections can be used A bottleneck is indicated by the following exception in the Audit Log
comsapaiiaframsapiDeliveryException error while processing message to remote systemcomsapaiiafrfccoreclientRfcClientException resource error could not get a client from JCOPool comsapmwjcoJCO$Exception (106) JCO_ERROR_RESOURCE Connection pool RfcClient hellip is exhausted The current pool size limit (max connections) is 1 connections
Also this should be done carefully since these threads will be taken from the J2EE application thread pool Therefore a very high value there can cause a bottleneck on the J2EE engine and therefore cause a major instability of the system As per RFC adapter online help the maximum number of connections are restricted to 50
o IDoc_AAE Adapter
The IDoc adapter on Java (IDoc_AAE) was introduced with PI 73 On the sender side the parallelization depends on the configuration mode chosen In Manual Mode the adapter works sequential per server node For channels in ldquoDefault Moderdquo it depends on the configuration of the inbound Resource Adapter (RA) Via the parameter MaxReaderThreadCount of the inbound RA you can configure how many threads are globally available for all IDoc adapters running in Default Mode Hence this determines the overall parallelization of the IDoc sender adapter per Java server node Currently the recommended maximum number of threads is 10
The receiver side of the Java IDoc adapter is working parallel per default
The table below gives a summary of the parallelism for the different adapter types
SAP NETWEAVER 71 AND HIGHER PERFORMANCE CHECK GUIDE
54
612 Sender Adapter
The first step(s) to be taken for a sender adapter depend on the type of adapter itself Afterwards however
the message flow is always the same First the message is processed in the Module Processor and
afterwards put into the queue of the Messaging System If the message is synchronous then it is the call
queue if the message is asynchronous that it is the send queue The final action of the Adapter Framework
is then to send the message from the messaging system to the Integration Server (for Non ICO interfaces)
Only the first entries of the audit log are of interest to establish if the sender adapter has a performance
problem From the first entry to the entry ldquoMessage successfully put into the queuerdquo These steps logically
belong to the sender adapter and the Module Processor while the subsequent steps belong to the
Messaging System The sender adapter uses one J2EE Engine application thread to execute its work This
is generally the same thread for all steps involved
Select the ldquoDetailsrdquo of a message in the AFW The first entry of the audit log will be the beginning of the activity of the sender adapter The end of the adapterrsquos activity is marked by the entry ldquoThe application sent the message asynchronously using connection Returning to applicationrdquo
6121 Tuning SOAP sender adapter As described above in general there is no limitation in the parallelization of the SOAP sender adapter itself
The incoming SOAP requests are limited by the available FCA Threads for HTTP processing The FCA
Threads are discussed in more detail in FCA Server Threads
Per default all interfaces using the SOAP adapter are using the same set of FCA Threads since they are all
using the same URL httplthostgtltportgtMessageServlet In case one interface is facing a very high load or
slow backend connections this can cause a blockage of the available FCA Threads and could cause a heavy
impact on the processing time of other interfaces
To avoid this SAP Note 1903431 allows the usage of different URLs for specific interfaces This way you
could isolate interfaces with a very high volume on a dedicated entry point using its own set of FCA Threads
In case of high load for this interface the other SOAP sender interfaces would not be affected by a shortage
of FCA Threads
SAP NETWEAVER 71 AND HIGHER PERFORMANCE CHECK GUIDE
55
To use this new feature you can specify on the sender system the following two entry points
o MessageServletInternal
o MessageServletExternal
More information about the URL of the SOAP adapter can be found here
613 Receiver Adapter
For a receiver adapter it is just the other way around when compared to the sender adapter First the
message is received from the Integration Server and then put into a queue of the Messaging System this
time either the request or the receive queue for asynchronous and the request queue for synchronous
messages The last step is then the activity of the receiver adapter itself
Select the ldquoDetailsrdquo of a message in the AFW The adapter activity starts after the entry ldquoThe message status set to DLNGrdquo The message will then be forwarded to the entry point of the AFW ldquoDelivering to channel ltchannel_namegtrdquo enters the Module Processor ldquoMP Entering Module Processorrdquo and ends with ldquoThe message was successfully delivered to the application using connection rdquo
Depending on the type of the adapter you now have to investigate why the receiver adapter needs a high amount of processing time This could be a complicated operating system command a bad network connection or a slow backend system among many other reasons
Here too custom modules can be the reason for a prolonged processing time Check Performance of Module Processing for more details
Note From 71 the audit log is not persisted any longer for performance reasons as described in Persistence of Audit Log information in PI 710 and higher
SAP NETWEAVER 71 AND HIGHER PERFORMANCE CHECK GUIDE
56
614 IDoc_AAE adapter tuning
A comprehensive and up-to date description about the tuning of the IDoc adapter is summarized in Note
1641541 - IDoc_AAE Adapter performance tuning Please refer to this Note for details
Similar to all other adapters running on the Adapter Engine also the IDOC_AAE adapter is using the Messaging System queues and the explanations of the next chapter Messaging System Bottleneck are also valid for the IDOC_AAE adapter Note that the IDOC_AAE adapter only supports async Scenarios ndash so it is only using the ldquoSendrdquo queue in Java-only scenarios and the ldquoSendrdquo and ldquoReceiverdquo queue in dual-stack scenariosrdquo
For the IDoc_AAE sender you can configure in addition bulk support as indicated in the screenshot below By doing so all messages received by PI in one RFC call from ERP will be processed as one message This is similar to the mechanism of the ABAP IDoc adapter described in the chapter Packaging on sender and receiver side except with the difference that the number of messages in one bulk cannot be further limited
It is also essential to ensure that the size of the IDocs or IDoc packages for sender or receiver IDocs is not
getting too large to avoid any negative impact on the Java heap memory and Garbage Collection In the
case of the IDoc_AAE adapter the XML size of the IDoc is less critical it is the number of segments in an
IDoc or the overall number of segments in all IDocs of an IDoc package that will influence the memory
allocation during message processing Based on the current implementation per IDoc segment around 5 KB
of memory during processing is required A package of 5 IDocs with 2000 segments for each IDoc would
consume roughly 500 MB during processing In such cases it is important to eg lower the package size
andor use large message queues as outlined in chapter Large message queues on PI Adapter Engine
615 Packaging for Proxy (SOAP in XI 30 protocol) and Java IDoc adapter
Due to message packaging in the Integration Engine (see PI Message Packaging for Integration Engine) the
ABAP based IDoc and Proxy adapter was always using packaging when sending asynchronous messages
to the receiver system With PI 731 packaging was also introduced for Java based IDoc and Proxy (SOAP in
XI 30 protocol) adapter The aim of packaging is to achieve similar benefits to packaging already existing in
ABAP pipeline
o Less calls to backend consuming less parallel Dialog Work Processes on the receiver
o Less overhead due to context switches authentication when calling the backend
Especially for high volume interfaces packaging should be enabled to avoid overloading of the backend
systems and impact on users operating on the system
SAP NETWEAVER 71 AND HIGHER PERFORMANCE CHECK GUIDE
57
Important
In the ABAP stack the packaging is active per default (in 71 and higher) as described in chapter PI
Message Packaging for Integration Engine Experience shows that packaging can have a very high impact
on the DIA Work process usage on the ERP receiver side Especially for migration projects from dual-stack
PI to AEXPO it is important to evaluate packaging to avoid any negative impact on the receiving ECC due
to missing packaging
The packaging on Java works in general different then on ABAP While in ABAP the aggregation is done on
the individual qRFC queue level (which always contains messages to one receiver system only) this is not
possible on the Adapter Engine since messages for all receivers are located in the same queue Therefore
packages are built outside of the Adapter Engine queues The messages to be packaged will be forwarded
to a bulk handler which waits till either the time for the package is exceeded or the number of messages or
data size is reached After this the message is send by a bulk thread to the receiving backend system
Packaging on Java is always done for a server node individually If you have a high number of server nodes
packaging will work less efficiently due to the load balancing of messages across the available server nodes
When enabling message packaging the message status will stay in status ldquoDeliveringrdquo throughout all steps
described above In the audit log you can see the time it spends in packaging The audit log shown below
shows eg that the message was almost waiting one minute before the package was built and 9 IDocs were
sent with this package
Packaging can be enabled globally by setting the following parameters in Messaging System service as
described in Note 1913972
o messagingsystemmsgcollectorenabled Enable packaging or disable it globally
o messagingsystemmsgcollectormaxMemPerBulk The maximum size of a bulk message
o messagingsystemmsgcollectorbulkTimeout The wait time per bulk - default 60 seconds
o messagingsystemmsgcollectormaxMemTotal Maximum memory which can be used by message collector
o messagingsystemmsgcollectorpoolSize Number of parallel threads used to send out packages to the backend This value has to be tuned based on the general performance of the receiver system the network latency between the systems or the configuration of the IDoc posting on the ERP sender side (described in chapter IDoc posting on receiver side) Therefore tuning of these threads might be very important These threads can unfortunately not be monitored yet with any PI tool or Wily
SAP NETWEAVER 71 AND HIGHER PERFORMANCE CHECK GUIDE
58
Introscope To verify that not all packaging threads are in use you can use the Thread monitoring in the SAP Management Console and check for threads named ldquoBULK_EXECUTORrdquo as shown below
If you would like to adapt the packaging for specific communication channel this can also be done using the
configuration options in the Integration Directory
While in the SOAP adapter in XI 30 protocol you can define three different packaging KPIs this is currently
not possible for the IDoc adapter There you can only specify the package size based on number of
messages
616 Adapter Framework Scheduler
For polling adapters like File JDBC and JMS the Adapter Framework Scheduler determines on which server
node the polling takes place Per default a File or JDBC sender only works on one server node and the
Adapter Framework (AFW) Scheduler determines on which one the job is scheduled
The Adapter Frameworks scheduler had several performance and reliability issues in a cluster environment
especially in systems having many Java server nodes and many polling communication channels Based on
this and the symptoms described in Note 1355715 - AF Scheduler to avoid using cluster communication a
new scheduler was released We highly recommend using the new version of the AFW scheduler To
activate the new scheduler you have to set the parameter schedulerrelocMode of the Adapter framework
SAP NETWEAVER 71 AND HIGHER PERFORMANCE CHECK GUIDE
59
service property to some negative value For instance by setting the value to -15 after every 15th polling
interval a rebalancing of the channel within the J2EE cluster might happen This can allow for better
balancing of the incoming load across the available server nodes if the files are coming in on regular
intervals The balancing is achieved by doing a servlet call Based on the HTTP load balancing the channel
might then be dispatched to another server node To avoid the balancing overhead this value should not be
set too low A value between -10 and -15 should be acceptable in most cases For very short polling intervals
(eg every second) even lower values (eg -50) can be configured
In case many files are put at one given time on the directory (by eg using a batch process) all these files will
be processed by one polling process only Hence a proper load balancing cannot be achieved by the AFW
scheduler In such a case the only option is to use write the files with different names or different directories
so that you can configure multiple sender channels to pick up the files
Starting from PI 731 you can monitor the Adapter Framework Scheduler in pimon Monitoring
Background Job Processing Monitor Adapter Framework Scheduler Jobs There you can check on which
server node the Communication Channel is polling (Status=rdquoActiverdquo) Also you can see the time the channel
was polling the last time and will poll next time
You cannot influence the server node on which the channel is polling This is determined via the AFW
scheduler You can only influence the frequency after which a channel can potentially move to another
server node by tuning the parameter relocMode as outlined above
Prior to PI 731 you have to use the following URL to monitor the Adapter Framework Scheduler
httpserverportAdapterFrameworkschedulerschedulerjsp
Above you see an example of a File sender channel The type value determines if the channel runs only on
one server node (type = L (local)) or on all server nodes (Type = G (global)) The time in the brackets
[60000] determines the polling interval in ms ndash in this case 60 seconds The Status column shows the
status of the channel
o ldquoONrdquo Currently polling
o ldquoonrdquo Currently waiting for the next polling
SAP NETWEAVER 71 AND HIGHER PERFORMANCE CHECK GUIDE
60
o ldquooffrdquo not scheduled any longer (eg channel deactivated or scheduled on another server node)
62 Messaging System Bottleneck
As described earlier the Messaging System is responsible for persisting and queuing messages that come
from any sender adapter and go to the Integration Server pipeline or Java only interfaces (ICO) or that come
from the Integration Server pipeline and go to any receiver adapter The time difference between receiving
the message from the one side and delivering it to the other side is the value that can be used to analyze
bottlenecks in the Messaging System The following chapters describe how to determine the time difference
for both directions
A bottleneck (or rather a ldquofakerdquo bottleneck) in the Messaging System can usually be closely connected with a
performance problem in the receiver adapter You must therefore make sure you execute the check
described in chapter 613 If the receiver adapter needs a lot of time to process messages then of course
the messages get queued in the messaging system and remain there for a long time since the adapter is not
ready to process the next one yet It looks like the messaging system is not fast enough but actually the
receiver adapter is the limiting factor
Execute the checks described in chapter 621 and 622 to get an overview of the situation you should do this for multiple messages
Decide if a specific receiver adapter is causing long waiting times in the messaging system by executing the check described in chapter 613 An additional hint at a receiver adapter problem is if only messages to specific receivers show a long wait time in the queue
Use the queue monitoring in the Runtime Workbench (RWB) to analyze how many threads are active for each of the queue types and how large the queue size currently is To do so choose Component Monitoring Adapter Engine Press the Engine Status button and choose tab ldquoAdditional Datardquo This will open the page below showing the number of messages in a queue the threads currently working and the maximum available threads Note This view only shows the Messaging System of one J2EE server node To get the whole picture you have to check all the server nodes that are available in your system via the drop down list box
SAP NETWEAVER 71 AND HIGHER PERFORMANCE CHECK GUIDE
61
o Since checking all the server nodes with this browser frontend can be very tedious it is better to use Wily Introscope since it allows easy graphical analysis of the queues and thread usage of the messaging system across Java server nodes
The starting point in Wily Introscope is usually the PI triage showing all the backlogs in the queue In the screenshot below a backlog in the dispatcher queue (for 71 and higher only) can be seen
The dispatcher queue is not the problem here since it will forward messages to the adapter queue if any free
threads are available on the adapter specific consumer threads The analysis must start in the PI inbound
queues By using the navigation button in the upper right corner of the inbound queue size you can directly
jump to a more detailed view where you can see that the file adapter was causing the backlog
SAP NETWEAVER 71 AND HIGHER PERFORMANCE CHECK GUIDE
62
To see the consumer thread usage you can then follow the link to the file adapter In the screenshot below
you can see that all consumer threads were exceeded during the time of the backlog Thus increasing the
number of consumer threads could be a solution if the resulting delay is not acceptable for business
o If it is obvious that the messaging system does not have enough resources as in the case above increase the number of consumers for the queue in question Use the results of the previous check to decide which adapter queues need more consumers
The adapter specific queues in the messaging system have to be configured in the NWA using
service ldquoXPI Service AF Corerdquo and property messagingconnectionDefinition The default
values for the sending and receiving consumer threads are set as follows
(name=global messageListener=localejbsAFWListener exceptionListener=
localejbsAFWListener pollInterval=60000 pollAttempts=60
SendmaxConsumers=5 RecvmaxConsumers=5 CallmaxConsumers=5
RqstmaxConsumers=5)
To set individual values for a specific adapter type you have to add a new property set to the default set with the name of the respective adapter type for example
(name=JMS_httpsapcomxiXISystem
messageListener=localejbsAFWListener
exceptionListener=localejbsAFWListener pollInterval=60000
pollAttempts=60 SendmaxConsumers=7 RecvmaxConsumers=7
CallmaxConsumers=7 RqstmaxConsumers=7)
The name of the adapter specific queue is based on the pattern ltadapter_namegt_ ltnamespacegt for
example RFC_httpsapcomxiXISystem
Note that you must not change parameters such as pollInterval and pollAttempts For more details see SAP Note 791655 - Documentation of the XI Messaging System Service Properties
o Not all adapters use the parameter above Some special adapters like CIDX RNIF or Java Proxy can be changed by using the service ldquoXPI Service Messaging Systemrdquo and property messagingconnectionParams by adding the relevant lines for the adapter in question as described above
o A performance problem on the Messaging System can also be caused by a high logging as described in chapter Logging Staging on the AAE (PI 73 and higher)
o Important Make sure that your system is able to handle the additional threads that is monitor the CPU usage and application thread availability as well as the memory of the J2EE Engine after you have applied the change
SAP NETWEAVER 71 AND HIGHER PERFORMANCE CHECK GUIDE
63
o Important Keep in mind that not all adapters are able to handle requests in parallel even if you assign more threads on the Messaging System queues In such a case adding additional threads will not speed up processing significantly See chapter Adapter Parallelism for details
o A backlog of messages in the messaging system is highly critical for synchronous scenarios due to timeouts that might occur Therefore the number of synchronous threads always has to be tuned so that no bottleneck occurs Often a backlog in synchronous queues is caused due to bad performance on the receiving backend system
o More information is provided in the blog Tuning the PI Messaging System Queues
621 Messaging System in between AFW Sender Adapter and Integration Server (Outbound)
Open the Audit Log of a message and look for the following entry ldquoThe message was successfully retrieved
from the send queuerdquo Note that the queue name would be ldquoCall Queuerdquo if the message was synchronous
To determine how long the message waited to be picked up from the queue compare the timestamp of the
above entry with the timestamp for the step ldquoMessage successfully put into the queuerdquo A large time
difference between those two timestamps would therefore indicate a bottleneck for consumer threads on the
sender queues in the Messaging System
Instead of checking the latency of single messages we recommend using Wily Introscope to monitor the
queue behavior as shown above
Asynchronous messages only use one thread for processing in the messaging system Multiple threads are
used for synchronous messages The adapter thread puts the message into the messaging system queue
and will wait till the messaging system delivers the response The adapter thread is therefore not available
for other tasks until the response is returned A consumer thread on the call queue sends the message to the
Integration Engine The response will be received by a third thread (consumer thread of send queue) which
correlates the response with the original request After this the initiating adapter thread will be notified to
send the response to the original sender system This correlation can be seen in the audit log of the
synchronous message below
SAP NETWEAVER 71 AND HIGHER PERFORMANCE CHECK GUIDE
64
622 Messaging System in Between Integration Server and AFW Receiver Adapter (Inbound)
Open the Audit Log of a message and look for the following entry ldquoMessage successfully put into the
queuerdquo Compare this timestamp with the timestamp for the step ldquoThe message was successfully retrieved
from the receive queuerdquo The time difference between these two timestamps is the time that the message
waited in the messaging system for a free consumer thread A large time difference between those two
timestamps indicates a bottleneck in the adapter specific inbound queues of the Messaging System
623 Interface Prioritization in the Messaging System
SAP NetWeaver PI 71 and higher offers the possibility for prioritization of interfaces similar to the ABAP
stack This feature is especially helpful if high volume interfaces run at the same time with business critical
interfaces To minimize the delay for critical messages the Messaging System now makes it possible for you
to define high medium and low priority processing at interface level Based on the priority the Dispatcher
Queue of the messaging system (which will be the first entry point for all messages) will forward the
messages to the standard adapter-specific queues The priority assigned to an interface determines the
number of messages that are forwarded once the adapter-specific queues have free consumer threads
available This is done based on a weighting of the messages to be reloaded The weights for the different
priorities are as follows High 75 Medium 20 Low 5
Based on this approach you can ensure that more resources can be used for high priority interfaces The
screenshot below shows the UI for message prioritization available in pimon Configuration and
Administration Message Prioritization
SAP NETWEAVER 71 AND HIGHER PERFORMANCE CHECK GUIDE
65
The number of messages per priority can be seen in a dashboard in Wily as shown below
You can find more details on configuring usage prioritization within the AAE at SAP Online Help navigate to
SAP NetWeaver SAP NetWeaver PI SAP NetWeaver Process Integration 71 Including Enhancement
Package 1 SAP NetWeaver Process Integration Library Function-Oriented View Process Integration
Process Integration Monitoring Component Monitoring Prioritizing the Processing of Messages
624 Avoid Blocking Caused by Single SlowHanging Receiver Interface
As already discussed above some receiver adapters process messages sequentially on one server node by
default This is independent of the number of consumer threads defined for the corresponding receiver
queue in the messaging system For example even though you have configured 20 threads for the JDBC
Receiver one Communication Channel will only be able to send one request to the remote database at a
given time If there are many messages for the same interface all of them will get a thread from the
messaging system but will be blocked when performing the adapter call
In the case of a slow message transmission for example for EDI interfaces using ISDN technology or
remote system with small network bandwidth this behavior can cause a ldquohangingrdquo situation for a specific
adapter since one interface can block all messaging threads As a result all the other interfaces will not get
any resources and will be blocked
SAP NETWEAVER 71 AND HIGHER PERFORMANCE CHECK GUIDE
66
Based on this a parameter messagingsystemqueueParallelismmaxReceivers was introduced which can
be set in NWA in service XPI Service Messaging System With this parameter you can restrict the maximum
number of receiver consumer threads that can be used by one interface In older releases (lower 731 SP11
and 74 SP6) this is a global parameter at the moment that affects all adapters It should therefore not be set
too restrictively If you need high parallel throughput one option is to set the maxReceiver parameter to 5 (so
that each interface can use 5 consumer threads for each server node) and increase the overall number of
threads on the receive queue for the adapter in question (for example JDBC) to 20 With this configuration it
will be possible for four interfaces to get resources in parallel before all threads are blocked For more
information see Note 1136790 - Blocking Receiver Channel May Affect the Whole Adapter Type and SDN
blog Tuning the PI Messaging System Queues
In the screenshot below you see the impact of maxReceivers parameter when a backlog for one interface
occurs Even though there are more free SOAP threads available they are not consumed Hence the free
SOAP threads could be assigned to other interfaces running in parallel
This parameter has a direct impact on the queue where message backlogs occur As mentioned earlier
usually a backlog should occur on the Dispatcher queue only since it is responsible to dispatch threads only
if there are free consumer threads in the adapter specific queue When setting maxReceiver you restrict the
threads per interface and this means that less consumer threads are blocked When one interface is facing a
high backlog there will always be free consumer threads and therefore the dispatcher queue can dispatch
the message to the adapter specific queue Hence the backlog will appear in the adapter specific queue so
that the message prioritization would not work properly any longer
SAP NETWEAVER 71 AND HIGHER PERFORMANCE CHECK GUIDE
67
Per default the maxReceiver parameter is only relevant for asynchronous message processing (ICo and
classical dual-stack scenarios) The reason here is that a wait time for synchronous scenarios should be
avoided by all means and therefore additional restrictions in the number of available threads can be very
critical Therefore it is usually advisable to not limit the threads per interface but increase the overall number
of available threads In case you have many high volume synchronous scenarios with different priority that
run in parallel it might be advisable to limit the threads each interface can use To do so you have to set the
parameter messagingsystemqueueParallelismqueueTypes to Recv ICoAll as described in SAP Note
1493502 - Max Receiver Parameter for Integrated Configurations
Enhancement with 731 SP11 and 74 SP6
With Note 1916598 - NF Receiver Parallelism per Interface an enhancement was introduced that allows
the specification of the maximum parallelization on more granular level This new feature has to be activated
by setting the parameter messagingsystemqueueParallelismperInterface to true Using a configuration UI
you can specify rules to determine the parallelization for all interfaces of a given receiver service If no rule
for a given interface is specified the global maxReceivers value will be considered If the receiver service
corresponds to a technical business system this configuration would help to restrict the parallel requests
from PI to that system This also works across protocols so that eg it could be used to restrict the number of
parallel requests using Proxy or IDoc to the same ERP receiver system Below you can find a screenshot of
the configuration UI in NWA SOA Monitoring
With the improvement mentioned above also the dispatching mechanism in the dispatcher queue is
changed so that it is aware of the maxReceiver settings This means that now again the backlog will now be
placed in the dispatcher queue and the prioritization will work properly
625 Overhead based on interface pattern being used
Also the interface pattern configured can cause some overhead When choosing the interface pattern
ldquoStateless Operationrdquo each message is parsed against its data type during inbound processing This can
cause performance and memory overhead but gives a syntactical check of the data received
When choosing ldquoStateless (XI30-Compatible)rdquo no check of the data type is performed and therefore the
overhead is avoided Therefore for interface with good data quality and high message throughput this
interface pattern should be chosen
SAP NETWEAVER 71 AND HIGHER PERFORMANCE CHECK GUIDE
68
63 Performance of Module Processing
If your analysis in chapter Adapter Performance Problem pointed to a problem in the Module Processing
then you must analyze the runtime of the modules used in the Communication Channel Adapter modules
can be combined so that one CC calls multiple modules in a defined sequence Adapter modules can be
custom-developed or SAP standard and can be used for many different purposes ndash like to transform the EDI
message before sending it to the partner or to change header attributes of a PI message before forwarding it
to a legacy application Due to the flexible usage of adapter modules there is also no standard way to
approach performance problems
In the audit log shown below you can see two adapter modules One module is a customer-developed
module called SimpleWaitModule The next module called CallSAPAdapter which is a standard module that
inserts the data into the messaging system queues
In the audit log you will get a first impression of the duration of the module In the example above you can
see that the SimpleWaitModule requires 4 seconds of processing time
Once again Wily Introscope offers a better overview of the processing time of modules In the screenshot
below you can see a dashboard showing the cumulativeaverage response times and number of invocations
of different modules If there is one that has been running for a very long time then it would be very easy to
identify since there will be a line indicating a much higher average response time The tooltip displays the
name of the module
Module
Processing
SAP NETWEAVER 71 AND HIGHER PERFORMANCE CHECK GUIDE
69
Once you have identified the module with the long running time you have to talk to the responsible developer
to understand why it is taking that long Eventually the module executes a look-up to a remote system using
JCo or JDBC which could be responsible for the delay In the best case the module will print out information
in addition to the audit log to detect such steps If not use the Wily Introscope transaction trace as explained
in appendix Wily Transaction Trace
64 Java only scenarios Integrated Configuration objects
From SAP NetWeaver PI 71 on you can configure scenarios that only run on the Java stack using the
Advance Adapter Engine (AAE) when only Java-based adapters are used A new configuration object is
used for this that is called Integrated Configuration When using this the steps executed so far in the ABAP
pipeline (Receiver Determination Interface Determination and Mapping) are also executed by the services in
the Adapter Engine
641 General performance gain when using Java only scenarios
The major advantage of AAE processing is a reduced overhead due to the context switches between ABAP
and Java Thus the overall throughput can be increased significantly and the overall latency of a PI
message can be reduced greatly If possible interfaces should always use the Integrated Configuration to
achieve best performance Therefore the best tuning option is to change a scenario that is using Java based
sender and receiver adapters from a classical ABAP-based scenario to an AAE-based one
SAP NETWEAVER 71 AND HIGHER PERFORMANCE CHECK GUIDE
70
Based on SAP internal measurements performed on 71 releases the throughput as well as the response
time could be improved significantly as shown in the diagrams below
SAP NETWEAVER 71 AND HIGHER PERFORMANCE CHECK GUIDE
71
Based on these measurements the following statements can be made
1) Significant performance improvements can be achieved always with local processing (if available) for a certain scenario
2) This is valid for all adapter types huge mapping runtimes slow networks slow (receiver) applications reduce the throughput and therefore rated for the overall scenario also reduce the benefit of local processing in terms of overall throughput and response time measurements
3) Greatest benefit is recognized for small payloads (comparison 10k 50k 500k) and asynchronous messages
642 Message Flow of Java only scenarios
All the Java based tuning options mentioned in chapter Analyzing the (Advanced) Adapter Engine and Long
Processing Times for ldquoPLSRV_MAPPING_REQUESTrdquo are still valid Just the calling sequence is different
The following describes the steps used in Integrated Configuration to help you better understand the
message flow of an interface The example is JMS to Mail
1) Enter the JMS sender adapter
2) Put into the dispatcher queue of the messaging system
3) Forwarded to the JMS send queue of the messaging system
4) Message is taken by JMS send consumer thread
a No message split used
In this case the JMS consumer thread will do all the necessary steps previously done in the ABAP pipeline (like receiver determination interface determination and mapping) and will then also transfer the message to the backend system (remote database in our example) Thus all the steps are executed by one thread only
b Message split used (1n message relation)
In this case there is a context switch The thread taking the message out of the queue will process the message up to the message split step It will create the new message and put it in the Send queue again from where it will be taken by different threads (which will then map the child message and finally send it to the receiving system)
As we can see in this example for Integrated Configuration only one thread does all the different steps of a
message The consumer thread will not be available for other messages during the execution of these steps
The tuning of the Send queue (Call for synchronous messages) is therefore much more important for
scenarios using Integrated Configuration than for ABAP-based scenarios
The different steps of the message processing can be seen in the audit log of a message If for example a
long-running mapping or adapter module is indicated then you can use the relevant chapter of this guide
There is no difference in the analysis except that for mappings no JCo connection is required since the
mapping call is done directly from the Java stack
SAP NETWEAVER 71 AND HIGHER PERFORMANCE CHECK GUIDE
72
The example audit logs below are based on a Java only synchronous SOAP to SOAP scenario
In the highlighted areas you can see that all the steps are very fast except the mapping call which lasts
around 7 seconds To analyze the long duration of the mapping now the same steps as discussed in chapter
Long Processing Times for ldquoPLSRV_MAPPING_REQUESTrdquo have to be followed
SAP NETWEAVER 71 AND HIGHER PERFORMANCE CHECK GUIDE
73
643 Avoid blocking of Java only scenarios
Like classical ABAP based scenarios Java only scenarios can face backlog situations in case of a slow or
hanging receiver backend Since the Java only interfaces are only using send queues the restriction of
consumer threads on the receiver queue as described in chapter Avoid Blocking Caused by Single
SlowHanging Receiver Interface is no solution
Based on that an additional property messagingsystemqueueParallelismqueueTypes of service SAP XI AF
MESSAGING was introduced via Note 1493502 - Max Receiver Parameter for Integrated Configurations
The parameter can be set for synchronous and asynchronous interfaces Please keep in mind that
messagingsystemqueueParallelismmaxReceivers is a global parameter for all adapters and for all
configured Quality of Service This global restriction can be avoided starting with 731 SP11 740 SP06 as
per SAP Note 1916598 - NF Receiver Parallelism per Interface Usually a restriction for the parallelization
can be highly critical for synchronous interfaces Therefore we generally recommend to set
messagingsystemqueueParallelismqueueTypes in most cases to Recv IcoAsync only
644 Logging Staging on the AAE (PI 73 and higher)
Up to PI 711 on the PI Adapter Engine only one message version was persisted Especially for Java only
scenarios this was often not sufficient for troubleshooting since for instance the result of a mapping could not
be verified
Starting from PI 73 the persistence steps can be configured globally in the Adapter Engine for synchronous
and asynchronous interfaces This is similar to the LOGGING or LOGGING_SYNC on the ABAP stack In
later version of PI you will be able to do the configuration on interface level
The versions that can be persisted are shown in the diagram below (the abbreviations in green are the
values for the configuration)
SAP NETWEAVER 71 AND HIGHER PERFORMANCE CHECK GUIDE
74
In the Messaging System we generally distinguish Staging (versioning) and Logging An overview is given
below
For details about the configuration please refer to the SAP online help Saving Message Versions
Similar to the LOGGING on the ABAP Integration Server persisting several versions of the Java message
can cause a high overhead on the DB and can cause a decrease in performance
The persistence steps can be seen directly in the audit log of a message
Also the Message Monitor shows the persisted versions
SAP NETWEAVER 71 AND HIGHER PERFORMANCE CHECK GUIDE
75
While this additional monitoring attributes are extremely helpful for troubleshooting they should be used
carefully from a performance perspective Especially the number of message versions and the
loggingstaging mode you choose can have a severe impact on performance Therefore you have to find the
balance between business requirement and performance overhead Some guidelines on how to use staging
and logging are summarized in SAP Note 1760915 - FAQ Staging and Logging in PI 73 and higher
65 J2EE HTTP load balancing
With NetWeaver version 71 and higher the Java HTTP load balancing is no longer done by the Java
Dispatcher but by the ICM The default load balancing rules of the ICM are designed with a stateful
application in mind giving priority to the balancing of HTTP sessions These default rules are not optimal for
stateless applications such as SAP PI
In the past we could observe an unequal load distribution across Java server nodes caused by this In case
of high backlogs this can cause a delay in the overall message processing of the interface because one
server node has more messages assigned than others and therefore not all available resources are used
A typical example can be seen in the Wily screenshot below
SAP Note 1596109 ndash Uneven distribution of HTTP requests on Java server nodes introduces new load
balancing rules for stateless applications like PI Please follow the description in the Note to ensure the
messages are distributed equally across the available server nodes In the meantime these load balancing
rules can also be executed using the CTC templates as described in Notes 1756963 and 1757922 Also this
has been included in the PI Initial Setup wizard in order to execute this task automatically as a post-
installation step (see Note 1760700 - PI CTC Add HTTP loadbalancing to initial setup)
SAP NETWEAVER 71 AND HIGHER PERFORMANCE CHECK GUIDE
76
For the example given above we could see a much better load balancing after the new load balancing rules
were implemented This can be seen in the following screenshot
Please Note The load balancing rules mentioned above are only responsible to balance the messages
across the available server nodes of one instance HTTP load balancing across application servers is done
by the SAP Web Dispatcher More information about this is provided in the Guide How To Scale SAP PI 71
66 J2EE Engine Bottleneck
All tuning that can be done in the AFW is limited by the ability of the J2EE Engine to handle a given amount
of threads and to provide enough memory that is needed to process all requests Of course the CPU is also
a limiting factor but this will be discussed in Chapter 91
From SAP NetWeaver PI 71 onwards the SAP VM is used on all platforms Therefore the analysis of all
platforms can use the same tools
661 Java Memory
The first analysis of the J2EE memory is usually done using the garbage collection (GC) behavior of the
Java Virtual Machine (JVM) To get the information of the GC written to the standard log file the JVM has to
be started with the parameter ndashverbosegc
Analyze the file std_serverltngtout for the frequency of GCs their duration and the allocated memory
Look for unusual patterns indicating an Out-of-Memory error or an unintentional restart of your J2EE engine This would be visible if the allocated memory drops to 0 at a given point in time A healthy Garbage Collection output would display a saw tooth pattern ndash that is the memory usage would increase over time but then go down to its original value as soon as a full Garbage Collection is triggered You should see the memory usage go down to initial values during low volume times (night-time)
Pay attention to GCs with a high duration This is important because no PI message can be mapped or processed by the J2EE Adapter Framework during a GC in a JAVA VM One of the many reasons for long GCs that should be mentioned here is paging (see chapter 92) If the heap space of the J2EE Engine is exhausted all objects in the heap are evaluated for their references If there is still a reference the object is kept If there is no reference the object is deleted If some or all of the objects have been swapped out due to insufficient RAM then they have to be swapped in to be evaluated This leads to very long runtimes for GCs GCs of more than 15 minutes have been observed on swapping systems
SAP NETWEAVER 71 AND HIGHER PERFORMANCE CHECK GUIDE
77
Different tools exist for the Garbage Collection Analysis
1) Solution Manager Diagnostics
Solution Manager Diagnostics (SMD) offers a memory analysis application that is able to read the GC output in the std_serverltngtout files To start call the Root Cause Analysis section In the Common Task list you find the entry Java Memory Analysis which will give you the chance to upload your std_serverltngtout file It shows the memory allocated after the GC and also prints the duration of each GC (black dots with duration scale on right axis) A normal GC output should show a saw tooth pattern where the memory always goes down to an initial value (especially during low volume times) This is shown in the example screenshot below
2) Wily Introscope
Again Wily Introscope offers different dashboards that can be used to check the Garbage Collection behavior on the J2EE engine The dashboard can be found using the J2EE Overview J2EE GC Overview and shows important KPIs for the GC such as the count of GC or the duration for each interval The GC Time dashboards shows the ratio of time spent in GC An example is shown in the screenshot below
SAP NETWEAVER 71 AND HIGHER PERFORMANCE CHECK GUIDE
78
3) Netweaver Administrator
The NWA also offers a view to monitor the Java heap usage However the important information about the duration of the GC is not available This monitor can be found by navigating to Availability and Performance Management Java System Reports Choose Report System Health
In NetWeaver 73 you find this data in Availability and Performance Management Resource Monitoring History Reports There you can build your own Memory report of the monitoring data provided The screenshot below eg shows the Used Memory per server node
SAP NETWEAVER 71 AND HIGHER PERFORMANCE CHECK GUIDE
79
4) SAP JVM Profiler
The SAP JVM profiler allows the analysis of the extensive GC information stored in the sapjvm_gcprf files of the server node folders or to directly connect to the server node to retrieve this information More information can be found at httpwikiscnsapcomwikidisplayASJAVAJava+Profiling
SAP NETWEAVER 71 AND HIGHER PERFORMANCE CHECK GUIDE
80
Procedure
o Search for restarts of the J2EE Engine by searching for the string ldquois startingrdquo in the file std_serverltngtout Apart from the first of these entries (which simply marks the initial start of the J2EE Engine) the second and any later entries mark a fatal situation after which the J2EE server node had to be restarted This could for example be an outndashof-memory situation Search the log above those entries for a possible reason
o Search for exceptions and fatal entries Was an out-of-memory error reported (search for pattern OutOfMemory) Was a thread shortage reported
o This document does not deal with tuning the J2EE Engine If at this point it becomes clear that the J2EE Engine is the limiting factor proceed with SAP Notes or open a customer incident Only some very basic recommendations are given here
o The parameters for the SAP VM are defined by Zero Admin templates From time to time new Zero Admin templates might be released which change important parameters for the SAP VM Thus you should check SAP Note 1248926 - AS Java VM Parameters for NetWeaver 71-based Products regularly and apply the changes accordingly
o The problem might be caused by too high parallelization when processing large messages This should be restricted to avoid overloading of the Java heap memory
1) In case the interfaces are using the ABAP Integration Server use the large message queue filters to restrict the parallelization of mapping calls from ABAP queues To do so set parameter EO_MSG_SIZE_LIMIT to eg 5000 to direct all large messages to dedicated XBTL or XBTM queues
2) To restrict the parallelization on the Java Messaging System you can use the large message queue mechanism described in chapter Large message queues on the Messaging System
o If it is already obvious that the memory of your J2EE Engine is getting short and nothing can be changed on the scenarios itself you have several options for scaling your PI landscape Especially for large PI installations with high message throughput or large messages SAP Note 1502676 - Scaling up large PI installations describes potential options
1) Increase the Java Heap of your server node If sufficient physical memory is available increase the default heap size of 2 GB to a higher value such as 3 or 4 GB Experience shows that the SAP VM can handle these heap sizes without major impact on performance Larger heap sizes can cause longer processing time of GCs which in turn can affect the PI application negatively Increasing the maximum heap size on the J2EE engine will automatically adapt the new area of the heap due to a dynamic configuration (in newer J2EE versions this will be per default set to 16 of the overall heap) After increasing the heap size monitor the duration of the GC execution
2) Add an additional server node to distribute the load over more processes SAP recommends that productive systems have at least 2 Java server nodes per instance Prerequisite is that your physical host has enough RAM and CPU To minimize the overhead for J2EE cluster communication it is in general recommended configuring larger server nodes (as described above) then a high number of server nodes
3) Add an additional application server consisting of a double stack Web Application Server (ABAP and J2EE Engine) to distribute the load to an additional hardware Find details on the scaling of PI with multiple instances in the Guide How To Scale up SAP NetWeaver Process Integration
4) Use a non-central Adapter Engine to separate large messages that cause the memory problem from business critical scenarios
662 Java System and Application Threads
A system or application thread is required for every task that the J2EE Engine executes Each of these
thread types are maintained using a thread pool If the pool of available threads is expired no more requests
can be processed It is therefore important that you have enough threads available at all times
SAP NETWEAVER 71 AND HIGHER PERFORMANCE CHECK GUIDE
81
o In general SAP recommends that you increase the system and application thread count for a PI system As described in SAP Note 937159 - XI Adapter Engine is stuck the application threads should be increased to 350 and the system threads to lsquo120rsquo for all J2EE server nodes
o There are two options for checking the thread usage
1) Wily Introscope
Wily Introscope provides a dashboard in the J2EE Overview section called J2EE CPU and Memory Detail that can also be used to monitor the thread usage on a PI engine Different views exist for Application and System Threads as shown in the screenshot below
2) NetWeaver Administrator (NWA)
The NWA also offers a monitor similar to the one available for the memory mentioned above This monitor can be found by navigating to Availability and Performance Management Java System Reports Choose Report System Health and looking at the windows shown in the screenshot below
Again in NetWeaver 73 and higher the monitor can be found at Availability and Performance
Management Resource Monitoring History Report An example for the Application Thread
Usage is shown below
SAP NETWEAVER 71 AND HIGHER PERFORMANCE CHECK GUIDE
82
Check if the ThreadPoolUsageRate is below 80 for both the application threads and the system threads Also check the maximum value by choosing a longer history in Wily Introscope
Has the thread usage increased over the last daysweeks
Is there one server node that shows a higher thread usage than others
3) SAP Management Console
The SAP Management Console is an essential tool to analyze different aspects of the J2EE engine It also offers a thread dump view similar to SM50 in ABAP showing the activity of all the threads of a given Java Application Server More information about the SAP MC can be found in Note 1014480 - SAP Management Console (SAP-MC) and the online help The SAP Management Console can be started as Java web-start application using httpltservergt5ltInstanc_numbergt13
Navigate to AS Java Threads and check for any threads in red status (gt20 secs running time) This indicates long running threads and you should check for the related thread stacks The example below shows a long running thread related to the PI directory You can see the user doing the request and can see that the thread is waiting for an HTTP response from the CPACache
SAP NETWEAVER 71 AND HIGHER PERFORMANCE CHECK GUIDE
83
If you are not sure what is causing the problem you should take multiple thread dumps (at least 3 every 30 seconds) for all server nodes This can be done in the Management Console navigating to AS Java Process Table
The Thread Dump Viewer tool (TDV) from Note 1020246 - Thread Dump Viewer for SAP Java Engine can be used to analyze the produced thread dumps (inside the results archive that can be downloaded to your local PC)
663 FCA Server Threads
An additional type of thread was introduced with SAP NetWeaver PI 71 that is responsible for HTTP traffic
FCA Server Threads The FCA Server Threads are responsible for receiving HTTP calls at the Java side
(after the Java dispatcher is no longer available) Also FCA Threads use a Thread Pool Fifteen FCA
Threads are configured by default but based on SAP Note 1375656 - SAP Netweaver PI System Parameters
we recommend that you increase it to 50 This can be done in the NWA by changing the parameter
FCAServerThreadCount of service HTTP Provider
FCA Server Threads are particularly crucial for synchronous message transfer and for HTTP-based
scenarios like WebServices or calls from the ABAP engine to the Adapter Engine If there is a long duration
of the HTTP call due to a slow backend system then the thread is blocked for the whole time and not
available to send other HTTP requests (other PI messages)
SAP NETWEAVER 71 AND HIGHER PERFORMANCE CHECK GUIDE
84
The configured FCAServerThreadCount represents the maximum number of threads working on a single
entry point An entry point in the PI sense could eg be the SOAP Adapter Servlet (share with all channels
as described in Tuning SOAP sender adapter)
o If response times for specific entry point are high (gt15 seconds) additional FCA threads will be spawned to be available for parallel HTTP based incoming requests using different entry points only This ensures that in case of problems with one application not all other applications will be blocked constantly
o An overall maximum of 20xFCAServerThreadCount may be used in the J2EE engine
There is currently no standard monitor available for FCA Threads except the thread view in the SAP
Management Console A new dashboard will be integrated into Wily Introscope soon and will also show the
FCA Server Threads that are in use
664 Switch Off VMC
The Virtual Machine Container (VMC) is enabled by default for an ABAP WebAS 71 Since PI does not use
VMC at runtime the VMC can be switched off on a PI system to avoid resource overhead This
recommendation is based on SAP Note 1375656 - SAP NetWeaver PI System Parameters
You can activate the VM Container setting the profile parameters vmcjenable = off which can be changed
using profile maintenance (transaction RZ10) Once you have made the change you need to restart the SAP
Web Application Server instance
SAP NETWEAVER 71 AND HIGHER PERFORMANCE CHECK GUIDE
85
7 ABAP PROXY SYSTEM TUNING
Every ABAP WebAS gt 620 includes an ABAP Proxy runtime This enables a SAP system to talk native PI
protocol (XI-SOAP) so that no costly transformation is necessary
In general ABAP proxy is just a framework that is triggered by (sender) or triggers (receiver) application-
specific coding It is not possible to give a general tuning recommendation because the applications and use
cases of ABAP proxy can differ so greatly
In this section we would like to highlight the system tuning options that can be applied to improve the
throughput at the ABAP Proxy backend side
In general you can increase the throughput of EO interfaces by changing the queue parallelization Two
different parameters exist to change the number of qRFC queues on the ABAP Proxy backend As in PI
ABAP Proxy processing is based on qRFC inbound queues (SMQ2) with specific names A sender proxy
uses XBTS queues (10 parallel by default) and a receiver proxy XBTR (20 parallel by default)
The sender proxy only forwards the message to PI by executing an HTTP call that must not take too much
time and which is not resource-critical On the other hand the receiver proxy executes the inbound
processing of the messages based on the application context (and which can be very time-consuming) It is
therefore more likely to face a backlog situation in the Receiver Proxy queues In the screenshot below you
can see the performance header of a receiver proxy message that required around 20 minutes in the
PLSRV_CALL_INBOUND_PROXY (which corresponds to the posting of the application data)
Of course such a long-running message will block the queue and all messages behind it will face a higher
latency Since this step is purely application-related it is only possible to perform tuning at the application
side
The number of sender and receiver ABAP Proxy queues can be changed in transaction SXMB_ADM on the
proxy backend with parameter EO_INBOUND_PARALLEL and sub parameter SENDER (XBTS queues)
and RECEIVER (XBTR queues) The prerequisite for increasing the number of queues is that there are
enough qRFC resources are available at the proxy system (as discussed in section qRFC Resources
(SARFC))
Also as described in chapter Message Prioritization on the ABAP Stack prioritization can be configured in
the ABAP Proxy system This can be used to separate runtime-critical interfaces from interfaces with a long
application processing (as shown above)
SAP NETWEAVER 71 AND HIGHER PERFORMANCE CHECK GUIDE
86
71 New enhancements in Proxy queuing
The queuing mechanism was enhanced for sender and receiver proxy systems with Note 1802294
(Receiver) and Note 1831889 (Sender) After implementing these two Notes interface specific queues will be
used and tuning of these queues on interface level will be possible This can be very helpful in cases where
one receiver interface shows very long posting time in the application coding that cannot be further
improved Other messages for more business critical interfaces will eventually be blocked by this message
due to the common usage of the XBTR queues On the sender side of a Proxy system the processing of the
queues call the central PI hub In general the processing time there should be fast But in case of high
volume interfaces you might want to slow down less business critical interfaces to avoid overloading of your
central PI hub The prioritization mechanisms available prior to these Notes did not provide such options
This is achieved by adding an interface specific identifier to the queue-name In the screenshot below you
see a comparison in the queue names for the old framework (red) and the new framework (blue)
For the sender queues the following new parameters are introduced
o Parameter EO_QUEUE_PREFIX_INTERFACE with sub parameter SENDERSENDER_BACK Should be set to lsquo1rsquo to active interface specific queue This is a global switch affecting all sender interfaces
o Parameter EO_INBOUND_PARALLEL_SENDER without sub parameter determines the general number of queues per interface
Using a sub parameter ltsender IDgt the parallelization of individual interfaces can be changed This can eg be used to assign more queues for high priority interfaces
Wildcards can be used in the ltsender IDgt to group interfaces sharing eg the same service name or the same interface name but different services
For the receiver queues the following new parameters are introduced
o Parameter EO_QUEUE_PREFIX_INTERFACE with sub parameter RECEIVER Should be set to lsquo1rsquo to active interface specific queue This is a global switch affecting all receiver interfaces
o Parameter EO_INBOUND_PARALLEL_RECEIVER without sub parameter determines the general number of queues per interface
Using a sub parameter ltsender IDgt the parallelization of individual interfaces can be changed This can eg be used to assign more queues for high priority interfaces
Wildcards can be used in the ltsender IDgt to group interfaces sharing eg the same service name or the same interface name but different services
This new feature also replaces the currently existing prioritization since it is in general more flexible and
powerful We therefore recommend adjusting existing prioritization rules using the new queuing possibilities
described above
SAP NETWEAVER 71 AND HIGHER PERFORMANCE CHECK GUIDE
87
8 MESSAGE SIZE AS SOURCE OF PERFORMANCE PROBLEMS
The message size directly influences the performance of an interface The size of a PI message depends on
two elements The PI header elements with a rather static size and the payload which can vary greatly
between interfaces or over time for one interface (for example larger messages during year-end closing)
The size of the PI message header can cause a major overhead for small messages of only a few kB and
can cause a decrease in the overall throughput of the interface Furthermore many system operations (like
context switches or database operations) are necessary for only a small payload The larger the message
payload the smaller the overhead due to the PI message header On the other hand large messages
require a lot of memory on the Java stack which can cause heavy memory usage on ABAP or excessive
garbage collection activity (see section Java Memory) that will also reduce the overall system performance
Very large messages can even crash the PI system by causing an Out-of-Memory exception for example
You therefore have to find a compromise for the PI message size
Below you see throughput measurements performed by SAP In general the best throughput was identified
for messages sizes of 1 to 5 MB
The message size in these measurements corresponds to the XML message size processed in PI and not
the size of the file or IDoc being sent to PI You can use the Runtime Header of the ABAP stack to check the
message size Below you can see an example of a very small message While the MessageSizePayload
field describes the size of the payload in bytes (here 433 bytes) the MessageSizeTotal describes the total
message size (header + payload) In the example this is around 14 KB demonstrating the overhead by the PI
header for small messages The next two lines describe the payload size before and after the mapping In
the example below the mapping reduces the payload size The last two lines determine the size of the
response message that is sent back to PI before and after the response mapping for synchronous
messages
SAP NETWEAVER 71 AND HIGHER PERFORMANCE CHECK GUIDE
88
Based on the above observations we highly recommend that you use a reasonable message size for your
interfaces During the design and implementation of the interface we therefore recommend using a message
size of 1 to 5 MB if possible Messages can be collected at the sender side or by using IDoc packaging as
described in Tuning the IDoc Adapter to achieve this In case of large messages a split has to be performed
by changing the sender processing or by using the split functions available in the structure conversion of the
File adapter
81 Large message queues on PI ABAP
In case the interfaces are using the ABAP Integration Server use the large message queue filters to restrict
the parallelization of mapping calls from ABAP queues To do so set the parameter EO_MSG_SIZE_LIMIT of
category TUNING to eg 5000 to direct all messages larger 5 MB to dedicated XBTL or XBTM queues
The value of the parameter depends on the number of large messages and the acceptable delay that might
be caused due to a backlog in the large message queue
To reduce the backlog the number of large message queues can also be configured via parameter
EO_MSG_SIZE_LIMIT_PARALLEL of category TUNING The default value is 1 so that all messages larger
than the defined threshold will be processed in one single queue Naturally the parallelization should not be
set higher than 2 or 3 to avoid overloading of the Java memory due to parallel large message requests
82 Large message queues on PI Adapter Engine
SAP Note 1727870 - Handling of large messages in the Messaging System introduces large message
queues (virtual queues no adapter behind) also for the Java based Adapter Engine Contrary to the
Integration Engine it is not the size of a single large message only that determines the parallelization
Instead the sum of the size of the large messages across all adapters on a given Java server node is limited
to avoid overloading the Java heap This is based on so called permits that define a threshold of a message
size Each message larger than the permit threshold is considered as large message The number of permits
can be configured as well to determine the degree of parallelization Per default the permit size is 10 MB and
10 permits are available This means that large messages will be processed in parallel if 100 MB are not
exceeded
To show this let us look at an example using the default values Let us assume we have 5 messages waiting
to be processed (status ldquoTo Be Deliveredrdquo on one server node Message A has 5 MB message B has 10
MB message C has 50 MB message D 150 MB message E 50 MB and message F 40 MB Message A is
not considered large since the size is smaller than the permit size and is not considered large and can be
immediately processed Message B requires 1 permit message C requires 5 Since enough permits are
available processing will start (status DLNG) Hence for message D all available 10 permits would be
required Since the permits are currently not available it cannot be scheduled If blacklisting is enabled the
message will be put to error status (NDLV) since it exceed the maximum number of defined permits In that
case the message would have to be restarted manually Message E requires 5 permits and can also not be
scheduled But since there are 4 permits left message F is put to DLNG Due to the smaller size message B
and message F finish first releasing 5 permits This is sufficient to schedule message E which requires 5
SAP NETWEAVER 71 AND HIGHER PERFORMANCE CHECK GUIDE
89
permits Only after message E and C have finished message D can be scheduled consuming all available
permits
The example above shows a potential delay a large message could face due to the waiting time for the
permits But the assumption is that large messages are not time critical and therefore additional delay is less
critical than potential overload of the system
The large message queue handling is based on the Messaging System queues This means that restricting
the parallelization is only possible after the initial persistence of the message in the Messaging System
queues Per default this is only done after the Receiver Determination Therefore if you have a very high
parallel load of incoming large requests this feature will not help Instead you would have to restrict the size
of incoming requests on the sender channel (eg file size limit in the file adapter or the
icmHTTPmax_request_size_KB limit in the ICM for incoming HTTP requests) If you have very complex
extended receiver determination or complex content based routing it might be useful to configure staging in
the first processing step of the Messaging System (BI=3) as described in Logging Staging on the AAE (PI
73 and higher)
The number of permits consumed can be monitored in PIMON Monitoring Adapter Engine Status The
number of threads corresponds to the number of consumed permits
In newer Wily versions there is also a dashboard showing the number of consumed permits as well The
Worker Threads on the right hand side of the screenshot correspond to the permits
SAP NETWEAVER 71 AND HIGHER PERFORMANCE CHECK GUIDE
90
9 GENERAL HARDWARE BOTTLENECK
During all tuning actions discussed in the previous chapters you must keep in mind that the limitation of all
activities is set by the underlying CPU and memory capacity The physical server and its hardware have to
provide resources for three PI runtimes the Adapter Engine the Integration Engine and the Business
Process Engine Tuning one of the engines for high throughput leaves fewer resources for the remaining
engines Thus the hardware capacity has to be monitored closely
91 Monitoring CPU Capacity
When monitoring the CPU capacity it is not enough to use the average that is displayed in the ldquoPrevious
Hoursrdquo section of transaction ST06 Instead you should start your interface and monitor the CPU while it is
running The best procedure is to use operating system tools to monitor the CPU usage (particularly if using
hardware virtualization)
The SMD Host Agent also reports CPU data to Wily Introscope which can be viewed using dashboards as
shown below This example shows two systems where one is facing a temporary CPU overload and the
other a permanent one
Also the NWA offers a view on the CPU activity from NetWeaver 73 on via Availability and Performance
Management Resource Monitoring History Reports There you can build your own report based on the
ldquoCPU utilizationrdquo data as shown in the screenshot
SAP NETWEAVER 71 AND HIGHER PERFORMANCE CHECK GUIDE
91
You can also monitor the CPU usage in ST06 as described below
Procedure
Log on to your Integration Server and call transaction ST06 Take a look at the snapshot that is provided on
the entry screen than navigate to ldquoDetailed Analysis Menurdquo
Snapshot view Is the idle time (upper left corner) at a reasonable value at all times for example around 10 or higher
Snapshot view The load average is a good indicator of the dimension of the bottleneck It describes the number of processes for each CPU that are in a wait queue before they are assigned to a free CPU As long as the average remains at one process for each available CPU the CPU resources are sufficient Once there is an average of around three processes for each available CPU there is a bottleneck at the CPU resources In connection with a high CPU usage a high value here can indicate that too many processes are active on the server In connection with a low CPU usage a high value here can indicate that the main memory is too small The processes are then waiting due to excessive paging
Detailed Analysis View TOP CPU Which thread uses up the highest amount of CPU Is it the J2EE Engine the work processes or the database
o There are different follow-up actions to be taken depending on the findings of the second check The first option is of course to simply increase the hardware This should be accompanied by a thorough sizing (for which SAP provides the Quicksizer in the Service Marketplace httpservicesapcomquicksizer )
o The second option is to identify the CPU-consuming threads and to think about a reduction of the load in this component For example if the J2EE Engine is the largest consumer then it is worth re-evaluating the number of concurrent mapping threads andor consumer queues as described in the previous chapters
o SAP Note 742395 - Analyzing High CPU Usage by the J2EE Engine provides a good entry point if the J2EE Engine consumes too much CPU
o If it is the work processes that consume a lot of CPU use transaction ST03N to figure out if it is the Integration Server or the Business Process Engine You can do that by looking at the CPU usage per user BPE uses the user WF-BATCH while the Integration Server uses the last user who activated a qRFC queue (typically PIAFUSER or PIAPPLUSER) Use the previous chapter to restrict these activities
92 Monitoring Memory and Paging Activity
As stated above paging is very critical for the Java stack since it influence the Java GC behavior directly
Therefore paging should be avoided in every case for a Java-based system
The OS tools are the most reliable for monitoring the paging activity on your system Transaction ST06 can
also be used to perform a snapshot analysis Take a look at the snapshot that is provided on the entry
screen
Snapshot view Is there enough physical memory available
Snapshot view Is there considerable paging Paging can have a negative influence on your J2EE Engine If it does this can be seen in long GC times as described in Chapter 661
93 Monitoring the Database
Monitoring database performance is a rather complex task and requires information to be gathered from a
variety of sources Only a basic set of indicators is given for the purpose of this guide A more detailed
SAP NETWEAVER 71 AND HIGHER PERFORMANCE CHECK GUIDE
92
analysis is required if these indicators point to a major performance problem in the database If assistance is
needed open a support message under the component BC-DB-ORA (or MSS SDB DB6 respectively)
931 Generic J2EE database monitoring in NWA
The next sections of this chapter will be mainly based on ABAP transactions to do a detailed analysis of the
database performanceThe NWA however offers possibilities to monitor the database performance for the
Java based tables This is especially helpful for Java only AEXPO or Non-Central AAEs In the NWA you
can use the ldquoOpen SQL Monitorrdquo in the Troubleshooting section of NWA The official documentation can be
found in the Online Help Monitoring DB via DBACOCKPIT transaction (ABAP based) is possible also for the
Java-only systems from SAP Solution Manager (DBA Cockpit must be configured in the Managed System
Setup)
It will be too much to outline all the available functionalities here Instead only a few key capabilities will be
demonstrated If you want to eg see the number of select update or insert statements in your system you
can use the ldquoTable Statistics Monitorrdquo It clearly shows you which tables in your system are accessed the
most frequently
To see the processing time of the different statements on your system you can use the ldquoOpen SQL statisticsrdquo
monitor There you can see the count the total average and max processing time of the individual SQL
SAP NETWEAVER 71 AND HIGHER PERFORMANCE CHECK GUIDE
93
statements and can therefore identify the expensive statements on your system
Per default the recorded period is always from the last restart of the system If you would like to just look at
the statistics for a specific time period (eg during a test) you have the option of resetting the statistics in the
individual monitor prior to the test
932 Monitoring Database (Oracle)
Procedure
Log on to your Integration Server and call transaction ST04
SAP NETWEAVER 71 AND HIGHER PERFORMANCE CHECK GUIDE
94
Many of the numbers in the screenshot above depend on each other The following checklist names a few
key performance figures of your Oracle database
The data buffer quality for instance is based on the ratio of physical reads versus the total number of reads The lower the ratio the better the buffer quality The data buffer quality should be better than 94 the statistics should be based on 15 million total reads This number of reads ensures that the database is in an equilibrated state
Ratio of user and recursive calls A good performance is indicated by ratio values greater than 2 Otherwise the number of recursive calls compared to the number of user calls is too high Over time this ratio always declines because more and more SQL statements get parsed in the meantime
Number of reads for each user call If this value exceeds 30 blocks for each user call this indicates an expensive SQL statement
Check the value of TimeUser call Values larger than 15 ms often indicate an optimization issue
Compare busy wait time versus CPU time A ratio of 6040 generally indicates a well-tuned system Significantly higher values (for example 8020) indicate room for improvement
The DD-cache quality should be better than 80
933 Monitoring Database (MS SQL)
Procedure
To display the most important performance parameters of the database call Transaction ST04 or choose
Tools Administration Monitor Performance Database Activity An analysis is only meaningful if
the database has been running for several hours with a typical workload To ensure a significant database
SAP NETWEAVER 71 AND HIGHER PERFORMANCE CHECK GUIDE
95
workload we recommend a minimum of 500 CPU busy seconds Note The default values displayed in
section Server Engine are relative values To display the absolute values press button Absolute values
Check the values in (1)
The cache hit ratio (2) which is the main performance indicator for the data cache shows the
average percentage of requested data pages found in the cache This is the average value since startup The value should always be above 98 (even during heavy workload) If it is significantly below 98 the data cache could be too small To check the history of these values use Transaction ST04 and choose Detail Analysis Menu Performance Database A snapshot is collected every 2 hours
Memory setting (5) shows the memory allocation strategy used and shows the following
FIXED SQL Server has a constant amount of memory allocated which is set by SQL Server configuration parameters min server memory (MB) = max server memory (MB)
RANGE SQL Server dynamically allocates memory between min server memory (MB) lt gt max server memory (MB)
AUTO SQL Server dynamically allocates memory between 4 MB and 2 PB which is set by min server memory (MB) = 0 and max server memory (MB) = 2147483647
FIXED-AWE SQL Server has a constant amount of memory allocated which is set by min server memory (MB) = max server memory (MB) In addition the address windowing extension functionality of Windows 2000 is enabled
934 Monitoring Database (DB2)
Procedure
To get an overview of the overall buffer pool usage catalog and package cache information go to
transaction ST04 choose Performance Database section Buffer Pool (or section Cache respectively)
1 1
1 2
1 3
1 5
1 4
gt 6h
gt 98
SAP NETWEAVER 71 AND HIGHER PERFORMANCE CHECK GUIDE
96
Buffer Pools Number Number of buffer pools configured in this system
Buffer Pools Total Size The total size of all configured buffer pools in KB If more than one buffer pool is used choose Performance Buffer Pools to get the size and buffer quality for every single buffer pool
Overall buffer quality This represents the ratio of physical reads to logical reads of all buffer pools
Data hit ratio In addition to overall buffer quality you can use the data hit ratio to monitor the database (data logical reads - data physical reads) (data logical reads) 100
Index hit ratio In addition to overall buffer quality you can use the index hit ratio to monitor the database (index logical reads - index physical reads) (index logical reads) 100
Data or Index logical reads The total number of read requests for data or index pages that went through the buffer pool
Data or Index physical reads The total number of read requests that required IO to place data or index pages in the buffer pool
Data synchronous reads or writes Read or write requests performed by db2agents
SAP NETWEAVER 71 AND HIGHER PERFORMANCE CHECK GUIDE
97
Catalog cache size Maximum size of the catalog cache that is used to maintain the most frequently accessed sections of the catalog
Catalog cache quality Ratio of catalog entries (inserts) to reused catalog entries (lookups)
Catalog cache overflows Number of times that an insert in the catalog cache failed because the catalog cache was full (increase catalog cache size)
Package cache size Maximum size of the package cache that is used to maintain the most frequently accessed sections of the package
Package cache quality Ratio of package entries (inserts) to reused package entries (lookups)
Package cache overflows Number of times that an insert in the package cache failed because the package cache was full (increase package cache size)
935 Monitoring Database (MaxDB SAP DB)
Procedure
As with the other database types call transaction ST04 to display the most important performance
parameters
SAP NETWEAVER 71 AND HIGHER PERFORMANCE CHECK GUIDE
98
With the Database Performance Monitor (transaction ST04) and its submonitors the CCMS in the SAP R3
System allows you to view in the SAP R3 System all of the information that can be used to identify
bottleneck situations
The SQL Statements section provides information about the number of SQL statements executed and related sizes
The IO Activity section lists physical and logical read and write accesses to the database
The Lock Activity section (in transaction ST04) allows you to identify possible bottlenecks in the assignment of locks by the database
The Logging Activity section combines information about the log area
The Scan and sort activity section can be helpful in identifying that suitable indexes are missing
The Cache Activity section provides information about the usage of the caches and the associated hit rates
o The data cache Hit rate should be 99 in a balanced system If this is not the case you need to check if the low hit rate is due to the size of the data cache being too small or due to an unsuitable SQL statement If necessary you can increase the data cache by increasing the MaxDB parameter Data_Cache_Size (lower than 74) or Cache_Size (74 or higher)
o The catalog cache hit rate should be 85 in a balanced system It is not a cause for concern if the catalog hit rate is temporarily lower since accesses to the system tables and an active command monitor can temporarily impair the hit rate If the catalog cache is busy the pages are paged out in the data cache rather than on the hard disk
o Log entries are not written directly to the log volume but first into a buffer (LOG_IO_QUEUE) so as to be able to write several log entries together asynchronously with one IO on the hard disk Only once a LOG_IO_QUEUE page is full is it written to the hard disk However there are situations in which you need to write LOG entries from the LOG_QUEUE onto the hard disk as quickly as possible for example if transactions are completed (COMMITROLLBACK) The transactions wait until the log writer reports the OK informing them that the log entry is on the hard disk Firstly this means that is important to use the quickest possible hard disks for the log volume(s) and secondly you must ensure that no LOG_QUEUE_OVERFLOWS occur in production operation If the LOG_IO_QUEUE is full then all transactions that want to write LOG entries must wait until free memory becomes available again in the LOG_IO_QUEUE At LOG_QUEUE_OVERFOLWS (Transaction DB50 -gt Current Status -gt Activities Overview -gt LOG_IO_QUEUE Overflow) you need to increase the LOG_IO_QUEUE parameter
SAP NETWEAVER 71 AND HIGHER PERFORMANCE CHECK GUIDE
99
o In accordance with Note 819324 - FAQ MaxDB SQL optimization check which SQL statements are responsible for the most disk accesses and whether they can be optimized You should also optimize SQL statements that have a poor runtime and poor selectivity
Bottleneck Analysis
The Bottleneck Analysis function is available in transaction ST04 under the Problem Analyzes
Performance Database Analyzer Bottlenecks You can use this function to activate the corresponding
analysis tool dbanalyzer
The dbanalyzer then collects important performance data every 15 minutes and evaluates this for possible
bottlenecks
The result of the bottleneck analysis is output in text format to provide a quick overview of possible causes of
performance problems For a more detailed description of the bottleneck messages see the online
documentation (httphelpsapcom) in the SAP Web Application Server area and search for SAP DB
bottleneck analysis messages
The dbanalyzer tool can also be started at operating system level It logs its analysis results in files with date
stamps in the subdirectory ltrundirectorygtanalyzer (you can find the actual directory by double-clicking on
lsquoPropertiesrsquo in DB50) of the relevant database instance
94 Monitoring Database Tables
Some of the tables of SAP PI grow very quickly and can cause severe performance problems if archiving or
deletion does not take place frequently For troubleshooting see SAP Note 872388 ndash Troubleshooting
Archiving and Deletion in PI
Procedure
Log on to your Integration Server and call transaction SE16 Enter the table names as listed below and execute In the following screen simply press the button ldquoNumber of Entriesrdquo The most important tables are SXMSPMAST (cleaned up by XML message archivingdeletion)
If you use the switch procedure you have to check SXMSPMAST2 as well
SXMSCLUR SXMSCLUP (cleaned up by XML message archivingdeletion)
If you use the switch procedure you have to check SXMSPCLUR2 and SXMSCLUP2 as well
SAP NETWEAVER 71 AND HIGHER PERFORMANCE CHECK GUIDE
100
SXMSPHIST (cleaned up by the deletion of history entries)
If you use the switch procedure you have to check SXMSPHIST2 as well
SXMSPFRAWH and SXMSPFRAWD (cleaned up by the performance jobs see SAP Note 820622 ndash Standard Jobs for XI Performance Monitoring)
SWFRXI (cleaned up by specific jobs see SAP Note 874708 - BPE HT Deleting Message Persistence Data in SWFRXI)
SWWWIHEAD (cleaned up by work item archivingdeletion)
Use an appropriate database tool for example SQLPLUS for Oracle for the database tables of the J2EE schema Main tables that could be affected of growth
PI Message tables BC_MSG and BC_MSG_AUDIT (when audit log persistence is enabled)
PI message logging information when stagingloging is used BC_MSG_LOG_VERSION
XI IDoc tables (if IDoc persistence is activated) XI_IDOC_IN_MSG and XI_IDCO_OUT_MSG
Check for all tables if the number of entries is reasonably small or remains roughly constant over a period of time If that is not the case check your archivingdeletion setup
SAP NETWEAVER 71 AND HIGHER PERFORMANCE CHECK GUIDE
101
10 TRACES LOGS AND MONITORING DECREASING PERFORMANCE
101 Integration Engine
There are three important locations for the configuration of tracing logging in the Integration Engine The
pipeline settings of PI itself the Internet Communication Manager (ICM) and the gateway All three are
heavily involved in message processing and therefore their tracing or logging settings can have an impact on
performance On top of this you might have changed the SM59 RFC destinations and have switched on the
trace in order to analyze a problem If so then this needs to be reset as well
Procedure
Start transaction SXMB_ADM and navigate to Integration Engine Configuration Specific Configuration and search for the following entries
Category Parameter Subparameter Current Value Default
RUNTIME TRACE_LEVEL ltnonegt ltyour valuegt 1
RUNTIME LOGGING ltnonegt ltyour valuegt 0
RUNTIME LOGGING_SYNC ltnonegt ltyour valuegt 0
Set the above parameters back to the default value which is the recommended value by SAP
Start transaction SMICM and check the value of the Trace Level that is displayed in the overview
(third line) Set the trace level to lsquo1rsquo if not already the case You can do so by navigating to Goto Trace Level Set
Start transaction SMGW navigate to Goto Parameters Display and check the parameter Trace Level Set the trace level to lsquo1rsquo if not already the case You can do so by navigating to Goto Trace Gateway Reduce Level (or Increase Level respectively)
Start transaction SM59 and search the following RFC destination for the flag ldquoTracerdquo on the tab Special Options and remove the Flag ldquoTracerdquo if it has been set
AI_RUNTIME_JCOSERVER
AI_DIRECTORY_JCOSERVER
LCRSAPRFC
SAPSLDAPI It is possible that other RFC destinations are used for sending out IDocs and similar
SAP NETWEAVER 71 AND HIGHER PERFORMANCE CHECK GUIDE
102
102 Business Process Engine
You only have to check the Event Trace in the Business Process Engine
Procedure
Call transaction SWELS and check if the Event Trace is switched on The recommended setting is lsquooffrsquo (as shown in the screenshot below)
103 Adapter Framework
Since the Adapter Framework runs on the J2EE Engine the tracing and logging can be conveniently
checked and controlled using NetWeaver Administrator To improve the performance SAP recommends that
you set all trace levels to default Higher trace levels are only acceptable in productive usage during problem
analysis Below you will find a description on how to set the default trace level for all locations at once It is of
possible to do it for every location separately but this way you might forget to reset one of the locations
Procedure
Start the NetWeaver Administrator and navigate to Problem Management (or Troubleshooting in NW 73 and higher) Logs and Traces and choose Log Configuration In the Show drop down list box choose Tracing Locations Select the Root Location in the tree and press the button Default Configuration This will set the default configuration for all locations
Start the NetWeaver Administrator and navigate to Troubleshooting Logviewer (direct link nwalinks) Open the View ldquoDeveloper Tracerdquo and check if you have very frequent reoccurring exceptions that fill up the trace Analyze the exception and check what is causing this (eg a wrong configuration of a Communication Channel causing repeated traces If you see very frequent errors for which you cannot find the root cause open a customer incident at SAP
SAP NETWEAVER 71 AND HIGHER PERFORMANCE CHECK GUIDE
103
An aggregated view of Java exceptions (by number date instance server node etc) are reported and available in SAP Solution Manager Root Cause Analysis Exception Analysis functionality
1031 Persistence of Audit Log information in PI 710 and higher
With SAP NetWeaver PI 71 the audit log is not persisted for successful messages in the database by default
to avoid performance overhead Therefore the audit log is only available in the cache for a limited period of
time (based on the overall message volume)
Audit log persistence can be activated temporarily for performance troubleshooting where audit log
information is required To do so use the NWA and change the parameter
ldquomessagingauditLogmemoryCacherdquo to false in service XPI Service Messaging System by setting the
parameter to false Details can be found in SAP Note 1314974 - PI 71 AF Messaging System audit log
persistence Only do so temporarily during the time of troubleshooting to avoid any performance problems
from the additional persistence
After implementing Note 1611347 - New data columns in Message Monitoring additional information like
message processing time in ms and server node is visible in the message monitor
SAP NETWEAVER 71 AND HIGHER PERFORMANCE CHECK GUIDE
104
11 ERRORS AS SOURCE OF PERFORMANCE PROBLEMS
If errors occur within messages or within technical components of the SAP Process Integration then this can
have a severe impact on the overall performance Thus to solve performance problems it is sometimes
necessary to analyze the log files of technical components and to search for messages with errors To
search for messages with errors use the PI Admin Check which is available using SAP Note 884865 - PIXI
Admin Check
Procedure
ICM (Internet Communication Manager)
Start transaction SMICM open the log file (Shift + F5 or GoTo Trace File Show All) and check for errors
Gateway
Start transaction SMGW open the Log File (CTRL + Shift + F10 or Goto Trace Gateway Display File) and check for errors
System Log
Start transaction SM21 choose an appropriate time interval and search the log entries for errors Repeat the procedure for remote systems if you are using dialog instances
ABAP Runtime Errors
Start transaction ST22 choose an appropriate time interval and search for PI-related dumps In general the number of ABAP dumps should be very small on a PI system and therefore all occurring dumps should be analyzed
Alerts CCMS
Start transaction RZ20 and search for recent alerts
Work Process and RFC trace
In the PI work directory check all files which begin with dev_rfc or dev_w for errors
J2EE Engine
In the PI work directory search for errors in file dev_server0out If you are using more than one J2EE server node check dev_serverltngtout as well
Applications running on the J2EE Engine
The traces for application-related errors are the defaulttrc files located in j2eeclusterserverltngtlog directory To monitor exceptions across multiple server nodes the best tool to use is the LogViewer service of the NWA This is available via Problem Management Logs and Traces and choose Log Viewer Search for exceptions in the area of the performance problem for example the PI Messaging system
SAP NETWEAVER 71 AND HIGHER PERFORMANCE CHECK GUIDE
105
APPENDIX A
A1 Wily Introscope Transaction Trace
As mentioned above the Wily Transaction trace can be used to trace expensive steps that were noticed
during the mapping or module processing The transaction trace will allow you to drill down further into Java
performance problems and to distinguish if it is a pure coding problem or caused by a look-up to a remote
system or a slow connection to the local database
The Wily Transaction trace can be used to trace all steps that exceed a specific duration on the Java stack If
a user is known (for example for SAP Enterprise Portal) the tracing can be restricted to a specific user In PI
if you encounter a module that lasts several seconds then you can restrict the tracing as shown below
Note Starting the Transaction Trace increases the data collection on the satellite system (PI) and is
therefore only recommended in productive environment for troubleshooting purposes
With the selection above the trace will run for 10 minutes (this is the maximum and it can be canceled earlier)
and will trace all steps exceeding 3 seconds for the agents of the PI system If such long-running steps are
found then a new window will be displayed listing these steps
In the screenshot below you can see the result in the Trace View The Trace View shows the elapsed time
from left to rightndash in the example below around 48 seconds From top to bottom we can see the call stack of
the thread In general we are interested in long-running threads on the bottom of the trace view A long-
running block at the bottom means that this is the lowest level coding that was instrumented and which is
consuming all the time
In the example below we see a mapping call that is performing many individual database statements ndash this
will become visible by highlighting the lowest level In such a case you have to review the coding of the
mapping to see if the high amount of database calls can be summarized in one call
SAP NETWEAVER 71 AND HIGHER PERFORMANCE CHECK GUIDE
106
Another case that is often seen is that a lookup using JDBC to a remote database or RFC to an ABAP
system takes a long time in the mapping or adapter module In such a case there will be one long block at
the bottom of the transaction trace that also gives you some details about the statement that was executed
A2 XPI inspector for troubleshooting and performance analysis
The XPI Inspector is an additional tool that provides enhanced logging and tracing capabilities with a main
focus on troubleshooting But the tool can also be used for troubleshooting of performance issues
General information about the tool can be found at Note 1514898 - XPI Inspector for troubleshooting PI The
tool can be called using the following URL on your system httphostjava-portxpi_inspector
To analyze performance problems typically the example ldquo51 ndash ldquoPerformance Problem)rdquo is used As a basic
measurement it allows you to take multiple thread dumps in specific time intervals These thread dumps can
be analyzed later by your administrators or SAP support to identify what is causing the problem The Thread
Dump Viewer tool (TDV) from Note 1020246 - Thread Dump Viewer for SAP Java Engine can be used to
analyze the produced thread dumps (inside the results archive that can be downloaded to your local PC)
SAP NETWEAVER 71 AND HIGHER PERFORMANCE CHECK GUIDE
107
In addition the tool allows you to do JVM profiling be either doing JVM Performance tracing or JVM Memory
Allocation tracing This can help to understand in detail which steps of the processing are taking a long time
As output the tool provides prf files that can be loaded into the JVM Profiler More information can be found
at httpwikiscnsapcomwikidisplayASJAVAJava+Profiling Please Note that these traces (especially the
memory profiling) will cause a high overhead on the J2EE engine and are therefore not recommended to be
used in production Instead it is advisable to reproduce the problem on your QA system and use the tool
there
Document Version 30 March 2014
wwwsapcom
copy 2014 SAP AG All rights reserved
SAP R3 SAP NetWeaver Duet PartnerEdge ByDesign SAP
BusinessObjects Explorer StreamWork SAP HANA and other SAP
products and services mentioned herein as well as their respective
logos are trademarks or registered trademarks of SAP AG in Germany
and other countries
Business Objects and the Business Objects logo BusinessObjects
Crystal Reports Crystal Decisions Web Intelligence Xcelsius and
other Business Objects products and services mentioned herein as
well as their respective logos are trademarks or registered trademarks
of Business Objects Software Ltd Business Objects is an SAP
company
Sybase and Adaptive Server iAnywhere Sybase 365 SQL
Anywhere and other Sybase products and services mentioned herein
as well as their respective logos are trademarks or registered
trademarks of Sybase Inc Sybase is an SAP company
Crossgate mgic EDDY B2B 360deg and B2B 360deg Services are
registered trademarks of Crossgate AG in Germany and other
countries Crossgate is an SAP company
All other product and service names mentioned are the trademarks of
their respective companies Data contained in this document serves
informational purposes only National product specifications may vary
These materials are subject to change without notice These materials
are provided by SAP AG and its affiliated companies (SAP Group)
for informational purposes only without representation or warranty of
any kind and SAP Group shall not be liable for errors or omissions
with respect to the materials The only warranties for SAP Group
products and services are those that are set forth in the express
warranty statements accompanying such products and services if
any Nothing herein should be construed as constituting an additional
warranty
wwwsapcom