Embed Size (px)
Citation preview

TransformationAnnual Report 2007
Inside:Progress made on the growth strategy in 2007 3Gladstone LNG set to transform Santos 14Changing dynamics in the eastern Australia gas market 16Sustainability leadership gives a perceptible advantage 24

on
14 16
Eastern Australia gasVersatility throughsupply hubs
LNG projectsLarge contingentresources
InsideIntroducing SantosCompany profile and history, and an overview
of Santos’ vision, strategy and values.
2007 operating and financial highlights 2Key results for 2007 and three-year
performance.
Progress made on the growth strategy in 2007 3Milestones that delivered on the growth strategy
during 2007 and share price performance.
Solid performance with exciting outlook 4Chairman Stephen Gerlach comments on
Santos’ performance in 2007.
Entering a period of transformation throughsignificant price and volume growth 5Managing Director John Ellice-Flint reviews
a year where Santos put in place some critical
pieces of its growth strategy.
A sound operating performance 8Chief Financial Officer Peter Wasow puts the
numbers in perspective and explains the 2007
financial results.
Major announcements made by Santos during 2007 9Summary of how the year was reported
through continuous disclosure.
Our five strategicgrowth areas
The world of Santos 10
Locations of Santos’ global exploration,
development and production activities.
Production statistics 2007 12
Summary of production results for 2007.
Reserves statistics 2007 13
Summary of reserves movements in 2007.
LNG projects 14
Santos’ transformational Gladstone LNG
project and progress on Darwin LNG and
PNG LNG.
Eastern Australia gas 16
New contracts and the changing eastern
Australia gas market which is providing
export opportunities.
Cooper Basin oil 18
Drilling and production results from the
Cooper Basin Oil project in 2007 and change
of focus for 2008.
Western Australia oil and gas 20
Rising gas demand and prices, progress on
the Reindeer development, and Mutineer-
Exeter oil production.
Asian growth 22
Start-up of Oyong oil production,
progress in Vietnam, and new entry
into India and Bangladesh.
Sustainability 24
Sustainability framework, policies,
systems and activities, including safety
and environmental performance,
employees and communities.
Board of Directors 32
Santos Leadership Team 34
Corporate governance 36
Santos Group interests 46
10-year summary 1998–2007 48
Directors’ Statutory Report 51
Remuneration Report 56
Financial Report 70
Securities exchange and shareholderinformation 152
Glossary 154
Information for shareholders 156
Index 157
Corporate directory

Strategic gains in 2007 signal an exciting period oftransformation for Santosfrom a leading domestic oil and gas producer to a majorexporter of LNG.
1
20 2218
Cooper Basin oilUnique infrastructureand know-how
Western Australia oil and gasGrowth at higher prices
Asian growthGrowing internationalprofile

Santosis a major Australian-basedoil and gas exploration and production company operating internationally.
CompanyprofileSantos has exploration interests
or production operations in every
major Australian petroleum
province and in Indonesia,
Papua New Guinea, Vietnam, India,
Bangladesh, Kyrgyzstan and Egypt.
We are Australia’s largest domestic
gas producer, supplying sales gas
to all mainland Australian states
and territories, ethane to Sydney,
and oil and liquids to domestic
and international customers.
Through our interest in the Darwin
LNG project, we are a producer of
liquefied natural gas (LNG) which
is exported to customers in Japan.
Santos has more than 1,750
employees and produced 59.1
million barrels of oil equivalent
(mmboe) in 2007.
Santos has the largest Australian
exploration and production
portfolio by area of any company –
192,000 square kilometres –
and is pursuing new venture
opportunities in Asia.
HistoryFounded in 1954, our name was
an acronym for South Australia
Northern Territory Oil Search.
Santos made its first significant
discovery of natural gas in the
Cooper Basin in 1963. The Moomba
discovery in 1966 confirmed this
region as a major petroleum
province and gas supplies to
Adelaide commenced in 1969.
The 1980s saw Santos develop a
major liquids business with the
construction of a liquids recovery
plant at Moomba and a fractionation
and load-out facility at Port
Bonython. During the 1990s Santos
further expanded its interests in
Australia and overseas.
Since 2000 the Company has
continued to build its business in
South East Asia while undertaking
high-impact exploration and
developing new projects to drive
production and earnings growth.
In 2006, a significant milestone was
reached with the first export of LNG
from the Darwin LNG project.
Premium WilCraft jack-up rig being transported to the Carnarvon Basin, offshore Western Australia,for exploration drilling.

VisionSantos’ vision is to become a
leading energy company in South
East Asia with a share price that
continues to grow and a reputation
for sustainability in its operations.
Our vision of future success is to
be a safe, low-cost, fast-moving
explorer and producer and an agile
niche player with a well-developed
ability to manage relationships with
employees, partners and other
stakeholders.
As the Company grows, it will
provide a working environment that
encourages innovation across the
business and where employees are
engaged in something which is
tangibly more than just a job.
StrategySantos has in place a robust
growth strategy to achieve its
vision through a portfolio of
growth businesses:
• LNG projects;
• Eastern Australia gas;
• Cooper Basin oil;
• Western Australia oil
and gas; and
• Asian growth.
ValuesWe are a team that:
• discovers – by opening our
minds to new possibilities,
thinking creatively and having
the courage to learn from
successes and failures, to
take on new challenges,
to capture opportunities
and to resolve problems;
• delivers – by taking personal
responsibility and pride in our
work to deliver timely, quality
results that benefit Santos
and help achieve our vision
and strategy;
• collaborates – by recognising
the value and power in diversity
of thought and communicating
openly to understand the
perspectives of others;
demonstrating leadership
by sharing what we know
and respectfully challenging
each other to achieve the
best results for all; and
• cares – by taking the long-term
view to build a sustainable future
for our Company, our people
and the environments and
communities in which we operate.

2
Santos Annual Report 2007
2007 operating and financial highlights
• Production of 59.1 mmboe and sales revenue of $2.5 billion, in line with forecast.
• EBITDAX of $1,733 million.
• Net profit after tax of $441 million, down 32%,negatively impacted by higher depreciation anddepletion, and one-off items.
• Full-year dividend unchanged at 40 cents per share.
• Strong 2007 reserves replacement ratio of 175%(Proven) and 178% (Proven plus Probable).
• Contingent resources increased 15% to 2.6 billion boe.
%2007 2006 change
Sales ($million) 2,488.5 2,750.3 (10)
Operating profit before tax ($million) 601.0 964.7 (38)
Cash flow from operations ($million) 1,213.9 1,550.3 (22)
Earnings per share (cents) 68.9 102.8 (33)
Ordinary dividends per share (cents) 40.0 40.0 0
Cash flow per share (cents) 205.6 260.0 (21)
Total shareholders’ funds ($million) 3,310.5 3,355.5 (1)
Return on average ordinary equity (%) 15.2 23.8 (36)
Return on average capital employed (%) 10.4 15.1 (31)
Net debt/(net debt plus equity) (%) 36.4 30.2 21
Net interest cover (times) 6.4 10.1 (37)
3
Santos Annual Report 2007
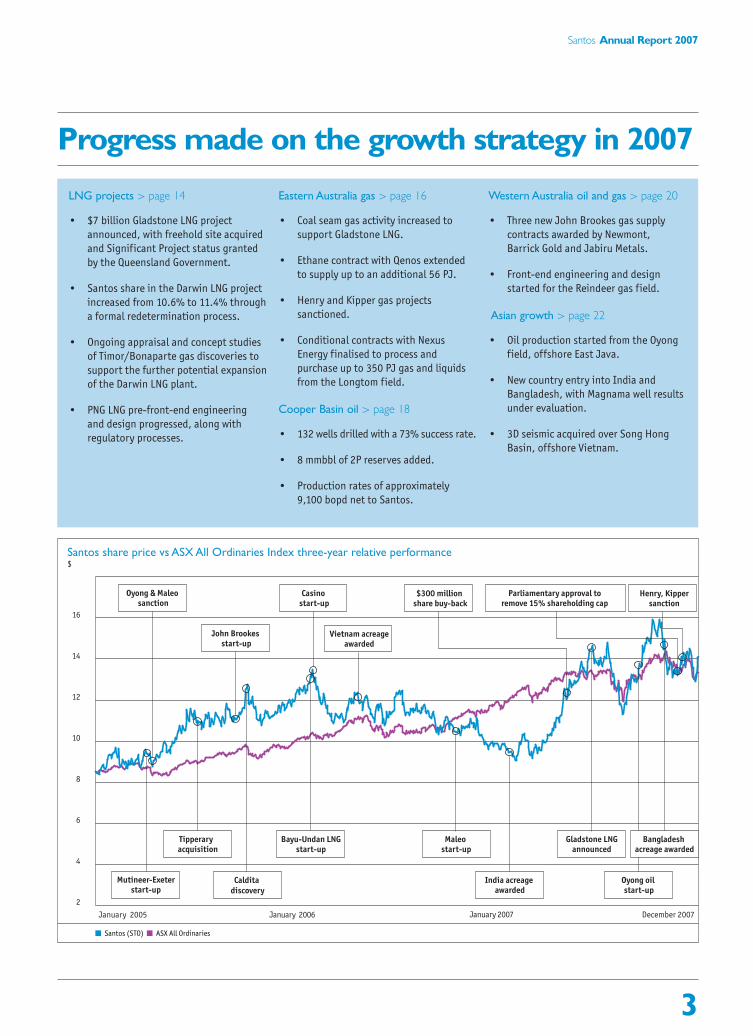
Progress made on the growth strategy in 2007
Santos share price vs ASX All Ordinaries Index three-year relative performance $
Santos (STO) ASX All Ordinaries
2
4
6
8
10
12
14
16
January 2005 January 2006 January 2007 December 2007
Tipperary acquisition
Bayu-Undan LNGstart-up
Maleo start-up
John Brookes start-up
Oyong & Maleo sanction
Casino start-up
Parliamentary approval to remove 15% shareholding cap
Mutineer-Exeterstart-up
Caldita discovery
Oyong oil start-up
Bangladesh acreage awarded
Gladstone LNGannounced
India acreage awarded
Henry, Kippersanction
$300 million share buy-back
Vietnam acreageawarded
LNG projects > page 14
• $7 billion Gladstone LNG project
announced, with freehold site acquired
and Significant Project status granted
by the Queensland Government.
• Santos share in the Darwin LNG project
increased from 10.6% to 11.4% through
a formal redetermination process.
• Ongoing appraisal and concept studies
of Timor/Bonaparte gas discoveries to
support the further potential expansion
of the Darwin LNG plant.
• PNG LNG pre-front-end engineering
and design progressed, along with
regulatory processes.
Eastern Australia gas > page 16
• Coal seam gas activity increased to
support Gladstone LNG.
• Ethane contract with Qenos extended
to supply up to an additional 56 PJ.
• Henry and Kipper gas projects
sanctioned.
• Conditional contracts with Nexus
Energy finalised to process and
purchase up to 350 PJ gas and liquids
from the Longtom field.
Cooper Basin oil > page 18
• 132 wells drilled with a 73% success rate.
• 8 mmbbl of 2P reserves added.
• Production rates of approximately
9,100 bopd net to Santos.
Western Australia oil and gas > page 20
• Three new John Brookes gas supply
contracts awarded by Newmont,
Barrick Gold and Jabiru Metals.
• Front-end engineering and design
started for the Reindeer gas field.
Asian growth > page 22
• Oil production started from the Oyong
field, offshore East Java.
• New country entry into India and
Bangladesh, with Magnama well results
under evaluation.
• 3D seismic acquired over Song Hong
Basin, offshore Vietnam.

4
Santos Annual Report 2007
After record production and profits in 2006,
Santos produced another solid performance
in 2007.
Production was in line with guidance for
the third successive year at 59.1 mmboe,
although 3% lower than in 2006.
Net profit after tax of $441 million was 32%
lower than 2006, reflecting the decline in
higher margin oil production, the increasing
contribution of lower margin gas in our product
mix, rising industry costs leading to higher
depreciation and depletion charges, higher
taxes, and a strong dollar.
Share price performance
Against the backdrop of a volatile share
market, Santos was one of the best performing
stocks among leading Australian companies
in 2007, with a strong gain in the share price
and healthy dividends resulting in total
shareholder return of 48%.
Share market sentiment toward Santos
was influenced by several factors including
rising world energy prices, a realisation
that Santos was strategically poised to
be a major beneficiary of the removal of
the 15% shareholding restriction, and the
announcement of our intention to construct
a LNG plant at Gladstone in Queensland.
Dividend maintained
The Board of Directors declared a final dividend
of 20 cents per share. With the earlier interim
payment maintained at the same level,
shareholders received a full-year dividend of 40
cents per share – unchanged from 2006.
Pivotal year for strategy
For Santos, 2007 marked a pivotal year in
the implementation of our strategy to gain
exposure to global prices for our large-scale
resources, which we expect to transform the
Company through significant volume growth
and margin expansion.
It is now evident that sufficient coal seam
gas exists in eastern Australia for Santos to
develop a large-scale LNG export business.
The creation of this export channel will
underpin a fundamental shift in the value
of Santos’ eastern Australia gas resources
as the gap between Asian and domestic
energy prices closes.
Santos was the early mover in recognising
and capturing this opportunity, and has
positioned itself by amassing a large, high-
quality coal seam gas resource position and
by leading the development of an export
LNG project at Gladstone.
In Asia, Santos continued to build a portfolio
of growth opportunities in new markets
including Vietnam, India and Bangladesh, as
well as expanding our interests in Indonesia
and Papua New Guinea.
Off-market buy-back
Santos completed an off-market buy-back
tender for approximately $300 million of
ordinary shares in June 2007. The initiative
reflected our significant franking credit
balance and the Board’s view that the
Company’s shares were being undervalued
by the market.
Directors were delighted with the results of
the buy-back which saw us acquire 4.1% of
our issued capital at the maximum discount
of 14% to the prevailing market price.
Shareholding restriction to go
In November 2007, and at our request,
the South Australian Parliament repealed
the legislation which restricts any one
shareholder from having an entitlement
to more than 15% of Santos’ shares.
Believing the shareholder cap is no longer
relevant, the Board was extremely pleased
with this outcome, which takes effect on
29 November 2008. The cap’s removal will
mark an exciting new era for Santos as it
pursues its many growth initiatives.
Sidoarjo mudflow incident
While the mudflow from the Sidoarjo incident
in East Java continues, there were a number
of positive developments during 2007.
These include general containment of the mud
within the existing dyke system, establishment
of the Sidoarjo Mud Mitigation Agency,
continued active support and funding by the
Government of Indonesia for relief efforts and
infrastructure replacement, a reduction in the
number of refugees affected by the incident
and a recent decision by the South Jakata
District Court in respect of responsibility for
the incident, which was in favour of all
defendants, including Santos Brantas Pty Ltd.
At the Board table
The appointment of Mr Kenneth Borda in
February 2007 was the only change to the
Board of Directors during the year.
Mr Borda, 55, has extensive international
business experience and was formerly CEO –
Middle East and North Africa of Deutsche
Bank, based in Dubai.
On behalf of the Directors, I again thank
everyone at Santos for their continuing
commitment to protecting and advancing
the interests of shareholders.
Stephen GerlachChairman
13 March 2008
Solid performance with exciting outlook
Review byStephen GerlachChairman
5
Santos Annual Report 2007
Many critical pieces of Santos’ growth
strategy were put into place during 2007.
This strategy is all about gaining exposure
to global prices for our large-scale resources.
The international trends for the oil and gas
industry are becoming increasingly clear and
Santos is well positioned to capitalise on them.
Unprecedented global economic growth,
including the industrialisation and
urbanisation of China and India, will
continue for several decades as billions
of people aspire to a better way of life.
This growth is energy intensive and is causing
a step change in energy demand and pricing.
Where will this energy come from? In what
forms? Over what timeframe? These issues
are not yet resolved.
The world is increasingly reliant on less stable
areas for energy supplies. About 90% of new
primary energy production is projected to
come from transitioning and developing
economies, up from 60% in the previous
three decades.
In this regard, Australian energy supplies
are increasingly seen as lower risk.
The potential to substitute coal and nuclear
power for oil is limited by greenhouse
gas impacts, environmental regulations,
resource issues and voter opposition.
In this environment, natural gas is
increasingly becoming the fuel of choice.
To meet the growing levels of demand, the
oil and gas industry is investing heavily in
unconventional technologies. Oil sands, coal
seam gas and tight gas are rapidly becoming
the mainstream as higher oil and gas prices
render them economic.
Consistent with these trends, global demand
for LNG continues to expand. Asian demand
for LNG imports is predicted to grow by 85%
over the next five years, while LNG imports to
the United States increased by about 35% in
2007 alone to meet the shortfall in domestic
gas production.
LNG, which is marketed globally at prices
linked to oil, has seen recent contract prices
of more than four times the prevailing price
of gas in eastern Australia.
Strategy to meet growing energy demand
Santos’ strategy and portfolio fit these
trends. As Australia’s largest domestic gas
producer, Santos has the scale, expertise
and cash flow necessary to take our business
to the next level.
Specifically, we intend to:
• Provide reliable LNG exports and grow
our LNG portfolio to greater than 50%
of our total production by 2020, through
an industry-leading project at Gladstone
in Queensland, the expansion of Darwin
LNG, and Papua New Guinea’s first
LNG project.
• Maintain our leading position in
unconventional gas in Australia. Santos’
coal seam gas reserves in Queensland now
exceed our conventional gas reserves from
the Cooper Basin, in addition to the tight
gas potential in the Cooper Basin. Santos’
Gladstone LNG project will be the world’s
first large-scale project to convert
unconventional gas to LNG.
• Continue to build our business in Asia,
with our recent entry into Vietnam, India
and Bangladesh adding to our position in
Indonesia and Papua New Guinea.
At a time when exploration and production
companies are finding reserves difficult to
replace and growth hard to achieve, Santos
has built a portfolio which can quadruple the
size of its reserves base in the next decade
from already captured opportunities.
The next few years promise to be exciting
for our shareholders, employees, customers
and partners as we realise our vision to be
a leading energy company in Asia.
Safety improved
Santos improved safety during 2007 by
successfully implementing new standards
on process safety and achieving a reduction
in the rate of injuries to employees and
contractors.
Injury rate as measured by total recordable
case frequency rate fell by 17% to 5.3 in
2007. This performance improvement in
2007 was an excellent achievement and a
reflection of the hard work put in by many
people across the Company.
Our safety systems and performance were
recognised during 2007, with Santos winning
four of the six categories at the Self Insurers
of South Australia safety awards and two
awards at the Safe Work SA awards, including
Employer of the Year.
Entering a period oftransformation throughsignificant price and volume growth
Review byJohn Ellice-FlintManaging Director

6
Santos Annual Report 2007
Santos has an extensive work program
planned for 2008 and is projecting a record
number of work-hours for employees and
contractors. We are challenging the
organisation to target its best total
recordable case frequency rate performance
with a target of less than 4.8 in 2008, that is
4.8 injuries for every million hours worked.
Solid operational performance
Santos’ operating performance in 2007 was
sound and, while our production volumes
were down, they were in line with our
guidance. The lower profit reflects these
lower volumes, industry cost pressures which
are impacting expected future development
costs, and higher taxes.
Earnings before interest, tax, depreciation,
depletion, exploration and impairment
expenses of $1.7 billion were 19% lower
than in 2006.
Net profit after tax of $441 million was
adversely affected by the cost factors being
felt across the industry.
Our average gas price received increased by
6% to $3.95 per gigajoule. A 19% increase in
the United States dollar oil price was offset
by the stronger Australian dollar exchange
rate. In Australian dollar terms, the oil price
of $92.10 was 3% above 2006.
Reserves grow strongly, at low cost
Santos is entering a period of unprecedented
reserve growth from discovered resources,
much of which the Company has captured
early and at low cost.
Our contingent resource base, which
has grown to 2.6 billion boe, or roughly
15 trillion cubic feet of gas, is mostly
pointed at LNG opportunities.
Santos’ Proven plus Probable (2P)
year-end reserves increased to 879 mmboe,
representing a reserve replacement ratio
of 178% for 2007 and a three-year rolling
average of 234%. This places us within the
top quartile of our peer companies globally.
The rate of replacement is only half the story.
The cost of replacement is perhaps even more
important. Over the past four years, we have
been able to reduce the cost of a replacement
barrel to around $13, from about $17 in 2004.
Our reserves and production leadership
provide the opportunity for step changes
in both the price and volume of sales we
can deliver into Asian markets.
Gladstone LNG the inflection point
Santos’ traditional focus has been on
the domestic Australian market, where
we are the largest gas producer. Our
strategy for the future is to sell our
products in Asia at higher prices, where
demand is growing strongly.
Coal seam gas is the driver of this
transformational strategy and Gladstone
LNG is critical to this process. It creates
a value uplift point by directing our coal
seam gas into LNG export markets.
The substantial price difference between
eastern Australia and South East Asia gas
prices is unsustainable, especially as demand
in both markets is rapidly increasing and there
is now sufficient gas to make export viable.
Santos is clearly not the only company to
recognise the potential of exporting coal
seam gas but does have the leading position
among potential east coast LNG producers.
We have a large and growing reserves base,
a freehold site to build the LNG plant and
our proposal has been designated a
Significant Project by the Queensland
Government – the only proposed LNG
project to have this status.
United States business divested
Santos finalised the sale of its United
States business in July 2007, entering into
agreements to sell these exploration and
production interests for approximately
US$70 million.
The decision to sell the United States
business was part of Santos’ broader
strategy of focusing our international
business in Asia: the region where our
geologic knowledge, experience and
networks are strongest and where energy
demand is growing faster than anywhere
else in the world.
Sustainability leadership an advantage
Santos has placed sustainability at
the forefront of all corporate activity for
many years and has been a leader among
major Australian companies in arguing for
immediate and meaningful action to combat
climate change.
In 2007 our leadership in this area was evident.
We were a founding member of the Australian
Business & Climate Group, which comprised
nine leading companies from the resource,
energy, infrastructure and finance industries.
The group published a report recommending
the development of a national climate change
response to address five main elements:
global action, emissions trading, complementary
measures, low emissions technology strategy
and an adaptation strategy.
0
200
400
600
800
1P 2P
Proven plus Probable reservesmmboe
Reserve replacement cost
20052004 2006 2007
$
643
774819
879
0
4
8
12
16
Review by John Ellice-Flint,Managing Director (continued)
Santos has achieved a three-year rolling average2P reserve replacement ratio of 234% andreduced replacement cost to approximately $13 per barrel.

7
Santos Annual Report 2007
Santos also won the Australian Petroleum
Production and Exploration Association’s
Environment Award. This award recognised
our five-year partnership with university
researchers which has provided a valuable
insight into how offshore exploration and
whales can coexist.
We are also very proud of our new Santos
Centre in Adelaide which exemplifies
sustainable building design.
Moomba Carbon Storage progressed
Another confirmation of our commitment
to environmental sustainability was Santos’
continuing efforts to build public policy
support for carbon geosequestration
generally, and the Moomba Carbon Storage
project in particular.
The extensive gas processing, storage and
transport infrastructure of eastern Australia
has the potential to play a critical role in
Australia’s response to climate change.
Since 2006, Santos has been incubating
Moomba Carbon Storage – a project that
would transform Moomba from an iconic
piece of Australia’s energy infrastructure
into a practical and world-leading climate
change facility supporting clean energy
throughout eastern Australia.
Santos is continuing to discuss the project
with a range of stakeholders, including federal
and state governments, and relevant industry
participants, including power generators,
pipeliners and infrastructure funds.
Outlook for unprecedented growth
Santos has a rich suite of LNG opportunities,
from new projects in Papua New Guinea and
Gladstone, to expansions at Darwin and
exploration opportunities in the Browse
Basin and Indonesia.
Developing these resources, and the export
facilities necessary to monetise them, creates
a new set of quality investments for Santos.
The richness of our emerging developments
is a distinguishing characteristic as we move
into the last part of this decade.
In the immediate term, the production
outlook for 2008 is for 56–58 mmboe,
marginally down on 2007.
Volume gains from attractive development
projects, such as Henry and Kipper in
Victoria, Reindeer in Western Australia and
Chim Sao in Vietnam, will arrest this decline
as we build momentum toward a step change
in cash flow growth.
We look forward to a return to production
growth in 2009.
There will be a steady flow of important
milestones that will act as catalysts for the
Company as our growth prospects mature.
Over the longer term, no other company has
the breadth of resources potential, nor is
better placed to develop them, than Santos.
John Ellice-FlintManaging Director
13 March 2008
‘Santos has built a portfolio which can quadruplethe size of its reserves base in the next decadefrom already captured opportunities.’
Santos Centre: the knowledge base
Designed with a long-term horizon,
Santos’ new head office is an innovative
blend of people-friendly workspaces
and leading edge technology.
It incorporates the Company’s
strong commitment to sustainability
and the health and wellbeing of
Santos’ employees.

8
Santos Annual Report 2007
A sound operatingperformance
Review byPeter WasowChief Financial Officer
Production and sales
Total sales revenue for the 12 months to
31 December 2007 was $2,489 million,
down 10% on the record $2,750 million
achieved in 2006.
The lower revenue reflects a 3% decline in
production volumes of 59.1 mmboe and a
15% appreciation in the Australian–US dollar
exchange rate, partially offset by higher
commodity prices.
Product prices increased
Higher commodity prices were evident across
Santos’ portfolio, with the average gas price
increasing by 6% to $3.95 per gigajoule.
A 19% increase in the US dollar oil price
was offset by the stronger Australian dollar
exchange rate. In Australian dollar terms,
the oil price of $92.10 was 3% above that
of 2006.
Production costs and netback
Unit production costs of $7.59/boe were
18% higher than in 2006, reflecting the
start of production from Oyong, and Maleo
and Darwin LNG producing for the full year.
In addition, cost increases primarily
resulted from industry cost pressures,
increased trucking costs relating to the
Moonie to Brisbane pipeline failure and
higher Bayu-Undan costs resulting from
the total plant and pipeline shutdown.
The cash margin per boe sold, or netback,
of $30.80 per boe was 6% lower than in 2006,
reflecting the higher production costs, higher
amounts of Petroleum Resources Rent Tax and
the commencement of Additional Profits Tax
for the Bayu-Undan field.
Depreciation and depletion
Depreciation and depletion expense
of $12.84/boe was 13% higher than
2006 as the benefits of reserves additions
were outweighed by higher future
development costs.
The expense also reflected a full year of
production from Casino, Darwin LNG and
Maleo, the start-up of Oyong production and
the acquisition of Santos’ Bangladesh interest.
Net profit after tax
Net profit after income tax decreased
by $203 million to $441 million and
earnings per share decreased by 33%
to 68.9 cents.
Cash flow and balance sheet
Operating cash flow remained strong at
$1,214 million, although 22% below 2006,
as a result of decreased sales volumes and
increased payments for royalties, excise,
Petroleum Resources Rent Tax and income
taxes, partly offset by higher product prices
and lower payments to suppliers.
Net debt of $1,896 million was $446
million higher than at the end of 2006,
primarily as a result of the $300 million
share buy-back undertaken during the year,
acquisition activity and capital expenditure.
Santos’ net debt/net debt plus equity ratio
increased from 30.2% in 2006 to 36.4% at
the end of 2007.

9
Santos Annual Report 2007
Major announcementsmade by Santos during 2007
22 Jan New $90 million Newmont gas supply contract awarded
23 Jan Santos CSG supplementary bidders statement and extension of offer
24 Jan 2006 Fourth Quarter Activities Report
30 Jan Santos proposes new superior transaction with QGC
9 Feb Caldita-2 drilling update
12 Feb Indian exploration acreage awarded
15 Feb Santos submits formal ‘superior’ offer to QGC Board
15 Feb New General Counsel and Company Secretary appointed
15 Feb International banker appointed to Board
21 Feb Santos confirms it will not proceed with offer for QGC
22 Feb 2006 Full Year Results: underlying net profit a record $683 million, up 7%
23 Feb Managing Director remuneration arrangements
29 Mar 2006 Annual Report, Sustainability Report and Notice of Meeting released
11 Apr Commencement of PNG LNG pre-front-end engineering study
24 Apr 2007 First Quarter Activities Report
26 Apr Longtom contract finalised
1 May South Australian Government review of 15% shareholding cap
1 May 2007 Annual General Meeting
14 May $300 million off-market buy-back announced
15 May Cooper Basin ethane contract with Qenos extended
31 May Off-market buy-back booklet released
14 Jun Moomba Carbon Storage demonstration project
15 Jun Santos lodges submission to South Australian Government shareholding cap review
30 Jun Off-market buy-back successfully completed
03 Jul New Executive Vice President Growth Businesses appointed
16 Jul Santos sells its United States interests
18 Jul Multi-billion dollar Gladstone LNG project proposed
26 Jul 2007 Second Quarter Activities Report
30 Jul Santos interest in Bayu-Undan development increased
30 Jul Moonie to Brisbane pipeline incident
14 Aug Commencement of front-end engineering and design for Reindeer field
23 Aug 2007 Interim Results: underlying net profit after tax of $305 million
11 Sep Santos discussions with South Australian Government regarding 15% shareholding cap
24 Sep First oil from Oyong development
16 Oct South Australian Government decision to remove Santos 15% shareholding cap
25 Oct 2007 Third Quarter Activities Report
26 Oct Santos acquires interests in Bangladesh
30 Oct Mutineer-13 drilling result
22 Nov South Australian Parliamentary approval of 15% shareholding cap removal
28 Nov Henry gas project sanctioned
19 Dec Kipper gas project sanctioned
24 Dec Mutineer-Exeter production update
28 Dec Indonesian court decision regarding Banjar Panji-1 well incident
Dates shown are when announcements
were made to the exchanges where Santos’
shares are listed: the Australian Securities
Exchange (ASX) and NASDAQ.
As part of Santos’ continuous disclosure, the
Company informs the market of information
that may affect the Company’s share price.
All material announcements disclosed to the
ASX are published on Santos’ website,
www.santos.com.
The Santos website provides an email alert
facility where people can register to be
notified, free of charge, of Santos’ News
Announcements via email, as well as an
RSS feed which allows people to view these
announcements using RSS reader software.

10
Santos Annual Report 2007
0 50
kilometresSouth East July
Gul fo f Suez
North Qarun
0 100
kilometres
AkBura
CharvakEast Mailisu
West Mailisu
KatranBatkenSulukta
Ashvaz
Nanai
SohWest Soh
Tuzluk
Naushkent SKaag J
0 50
kilometres
Victoria
Longford
VIC/RL2
VIC/RL3Sole
Kipper
VIC/L21
Patricia-Baleen
Bass Strait
Orbost
VIC/P55
Patricia-Baleen Gas Facility
VIC/P39(V)
0 100
kilometres
T/32P
T/33P
Bass StraitT/35P
T/36P
T/40P
T/48P
Bay of Bengal
0 100
kilometres
NEC-DWN-2004/1
NEC-DWN-2004/2
BangladeshIndia India
Burma
Block 16
Block 16(Sangu)
Block10
Block 5
Nam Con SonBasin
Song HongBasin
0 250
kilometres
SouthChinaSea
101-100/04 PSC
Kakap PSC(Indonesia)
12 PSC
0 50
kilometres
ATP 299P
ATP 820P
ATP636P
AlkinaAquitaine ‘C’
Aquitaine ‘B’
Innamincka
Total 66
PEL 114
Aquitaine ‘A’
ATP 783P
ATP 543P S
ATP543P
ATP 765P
ATP 752P B
ATP 661PWareena
0 100
kilometres
ATP 685P
ATP 553P
ATP 337P
ATP 336P Roma
ATP 471P M
ATP 470P RDATP 471P B
ATP 337P
ATP 337P
ATP 470P RD
ATP 336PWaldegrave
ATP 745P
ATP 526P
ATP 592P
ATP 653P
ATP 804P
ATP 626P
0 100
kilometres
Tasmania
Victoria
VIC/P44
VIC/RL7
VIC/L22
La Bella
Minerva
Portland HeytesburyGas Facility
Hamilton
VIC/P51Casino
Mt Gambier
PEP 160
VIC/L24
King Island
Geelong
Melbourne
0 100
kilometres
WA-191-P(1)
WA-209-P
WA-8-L
WA-214-P (1)
WA-264-P
WA-208-P WA-20-L
WA-214-P(2)WA-13-L
WA-15-L
WA-191-P(2)
TL/2
WA-7-L
TP/7(3)
WA-1-P(1)
11SL/06-7
TL/7TL/4
TL/3
TP/2 L 10
TR/4
WA-290-P
8SL/06-7 WA-1-P(2)WA-246-P
IndianOcean
WA-26-LWA-27-L
WA-33-RWA-29-L
TP/7(2)
WA-358-P
0 200
kilometres
NT/RL1WA-6-R
WA-18-P
NT/P69
NT/P61
WA-274-P
NT/P67WA-281-P
AC/L1AC/L2AC/L3
JPDA 03-12
WA-27-R
NT/P48
0 100
kilometres
Northern Territory
RL2Dingo
OL3
PalmValley
OL4
OL5Mereenie
Brewer Estate
The world of Santos
Egypt Kyrgyzstan India and Bangladesh
Indonesia and Vietnam Amadeus BasinBrowse,Timor and Bonaparte
Carnarvon Basin
Otway Basin Sorell Basin Gippsland Basin
Surat/Bowen BasinsCooper/Eromanga Basins

11
Santos Annual Report 2007
East Java BasinJeruk, Maleo,
Oyong, Tanggulangin, Wortel, Wunut
Carnarvon BasinBarrow, Hurricane,
John Brookes, Legendre,Mutineer-Exeter, Reindeer,
Stag, Thevenard Surat/Bowen BasinsFairview, Gladstone LNG, Lytton, Moonie, Roma, Scotia, Wallumbilla
Amadeus BasinMereenie, Palm Valley,
Brewer Estate
Houtman Basin
Gippsland BasinPatricia-Baleen, Sole, Kipper
Otway BasinCasino, Henry, Minerva
Browse Basin
Sorell Basin
Timor/Bonaparte
Kutei BasinHiu Aman
Port Bonython
Wickham Point
IndiaNE Coast Basin
Cooper/Eromanga BasinsMoomba, Ballera, Jackson
West Papua and Papua New GuineaHides, SE Gobe, Barikewa
Nam Con Son BasinChim Sao, Dua
Song Hong Basin
West Natuna BasinKakap PSC
KyrgyzstanFergana Basin
0 100
kilometres
PDL 1
PDL 3
Warim PSCPRL 5
PRL 9
III
III IV V
50
kilometres
0
Sampang PSC
Java Sea
MaduraOffshore PSC
Nth Bali1 PSCBrantas PSC
50
kilometres
0
PopodiPSC
PapalangPSC
Makassar Strait
DonggalaPSC
Kutei Basin East Java Basin West Papua and Papua New Guinea
Key to maps
Exploration
Production
Processing and load-out facility
Oil field
Gas field
— Oil pipeline
— Gas pipeline
Detailed exploration maps are available on the Santos website www.santos.com.
Jabiru-Challis
Bayu-Undan,Barossa, Caldita, Elang-Kakatua Evans Shoal
BangladeshBengal Basin
Petrel, Tern
12
Santos Annual Report 2007
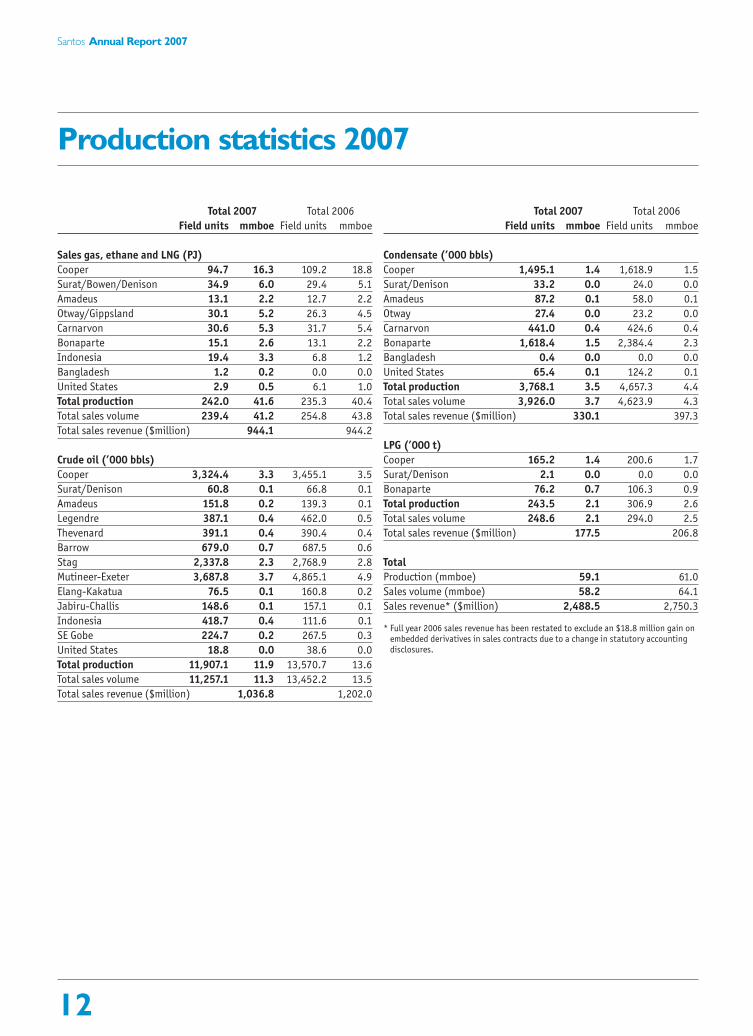
Production statistics 2007
Total 2007 Total 2006
Field units mmboe Field units mmboe
Sales gas, ethane and LNG (PJ)
Cooper 94.7 16.3 109.2 18.8
Surat/Bowen/Denison 34.9 6.0 29.4 5.1
Amadeus 13.1 2.2 12.7 2.2
Otway/Gippsland 30.1 5.2 26.3 4.5
Carnarvon 30.6 5.3 31.7 5.4
Bonaparte 15.1 2.6 13.1 2.2
Indonesia 19.4 3.3 6.8 1.2
Bangladesh 1.2 0.2 0.0 0.0
United States 2.9 0.5 6.1 1.0
Total production 242.0 41.6 235.3 40.4
Total sales volume 239.4 41.2 254.8 43.8
Total sales revenue ($million) 944.1 944.2
Crude oil (’000 bbls)
Cooper 3,324.4 3.3 3,455.1 3.5
Surat/Denison 60.8 0.1 66.8 0.1
Amadeus 151.8 0.2 139.3 0.1
Legendre 387.1 0.4 462.0 0.5
Thevenard 391.1 0.4 390.4 0.4
Barrow 679.0 0.7 687.5 0.6
Stag 2,337.8 2.3 2,768.9 2.8
Mutineer-Exeter 3,687.8 3.7 4,865.1 4.9
Elang-Kakatua 76.5 0.1 160.8 0.2
Jabiru-Challis 148.6 0.1 157.1 0.1
Indonesia 418.7 0.4 111.6 0.1
SE Gobe 224.7 0.2 267.5 0.3
United States 18.8 0.0 38.6 0.0
Total production 11,907.1 11.9 13,570.7 13.6
Total sales volume 11,257.1 11.3 13,452.2 13.5
Total sales revenue ($million) 1,036.8 1,202.0
Total 2007 Total 2006
Field units mmboe Field units mmboe
Condensate (’000 bbls)
Cooper 1,495.1 1.4 1,618.9 1.5
Surat/Denison 33.2 0.0 24.0 0.0
Amadeus 87.2 0.1 58.0 0.1
Otway 27.4 0.0 23.2 0.0
Carnarvon 441.0 0.4 424.6 0.4
Bonaparte 1,618.4 1.5 2,384.4 2.3
Bangladesh 0.4 0.0 0.0 0.0
United States 65.4 0.1 124.2 0.1
Total production 3,768.1 3.5 4,657.3 4.4
Total sales volume 3,926.0 3.7 4,623.9 4.3
Total sales revenue ($million) 330.1 397.3
LPG (’000 t)
Cooper 165.2 1.4 200.6 1.7
Surat/Denison 2.1 0.0 0.0 0.0
Bonaparte 76.2 0.7 106.3 0.9
Total production 243.5 2.1 306.9 2.6
Total sales volume 248.6 2.1 294.0 2.5
Total sales revenue ($million) 177.5 206.8
Total
Production (mmboe) 59.1 61.0
Sales volume (mmboe) 58.2 64.1
Sales revenue* ($million) 2,488.5 2,750.3
* Full year 2006 sales revenue has been restated to exclude an $18.8 million gain onembedded derivatives in sales contracts due to a change in statutory accountingdisclosures.

13
Santos Annual Report 2007
Reserves statistics 2007
Proven plus Probable reserves (Santos share) by activity
Sales gas
(incl. ethane & LNG) Crude oil Condensate LPG Total
PJ mmbbl mmbbl ’000 tonnes mmboe
Reserves year end 2006 3,949 75 43 2,895 819
Production -242 -12 -4 -243 -59
Additions 551 16 4 330 117
Acquisitions/divestments 13 0 0 0 2
Estimated reserves year end 2007 4,271 79 43 2,982 879
Proven plus Probable reserves (Santos share) by area
Sales gas
(incl. ethane & LNG) Crude oil Condensate LPG Total
Area PJ mmbbl mmbbl ’000 tonnes mmboe
Cooper Basin 783 39 11 1,560 197
Onshore Northern Territory 113 2 1 0 23
Offshore Northern Territory 325 0 20 1,011 84
Eastern Queensland 1,667 0 0 14 287
Southern Australia 404 0 5 397 77
Carnarvon Basin 768 34 6 0 171
Papua New Guinea 0 1 0 0 1
Indonesia 187 3 0 0 35
Bangladesh 24 0 0 0 4
Total 4,271 79 43 2,982 879
Reserves (Santos share)(mmboe)
Year end Acquisitions/ Year end
2006 Production Additions divestments 2007
Proven (1P) reserves 441 -59 100 3 485
Proven plus Probable (2P) reserves 819 -59 117 2 879
2C Contingent Resources* 2,248 0 359 -12 2,595
* ‘2C Contingent Resources’ were previously called ‘best estimate resources’. The name has been changed to be consistent with the updated SPE/WPC/AAPG/SPEE Guidelines issued in March 2007.
Defining reserves
Santos has in place an evaluation and
reporting process that is in line with
international industry practice and conforms
with the Petroleum Resource Management
System (PRMS) published by the Society of
Petroleum Engineers (SPE), World Petroleum
Council (WPC), the American Association of
Petroleum Geologists (AAPG) and the Society
of Petroleum Evaluation Engineers (SPEE).
Reserves are defined as those quantities
of petroleum which are anticipated to be
commercially recovered from known
accumulations from a given date forward.
Santos reports reserves net of the petroleum
required for processing and transportation
to the customer. Reserves reported are
based on, and accurately reflect, information
compiled by full-time employees of the
Company who have the requisite
qualifications and experience prescribed
by the ASX Listing Rules.
Externally audited booking process
In excess of 80% of Santos’ year-end 2007
reserves and contingent resources were
audited by independent experts, Gaffney
Cline & Associates (conventional assets)
and Netherland Sewell and Associates (coal
seam gas assets). The auditors found that:
‘Based on the outcomes of the audits of
Santos’ major assets and our understanding
of the estimation processes employed by
Santos, we are of the opinion that, in
aggregate, the total volumes summarised
in the Santos summary table represent a
reasonable estimate of Santos’ December 31,
2007 reserve and contingent resources
position.’

14
Santos Annual Report 2007
LNG projectsGladstone LNG set to transform Santosthrough volume growth and margin expansion
Artist's impressionof the proposedGladstone LNGplant, Curtis Island,Queensland.

15
Santos Annual Report 2007
Santos’ plan to build an LNG business from its
eastern Australia coal seam gas resources is
a transformational initiative.
The $7 billion Gladstone LNG project
augments Santos’ leadership position in
the domestic Australian gas market and is
the leading proposal to export Queensland
gas to world markets.
Gladstone LNG sits strategically with Santos’
other LNG initiatives in Darwin, Papua New
Guinea and, potentially, in the Browse and
Kutei Basins in Western Australia and
Indonesia respectively.
Over the past five years, the global LNG
market has changed dramatically, with the
terms of trade now much more favourable
to producers. Between 2000 and 2002,
contracts to sell LNG to China enabled
the development of several major projects,
but at prices near historic lows.
The rising prices of recent years, accompanied
by the stronger linkages of world gas and oil
prices, means Santos is developing its LNG
projects at the right time.
Gladstone LNG a game-changingenterprise
The announcement in 2007 of Santos’ plans
for the Gladstone LNG plant represented the
culmination of five years of effort in building
the Company’s coal seam gas business.
Strategic, incremental acquisitions of acreage
in the Fairview, Scotia and Roma areas in
Queensland and in the Gunnedah Basin in
New South Wales now see Santos with licence
areas spanning more than 30,000 square
kilometres.
Certified 2P reserves in Santos’ Queensland
coal seam gas fields have increased to more
than 1,600 PJ. With 3P reserves plus high-
side contingent resources of approximately
14,500 PJ, Santos’ focus is on appraisal
drilling, with 600 wells planned before the
first shipment of LNG from Gladstone in 2014.
Santos has four valuable coal seam gas assets
with a total resource in the region of 50–70
trillion cubic feet of gas. This is enough gas
to supply all of Australia’s domestic gas
needs for at least 100 years.
It is this build-up of coal seam gas resources
that will enable Santos to make Gladstone
LNG a reality.
In 2007, Santos acquired a freehold site to
build the liquefication plant, including future
expansions on Curtis Island in the industrial
Port of Gladstone, and the project was
awarded Significant Project status by the
Queensland Government.
The project is on schedule to begin exporting
approximately 3 million tonnes of LNG each
year from 2014. Santos sees scope to increase
production to 10 million tonnes per year within
a few years of commencing LNG shipments.
Santos expects to award contracts for pre-
front-end engineering and design in April
2008 and front-end engineering and design
work on Gladstone LNG by the end of 2008,
enabling a final investment decision on the
project by the end of 2009.
Increased stake in Darwin LNG
During 2007, Santos increased its share
in the ConocoPhillips-operated Darwin LNG
development from 10.6% to 11.4% as a result
of a formal redetermination process.
Darwin LNG, the Company’s first major LNG
investment, which commenced production
in early 2006, has been a very successful
venture for Santos which is the only
Australian joint venture participant.
With the ongoing appraisal of significant
gas resources in the region, Santos and its
partners are progressing plans to expand the
Darwin plant with a second processing train.
In the Bonaparte Basin, the Frigate
Deep-1 well will be drilled during 2008,
targeting gas 15 kilometres west of the
Tern field.
PNG LNG well progressed
The proposed PNG LNG development
made very good progress in 2007 within
the joint venture and in moving through
regulatory and approval processes with
the PNG Government.
The joint venture, in which Santos currently
has a 13.8% share, anticipates front-end
engineering and design will commence early
in 2008 and a final investment decision will
be made in 2009 to enable first gas to be
exported by 2013.
ExxonMobil will operate the project on
behalf of the joint venture.
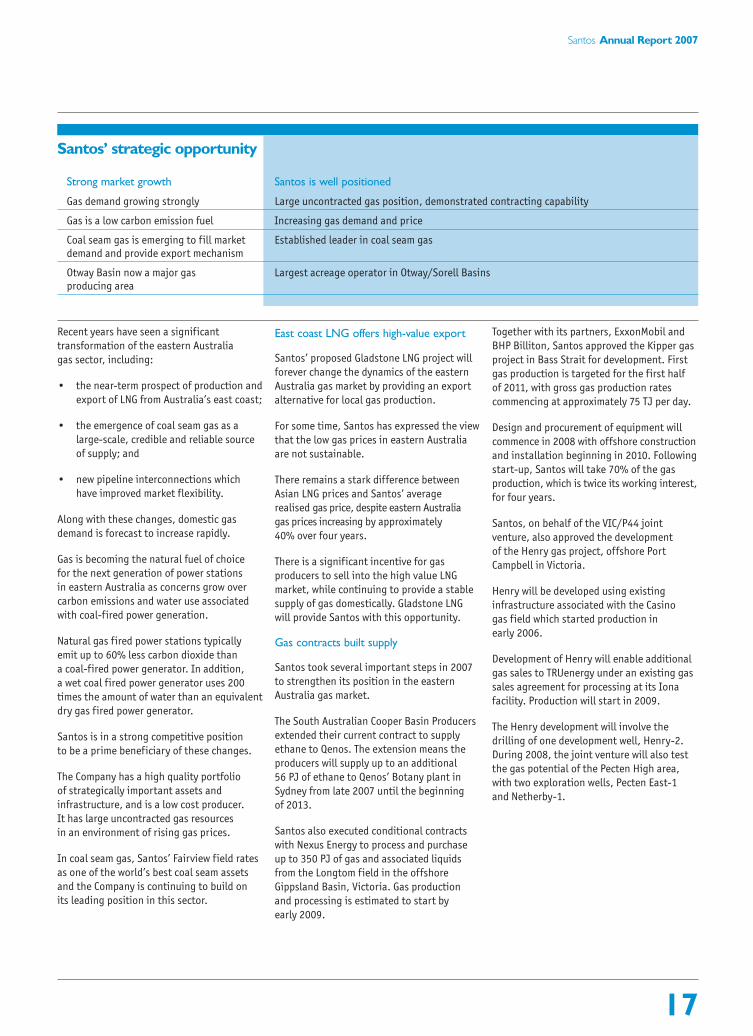
Santos’ strategic opportunity
Favourable LNG dynamics Santos well positioned
Booming demand for LNG Multiple LNG opportunities
Large gas resources a prerequisite Significant contingent resource positions with quality assets
Gladstone LNG 50–70 trillion cubic feet of coal seam gas potential resource, freehold site acquired
PNG LNG Hides field critical to PNG LNG
Darwin LNG expansion Santos 40% interest in 8+ trillion cubic feet of resources

16
Santos Annual Report 2007
Eastern Australia gasUnique ability to benefit from changingmarket dynamics, including LNG export
Inspection ofCompressor Site 2,Fairview coal seam gas field, easternQueensland.
17
Santos Annual Report 2007
Recent years have seen a significant
transformation of the eastern Australia
gas sector, including:
• the near-term prospect of production and
export of LNG from Australia’s east coast;
• the emergence of coal seam gas as a
large-scale, credible and reliable source
of supply; and
• new pipeline interconnections which
have improved market flexibility.
Along with these changes, domestic gas
demand is forecast to increase rapidly.
Gas is becoming the natural fuel of choice
for the next generation of power stations
in eastern Australia as concerns grow over
carbon emissions and water use associated
with coal-fired power generation.
Natural gas fired power stations typically
emit up to 60% less carbon dioxide than
a coal-fired power generator. In addition,
a wet coal fired power generator uses 200
times the amount of water than an equivalent
dry gas fired power generator.
Santos is in a strong competitive position
to be a prime beneficiary of these changes.
The Company has a high quality portfolio
of strategically important assets and
infrastructure, and is a low cost producer.
It has large uncontracted gas resources
in an environment of rising gas prices.
In coal seam gas, Santos’ Fairview field rates
as one of the world’s best coal seam assets
and the Company is continuing to build on
its leading position in this sector.
East coast LNG offers high-value export
Santos’ proposed Gladstone LNG project will
forever change the dynamics of the eastern
Australia gas market by providing an export
alternative for local gas production.
For some time, Santos has expressed the view
that the low gas prices in eastern Australia
are not sustainable.
There remains a stark difference between
Asian LNG prices and Santos’ average
realised gas price, despite eastern Australia
gas prices increasing by approximately
40% over four years.
There is a significant incentive for gas
producers to sell into the high value LNG
market, while continuing to provide a stable
supply of gas domestically. Gladstone LNG
will provide Santos with this opportunity.
Gas contracts built supply
Santos took several important steps in 2007
to strengthen its position in the eastern
Australia gas market.
The South Australian Cooper Basin Producers
extended their current contract to supply
ethane to Qenos. The extension means the
producers will supply up to an additional
56 PJ of ethane to Qenos’ Botany plant in
Sydney from late 2007 until the beginning
of 2013.
Santos also executed conditional contracts
with Nexus Energy to process and purchase
up to 350 PJ of gas and associated liquids
from the Longtom field in the offshore
Gippsland Basin, Victoria. Gas production
and processing is estimated to start by
early 2009.
Together with its partners, ExxonMobil and
BHP Billiton, Santos approved the Kipper gas
project in Bass Strait for development. First
gas production is targeted for the first half
of 2011, with gross gas production rates
commencing at approximately 75 TJ per day.
Design and procurement of equipment will
commence in 2008 with offshore construction
and installation beginning in 2010. Following
start-up, Santos will take 70% of the gas
production, which is twice its working interest,
for four years.
Santos, on behalf of the VIC/P44 joint
venture, also approved the development
of the Henry gas project, offshore Port
Campbell in Victoria.
Henry will be developed using existing
infrastructure associated with the Casino
gas field which started production in
early 2006.
Development of Henry will enable additional
gas sales to TRUenergy under an existing gas
sales agreement for processing at its Iona
facility. Production will start in 2009.
The Henry development will involve the
drilling of one development well, Henry-2.
During 2008, the joint venture will also test
the gas potential of the Pecten High area,
with two exploration wells, Pecten East-1
and Netherby-1.
Santos’ strategic opportunity
Strong market growth Santos is well positioned
Gas demand growing strongly Large uncontracted gas position, demonstrated contracting capability
Gas is a low carbon emission fuel Increasing gas demand and price
Coal seam gas is emerging to fill market Established leader in coal seam gasdemand and provide export mechanism
Otway Basin now a major gas Largest acreage operator in Otway/Sorell Basinsproducing area

18
Santos Annual Report 2007
Cooper Basin oilLarge-scale oil exploitation project,withextensive acreage, infrastructure and know-how
Installation ofenvironmentally-friendly glass-reinforced epoxyflowlines, CooperBasin Oil project.

19
Santos Annual Report 2007
The Cooper Basin Oil project – Santos’
initiative to increase oil production from
Australia’s richest onshore hydrocarbon
province – remains a significant undertaking,
and one which will underpin the Company’s
oil production rates for many years.
Drilling and production results
Santos’ intensive drilling program continued
in 2007 with 132 wells drilled compared to
108 in 2006.
The well success rate of 73% maintained
a strike rate since launching the project
of around 75% – a better performance than
any other company operating in the Cooper
Basin. This enabled Santos to increase 2P
reserves by 8 mmbbl.
Initial online production rates from
successful wells averaged a gross 160 barrels
per day, meeting expectations and taking
total oil production since the project began
to approximately 7 mmbbl Santos share.
The Cooper Basin Oil project has the advantage
of great flexibility as Santos has the equipment,
people, planning systems and contractor
relationships to deploy resources quickly and
effectively to adjust the drilling schedule
according to results.
Challenges met
Santos met considerable challenges during
2007. Heavy rains in the first half of the year
limited the movement of rigs and construction
crews. Associated cooler weather also caused
problems in the transportation by pipeline
of high pour-point (thick viscous) oil from
some wells.
The ‘waxing’ of this oil was overcome by
the optimisation of pour-point depressants
and modifications to the Limestone Creek
production hub to increase the temperature
of the oil and split out the higher pour-point
oil for separate transportation by truck.
Another impediment was the closure of
the Moonie to Brisbane pipeline after a leak
occurred in suburban Brisbane in late July.
In addition to the immediate emergency
response and ongoing management at
the site of the leak, Santos responded by
arranging an intensive trucking program
and the installation of additional truck
loading facilities that saw about 6,000
barrels of oil per day transported from
Moonie to Brisbane and Moomba by road.
A longer-term solution will be the
construction of the Jackson to Moomba
pipeline, which is expected to be completed
by mid 2008. Engineering work to expand
handling facilities at Moomba and Port
Bonython in South Australia where oil
is shipped to export and domestic markets
is well progressed.
Change in focus for 2008
A key focus for 2008 is to build a larger
inventory of drilling opportunities to
provide more flexibility, and to continue
to optimise the portfolio.
An area of significant potential is increased
oil recovery through secondary and tertiary
enhanced recovery techniques. While these
techniques are relatively new to onshore
Australia, they are well-proven technologies
in other parts of the world.
Secondary recovery involves injecting water
into wells to increase the pressure of the
field and push the oil towards the producing
wells. This is taking place in the Mulberry,
Endeavour, Gimboola, Talgeberry, Cranstoun
and Merrimelia fields, and initial results have
been positive.
Santos is also assessing the use of carbon
dioxide as an injection agent for enhanced
oil recovery at the Tirrawarra field, about
60 kilometres north-west of Moomba. Carbon
dioxide has been used as an injection agent
for more than 30 years in the United States
but never in Australia.
Using carbon dioxide in this way also offers
the exciting potential to combat climate
change. The injection of carbon dioxide
captured from emissions at the Moomba
gas processing plant into the Tirrawarra
field is included in the first phase of Santos’
proposed Moomba Carbon Storage project.
Santos’ strategic opportunity
High value opportunity Santos’ competitive advantage
Oil prices higher for longer Using modern rigs and proven technology to increase recovery factors
Ability to execute low-cost program Unique capabilities, knowledge, infrastructure and short cycle time
Over 700 mmbbl original oil in place Largest onshore Australian oil acreage: more than 7.4 million acres

20
Santos Annual Report 2007
Western Australia oil and gasBenefits realised from large gas reserves as demand and prices increase
Mutineer-Exeterfloating production,storage and offtakevessel, offshoreWestern Australia.

21
Santos Annual Report 2007
The increasing demand for natural gas
to power the Western Australia resources
industry is strongly supported by Santos,
and the Company is benefiting as the true
economic and environmental value of this
natural resource is being realised.
The strength of the Western Australia
economy has underpinned growth in
the state’s gas industry in recent years.
Western Australia has benefited for many
years from a major investment in LNG
infrastructure and associated domestic
gas supply. However, further development
of domestic supply has fallen behind the
rapidly increasing demand to meet the
state’s booming economy.
With historically very low prices based on
LNG project domestic gas obligations, until
recently there was no incentive for further
exploration and development of gas for
domestic consumption. Without investment
in exploration and development, long-term
domestic gas supply was under threat.
This dynamic is now changing as increases
in domestic prices signal the opportunity
for further investment.
More gas projects are now being developed
to deliver gas to the domestic market.
Santos’ most recent contract negotiations
concluded at more than $7.50 per gigajoule,
and the price trend is expected to increase
in 2008 as demand continues to escalate
despite growing prices.
Reindeer development advanced
This new pricing paradigm is enabling
the development of the Reindeer gas field
to supply additional gas to the Western
Australia market.
Front-end engineering and design studies
for the development of Reindeer in the
Carnarvon Basin, offshore from Dampier,
were completed in late 2007. Project sanction
is anticipated in the first quarter of 2008.
A tender process for the sale of the gas
was concluded late in 2007. This innovative
approach yielded important insights into the
Western Australia market and provided all
potential buyers with an equal and efficient
opportunity to negotiate for the purchase
of new gas supplies.
This process resulted in the selection of
a number of parties with whom gas sales
negotiations are progressing. A further
significant increase in prices above 2007
levels has been obtained, underpinning
the investment required to bring projects
such as Reindeer online.
Mutineer-Exeter oil production
Production from Mutineer-Exeter, Santos’
major oil-producing asset outside the Cooper
Basin, slipped to 3.7 mmbbl in 2007, from
4.9 mmbbl in 2006.
Production rates from the field were impacted
by workover activity, natural field decline
and, from mid December, electrical damage
on the floating production, storage and
offtake vessel which rendered all subsea
pumps inoperable.
Temporary repairs to the vessel will limit
Mutineer-Exeter production in the first
quarter of 2008. A permanent repair is
scheduled for the first quarter of 2009.
Other Western Australia oil production
at Stag, Legendre, Thevenard and Barrow
totalled 3.8 mmbbl, down from 4.3 mmbbl
in 2006, again due to workover activity
and natural field decline.
2008 exploration
Three exploration wells are scheduled to
be drilled in Western Australia in 2008.
The Ichthys North-1 well in the Browse
Basin will be drilled during the third quarter.
This is an exciting prospect targeted at
proving a gas accumulation to the immediate
north of the Inpex-operated Ichthys field
that is currently under development planning.
The Johnson-1 well will be drilled, targeting
oil in the Carnarvon Basin, and Santos will
be partnering in the ENI-operated Charon-1
well, also targeting oil, in the Houtman Basin.
In addition, two near-field oil exploration
wells are scheduled to be drilled on the
Adams and Fletcher North prospects, near
the Mutineer-Exeter field in the WA-191-P
permit in the Carnarvon Basin.
Santos’ strategic opportunity
Oil upside, gas prices rising Santos well positioned
Demand for gas remains high Uncontracted John Brookes reserves; Reindeer development opportunity
Further growth expected at higher prices Western Australia gas market has moved to A$7.50+ per thousand cubic feet
Proven hydrocarbon systems Multiple oil exploration and appraisal targets, short cycle time opportunities

22
Santos Annual Report 2007
Asian growthEstablished production in Indonesia a platformfor broader growth in Asia
Oyong oil wellheadand productionbarge, offshore East Java.

23
Santos Annual Report 2007
Santos is uniquely positioned to become a
leading energy company in South East Asia.
The Company’s competitive advantages in
this region stem from deep knowledge of the
hydrocarbon basins and systems, regional
experience and extensive industry and
political networks.
Santos’ success in Asia will be judged by
achievements in two core areas – Indonesia
and Vietnam – and the emerging areas of
India and Bangladesh.
Indonesia a major producer
Indonesia is a major focus for Santos,
reflected in the fact that the Jakarta office
is the Company’s largest outside Australia.
Oil production from the Oyong field in
the Sampang PSC, 70 kilometres east
of Surabaya, started in September 2007,
with production in line with expectations at
8,000 barrels of oil per day and cumulative
production of 1 mmbbl.
Phase 2 of Oyong was approved for development
in December 2007 and will develop the gas
reserves. First gas production is anticipated
in the third quarter of 2009 with gas to be
sold to PT Indonesia Power.
The Wortel gas field, discovered in 2006 and
located 7 kilometres west of Oyong, has the
potential to be the third phase for Oyong.
An infill 2D seismic survey has been completed
to assist with the appraisal of the field. An
investment decision is anticipated in 2009
depending upon the seismic results.
Production from the Maleo field has
stabilised but continues to be impacted
by capacity restrictions in the Pertamina-
operated East Java Gas Pipeline following a
rupture of this line during November 2006.
However, gross production rates from Maleo
have increased throughout the year and were
running at approximately 80 TJ/day at the
end of 2007.
Progress made in Vietnam
Santos has made good progress since first
entering Vietnam in 2006. The Company is
progressing the Chim Sao (Blackbird) and Dua
oil discoveries – partnering with Premier Oil
and Delek Energy – towards a project sanction
decision in 2008.
The joint venture has already identified
a recoverable resource of approximately
80 mmbbl. First oil production is expected
in 2010.
A six-month drilling program during 2008
will appraise the Chim Sao field and test
two further exploration prospects.
Further north, in the Song Hong Basin,
Santos is the operator in a joint venture
with Singapore Petroleum. The joint
venture acquired 3D seismic during 2007,
is progressing with interpretation and
expects to begin drilling in 2009.
As a further sign of Santos’ confidence in
Vietnam, the Company opened an office in
Hanoi in the first quarter of 2008. Santos‘
investment in the country is part of the
growing economic and trade ties between
Australia and Vietnam.
Emerging areas in India and Bangladesh
During February 2007, Santos was awarded
a 100% working interest and operatorship
of two blocks covering approximately 16,500
square kilometres in the northern Bay of
Bengal, offshore India.
Several large discoveries have already
been made just west of the acreage acquired
by Santos. Santos has committed to an
eight-year, US$70 million work program
covering the two offshore deep water
exploration licences.
The acquisition of 2D seismic over the blocks
is well advanced and due for completion in
the second quarter of 2008. This will be
followed by targeted 3D seismic, with drilling
expected in 2010.
As an extension of the Company’s Bay
of Bengal play, Santos acquired various
assets in Bangladesh in October 2007,
including a 37.5% interest in the Sangu
gas field and a portfolio of exploration
acreage from Cairn Energy.
The exploration drilling of the Magnama-1
well encountered approximately 20–40 metres
of gas-charged sands.
Further evaluation will be required before
making an investment decision. The nearby
Hatia well was spudded in early 2008.
Both wells are close to Sangu production
facilities which have approximately 400
mmscf/d of spare capacity to sell gas to
the Bangladesh market.
Santos’ strategic opportunity
High growth potential Santos has a quality portfolio
Focused long-term vision Strategic focus on Asiarequired for success
Exploration, development and Maleo gas and Oyong oil fields producing; Oyong gas project start-up in first half 2009; production in Indonesia Kutei exploration
Exploration success in Vietnam Chim Sao, Dua oil discoveries, Swan gas field, active exploration program
Quality acreage captured India and Bangladesh entries; Kyrgyzstan and Vietnam acreage extensions

24
Santos Annual Report 2007
SustainabilityBeing a leader in sustainability gives a perceptible advantage
Employee kitchen facilities at Santos Centre.

25
Santos Annual Report 2007
Sustainability creates long-term shareholder
value by realising the opportunities and
managing risks derived from social,
environmental and economic factors.
Santos’ overall sustainability performance
improved in 2007 with many achievements
both on the ground and in the implementation
of policies and systems.
Recognition of Santos’ sustainability
performance includes listings on the:
• Australian SAM Sustainability Index
(AuSSI);
• Reputex Social Responsibility Index, with
Santos achieving a Reputex ‘A’ rating;
• Goldman Sachs JBWere ASX Climate
Disclosure Leadership Index; and
• Horwath–University of Newcastle five-
star rating for corporate governance.
The Australian Petroleum Production and
Exploration Association also recognised
Santos’ five-year research partnership into
the relationship between whales and seismic
activity by awarding the Company its 2007
Environment Award.
The Company is committed to integrating
the principles of sustainability into its day-
to-day business, measuring its progress
towards this goal and comprehensively
reporting this progress.
Systems and policies integrated
To promote high standards of corporate
governance and ethical business conduct,
Santos has a clear set of values, policies
and procedures to guide the actions of the
Company and employees in all the areas
of the business.
This includes an integrated Code of
Conduct which prescribes that, in addition
to compliance with all applicable legal
requirements, all employees are expected to
adopt appropriate standards of professional
and business conduct in their dealings on
behalf of Santos.
The table to the right summarises the areas
covered by these systems and policies.
One of Santos’ systems is a comprehensive
Environment, Health and Safety Management
System that accommodates all aspects of
the Company’s environment, health and
safety requirements and is the foundation
on which assessments are conducted and
improvements made.
The Environment, Health and Safety
Management System describes the
requirements for effective environmental
and safety practice and prescribes how
the Company complies with relevant
international and Australian standards
and regulatory requirements.
In 2007, Santos compiled its various
management tools and processes into a
unified system called How Santos Works
to formally document these management
systems in an integrated manner.
How Santos Works has been created to ensure
Santos’ operational systems and decision-
making processes are capable of achieving
its corporate strategy.
Safety performance improved
Santos improved safety in 2007 through
the successful implementation of new
standards on process safety and achieving
a reduction in the rate of injuries.
Santos systems and policies include:
How Santos Works
Code of Conduct
Environment, Health and SafetyManagement System
Business conduct
Anti-corruption
Company resources
Confidentiality
Conflict of interest
Financial governance
Financial management and accounting
Gifts and benefits
Guidelines for dealing in securities
Political affiliation
Privacy
Recruitment and selection
Reporting misconduct
Risk management
Shareholder communication and market disclosure
Environment and social
Environment
Greenhouse
Health and wellbeing
Human rights
Safety
Workplace and employment
Conditions of employment
Equal opportunity
Internet and electronic communications
Issue resolution
Leave
Performance management
Remuneration and benefits
Training and development
All Santos systems and policies are published on the Company’s intranet (internal website).A major achievement during 2007 was thepublication of the Human Rights Policy and How Santos Works following an extensivereview process.
Santos’ Sustainability Report 2007 providesmore information about the Company’s
sustainability management and performance. AdvantageSustainability Report 2007
Inside:Scorecard of our sustainability performance 7Drilling innovations reduce water use 15Community development in Indonesia 24Call for a low emission technology strategy 37

26
Santos Annual Report 2007
This performance improvement in 2007 was
an excellent achievement and a reflection
of the hard work put in by many people.
There were an unacceptably high number
of safety incidents involving contractors
in 2006. Consequently Santos worked with
contractor companies in 2007 to arrest this
concerning trend. As a result, contractor
safety performance improved by 25%.
Hand and finger injuries continued to be
the major injury type, accounting for up to
half of all injuries. To address this, Santos
launched an awareness program in 2007
including a hand hazard identification and
glove selection program which aims to reduce
the number of incidents and the severity of
the injury.
Fatigue has been identified as another cause
of many serious workplace accidents. Santos
established a joint employee/employer
working group to review fatigue data,
rosters and work patterns, and steward
ongoing initiatives, such as creating an
employee information DVD.
A defensive driving program, entitled Safe
Drive, was also launched in 2007. Targeting
all employees and their families, the program
showed people how to drive defensively to
prevent vehicle incidents.
Safe Drive was supported by the installation
of in-vehicle monitoring systems for all
vehicles to provide feedback to help change
and improve driving behaviour.
Santos won four of the six categories at the
Self Insurers of South Australia 2007 safety
awards and two awards at the Safe Work SA
awards, including Employer of the Year.
Developing leadership
Santos’ approach to leadership is central
to developing capability, fostering an
achievement-oriented culture and
strengthening employee commitment.
The Company works to develop leadership
skills to meet future challenges such as
industry consolidation, strong competition
for skills in the marketplace, expectations
of recruits, new technology, increasing
governance and public reporting issues, and
rapidly changing workplace demographics.
The Santos Board oversees the continuity
of executive leadership for the organisation
through succession planning for key roles.
Ongoing development of leadership potential
at other levels of the organisation ensures
long-term depth of leadership capacity.
Structured approach builds capabilities
The Santos Capability Framework, which
sets out an organisation’s capabilities
and competencies, was further developed
during 2007.
The framework will underpin all human
resources initiatives from recruitment to
employee development, enabling individuals
and their managers to focus development
discussions on the most important
capabilities and competencies.
The process of applying the Capability Framework
began in 2007 through executive leadership
assessments and tailored development plans.
Further implementation of this approach
will occur in 2008, and leadership and
management training programs also will be
delivered from the core learning curriculum.
Santos’ graduate program is also an integral
part of the Company’s capability development
strategy. The Company has an active graduate
program, designed to attract and retain
the best graduates by offering them career
path opportunities.
Each year, approximately 15 engineering
and geoscience university graduates are
selected for the three-year program. They
are given training and career development
opportunities while working in a structured
job rotation program.
Training for the future
Development and training at Santos
addresses specific skills for individuals
and learning that the Company considers
core to its business.
Competency-based training was an important
training focus in 2007 for field operations.
This training is externally accredited under
the Australian Qualifications Training
Framework and includes on-the-job
competency and skills assessment for
operators and supervisors.
During 2007, Santos issued 37 level III
and IV certificates and engaged 12
apprentices. Santos also received the
Commonwealth Minister for Vocational
Total recordable case frequency rateRecordable injuries per million hours worked
0
3
6
9
12
15
2006200520042003 2007
Contractor Combined Employee
Injury rate as measured by total recordable casefrequency rate fell by 17% to 5.3 in 2007 andwas also better than Santos’ 2007 target by 9%.
The majority of Santos’ employees are located in South Australia due to the significantCooper Basin operations and the Adelaide-based corporate and business services thatsupport Santos’ assets in Australia and overseas.At 31 December 2007, Santos had 1,774employees (full-time equivalent), a 6% increaseon the previous year due to the ramp-up of theFairview and Gladstone LNG activities. Some372 people were employed under award-basedagreements and in 2007 there was no time lostdue to industrial stoppage.
Sustainability (continued)
Employee Full-time 1,665
Part-time 65
Graduate program 65
Contractors 250
External service providers 1,639
3,684
Workforce composition 2007Head count

27
Santos Annual Report 2007
and Further Education’s Runner-Up Award
for Excellence for Employers of Australian
Apprentices for the Adelaide Region.
Creating the culture for success
During 2007, Santos continued the practice
of having the Managing Director and senior
leadership conduct face-to-face communication
sessions to inform employees about business
direction, strategy and performance.
Building an achievement-oriented culture
at Santos is an important objective. The
majority of employees participate in the
annual performance review process. Half
of the annual performance review assesses
for behaviour that is consistent with Santos’
values (see inside front cover).
The performance review provides valuable
two-way communication between employees
and their managers to assess performance
against agreed objectives. It also provides a
forum to identify professional development
needs, career planning and future opportunities.
To improve the quality of this exchange,
a number of programs were developed and
presented to leaders during 2007 to develop
skills in coaching for performance and giving
and receiving feedback. These programs will
continue to be implemented in 2008.
Growing employee commitment
Santos measures employee commitment
every two years, using the intervening year to
implement findings from these surveys. The
2006 survey, conducted by an international
research organisation, showed that employee
commitment was positive and had improved.
Santos continued to implement programs
during 2007 to improve employee commitment.
Change management was identified via
employee feedback as an area for further
improvement and during 2007 Santos
developed tools and education materials
for the effective management of change.
Santos has recognised the increasing
importance of flexible work options in
maintaining a diverse, adaptable and
highly committed workforce. Therefore a
range of additional work/life policies and
tools were developed in 2007.
The Queensland Resources Council awarded
Santos the 2007 High Achievement Resources
Award for Women, Best Company Initiative.
The award recognised Santos’ policies and
practices that have attracted and retained
women in its coal seam gas business.
Outstanding results from health programs
Santos has an active program to manage
the health and wellbeing of personnel by
creating an environment where personnel
are educated and motivated to improve
their health, wellbeing and fitness for work.
In 2007, the health and wellbeing program
focused on nutrition, health and weight
loss. Seminars on healthy eating, losing
weight, exercise and understanding health
factors such as blood pressure, cholesterol
and weight were held in offices and the
field locations.
This program is achieving some outstanding
results for employees and contractors with
participation rates continually rising.
The use of drugs – both legal and illegal – and
alcohol, when used in the workplace, represents
an unacceptable health and safety risk.
The Company has in place a comprehensive
drug and alcohol testing program supported
by a confidential rehabilitation and
management program for people who
breach this policy.
To support this position, and help employees
and contractors understand the consequences
of drugs and alcohol, Santos ran a company-
wide awareness program during 2007 to
encourage healthy lifestyle practices.
Santos employees and their families have
access to confidential counselling via the
Santos Employee Assistance Program.
Psychological support is provided for a range
of issues including relationship difficulties,
stress, and drug and alcohol problems.
New head office exemplifies sustainability
Santos relocated to a new Adelaide head
office during 2007 in a move that is a
tangible expression of the Company’s
commitment to sustainability.
The new Santos Centre provides a safe,
environmentally-responsible workplace that
helps employees work effectively together.
It also supports the cultural change that
has occurred over recent years with a design
that reinforces Santos’ values.
Voluntary employee turnover is relatively stablein a climate where worldwide demand for skilledresources is rapidly increasing.
Voluntary employee turnover%
0
2
4
6
8
10
2006200520042003 2007
Employees participated in more than 105,000hours of training in 2007.Training expendituretotalled $4.35 million and $120,000 was spentto support independent tertiary study throughSantos’ study assistance program.
Santos’ gender profile reflects the predominantlymale workforce in trades, engineering andscience.The Company is involved in programs to improve gender balance; for example, theGeoscience Pathways project which encouragesschool students to consider careers in thisdiscipline.
Category Total Average employees training
hours peremployee
Strategic leader 17 11.4
Functional leader 78 10.3
Team leader 210 25.9
Senior technical
specialist 108 13.3
Technical specialist 364 29.7
Team member 1,009 85.3
Workforce training 2007
28
Santos Annual Report 2007
Santos Centre met its objective of being a
satisfying and productive workplace because
it grew out of the ideas and aspirations of
Santos’ people. A comprehensive
consultation process resulted in the final
design which reflects, in small and large
ways, the input of hundreds of employees.
As a condition of its lease with the building’s
owners, Santos prescribed that the base
building design had to achieve at least a five-
star Green Star rating by the Green Building
Council of Australia.
This rating was achieved, with the building
achieving five-star Green Star ratings for the
‘Office Design’ and ‘Office Design As Built’
rating criteria.
Santos is seeking a five-star Green Star rating
for the ‘Office Interiors’ criteria for the fit-
out of the building. The rating is expected
to be awarded in May 2008.
These ratings put Santos Centre’s green
credentials ahead of most commercial
buildings in Australia. The benefits of a
green building include better indoor air
quality, reduced energy use and greenhouse
gas emissions, reduced water consumption
and improved operating costs.
Examples of Santos Centre’s sustainable
building design include:
• 90% of rubber floor surfaces are made
from recycled car tyres;
• 85-year-old timber, recycled from a
Queensland railway bridge, in flooring;
• 2,800 plants to absorb carbon dioxide
and release oxygen;
• automatic louvres allow natural
light while reducing energy demand
for cooling;
• motion detection controls for lights in
meeting rooms and for after hours; and
• on-site employee gymnasium.
Continuous improvement makes an impact
Following the successful pilot of the Company’s
Continuous Improvement Framework, Santos
established this process throughout the
organisation in 2007.
Continuous improvement provides a process
that enables Santos to identify better ways
to do things while building the capability of
employees to make sustainable changes that
contribute to business efficiency and growth.
Santos has trained more than 100 employees
throughout the Company to use the Continuous
Improvement Framework and has developed a
suite of projects that have the potential to
deliver significant benefits.
Oil spill management
Oil spill management and prevention remains
a high priority for Santos.
Disappointingly, Santos had four significant
oil spills in 2007: the Alwyn #1 flowline
(15 m3); Moonie to Brisbane oil pipeline
(Moonie East, 50 m3); Moonie to Brisbane
oil pipeline (Algester, 400 m3); Jackson South
oil flowline (24 m3); and one minor spill at
Kooroopa North #3 (9.2 m3).
The management and clean-up of these spills
were undertaken immediately and thoroughly
to minimise the impact on the environment
and community.
For example, the oil spill in the Brisbane
suburb of Algester was detected by Santos’
automatic monitoring system. When the leak
site was identified, the section of pipeline in
the vicinity of the incident was further
isolated to minimise the spill.
Santos worked closely with emergency
services and the Queensland Environmental
Protection Authority to contain the oil and
support the affected residents.
In the first 48 hours after the spill, the
majority of surface oil was recovered and
stormwater drains cleaned. Clean-up
activities were continuing at the time this
report was published to ensure the area is
fully rehabilitated.
Santos is concerned about the impact to
the environment and community as a result
of these oil spills and will diligently pursue
programs to remediate spill sites and prevent
further spills.
In 2007 Santos undertook an oil spill
prevention management review to analyse
the number and severity of uncontained
spills and assess Santos’ pipeline integrity
management programs.
The review endorsed the management
program and recommended that an
audit program be established to assess
• More than 250 employees joined
weight reduction programs.
• Results of health checks indicated
76% of staff who had joined weight
loss programs had lost or maintained
weight.
• All Santos sites installed new gym
facilities and/or equipment.
• 19% increase in voluntary health
checks at all Santos sites.
• Health expo and information
seminars were held on weight loss,
fitness, healthy eating and stress
management.
• Several health information programs
were created for employees’ families.
• $10,000 was raised for the Juvenile
Diabetes Research Foundation as
part of employees’ Walk the Moomba
Pipeline competition.
Santos programs helped employees toachieve and maintain a healthy lifestyle
Sustainability (continued)

29
Santos Annual Report 2007
conformance against procedures and
the effectiveness of the standards and
programs in place in the field.
Waste recycling improved
Santos works to continuously improve its
waste management. In 2007 there was an
increased focus on quantifying waste streams
so that future improvements can be
accurately measured.
In addition to traditional camp-based waste
management, during 2007 Santos focused
on reducing oil sludge production at its
source by replacing open sludge pits with
sludge storage tanks at its south-west
Queensland oil fields.
While environmental factors drove the
initiative, an added bonus was the reduced
costs because there was less waste material
to be transported and there were additional
profits for the Company by returning the
hydrocarbons to the system.
The new program has been so successful
it has reduced the volume of sludge being
transported by 90% and eliminated the
need for the sludge disposal pond at Jackson.
Santos is now planning to install sludge tanks
at further operational sites throughout the
Cooper Basin.
Climate change strategies pursued
Climate change is an unprecedented global
issue requiring significant resources to
meet the complex environmental, energy,
economic and political challenges.
As a global stakeholder in the energy
business, Santos recognises that one of its
most important environmental responsibilities
is to pursue strategies that address the issue
of greenhouse gas emissions.
Natural gas will play a pivotal role in helping
Australia’s economy move to a cleaner energy
portfolio. Natural gas has approximately half
the greenhouse intensity and uses only a
minute fraction of the water that coal-fired
electricity requires.
Emissions reductions on track
Santos is pursuing an emission intensity
reduction target of 20% by 2008, from
2002 levels (greenhouse emissions/unit
of production).
Greenhouse gas and energy efficiency
hazard standards under the Environment,
Health and Safety Management System
provide direction to Santos operations
for the measurement and management
of emissions and energy.
Santos continues to deliver energy efficiency
improvements with a number of projects
identified in 2007. An example of this is
the Moomba Gas Recovery project which
will divert gas from flaring.
Santos also continues to participate in
the Yellowbank Gas Flare project where, in
partnership with Origin Energy, credits were
verified on the Greenhouse Friendly Register.
Australian Business & Climate Group
During 2007, a group comprising Santos and
eight other leading companies called for an
urgent strategy on low emission technology
to help reduce greenhouse gas emissions.
The Australian Business & Climate Group
said that urgent development of a national
low emission technology strategy is required
to complement an Australian emissions
trading scheme.
In the report, Stepping Up: Accelerating
the Deployment of Low Emission Technology
in Australia, the companies collaborated
to specifically review and recommend
mechanisms needed to drive the development
of transformational technologies critical if
future emissions targets are to be met – the
low emission technology strategy.
The report and more information about
the group are at the website
www.businessandclimate.com.
Research and development
Santos spent $8.8 million on research and
development activities during 2007, with
major projects investigating new techniques
for fracture stimulation, coal seam gas
production and exploiting possible and
contingent hydrocarbon resources.
Contributing to community wellbeing
Santos has formed relationships with the
many communities in which it has operations
and recognises its responsibility to contribute
to the social fabric of those communities.
This is achieved in part through the sponsorship
and donations program and in 2007 Santos
contributed $3.8 million to 170 events and
organisations in Australia, Indonesia, Papua
New Guinea and the United States.
Lytton spill effect
Moonie East/Algester spills effect
Oil spill volumesm3
2006200520042003 2007
0
500
1000
1500
2000
Santos had four significant oil spills during 2007.Pipeline spills accounted for 96% of oil spillsduring 2007, with the remainder being the resultof 66 relatively minor incidents, typically fromleaks from small hoses, pumps and valves.
Australia United States PNG Indonesia
Santos share greenhouse gas emissionsMillion tonnes CO2-e
3.5
3.6
3.7
3.8
3.9
4.0
4.1
4.2
4.3
4.4
20042003 2005 2006
Santos reports its total greenhouse emissionsand emissions intensity mid-year as a ratio ofgreenhouse emissions per unit of production,and is on track to meet its target of 20%intensity reduction in the period 2002–08.
Santos joined eight other leading companies,known as the Australian Business & ClimateGroup, to publish a report calling for an urgentstrategy on low emission technology.

30
Santos Annual Report 2007
Through this program, Santos provides
support for community-based programs,
organisations and events that are valued
by members of those communities, reflect
each community’s specific socioeconomic
and cultural circumstances, and share
common values and priorities with Santos.
An important part of Santos’ sponsorship
program is the Santos Community Fund,
which provides financial and in-kind support
to organisations that benefit the community
in the areas of health, the environment and
building social capacity.
The fund brings together all the
contributions Santos makes to community-
based organisations and also provides
additional support to Santos employees who
volunteer their own time and resources to
improve the community.
Santos made contributions to 24 organisations
through this fund during 2007, including the
Children’s Medical Research Centre, DeafBlind
Association, Juvenile Diabetes Research
Foundation and Queensland Cancer Fund.
Santos’ longest-standing community support
program is in the Cooper Basin which
straddles the South Australia–Queensland
border. Santos participates in and supports
events such as the Cooper Cup Cricket
Challenge and the Outback Car Trek that
benefit the largely landholder population.
The combined efforts of Santos, its
employees and contractors, and the Cooper
Basin community raised $100,000 in 2007 for
the Royal Flying Doctor Service, an essential
service for outback communities.
The Yard Dogs Association, a volunteer group
of Cooper Basin employees and contractors,
raised $70,000 in 2007 for Camp Quality, an
organisation that supports young people and
their families living with cancer.
Structured approach to stakeholderconsultation
During 2007, Santos documented its
approach to stakeholder relations in a draft
Community Policy and an associated set of
management standards to be incorporated
into the Company’s Environment, Health
and Safety Management System.
The policy and standards are expected to be
formally introduced in 2008 and will guide
future community investment and
stakeholder engagement activities.
Santos consults with members of the community
in areas where its work programs may affect
them. This helps identify the impact of Santos’
activities on social infrastructure; for example,
the purchase of local goods and services, and
impacts on road use or resident amenity.
In eastern Queensland and the Cooper Basin,
Santos’ landholder liaison employees have
regular interaction with the landowners in
the vicinity of Santos’ exploration and
production activities.
In the Gippsland area of Victoria, Santos
participates in a stakeholder engagement
program relating to the Patricia-Baleen gas
plant. The centrepiece of this program is the
Community Advisory Committee which meets
regularly to discuss relevant issues.
Santos’ sponsorship program is geographicallydistributed in a manner consistent with the spread of the Company’s operations in each area.
Santos’ sponsorship program provides support to education (e.g.,Australian School of Petroleumat the University of Adelaide), environment (e.g.,Timboon Embankment restoration), art andculture (e.g.,Adelaide Symphony Orchestra) anda range of youth development activities (e.g., theAFL’s Central Australia Football Team).
2007 2006 2005 2004 2003
Number of employees (full-time equivalent) 1,774 1,679 1,521 1,526 1,700
Number of shareholders 77,498 83,566 78,157 78,976 84,327
Wages and salaries ($million) 253.0 230.7 216.6 214.0 191.8
Materials, goods and services ($million) 947.4 754.2 544.7 433.8 305.6
Royalties and taxes ($million) 534.6 427.5 209.3 169.6 118.7
Sponsorship ($million) 3.8 3.8 3.5 4.0 3.2
Summary of socioeconomic contribution
Sustainability (continued)

New public health clinic, GiligentingIsland, Indonesia.
31
Santos Annual Report 2007
All of Santos’ activities in Indonesia are
governed by its Community Development Plan.
The plan aims to foster the development of
community wellbeing and social infrastructure
in the areas in which Santos operates.
Santos drafted the plan after extensive
socioeconomic assessment and local
consultation and it formed the basis for a
Memorandum of Understanding between
Santos, the local communities and
government agencies.
Activities conducted by Santos on
Madura Island under the auspices of the
Memorandum during 2007 included:
• development of six public health
clinics and three village roads for
the Giligenting Island community;
• purchase of more than 1,000 text and
literature books for nine junior high
schools in the Camplong sub-district;
• financial assistance towards the
construction of an Islamic high school
in the Giligenting sub-district and 10
scholarships for the Fishery Academy
in Surabaya; and
• purchase and planting of 43,000
mangrove seeds along eight hectares of
Sampang coast and 25,000 seeds across
five hectares of Sumenep coast.
Successful indigenous partnerships
Santos recognises and acts upon its
responsibility to native title claimants and
understands the importance of identifying
and protecting cultural heritage.
Santos has had a long and successful
relationship with indigenous stakeholders.
The Company worked with 15 native title
groups during 2007 and spent more than
$5.5 million as part of cultural heritage
and native title processes.
A focus for 2008 is to lay the groundwork
for the negotiation of native title and cultural
heritage agreements for Santos’ Gladstone LNG
project. Santos has engaged three indigenous
employees to help manage project negotiations.
During 2007, Santos also began to
develop its Aboriginal Engagement Policy.
A proactive approach to native title and
cultural heritage, the policy broadens the
areas in which Santos interacts with
indigenous Australian communities.
This policy will provide the basis for
sustainable long-term relationships between
Santos and indigenous communities and will
deliver commercial efficiencies for Santos.
2007 Sustainability Report
More information about Santos’ progress
against sustainability targets is available
in the 2007 Sustainability Report.
The report can be downloaded from the Santos
website at www.santos.com/sustainability2007
or a printed copy can be ordered from Santos’
Share Register by telephoning 08 8116 5000.
Shareholders can also elect to receive
future Sustainability Reports by contacting
the Share Register.
Santos corporate structure
Board of Directors
Managing Director and Chief Executive Officer
Executive Vice President
Growth Businesses
Vice PresidentGeoscience andNew Ventures
Vice PresidentStrategic Projects
PresidentIndonesia
Vice PresidentDevelopment
Vice PresidentCommercial
Vice PresidentOperations
Executive Vice President
Corporate Projects
Chief FinancialOfficer
General Counseland Company
Secretary
Vice PresidentCorporate and People
Revegetation of mangroves,Sumenep, Indonesia.

Board of Directors
32
Santos Annual Report 2007
Kenneth Charles Borda
LLB, BA
Age 55. Independent non-executive
Director since 14 February 2007 and
member of the Finance Committee
of the Board. CEO of Middle East and
North Africa, Deutsche Bank before
retirement on 1 May 2007. Formerly
Regional CEO Asia Pacific and CEO
Australia and New Zealand, Deutsche
Bank. Chairman of Deutsche Bank
Malaysia from 2002 until retirement
on 1 May 2007. Board member
of Fullerton Funds Management,
owned by Temasek, Singapore, since
February 2007. Appointed as non-
executive director of Ithmaar Bank
(Bahrain) on 16 February 2007
and Leighton Contractors Pty Ltd
on 1 July 2007. Previously a Board
member of SFE Corporation for over
five years until its acquisition by the
Australian Stock Exchange Ltd in
July 2006.
Prof Judith Sloan
BA (Hons), MA, MSc
Age 53. Independent non-executive
Director since 5 September 1994.
Chair of the Remuneration Committee
and member of the Audit and
Nomination Committees of the
Board. Appointed non-executive
director of the Westfield Group on
26 February 2008. Chairman of the
Babcock & Brown Communities
Group since July 2007. Commissioner
of the Australian Fair Pay Commission
since March 2006 and part-time
Commissioner of the Productivity
Commission since 1998. Non-
executive Chairman of Primelife
Corporation Ltd July 2006–July
2007, Board member then Deputy
Chairman of the Australian
Broadcasting Corporation 1999–
2004 and non-executive director
of Mayne Group Ltd 1995–2004.
Previous appointments include
Chairman of SGIC Holdings Ltd,
non-executive director of the
South Australian Ports Corporation,
Professor of Labour Studies at the
Flinders University of South Australia
and Director of the National Institute
of Labour Studies.
Kenneth Alfred Dean
BCom (Hons), FCPA, MAICD
Age 55. Independent non-executive
Director since 23 February 2005.
Chairman of the Audit Committee
and member of the Finance
Committee of the Board. Director
of Santos Finance Ltd since
30 September 2005. Chief Financial
Officer of Alumina Ltd, alternate
director of Alumina Ltd since
27 October 2005 and non-executive
director of Alcoa of Australia Ltd,
Alcoa World Alumina LLC and related
companies since October 2005.
Director of Shell Australia Ltd from
1997 to 2001 and Woodside
Petroleum Ltd from 1998 to 2004.
Over 30 years’ experience in the oil
and gas industry. Fellow of the
Australian Society of Certified
Practising Accountants and member
of the Australian Institute of
Company Directors. Former Chief
Executive Officer of Shell Financial
Services and member of the La Trobe
University Council.
Stephen Gerlach
LLB
Age 62. Independent non-executive
Director since 5 September 1989 and
Chairman since 4 May 2001.
Chairman of the Finance Committee
and Nomination Committee of the
Board. Member of the Environment,
Health, Safety and Sustainability
Committee and Remuneration
Committee of the Board. Chairman
of Santos Finance Ltd. Chairman of
Futuris Corporation Ltd since 2003,
having been appointed a non-
executive director in 1996. Chairman
and director of Challenger Listed
Investments Ltd from 1994 until
5 December 2007. Former Managing
Partner of the Adelaide legal firm,
Finlaysons. A Trustee of the
Australian Cancer Research
Foundation, Chairman of Foodbank
SA and a director of Foodbank
Australia. Previous directorships
include Southcorp Holdings Ltd
1994–2005, Elders Rural Bank
1998–2006, Chairman of Elders
Australia Ltd 1993–2006 and
Chairman of Equatorial Mining Ltd
1994–2002.

33
Santos Annual Report 2007
Richard Michael Harding
MSc
Age 58. Independent non-executive
Director since 1 March 2004.
Chairman of the Environment,
Health, Safety and Sustainability
Committee of the Board. Member
of the Audit, Nomination and
Remuneration Committees of the
Board. Independent non-executive
Chairman of Clough Ltd, having
been appointed as director in
May 2006. Non-executive Deputy
Chairman of Arc Energy Ltd until
25 May 2007 (appointed as non-
executive director on 26 August
2003). Chairman of the Ministry
of Defence Project Governance
Board - Land Systems Division
(Army) since 2003. Former
President and General Manager
of BP Developments Australia Ltd
with over 25 years of extensive
international experience with BP.
Former Vice-Chairman and Council
member of the Australian Petroleum
Production and Exploration
Association.
John Charles Ellice-Flint
BSc (Hons)
Age 57. Managing Director since
19 December 2000. Member of the
Environment, Health, Safety and
Sustainability Committee of the
Board. Director of Santos Finance
Ltd and also Chairman of other
Santos Ltd subsidiary companies.
Thirty-six years’ experience in the
international oil and gas industry
including 28 years with Unocal,
including as Senior Vice President:
Global Exploration and Technology
and Vice President: Corporate
Planning and Economics. Member
and Chair of the South Australian
Museum Board since 2002. Member
of the Australian Petroleum
Production and Exploration
Association Council.
Roy Alexander Franklin OBE
BSc (Hons)
Age 54. Independent non-executive
Director since 28 September 2006
and member of the Environment,
Health, Safety and Sustainability
Committee of the Board. Non-
executive Chairman of Bateman
Litwin NV since May 2006. Chairman
of Novera Energy plc since May 2007.
Non-executive director of Keller
Group plc since 19 July 2007 and
StatoilHydro ASA since 1 October
2007. Former Chief Executive Officer
of Paladin Resources plc 1997–2005
and former Group Managing Director
of Clyde Petroleum plc. Former
Chairman of BRINDEX, the trade
association for UK independent oil
and gas companies 2002–2005 and a
former member of PILOT, the joint
industry/UK Government task force
set up to maximise hydrocarbon
recovery from the UK North Sea
2002–2005.

34
Santos Annual Report 2007
David Knox
Executive Vice President
Growth Businesses
BSc (Hons) Mech Eng, MBA
David Knox is responsible
for Santos’ growth in
Australia and Asia. His
accountabilities include
geoscience and new
ventures, LNG ventures,
Indonesia and strategic
projects.
David joined Santos in
September 2007 and was
previously Managing Director
of BP Exploration &
Production in Australasia.
He was also an Executive
Member of APPEA. David
has a wealth of upstream
oil and gas experience,
having held management
and engineering roles at
BP, ARCO and Shell across
Australia, United Kingdom,
Pakistan, United States,
Netherlands and Norway.
Martyn Eames
Vice President
Corporate and People
BSc (Hons)
Martyn Eames is responsible
for the corporate groups that
include shared business
services, human resources,
corporate affairs,
environment, health,
safety and sustainability,
government, media and
Indigenous affairs.
Martyn joined Santos in
December 2004 and was
formerly Vice President
Strategy and Business
Planning with BP Angola.
His career spanned more
than 25 years with BP,
working various upstream
roles in Angola, Canada,
Australia, Papua New
Guinea, Norway, the UK
and the United States.
John Ellice-Flint
Managing Director and
Chief Executive Officer
BSc (Hons)
John Ellice-Flint is
responsible for the overall
performance and strategic
direction of the Company.
John leads major strategic
initiatives, develops top level
external relationships, leads
and manages the Santos
Leadership Team and takes
responsibility for the
management succession
process.
John joined Santos as
Managing Director in
December 2000. He has
36 years’ experience in the
international oil and gas
industry including 28 years
with Unocal, including as
Senior Vice President: Global
Exploration and Technology
and Vice President:
Corporate Planning and
Economics.
Mark Macfarlane
Vice President
Development
BEng (Hons) Mechanical
Mark Macfarlane is
responsible for Santos’
development portfolio,
including operated and non-
operated projects, reservoir
management/development
for all Australian assets,
and drilling and well
construction services for
all of Santos’ activities.
Mark joined Santos in 1997
after a nine-year career with
Esso in Australia and
Malaysia. He has worked
in a variety of leadership
roles at Santos, including
reservoir management,
corporate planning, gas
and oil exploitation and
optimisation and was
Manager Production until
March 2006. Mark was
appointed Vice President
in April 2006.
Roger Kennett
Vice President
Operations
BSc Chemical Technology
Roger Kennett is responsible
for production operations,
including environment,
health and safety,
engineering and technical
services, production and
processing facility
operations, and reliability.
Roger has held a range
of field engineering and
leadership roles during his
23-year career with Santos.
His most recent role was
General Manager Production
Operations and he was
appointed Vice President in
June 2007. Before joining
Santos, Roger worked for
13 years in the chemical
and fertiliser industries.
Santos Leadership Team

35
Santos Annual Report 2007
Rick Wilkinson
Vice President
Commercial
BSc (Hons)
Rick Wilkinson is responsible
for gas and liquids marketing,
commercialising discovered
resources and developing
new gas business.
Rick was formerly General
Manager Southern Australia.
Before joining Santos in
1997, he was Group Manager
Energy Retail for the
Victorian Gas and Fuel
Corporation, responsible for
energy trading, customer
relations, marketing and
sales. He has also held
various engineering,
strategy and management
positions with Schlumberger,
McKinsey & Co and
Pilkington Glass.
Peter Wasow
Chief Financial Officer
BCom, GradDipMgmt, FCPA
Peter Wasow is responsible
for corporate development,
corporate strategy and
planning, investor relations,
accounting, corporate
finance, taxation and audit.
Peter joined Santos in May
2002 following a 23-year
career with BHP Billiton. His
roles included Vice President
Finance and Administration
for BHP Petroleum in
Houston, Texas. His most
recent role was Vice
President Finance, in the
BHP corporate office,
Melbourne.
John Anderson
Vice President
Strategic Projects
LLB, BEc, GDCL
John Anderson leads the
team responsible for the
emerging core areas of
Timor/Bonaparte and Papua
New Guinea, business
development and identified
projects of specific
importance such as carbon
business and tight gas.
John joined Santos in 1996
as Corporate Counsel for the
former Queensland Northern
Territory Business Unit after
10 years as a solicitor with
Freehills. He has held a
range of roles at Santos
including Manager Legal and
Business Services, Manager
Commercial for the former
Central Business Unit and
most recently Group
Executive Business
Development. John was
appointed Vice President
in April 2006.
James Baulderstone
General Counsel and
Company Secretary
LLB (Hons), BSc (Hons)
James Baulderstone is
responsible for the Office of
General Counsel, comprising
the Company’s operational
and corporate legal function,
secretariat and share registry.
James joined Santos in
January 2007 and was
previously Corporate Counsel
at Bluescope Steel and Chief
Legal Officer at Mayne Group
Limited. James has extensive
legal and commercial
experience in leading teams
negotiating complex
corporate transactions
across many diverse
jurisdictions including the
US, Germany, UK, Malaysia,
China and India.
Trevor Brown
Vice President Geoscience
and New Ventures
BSc (Hons)
Trevor Brown leads a
team of highly qualified
geoscientists to implement
a challenging exploration
strategy, with responsibility
for all exploration, appraisal
and new venture activities.
Trevor was most recently
Santos’ Manager Growth
Projects, having joined the
Company in 2001 from US
independent oil company
Unocal where he was part
of a very active exploration
group. He has over 20 years
of experience in the oil and
gas industry, including 11
years in Indonesia managing
onshore and offshore
exploration programs.
Not pictured:Jon Young,Executive Vice PresidentCorporate Projects.

36
Santos Annual Report 2007
Corporate governance
Muster Point sculpture in the atrium of SantosCentre,Adelaide.
Strong corporate management andgovernance underpins performance

37
Santos Annual Report 2007
Introduction
The Board and Management of Santos
believe that, for the Company to achieve and
maintain its objective of becoming a leading
energy company in South East Asia with a
share price that continues to grow and a
reputation for sustainability in its operations,
it is necessary for the Company to meet the
highest standards of personnel safety and
environmental performance, governance and
business conduct across its operations in
Australia and internationally.
To achieve the highest standards of corporate
governance, the Board has established
corporate governance policies and charters
(Policies). The Policies, or a summary of the
Policies, are publicly available on the
Company’s website, www.santos.com.
The Company’s Policies meet the
requirements of both the Corporations Act
2001 (Cth) (the Act) and the Listing Rules
of the Australian Securities Exchange (ASX),
and, in the opinion of the Board, comply with
best practice, including the ASX Principles of
Good Corporate Governance and Good
Practice Recommendations (ASX Principles)
which were revised in August 2007.
Although the revised ASX Principles did not
apply to the Company for the financial year
ended 31 December 2007, the ASX has
encouraged early transition. Accordingly, the
disclosures in this Corporate Governance
Statement (Statement) are made against the
revised ASX Principles. The following table
indicates where specific ASX Principles are
dealt with in this Statement:
Part 1: Composition of the Board
Relevant policies and charters
See www.santos.com
• Board Guidelines
• Company Constitution
1.1 Composition
The composition of the Board is determined
in accordance with the Company’s
Constitution and the Board Guidelines
which, among other things, require that:
• the Board comprises a minimum
of five directors (exclusive of the Chief
Executive Officer/Managing Director
(CEO)), and a maximum of ten directors;
• the Board should comprise a substantial
majority of independent, non-executive
Directors;
• there should be a separation of the roles
of Chairman and CEO of the Company;
• the Chairman of the Board should be an
independent, non-executive Director; and
• performance of the Board and its
members should be reviewed regularly
and objectively.
The names and details of the experience,
qualifications, special responsibilities,
and term of office of each Director of the
Company and the Company Secretary are set
out on pages 32 to 35 of this Annual Report.
1.2 Director independence
The Board has adopted the definition of
independence set out in the ASX Principles,
which is based on the 2002 guidelines of
the Investment and Financial Services
Association Limited.
Having regard to this definition, the
Board generally considers a Director to be
independent if he or she is not a member of
Management and is free of any interest and
any business or other relationship which
could, or could reasonably be perceived to,
materially interfere with the Director’s ability
to act in the best interests of the Company.
The Board will assess the materiality
of any given relationship that may affect
independence on a case-by-case basis
and has adopted materiality guidelines
to assist in that assessment.
ASX principle Reference in StatementPrinciple 1 - Lay solid foundations for management and oversight Parts 2.1, 3 and 4
Principle 2 - Structure the Board to add value Parts 1 and 3
Principle 3 - Promote ethical and responsible decision making Part 5
Principle 4 - Safeguard integrity in financial reporting Parts 3 and 4
Principle 5 - Make timely and balanced disclosure Part 5.3
Principle 6 - Respect the rights of shareholders Part 5.3
Principle 7 - Recognise and manage risk Parts 3 and 4
Principle 8 - Remunerate fairly and responsibly Part 3
38
Santos Annual Report 2007
Under these guidelines, the following
interests are regarded as material in the
absence of any mitigating factors:
• a holding of 5% or more of the Company’s
voting shares or a direct association with
an entity that holds more than 5% of the
Company’s voting shares; or
• an affiliation with an entity which
accounts for 5% or more of the revenue
or expense of the Company.
The Board has determined that there should
not be any arbitrary length of tenure that
should be considered to materially interfere
with a Director’s ability to act in the best
interests of the Company, as it believes this
assessment must be made on a case-by-case
basis with reference to the length of service
of all members of the Board.
Each Director’s independence is assessed
by the Board on an individual basis, with
reference to the above materiality guidelines
and focussing on an assessment of each
Director’s capacity to bring independence of
judgement to Board decisions. In this context,
Directors are required to promptly disclose to
the Board their interests in contracts, family
ties and cross-directorships which may be
relevant in considering their independence.
Currently, the Board comprises six non-
executive Directors, all of whom are
considered independent under the principles
set out above, and one executive Director.
1.3 Appointment of new Directors, term of
office and re-election
The Board Guidelines include the following
principles:
• non-executive Directors are to be appointed
on the basis that their nomination for re-
election as a Director is subject to review
and support by the Board;
• there should be appropriate circumstances
justifying re-election after a specified
period of service as a Director; and
• the contribution of the Board, Board
Committees, and of individual Directors
is the subject of formal review and
discussion in accordance with the process
set out in part 1.4 following.
Prospective candidates for election and
re-election to the Board are reviewed by
the Nomination Committee. Appropriate
regard is had to the business experience,
skills and expertise of the candidates and
the requirements of the Board, to ensure
that the Board’s overall composition
enables it to meet its responsibilities. The
Nomination Committee makes appropriate
recommendations to the Board regarding
possible appointments of Directors.
Prior to appointment, each Director is
provided with a letter of appointment
which includes an organisation chart and
copies of the Company’s Constitution, Board
Guidelines, Committee Charters, relevant
policies and functional overviews of the
Company’s strategic objectives and operations.
Additionally, the expectations of the Board
in respect to a proposed appointee to the
Board and the workings of the Board and its
Committees are conveyed in interviews with
the Chairman. Induction procedures include
access to appropriate executives in relation
to details of the business of the Company.
Under the Company’s Constitution,
approximately one third of Directors retire
by rotation each year. Directors appointed
during the year are also required to submit
themselves for election by shareholders at
the Company’s next Annual General Meeting.
1.4 Review of Board, Director and
executive performance
An external review of the Board and
individual Directors is carried out on
a biennial basis. In addition, internal
reviews of individual Directors are
conducted annually.
The external reviews are carried out by an
independent consultant, based on a scope
agreed in advance with the Board.
Internal reviews are facilitated by the
Chairman, in consultation with the
Nomination Committee, and involve
meetings with each Director.
In addition, Board Committees conduct their
own internal review of their performance,
structure, objectives and purpose from time
to time.
Performance evaluation of senior executives
is undertaken twice a year by the CEO, the
results of which are used by the
Remuneration Committee of the Board
in determining future remuneration and
generally for review by the Board in relation
to management succession planning.
An external review of the Board was
undertaken in November 2007. In addition,
performance reviews were conducted for each
of the senior executives during the year.
These reviews were carried out in accordance
with the process set out above against the
following criteria:
• comparing performance against agreed
measures;
• examining the effectiveness and quality
of the individual;
• assessment of key contributions;
• identifying areas of potential
improvement; and
• assessing whether various expectations
of shareholders have been met.
Part 2: Board responsibilities
Relevant policies and charters
See www.santos.com
• Board Guidelines
In addition to the Board Guidelines, the
Board has adopted a formal document
outlining the Role of the Board. The
overriding objective is to increase
shareholder value to top quartile
performance within an appropriate
management framework which protects the
rights and interests of shareholders and
ensures the Company is properly managed
through the implementation of sound
strategies and action plans and the
development of an integrated framework
of control over the Company’s economic
resources.
2.1 Responsibilities
The Board is responsible for the overall
corporate governance of the Company,
including approving the strategic direction
and financial objectives, oversight of the
Company and its management, establishing
goals for management and monitoring the
attainment of these goals.
Corporate governance (continued)

39
Santos Annual Report 2007
Specifically, the Board is responsible for:
• the provision of strategic direction and
oversight of management;
• significant acquisitions and disposals
of assets;
• significant expenditure decisions outside
of the corporate budget;
• hedging of product sales, sales contracts
and financing arrangements;
• the approval of, and monitoring of,
financial performance against strategic
plans and corporate budgets;
• the approval of delegations of authority
to management;
• ethical standards and codes of conduct;
• the selection and evaluation of, and
succession planning for, Directors and
executive management;
• the remuneration of Directors and
executive management;
• the integrity of material business risk
management including financial and
non-financial risks.
The Board has also established a number of
Board Committees to assist with the effective
discharge of its duties.
Each Director ensures they are able to devote
sufficient time to discharge their duties and
to prepare for Board and Committee meetings
and associated activities. The Board
delegates management of the Company’s
resources to the Company’s executive
management team, under the leadership of
the CEO, to deliver the strategic direction and
goals approved by the Board. This is formally
documented in the Company’s Delegation of
Authority which details the responsibilities
delegated by the Board to Management for:
• implementing corporate strategies;
• maintaining and reporting on effective
risk management; and
• operating under approved budgets and
written delegations of authority.
2.2 Indemnity, access to information and
independent professional advice
The Board Guidelines set out the
circumstances and procedures pursuant to
which a Director, in furtherance of his or her
duties, may seek independent professional
advice at the Company’s expense. Those
procedures require prior consultation with,
and approval by, the Chairman and
assurances as to the qualifications and
reasonableness of the fees of the relevant
expert and, under normal circumstances, the
provision of the expert’s advice to the Board.
Pursuant to a deed executed by the Company
and each Director, a Director also has the
right to access all documents which have
been presented to meetings of the Board or
to any Committee of the Board or otherwise
made available to the Director whilst in
office. This right continues for a term of
seven years after ceasing to be a Director or
such longer period as is necessary to
determine relevant legal proceedings that
commenced during that term.
Information in respect to indemnity and
insurance arrangements for Directors and
certain senior executives appears in the
Directors’ Statutory Report on page 54 of
this Annual Report.
Part 3: Board Committees
Relevant policies and charters
See www.santos.com
• Audit Committee Charter
• Nomination Committee Charter
• Remuneration Committee Charter
• Finance Committee Charter
• Environment, Health, Safety &
Sustainability Committee Charter
3.1 Role and membership
The Board has established a number of
Committees to assist with the effective
discharge of its duties. The membership
and role of each Committee is set out on
pages 40 to 42.
All Committees are chaired by and comprise
only non-executive, independent Directors,
except the Environment, Health, Safety and
Sustainability Committee, which includes the
CEO as a member. Each Committee has no less
than three members. Other composition
requirements specific to the individual
Committee are set out in the table below.
Non-Committee members may attend
Committee meetings by invitation.
Each Committee operates under a specific
charter approved by the Board. The Board
Committee Charters have been reviewed in
accordance with the revised ASX Principles.
Board Committees have access to internal
and external resources, including access
to advice from external consultants or
specialists without management present.
The Chairman of each Committee provides
a report together with the minutes and
recommendations of the Committee at the
next Board meeting.
3.2 Board and Committee meetings
The Board Guidelines prescribe that the
Board is to meet at least eight times a year,
including a strategy meeting of two days’
duration. Board members are expected to
attend any additional meetings as required.
In 2007, a total of 15 meetings were held.
Details of the Board and Committee meetings
held and attendances at those meetings
appear in the Directors’ Statutory Report
on page 52 of this Annual Report.
Executive management attend Board and
Committee meetings, at which they report
to Directors within their respective areas of
responsibility. Where appropriate, advisors
to the Company attend meetings of the
Board and of its Committees.

40
Santos Annual Report 2007
Committee
Audit
Members and composition
Mr K A Dean (Chairman)
Mr R M Harding
Professor J Sloan
The Committee is required to consist of:
• members who are financially literate;
• at least one member with past employment
experience in finance and accounting,
requisite professional certification in
accounting or other comparable
experience or background; and
• at least one member with an
understanding of the exploration
and production industry.
The Chairman of the Board is precluded from
being the Chairman of the Audit Committee.
Role
The primary objective of the Audit Committee is to assist the Board to
fulfil its corporate governance and oversight responsibilities related
to financial accounting practices, external financial reporting,
financial risk management and internal control, the internal and
external audit function, and compliance with laws and regulations
relating to these areas of responsibility.
Specifically, the role of the Audit Committee includes:
• reviewing the effectiveness of the Company’s risk management
and internal compliance and control systems relating to financial
reporting;
• evaluating the truth and fairness of Company financial reports
and recommending acceptance to the Board;
• reviewing the process adopted by the CEO and Chief Financial
Officer (CFO) when certifying to the Board that the Company’s
financial reports are true and fair and that they are based on a
sound system of risk management and internal compliance and
control that is operating effectively in all material respects;
• examining the accounting policies of the Company to determine
whether they are appropriate and in accordance with generally
accepted practices;
• meeting regularly with the internal and external auditors to
reinforce their respective independence and to determine the
appropriateness of internal and external audit procedures;
• where the external auditor provides non-audit services, reporting
to the Board as to whether the Committee is satisfied that the
provision of those services has not compromised the auditor’s
independence;
• reviewing the performance of the internal and external auditors
and providing them with confidential access to the Board;
• receiving from the external auditors a formal written statement
delineating all relationships between the auditors and the
Company and confirming compliance with all professional and
regulatory requirements relating to auditor independence;
• referring matters of concern to the Board, as appropriate, and
considering issues which may impact on the financial reports
of the Company;
• recommending proposed dividends to the Board for final
adoption; and
• recommending to the Board the appointment and dismissal
of the head of internal audit.
Corporate governance (continued)

41
Santos Annual Report 2007
Committee
Environment,
Health, Safety and
Sustainability
Members and composition
Mr R M Harding (Chairman)
Mr J C Ellice-Flint
Mr R A Franklin
Mr S Gerlach
Role
The role of the Environment, Health, Safety and Sustainability
Committee includes:
• monitoring and review of the Environment, Health and Safety
and Greenhouse Policies and related systems;
• monitoring and review of the development of the Company’s
Sustainability Management Framework and the performance
of sustainability aspects of this framework under the categories
of Environment, Community and Our People (excluding
sustainability aspects under the category of Economy); and
• review of the regular internal and external environmental,
health and safety audits.
The Committee was named the Safety, Health and Environment
Committee until February 2008, when the Committee’s charter was
expanded to incorporate a sustainability component.
Nomination Mr S Gerlach (Chairman)
Mr R M Harding
Professor J Sloan
It is the responsibility of the Nomination Committee to devise the
criteria for, and review membership of, and nominations to, the
Board (including the re-election of incumbent Directors). The primary
criteria adopted in selection of suitable Board candidates, and the
assessment of incumbent directors seeking re-election is their
capacity to contribute to the ongoing development of the Company,
having regard to the location and nature of the Company’s significant
business interests and to the candidates’ qualifications and
experience by reference to the attributes of existing Board members.
When a Board vacancy exists or where it is considered that the Board
would benefit from the services of a new Director with particular
skills, the Nomination Committee has responsibility for proposing
candidates for consideration by the Board and, where appropriate,
engages the services of external consultants.
Remuneration Professor J Sloan (Chair)
Mr S Gerlach
Mr R M Harding
The Remuneration Committee is responsible for reviewing the
remuneration policies and practices of the Company including:
• the compensation arrangements for the executive and non-
executive Directors (including the CEO), and senior executives;
• the Company’s superannuation arrangements; and
• employee share and option plans.
The Committee has access to independent advice and comparative
studies on the appropriateness of remuneration arrangements.
The structure and details of the remuneration paid to Directors, the
CEO and other senior executives during the period are set out in the
Remuneration Report commencing on page 56 of this Annual Report
and note 31 to the financial statements commencing on page 126 of
this Annual Report.

42
Santos Annual Report 2007
Committee
Finance
Members and composition
Mr S Gerlach (Chairman)
Mr K C Borda
Mr K A Dean
Role
The role of the Finance Committee includes:
• responsibility for considering and making recommendations to
the Board on the Company’s capital management strategy and
the Company’s funding requirements and specific funding
proposals;
• formulating and monitoring compliance with treasury policies
and practices; and
• the management of credit, liquidity and commodity market risks.
Part 4: Risk management
Relevant policies and charters
See www.santos.com
• Board Guidelines
• Risk Management Policy
Risk management systems
The Board is responsible for overseeing
the implementation of, and ensuring there
are adequate policies in relation to, the
Company’s risk management and internal
compliance and control systems. These
systems require Management to be
responsible for identifying and managing
the Company’s material business risks, which
include financial and non-financial risks,
such as environmental, exploration and
investment risks.
An Enterprise-Wide Risk Management
approach forms the cornerstone of Risk
Management activities of the Company and is
based on the relevant Australian Standard
(AS/NZS 4360 : 2004). This approach is
incorporated in the Company’s Risk
Management Policy and aims to ensure that
material business risks (both financial and
non-financial) facing the Company are
consistently identified, analysed and
evaluated, and that active management plans
and controls are in place for the ongoing
management of these risks. Independent
validation of controls is undertaken by
internal audit as part of its risk-based
approach. The internal audit function is
independent of the external auditor and
reports to the Audit Committee.
Management reporting on risk
Management reporting on risk operates on a
number of levels.
All reports to the Board on strategic and
operational issues incorporate an assessment
by Management of the associated risks, which
ensures that the Board is in a position to
make fully-informed business judgements on
these issues.
In addition, the Board receives dedicated
risk management updates from management,
which address the material business risks
facing the Company and the systems and
policies in place to manage those risks.
In addition to these periodic updates, the
Board and Management give consideration
to effectiveness of the Company’s risk
management and internal compliance and
control systems, and whether there is scope
for further improvement of these systems.
The Board also receives written certifications
from the CEO and the CFO in relation to the
Company’s financial reporting processes.
For the 2007 financial year, the CEO and
CFO certified that:
“The declaration provided in accordance
with section 295A of the Corporations Act in
respect of the Consolidated Financial Report for
the year ended 31 December 2007 is founded
on a sound system of risk management and
internal control, and the system is operating
effectively in all material respects in relation
to financial reporting risks.”
Corporate governance (continued)

43
Santos Annual Report 2007
Type of risk
Environmental and
safety risk
Method of management
Environmental and safety risk is managed through:
• a comprehensive Environmental Health and Safety Management System based on Australian Standard 4801 and
International Standard 14001;
• environment, health and safety committees at Board and Management levels;
• the retention of specialist environmental, health and safety staff and advisors;
• regular internal and external environmental, health and safety audits; and
• imposing environmental care and health and safety accountability as line management responsibilities.
Exploration and
reserves risk
Exploration risk and uncertainty is managed through:
• internal control systems which include formalised risk and resource assessment of exploration prospects;
• corporate review in both prospect and hindsight; and
• Board approval of exploration budgets.
The Company has a Reserves Management System that is consistent with the Society of Petroleum Engineers Petroleum
Resources Management System. External reserves reviews and audits are also undertaken as necessary.
Investment risk The Company has clearly defined procedures for capital allocation and expenditure. These include:
• a portfolio management system;
• annual budgets;
• detailed appraisal and review procedures;
• project management processes;
• levels of authority; and
• due diligence requirements where assets are being acquired.
Financial reporting
and treasury
• A comprehensive budgeting system exists with an annual budget approved by the Board.
• Monthly actual results are reported against budget and quarterly forecasts for the year are prepared and reported
to the Board.
• Treasury operations are subject to a comprehensive system of internal control, and speculative transactions are
prohibited.
• Further details relating to financial instruments and commodity price risk management are included in Note 38
to the Consolidated Financial Statements.
Operational risk • All significant areas of Company operations are subject to regular reporting to the Board.
• The Board receives regular reports on the performance of each functional area, including: operations; gas
marketing and commercialisation; liquids marketing; legal and secretariat; geoscience, exploration and new
ventures; development; finance; safety; human resources; government; investor relations; climate change,
sustainability, cultural heritage and other environmental matters.
Examples of business risks
Examples of management of specific business risks, and the systems Santos has in place to manage these risks, include the following:

44
Santos Annual Report 2007
Part 5: Ethics and conduct
Relevant policies and charters
See www.santos.com
• Code of Conduct
• Guidelines for Dealing in Securities
• Continuous Disclosure Policy
• Shareholder Communications and
Market Disclosure Policy
5.1 Ethical standards and Code of Conduct
To promote high standards of corporate
governance and business conduct, the
Company has provided its employees with
a clear set of rules, values and guidelines
to follow when carrying out their work as
a Santos employee and representative.
These rules, values and guidelines set out
what is expected of Directors, employees,
contractors and agents of Santos.
In particular, the Company has in place an
integrated Code of Conduct which:
• sets out the Company’s key rules, values
and guidelines with respect to workplace
and environment, business conduct and
sustainability; and
• outlines the processes for reporting and
investigating suspected breaches, and
the penalties that may be imposed where
a breach is found to have occurred.
Key issues addressed by the Code of Conduct
include:
• achieving compliance with all applicable
laws of the countries in which Santos
operates;
• avoiding conflicts, by prioritising the
interests of the Company and its
stakeholders over personal interests;
• prohibiting inappropriate gifts,
hospitalities, bribes, commissions and
inducements;
• communicating regularly, accurately
and effectively with investors, other
stakeholders, the media and the
market generally;
• treating employees and prospective
employees fairly and equitably in all
matters;
• protecting rights of privacy and
confidentiality, both at an individual and
Company level;
• ensuring Company assets are used solely
to promote the interests of the Company
and its stakeholders;
• operating with a view to long-term
sustainability, through a focus on health,
safety and the environment; and
• acting as a responsible corporate citizen
in all communities of which the Company
is part, and actively contributing to the
needs of the communities.
The standards of conduct expected of Santos
staff, including those directed at the broader
stakeholder constituency of shareholders,
employees, customers and the community, are
also recorded in separate guidelines and policies
relating to dealing in securities (discussed
below), the environment, occupational health
and safety and human resources.
Further, a Finance Code of Conduct, based
on that developed by the Group of 100 (an
association of senior finance executives from
Australia’s business enterprises) applies to
the CFO and all other officers and employees
within the finance function of the Company
who have the opportunity to influence the
integrity, direction and operation of the
Company and its financial performance.
Santos treats actual or suspected breaches
of its guidelines and policies seriously, and
has adopted an Issue Resolution Policy and
a Reporting Misconduct Policy to ensure that
suspected breaches are reported and acted
upon fairly and effectively. Where a serious
breach is found to have occurred, penalties
may be imposed ranging from counselling
to dismissal.
5.2 Guidelines for dealing in securities
The Company has developed specific written
guidelines that prohibit Directors and
executives (and their respective associates)
from acquiring, selling or otherwise trading
in the Company’s shares or another company’s
shares, if they possess material price-sensitive
information which is not in the public domain.
Pursuant to these guidelines, no person
may deal in securities while they are in the
possession of price-sensitive information.
In other circumstances, Directors must provide
notice of their intention and receive
acknowledgement from the Chairman or his
representative (and executives from the
Company Secretary or a person appointed by
the Board) prior to any dealings in securities
either by themselves or by their associates,
and must promptly notify details following
the dealing.
The Company’s policy is that trading in Santos
securities is permitted, with approval as set
out above, only during the following periods:
• the period commencing two clear days
after the announcement of the Company’s
annual results and ending 1 July; and
• the period commencing two clear
days after the announcement of the
Company’s half-yearly results and
ending 1 January.
Directors and executives may not deal
in securities on considerations of a short-
term nature.
5.3 Continuous disclosure and shareholder
communication
The Company is committed to giving all
shareholders timely and equal access to
information concerning the Company.
The Company has developed policies and
procedures in accordance with its
commitment to fulfilling its obligations to
shareholders and the broader market for
continuous disclosure. These policies
establish procedures to ensure that Directors
and Management are aware of and fulfil their
obligations in relation to the timely disclosure
of material price-sensitive information.
Information must not be selectively disclosed
prior to being announced to the ASX and
NASDAQ. Employees must notify their
departmental manager or a designated
Disclosure Officer as soon as they become
aware of information that should be
considered for release to the market.
When the Company makes an announcement to
the market, that announcement is released to
both exchanges where its shares and securities
are listed: ASX and NASDAQ. The Company
Secretary and Group Executive Investor
Corporate governance (continued)

45
Santos Annual Report 2007
Relations are responsible for communications
with the exchanges. All material information
disclosed to the ASX is posted on the
Company’s website at www.santos.com. This
includes ASX announcements, annual reports,
notices of meetings, CEO briefings, media
releases, and materials presented at investor,
media and analyst briefings. An email alert
facility is also offered to shareholders. Web-
casting of material presentations, including
annual and half-yearly results presentations,
is provided for the benefit of shareholders,
regardless of their location.
The Board is conscious of its obligations
to shareholders and will seek their approval
as required by the Company’s Constitution,
the Act and the ASX Listing Rules, or where
otherwise considered appropriate by the
Directors.
Additionally, the Company’s external auditor
attends Annual General Meetings to be
available to answer shareholder questions
relevant to the conduct of the audit.
5.4 Independence of auditors and non-audit
services
The Board has adopted a policy in relation
to the provision of non-audit services by
the Company’s external auditor. The policy
ensures the external auditor’s independence
and impartiality by prescribing that:
• the Board will not invite any past or
present lead audit partner of the firm
currently engaged as the Company’s
external auditor to fill a vacancy on
the Board;
• audit partners who have had significant
roles in the statutory audit will be
required to rotate off the audit after a
maximum of five years and there will be
a period of at least two successive years
before that partner can again be involved
in the Company’s audit; and
• the internal audit function, if
outsourced, will be provided by a firm
other than the external audit firm.
The nature and amount of non-audit
services provided by the external auditors
is detailed on page 54 of the Directors’
Statutory Report, together with the
Directors’ reasons for being satisfied that
the provision of those services did not
compromise the auditor independence
requirements of the Act.
A copy of the auditor’s independence
declaration as required under section
307C of the Act is set out on page 150
of this Annual Report.

46
Santos Annual Report 2007
Santos Group interests as at 28 February 2008
Licence area % interest
Note: In South Australia PPL = Petroleum
Production Licence and PL = Pipeline Licence.
In Queensland PPL = Pipeline Licence and PL
= Petroleum Lease.
South Australia
Cooper Basin* (Fixed Factor Area)
(PPLs 6-20, 21-61, 63-75, 78-117, 119,
120, 124, 126-130, 132-135, 137-141,
143-146, 148-151, 153-155, 157,
159-166, 169-181, 183-186, 188-190,
192, 193, 195, 196, 198 & 199) 66.6
Patchawarra East Joint Operating Area*(PPLs 26, 76, 77, 118, 121-123, 125,
131, 136, 142, 147, 152, 156, 158,
167, 182, 187, 191, 194, 197, 200 & 201) 72.3
Derrilyn Unit* (PPL 206 & 208) 65.0
PEL 114* 100.0
PL2* 66.6
PL17* 100.0
Queensland
South-West Queensland*ATP 259P
Naccowlah (PLs 23-26, 35, 36, 62,
76-79, 82, 87, 105, 107, 109, 133,
149, 175, 181, 182 & 189) 55.5
Total 66 (PLs 34, 37, 63, 68, 75, 84, 88,
110, 129, 130, 134, 140, 142-144, 150,
168, 178, 186, 193, 241, PPL8 & PPL14) 70.0
Wareena (PLs 113, 114, 141, 145, 148,
153, 157, 158, 187 & 188) 61.2
Innamincka (PLs 58, 80, 136, 137,
156 & 159) 70.0
Alkina 72.0
Aquitaine A (PLs 86, 131, 146, 177, 208) 55.0
Aquitaine B (PLs 59-61, 81, 83, 85, 97,
106, 108, 111-112, 132, 135, 139, 147,
151-152, 155, 205, 207) 55.0
Aquitaine C (PLs 138 & 154) 47.8
50/40/10 (PL 55) 60.0
SWQ Unit (PPLs 13, 16-18, 31, 34, 35,
36-40, 46-48, 62, 64-72, 78-82, 84, 86,
94-96, 98, 100, 101, 105 & 113 and in
South Australia PLs 5 & 9) 60.1
ATP 267P (Nockatunga)(PLs 33, 50 & 51) 59.1
ATP 299P(Tintaburra)(PLs 29, 38, 39,
52, 57, 95, 169 & 170, PPLs 109, 110,
111 & 112) 89.0
PPL 127 (Jackson to Tickalara) 100.0
PPL 138 (Tickalara to SA Border) 100.0
Licence area % interest
ATP 543P (PL117) 100.0
ATP 765 Farmin (Under Appln) 63.0
ATP 766 Farmin (Under Appln) 63.0
Surat BasinATP 212P (Major) (PLs 30, 56 & 74) 15.0
ATP 336P (Roma) (PLs 3-13, 28, 69,
89, 93 & PPL2)* 100.0
ATP 336P (Waldegrave) (PLs 10-12, 28,
69 & 89)* 53.8
ATP 470P (Redcap) (PL 71) 10.0
ATP 470P (Formosa Downs) 5.5
ATP 471P (Bainbilla) (PL 119 & PPL 58) 16.7
ATP 471P (Myall) (PL 192 & PPL 87) 51.0
Boxleigh (PL15 Sublease)* 100.0
PL 1 (Moonie)* 100.0
PL 1 (2) (Cabawin Exclusion)* 100.0
PL 1 (FO) (Cabawin Farm-out)* 50.0
PL 2 (A & B) (Kooroon)* 52.5
PL 2 (Alton)* 100.0
PL 2C (Alton Farm-out)* 63.5
PL 5 (Drillsearch)* 25.0
PL 5 (Mascotte)* 59.0
PL 11 (Snake Creek East)* 75.0
PL 12 (Trinidad)* 100.0
PL 17 Upper Stratum Farmin* 100.0
PL 200 (Spring Gully) 2.60
PL 204 (Spring Gully) 1.10
PPL 119 (Downlands East Exclusion) 28.8
PL 213 (Churchie West) 16.7
ATP 526P (PLs 90,91, 92, 99, 100, 232,
233, 234, 235, 236)* 79.5
ATP 592P, (PLs 195, 203) (Spring Gully) 4.0
ATP 606P (Spring Gully) 2.6
ATP 631P* 81.9
ATP 653P (Fairview)* 79.5
ATP 655P (Fairview)* 100.0
ATP 665P (Fairview)* 100.0
ATP 708P (Fairview)* 100.0
ATP 745P (Fairview)* 79.5
ATP 803P* 100.0
ATP 804P* 71.0
Bowen BasinATP 337P (Denison)* (PLs 41-45, 54,
67, 173, 183, 218, PPL10 & PPL11) 50.0
ATP 337P (Mahalo)* 30.0
PL176 (Scotia)* 100.0
ATP 553P (Denison)* 50.0
ATP 685P (Cockatoo Creek) 50.0
FacilitiesWungoona Processing Facilities* 50.0
Moonie to Brisbane Pipeline* 100.0
Jackson Moonie Pipeline (PPL 6)* 82.8
Licence area % interest
PPL 76* 100.0
PPL 92
(Comet Ridge Gathering System)* 100.0
Comet Ridge to Wallumbilla Pipeline
(PPL 118)* 100.0
Victoria
Otway Basin (Onshore) PEP 160 30.0
Otway Basin (Offshore)VIC/P44 * 50.0
VIC/P51* 55.0
VIC/RL7 (La Bella) 10.0
VIC/L22 (Minerva) 10.0
Gippsland BasinVIC/RL3 (Sole)* 100.0
VIC/L21 (Patricia-Baleen)* 100.0
VIC/L24 (Casino) 50.0
VIC/P55* 100.0
Offshore South Australia
Duntroon Basin*EPP 32 100.0
Offshore Tasmania
Sorell Basin*T/32P 37.5
T/33P 55.0
T/35P 37.5
T/36P 50.0
T/40P 100.0
Northern Territory
Amadeus BasinOL 3 (Palm Valley) 48.0
OLs 4 and 5 (Mereenie)* 65.0
RL2 (Dingo)* 65.7
PL2 Mereenie Pipeline* 65.0
Offshore Northern Australia
Carnarvon BasinEP 61 28.6
EP 62 28.6
EP 357 35.7
L1H (Barrow Island) 28.6
L10 28.6
L12 (Crest) 35.7
L13 (Crest) 35.7

47
Santos Annual Report 2007
Licence area % interest
TL/2 (Airlie) 15.0
TL/3 (Banta-Triller) 28.6
TL/4 35.7
TL/7 (Thevenard) 35.7
TP/2 28.6
TP/7 (1-2) 43.7
TP/7 (3) 63.4
TP/7 (4) 18.7
TR/4 (Australind) 35.7
WA-1-P 22.6
WA-7-L 28.6
WA-8-L (Talisman) 37.4
WA-13-L (East Spar) 45.0
WA-15-L (Stag) 66.7
WA-20-L (Legendre) 22.6
WA-26-L (Mutineer)* 33.4
WA-27-L (Exeter)* 33.4
WA-29-L (John Brookes) 45.0
WA-33-R (Maitland) 18.7
WA-191-P (Mutineer-Exeter)* 33.4
WA-208-P* 31.3
WA-209-P (Reindeer) 45.0
WA-214-P (John Brookes) 45.0
WA-246-P 15.0
WA-358-P 37.5
WA-264-P* 50.0
WA-290-P 15.0
Browse Basin*WA-274-P 30.0
WA-281-P 47.9
Bonaparte Basin*NT/P67 100.0
NT/RL1 (Petrel) 95.0
WA-6-R (Petrel West) 95.0
WA-18-P (Tern) 100.0
WA-27-R 100.0
Houtman BasinWA-328-P 33.0
WA-337-P 100.0
WA-339-P* 100.0
Timor SeaAC/L1 (Jabiru) 10.3
AC/L2 (Challis) 10.3
AC/L3 (Cassini) 10.3
NT/P48 (Evans Shoal) 40.0
NT/P61 40.0
NT/P69 40.0
Timor GapJPDA 03-12 19.3
Bayu-Undan Gas Field 11.4
Elang 21.4
Licence area % interest
Bangladesh
Block 5 45.0
Block 10 45.0
Block 16 37.5
Sangu Development Area 37.5
Egypt
South East July* 100.0
North Qarun 25.0
India
NEC-DWN-2004/1* 100.0
NEC-DWN-2004/2* 100.0
Indonesia
East Java BasinBrantas 18.0
Madura Offshore (Maleo)* 67.5
Nth Bali I* 30.0
Sampang (Oyong)* 45.0
Kutei BasinDonggala* 50.0
Papalang 20.0
Popodi 20.0
West Natuna BasinKakap 9.0
West Papua BasinWarim 20.0
Kyrgyzstan
Closed Joint Stock Company SouthPetroleum Company (SPC)The Santos Group holds a 70% equity interest
in SPC which is the legal and beneficial
holder of the following prospecting licences:
Tuzluk, Soh, West Soh, Nuashkent, Nanai.
Joint Stock Company Textonic (Textonic)The Santos Group is beneficially entitled to
33% of the licences held by Textonic which
is the legal and beneficial owner of the
following prospecting licences: Sulukta,
Batken, Katran, Ak-Bura, Charvak, East
Mailisu, Ashvaz and West Mailisu.
Licence area % interest
Papua New Guinea
PDL 1 (Hides) 31.0
PDL 3* 15.9
PRL 5* 50.3
PRL 9* 42.6
SE Gobe Unit (Unitisation of PDLs3 &4) 9.4
Vietnam
Block 101-100/04 55.0
12W 37.5
* Santos operated

48
Santos Annual Report 2007
10-year summary 1998–2007
As at 31 December 1998 1999 2000 2001 2002 2003 2004 2005 2006 2007
Santos average realised oil price (A$/bbl) 20.95 27.57 46.54 45.53 44.74 43.59 51.83 73.83 89.35 92.10
Financial performance ($million)
Product sales revenue1 769.4 944.5 1,497.1 1,459.7 1,478.4 1,465.0 1,500.9 2,462.8 2,750.3 2,488.5
Total revenue2 806.9 958.5 1,515.0 1,480.8 1,498.0 1,478.7 1,515.2 2,475.9 2,784.6 2,517.6
Foreign currency gains/(losses)3 2.0 0.3 2.7 0.2 (0.7) (7.9) 2.6 (3.8) 0.8 (0.5)
Profit from ordinary activities before tax3 267.3 339.6 725.9 627.6 493.3 430.9 518.8 1,133.5 964.7 601.0
Income tax relating to ordinary activities3 91.0 30.5 239.1 181.7 171.2 103.9 164.1 371.4 321.3 160.4
Net profit after income tax attributable
to the shareholders of Santos Ltd3 176.3 309.1 486.8 445.9 322.1 327.0 354.7 762.1 643.4 440.6
Financial position ($million)
Total assets3 4,236.1 4,338.7 4,659.8 5,048.7 5,320.8 5,218.3 4,836.6 6,191.3 6,902.9 7,320.2
Net debt3 1,280.0 1,301.1 866.6 1,060.8 1,162.9 897.6 1,133.3 1,598.9 1,449.7 1,895.5
Total equity3 1,939.2 2,056.7 2,310.9 2,726.6 2,863.9 3,087.9 2,357.8 2,964.0 3,355.5 3,310.5
Reserves and production (mmboe)
Proven plus Probable reserves (2P) 966 941 921 724 732 636 643 774 819 879
Production 45.6 49.2 56.0 55.7 57.3 54.2 47.1 56.0 61.0 59.1
Exploration4
Wells drilled (number) 81 34 42 26 18 19 16 22 25 10
Expenditure ($million) 180.7 78.1 100.1 93.4 133.1 136.4 125.6 187.0 258.5 149.8
Other capital expenditure ($million)
Delineation and development4 158.1 116.8 187.1 308.1 308.8 519.0 672.7 666.1 865.5 954.6
Buildings, plant and equipment 165.7 102.5 153.5 258.7 319.0 94.9 131.1 106.0 182.1 202.2

49
Santos Annual Report 2007
Share information
Share issues
As as 31 December 1998 1999 2000 2001 2002 2003 2004 2005 2006 2007Employee Employee Employee Employee Employee Employee Employee Employee Employee Employee
Share Plan Share Plan Share Plan/ Share Plan/ Share Plan/ Share Plan/ Share Plan/ Share Plan/ Share Plan/ Share Plan/1 for 8 Executive Executive Executive Executive Executive Executive Executive Executive
rights issue Share Plan Share Plan/ Share Plan/ Share Plan/ Share Plan/ Share Plan/ Share Plan/ Share Plan/Exercise of Exercise of Exercise of Exercise of Exercise of Exercise of Exercise of
Options/ Options/ Options Options/ Options/ Options/ Options/Restricted Share Preference Dividend Dividend Dividend
Shares Buy-back/ Share Reinvestment Reinvestment ReinvestmentSchemes of Buy-back/ Plan Plan Plan/Share
Arrangement Issue of Buy-backFUELS/
ConvertiblePreference
Shares
Number of issued ordinary shares
at year end (million) 607.8 608.2 610.4 579.3 583.1 584.7 585.7 594.4 598.5 586.1
Weighted average number
of ordinary shares (million) 605.6 606.1 608.3 612.0 580.9 583.4 584.9 587.9 596.2 590.5
Dividends paid per ordinary share (¢)
- ordinary 25.0 25.0 30.0 30.0 30.0 30.0 30.0 36.0 40.0 40.0
- special - - - 10.0 - - - - - -
Dividends ($million)
- ordinary 151.4 151.5 182.0 184.8 174.2 175.0 175.5 212.4 238.1 235.1
- special - - - 61.2 - - - - - -
Number of issued preference shares
at year end (million) - - - 3.5 3.5 3.5 6.0 6.0 6.0 6.0
Dividends paid per preference share ($)
- ordinary - - - - 5.40 6.57 6.59 5.10 5.06 5.59
- special - - - - - - 5.00 - - -
Dividends ($million)
- ordinary - - - - 18.9 23.0 23.0 30.6 30.4 33.5
- special - - - - - - 14.3 - - -
Earnings per share (¢)3 29.1 51.0 80.0 72.9 51.9 52.1 54.2 124.4 102.8 68.9
Return on total revenue (%)2,3 21.8 32.2 32.1 30.1 21.5 22.1 23.4 30.8 23.1 17.5
Return on average ordinary equity (%)3 9.1 15.5 22.3 19.0 13.1 12.3 19.9 35.1 23.8 15.2
Return on average capital employed (%)3 7.0 11.4 16.5 13.9 8.9 8.8 11.7 19.8 15.1 10.4
Net debt/(net debt + equity) (%)3 39.8 38.7 27.3 28.0 28.9 22.5 32.5 35.0 30.2 36.4
Net interest cover (times)3 4.4 5.2 9.1 9.7 8.1 8.5 9.1 14.9 10.1 6.4
General
Number of employees
(excluding contractors) 1,650 1,645 1,631 1,713 1,737 1,700 1,526 1,521 1,679 1,774
Number of shareholders 81,286 81,416 76,457 86,472 85,888 84,327 78,976 78,157 83,566 77,498
Market capitalisation ($million) 2,654 2,516 3,670 3,589 3,509 4,017 4,965 7,280 5,907 8,274
Netback - - - - 18.9 18.4 19.8 29.5 33.1 30.9
1 Full year 2006 sales revenue has been restated to exclude an $18.8 million gain on embedded derivatives in sales contracts due to a change in statutory accounting disclosures.2 From 2005, ‘Total operating revenue’ has been reclassified to ‘Total revenue’ and prior year amounts have been restated.3 From 2004, amounts reflect Australian equivalents to International Financial Reporting Standards. Prior year amounts reflect previous Australian Generally Accepted
Accounting Principles and have not been restated.4 From 2001, appraisal and near-field exploration wells have been reclassified from exploration to delineation expenditure. Prior year amounts have not been restated.

50
Santos Annual Report 2007
Financial Report
ContentsDirectors’ Statutory Report 51
Remuneration Report 56
Financial Report
Income Statements 70
Balance Sheets 71
Cash Flow Statements 72
Statements of Recognised Income and Expense 73
Notes to the Consolidated Financial Statements
1 Significant Accounting Policies 74
2 Revenue and Other Income 85
3 Expenses 85
4 Earnings 88
5 Net Financing Costs 88
6 Income Tax Expense 89
7 Discontinued Operations 90
8 Cash and Cash Equivalents 91
9 Trade and Other Receivables 91
10 Inventories 92
11 Derivative Financial Instruments 92
12 Exploration and Evaluation Assets 93
13 Oil and Gas Assets 94
14 Other Land, Buildings, Plant and Equipment 96
15 Impairment of Cash-Generating Units 97
16 Available-For-Sale Financial Assets 98
17 Other Financial Assets 98
18 Deferred Tax Assets and Liabilities 98
19 Trade and Other Payables 99
20 Interest-Bearing Loans and Borrowings 100
21 Provisions 102
22 Other Liabilities 103
23 Capital and Reserves 103
24 Earnings per Share 107
25 Consolidated Entities 109
26 Acquisitions of Subsidiaries 110
27 Interests in Joint Ventures 111
28 Reconciliation of Cash Flows from Operating Activities 113
29 Employee Benefits 114
30 Share-Based Payment Plans 117
31 Key Management Personnel Disclosures 126
32 Related Parties 136
33 Remuneration of Auditors 136
34 Segment Information 137
35 Commitments for Expenditure 139
36 Contingent Liabilities 141
37 Deed of Cross Guarantee 142
38 Financial Risk Management 144
Directors’ Declaration 149
Auditor's Independence Declaration 150
Independent Audit Report 151

51
Santos Annual Report 2007
Directors’ Statutory Report
The Directors present their report together with the financial report of Santos Ltd (Santos or Company) and the consolidated financialreport of the consolidated entity, being the Company and its controlled entities, for the financial year ended 31 December 2007, and theauditor report thereon. Information in the Annual Report referred to by page number in this report, including the Remuneration Report, or contained in a Note to the financial statements referred to in this report is to be read as part of this report.
1. Directors, Directors’ Shareholdings and Directors’ Meetings
The names of Directors of the Company in office at the date of this report and details of the relevant interest of each of those Directors in
shares in the Company at that date are as set out below:
The above named Directors held office during and since the end of the financial year, except for Mr K C Borda, who was appointed a Director
on 14 February 2007.
Except where otherwise indicated, all shareholdings are of fully paid ordinary shares.
At the date of this report, Mr J C Ellice-Flint holds 2,500,000 options under the Santos Executive Share Option Plan and subject to the further
terms described in the Remuneration Report and Note 30 to the financial statements.
Details of the qualifications, experience and special responsibilities of each Director and the Company Secretary are set out on pages 32 to 35
of this Annual Report. This information includes details of other public company directorships held during the last three years.
Surname Other Names Shareholdings in Santos Ltd
Ordinary Franked Unsecured
Shares Equity Listed Securities
Borda Kenneth Charles 35,207 Nil
Dean Kenneth Alfred 4,145 Nil
Ellice-Flint (Managing Director) John Charles 4,073,860 Nil
Franklin Roy Alexander Nil Nil
Gerlach (Chairman) Stephen 49,210 Nil
Harding Richard Michael 608 Nil
Sloan Judith 10,639 195

52
Santos Annual Report 2007
As at the date of this report, the Company had an audit committee of the Board of Directors.
Particulars of the Company’s corporate governance practices appear on pages 36 to 45 of the Annual Report.
2. Principal Activities
The principal activities of the consolidated entity during the financial year were: petroleum exploration, the production, treatment and
marketing of natural gas, crude oil, condensate, naphtha, liquid petroleum gas and liquefied natural gas, and the transportation by pipeline
of crude oil. No significant change in the nature of these activities has occurred during the year.
3. Review and Results of Operations
A detailed review of the operations of the consolidated entity during the financial year, the results of those operations and the financial
position of the consolidated entity as at the end of the financial year is contained on pages 2 to 8 of the Annual Report. Further details
regarding the operations, results and business strategies of the consolidated entity appear in the individual reports at pages 12 to 23 of the
Annual Report.
In summary, the consolidated net profit after income tax was $440.6 million, a 31.5% decrease from the previous period comparative result of
$643.4 million. Sales revenue was $2,488.5 million, down 9.5% from 2006.
In particular, revenues for the Australian segment was $2,356.0 million, an 11.3% decrease from the 2006 result of $2,656.7 million.
International operations recorded revenue growth of 114.2% from 2006 to $131.5 million in 2007.
Total production was down by 3.1% to 59.1 million barrels of oil equivalent (mmboe), as natural field decline and the sale of the US business
was offset by the start-up of the Oyong project in Indonesia, the acquisition of gas interests in Bangladesh and ongoing field development
and optimisation initiatives across Santos’ portfolio.
Surname Other Names Environment, Health,Safety &
Directors’ Audit Sustainability Remuneration Finance NominationMeetings** Committee Committee Committee Committee Committee
No. of No. of No. of No. of No. of No. of No. of No. of No. of No. of No. of No. ofMtgs Mtgs Mtgs Mtgs Mtgs Mtgs Mtgs Mtgs Mtgs Mtgs Mtgs Mtgs
Held* Attended Held* Attended Held* Attended Held* Attended Held* Attended Held* Attended
Borda Kenneth Charles 14 13 - - - - - - 8 8 - -
Dean Kenneth Alfred 15 15 4 4 - - - - 9 9 - -
Ellice-Flint John Charles 15 15 - - 4 4 - - - - - -
Franklin Roy Alexander 15 15 - - 4 4 - - - - - -
Gerlach Stephen 15 14 - - 4 4 6 6 9 9 2 2
Harding Richard Michael 15 14 4 4 4 3 6 6 - - 2 2
Sloan Judith 15 14 4 4 - - 6 6 - - 2 2
* Reflects the number of meetings held during the time the Director held office, or was a member of the Committee, during the year.** In addition to formal meetings, the Board participated in a site visit to Roma and Fairview.
Directors’ Meetings
The number of Directors’ Meetings and meetings of committees of Directors held during the financial year and the number of meetings
attended by each Director are as follows:
Directors’ Statutory Report (continued)

53
Santos Annual Report 2007
4. Significant changes in the state of affairs
The Directors consider that matters or circumstances that have significantly affected, or may significantly affect, the operations,
results of operations or the state of affairs of the Company in subsequent financial years are:
• The sale of Santos’ United States interests;
• The commencement of oil production from the Oyong development in Indonesia;
• The mud flow incident at the Banjar Panji-1 onshore exploration well in Indonesia;
• The proposal to export coal seam gas from Queensland including the construction of a liquefied natural gas facility at Gladstone;
• The acquisition of an interest in the Sangu gas field and exploration acreage in Bangladesh;
• The passing of legislation by the South Australian Parliament which has the effect of removing the restriction on any one shareholder
having an entitlement to more than 15% of Santos’ shares, effective from 29 November 2008.
5. Dividends
On 21 February 2008, the Directors:
(i) resolved to pay a fully franked final dividend of $0.20 per fully paid ordinary share on 31 March 2008 to shareholders registered in
the books of the Company at the close of business on 3 March 2008. This final dividend amounts to approximately $117.2 million; and
(ii) declared that in accordance with the Terms of Issue, a fully franked dividend of $2.9983 per Franked Unsecured Equity Listed Security
be paid on 31 March 2008 to holders registered in the books of the Company at the close of business on 3 March 2008, amounting to
$18.0 million.
A fully franked final dividend of $119.7 million (20 cents per ordinary share) was paid on 2 April 2007 on the 2006 results. Indication of
this dividend payment was disclosed in the 2006 Annual Report. In addition, a fully franked interim dividend of $115.4 million (20 cents
per fully paid ordinary share) was paid to members on 2 October 2007.
In accordance with the Terms of Issue, a fully franked final dividend of $2.7272 per Franked Unsecured Equity Listed Security ($16.4 million)
was paid on 2 April 2007. Indication of this dividend payment was disclosed in the 2006 Annual Report. A fully franked interim dividend of
$2.8592 per Franked Unsecured Equity Listed Securities ($17.2 million) was paid on 2 October 2007.
6. Environmental Regulation
The consolidated entity’s Australian operations are subject to various environmental regulations under Commonwealth, State and Territory
legislation, including under applicable petroleum legislation, under authorisations in respect of its South Australian operations (numbers
EPA 888, 1259, 2164, 2569, 14145, 14427 and 45060001 issued under the Environment Protection Act 1993), its Queensland operations
(numbers 150029, 150101, 150125, 150174, 150175, 150224, 150225, 150238, 150245, 150271, 150275, 150276, 150286, 150287, 150288,
150313, 150347, 150351, 150359, 150329, 150330, 150331, 150332, 150333, 150334, 150343, 150347, 150355, 150359, 150368,
150381,150382, 170520, 170533, 170543, 170544, EA PEN 2000018207, EA PEN 2000054807, EA PEN 2000054007 and EA PEN 200054107
issued under the Environmental Protection Act 1994) and its Victorian operations (number 54626 issued under the Environment Protection Act
1970). Applicable legislation and requisite environmental licences are specified in the entity’s EHS Compliance Database, which forms part of
the consolidated entity’s overall Environmental Management System. Compliance performance is monitored on a regular basis and in various
forms, including environmental audits conducted by regulatory authorities and by the Company, either through internal or external resources.
During the financial year no fines were imposed, no prosecutions were instituted and no official directions or notices were issued by the
relevant regulatory bodies regarding non-compliance by Santos with the above referenced regulations.
54
Santos Annual Report 2007
7. Events Subsequent to Balance Date
Except as mentioned below, in the opinion of the Directors there has not arisen in the interval between the end of the financial year and the
date of this report any matter or circumstance that has significantly affected or may significantly affect the operations of the consolidated
entity, the results of those operations, or the state of affairs of the consolidated entity in future financial years.
Dividends declared after 31 December 2007 are set out in Item 5 of this Directors’ Report and Note 23 to the financial statements.
8. Likely Developments
Certain likely developments in the operations of the consolidated entity and the expected results of those operations in future financial years
are referred to at pages 4 to 7 of the Annual Report.
Further information about likely developments in the operations of the consolidated entity and the expected results of those operations
in future financial years has not been included in this report because disclosure of the information would be likely to result in unreasonable
prejudice to the consolidated entity. Further details regarding likely developments appear in the individual reports at pages 14 to 23 of
the Annual Report.
9. Directors’ and Senior Executives’ Remuneration
Details of the Company’s remuneration policies and the nature and amount of the remuneration of the Directors and senior management
(including shares and options granted during the financial year) are set out in the Remuneration Report commencing on page 56 of the
Annual Report.
10. Indemnification
Rule 61 of the Company’s Constitution provides that the Company indemnifies, on a full indemnity basis and to the full extent permitted
by law, officers of the Company for all losses or liabilities incurred by the person as an officer of the Company, a related body corporate or
trustee of a company-sponsored superannuation fund. Rule 61 does not indemnify an officer for any liability involving a lack of good faith.
Rule 61 also permits the Company to purchase and maintain a Directors’ and Officers’ insurance policy. No indemnity has been granted to
an auditor of the Company in their capacity as auditor of the Company.
In conformity with Rule 61, the Company is party to Deeds of Indemnity in favour of each of the Directors referred to in this report who held
office during the year and certain senior executives of the consolidated entity. The indemnities operate to the full extent permitted by law
and are not subject to a monetary limit. Santos is not aware of any liability having arisen, and no claims have been made, during or since the
financial year under the Deeds of Indemnity.
During the year, the Company paid premiums in respect of Directors’ and Officers’ Liability and Legal Expenses insurance contracts for the year
ending 31 December 2007 and since the end of the year the Company has paid, or agreed to pay, premiums in respect of such contracts for the
year ending 31 December 2008. The insurance contracts insure against certain liability (subject to exclusions) persons who are or have been
directors or officers of the Company and its controlled entities. A condition of the contracts is that the nature of the liability indemnified and
the premium payable not be disclosed.
11. Non-audit services
During the year the Company’s auditor, Ernst & Young, was paid the following amounts in relation to non-audit services it provided:
Taxation services $15,000
Assurance services $244,000
The Directors are satisfied, based on the advice of the audit committee, that the provision of the non-audit services detailed above
by Ernst & Young is compatible with the general standard of independence for auditors imposed by the Corporations Act 2001.
The reason for forming this opinion is that all non-audit services have been reviewed by the audit committee to ensure they do not
impact the impartiality and objectivity of the auditor.
A copy of the auditor’s independence declaration as required under section 307C of the Corporations Act 2001 is set out on page 150
of the Annual Report.
Directors’ Statutory Report (continued)

55
Santos Annual Report 2007
12. Shares under option
Unissued ordinary shares of Santos Ltd under option at the date of this report are as follows:
Date options granted Expiry date Issue price of shares Number under option
15 June 2004 14 June 2009 $6.95 100,000
15 June 2004 1 July 2008 $6.95 46,178
23 May 2005 22 May 2015 $8.46 33,950
23 May 2005 31 March 2007 $8.46 85,500
23 May 2005 22 May 2015 $8.46 542,500
24 October 2006 24 October 2016 $10.48 849,400
4 May 2006 3 May 2016 $11.36 500,000
4 May 2006 3 May 2016 $11.36 1,000,000
4 May 2006 3 May 2016 $11.36 1,000,000
6 August 2007 30 June 2017 $14.14 261,400
6 August 2007 30 June 2017 $14.14 59,800
3 September 2007 2 September 2017 $12.81 100,000
4,578,728
Options do not confer an entitlement to participate in a bonus or rights issue, prior to the exercise of the option.
13. Shares issued on the exercise of options
The following ordinary shares of Santos Ltd were issued during the year ended 31 December 2007 on the exercise of options granted under the
Santos Executive Share Option Plan. No further shares have been issued since then on the exercise of options granted under the Santos Executive
Share Option Plan. No amounts are unpaid on any of the shares.
Date options granted Issue price of shares Number of shares issued
18 June 2002 $6.20 150,000
12 December 2003 $6.38 100,000
12 December 2003 $6.38 27,095
15 June 2004 $6.95 100,000
15 June 2004 $6.95 70,003
22 May 2005 $8.46 8,300
455,398
14. Rounding
Australian Securities and Investments Commission Class Order 98/100, dated 10 July 1998, applies to the Company and accordingly amounts have
been rounded off in accordance with that Class Order, unless otherwise indicated.
This report is made on 21 February 2008 in accordance with a resolution of the Directors.
Director Director
21 February 2008 21 February 2008

56
Santos Annual Report 2007
Remuneration Report
The Directors of Santos Limited present the
Remuneration Report for the Company and its
controlled entities for the year ended 31
December 2007. This Remuneration Report
forms part of the Directors’ Statutory Report.
In order to achieve its objective of delivering
top quartile strategic operating and
shareholder value performance compared to
its peers in the Australian and international
exploration and production industry, the
Company needs to have highly capable people
available to it. Consistent with this objective,
the Company’s remuneration strategy is
designed to attract and retain appropriately
qualified and experienced Directors,
executives and staff with the necessary skills
and attributes to lead and manage the
Company. The Company’s remuneration
strategy is therefore critical to the delivery of
the Company’s overall strategic objectives.
In addition to attracting and retaining talent,
Santos’ remuneration strategy also aims to
encourage its employees to strive for
superior performance by rewarding the
achievement of targets that are fair,
challenging, clearly understood and within
the control of employees to achieve through
their own actions. For the Company’s most
senior staff, performance targets are
primarily aligned with long-term shareholder
value creation.
The Remuneration Report sets out
remuneration information for the Company’s
non-executive Directors, Managing Director
and Senior Executives, who are the key
people accountable for planning, directing
and controlling the affairs of the
consolidated entity. They include the five
highest remunerated executives of the
Company and Group for the 2007 financial
year, and are listed in Table 1 below.
Table 1: Non-executive Directors, Managing Director and Senior Executives
In review - Remuneration decisions made in 2007 and their influences
The competition for talent intensified to
record levels in 2007, with buoyant market
conditions increasing the already high
demand for appropriately skilled and
experienced staff. Whilst increased
competition for executive talent has been
observed across a number of industries, the
trend has been particularly marked in the
upstream oil and gas industry due to high
energy prices, increased levels of exploration
and development within the industry and the
transferable nature of oil and gas industry
skills in the international market. Santos’
exposure to this industry trend also reached
new levels in 2007, with the Company’s
increased exploration activity during 2007
increasing its need for experienced and
qualified staff. Recruitment and retention of
talented staff therefore represents a critical
challenge for the Group as it continues to
expand its profile and become more active in
international and domestic markets.
A second development during the year which
will significantly impact Santos’ future
international and domestic profile is the
South Australian Government’s decision to
repeal the Santos Limited (Regulation of
Shareholding) Act 1989, which restricts any
one shareholder from holding more than 15%
of the Company. The Act’s repeal will mean
that, for the first time in approximately three
decades, the Company’s ownership structure
will be subject to the full force of the market.
These developments were major influences
on two key remuneration actions the
Company took in 2007. Firstly, in order to
maximise the retention of its key executives
during a possible period of volatility, all
Senior Executives (excluding the Managing
Director) and 57 other selected executives
were granted a special “Growth Award”. The
Growth Award comprises Share Acquisition
Rights or options which vest or become
exercisable on the third anniversary of the
grant date, providing the executive meets
continuous service conditions. Consistent
Executive
Name PositionJ C Ellice-Flint Managing Director
J H Anderson Vice President Strategic Projects
J L Baulderstone General Counsel and Company Secretary1
T J Brown Vice President Geoscience and New Ventures
M E J Eames Vice President Corporate and People
R M Kennett Vice President Operations2
D J Knox Executive Vice President Growth Businesses3
M S Macfarlane Vice President Development
P C Wasow Chief Financial Officer
R J Wilkinson Vice President Gas Marketing and
Commercialisation
J T Young Executive Vice President Corporate Projects4
Non-Executive
Name PositionS Gerlach Chairman
K C Borda Director5
K A Dean Director
R A Franklin Director
R M Harding Director
J Sloan Director
1 Appointed on 29 January 20072 Appointed on 1 June 20073 Appointed on 3 September 20074 Appointed on 1 June 2007; previously Executive Vice
President - Operations5 Appointed on 14 February 2007
57
Santos Annual Report 2007
with the retention focus, no performance
hurdles apply to the Growth Award. More
details on the Growth Award are provided on
pages 63 to 65.
Secondly, the Company undertook a detailed
review of its Long-term Incentive (LTI) plan
in order to assess its overall effectiveness as
a remuneration tool. Vesting of LTI grants
since 2005 has been based on relative Total
Shareholder Return (TSR) hurdles, partly
against ASX 100 companies, and partly
against Australian and international
Exploration and Production (E&P) companies.
The Board was concerned that due to the
unique nature of the Company’s assets and
contractual arrangements, comparing it
meaningfully to other companies was
difficult, and hence the plan’s total reliance
on relative TSR was unsuitable.
To address these concerns, the Board decided
to base vesting of half the 2007 LTI grant on
an absolute TSR hurdle. The Directors believe
that the combination of absolute and relative
TSR is a fairer test, given the factors
described above. The Board considers this
change an interim step towards a more
individually tailored remuneration structure.
More details on the 2007 LTI grant are
provided on pages 63 to 66.
The Board is continuing to assess the
Company’s remuneration arrangements
as appropriate, to ensure that these
arrangements remain effective in achieving
the policy objectives detailed below.
Remuneration Policy
The Company’s remuneration policy as set by the Board is summarised below.
Non-executive Directors
Managing Director and Senior Executives
Policy objective
To enable the Company to prudently secure
and retain the services of suitable individuals
to serve as Directors.
To promote independence and impartiality.
To align non-executive Director and
shareholder interests by encouraging the
creation of long-term shareholder value.
To enable the Company to prudently secure
and retain the services of suitable individuals
able to contribute towards meeting its
strategic objectives.
To encourage striving for superior
performance by rewarding achievement of
targets that are fair, challenging, clearly
understood and within the control of
employees to achieve through their own
actions.
Implementation approach
Directors’ fees are set taking into account,
among other things, fees paid for similar roles
in comparable companies, the commitment,
risk and responsibility accepted by non-
executive Directors, and recognition of their
commercial expertise and experience.
Non-executive Director remuneration does
not vary according to the performance of the
Company.
Purchase of the Company’s shares by
Directors is facilitated via the Non-executive
Director Share Plan.
Executive remuneration levels are market-
aligned by comparison against similar roles
in comparable companies.
A significant component of executive
remuneration is driven by Company and
individual performance through the
Company’s short-term and long-term
incentive programs. These components of
remuneration are “at risk”, so executives
only derive value from participating in these
programs where they satisfy challenging
performance hurdles.
Individual performance also affects base
remuneration. The Board intends the base
remuneration of consistently high-performing
executives to be higher, in market terms, than
that of others.

58
Santos Annual Report 2007
Managing Director and Senior Executives
(continued)
Policy objective
To align executive and shareholder interests
by encouraging the creation of long-term
shareholder value.
Implementation approach
Part of executive remuneration is delivered
in share-based payments, in order to align
executive and shareholder interests.
In addition, performance measures for
the “at risk” remuneration components
are linked to shareholder value creation.
Details of remuneration policy implementation in 2007
Non-executive Director remuneration
Maximum aggregate amount
Total non-executive Directors’ fees paid in a year, including Board committee fees, cannot exceed $1,500,000. This amount was approved by
shareholders at the Annual General Meeting held on 7 May 2004. Directors may also be paid additional fees for special duties or exertions, and
are entitled to be reimbursed for all business-related expenses. These payments are not included in the maximum aggregate amount approved
by shareholders. No additional fees were paid during the year.
2007 non-executive Directors’ fees
Table 2: 2007 non-executive Directors’ fees payable in 2007
Board Committees
Chair1 Member Chair Member
Fees $390,000 $130,000 $10,000 - $28,000 $4,000 - $14,000
1 The Chairman of the Board does not receive any additional fees for serving on or chairing any Board committee.
Superannuation and retirement benefits
Superannuation contributions are made
on behalf of non-executive Directors in
accordance with the requirements of the
Company’s statutory superannuation
obligations.
Non-executive Directors appointed prior
to 1 January 2004 (Participating Directors)
are contractually entitled to receive benefits
upon their retirement pursuant to
agreements entered into upon their
appointment, the terms of which were
approved by shareholders at the 1989 AGM.
Non-executive Directors appointed after
1 January 2004 are not entitled to receive
a benefit upon retirement other than
statutory entitlements.
The retirement benefits of Participating
Directors were frozen with effect from 30
June 2004, at which time their entitlements
ceased to accrue. However, to prevent
erosion in the real value of the frozen
benefits, the Board determined that the
benefits would be indexed annually against
the five-year Australian Government Bond
Rate with effect from 1 July 2007.
The increase in Participating Directors’
frozen benefits during the year as a result
of indexation, along with the amount of their
benefits as at 31 December 2007, are set out
in Table 3 below. The benefits have been fully
provided for.
Table 3: Non-executive Director retirement benefits
Benefit as at Increase as a result Benefit as at
Director 1 January 2007 of indexation 31 December 2007
S Gerlach $1,130,725 $37,925 $1,168,650
J Sloan $346,752 $11,630 $358,382
Remuneration Report (continued)

59
Santos Annual Report 2007
Non-executive Director Share Plan
In accordance with shareholder approval
obtained at the 2007 Annual General
Meeting, the Non-executive Director Share
Plan (NED Share Plan) was introduced in July
2007. Participation in the NED Share Plan is
voluntary and all present and future non-
executive Directors are eligible to participate.
Under the NED Share Plan, Directors elect to
sacrifice all or part of their pre-tax fees
in return for an allocation of shares of
equivalent value. The NED Share Plan
therefore does not involve any additional
remuneration for participating Directors.
Shares are allocated quarterly and are either
issued as new shares or purchased on the ASX
at the prevailing market price. The shares are
registered in the name of the participating
Director, but are subject to a restriction
on dealing. In the absence of exceptional
circumstances, the restriction will apply until
the Director ceases to hold office or until ten
years have elapsed since the allocation of the
shares, whichever is earlier.
Details of the shares allocated to Directors
under the NED Share Plan during the year
are set out in Table 4 below.
Table 4: 2007 NED Share Plan allocations
October 2007 December 2007
Director1 allocation2 allocation3 Total
K C Borda 2,227 2,530 4,757
K A Dean 3,000 609 3,609
S Gerlach 1,263 1,435 2,698
R M Harding 289 323 612
J Sloan 2,640 2,999 5,639
1 Mr R A Franklin did not elect to participate in 2007.2 Shares were allocated to the participating Directors on 10 October at $15.4326 per share.3 Shares were allocated to the participating Directors on 28 December 2007 at $13.5843 per share.
Details of remuneration paid to non-executive Directors in 2007
Details of the fees and other benefits paid to Directors during the year are set out in Table 5 below.
Table 5: 2007 non-executive Director remuneration details
Share-based
Short-term benefits Retirement benefits payments
Fees for
Directors’ special Super- Increase to NED
fees (incl duties or annuation retirement Share
Committee Fees)1 exertions Other3 contributions4 benefit Plan Total
S Gerlach $252,229 - $4,788 $111,678 $37,925 $39,000 $445,620
K C Borda $51,7042 - - $10,672 - $68,750 $131,126
K A Dean $107,575 - - $54,282 - $16,550 $178,407
R A Franklin $140,512 - - $3,195 - - $143,707
R M Harding $39,600 - - $136,440 - $8,800 $184,840
C J Recny5 $19,589 - - $1,763 - - $21,352
J Sloan $0 - - $94,407 $11,630 $81,500 $187,537
1 Refer Table 2 above for details of annual Directors’ fees and Committee fees. Figure shown is after fee sacrifice to superannuation and/or NED Share Plan.2 Mr K C Borda donated his Director’s fees to charity.3 This figure represents the value of car parking provided to the Chairman in the Company’s head office in Adelaide.4 Includes superannuation guarantee payments and any voluntary fee sacrifice to superannuation.5 Payment to deceased estate.

60
Santos Annual Report 2007
Managing Director’s remuneration
Remuneration components and their relative weightings
Total remuneration for the Managing Director is made up of the following components, the majority of which are at risk and linked to
shareholder value creation:
• Base remuneration - comprising salary and superannuation;
• Short-term Incentive (STI) - an annual bonus linked to Company performance and achievement of strategic objectives; and
• Long-term Incentive (LTI) - equity grants tied to vesting conditions dependent on Santos’ achievement of superior performance
relative to its peers.
The relative weightings of the three components comprising the Managing Director’s total remuneration are provided below.
Table 6: Relative weightings of remuneration components
% of total remuneration (annualised)
Fixed Performance-based
remuneration remuneration
STI LTI
Managing Director 46% 27% 27%
Base remuneration
Mr Ellice-Flint is paid a salary from which he
may, if he wishes, sacrifice a proportion for
benefits such as a novated car lease. The
Board receives external advice on Mr Ellice-
Flint’s base remuneration, which is market-
aligned by comparison to that of Managing
Directors of comparable companies.
The Company funds Mr Ellice-Flint’s
defined benefit superannuation plan.
On his birthday in 2007 he became entitled
to a superannuation payment of 3.22 times
final average salary. This multiple increases
at a rate of approximately 0.5 times final
average salary on each subsequent birthday
until the multiple is capped at 6.00 times
final average salary at 62 years of age.
Short-term Incentive (STI)
Mr Ellice-Flint’s STI is based on a number of
agreed annual objectives linked to Company
performance objectives and delivery of
strategic growth initiatives. Consistent
with his role as Managing Director, the
performance measures for Mr Ellice-Flint’s
STI comprise a combination of operational,
financial, budgetary and ongoing strategic
targets that are directly related to the
strategic objectives set by the Board for
the relevant financial year.
The Remuneration Committee assesses
performance against Mr Ellice-Flint’s objectives
annually and makes a recommendation to the
Board. These objectives are directly linked to
the priorities and performance of the Company
across a range of measures including an
overriding focus on the creation of shareholder
wealth. The maximum STI payable is 150%
of base salary.
Half of Mr Ellice-Flint’s STI is paid to him
in the Company’s shares. These shares are
subject to restrictions on sale, transfer and
hedging for two years from their date of
acquisition (restrictions may be lifted earlier
upon termination of the Managing Director’s
employment depending on the circumstances).
The other half of the STI is paid in cash.
For 2007 performance, Mr Ellice-Flint was
awarded an STI payment of $1,950,000 or
115% of base salary.
Long-term Incentive (LTI)
The Managing Director receives his
LTI in the form of options. Each option
entitles Mr Ellice-Flint to acquire one fully
paid ordinary share in the Company at a
predetermined price, subject to satisfaction
of vesting conditions. The grant size is
determined by reference to the median
grant size given to executives in similar
roles in comparable companies.
At the 2006 AGM, shareholder approval
was given for the grant of three tranches
of options to Mr Ellice-Flint as follows:
Tranche Number of options Performance period
1 500,000 4 May 2006 - 26 August 2007
2 1,000,000 4 May 2006 - 26 August 2008
3 1,000,000 4 May 2006 - 26 August 2009
Remuneration Report (continued)

61
Santos Annual Report 2007
These grants were initially proposed in
2005, but were held over until the 2006 AGM
pending completion of the Board review of
the overall remuneration package for the
Managing Director, and were ultimately
made on 4 May 2006.
No new LTI grant was made to Mr Ellice-Flint
in 2007.
The exercise price for the options granted is
$11.36, being the volume weighted average
price in the ten days up to and including
9 March 2006 (as approved by shareholders
on 4 May 2006).
Vesting of each tranche of options is
based on two performance conditions,
each applying to one half of the tranche:
• relative TSR against the ASX 100 at
the beginning of the performance
period; and
• relative TSR against a group of Australian
and international E&P companies.
At the time of grant, the Board considered the
ASX 100 and E&P companies to be reasonable
comparators against the market generally,
and against Santos’ peers. See Appendix 1
(page 68) for a listing of companies
comprising the comparator groups.
The options granted vest according to the
following schedule:
Santos TSR % ofpercentile ranking grant vesting< 50th percentile 0%
= 50th percentile 50%
51st to 74th percentile 52% to 98%
(additional 2% for
each percentile
improvement)
≥ 75th percentile 100%
Performance conditions may be re-tested
quarterly during the 12-month period
commencing on the earliest exercise date
for a tranche. If the performance conditions
are not satisfied at the end of that 12-month
retesting period, the options in that tranche
will lapse.
Consistent with the terms of his service
agreement, the Managing Director’s
options may vest and become exercisable
upon cessation of his employment.
Whether vesting occurs will depend on
the circumstances - for example, where
the Managing Director retires by mutual
agreement with the Board, his outstanding
options may vest and become exercisable at
the Board’s discretion. However, no options
will vest or become exercisable where the
Company terminates the Managing Director’s
employment for cause.
In addition, where an entity becomes
entitled to more than 30% of the Company’s
total number of voting shares, the Managing
Director will be entitled to exercise his
outstanding options unless the Board,
in its discretion, determines otherwise.
Tranche 1 options were tested against the performance condition in 2007, with the following results:
ASX 100 comparator group E&P comparator group(applying to 250,000 options) (applying to 250,000 options)
Santos TSR ranking at 26 August 2007 22nd percentile 50th percentile
Santos TSR ranking at 26 November 2007 (first re-test) 40th percentile 50th percentile
Number of options exercisable Nil 125,000
Tranche 1 options still not vested by 26 August 2008 will lapse.
Details of remuneration paid in 2007
Table 7: Managing Director’s 2007 remuneration details
Share-based Other
Post- payments long-term
Short-term employee benefits employment (LTI) Termination benefits Total
Base salary STI Other Superannuation Options
$1,702,694 $1,950,000 $1,9441 $987,3572 $1,898,2733 - $297,5004 $6,837,768
1 This amount represents the cost of car parking provided up to 30 April 2007. From 1 May 2007, the cost of parking in the Company’s new head office was paid by the Managing Director.
2 This amount reflects the accounting value ascribed to the superannuation benefit reflecting the services provided during the period. The actual contribution made during 2007 by the Company in respect of the current and future entitlements of the Managing Director was $1,094,334.
3 In accordance with the requirements of the Accounting Standards, remuneration includes a proportion of the notional value of equity compensation granted or outstanding during the year. The notional value of equity instruments which do not vest during the reporting period is determined as at the grant date and is progressively allocated over the vesting period. The amount included as remuneration is not related to or indicative of the benefit (if any) that the Managing Director may ultimately realise should the equity instruments vest. The notional value of options as at their date of grant was determined in accordance with AASB 2 “Share Based Payment” applying the Monte Carlo valuation method. Details of the assumptions underlying the valuation are set out in Note 30 to the financial statements. The amounts set out above include a proportion of the value of options granted to the Managing Director in 2006 that had not vested as at 1 January 2007. Of the Managing Director’s total remuneration for the year, 28% consisted of options.
4 This amount represents the Managing Director’s long service leave accrual as at 31 December 2007.

62
Santos Annual Report 2007
Service Agreement
The Company has entered into a service
agreement with the Managing Director. The
service agreement is ongoing until
termination by the Company or the Managing
Director.
The service agreement provided that the
Company may terminate the Managing
Director’s employment on giving 24 months’
notice. The contract was varied in 2006 to
reduce the notice period to 12 months,
effective from 1 January 2008. Where the
Company exercises this general right to
terminate, it must make a payment to the
Managing Director equivalent to his base
salary for the full notice period.
The Company may terminate the Managing
Director’s employment at any time for cause.
No payment in lieu of notice will be made in
this circumstance.
Mr Ellice-Flint may initiate termination
of his service agreement by giving three
months’ notice.
Table 8: Relative weightings of remuneration components
% of total remuneration (annualised)
Fixed Performance-based
remuneration remuneration
TFR STI LTI
Executive Vice Presidents and Chief Financial Officer 52% 27% 21%
Other Senior Executives 57% 20% 23%
Senior Executive remuneration
Remuneration components and their
relative weightings
Total remuneration for Senior Executives is
made up of the following components:
• Base remuneration - comprising salary
and superannuation;
• Short-term incentives (STI) - annual
bonuses tied to individual and Company
performance; and
• Long-term incentives (LTI) - equity grants
tied to vesting conditions tested over a
three-year period.
Santos’ executive remuneration structure
is consistent with the Company’s “pay for
performance” policy.
The relative weightings of the three
components comprising the Senior
Executives’ total remuneration are
provided in Table 8 below.
Base remuneration
Salary and superannuation Senior Executives are paid Total Fixed Remuneration (TFR), out of which the Company makes
contributions into their superannuation funds of at least the minimum statutory amount.
They may, if they wish, salary sacrifice part of their TFR for additional superannuation
contributions or other benefits such as novated car leases.
Benefits Senior Executives do not receive any benefits in addition to TFR.
Market alignment Executive remuneration levels are market-aligned by comparison against similar roles in ASX
100 energy, materials and utilities companies, excluding BHP Billiton and Rio Tinto due to
their disproportionately larger size and market capitalisation. This broad industry group is
used as there are too few Australian exploration and production companies of similar size to
Santos for benchmarking purposes.
Short-term Incentive
Frequency STI is assessed and paid annually.
Maximum STI 75% of TFR for the CFO and Executive Vice Presidents.
50% of TFR for other Senior Executives.
Remuneration Report (continued)
63
Santos Annual Report 2007
Performance measures To promote collaboration among Senior Executives and to focus their efforts towards the
overall benefit of the Company, 70% of their STI is based on Company performance. The
remaining 30% is based on the executive’s individual performance.
A range of Company performance metrics is used in order to drive balanced business
performance. These metrics include lagging indicators to assess the Company’s past
performance, as well as forward-looking indicators to ensure the Company is positioning itself
well for future growth. The metrics include reserve growth, reserve replacement cost,
production, margin, new growth options, shareholder value creation, people, environment,
health and safety and continuous improvement. Individual performance is assessed against
targets set within each executive’s area of responsibility.
Assessment of performance Individual performance is assessed by the Managing Director, who makes a recommendation
to the Remuneration Committee.
Company performance is assessed by the Remuneration Committee. Each metric is assessed
against target and assigned a score on a five-point scale. The average of these scores forms
the overall Company performance score.
The Remuneration Committee then makes a recommendation to the Board as to the amount of
STI to be paid to each Senior Executive (based on both individual and Company performance).
The Board believes the above methods of assessment are rigorous and transparent and
provide a balanced assessment of the executive’s performance.
Payment method Cash.
STI awarded in 2007 Company performance against the metrics in 2007 resulted in an average STI of 80% of
maximum payable to all eligible employees.
2007 STI awards made to individual Senior Executives ranged from 67% to 84% of maximum.
The difference between actual STI paid and maximum STI was forfeited.
Long-term Incentives
The Company made two LTI grants to its Senior Executives in 2007. These were:
• a “Performance Grant” subject to satisfaction of performance conditions linked to delivery of sustained returns to shareholders; and
• a “Growth Award” that has a specific retention focus and is subject to a service condition. The Board’s reasons for granting the Growth
Award are explained on pages 56 to 57.
Both the Performance Grant and the Growth Award were granted, at the executive’s election, in the form of either:
• Share Acquisition Rights (SARs) - a conditional entitlement to a fully paid ordinary share at zero price, subject to satisfaction of vesting
conditions; or
• Options - an entitlement to acquire a fully paid ordinary share at a predetermined price, subject to satisfaction of vesting conditions.
The size of the grant made to each executive was determined by reference to the median grant size offered to executives in similar roles in
comparable companies.
Vesting details of the Performance Grant and the Growth Award are summarised in Table 9 below. In addition, Table 11 contains details of the
number and value of SARs and options granted to Senior Executives in 2007.

64
Santos Annual Report 2007
Table 9: Performance Grant and Growth Award vesting details
Vesting period
Vesting condition
Vesting schedule
Exercise price
Re-testing of performance conditions
Performance Grant
1 January 2007 to 31 December 2009.
Vesting of this grant is based on two
performance conditions, each applying
to 50% of the grant:
• relative TSR against Australian and
international E&P companies (see
Appendix 1 (page 68) for a listing
of the relevant companies); and
• an annualised compound absolute
TSR target of 11% over the performance
period.
The Board’s reasons for using these
performance conditions are explained on
page 56 to 57.
Relative TSR condition
Santos TSR % ofpercentile ranking grant vesting< 50th percentile 0%
= 50th percentile 50%
51st to 74th percentile 52% to 98%
(additional 2% for
each percentile
improvement)
≥ 75th percentile 100%
Absolute TSR condition
0% if annualised compound TSR is less
than 11%.
100% if annualised compound TSR is
11% or greater.
$14.14 for options, being the volume
weighted average price in the week up to
and including the grant date of 1 July 2007.
SARs have no exercise price.
There is no re-testing of the performance
conditions if they are not satisfied.
Growth Award
1 July 2007 to 30 June 2010, except for
Mr D J Knox (see below).
For all Senior Executives except Mr D J Knox,
vesting of the Growth Award is based on
continuous service to 30 June 2010, or three
years from the grant date.
For Mr D J Knox, vesting of the Growth
Award is based on continuous service to
2 September 2010, which is three years
from his date of commencement with the
Company.
0% if the continuous service condition is
not met.
100% if the continuous service condition
is met.
As for Performance Grant.
Not applicable.
Remuneration Report (continued)

65
Santos Annual Report 2007
Upon cessation of employment, SARs which have not already vested and options which are not exercisable will, in general, lapse and be
forfeited. However, if cessation occurs due to death, disability or redundancy, or in special circumstances approved by the Board, then a
proportion of the SARs and options may vest and become exercisable.
Where there is a change in control, the Board may determine whether, and the extent to which, SARs and options may vest.
In 2007, a Performance Grant, with the performance period 1 January 2004 to 31 December 2006, was tested against its TSR hurdles relative
to ASX 100 and E&P comparator groups. The Company’s TSR percentile ranking against both comparator groups was below the 50th percentile,
therefore all the SARs and options issued in this grant failed to vest, and consequently lapsed.
Details of remuneration paid in 2007
Table 10: 2007 Senior Executive remuneration details
Post- Share-based payments3
Short-term employee benefits employment (LTIs)
Other
Super- long term
Base salary STI Other1 annuation SARs Options Termination benefits4 Total
J H Anderson $426,902 $199,500 $1,944 $44,542 $61,371 $35,458 - $119,457 $889,174
J L Baulderstone $379,833 $167,000 $1,463 $38,340 $55,916 $33,200 - - $675,751
T J Brown $465,358 $163,700 $1,944 $17,6272 $61,826 $36,330 - $57,923 $804,708
M E J Eames $505,228 $235,100 $1,944 $52,766 $135,576 $22,181 - $22,682 $975,477
R M Kennett $391,597 $187,500 $1,976 $66,082 $72,549 - - $234,560 $954,264
D J Knox $230,403 $143,300 - $21,792 $65,429 $28,143 - - $489,067
M S Macfarlane $426,902 $180,700 $1,944 $44,542 $78,517 $22,682 - $108,597 $863,884
P C Wasow $631,261 $406,900 $1,944 $12,686 $158,421 - - $57,732 $1,268,945
R J Wilkinson $411,455 $207,800 $1,944 $81,752 $118,370 - - $104,229 $925,551
J T Young $383,216 $239,200 $1,944 $12,686 $135,084 $33,186 - $99,397 $904,713
1 These amounts represent the cost of car parking provided partly in the Company’s old head office premises in Adelaide and partly in its current premises, up to 30 April 2007. On 1 May 2007, the cost of parking in the Company’s current head office was added to TFR, and from then on Executives were required to obtain parking via salarysacrifice.
2 This amount reflects the accounting value ascribed to the superannuation benefit reflecting the services provided during the period. The actual contribution made during 2007 by the Company in respect of the current and future entitlements of Mr T J Brown was $12,686.
3 In accordance with the requirements of the Accounting Standards, remuneration includes a proportion of the notional value of equity compensation granted or outstanding during the year. The notional value of equity instruments which do not vest during the reporting period is determined as at the grant date and is progressively allocated over the vesting period. The amount included as remuneration is not related to or indicative of the benefit (if any) that individual executives may ultimately realise should the equity instruments vest. The notional value of SARs and options as at their date of grant was determined in accordance with AASB 2 “Share Based Payment” applying the Monte Carlo valuation method. Details of the assumptions underlying the valuation are set out in Note 30 to the financial statements. The amounts set out above include a proportion of the value of SARs and Options granted during 2007 under the Performance Grant and Growth Awards as well as a proportion of the value of SARs and options granted in previous financial years that had not vested as at 1 January 2007. The percentage of each Senior Executive’s total remuneration for the year that consisted of SARs and options are as follows:J H Anderson 11%J L Baulderstone 13%T J Brown 12%M E J Eames 16%M S Macfarlane 8%R M Kennett 19%D J Knox 12%P C Wasow 12%R J Wilkinson 13%J T Young 19%
4 These amounts represent Senior Executives’ long service leave accruals as at 31 December 2007.

66
Santos Annual Report 2007
Table 11: SARs and Options granted to Senior Executives in 20071,2
Number Maximum Exercise
Executive granted value3 price4 Exercise period Expiry date
J H Anderson
SARs (Performance Grant) 13,500 $134,325 1 January 2017
SARs (Growth Award) 13,500 $172,530 1 January 2017
J L Baulderstone
Options (Performance Grant) 50,000 $166,000 $14.14 1 January 2010 - 31 December 2016 1 January 2017
SARs (Performance Grant) 18,450 $122,385 1 January 2017
SARs (Growth Award) 18,450 $157,194 1 January 2017
T J Brown
SARs (Performance Grant) 13,600 $135,320 1 January 2017
SARs (Growth Award) 13,600 $173,808 1 January 2017
M E J Eames
SARs (Performance Grant) 16,000 $159,200 1 January 2017
SARs (Growth Award) 16,000 $204,480 1 January 2017
R M Kennett
SARs (Performance Grant) 9,100 $90,545 1 January 2017
SARs (Growth Award) 9,100 $116,298 1 January 2017
D J Knox
SARs (Performance Grant) 50,000 $458,000 1 July 2017
Options (Growth Award) 100,000 $197,000 $12.81 1 July 2010 - 30 June 2017 1 July 2017
M S Macfarlane
SARs Performance Grant) 13,500 $134,325 1 January 2017
SARs (Growth Award) 13,500 $172,530 1 January 2017
P C Wasow
SARs (Performance Grant) 18,500 $184,075 1 January 2017
SARs (Growth Award) 18,500 $236,430 1 January 2017
R J Wilkinson
SARs (Performance Grant) 14,100 $140,295 1 January 2017
SARs (Growth Award) 14,100 $180,198 1 January 2017
J T Young
SARs (Performance Grant) 19,500 $194,025 1 January 2017
SARs (Growth Award) 19,500 $249,210 1 January 2017
1 No additional SARs or options were granted to the Managing Director in 2007. 2 The grants made to the senior executives during the year constituted 100% of the grants available for the year. As the SARs and Options only vest on satisfaction of
service and/or performance conditions to be tested in future financial years, none of the SARs or Options detailed above were forfeited during the year. Details of therelevant service and performance conditions (including the applicable vesting periods) are set out in Table 9 above.
3 Maximum value represents the fair value of the Performance Grants and Growth Awards as at their grant date of 1 July 2007, except for D J Knox’s grants which had a grant date of 3 September 2007. The Monte Carlo simulation approach was used to determine the value of the SARs and options granted. Details of the assumptionsunderlying the valuation are set out in Note 30 to the financial statements. The minimum total value of the grant, if the applicable vesting conditions are not met, is nil in all cases.
4 If they vest, SARs are granted at nil price without the requirement to exercise them.
Service Agreements
The Company has entered into service
agreements with the Senior Executives.
The service agreements are ongoing
until termination by the Company or
the Senior Executive.
Mr J T Young’s service agreement may be
terminated by either party by giving three
months’ notice. The service agreements of all
other Senior Executives may be terminated by
the relevant executive by giving six months’
notice, or by the Company by giving 12
months’ notice. In the case of a Company-
initiated termination, the Company may make
a payment in lieu of notice equivalent to the
TFR the executive would have received over
the notice period.
All Senior Executives’ service agreements
may be terminated immediately for cause,
whereupon no payments in lieu of notice or
other termination payments apply.
Remuneration Report (continued)
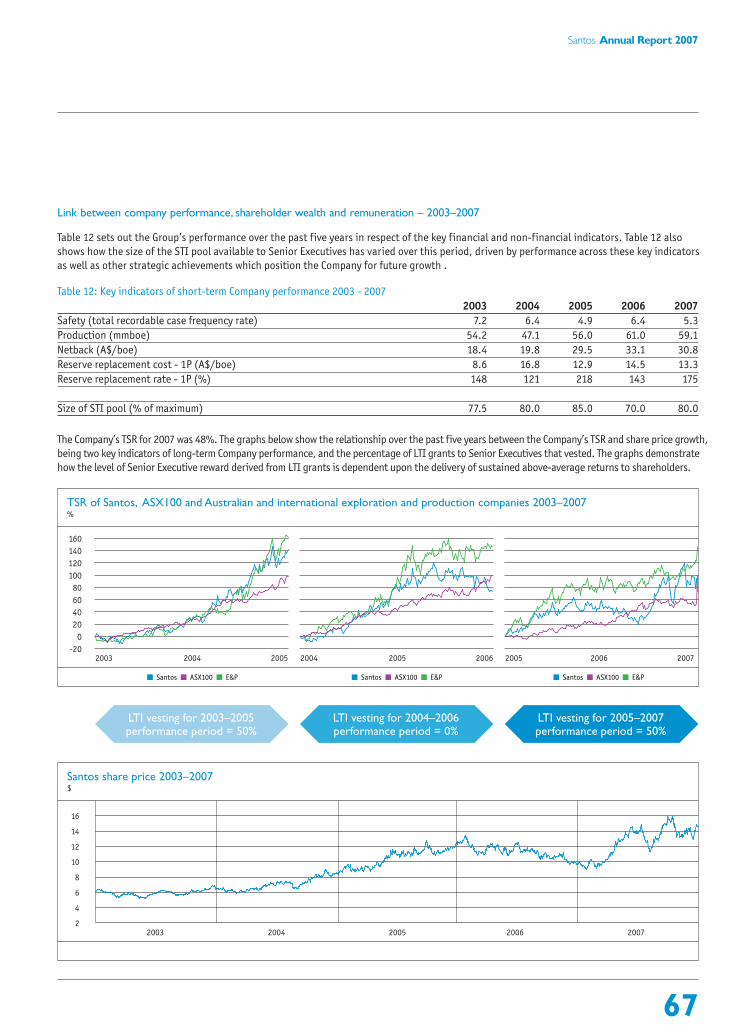
67
Santos Annual Report 2007
Link between company performance, shareholder wealth and remuneration – 2003–2007
Table 12 sets out the Group’s performance over the past five years in respect of the key financial and non-financial indicators. Table 12 also
shows how the size of the STI pool available to Senior Executives has varied over this period, driven by performance across these key indicators
as well as other strategic achievements which position the Company for future growth .
Table 12: Key indicators of short-term Company performance 2003 - 2007
2003 2004 2005 2006 2007
Safety (total recordable case frequency rate) 7.2 6.4 4.9 6.4 5.3
Production (mmboe) 54.2 47.1 56.0 61.0 59.1
Netback (A$/boe) 18.4 19.8 29.5 33.1 30.8
Reserve replacement cost - 1P (A$/boe) 8.6 16.8 12.9 14.5 13.3
Reserve replacement rate - 1P (%) 148 121 218 143 175
Size of STI pool (% of maximum) 77.5 80.0 85.0 70.0 80.0
The Company’s TSR for 2007 was 48%. The graphs below show the relationship over the past five years between the Company’s TSR and share price growth,
being two key indicators of long-term Company performance, and the percentage of LTI grants to Senior Executives that vested. The graphs demonstrate
how the level of Senior Executive reward derived from LTI grants is dependent upon the delivery of sustained above-average returns to shareholders.
2005 2005 2006 20072004 200620042003 2005
2003 2004 2005 2006 20072
4
6
8
10
12
14
16
Santos share price 2003–2007$
TSR of Santos, ASX100 and Australian and international exploration and production companies 2003–2007%
LTI vesting for 2003–2005performance period = 50%
LTI vesting for 2004–2006performance period = 0%
LTI vesting for 2005–2007performance period = 50%
Santos ASX100 E&P Santos ASX100 E&P Santos ASX100 E&P
-20
0
20
40
60
80
100
120
140
160

68
Santos Annual Report 2007
The TSR growth shown above incorporates
dividends and capital returns the Company
made to shareholders during the past five
years. Dividends paid by the Company in the
past five years are as follows:
(Dividends per ordinary share)
2003 $0.30
2004 $0.30
2005 $0.36
2006 $0.40
2007 $0.40
The following capital returns were made in
the 2003 - 2007 period:
• In conjunction with its $600 million
offering of Redeemable Convertible
Preference Shares (or FUELS), on 30
September 2004 the Company redeemed
and bought back the entire 3,500,000
Reset Convertible Preference Shares on
issue at that date. 2,865,821 were
redeemed at face value and reinvested in
FUELS, 489,774 shares were bought back
for $105 each and cancelled, and
144,405 were redeemed at face value.
• On 30 June 2007, the Company bought
back 24,671,275 fully paid ordinary
shares, representing 4.10% of fully paid
ordinary shares on issue at that date, at a
price of $12.16 per share.
Appendices
Appendix 1: LTI comparator groups
Managing Director’s LTI comparator groups:
Comparator group 1 - ASX 100 companies
as at 4 May 2006.
Comparator group 2 - Australian and
international E&P companies:
Anadarko Petroleum Ltd
Apache Corp
Australian Worldwide Exploration Ltd
Cairn Energy PLC
Chesapeake Energy Corp
EOG Resource Inc
Forest Oil Corp
Hardman Resources Ltd
Kerr McGee Corp
Murphy Oil Corp
Newfield Exploration Co
Nexen Inc
Noble Energy Inc
Oil Search Ltd
Pioneer Natural Resources Co
Pogo Producing Co
Premier Oil PLC
Talisman Energy Inc
Woodside Petroleum Ltd
XTO Energy Inc.
Senior Executive LTI Performance Grant
comparator group
Australian and international E&P companies:
Anadarko Petroleum Ltd
Apache Corp
Australian Worldwide Exploration Ltd
Cairn Energy PLC
Chesapeake Energy Corp
EOG Resource Inc
Forest Oil Corp
Murphy Oil Corp
Newfield Exploration Co
Nexen Inc
Noble Energy Inc
Oil Search Ltd
Pioneer Natural Resources Co
Pogo Producing Co
Premier Oil PLC
Talisman Energy Inc
Woodside Petroleum Ltd
XTO Energy Inc.
Remuneration Report (continued)

69
Santos Annual Report 2007
Ap
pen
dix
2:
Mo
vem
ents
in
Man
agin
g D
irec
tor’
s an
d S
enio
r Ex
ecu
tive
s’ S
AR
s an
d O
pti
on
s in
20
07
Tab
le 1
3:
Mo
vem
ents
in
Man
agin
g D
irec
tor’
s an
d S
enio
r Ex
ecu
tive
s’ S
AR
s an
d O
pti
on
s in
20
07
Mov
emen
ts i
n n
um
ber
Mov
emen
ts i
n v
alu
eSA
Rs
Vest
ed/
Bal
ance
at
Forf
eite
d/
Bal
ance
at
Op
tion
sLa
pse
d/
1/1
/07
Gra
nte
dVe
sted
Exer
cise
d1
Lap
sed
31/1
2/0
7
Gra
nte
d3
Exer
cise
d4
Forf
eite
d5
J C
Elli
ce-F
lin
t2
SA
Rs
--
--
--
--
-O
pti
on
s2
,50
0,0
00
-1
25
,00
0-
-2
,50
0,0
00
--
-J
H A
nd
erso
nS
AR
s-
27,0
00
--
-27
,00
0$
30
6,8
55
--
Op
tio
ns
13
4,0
44
--
-(2
8,8
00
)10
5,2
44
--
$2
5,9
20
J L
Bau
lder
sto
ne
SA
Rs
-3
6,9
00
--
-3
6,9
00
$27
9,5
79
--
Op
tio
ns
-5
0,0
00
--
-5
0,0
00
$16
6,0
00
--
T J
Bro
wn
SA
Rs
-27
,20
0-
--
27,2
00
$3
09
,12
8-
-O
pti
on
s1
84
,76
9-
-(4
6,3
69
)(2
9,0
00
)10
9,4
00
-$
29
5,9
77
$2
6,1
00
M E
J E
ames
SA
Rs
39
,50
03
2,0
00
--
-71
,50
0$
36
3,6
80
--
Op
tio
ns
50
,00
0-
--
-5
0,0
00
--
-R
M K
enn
ett
SA
Rs
28
,80
01
8,2
00
--
(9,0
00
)3
8,0
00
$2
06
,84
3-
$37
,53
0O
pti
on
s-
--
--
--
--
D J
Kn
ox
SA
Rs
-5
0,0
00
--
-5
0,0
00
$4
58
,00
0-
-O
pti
on
s-
100
,00
0-
--
100
,00
0$
197,
00
0-
-M
S M
acfa
rlan
eS
AR
s19
,20
027
,00
0-
-(9
,60
0)
36
,60
0$
30
6,8
55
-$
40
,03
2O
pti
on
s6
3,7
00
--
--
63
,70
0-
--
P C
Was
ow
SA
Rs
70
,20
037
,00
0-
-(2
3,6
00
)8
3,6
00
$4
20
,50
5-
$9
8,4
12
Op
tio
ns
--
--
--
--
-R
J W
ilki
nso
nS
AR
s51
,60
02
8,2
00
--
(17,
70
0)
62
,10
0$
32
0,4
93
-$
73,8
09
Op
tio
ns
--
--
--
--
-J
T Yo
un
gS
AR
s5
2,0
00
39
,00
0-
-(2
6,0
00
)6
5,0
00
$4
43
,23
5-
$10
8,4
20
Op
tio
ns
93
,20
0-
--
-9
3,2
00
--
-To
tal S
AR
s$
3,4
15
,173
$0
$3
58
,20
3To
tal O
pti
ons
$3
63
,00
0$
29
5,9
77
$5
2,0
20
1Fo
r ea
ch o
pti
on
exe
rcis
ed d
uri
ng
th
e ye
ar,
the
rele
van
t e
xecu
tive
rec
eive
d o
ne
full
y p
aid
ord
inar
y sh
are
in t
he
Com
pan
y. O
pti
on
s w
ere
exe
rcis
ed o
n 2
1 D
ecem
ber
20
07,
at a
n e
xerc
ise
pri
ce o
f $
6.3
8p
er o
pti
on
fo
r 27
,09
5 o
pti
on
s an
d $
6.9
5 p
er o
pti
on
fo
r 19
,274
op
tio
ns.
2
No
SA
Rs
or
op
tio
ns
wer
e g
ran
ted
to
th
e M
anag
ing
Dir
ecto
r in
20
07.
No
ne
of
the
op
tio
ns
fro
m h
is g
ran
ts p
rio
r to
20
07 w
ere
exe
rcis
ed,
forf
eite
d o
r la
pse
d i
n 2
007
.3
Th
e va
luat
ion
ap
pro
ach
use
d f
or
SA
Rs
and
op
tio
ns
gra
nte
d d
uri
ng
th
e ye
ar i
s se
t o
ut
in T
able
11
ab
ove
an
d N
ote
30
to
th
e fi
nan
cial
sta
tem
ents
co
nta
ined
in
th
e 2
007
Fin
anci
al R
epo
rt.
4Th
e va
lue
of
each
SA
R o
n t
he
dat
e o
f ve
stin
g i
s b
ased
on
th
e cl
osi
ng
mar
ket
pri
ce o
f S
anto
s Li
mit
ed s
har
es o
n A
SX
on
th
e p
rece
din
g t
rad
ing
day
. Th
e va
lue
of
each
op
tio
n e
xerc
ised
du
rin
g t
he
year
is
bas
ed o
n t
he
dif
fere
nce
bet
wee
n t
he
clo
sin
g m
arke
t p
rice
of
San
tos
Lim
ited
sh
ares
on
AS
X o
n t
he
pre
ced
ing
tra
din
g d
ay a
nd
th
e re
leva
nt
exe
rcis
e p
rice
. 5
The
valu
e o
f a
SA
R o
r o
pti
on
on
th
e d
ay i
t la
pse
d r
epre
sen
ts t
he
ben
efit
fo
reg
on
e as
det
erm
ined
by
the
Mo
nte
Car
lo v
alu
atio
n m
eth
od
at
the
dat
e th
e S
AR
or
op
tio
n w
as g
ran
ted
.

70
Santos Annual Report 2007
Consolidated Consolidated Santos Ltd
2007 2006 2007 2006
Continuing Discontinued Total Continuing Discontinued Total
Note $million $million $million $million $million $million $million $million
Product sales 2 2,458.4 30.1 2,488.5 2,689.1 61.2 2,750.3 974.3 1,187.1
Cost of sales 3 (1,446.3) (5.8) (1,452.1) (1,302.2) (35.2) (1,337.4) (643.3) (703.3)
Gross profit 1,012.1 24.3 1,036.4 1,386.9 26.0 1,412.9 331.0 483.8
Other revenue 2 29.1 – 29.1 29.0 – 29.0 901.3 31.3
Other income 2 81.7 (69.6) 12.1 25.0 38.9 63.9 15.6 6.1
Other expenses 3 (317.8) (20.5) (338.3) (325.4) (92.7) (418.1) 169.7 (401.4)
Operating profit/(loss) before net
financing costs 805.1 (65.8) 739.3 1,115.5 (27.8) 1,087.7 1,417.6 119.8
Financial income 5 13.6 0.8 14.4 12.0 0.6 12.6 188.8 36.9
Financial expenses 5 (152.7) – (152.7) (135.5) (0.1) (135.6) (294.4) (169.6)
Net financing (costs)/income (139.1) 0.8 (138.3) (123.5) 0.5 (123.0) (105.6) (132.7)
Profit/(loss) before tax 666.0 (65.0) 601.0 992.0 (27.3) 964.7 1,312.0 (12.9)
Income tax expense 6 (159.8) (0.6) (160.4) (321.1) (0.2) (321.3) (38.0) (97.6)
Net profit/(loss) for the period 506.2 (65.6) 440.6 670.9 (27.5) 643.4 1,274.0 (110.5)
Attributable to:
Minority interest – – – – – – – –
Equity holders of Santos Ltd 506.2 (65.6) 440.6 670.9 (27.5) 643.4 1,274.0 (110.5)
506.2 (65.6) 440.6 670.9 (27.5) 643.4 1,274.0 (110.5)
Earnings per share attributable to the
ordinary equity holders of Santos Ltd (¢)
Basic earnings per share 24 80.0 68.9 107.4 102.8
Diluted earnings per share 24 78.9 68.7 103.1 98.9
Dividends per share ($)
Ordinary shares 23 0.40 0.40
Redeemable preference shares 23 5.5864 5.0575
The income statements are to be read in conjunction with the notes to the consolidated financial statements.
Income Statementsfor the year ended 31 December 2007

71
Santos Annual Report 2007
Consolidated Santos Ltd
2007 2006 2007 2006
Note $million $million $million $million
Current assets
Cash and cash equivalents 8 200.5 158.7 56.8 52.8
Trade and other receivables 9 607.4 487.5 208.5 235.7
Inventories 10 241.5 167.4 115.9 75.0
Derivative financial instruments 11 84.1 36.1 – 1.3
1,133.5 849.7 381.2 364.8
Assets classified as held for sale 7 – 210.8 – –
Total current assets 1,133.5 1,060.5 381.2 364.8
Non-current assets
Receivables 9 – – 1,304.8 1,263.8
Exploration and evaluation assets 12 332.4 360.3 15.5 20.7
Oil and gas assets 13 5,584.4 5,232.7 1,650.1 1,719.5
Other land, buildings, plant and equipment 14 134.8 117.2 107.4 94.2
Available-for-sale financial assets 16 15.6 45.2 15.6 20.3
Other financial assets 17 32.7 11.9 3,488.4 2,841.7
Deferred tax assets 18 86.8 75.1 – –
Total non-current assets 6,186.7 5,842.4 6,581.8 5,960.2
Total assets 7,320.2 6,902.9 6,963.0 6,325.0
Current liabilities
Trade and other payables 19 661.4 441.8 642.9 562.9
Deferred income 12.0 6.4 1.7 1.7
Interest-bearing loans and borrowings 20 103.1 289.3 – –
Current tax liabilities 30.5 213.5 28.7 207.8
Provisions 21 112.4 132.1 65.1 60.4
Other current liabilities 22 12.0 8.9 – –
931.4 1,092.0 738.4 832.8
Liabilities directly associated with assets classified as held for sale 7 – 16.8 – –
Total current liabilities 931.4 1,108.8 738.4 832.8
Non-current liabilities
Deferred income 8.8 11.3 – –
Interest-bearing loans and borrowings 20 1,992.9 1,360.4 2,478.2 2,583.6
Deferred tax liabilities 18 525.6 517.5 54.1 65.3
Provisions 21 543.6 541.8 167.8 184.8
Other non-current liabilities 22 7.4 7.6 – –
Total non-current liabilities 3,078.3 2,438.6 2,700.1 2,833.7
Total liabilities 4,009.7 3,547.4 3,438.5 3,666.5
Net assets 3,310.5 3,355.5 3,524.5 2,658.5
Equity
Issued capital 23 2,331.6 2,254.4 2,331.6 2,254.4
Reserves 23 (272.9) (200.3) 7.4 2.4
Retained earnings 23 1,251.8 1,301.4 1,185.5 401.7
Equity attributable to equity holders of Santos Ltd 3,310.5 3,355.5 3,524.5 2,658.5
Equity attributable to minority interest – – – –
Total equity 3,310.5 3,355.5 3,524.5 2,658.5
The balance sheets are to be read in conjunction with the notes to the consolidated financial statements.
Balance Sheetsas at 31 December 2007
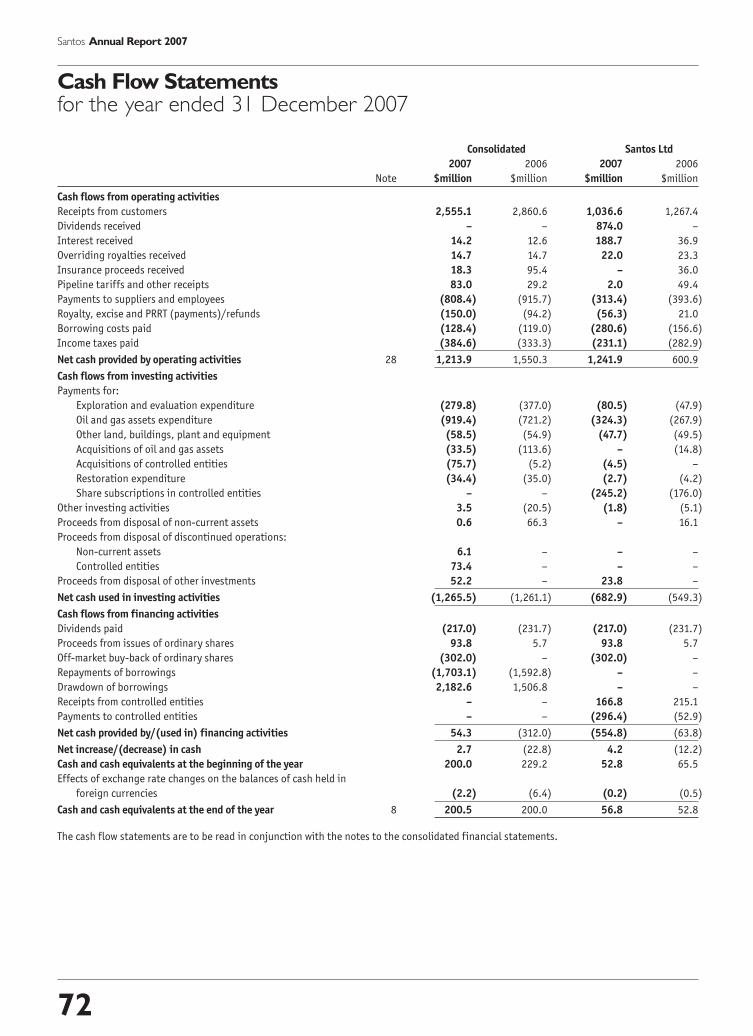
72
Santos Annual Report 2007
Consolidated Santos Ltd
2007 2006 2007 2006
Note $million $million $million $million
Cash flows from operating activities
Receipts from customers 2,555.1 2,860.6 1,036.6 1,267.4
Dividends received – – 874.0 –
Interest received 14.2 12.6 188.7 36.9
Overriding royalties received 14.7 14.7 22.0 23.3
Insurance proceeds received 18.3 95.4 – 36.0
Pipeline tariffs and other receipts 83.0 29.2 2.0 49.4
Payments to suppliers and employees (808.4) (915.7) (313.4) (393.6)
Royalty, excise and PRRT (payments)/refunds (150.0) (94.2) (56.3) 21.0
Borrowing costs paid (128.4) (119.0) (280.6) (156.6)
Income taxes paid (384.6) (333.3) (231.1) (282.9)
Net cash provided by operating activities 28 1,213.9 1,550.3 1,241.9 600.9
Cash flows from investing activities
Payments for:
Exploration and evaluation expenditure (279.8) (377.0) (80.5) (47.9)
Oil and gas assets expenditure (919.4) (721.2) (324.3) (267.9)
Other land, buildings, plant and equipment (58.5) (54.9) (47.7) (49.5)
Acquisitions of oil and gas assets (33.5) (113.6) – (14.8)
Acquisitions of controlled entities (75.7) (5.2) (4.5) –
Restoration expenditure (34.4) (35.0) (2.7) (4.2)
Share subscriptions in controlled entities – – (245.2) (176.0)
Other investing activities 3.5 (20.5) (1.8) (5.1)
Proceeds from disposal of non-current assets 0.6 66.3 – 16.1
Proceeds from disposal of discontinued operations:
Non-current assets 6.1 – – –
Controlled entities 73.4 – – –
Proceeds from disposal of other investments 52.2 – 23.8 –
Net cash used in investing activities (1,265.5) (1,261.1) (682.9) (549.3)
Cash flows from financing activities
Dividends paid (217.0) (231.7) (217.0) (231.7)
Proceeds from issues of ordinary shares 93.8 5.7 93.8 5.7
Off-market buy-back of ordinary shares (302.0) – (302.0) –
Repayments of borrowings (1,703.1) (1,592.8) – –
Drawdown of borrowings 2,182.6 1,506.8 – –
Receipts from controlled entities – – 166.8 215.1
Payments to controlled entities – – (296.4) (52.9)
Net cash provided by/(used in) financing activities 54.3 (312.0) (554.8) (63.8)
Net increase/(decrease) in cash 2.7 (22.8) 4.2 (12.2)
Cash and cash equivalents at the beginning of the year 200.0 229.2 52.8 65.5
Effects of exchange rate changes on the balances of cash held in
foreign currencies (2.2) (6.4) (0.2) (0.5)
Cash and cash equivalents at the end of the year 8 200.5 200.0 56.8 52.8
The cash flow statements are to be read in conjunction with the notes to the consolidated financial statements.
Cash Flow Statementsfor the year ended 31 December 2007

73
Santos Annual Report 2007
Consolidated Santos Ltd
2007 2006 2007 2006
Note $million $million $million $million
Foreign exchange translation differences (101.8) (81.6) – –
Net gain on hedge of net investment in foreign subsidiaries 62.6 52.0 – –
Change in fair value of available-for-sale financial assets, net of tax 17.4 7.6 14.7 (2.0)
Share-based payment transactions 30 5.2 2.6 5.2 2.6
Actuarial gain/(loss) on defined benefit plan, net of tax 29 4.4 (6.3) 4.4 (6.3)
Net income/(expense) recognised directly in equity (12.2) (25.7) 24.3 (5.7)
Transfers (net of any related tax):
Transfer to profit on sale of available-for-sale financial assets (23.6) – (9.7) –
Transfer to profit on disposal of foreign operation (27.2) – – –
Profit/(loss) for the period 440.6 643.4 1,274.0 (110.5)
Total recognised income and expense for the period 377.6 617.7 1,288.6 (116.2)
Attributable to:
Equity holders of Santos Ltd 23 377.6 617.7 1,288.6 (116.2)
Minority interest – – – –
377.6 617.7 1,288.6 (116.2)
Other movements in equity arising from transactions with owners as owners are set out in note 23.
The statements of recognised income and expense are to be read in conjunction with the notes to the consolidated financial statements.
Statements of Recognised Income and Expensefor the year ended 31 December 2007

74
Santos Annual Report 2007
Notes to the Consolidated Financial Statementsfor the year ended 31 December 2007
1. SIGNIFICANT ACCOUNTINGPOLICIES
The financial report of Santos Ltd (“the
Company”) for the year ended 31 December
2007 was authorised for issue in accordance
with a resolution of the Directors on
21 February 2008.
Santos Ltd (the parent) is a company limited
by shares incorporated in Australia whose
shares are publicly traded on the Australian
Securities Exchange (“ASX”) and is the
ultimate parent entity in the Group. The
consolidated financial report of the Company
for the year ended 31 December 2007
comprises the Company and its controlled
entities (“the Group”).
The nature of the operations and principal
activities of the Group are described in the
Directors’ Report.
(A) STATEMENT OF COMPLIANCE
The financial report is a general purpose
financial report which has been prepared
in accordance with the requirements of
the Corporations Act 2001, Australian
Accounting Standards and other
authoritative pronouncements of the
Australian Accounting Standards Board.
Compliance with Australian Accounting
Standards ensures that the financial
statements and notes of the Group and
the Company comply with International
Financial Reporting Standards (“IFRSs”).
(B) BASIS OF PREPARATION
The financial report is presented in
Australian dollars.
The financial report is prepared on the
historical cost basis, except for
derivative financial instruments and
available-for-sale financial assets, which
are measured at fair value.
The Company is of a kind referred to in
ASIC Class Order 98/100 dated 10 July
1998 (updated by Class Order 05/641
effective 28 July 2005), and in accordance
with that Class Order amounts in the
financial report and Directors’ Report
have been rounded to the nearest
hundred thousand dollars, unless
otherwise stated.
Adoption of new accounting standards
The Group has adopted the following
standards and interpretations, and all
consequential amendments, which
became applicable on 1 January 2007.
Adoption of these standards and
interpretations has only affected the
disclosure in these financial statements.
There has not been any impact on the
financial position or performance of
the Group.
• AASB 7 Financial Instruments:
Disclosures
• AASB 101 Presentation of Financial
Statements (issued in October 2006)
• AASB 2005-10 Amendments to
Australian Accounting Standards
(AASB 132, 101, 114, 117, 133, 139, 1,
4, 1023 and 1038)
• Interpretation 10 Interim Financial
Reporting and Impairment
The Group has also early adopted the
amendments to Australian Accounting
Standards as set out in AASB 2007-4
Amendments to Australian Accounting
Standards arising from ED 151 and Other
Amendments.
The following standards, amendments
and interpretations were available for
early adoption but have not been applied
by the Group in these financial
statements:
• AASB 8 Operating Segments
• AASB 101 Presentation of Financial
Statements (issued in September
2007)
• AASB 123 Borrowing Costs
• AASB 2007-1 Amendments to
Australian Accounting Standards
arising from Interpretation 11
• AASB 2007-3 Amendments to
Australian Accounting Standards
arising from AASB 8
• AASB 2007-6 Amendments to
Australian Accounting Standards
arising from AASB 123
• AASB 2007-7 Amendments to
Australian Accounting Standards
• AASB 2007-8 Amendments to
Australian Accounting Standards
arising from AASB 101
• Interpretation 11 Group and Treasury
Share Transactions
• Interpretation 14 AASB 119 – The
Limit on A Defined Benefit Asset,
Minimum Funding Requirements and
their Interaction
The Group plans to adopt the above
standards from 1 January 2009 and the
interpretations from 1 January 2008.
The initial application of the standards
and interpretations are not expected to
have an impact on the financial results of
the Company and the Group.
The following Australian Accounting
Standards Board interpretation was also
available for early adoption but has not
been applied by the Company in these
financial statements:
• Interpretation 1003 Australian
Petroleum Resource Rent Tax
The interpretation specifies that
Australian petroleum resource rent tax
falls within the scope of AASB 112
Income Taxes, and is applicable to annual
reporting periods ending on or after
30 June 2008. The Group plans to adopt
the interpretation from 1 January 2008.

75
Santos Annual Report 2007
1. SIGNIFICANT ACCOUNTINGPOLICIES (CONTINUED)
Had PRRT and similar taxes been
accounted for as an income tax under
AASB 112, a deferred tax liability of
$306.5 million would have been
recognised (2006: deferred tax liability
$210.0 million). Profit before tax
would have increased by $116.6 million
(2006: $44.8 million), the income tax
expense attributed to these taxes
would have been $213.1 million
(2006: $251.3 million expense), and
profit after tax would have decreased
by $96.5 million (2006: $206.5 million
decrease).
The accounting policies set out below
have been applied consistently to all
periods presented in the consolidated
financial report.
The accounting policies have been
consistently applied by the Group.
(C) BASIS OF CONSOLIDATION
Subsidiaries
Subsidiaries are entities controlled by
the Company. Control exists when the
Company has the power, directly or
indirectly, to govern the financial and
operating policies of an entity so as
to obtain benefits from its activities.
In assessing control, potential voting
rights that presently are exercisable or
convertible are taken into account. The
financial statements of subsidiaries are
included in the consolidated financial
statements from the date that control
commences until the date that control
ceases. On acquisition, the assets,
liabilities and contingent liabilities of a
subsidiary are measured at their fair
value at the date of acquisition.
Investments in subsidiaries are carried at
their cost of acquisition in the Company’s
financial statements.
Intragroup balances and any unrealised
gains and losses or income and expenses
arising from intragroup transactions are
eliminated in preparing the consolidated
financial statements.
Minority interests
Minority interests in the net assets of
consolidated entities are allocated their
share of net profit after tax in the
income statement, and are identified
separately from the Group’s equity in
those entities. Minority interests consist
of the amount of those interests at the
date of the original business combination
and the minority’s share of changes in
equity since the date of the combination.
Where the minority interest has losses
greater than its equity interest in the
consolidated subsidiary, the excess and
any further losses applicable to the
minority interest are allocated against
the Group’s interest. If the minority
interest subsequently reports profits, the
profits are allocated to the Group until
the minority’s share of losses previously
absorbed by the Group have been fully
recovered.
Jointly controlled assets
Santos’ exploration and production
activities are often conducted through
joint venture arrangements governed by
joint operating agreements, production
sharing contracts or similar contractual
relationships. A summary of the Group’s
interests in its significant joint ventures
is included in note 27.
A joint venture characterised as a jointly
controlled asset involves the joint
control, and often the joint ownership,
by the venturers of one or more assets
contributed to, or acquired for the
purpose of, the joint venture and
dedicated to the purposes of the joint
venture. The assets are used to obtain
benefits for the venturers. Each venturer
may take a share of the output from the
assets and each bears an agreed share of
expenses incurred. Each venturer has
control over its share of future economic
benefits through its share of jointly
controlled assets.
The interests of the Company and of the
Group in unincorporated joint ventures
are brought to account by recognising
in the financial statements the Group’s
share of jointly controlled assets, share
of expenses and liabilities incurred, and
the income from the sale or use of its
share of the production of the joint
venture in accordance with the revenue
policy in note 1(X).
Jointly controlled entities
The Group has interests in joint ventures
which are jointly controlled entities,
whereby the venturers have contractual
arrangements that establish joint control
over the economic activities of the
entities. The Group recognises its
interest in jointly controlled entities
using proportionate consolidation,
by combining its share of the assets,
liabilities, income and expenses of the
joint venture with similar line items in
the consolidated financial statements.
(D) FOREIGN CURRENCY
Foreign currency transactions
Transactions in foreign currencies are
translated at the foreign exchange rate
ruling at the date of the transaction.
Monetary assets and liabilities
denominated in foreign currencies at
the balance sheet date are translated to
the functional currency at the foreign
exchange rate ruling at that date.
Foreign exchange differences arising on
translation are recognised in the income
statement.

76
Santos Annual Report 2007
Notes to the Consolidated Financial Statementsfor the year ended 31 December 2007
1. SIGNIFICANT ACCOUNTINGPOLICIES (CONTINUED)
Foreign exchange differences that arise
on the translation of monetary items
that form part of the net investment in
a foreign operation are recognised in
equity in the consolidated financial
statements.
Non-monetary assets and liabilities that
are measured in terms of historical cost
in a foreign currency are translated using
the exchange rate at the date of the
transaction. Non-monetary assets and
liabilities denominated in foreign
currencies that are stated at fair value
are translated to the functional currency
at foreign exchange rates ruling at the
dates the fair value was determined.
Financial statements of foreign
operations
The assets and liabilities of foreign
operations, including fair value
adjustments arising on consolidation, are
translated to Australian dollars at foreign
exchange rates ruling at the balance
sheet date. The revenues and expenses
of foreign operations are translated to
Australian dollars at rates approximating
the foreign exchange rates ruling at
the dates of the transactions. Foreign
exchange differences arising on
retranslation are recognised directly in
the foreign currency translation reserve.
Net investment in foreign operations
Exchange differences arising from the
translation of the net investment in
foreign operations and of related
hedges are taken to the foreign currency
translation reserve. They are released
into the income statement upon disposal
of the foreign operation.
(E) DERIVATIVE FINANCIALINSTRUMENTS
The Group uses derivative financial
instruments to hedge its exposure to
changes in foreign exchange rates,
commodity prices and interest rates
arising in the normal course of business.
The principal derivatives that may be
used are forward foreign exchange
contracts, foreign currency swaps,
interest rate swaps and commodity crude
oil price swap and option contracts. Their
use is subject to a comprehensive set of
policies, procedures and limits approved
by the Board of Directors. The Group
does not trade in derivative financial
instruments for speculative purposes.
Derivative financial instruments are
recognised initially at fair value.
Subsequent to initial recognition,
derivative financial instruments are
stated at fair value. Where derivatives
qualify for hedge accounting, recognition
of any resultant gain or loss depends
on the nature of the item being
hedged, otherwise the gain or loss
on re-measurement to fair value is
recognised immediately in profit or loss.
The fair value of interest rate swaps is
the estimated amount that the Group
would receive or pay to terminate the
swap at the balance sheet date, taking
into account current interest rates and
the current creditworthiness of the swap
counterparties. The fair value of forward
exchange contracts is their quoted
market price at the balance sheet date,
being the present value of the quoted
forward price. The fair value of
commodity swap and option contracts is
their quoted market price at the balance
sheet date.
(F) HEDGING
Fair value hedge
Where a derivative financial instrument
hedges the changes in fair value of
a recognised asset or liability or an
unrecognised firm commitment (or an
identified portion of such asset, liability
or firm commitment), any gain or loss on
the hedging instrument is recognised in
the income statement. The hedged item
is stated at fair value in respect of the
risk being hedged, with any gain or loss
being recognised in the income
statement.
Cash flow hedge
Where a derivative financial instrument
is designated as a hedge of the variability
in cash flows of a recognised asset or
liability, or a highly probable forecast
transaction, the effective part of any
gain or loss on the derivative financial
instrument is recognised directly in
equity. When the forecast transaction
subsequently results in the recognition
of a non-financial asset or non-financial
liability, or the forecast transaction for
a non-financial asset or non-financial
liability becomes a firm commitment for
which fair value hedging is applied, the
associated cumulative gain or loss is
removed from equity and included in the
initial cost or other carrying amount of
the non-financial asset or non-financial
liability. If a hedge of a forecast
transaction subsequently results in the
recognition of a financial asset or a
financial liability, the associated gains
and losses that were recognised directly
in equity are reclassified into profit or
loss in the same period or periods during
which the asset acquired or liability
assumed affects profit or loss
(i.e. when interest income or expense
is recognised).
For cash flow hedges, other than those
covered by the preceding paragraph,
the associated cumulative gain or loss is
removed from equity and recognised in
the income statement in the same period
or periods during which the hedged
forecast transaction affects profit or loss.
The ineffective part of any gain or loss is
recognised immediately in the income
statement.

77
Santos Annual Report 2007
1. SIGNIFICANT ACCOUNTINGPOLICIES (CONTINUED)
When a hedging instrument expires or
is sold, terminated or exercised, or the
entity revokes designation of the hedge
relationship, but the hedged forecast
transaction is still expected to occur,
the cumulative gain or loss at that point
remains in equity and is recognised in
accordance with the above policy when
the transaction occurs. If the hedged
transaction is no longer expected to take
place, the cumulative unrealised gain or
loss recognised in equity is recognised
immediately in the income statement.
Hedge of monetary assets and liabilities
When a derivative financial instrument is
used to hedge economically the foreign
exchange exposure of a recognised
monetary asset or liability, hedge
accounting is not applied and any gain
or loss on the hedging instrument is
recognised in the income statement.
Hedge of net investment in a
foreign operation
The portion of the gain or loss on an
instrument used to hedge a net
investment in a foreign operation that is
determined to be an effective hedge is
recognised directly in equity. Any
ineffective portion is recognised
immediately in the income statement.
On disposal of the foreign operation,
the cumulative value of any such gains or
losses recognised directly in equity is
transferred to profit or loss.
(G) ACQUISITION OF ASSETS
All assets acquired are recorded at their
cost of acquisition, being the amount of
cash or cash equivalents paid, and the
fair value of assets given, shares issued
or liabilities incurred. The cost of an
asset comprises the purchase price
including any incidental costs directly
attributable to the acquisition; any costs
directly attributable to bringing the
asset to the location and condition
necessary for it to be capable of
operating; and the estimate of the costs
of dismantling and removing the asset
and restoring the site on which it is
located determined in accordance with
note 1(Q).
Business combinations
All business combinations are accounted
for by applying the purchase method.
The purchase method of accounting
involves allocating the cost of the
business combination to the fair value of
the assets acquired and the liabilities and
contingent liabilities assumed at the date
of acquisition.
(H) EXPLORATION AND EVALUATIONEXPENDITURE
Exploration and evaluation expenditure
in respect of each area of interest is
accounted for using the successful
efforts method of accounting. The
successful efforts method requires all
exploration and evaluation expenditure
to be expensed in the period it is
incurred, except the costs of successful
wells and the costs of acquiring interests
in new exploration assets, which are
capitalised as intangible exploration
and evaluation. The costs of wells are
initially capitalised pending the results
of the well.
An area of interest refers to an individual
geological area where the presence of oil
or a natural gas field is considered
favourable or has been proved to exist,
and in most cases will comprise an
individual prospective oil or gas field.
Exploration and evaluation expenditure
is recognised in relation to an area of
interest when the rights to tenure of the
area of interest are current and either:
(i) such expenditure is expected to be
recovered through successful
development and commercial
exploitation of the area of interest,
or alternatively, by its sale; or
(ii) the exploration activities in the area
of interest have not yet reached a
stage which permits reasonable
assessment of the existence of
economically recoverable reserves
and active and significant operations
in, or in relation to, the area of
interest are continuing.
The carrying amounts of the Group’s
exploration and evaluation assets are
reviewed at each balance sheet date, in
conjunction with the impairment review
process referred to in note 1(P), to
determine whether any of the following
indicators of impairment exist:
(i) tenure over the licence area has
expired during the period or will
expire in the near future, and is not
expected to be renewed;
(ii) substantive expenditure on further
exploration for and evaluation of
mineral resources in the specific area
is not budgeted or planned;
(iii) exploration for and evaluation of
resources in the specific area has not
led to the discovery of commercially
viable quantities of resources, and
the Group has decided to discontinue
activities in the specific area; or
(iv) sufficient data exists to indicate that
although a development is likely to
proceed the carrying amount of the
exploration and evaluation asset is
unlikely to be recovered in full from
successful development or from sale.
Where an indicator of impairment exists
a formal estimate of the recoverable
amount is made, and any resultant
impairment loss is recognised in the
income statement.
When a discovered oil or gas field enters
the development phase the accumulated
exploration and evaluation expenditure
is transferred to oil and gas assets –
assets in development.

78
Santos Annual Report 2007
Notes to the Consolidated Financial Statementsfor the year ended 31 December 2007
1. SIGNIFICANT ACCOUNTINGPOLICIES (CONTINUED)
(I) OIL AND GAS ASSETS
Oil and gas assets are usually single oil
or gas fields being developed for future
production or which are in the
production phase. Where several
individual oil or gas fields are to be
produced through common facilities,
the individual oil or gas fields and the
associated production facilities are
managed and reported as a single oil and
gas asset.
Assets in development
When the technical and commercial
feasibility of an undeveloped oil or gas
field has been demonstrated, the field
enters its development phase. The costs
of oil and gas assets in the development
phase are separately accounted for
as tangible assets and include past
exploration and evaluation costs,
development drilling and other
subsurface expenditure, surface plant
and equipment and any associated land
and buildings.
When commercial operation commences
the accumulated costs are transferred to
oil and gas assets – producing assets.
Producing assets
The costs of oil and gas assets in
production are separately accounted
for as tangible assets and include past
exploration and evaluation costs,
pre-production development costs and
the ongoing costs of continuing to
develop reserves for production and to
expand or replace plant and equipment
and any associated land and buildings.
These costs are subject to depreciation
and depletion in accordance with
note 1(K).
Ongoing exploration and evaluation
activities
Often the initial discovery and
development of an oil or gas asset will
lead to ongoing exploration for, and
evaluation of potential new oil or gas
fields in the vicinity with the intention
of producing any near field discoveries
using the infrastructure in place.
Exploration and evaluation expenditure
associated with oil and gas assets is
accounted for in accordance with the
policy in note 1(H). Exploration and
evaluation expenditure amounts
capitalised in respect of oil and gas
assets are separately disclosed in
note 13.
(J) LAND, BUILDINGS, PLANT ANDEQUIPMENT
Land and buildings are measured at
cost less accumulated depreciation on
buildings, less any impairment losses
recognised.
Plant and equipment is stated at cost
less accumulated depreciation and any
accumulated impairment losses. Such
cost includes the cost of rotable spares
and insurance spares that are purchased
for back up or rotation with specific plant
and equipment items. Similarly, the
cost of major cyclical maintenance is
recognised in the carrying amount of
the related plant and equipment as a
replacement only if it is eligible for
capitalisation. Any remaining carrying
amount from the cost of the previous
major cyclical maintenance is
derecognised. All other repairs and
maintenance are recognised in profit or
loss as incurred.
Depreciation on buildings, plant and
equipment is calculated in accordance
with note 1(K).
(K) DEPRECIATION AND DEPLETION
Depreciation charges are calculated to
write-off the depreciable value of
buildings, plant and equipment over their
estimated economic useful lives to the
Group. Each component of an item of
buildings, plant and equipment with a
cost that is significant in relation to the
total cost of the asset is depreciated
separately. The residual value, useful life
and depreciation method applied to an
asset is reviewed at the end of each
annual reporting period.
Depreciation of onshore buildings, plant
and equipment and corporate assets is
calculated using the straight-line method
of depreciation on an individual asset
basis from the date the asset is available
for use.
The estimated useful lives for each class
of onshore assets for the current and
comparative periods are as follows:
• Buildings 20 – 50 years
• Plant and equipment
– Computer equipment 3 – 5 years
– Motor vehicles 4 – 7 years
– Furniture and
fittings 10 – 20 years
– Pipelines 10 – 30 years
– Plant and facilities 10 – 50 years
Depreciation of offshore plant and
equipment is calculated using the
units of production method on a
cash-generating unit basis (refer
note 1(P)) from the date of
commencement of production.
Depletion charges are calculated using
a unit of production method based on
heating value which will amortise the
cost of carried forward exploration,
evaluation and subsurface development
expenditure (“subsurface assets”)
over the life of the estimated Proven
plus Probable (“2P”) reserves in a
cash-generating unit, together with
future subsurface costs necessary to
develop the hydrocarbon reserves in the
respective cash-generating units.
The heating value measurement used for
the conversion of volumes of different
hydrocarbon products is barrels of oil
equivalent.

79
Santos Annual Report 2007
1. SIGNIFICANT ACCOUNTINGPOLICIES (CONTINUED)
Depletion is not charged on costs carried
forward in respect of assets in the
development stage until production
commences.
(L) AVAILABLE-FOR-SALE FINANCIALASSETS
Financial instruments held by the Group
and the Company which are classified as
being available for sale are stated at fair
value, with any resultant gain or loss
being recognised directly in equity.
The fair value of financial instruments
classified as available for sale is their
quoted bid price on the balance
sheet date.
Financial instruments classified
as available for sale are
recognised/derecognised by the Group
and the Company on the date it commits
to purchase/sell the investments. When
these investments are derecognised, the
cumulative gain or loss previously
recognised directly in equity is
recognised in profit or loss.
(M) INVENTORIES
Inventories are stated at the lower
of cost and net realisable value. Net
realisable value is the estimated selling
price in the ordinary course of business,
less the estimated costs of completion
and selling expenses. Cost is determined
as follows:
(i) drilling and maintenance stocks,
which include plant spares,
consumables and maintenance and
drilling tools used for ongoing
operations, are valued at weighted
average cost; and
(ii) petroleum products, which comprise
extracted crude oil, liquefied
petroleum gas, condensate and
naphtha stored in tanks and pipeline
systems and processed sales gas and
ethane stored in subsurface
reservoirs, are valued using the
absorption cost method in a manner
which approximates specific
identification.
(N) TRADE AND OTHER RECEIVABLES
Trade and other receivables are initially
recognised at fair value, which in
practice is the equivalent of cost,
less any impairment losses.
Long-term receivables are discounted
and are stated at amortised cost, less
impairment losses.
Trade and other receivables are assessed
for indicators of impairment at each
balance sheet date. Where a receivable is
impaired the amount of the impairment
is the difference between the asset’s
carrying value and the present value of
estimated future cash flows, discounted
at the original effective interest rate.
The carrying amount of the receivable is
reduced through the use of an allowance
account. Changes in the allowance
account are recognised in profit or loss.
(O)CASH AND CASH EQUIVALENTS
Cash and cash equivalents comprise cash
balances and short-term deposits that
are readily convertible to known amounts
of cash, are subject to an insignificant
risk of changes in value, and have an
original maturity of three months or less.
(P) IMPAIRMENT
The carrying amounts of the Group’s
assets, other than inventories and
deferred tax assets, are reviewed at each
balance sheet date to determine whether
there is any indication of impairment.
Where an indicator of impairment exists
a formal estimate of the recoverable
amount is made.
Oil and gas assets, land, buildings,
plant and equipment are assessed for
impairment on a cash-generating unit
(“CGU”) basis. A cash-generating unit
is the smallest grouping of assets that
generates independent cash inflows, and
generally represents an individual oil or
gas field. Impairment losses recognised
in respect of cash-generating units are
allocated to reduce the carrying amount
of the assets in the unit on a pro-rata
basis.
Exploration and evaluation assets are
assessed for impairment in accordance
with note 1(H).
An impairment loss is recognised in the
income statement whenever the carrying
amount of an asset or its cash-generating
unit exceeds its recoverable amount.
Where a decline in the fair value of an
available-for-sale financial asset has
been recognised directly in equity and
there is objective evidence that the asset
is impaired, the cumulative loss that had
been recognised directly in equity is
recognised in profit or loss even though
the financial asset has not been
derecognised. The amount of the
cumulative loss that is recognised in
profit or loss is the difference between
the acquisition cost and current fair
value, less any impairment loss on that
financial asset previously recognised in
profit or loss.
Calculation of recoverable amount
The recoverable amount of an asset is the
greater of its fair value less costs to sell
and its value in use. In assessing value in
use, an asset’s estimated future cash
flows are discounted to their present
value using a pre-tax discount rate that
reflects current market assessments of
the time value of money and the risks
specific to the asset. Where an asset does
not generate cash flows that are largely
independent from other assets or groups
of assets, the recoverable amount is
determined for the cash-generating unit
to which the asset belongs.

80
Santos Annual Report 2007
Notes to the Consolidated Financial Statementsfor the year ended 31 December 2007
1. SIGNIFICANT ACCOUNTINGPOLICIES (CONTINUED)
For oil and gas assets the estimated
future cash flows are based on estimates
of hydrocarbon reserves, future
production profiles, commodity prices,
operating costs and any future
development costs necessary to produce
the reserves. Estimates of future
commodity prices are based on
contracted prices where applicable or
based on forward market prices where
available.
Reversals of impairment
An impairment loss is reversed if there
has been an increase in the estimated
recoverable amount of a previously
impaired asset. An impairment loss is
reversed only to the extent that the
asset’s carrying amount does not exceed
the carrying amount that would have
been determined, net of depreciation or
depletion, if no impairment loss had
been recognised.
Impairment losses recognised on
equity instruments classified as
available-for-sale financial assets are
not reversed.
(Q)PROVISIONS
A provision is recognised in the balance
sheet when the Group has a present legal
or constructive obligation as a result of a
past event, it is probable that an outflow
of resources embodying economic
benefits will be required to settle the
obligation and a reliable estimate can be
made of the amount of the obligation.
Provisions are determined by discounting
the expected future cash flows at a
pre-tax rate that reflects current market
assessments of the time value of money
and, where appropriate, the risks specific
to the liability.
Restoration
Provisions for future environmental
restoration are recognised where there
is a present obligation as a result of
exploration, development, production,
transportation or storage activities
having been undertaken, and it is
probable that an outflow of economic
benefits will be required to settle the
obligation. The estimated future
obligations include the costs of removing
facilities, abandoning wells and restoring
the affected areas.
The provision for future restoration costs
is the best estimate of the present value
of the future expenditure required to
settle the restoration obligation at the
reporting date, based on current legal
requirements. Future restoration costs
are reviewed annually and any changes in
the estimate are reflected in the present
value of the restoration provision at the
balance sheet date, with a corresponding
change in the cost of the associated
asset.
The amount of the provision for future
restoration costs relating to exploration,
development and production facilities is
capitalised and depleted as a component
of the cost of those activities.
The unwinding of the effect of
discounting on the provision is
recognised as a finance cost.
(R) EMPLOYEE BENEFITS
Wages, salaries and annual leave
Liabilities for wages and salaries,
including non-monetary benefits, and
annual leave that are expected to be
settled within twelve months of the
reporting date are recognised in respect
of employees’ services up to the
reporting date. They are measured at the
amounts expected to be paid when the
liabilities are settled.
Long-term service benefits
Long service leave is provided in respect
of all employees, based on the present
value of the estimated future cash
outflow to be made resulting from
employees’ services up to balance date.
The obligation is calculated using
expected future increases in wage and
salary rates and expected settlement
dates, and is discounted using the
rates attached to the Commonwealth
Government bonds at the balance
sheet date which have maturity dates
approximating the terms of the Group’s
obligations.
Defined contribution plans
The Company and several controlled
entities contribute to a number of
defined contribution superannuation
plans. Obligations for contributions are
recognised as an expense in the income
statement as incurred.
Defined benefit plan
The Group’s net obligation in respect of
the defined benefit superannuation plan
is calculated by estimating the amount
of future benefit that employees have
earned in return for their service in the
current and prior periods; that benefit
is discounted to determine its present
value, and the fair value of any plan
assets is deducted.
The discount rate is the yield at the
balance sheet date on government bonds
that have maturity dates approximating
the terms of the Group’s obligations. The
calculation is performed by a qualified
actuary using the projected unit credit
method.

81
Santos Annual Report 2007
1. SIGNIFICANT ACCOUNTINGPOLICIES (CONTINUED)
When the benefits of the plan are
improved, the portion of the increased
benefit relating to past service by
employees is recognised as an expense in
the income statement on a straight-line
basis over the average period until the
benefits become vested. To the extent
that the benefits vest immediately, the
expense is recognised immediately in the
income statement.
Actuarial gains or losses that arise in
calculating the Group’s obligation in
respect of the plan are recognised
directly in retained earnings.
When the calculation results in plan
assets exceeding liabilities to the Group,
the recognised asset is limited to the net
total of any unrecognised actuarial losses
and past service costs and the present
value of any future refunds from the plan
or reductions in future contributions to
the plan.
Past service cost is the increase in the
present value of the defined benefit
obligation for employee services in prior
periods, resulting in the current period
from the introduction of, or changes to,
post-employment benefits or other
long-term employee benefits. Past
service costs may either be positive
(where benefits are introduced or
improved) or negative (where existing
benefits are reduced).
Share-based payment transactions
The Santos Executive Share Option Plan
allows eligible executives to acquire
shares in the capital of the Company.
The fair value of options granted is
recognised as an employee expense with
a corresponding increase in equity. The
fair value is measured at grant date and
recognised over the period during which
the executive becomes unconditionally
entitled to the options. The fair value of
the options granted is measured using
the Monte Carlo simulation method,
taking into account the terms and market
conditions upon which the options were
granted. The amount recognised as an
expense is only adjusted when the
options do not vest due to non-market
related conditions.
The fair value of Share Acquisition Rights
(“SARs”) issued to eligible executives
under the Executive Long-term Incentive
Program is recognised as an employee
expense with a corresponding increase
in equity. The fair value is measured at
grant date and recognised over the
period during which the executive
becomes unconditionally entitled to the
SARs. The fair value of the SARs granted
is measured using the Monte Carlo
simulation method, taking into account
the terms and market conditions upon
which the SARs were granted. The
amount recognised as an expense is only
adjusted when the SARs do not vest due
to non-market related conditions.
The fair value of shares issued to eligible
employees under the Santos Employee
Share Acquisition Plan, to eligible
executives and employees under the
Santos Employee Share Purchase Plan,
and new shares issued to Non-executive
Directors under the Non-executive
Director Share Plan, is recognised as an
increase in issued capital on grant date.
(S) INTEREST-BEARING BORROWINGS
Interest-bearing borrowings are
recognised initially at fair value, net of
transaction costs incurred. Subsequent
to initial recognition, interest-bearing
borrowings are stated at amortised cost
with any difference between cost and
redemption value being recognised in the
income statement over the period of the
borrowings on an effective interest basis.
Fixed rate notes that are hedged by an
interest rate swap are recognised at fair
value (refer note 1(F)).
(T) CAPITALISATION OFBORROWING COSTS
Borrowing costs, including interest and
finance charges relating to major oil and
gas assets under development up to the
date of commencement of commercial
operations, are capitalised as a
component of the cost of development.
Where funds are borrowed specifically for
qualifying projects the actual borrowing
costs incurred are capitalised. Where the
projects are funded through general
borrowings the borrowing costs are
capitalised based on the weighted
average borrowing rate (refer note 20).
Borrowing costs incurred after
commencement of commercial operations
are expensed.
(U) DEFERRED INCOME
A liability is recorded for obligations
under sales contracts to deliver natural
gas in future periods for which payment
has already been received.
(V) TRADE AND OTHER PAYABLES
Trade and other payables are recognised
when the related goods or services are
received, at the amount of cash or cash
equivalent that will be required to
discharge the obligation, gross of any
settlement discount offered. Trade
payables are non-interest-bearing and
are settled on normal terms and
conditions.
(W)SHARE CAPITAL
Ordinary share capital
Ordinary share capital is classified as
equity.

82
Santos Annual Report 2007
Notes to the Consolidated Financial Statementsfor the year ended 31 December 2007
1. SIGNIFICANT ACCOUNTINGPOLICIES (CONTINUED)
Preference share capital
Preference share capital is classified as
equity if it is non-redeemable and any
dividends are discretionary, or it is
redeemable only at the Company’s
option. Dividends on preference share
capital classified as equity are recognised
as distributions within equity.
Dividends
Dividends are recognised as a liability at
the time the Directors resolve to pay or
declare the dividend.
Transaction costs
Transaction costs of an equity transaction
are accounted for as a deduction from
equity, net of any related income tax
benefit.
(X) REVENUE
Revenue is recognised in the income
statement when the significant risks
and rewards of ownership have been
transferred to the buyer. Revenue is
recognised and measured at the fair
value of the consideration or
contributions received, net of goods and
services tax (“GST”), to the extent it is
probable that the economic benefits will
flow to the Group and the revenue can be
reliably measured.
Sales revenue
Sales revenue is recognised on the basis
of the Group’s interest in a producing
field (“entitlements” method), when the
physical product and associated risks
and rewards of ownership pass to the
purchaser, which is generally at the time
of ship or truck loading, or on the
product entering the pipeline.
Revenue earned under a production
sharing contract (“PSC”) is recognised on
a net entitlements basis according to the
terms of the PSC.
Dividends
Dividend revenue from controlled entities
is recognised as the dividends are
declared, and from other parties as the
dividends are received.
Overriding royalties
Royalties recognised on farmed-out
operating lease rights are recognised as
revenue as they accrue in accordance
with the terms of the overriding royalty
agreements.
Pipeline tariffs and processing tolls
Tariffs and tolls charged to other entities
for use of pipelines and facilities owned
by the Group are recognised as revenue
as they accrue in accordance with the
terms of the tariff and tolling
agreements.
Trading revenue
Trading revenue represents the net
revenue derived from the purchase and
subsequent sale of hydrocarbon products
from third parties where the risks and
benefits of ownership of the product do
not pass to the Group, or where the
Group acts as an agent or broker with
compensation on a commission or
fee basis.
(Y) OTHER INCOME
Other income is recognised in the income
statement at the fair value of the
consideration received or receivable,
net of GST, when the significant risks
and rewards of ownership have been
transferred to the buyer or when the
service has been performed.
The gain or loss arising on disposal of a
non-current asset is included as other
income at the date control of the asset
passes to the buyer. The gain or loss on
disposal is calculated as the difference
between the carrying amount of the
asset at the time of disposal and the net
proceeds on disposal.
(Z) EXPENSES
Government royalties, petroleum
resource rent tax and similar taxes
Government royalties, petroleum
resource rent tax (“PRRT”) and similar
taxes are recognised as an operating
expense on an accruals basis when the
related sales are recognised or related
production takes place. The amount
is recognised in accordance with
government legislative requirements.
Operating lease payments
Operating lease payments, where the
lessor effectively retains substantially
all the risks and rewards incidental to
ownership of the leased items, are
recognised in the income statement on
a straight-line basis over the term of
the lease.
Net financing costs
Net financing costs comprise interest
payable on borrowings calculated using
the effective interest rate method, the
unwinding of the effect of discounting
on provisions, and interest receivable on
funds invested.
Interest income is recognised in the
income statement as it accrues, using the
effective interest method.
(AA)GOODS AND SERVICES TAX
Revenues, expenses and assets are
recognised net of the amount of goods
and services tax (“GST”), except where
the amount of GST incurred is not
recoverable from the Australian Taxation
Office (“ATO”). In these circumstances

83
Santos Annual Report 2007
1. SIGNIFICANT ACCOUNTINGPOLICIES (CONTINUED)
the GST is recognised as part of the cost
of acquisition of the asset or as part of
the expense.
Receivables and payables are stated
with the amount of GST included. The
net amount of GST recoverable from,
or payable to, the ATO is included as
a current asset or liability in the
balance sheet.
Cash flows are included in the cash flow
statement on a gross basis. The GST
components of cash flows arising from
investing and financing activities which
are recoverable from, or payable to,
the ATO are classified as operating
cash flows.
(AB)INCOME TAX
Income tax on the profit or loss for the
year comprises current and deferred tax.
Income tax is recognised in the income
statement except to the extent that it
relates to items recognised directly in
equity, in which case it is recognised
in equity.
Current tax is the amount of income tax
payable on the taxable profit or loss for
the year, using tax rates enacted or
substantively enacted at the balance
sheet date, and any adjustment to tax
payable in respect of previous years.
Deferred tax is determined using the
balance sheet approach, providing for
temporary differences between the
carrying amounts of assets and liabilities
for financial reporting purposes and the
appropriate tax bases. The following
temporary differences are not provided
for: the initial recognition of assets or
liabilities that affect neither accounting
nor taxable profit, and differences
relating to investments in subsidiaries
to the extent it is probable that they will
not reverse in the foreseeable future. The
amount of deferred tax provided is based
on the expected manner of realisation or
settlement of the carrying amount of
assets and liabilities, using tax rates
enacted or substantively enacted at the
balance sheet date.
A deferred tax asset is recognised only to
the extent that it is probable that future
taxable profits will be available against
which the asset can be utilised. Deferred
tax assets are reduced to the extent that
it is no longer probable that the related
tax benefit will be realised.
The Company and all its wholly-owned
Australian resident entities are part of a
tax-consolidated group under Australian
taxation law. Santos Ltd is the head
entity in the tax-consolidated group.
Current tax expense/income, deferred
tax liabilities and deferred tax assets
arising from temporary differences of the
members of the tax-consolidated group
are allocated among the members of
the tax-consolidated group using a
“stand-alone taxpayer” approach in
accordance with Interpretation 1052
Tax Consolidation Accounting and are
recognised in the separate financial
statements of each entity. Current tax
liabilities and assets and deferred tax
assets arising from unused tax losses
and tax credits of the members of the
tax-consolidated group are recognised
by the Company (as head entity in the
tax-consolidated group).
The Company and the other entities in
the tax-consolidated group have entered
into a tax funding agreement. Tax
contribution amounts payable under the
tax funding agreement are recognised as
payable to or receivable by the Company
and each other member of the
tax-consolidated group. Where the tax
contribution amount recognised by each
member of the tax-consolidated group
for a particular period under the tax
funding agreement is different to the
aggregate of the current tax liability or
asset and any deferred tax asset arising
from unused tax losses and tax credits in
respect of that period assumed by the
Company, the difference is recognised as
a contribution from (or distribution to)
equity participants.
The Company and the other entities in
the tax-consolidated group have also
entered into a tax sharing agreement
pursuant to which the other entities may
be required to contribute to the tax
liabilities of the Company in the event of
default by the Company or upon leaving
the tax-consolidated group.
(AC)DISCONTINUED OPERATIONSAND NON-CURRENT ASSETS HELDFOR SALE
A discontinued operation is a component
of the Group that has been disposed of,
or is classified as held for sale, and that
represents a major line of business or
geographical area of operations, and is
part of a single coordinated plan to
dispose of such a line of business or area
of operations. The results of discontinued
operations are presented separately on
the face of the income statement.
Non-current assets and disposal groups
are classified as held for sale and
measured at the lower of their carrying
amount and fair value less costs to sell if
their carrying amount will be recovered
principally through a sale transaction.
They are not depreciated or amortised.
For an asset or disposal group to be
classified as held for sale, it must be
available for immediate sale in its
present condition and its sale must be
highly probable.
An impairment loss is recognised for any
initial or subsequent write-down of the
asset (or disposal group) to fair value
less costs to sell. A gain is recognised for
any subsequent increases in fair value

84
Santos Annual Report 2007
Notes to the Consolidated Financial Statementsfor the year ended 31 December 2007
1. SIGNIFICANT ACCOUNTINGPOLICIES (CONTINUED)
less costs to sell of an asset (or
disposal group) but not in excess of any
cumulative impairment loss previously
recognised. A gain or loss not previously
recognised by the date of the sale of the
non-current asset (or disposal group) is
recognised at the date of derecognition.
(AD)SIGNIFICANT ACCOUNTINGJUDGEMENTS, ESTIMATES ANDASSUMPTIONS
The carrying amounts of certain assets
and liabilities are often determined
based on management’s judgement
regarding estimates and assumptions
of future events. The reasonableness of
estimates and underlying assumptions
are reviewed on an ongoing basis.
Revisions to accounting estimates are
recognised in the period in which the
estimate is revised if the revision affects
only that period or in the period of the
revision and future periods if the revision
affects both current and future periods.
The key judgements, estimates and
assumptions that have a significant risk
of causing a material adjustment to the
carrying amount of certain assets and
liabilities within the next annual
reporting period are:
Estimates of reserve quantities
The estimated quantities of Proven and
Probable hydrocarbon reserves reported
by the Company are integral to the
calculation of depletion and depreciation
expense and to assessments of possible
impairment of assets. Estimated
reserve quantities are based upon
interpretations of geological and
geophysical models and assessments of
the technical feasibility and commercial
viability of producing the reserves. These
assessments require assumptions to be
made regarding future development and
production costs, commodity prices,
exchange rates and fiscal regimes.
The estimates of reserves may change
from period to period as the economic
assumptions used to estimate the
reserves can change from period to
period, and as additional geological
data is generated during the course of
operations. Reserves estimates are
prepared in accordance with the
Company’s policies and procedures for
reserves estimation which conform to
guidelines prepared by the Society of
Petroleum Engineers.
Exploration and evaluation
The Group’s policy for exploration and
evaluation expenditure is discussed in
note 1(H). The application of this policy
requires management to make certain
estimates and assumptions as to future
events and circumstances, particularly
in relation to the assessment of whether
economic quantities of reserves have
been found. Any such estimates and
assumptions may change as new
information becomes available. If,
after having capitalised exploration and
evaluation expenditure, management
concludes that the capitalised
expenditure is unlikely to be recovered
by future exploitation or sale, then the
relevant capitalised amount will be
written off to the income statement.
The carrying amount of exploration and
evaluation assets is disclosed in note 12.
Provision for restoration
The Group estimates the future removal
and restoration costs of oil and gas
production facilities, wells, pipelines and
related assets at the time of installation
of the assets. In most instances the
removal of these assets will occur many
years in the future. The estimate of
future removal costs therefore requires
management to make judgements
regarding the removal date, future
environmental legislation, the extent of
restoration activities required and future
removal technologies.
The carrying amount of the provision for
restoration is disclosed in note 21.
Impairment of oil and gas assets
The Group assesses whether oil and gas
assets are impaired on a semi-annual
basis. This requires an estimation of
the recoverable amount of the
cash-generating unit to which the assets
belong. The assumptions used in the
estimation of recoverable amount and
the carrying amount of oil and gas assets
are discussed in notes 13 and 15.
Sidoarjo mudflow incident
The Group has raised a provision for
potential remediation and related costs
that may arise from the Sidoarjo mudflow
incident. The amounts recognised and
the basis of the estimate are discussed in
note 3.
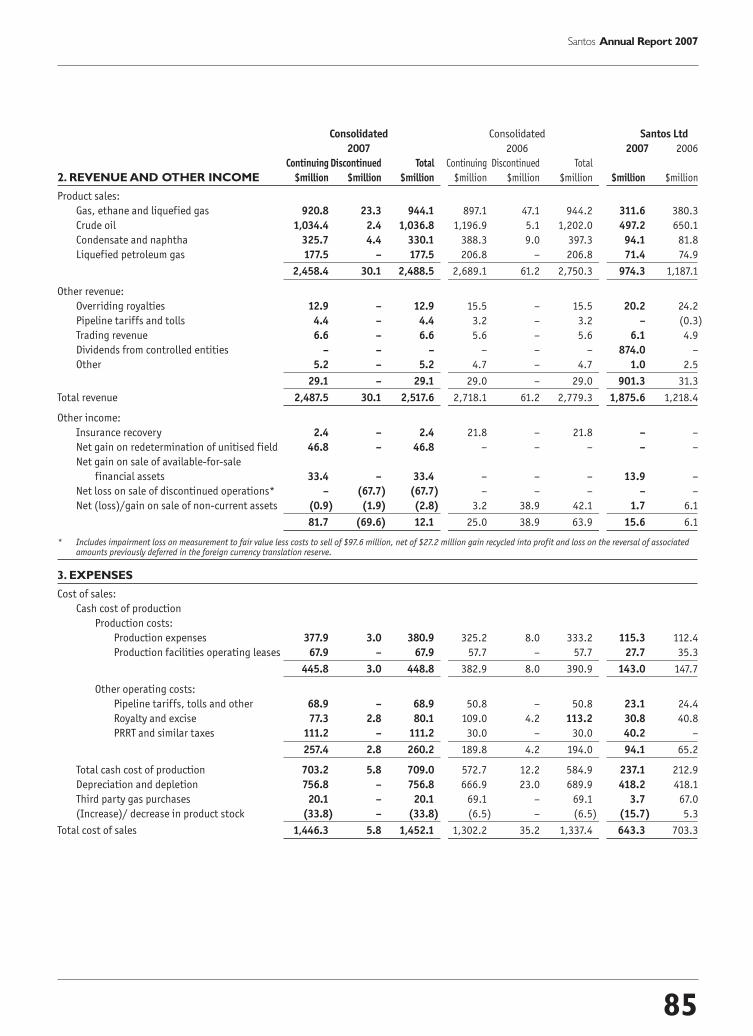
85
Santos Annual Report 2007
Consolidated Consolidated Santos Ltd
2007 2006 2007 2006
Continuing Discontinued Total Continuing Discontinued Total
2. REVENUE AND OTHER INCOME $million $million $million $million $million $million $million $million
Product sales:
Gas, ethane and liquefied gas 920.8 23.3 944.1 897.1 47.1 944.2 311.6 380.3
Crude oil 1,034.4 2.4 1,036.8 1,196.9 5.1 1,202.0 497.2 650.1
Condensate and naphtha 325.7 4.4 330.1 388.3 9.0 397.3 94.1 81.8
Liquefied petroleum gas 177.5 – 177.5 206.8 – 206.8 71.4 74.9
2,458.4 30.1 2,488.5 2,689.1 61.2 2,750.3 974.3 1,187.1
Other revenue:
Overriding royalties 12.9 – 12.9 15.5 – 15.5 20.2 24.2
Pipeline tariffs and tolls 4.4 – 4.4 3.2 – 3.2 – (0.3)
Trading revenue 6.6 – 6.6 5.6 – 5.6 6.1 4.9
Dividends from controlled entities – – – – – – 874.0 –
Other 5.2 – 5.2 4.7 – 4.7 1.0 2.5
29.1 – 29.1 29.0 – 29.0 901.3 31.3
Total revenue 2,487.5 30.1 2,517.6 2,718.1 61.2 2,779.3 1,875.6 1,218.4
Other income:
Insurance recovery 2.4 – 2.4 21.8 – 21.8 – –
Net gain on redetermination of unitised field 46.8 – 46.8 – – – – –
Net gain on sale of available-for-sale
financial assets 33.4 – 33.4 – – – 13.9 –
Net loss on sale of discontinued operations* – (67.7) (67.7) – – – – –
Net (loss)/gain on sale of non-current assets (0.9) (1.9) (2.8) 3.2 38.9 42.1 1.7 6.1
81.7 (69.6) 12.1 25.0 38.9 63.9 15.6 6.1
* Includes impairment loss on measurement to fair value less costs to sell of $97.6 million, net of $27.2 million gain recycled into profit and loss on the reversal of associatedamounts previously deferred in the foreign currency translation reserve.
3. EXPENSES
Cost of sales:
Cash cost of production
Production costs:
Production expenses 377.9 3.0 380.9 325.2 8.0 333.2 115.3 112.4
Production facilities operating leases 67.9 – 67.9 57.7 – 57.7 27.7 35.3
445.8 3.0 448.8 382.9 8.0 390.9 143.0 147.7
Other operating costs:
Pipeline tariffs, tolls and other 68.9 – 68.9 50.8 – 50.8 23.1 24.4
Royalty and excise 77.3 2.8 80.1 109.0 4.2 113.2 30.8 40.8
PRRT and similar taxes 111.2 – 111.2 30.0 – 30.0 40.2 –
257.4 2.8 260.2 189.8 4.2 194.0 94.1 65.2
Total cash cost of production 703.2 5.8 709.0 572.7 12.2 584.9 237.1 212.9
Depreciation and depletion 756.8 – 756.8 666.9 23.0 689.9 418.2 418.1
Third party gas purchases 20.1 – 20.1 69.1 – 69.1 3.7 67.0
(Increase)/ decrease in product stock (33.8) – (33.8) (6.5) – (6.5) (15.7) 5.3
Total cost of sales 1,446.3 5.8 1,452.1 1,302.2 35.2 1,337.4 643.3 703.3

86
Santos Annual Report 2007
Consolidated Consolidated Santos Ltd
2007 2006 2007 2006
Continuing Discontinued Total Continuing Discontinued Total
3. EXPENSES (CONTINUED) $million $million $million $million $million $million $million $million
Other expenses:
Selling, general and administrative:
Expenses 75.3 11.8 87.1 64.0 7.5 71.5 71.8 47.1
Depreciation 2.5 – 2.5 1.2 1.1 2.3 1.1 0.3
77.8 11.8 89.6 65.2 8.6 73.8 72.9 47.4
Foreign exchange losses/(gains) 0.5 – 0.5 (0.8) – (0.8) 0.7 0.5
Change in fair value of financial assets
designated as at fair value through
profit or loss 11.9 – 11.9 (18.8) – (18.8) 1.3 (1.3)
Fair value hedges, (gains)/losses:
On the hedging instrument (57.6) – (57.6) 15.5 – 15.5 – –
On the hedged item attributable to
the hedged risk 59.1 – 59.1 (15.7) – (15.7) – –
Exploration and evaluation expensed 226.1 8.7 234.8 268.8 79.0 347.8 54.2 19.9
Net impairment loss on oil and gas assets – – – 11.2 5.1 16.3 56.6 2.9
Impairment loss on receivables due from
controlled entities – – – – – – 25.3 6.3
Net impairment (reversal)/loss on investments
in controlled entities – – – – – – (380.7) 325.7
317.8 20.5 338.3 325.4 92.7 418.1 (169.7) 401.4
Profit before tax includes the following:
Depreciation and depletion:
Depletion of subsurface asset expenditure 431.3 – 431.3 400.3 23.0 423.3 265.7 296.7
Depreciation of plant and equipment 323.6 – 323.6 265.1 1.1 266.2 151.3 120.4
Depreciation of buildings 4.4 – 4.4 2.7 – 2.7 2.3 1.3
Total depreciation and depletion 759.3 – 759.3 668.1 24.1 692.2 419.3 418.4
Employee benefits expense 173.8 6.5 180.3 161.4 14.7 176.1 176.8 173.0
Net write-down of inventories 0.2 – 0.2 0.4 – 0.4 0.3 0.2
Operating lease rentals:
Minimum lease payments 59.1 0.2 59.3 72.5 0.7 73.2 41.1 48.5
Contingent rentals 0.5 – 0.5 0.6 – 0.6 0.1 0.2
Amounts that are unusual because of their
nature, size, or incidence:
Remediation and related costs of the
Moonie to Brisbane pipeline incident 38.0 – 38.0 – – – – –
Exploration and evaluation expensed
includes amounts provided for potential
remediation and related costs of the
Sidoarjo mudflow incident 8.0 – 8.0 88.5 – 88.5 – –
Notes to the Consolidated Financial Statementsfor the year ended 31 December 2007

87
Santos Annual Report 2007
3. EXPENSES (CONTINUED)
Sidoarjo mudflow incident
The mudflow incident at the Banjar Panji-1 onshore exploration well located within the area of the Brantas Production Sharing Contract
(“PSC”) continues, with the total area affected presently being approximately 650 hectares. The cause of the incident is yet to be determined.
The Company, through its subsidiary Santos Brantas Pty Ltd (“STOB”), has a non-operated 18% interest in the Brantas PSC, which is operated
by 50% participant Lapindo Brantas Inc (“Lapindo”). The other party to the PSC is an Indonesian company, PT Prakarsa Brantas (“Prakarsa”),
formerly known as PT Medco E & P Brantas.
The flow of mud and water has resulted in significant property damage, the interruption of local infrastructure and the need to relocate a
significant number of local villagers. Efforts to contain and manage the mudflow are continuing and are overseen by the Sidoarjo Mud
Mitigation Agency (“the Agency”), which was established by Regulation of the President of Indonesia Number 14 Year 2007, dated 8 April 2007.
During the year, STOB was named as one of a number of defendants (including Lapindo and relevant Government authorities) in a legal
proceeding commenced in Indonesia by Wahana Lingkungan Hidup Indonesia (Friends of the Earth Indonesia – “WALHI”) which sought
various orders against the defendants. On 27 December 2007, the South Jakarta District Court dismissed WALHI’s application citing natural
causes as the likely cause of the incident. Santos understands that WALHI has filed an appeal against that decision with the relevant High
Court in Indonesia. STOB will continue to vigorously defend the proceeding.
STOB has not admitted any liability in relation to the incident under the PSC, the Operating Agreement or at all. Nevertheless, STOB has
supported Lapindo and the Agency in their efforts to manage the incident and assist the community. STOB has, subject to a full reservation of
its legal rights, paid PSC cash calls of approximately US$28.5 million since May 2006.
The Board’s prudent estimate of the costs that may arise relating to the incident reflects an assumption that a resolution will ultimately be
reached as between the Government, Lapindo, the non-operating PSC parties (STOB and Prakarsa) and all other relevant parties as to the
costs related to long-term mud management options, proposed costs of infrastructure relocation and any third party claims. It also assumes
that the present conditions at the site of the incident will remain stable or improve over the longer term. These assumptions are based upon
an updated assessment of information currently available, experience and events since May 2006 (including the WALHI decision and factors
impacting a resolution) and progress associated with managing the mudflow.
The Company, while not accepting any liability in relation to the incident, its ongoing management or any remediation of the area, has
previously raised a provision of US$72.0 million in relation to the incident, resulting in approximately A$88.5 million expensed (at foreign
exchange rates applying at the time). As part of its review of provisions for the financial year ended 31 December 2007, the Company
considered it prudent to increase the provision in light of current information. The total provision (before costs already paid) has been
increased to US$79.0 million, representing an increase in the provision of US$7.0 million and resulting in A$8.0 million being expensed in the
current period.
With the mudflow continuing, the complexity of the incident, and the need to consult with a number of interested parties (both public and
private), the situation remains dynamic. Accordingly, there continues to be uncertainty surrounding the incident and its cost and other
implications for the Group. There remains the possibility that resolution of these uncertainties may ultimately be on a different basis than
presently assumed which could result in the costs borne by STOB being significantly different from the current estimate. The Company will
continue to review the adequacy of the Group’s provision in light of developments and available information.
The Company’s accounting policy in respect of insurance claims is to recognise insurance proceeds only when the insurers have granted
indemnity or there is a high probability that indemnity will be granted. In accordance with this policy, the Group recognised an amount of
A$21.8 million as insurance proceeds in 2006. The insurance proceeds include STOB’s share of the US$25.0 million well control insurance
received by the Joint Venture. The balance relates to the Company’s own well control insurance. The Group has therefore recognised an amount
that reflects progress claim payments received and likely to be received under the Company’s own policy, while it continues to work towards a
resolution with its insurers.

88
Santos Annual Report 2007
Consolidated Consolidated Santos Ltd
2007 2006 2007 2006
Continuing Discontinued Total Continuing Discontinued Total
4. EARNINGS $million $million $million $million $million $million $million $million
Earnings before interest, tax, depreciation,
depletion, exploration and impairment
(“EBITDAX”) is calculated as follows:
Profit/(loss) before tax 666.0 (65.0) 601.0 992.0 (27.3) 964.7 1,312.0 (12.9)
Add back:
Net financing costs/(income) 139.1 (0.8) 138.3 123.5 (0.5) 123.0 105.6 132.7
Earnings before interest and tax (“EBIT”) 805.1 (65.8) 739.3 1,115.5 (27.8) 1,087.7 1,417.6 119.8
Add back:
Depreciation and depletion 759.3 – 759.3 668.1 24.1 692.2 419.3 418.4
Exploration and evaluation expensed 226.1 8.7 234.8 268.8 79.0 347.8 54.2 19.9
Net impairment loss on oil and gas assets – – – 11.2 5.1 16.3 56.6 2.9
Impairment loss on receivables due from
controlled entities – – – – – – 25.3 6.3
Net impairment (reversal)/loss on
investments in controlled entities – – – – – – (380.7) 325.7
EBITDAX 1,790.5 (57.1) 1,733.4 2,063.6 80.4 2,144.0 1,592.3 893.0
5. NET FINANCING COSTS
Interest income:
Controlled entities – – – – – – 186.2 34.2
Other entities 13.6 0.8 14.4 12.0 0.6 12.6 2.6 2.7
Financial income 13.6 0.8 14.4 12.0 0.6 12.6 188.8 36.9
Interest expense:
Controlled entities – – – – – – 279.7 156.1
Other entities 129.5 – 129.5 120.3 0.1 120.4 0.6 0.9
Less borrowing costs capitalised (6.3) – (6.3) (14.5) – (14.5) – –
123.2 – 123.2 105.8 0.1 105.9 280.3 157.0
Unwind of the effect of discounting on provisions 23.9 – 23.9 25.4 – 25.4 8.5 8.3
Interest expense on defined benefit obligation 5.6 – 5.6 4.3 – 4.3 5.6 4.3
Financial expenses 152.7 – 152.7 135.5 0.1 135.6 294.4 169.6
Net financing costs/(income) 139.1 (0.8) 138.3 123.5 (0.5) 123.0 105.6 132.7
Notes to the Consolidated Financial Statementsfor the year ended 31 December 2007

89
Santos Annual Report 2007
Consolidated Santos Ltd
2007 2006 2007 2006
6. INCOME TAX EXPENSE $million $million $million $million
Recognised in the income statement
Current tax expense
Current year 236.2 372.1 48.5 179.5
Adjustments for prior years (23.2) 5.1 10.7 (0.4)
213.0 377.2 59.2 179.1
Deferred tax expense
Origination and reversal of temporary differences (23.2) (40.6) (10.6) (81.5)
Benefit of tax losses recognised (19.2) (15.3) – –
Adjustments for prior years (10.2) – (10.6) –
(52.6) (55.9) (21.2) (81.5)
Total income tax expense 160.4 321.3 38.0 97.6
Numerical reconciliation between tax expense and pre-tax net profit/(loss)
Profit/(loss) before tax 601.0 964.7 1,312.0 (12.9)
Prima facie income tax at 30% (2006: 30%) 180.3 289.4 393.6 (3.9)
Increase in income tax expense due to:
Non-deductible depreciation and depletion 3.5 6.1 25.5 2.2
Abandonment of exploration – – – 1.9
Net impairment (reversal)/loss of investments in controlled entities – – (114.2) 97.6
Foreign losses not recognised 38.5 41.3 – –
Benefit arising from previously unrecognised tax losses that is used to
reduce current tax expense (10.1) – (6.6) –
Dividends from controlled entities – – (262.2) –
Tax losses recognised (19.2) (15.3) – –
(Over)/under provided in prior years (33.4) 5.1 0.1 (0.4)
Other 0.8 (5.3) 1.8 0.2
Income tax expense on pre-tax net profit/(loss) 160.4 321.3 38.0 97.6
Aggregate income tax expense is attributable to:
Continuing operations 159.8 321.1 38.0 97.6
Discontinued operations 0.6 0.2 – –
160.4 321.3 38.0 97.6
Deferred tax charged/(credited) directly to equity
Hedges of investments in foreign operations 26.8 23.0 – –
Change in fair value of available-for-sale financial assets (3.3) 3.8 1.5 (0.3)
Off-market share buy-back transaction costs (0.6) – (0.6) –
Actuarial gain/(loss) on defined benefit plan 1.9 (2.7) 1.9 (2.7)
24.8 24.1 2.8 (3.0)
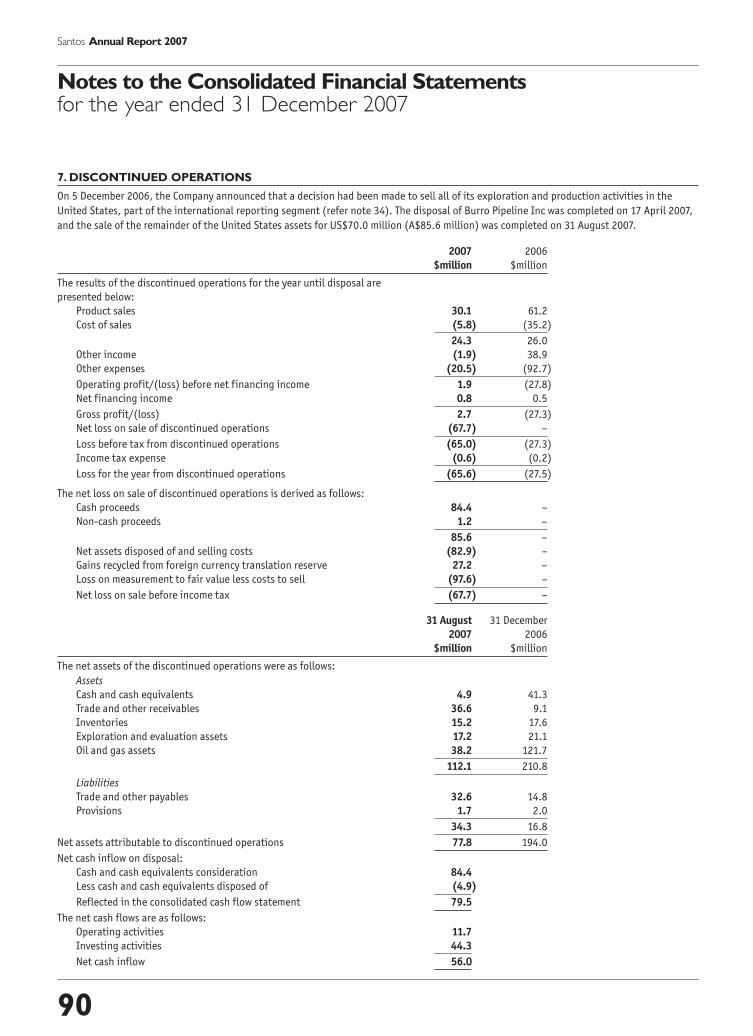
90
Santos Annual Report 2007
7. DISCONTINUED OPERATIONS
On 5 December 2006, the Company announced that a decision had been made to sell all of its exploration and production activities in the
United States, part of the international reporting segment (refer note 34). The disposal of Burro Pipeline Inc was completed on 17 April 2007,
and the sale of the remainder of the United States assets for US$70.0 million (A$85.6 million) was completed on 31 August 2007.
2007 2006
$million $million
The results of the discontinued operations for the year until disposal are
presented below:
Product sales 30.1 61.2
Cost of sales (5.8) (35.2)
24.3 26.0
Other income (1.9) 38.9
Other expenses (20.5) (92.7)
Operating profit/(loss) before net financing income 1.9 (27.8)
Net financing income 0.8 0.5
Gross profit/(loss) 2.7 (27.3)
Net loss on sale of discontinued operations (67.7) –
Loss before tax from discontinued operations (65.0) (27.3)
Income tax expense (0.6) (0.2)
Loss for the year from discontinued operations (65.6) (27.5)
The net loss on sale of discontinued operations is derived as follows:
Cash proceeds 84.4 –
Non-cash proceeds 1.2 –
85.6 –
Net assets disposed of and selling costs (82.9) –
Gains recycled from foreign currency translation reserve 27.2 –
Loss on measurement to fair value less costs to sell (97.6) –
Net loss on sale before income tax (67.7) –
31 August 31 December
2007 2006
$million $million
The net assets of the discontinued operations were as follows:
Assets
Cash and cash equivalents 4.9 41.3
Trade and other receivables 36.6 9.1
Inventories 15.2 17.6
Exploration and evaluation assets 17.2 21.1
Oil and gas assets 38.2 121.7
112.1 210.8
Liabilities
Trade and other payables 32.6 14.8
Provisions 1.7 2.0
34.3 16.8
Net assets attributable to discontinued operations 77.8 194.0
Net cash inflow on disposal:
Cash and cash equivalents consideration 84.4Less cash and cash equivalents disposed of (4.9)
Reflected in the consolidated cash flow statement 79.5
The net cash flows are as follows:
Operating activities 11.7Investing activities 44.3
Net cash inflow 56.0
Notes to the Consolidated Financial Statementsfor the year ended 31 December 2007

91
Santos Annual Report 2007
Consolidated Santos Ltd
2007 2006 2007 2006
8. CASH AND CASH EQUIVALENTS $million $million $million $million
Cash at bank and in hand 128.6 136.6 49.3 49.5
Call deposits 71.9 22.1 7.5 3.3
200.5 158.7 56.8 52.8
Cash at bank and in hand attributable to discontinued operations (refer note 7) – 41.3 – –
Cash and cash equivalents in the cash flow statements 200.5 200.0 56.8 52.8
Bank balances and call deposits earn interest at floating rates based upon
market rates.
The carrying amounts of cash and cash equivalents represent fair value.
Restricted cash balances
Barracuda Ltd, a wholly-owned subsidiary incorporated in Papua New Guinea,
has cash and cash equivalents at 31 December 2007 of US$14.5 million
(2006: US$4.7 million) which can only be repatriated to Australia with the
permission of the Internal Revenue Commission of Papua New Guinea in
accordance with the financing plan submitted in respect of PDL 3.
Santos (BBF) Pty Ltd, a wholly-owned Australian subsidiary, has cash and cash
equivalents at 31 December 2007 of US$23.7 million (2006: US$12.6 million)
that are held to cover obligations under a reserve-based facility.
9.TRADE AND OTHER RECEIVABLES
Current receivables
Trade receivables 429.0 370.2 145.2 172.1
Tax related balances owing by controlled entities – – 20.0 46.6
Non-trade receivables and prepayments 178.4 117.3 43.3 17.0
607.4 487.5 208.5 235.7
The ageing of trade receivables at the reporting date was as follows:
Less than one month 394.0 360.9 143.7 172.1
One to three months 20.1 8.6 0.7 –
Three to six months 13.3 0.3 – –
Six to twelve months – 0.4 0.1 –
Greater than twelve months 1.6 – 0.7 –
429.0 370.2 145.2 172.1
Trade receivables are non-interest-bearing and settlement terms are generally within 30 days.
Trade receivables that are neither past due nor impaired relate to a number of independent customers for whom there is no recent history of
default.
Impaired receivables
At 31 December 2007 there were no current trade receivables that were impaired (2006: $nil).
The balance of the allowance for impairment in respect of trade receivables at 31 December 2007 was $nil (2006: $nil). There has been no
movement in the allowance during the year.
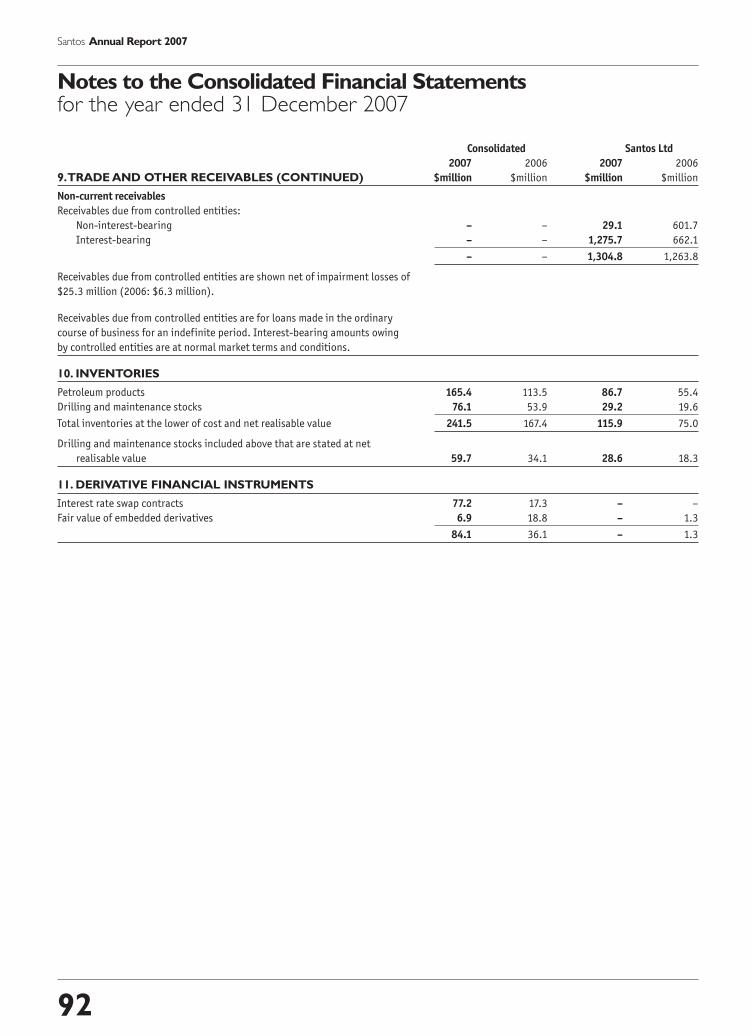
92
Santos Annual Report 2007
Consolidated Santos Ltd
2007 2006 2007 2006
9.TRADE AND OTHER RECEIVABLES (CONTINUED) $million $million $million $million
Non-current receivables
Receivables due from controlled entities:
Non-interest-bearing – – 29.1 601.7
Interest-bearing – – 1,275.7 662.1
– – 1,304.8 1,263.8
Receivables due from controlled entities are shown net of impairment losses of
$25.3 million (2006: $6.3 million).
Receivables due from controlled entities are for loans made in the ordinary
course of business for an indefinite period. Interest-bearing amounts owing
by controlled entities are at normal market terms and conditions.
10. INVENTORIES
Petroleum products 165.4 113.5 86.7 55.4
Drilling and maintenance stocks 76.1 53.9 29.2 19.6
Total inventories at the lower of cost and net realisable value 241.5 167.4 115.9 75.0
Drilling and maintenance stocks included above that are stated at net
realisable value 59.7 34.1 28.6 18.3
11. DERIVATIVE FINANCIAL INSTRUMENTS
Interest rate swap contracts 77.2 17.3 – –
Fair value of embedded derivatives 6.9 18.8 – 1.3
84.1 36.1 – 1.3
Notes to the Consolidated Financial Statementsfor the year ended 31 December 2007
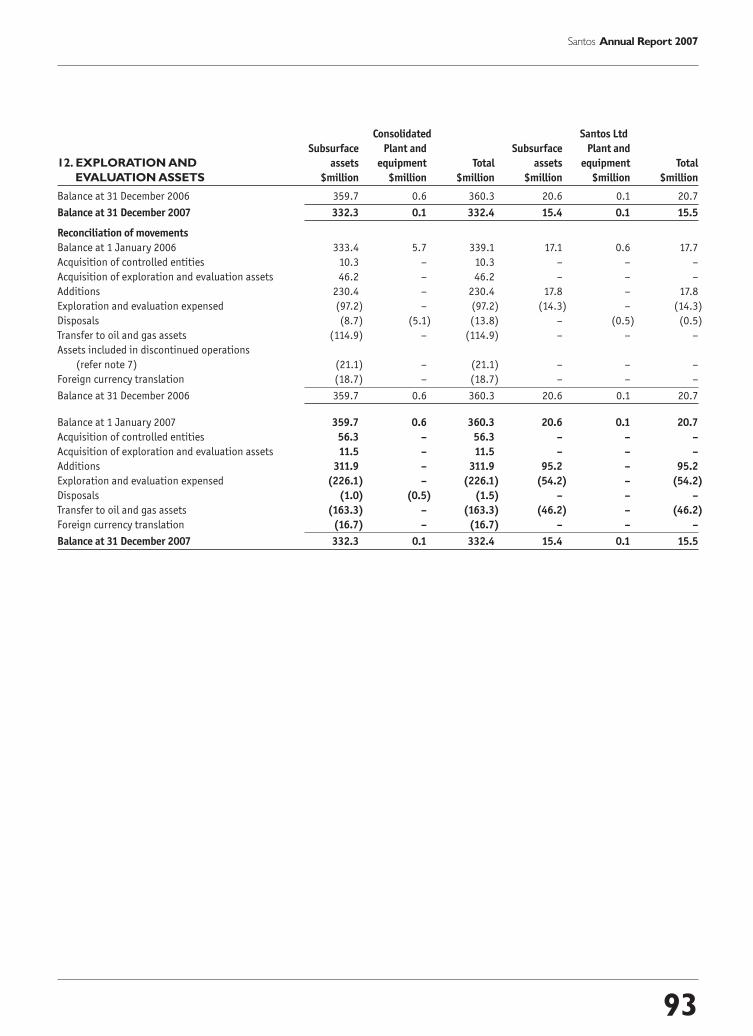
93
Santos Annual Report 2007
Consolidated Santos Ltd
Subsurface Plant and Subsurface Plant and
12. EXPLORATION AND assets equipment Total assets equipment Total
EVALUATION ASSETS $million $million $million $million $million $million
Balance at 31 December 2006 359.7 0.6 360.3 20.6 0.1 20.7
Balance at 31 December 2007 332.3 0.1 332.4 15.4 0.1 15.5
Reconciliation of movements
Balance at 1 January 2006 333.4 5.7 339.1 17.1 0.6 17.7
Acquisition of controlled entities 10.3 – 10.3 – – –
Acquisition of exploration and evaluation assets 46.2 – 46.2 – – –
Additions 230.4 – 230.4 17.8 – 17.8
Exploration and evaluation expensed (97.2) – (97.2) (14.3) – (14.3)
Disposals (8.7) (5.1) (13.8) – (0.5) (0.5)
Transfer to oil and gas assets (114.9) – (114.9) – – –
Assets included in discontinued operations
(refer note 7) (21.1) – (21.1) – – –
Foreign currency translation (18.7) – (18.7) – – –
Balance at 31 December 2006 359.7 0.6 360.3 20.6 0.1 20.7
Balance at 1 January 2007 359.7 0.6 360.3 20.6 0.1 20.7
Acquisition of controlled entities 56.3 – 56.3 – – –
Acquisition of exploration and evaluation assets 11.5 – 11.5 – – –
Additions 311.9 – 311.9 95.2 – 95.2
Exploration and evaluation expensed (226.1) – (226.1) (54.2) – (54.2)
Disposals (1.0) (0.5) (1.5) – – –
Transfer to oil and gas assets (163.3) – (163.3) (46.2) – (46.2)
Foreign currency translation (16.7) – (16.7) – – –
Balance at 31 December 2007 332.3 0.1 332.4 15.4 0.1 15.5
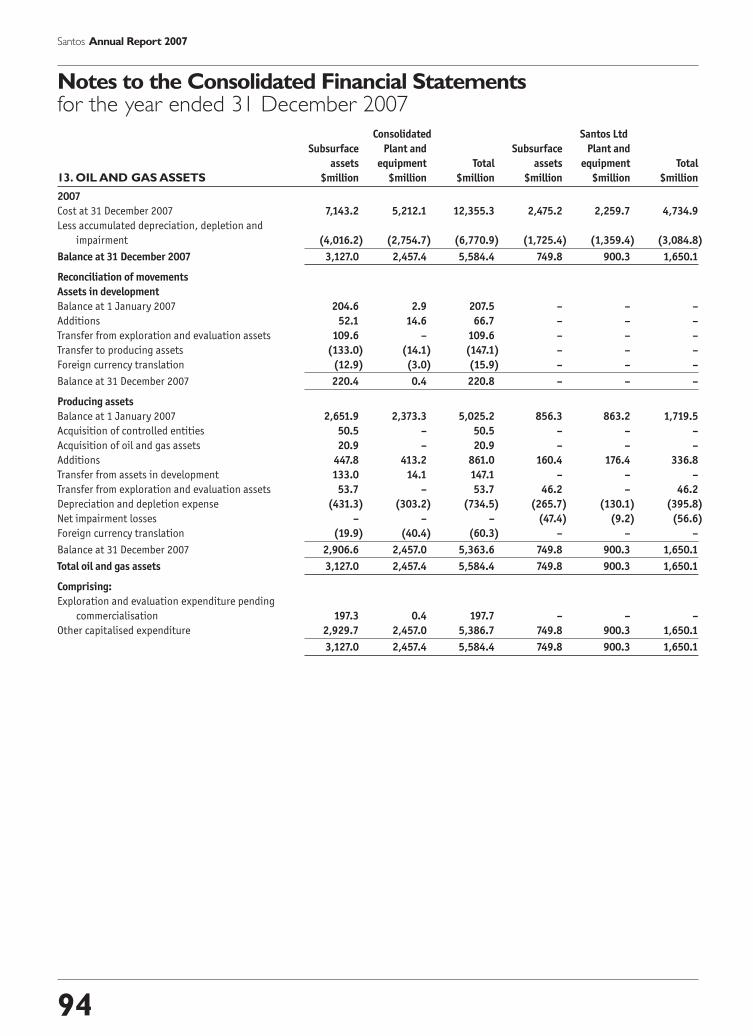
94
Santos Annual Report 2007
Consolidated Santos Ltd
Subsurface Plant and Subsurface Plant and
assets equipment Total assets equipment Total
13. OIL AND GAS ASSETS $million $million $million $million $million $million
2007
Cost at 31 December 2007 7,143.2 5,212.1 12,355.3 2,475.2 2,259.7 4,734.9
Less accumulated depreciation, depletion and
impairment (4,016.2) (2,754.7) (6,770.9) (1,725.4) (1,359.4) (3,084.8)
Balance at 31 December 2007 3,127.0 2,457.4 5,584.4 749.8 900.3 1,650.1
Reconciliation of movements
Assets in development
Balance at 1 January 2007 204.6 2.9 207.5 – – –
Additions 52.1 14.6 66.7 – – –
Transfer from exploration and evaluation assets 109.6 – 109.6 – – –
Transfer to producing assets (133.0) (14.1) (147.1) – – –
Foreign currency translation (12.9) (3.0) (15.9) – – –
Balance at 31 December 2007 220.4 0.4 220.8 – – –
Producing assets
Balance at 1 January 2007 2,651.9 2,373.3 5,025.2 856.3 863.2 1,719.5
Acquisition of controlled entities 50.5 – 50.5 – – –
Acquisition of oil and gas assets 20.9 – 20.9 – – –
Additions 447.8 413.2 861.0 160.4 176.4 336.8
Transfer from assets in development 133.0 14.1 147.1 – – –
Transfer from exploration and evaluation assets 53.7 – 53.7 46.2 – 46.2
Depreciation and depletion expense (431.3) (303.2) (734.5) (265.7) (130.1) (395.8)
Net impairment losses – – – (47.4) (9.2) (56.6)
Foreign currency translation (19.9) (40.4) (60.3) – – –
Balance at 31 December 2007 2,906.6 2,457.0 5,363.6 749.8 900.3 1,650.1
Total oil and gas assets 3,127.0 2,457.4 5,584.4 749.8 900.3 1,650.1
Comprising:
Exploration and evaluation expenditure pending
commercialisation 197.3 0.4 197.7 – – –
Other capitalised expenditure 2,929.7 2,457.0 5,386.7 749.8 900.3 1,650.1
3,127.0 2,457.4 5,584.4 749.8 900.3 1,650.1
Notes to the Consolidated Financial Statementsfor the year ended 31 December 2007
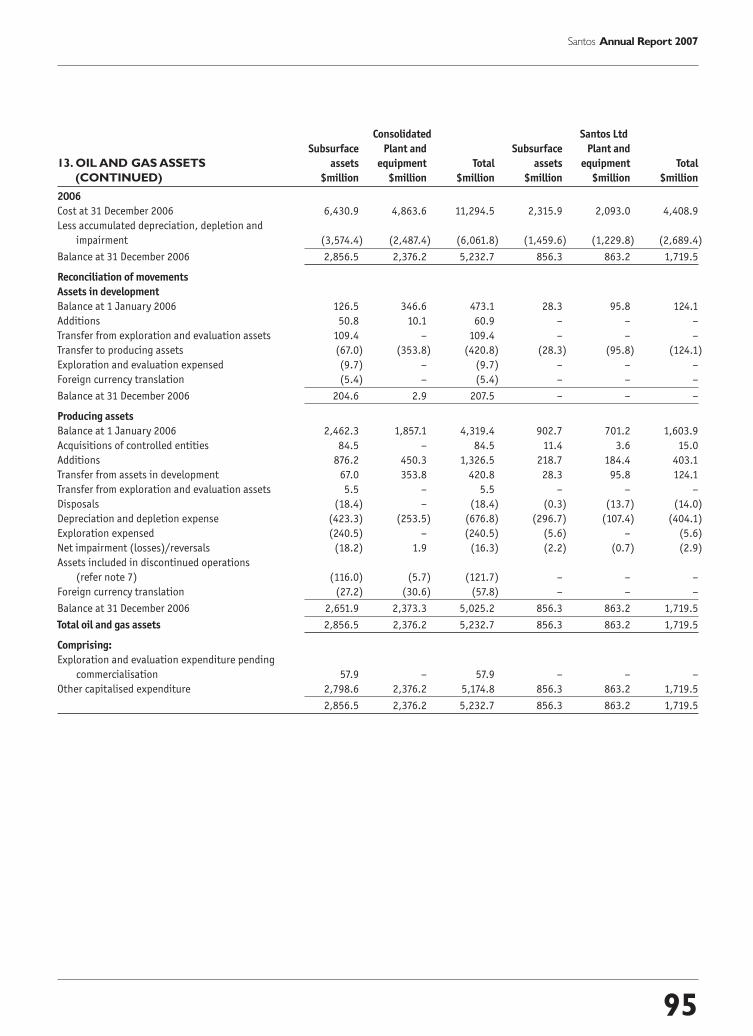
95
Santos Annual Report 2007
Consolidated Santos Ltd
Subsurface Plant and Subsurface Plant and
13. OIL AND GAS ASSETS assets equipment Total assets equipment Total
(CONTINUED) $million $million $million $million $million $million
2006
Cost at 31 December 2006 6,430.9 4,863.6 11,294.5 2,315.9 2,093.0 4,408.9
Less accumulated depreciation, depletion and
impairment (3,574.4) (2,487.4) (6,061.8) (1,459.6) (1,229.8) (2,689.4)
Balance at 31 December 2006 2,856.5 2,376.2 5,232.7 856.3 863.2 1,719.5
Reconciliation of movements
Assets in development
Balance at 1 January 2006 126.5 346.6 473.1 28.3 95.8 124.1
Additions 50.8 10.1 60.9 – – –
Transfer from exploration and evaluation assets 109.4 – 109.4 – – –
Transfer to producing assets (67.0) (353.8) (420.8) (28.3) (95.8) (124.1)
Exploration and evaluation expensed (9.7) – (9.7) – – –
Foreign currency translation (5.4) – (5.4) – – –
Balance at 31 December 2006 204.6 2.9 207.5 – – –
Producing assets
Balance at 1 January 2006 2,462.3 1,857.1 4,319.4 902.7 701.2 1,603.9
Acquisitions of controlled entities 84.5 – 84.5 11.4 3.6 15.0
Additions 876.2 450.3 1,326.5 218.7 184.4 403.1
Transfer from assets in development 67.0 353.8 420.8 28.3 95.8 124.1
Transfer from exploration and evaluation assets 5.5 – 5.5 – – –
Disposals (18.4) – (18.4) (0.3) (13.7) (14.0)
Depreciation and depletion expense (423.3) (253.5) (676.8) (296.7) (107.4) (404.1)
Exploration expensed (240.5) – (240.5) (5.6) – (5.6)
Net impairment (losses)/reversals (18.2) 1.9 (16.3) (2.2) (0.7) (2.9)
Assets included in discontinued operations
(refer note 7) (116.0) (5.7) (121.7) – – –
Foreign currency translation (27.2) (30.6) (57.8) – – –
Balance at 31 December 2006 2,651.9 2,373.3 5,025.2 856.3 863.2 1,719.5
Total oil and gas assets 2,856.5 2,376.2 5,232.7 856.3 863.2 1,719.5
Comprising:
Exploration and evaluation expenditure pending
commercialisation 57.9 – 57.9 – – –
Other capitalised expenditure 2,798.6 2,376.2 5,174.8 856.3 863.2 1,719.5
2,856.5 2,376.2 5,232.7 856.3 863.2 1,719.5

96
Santos Annual Report 2007
Consolidated Santos Ltd
Land and Plant and Land and Plant and
14. OTHER LAND, BUILDINGS, buildings equipment Total buildings equipment Total
PLANT AND EQUIPMENT $million $million $million $million $million $million
Cost at 31 December 2006 21.8 198.9 220.7 4.8 188.3 193.1
Less accumulated depreciation (1.8) (101.7) (103.5) (0.5) (98.4) (98.9)
Balance at 31 December 2006 20.0 97.2 117.2 4.3 89.9 94.2
Cost at 31 December 2007 27.1 236.1 263.2 4.8 224.9 229.7
Less accumulated depreciation (2.5) (125.9) (128.4) (0.6) (121.7) (122.3)
Balance at 31 December 2007 24.6 110.2 134.8 4.2 103.2 107.4
Reconciliation of movements
Balance at 1 January 2006 12.2 61.3 73.5 5.5 46.3 51.8
Acquisition of controlled entities – – – – – –
Additions 11.9 47.3 59.2 1.1 55.7 56.8
Disposals – (0.1) (0.1) – (0.1) (0.1)
Depreciation (4.1) (11.3) (15.4) (2.3) (12.0) (14.3)
Balance at 31 December 2006 20.0 97.2 117.2 4.3 89.9 94.2
Balance at 1 January 2007 20.0 97.2 117.2 4.3 89.9 94.2
Additions 5.1 37.3 42.4 – 36.7 36.7
Depreciation (0.5) (24.3) (24.8) (0.1) (23.4) (23.5)
Balance at 31 December 2007 24.6 110.2 134.8 4.2 103.2 107.4
Notes to the Consolidated Financial Statementsfor the year ended 31 December 2007

97
Santos Annual Report 2007
15. IMPAIRMENT OF CASH-GENERATING UNITS
At 31 December 2007 the Group reassessed the carrying amount of its oil and gas assets for indicators of impairment such as changes in future
prices, future costs and reserves. As a result, the recoverable amounts of some cash-generating units were formally reassessed but no
impairment write-downs were required.
Estimates of recoverable amounts are based on the assets’ value in use, determined by discounting each asset’s estimated future cash flows at
asset specific discount rates. The pre-tax discount rates applied were equivalent to post-tax discount rates between 5.6% and 9.7% (2006: 6.3%
and 9.1%) depending on the nature of the risks specific to each asset. Where an asset does not generate cash flows that are largely independent
from other assets or groups of assets, the recoverable amount is determined for the cash-generating unit to which the asset belongs.
Consolidated Santos Ltd
Subsurface Plant and Subsurface Plant and
assets equipment Total assets equipment Total
CGU Description $million $million $million $million $million $million
2007
Mutineer-Exeter Oil field – – – 39.3 8.6 47.9
Other – impairment losses – – – 8.1 0.6 8.7
Australia – – – 47.4 9.2 56.6
Comprising:
Impairment losses – 56.6
Impairment reversals – –
Net impairment loss – 56.6
2006
Elang-Kakatua Oilfield 6.2 0.3 6.5 – – –
Other – impairment losses 6.6 0.8 7.4 2.2 0.7 2.9
Other – impairment reversals (3.3) (2.8) (6.1) – – –
Australia 9.5 (1.7) 7.8 2.2 0.7 2.9
International – other 3.4 – 3.4 – – –
Continuing operations 12.9 (1.7) 11.2 2.2 0.7 2.9
Discontinued operations 5.1 – 5.1 – – –
18.0 (1.7) 16.3 2.2 0.7 2.9
Comprising:
Impairment losses 22.4 2.9
Impairment reversals (6.1) –
Net impairment loss 16.3 2.9
The Group has continued to carry forward capitalised exploration and evaluation expenditure of $55.5 million in respect of the Jeruk oil
discovery in the Sampang PSC in East Java, Indonesia. Opportunities to commercialise Jeruk continue to be pursued; however, plans for
additional appraisal drilling have been placed on hold pending the review of development scenarios and the resolution of commercial and
technical issues that may impact the viability of any development.
At 31 December 2007 the recoverable amount of Jeruk was formally estimated by applying probabilistic assessments to potential future cash
flows. This analysis indicated that the recoverable amount of Jeruk supports the carrying amount at 31 December 2007.

98
Santos Annual Report 2007
Consolidated Santos Ltd
2007 2006 2007 2006
16.AVAILABLE-FOR-SALE FINANCIAL ASSETS $million $million $million $million
Equity securities available for sale 15.6 45.2 15.6 20.3
Investments in equity securities available for sale consist of investments in
ordinary shares listed on the Australian Securities Exchange, and have no fixed
maturity date or coupon rate.
17. OTHER FINANCIAL ASSETS
Investments in controlled entities – – 3,472.3 2,833.8
Other 32.7 11.9 16.1 7.9
32.7 11.9 3,488.4 2,841.7
18. DEFERRED TAX ASSETS AND LIABILITIES
Recognised deferred tax assets and liabilities
Deferred tax assets and liabilities are attributable to the following:
Assets Liabilities Net
2007 2006 2007 2006 2007 2006
$million $million $million $million $million $million
Consolidated
Exploration, evaluation, oil and gas assets,
other land, buildings, plant and equipment – – 306.4 358.8 306.4 358.8
Other investments – – 3.3 1.6 3.3 1.6
Trade receivables – (7.9) 5.7 – 5.7 (7.9)
Other receivables – – 0.1 – 0.1 –
Inventories – – 20.1 15.0 20.1 15.0
Prepayments – – 2.2 2.0 2.2 2.0
Other assets – – – 9.7 – 9.7
Equity-raising costs (0.6) (1.3) – – (0.6) (1.3)
Trade payables (6.6) (7.8) – – (6.6) (7.8)
Interest-bearing loans and borrowings – – 87.1 91.1 87.1 91.1
Employee benefits (19.3) (18.3) – – (19.3) (18.3)
Defined benefit obligation (3.4) (5.5) – – (3.4) (5.5)
Provisions (11.1) (9.1) – – (11.1) (9.1)
Other items – – 73.4 34.3 73.4 34.3
Tax value of carry-forward losses recognised (18.5) (20.2) – – (18.5) (20.2)
Tax (assets)/liabilities (59.5) (70.1) 498.3 512.5 438.8 442.4
Set-off of tax (27.3) (5.0) 27.3 5.0 – –
Net tax (assets)/liabilities (86.8) (75.1) 525.6 517.5 438.8 442.4
Notes to the Consolidated Financial Statementsfor the year ended 31 December 2007

99
Santos Annual Report 2007
Assets Liabilities Net18. DEFERRED TAX ASSETS 2007 2006 2007 2006 2007 2006
AND LIABILITIES (CONTINUED) $million $million $million $million $million $million
Santos Ltd
Exploration, evaluation, oil and gas assets,
other land, buildings, plant and equipment – – 83.9 111.7 83.9 111.7
Other investments – – 3.3 1.6 3.3 1.6
Trade receivables – (8.5) 5.0 – 5.0 (8.5)
Inventories – – 12.6 9.7 12.6 9.7
Other assets – – – 0.9 – 0.9
Equity-raising costs (0.6) (1.3) – – (0.6) (1.3)
Employee benefits (18.3) (17.5) – – (18.3) (17.5)
Defined benefit obligation (3.4) (5.5) – – (3.4) (5.5)
Provisions (8.2) (6.2) – – (8.2) (6.2)
Other liabilities – (2.8) – – – (2.8)
Other items (11.2) – – 0.2 (11.2) 0.2
Tax value of carry-forward losses recognised (9.0) (17.0) – – (9.0) (17.0)
Tax (assets)/liabilities (50.7) (58.8) 104.8 124.1 54.1 65.3
Set-off of tax 50.7 58.8 (50.7) (58.8) – –
Net tax liabilities – – 54.1 65.3 54.1 65.3
At 31 December 2007, temporary differences of $2,498.9 million (2006: $3,006.5 million) relating to investments in subsidiaries have not
been recognised because the Company controls whether the liability will be incurred and it is satisfied that it will not be incurred in the
foreseeable future.
Unrecognised deferred tax assets
Deferred tax assets have not been recognised in respect of the following items:
Consolidated Santos Ltd
2007 2006 2007 2006
$million $million $million $million
Deductible temporary differences 75.8 40.3 – –
Tax losses 72.8 124.5 27.8 38.8
148.6 164.8 27.8 38.8
Deferred tax assets have not been recognised in respect of these items because it
is not probable that future taxable profits will be available against which the
Group can utilise the benefits. Unrecognised deductible temporary differences
and tax losses of $44.9 million (2006: $83.9 million) will expire between 2008
and 2025. The remaining deductible temporary differences and tax losses do not
expire under current tax legislation.
19.TRADE AND OTHER PAYABLES
Trade payables 432.4 341.4 180.6 136.2
Non-trade payables and accrued expenses 229.0 100.4 73.1 55.0
Amounts owing to controlled entities – – 389.2 371.7
661.4 441.8 642.9 562.9

100
Santos Annual Report 2007
Consolidated Santos Ltd
2007 2006 2007 2006
20. INTEREST-BEARING LOANS AND BORROWINGS $million $million $million $million
This note provides information about the contractual terms of the Group’s
interest-bearing loans and borrowings. For more information about the Group’s
exposure to interest rate and foreign currency risk, see note 38.
Current liabilities
Bank loans – secured 1.4 9.0 – –
Bank loans – unsecured 17.3 20.3 – –
Commercial paper 64.6 129.6 – –
Medium-term notes 19.8 – – –
Long-term notes – 130.4 – –
103.1 289.3 – –
Non-current liabilities
Amounts owing to controlled entities – – 2,478.2 2,583.6
Bank loans – secured 46.4 52.5 – –
Bank loans – unsecured 304.5 212.4 – –
Medium-term notes 438.8 463.7 – –
Long-term notes 1,203.2 631.8 – –
1,992.9 1,360.4 2,478.2 2,583.6
The amounts owing to controlled entities are for loans made in the ordinary course of business on normal market terms and conditions and are
not repayable for a minimum of nine years.
The Group has entered into interest rate swap contracts to manage the exposure to interest rates. This has resulted in a weighted average
interest rate on interest-bearing liabilities of 6.62% as at 31 December 2007 (2006: 6.33%). All borrowings are unsecured, with the exception
of the secured bank loan, and arranged through a controlled entity, Santos Finance Ltd, and guaranteed by Santos Ltd.
Details of major credit facilities(A) BANK LOANS – SECURED
A reserve-based lending facility for US$65.0 million was entered into in the 2006 reporting period which bears a floating rate of interest.
The facility is secured by a first charge over the Group’s interests in the Maleo and Kakap assets in Indonesia with a carrying amount at
31 December 2007 of A$131.6 million. The average rate for the year was 9.15%, and A$47.8 million was outstanding at the balance sheet
date. The facility is available until 2012, and the current amount drawn down is expected to be fully repaid by 2010.
(B) BANK LOANS – UNSECURED
The Group has access to the following committed revolving bank facilities:
Revolving facilities
2007 2006
Year of maturity Currency A$million A$million
2007 Multi-currency – 200.0
2008 Multi-currency – 300.0
2009 Multi-currency – 200.0
2011 Multi-currency 225.0 –
2012 Multi-currency 375.0 –
2013 Multi-currency 100.0 –
700.0 700.0
Revolving bank facilities bear interest at the relevant interbank reference rate plus 0.25% to 0.43%. The amount drawn at
31 December 2007 is $130.0 million (2006: $nil).
Notes to the Consolidated Financial Statementsfor the year ended 31 December 2007

101
Santos Annual Report 2007
20. INTEREST-BEARING LOANS AND BORROWINGS (CONTINUED)
(B) BANK LOANS – UNSECURED (CONTINUED)
Term bank loans
2007 2006
Year of maturity Currency A$million A$million
2007 USD – 20.3
2008 USD 17.3 19.1
2009 USD 21.4 23.7
2010 USD 22.2 24.4
2011 USD 22.9 25.3
2012 USD 19.7 21.9
2013 USD 16.4 18.2
2014 USD 17.3 19.2
2015 USD 17.7 19.6
2016 USD 18.0 20.0
2017 USD 18.9 21.0
191.8 232.7
Term bank loans bear interest at the relevant interbank reference rate plus a margin of up to 0.75%. The amount outstanding at
31 December 2007 is US$168.1 million (A$191.8 million) (2006: US$183.9 million (A$232.7 million)) at a weighted average annual
effective interest rate of 5.99% (2006: 6.22%).
(C) COMMERCIAL PAPER
The Group has an $800.0 million (2006: $800.0 million) Australian commercial paper program supported by the revolving bank facilities
referred to in (B) above. At 31 December 2007, $64.6 million (2006: $129.6 million) of commercial paper is on issue and the weighted
average annual effective interest rate is 7.59% (2006: 6.61%).
(D) MEDIUM-TERM NOTES
The Group has a $1,000.0 million (2006: $1,000.0 million) Australian medium-term note program.
Medium-term notes on issue
Effective 2007 2006
Year of issue Year of maturity interest rate $million $million
1998 2008 8.04% 19.8 19.7
2005 2011 7.85%* 349.0 349.2
2005 2015 7.84% 89.8 94.8
458.6 463.7
* Floating rate of interest.
(E) LONG-TERM NOTES
Long-term notes on issue
Effective 2007 2006 2007 2006
Year of issue Year of maturity interest rate US$million US$million A$million A$million
2000 2007 to 2015 7.08% 203.1 303.4 231.8 384.0
2002 2009 to 2022 6.15% 307.3 298.9 350.7 378.2
2007 2017 to 2027 5.57% 544.0 – 620.7 –
1,054.4 602.3 1,203.2 762.2

102
Santos Annual Report 2007
Consolidated Santos Ltd
2007 2006 2007 2006
21. PROVISIONS $million $million $million $million
Current
Liability for annual leave 23.7 21.6 22.9 20.8
Liability for long service leave 35.7 31.8 35.2 31.3
Restoration 51.5 77.0 5.5 6.6
Non-executive Directors’ retirement benefits 1.5 1.7 1.5 1.7
112.4 132.1 65.1 60.4
Non-current
Liability for long service leave 3.5 2.7 3.2 2.5
Liability for defined benefit obligations (refer note 29) 16.3 26.3 16.3 26.3
Restoration 523.8 512.8 148.3 156.0
543.6 541.8 167.8 184.8
Movements in each class of provision during the financial year, other than provisions relating to employee benefits are set out below:
Total
Non-executive
Directors’
Total retirement
restoration benefits Total
$million $million $million
Consolidated
Balance at 1 January 2007 589.8 1.7 591.5
Provisions made during the year 29.6 0.1 29.7
Provisions used during the year (42.7) (0.3) (43.0)
Unwind of discount 23.9 – 23.9
Change in discount rate (32.5) – (32.5)
Foreign currency fluctuations 7.2 – 7.2
Balance at 31 December 2007 575.3 1.5 576.8
Santos Ltd
Balance at 1 January 2007 162.6 1.7 164.3
Provisions made during the year (5.0) 0.1 (4.9)
Provisions used during the year (2.7) (0.3) (3.0)
Unwind of discount 8.5 – 8.5
Change in discount rate (9.6) – (9.6)
Balance at 31 December 2007 153.8 1.5 155.3
Restoration
Provisions for future removal and restoration costs are recognised where there is a present obligation as a result of exploration, development,
production, transportation or storage activities having been undertaken, and it is probable that an outflow of economic benefits will be
required to settle the obligation. The estimated future obligations include the costs of removing facilities, abandoning wells and restoring the
affected areas.
Non-executive Directors’ retirement benefits
Agreements exist with the Non-executive Directors appointed prior to 1 January 2004 providing for the payment of a sum on retirement from
office as a Director in accordance with shareholder approval at the 1989 Annual General Meeting. Such benefits ceased to accrue with effect
from 30 June 2004. These benefits have been fully provided for by the Company.
In June 2007, the Board resolved to adopt a policy of indexation of these frozen benefits to prevent further erosion of the real value.
The entitlements are annually indexed to the five year government bond rate.
During the year, a retirement payment was made to Mr M A O’Leary who retired as a Director in December 2006.
Notes to the Consolidated Financial Statementsfor the year ended 31 December 2007
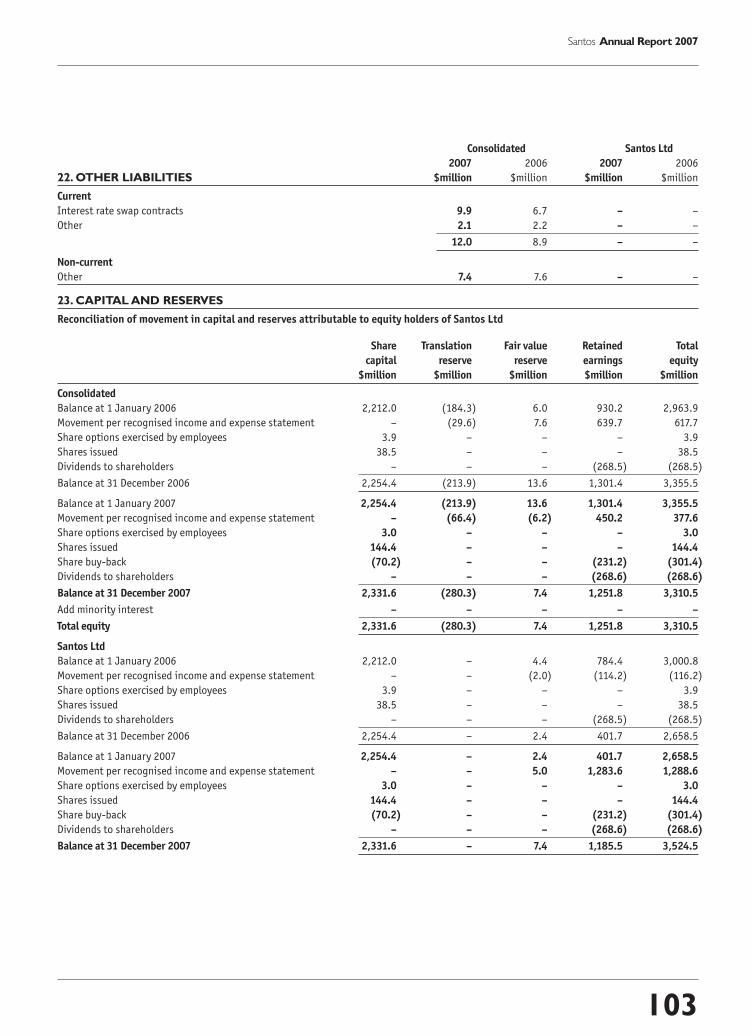
103
Santos Annual Report 2007
Consolidated Santos Ltd
2007 2006 2007 2006
22. OTHER LIABILITIES $million $million $million $million
Current
Interest rate swap contracts 9.9 6.7 – –
Other 2.1 2.2 – –
12.0 8.9 – –
Non-current
Other 7.4 7.6 – –
23. CAPITAL AND RESERVES
Reconciliation of movement in capital and reserves attributable to equity holders of Santos Ltd
Share Translation Fair value Retained Total
capital reserve reserve earnings equity
$million $million $million $million $million
Consolidated
Balance at 1 January 2006 2,212.0 (184.3) 6.0 930.2 2,963.9
Movement per recognised income and expense statement – (29.6) 7.6 639.7 617.7
Share options exercised by employees 3.9 – – – 3.9
Shares issued 38.5 – – – 38.5
Dividends to shareholders – – – (268.5) (268.5)
Balance at 31 December 2006 2,254.4 (213.9) 13.6 1,301.4 3,355.5
Balance at 1 January 2007 2,254.4 (213.9) 13.6 1,301.4 3,355.5
Movement per recognised income and expense statement – (66.4) (6.2) 450.2 377.6
Share options exercised by employees 3.0 – – – 3.0
Shares issued 144.4 – – – 144.4
Share buy-back (70.2) – – (231.2) (301.4)
Dividends to shareholders – – – (268.6) (268.6)
Balance at 31 December 2007 2,331.6 (280.3) 7.4 1,251.8 3,310.5
Add minority interest – – – – –
Total equity 2,331.6 (280.3) 7.4 1,251.8 3,310.5
Santos Ltd
Balance at 1 January 2006 2,212.0 – 4.4 784.4 3,000.8
Movement per recognised income and expense statement – – (2.0) (114.2) (116.2)
Share options exercised by employees 3.9 – – – 3.9
Shares issued 38.5 – – – 38.5
Dividends to shareholders – – – (268.5) (268.5)
Balance at 31 December 2006 2,254.4 – 2.4 401.7 2,658.5
Balance at 1 January 2007 2,254.4 – 2.4 401.7 2,658.5
Movement per recognised income and expense statement – – 5.0 1,283.6 1,288.6
Share options exercised by employees 3.0 – – – 3.0
Shares issued 144.4 – – – 144.4
Share buy-back (70.2) – – (231.2) (301.4)
Dividends to shareholders – – – (268.6) (268.6)
Balance at 31 December 2007 2,331.6 – 7.4 1,185.5 3,524.5
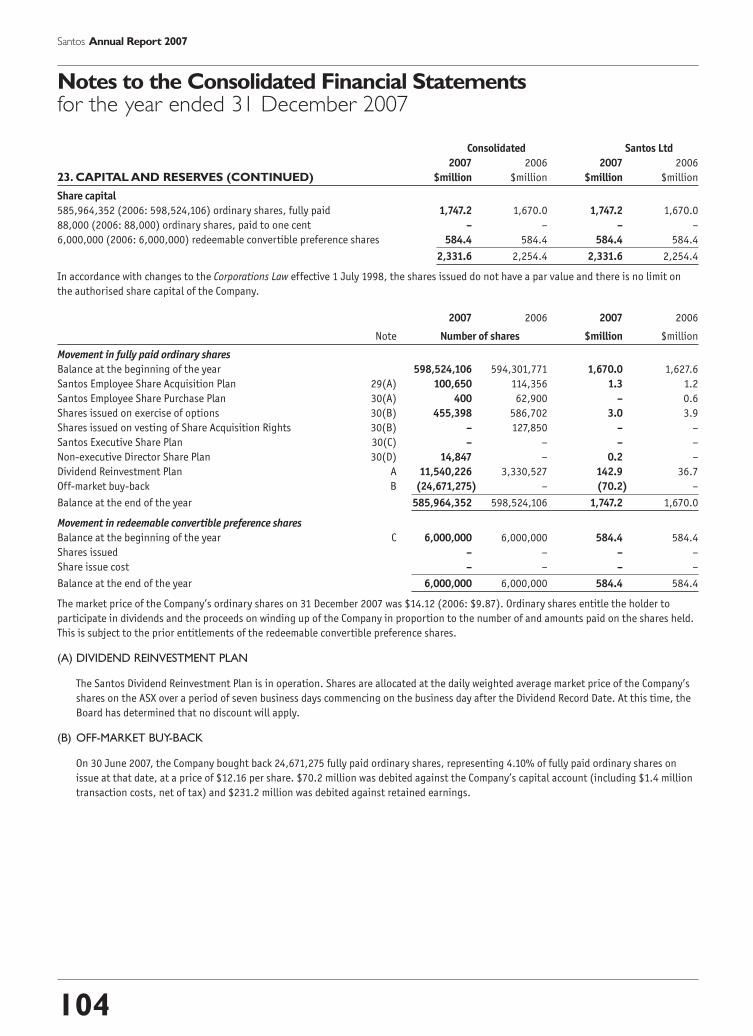
104
Santos Annual Report 2007
Consolidated Santos Ltd
2007 2006 2007 2006
23. CAPITAL AND RESERVES (CONTINUED) $million $million $million $million
Share capital
585,964,352 (2006: 598,524,106) ordinary shares, fully paid 1,747.2 1,670.0 1,747.2 1,670.0
88,000 (2006: 88,000) ordinary shares, paid to one cent – – – –
6,000,000 (2006: 6,000,000) redeemable convertible preference shares 584.4 584.4 584.4 584.4
2,331.6 2,254.4 2,331.6 2,254.4
In accordance with changes to the Corporations Law effective 1 July 1998, the shares issued do not have a par value and there is no limit on
the authorised share capital of the Company.
2007 2006 2007 2006
Note Number of shares $million $million
Movement in fully paid ordinary shares
Balance at the beginning of the year 598,524,106 594,301,771 1,670.0 1,627.6
Santos Employee Share Acquisition Plan 29(A) 100,650 114,356 1.3 1.2
Santos Employee Share Purchase Plan 30(A) 400 62,900 – 0.6
Shares issued on exercise of options 30(B) 455,398 586,702 3.0 3.9
Shares issued on vesting of Share Acquisition Rights 30(B) – 127,850 – –
Santos Executive Share Plan 30(C) – – – –
Non-executive Director Share Plan 30(D) 14,847 – 0.2 –
Dividend Reinvestment Plan A 11,540,226 3,330,527 142.9 36.7
Off-market buy-back B (24,671,275) – (70.2) –
Balance at the end of the year 585,964,352 598,524,106 1,747.2 1,670.0
Movement in redeemable convertible preference shares
Balance at the beginning of the year C 6,000,000 6,000,000 584.4 584.4
Shares issued – – – –
Share issue cost – – – –
Balance at the end of the year 6,000,000 6,000,000 584.4 584.4
The market price of the Company’s ordinary shares on 31 December 2007 was $14.12 (2006: $9.87). Ordinary shares entitle the holder to
participate in dividends and the proceeds on winding up of the Company in proportion to the number of and amounts paid on the shares held.
This is subject to the prior entitlements of the redeemable convertible preference shares.
(A) DIVIDEND REINVESTMENT PLAN
The Santos Dividend Reinvestment Plan is in operation. Shares are allocated at the daily weighted average market price of the Company’s
shares on the ASX over a period of seven business days commencing on the business day after the Dividend Record Date. At this time, the
Board has determined that no discount will apply.
(B) OFF-MARKET BUY-BACK
On 30 June 2007, the Company bought back 24,671,275 fully paid ordinary shares, representing 4.10% of fully paid ordinary shares on
issue at that date, at a price of $12.16 per share. $70.2 million was debited against the Company’s capital account (including $1.4 million
transaction costs, net of tax) and $231.2 million was debited against retained earnings.
Notes to the Consolidated Financial Statementsfor the year ended 31 December 2007

105
Santos Annual Report 2007
23. CAPITAL AND RESERVES (CONTINUED)
(C) REDEEMABLE CONVERTIBLE PREFERENCE SHARES
On 30 September 2004, the Company issued 6,000,000 redeemable convertible preference shares at $100 each, which resulted in an
amount of $600,000,000 being credited to the Company’s capital account before deducting the costs of issue.
Redeemable convertible preference shareholders receive a floating preferential, non cumulative dividend which incorporates the value of
franking credits (i.e. it is on a grossed up basis), set at the Bank Bill Swap Rate for 180-day bills plus a margin. Dividends on redeemable
convertible preference shares are in priority to any dividend declared on ordinary class shares. Redeemable convertible preference
shareholders are not entitled to vote at any general meetings, except in the following circumstances:
(i) on a proposal:
(1) to reduce the share capital of the Company;
(2) that affects rights attached to the redeemable convertible preference shares;
(3) to wind up the Company; or
(4) for the disposal of the whole of the property, business and undertaking of the Company;
(ii) on a resolution to approve the terms of a buy-back agreement;
(iii) during a period in which a dividend or part of a dividend on the redeemable convertible preference shares is in arrears; or
(iv) during the winding up of the Company.
In the event of the winding up of the Company, redeemable convertible preference shares will rank for repayment of capital behind all
creditors of the Company, but ahead of the ordinary class shares.
The redeemable convertible preference shares may, at the sole discretion of the Company, be converted into ordinary class shares
and/or exchanged.
Capital risk management
The Group’s objective when managing capital is to safeguard the ability to continue as a going concern, so that it can continue to provide
returns for shareholders and benefits for other stakeholders, and to maintain an efficient capital structure.
In order to maintain or adjust the capital structure the Group may adjust the amount of dividends paid to shareholders, return capital to
shareholders, issue new shares or sell assets to reduce debt.
Consistently with others in the industry, the Group monitors capital on the basis of the gearing ratio. This ratio is calculated as net debt
divided by total capital. Net debt is calculated as total interest-bearing loans and borrowings less cash and cash equivalents. Total capital is
calculated as total equity as shown in the balance sheet plus net debt. Equity includes redeemable convertible preference shares.

106
Santos Annual Report 2007
23. CAPITAL AND RESERVES (CONTINUED)
During 2007 the Group’s target was to maintain a gearing ratio below 45% and a BBB+ Standard & Poor’s credit rating. The gearing ratios at
31 December 2007 and 31 December 2006 were as follows:
Consolidated Santos Ltd
2007 2006 2007 2006
$million $million $million $million
Total interest-bearing loans and borrowings (note 20) 2,096.0 1,649.7 2,478.2 2,583.6
Less cash and cash equivalents (note 8) (200.5) (200.0) (56.8) (52.8)
Net debt 1,895.5 1,449.7 2,421.4 2,530.8
Total equity 3,310.5 3,355.5 3,524.5 2,658.5
Total capital 5,206.0 4,805.2 5,945.9 5,189.3
Gearing ratio 36.4% 30.2% 40.7% 48.8%
The increase in the gearing ratio resulted primarily from the $300.0 million share buy-back undertaken during the year.
Translation reserve
The foreign currency translation reserve comprises all foreign exchange differences arising from the translation of the financial statements
of foreign operations where their functional currency is different to the presentation currency of the reporting entity, as well as from the
translation of liabilities that hedge the Company’s net investment in a foreign subsidiary and exchange differences that arise on the translation
of monetary items that form part of the net investment in a foreign operation.
Fair value reserve
The fair value reserve includes the cumulative net change in the fair value of available-for-sale investments until the investment is
derecognised.
Dividends
Dividends recognised during the year by the Company are:
Dollars Total Franked/ Payment
per share $million unfranked date
2007
Interim 2007 redeemable preference $2.8592 17.1 Franked 2 Oct 2007
Final 2006 redeemable preference $2.7272 16.4 Franked 2 Apr 2007
Interim 2007 ordinary $0.20 115.4 Franked 2 Oct 2007
Final 2006 ordinary $0.20 119.7 Franked 2 Apr 2007
268.6
2006
Interim 2006 redeemable preference $2.5275 15.2 Franked 2 Oct 2006
Final 2005 redeemable preference $2.5300 15.2 Franked 31 Mar 2006
Interim 2006 ordinary $0.20 119.2 Franked 2 Oct 2006
Final 2005 ordinary $0.20 118.9 Franked 31 Mar 2006
268.5
Franked dividends paid during the year were franked at the tax rate of 30%.
Notes to the Consolidated Financial Statementsfor the year ended 31 December 2007
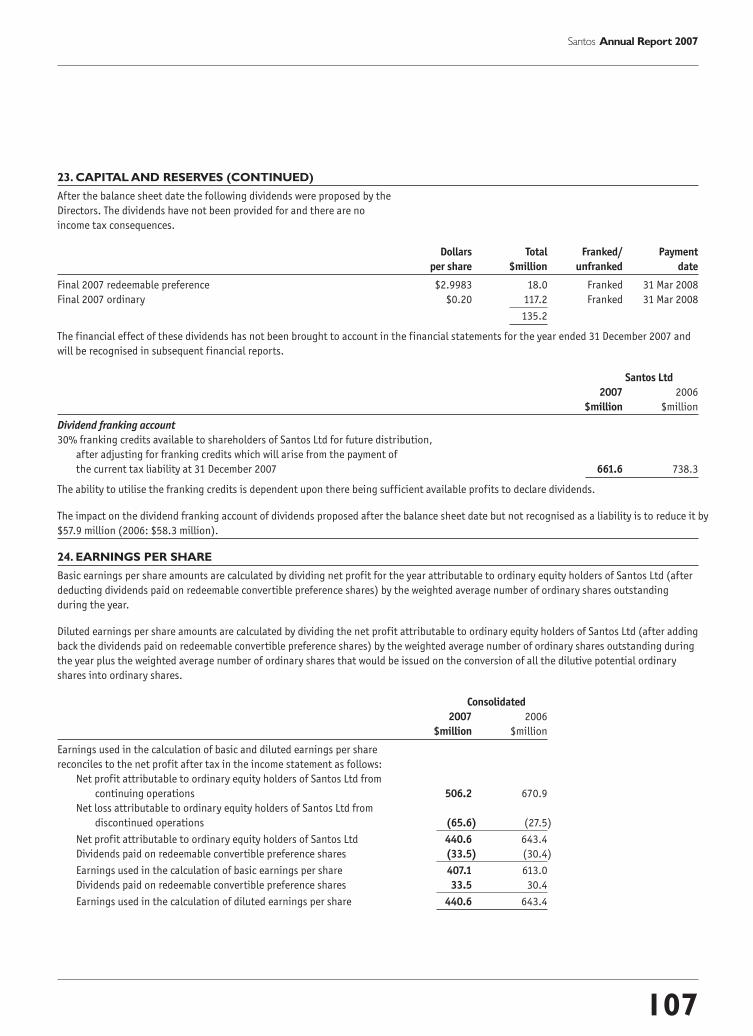
107
Santos Annual Report 2007
23. CAPITAL AND RESERVES (CONTINUED)
After the balance sheet date the following dividends were proposed by the
Directors. The dividends have not been provided for and there are no
income tax consequences.
Dollars Total Franked/ Payment
per share $million unfranked date
Final 2007 redeemable preference $2.9983 18.0 Franked 31 Mar 2008
Final 2007 ordinary $0.20 117.2 Franked 31 Mar 2008
135.2
The financial effect of these dividends has not been brought to account in the financial statements for the year ended 31 December 2007 and
will be recognised in subsequent financial reports.
Santos Ltd
2007 2006
$million $million
Dividend franking account
30% franking credits available to shareholders of Santos Ltd for future distribution,
after adjusting for franking credits which will arise from the payment of
the current tax liability at 31 December 2007 661.6 738.3
The ability to utilise the franking credits is dependent upon there being sufficient available profits to declare dividends.
The impact on the dividend franking account of dividends proposed after the balance sheet date but not recognised as a liability is to reduce it by
$57.9 million (2006: $58.3 million).
24. EARNINGS PER SHARE
Basic earnings per share amounts are calculated by dividing net profit for the year attributable to ordinary equity holders of Santos Ltd (after
deducting dividends paid on redeemable convertible preference shares) by the weighted average number of ordinary shares outstanding
during the year.
Diluted earnings per share amounts are calculated by dividing the net profit attributable to ordinary equity holders of Santos Ltd (after adding
back the dividends paid on redeemable convertible preference shares) by the weighted average number of ordinary shares outstanding during
the year plus the weighted average number of ordinary shares that would be issued on the conversion of all the dilutive potential ordinary
shares into ordinary shares.
Consolidated
2007 2006
$million $million
Earnings used in the calculation of basic and diluted earnings per share
reconciles to the net profit after tax in the income statement as follows:
Net profit attributable to ordinary equity holders of Santos Ltd from
continuing operations 506.2 670.9
Net loss attributable to ordinary equity holders of Santos Ltd from
discontinued operations (65.6) (27.5)
Net profit attributable to ordinary equity holders of Santos Ltd 440.6 643.4
Dividends paid on redeemable convertible preference shares (33.5) (30.4)
Earnings used in the calculation of basic earnings per share 407.1 613.0
Dividends paid on redeemable convertible preference shares 33.5 30.4
Earnings used in the calculation of diluted earnings per share 440.6 643.4

108
Santos Annual Report 2007
24. EARNINGS PER SHARE (CONTINUED)
Consolidated
2007 2006
Number of shares
The weighted average number of shares used for the purposes of calculating
diluted earnings per share reconciles to the number used to calculate basic
earnings per share as follows:
Basic earnings per share 590,505,305 596,176,555
Partly paid shares 65,864 63,763
Executive share options 818,109 654,780
Share acquisition rights 1,846,671 675,123
Redeemable convertible preference shares 48,354,101 52,942,374
Diluted earnings per share 641,590,050 650,512,595
Partly paid shares outstanding issued under the Santos Executive Share Plan; options outstanding issued under the Santos Executive Share
Option Plan; Share Acquisition Rights (“SARs”) issued to eligible executives, and redeemable convertible preference shares have been
classified as potential ordinary shares and included in the calculation of diluted earnings per share. The number of shares included in the
calculation are those assumed to be issued for no consideration, being the difference between the number that would have been issued at the
exercise price and the number that would have been issued at the average market price.
During the year, 455,398 (2006: 586,702) options, nil (2006: 127,850) SARs and nil (2006: nil) partly paid shares were converted to ordinary
shares. The diluted earnings per share calculation includes that portion of these options, SARs and partly paid shares assumed to be issued for
nil consideration, weighted with reference to the date of conversion. The weighted average number included is 321,982 (2006: 391,882).
335,900 (2006: 280,500) options and 273,100 (2006: 212,350) SARs lapsed during the year. The diluted earning per share calculation includes
that portion of these options and SARs assumed to be issued for nil consideration, weighted with reference to the date the options or SARs
lapsed. The weighted average number included is 104,179 (2006: 139,619).
To calculate earnings per share amounts for the discontinued operations, the loss figure used in the numerator and the weighted average
number of ordinary shares for both basic and diluted amounts are per the above tables.
Consolidated
2007 2006
cents cents
Earnings per share for continuing and discontinued operations
Basic earnings per share:
From continuing operations 80.0 107.4
From discontinued operations (11.1) (4.6)
68.9 102.8
Diluted earnings per share:
From continuing operations 78.9 103.1
From discontinued operations (10.2) (4.2)
68.7 98.9
Notes to the Consolidated Financial Statementsfor the year ended 31 December 2007

109
Santos Annual Report 2007
25. CONSOLIDATED ENTITIES
Country ofName incorporation
Santos Ltd (Parent Entity) AUSTControlled entities1:Alliance Petroleum Australia Pty Ltd2 AUSTBasin Oil Pty Ltd AUSTBoston L.H.F. Pty Ltd AUSTBridgefield Pty Ltd AUSTBridge Oil Developments Pty Limited2 AUSTBronco Energy Pty Limited4 AUSTCanso Resources Pty Ltd AUSTCoveyork Pty Ltd AUSTDoce Pty Ltd AUSTFairview Pipeline Pty Ltd AUSTFarmout Drillers Pty Ltd AUSTGidgealpa Oil Pty Ltd4 AUSTKipper GS Pty Ltd AUSTControlled entity of Kipper GS Pty Ltd
Santos Carbon Pty Ltd (previously Crusader (Victoria) Pty Ltd) AUSTMoonie Pipeline Company Pty Ltd AUSTReef Oil Pty Ltd2 AUSTSantos Asia Pacific Pty Ltd AUSTControlled entities of Santos Asia Pacific Pty Ltd
Santos (Sampang) Pty Ltd AUSTSantos (Warim) Pty Ltd AUST
Santos Australian Hydrocarbons Pty Ltd AUSTSantos (BOL) Pty Ltd2 AUSTControlled entity of Santos (BOL) Pty Ltd
Bridge Oil Exploration Pty Limited AUSTSantos CSG Pty Ltd AUSTSantos Darwin LNG Pty Ltd2 AUSTSantos Direct Pty Ltd AUSTSantos Facilities Pty Ltd AUSTSantos Finance Ltd AUSTSantos (Globe) Pty Ltd AUSTSantos International Holdings Pty Ltd AUSTControlled entities of Santos International Holdings Pty Ltd
Barracuda Limited PNGCairn Energy Bangladesh Limited4 UKCJSC South Petroleum Company1 KGZLavana Limited PNGPetroleum Ventures B.V.4 NLSanro Insurance Pte Ltd SGSantos Americas and Europe Corporation USAControlled entities of Santos Americas and Europe Corporation
Santos TPY Corp USAControlled entities of Santos TPY Corp
Santos Queensland Corp USASantos TOG Corp USAControlled entities of Santos TOG Corp
Santos TOGA Pty Ltd AUSTControlled entity of Santos TOGA Pty Ltd
Santos TPC Pty Ltd AUSTSantos TPY CSG Corp USA
Santos (Bawean) Pty Ltd AUSTSantos (BBF) Pty Ltd AUSTControlled entities of Santos (BBF) Pty Ltd
Santos (SPV) Pty Ltd AUSTControlled entities of Santos (SPV) Pty Ltd
Novus Nominees Pty Ltd AUSTSantos Brantas Pty Ltd AUSTSantos (Madura Offshore) Pty Ltd AUSTSantos UK (Kakap 2) Limited UK
Santos (Donggala) Pty Ltd AUSTSantos Egypt Pty Ltd AUST
Country ofName incorporation
Santos Hides Ltd PNGSantos International Operations Pty Ltd AUSTSantos International Ventures Pty Ltd (previously
Santos India Pty Ltd3) AUSTSantos Niugini Exploration Limited PNGSantos (Nth Bali 1) Pty Ltd AUSTSantos (Papalang) Pty Ltd AUSTSantos (Popodi) Pty Ltd AUSTSantos Vietnam Pty Ltd AUST
Santos (JBJ1) Pty Ltd3 AUSTControlled entity of Santos (JBJ1) Pty Ltd
Santos (JBJ2) Pty Ltd3 AUSTControlled entity of Santos (JBJ2) Pty Ltd
Santos (JBJ3) Pty Ltd3 AUSTSantos (JPDA 06-104) Pty Ltd AUSTSantos (JPDA 91-12) Pty Ltd AUSTSantos (NARNL Cooper) Pty Ltd AUSTSantos (NGA) Pty Ltd5 AUSTSantos (N.T.) Pty Ltd AUSTControlled entity of Santos (N.T.) Pty Ltd
Bonaparte Gas & Oil Pty Limited AUSTSantos Offshore Pty Ltd2 AUSTSantos Oil Exploration (Malaysia) Sdn Bhd (in liquidation) MYSantos Petroleum Pty Ltd2 AUSTSantos QNT Pty Ltd2 AUSTControlled entities of Santos QNT Pty Ltd
Santos QNT (No. 1) Pty Ltd2 AUSTControlled entities of Santos QNT (No. 1) Pty Ltd
Santos Petroleum Management Pty Ltd2 AUSTSantos Petroleum Operations Pty Ltd AUSTTMOC Exploration Proprietary Limited AUST
Santos QNT (No. 2) Pty Ltd2 AUSTControlled entities of Santos QNT (No. 2) Pty Ltd
Associated Petroleum Pty Ltd5 AUSTMoonie Oil Pty Ltd AUSTPetromin Pty Ltd AUSTSantos (299) Pty Ltd5 AUSTSantos Exploration Pty Ltd AUSTSantos Gnuco Pty Ltd5 AUSTTransoil Pty Ltd AUST
Santos Resources Pty Ltd AUSTSantos (TGR) Pty Ltd AUSTSantos Timor Sea Pipeline Pty Ltd AUSTSesap Pty Ltd AUSTVamgas Pty Ltd2 AUST
1 Beneficial interests in all controlled entities are 100%, except CJSC SouthPetroleum Company which is 70%.
2 Company is party to a Deed of Cross Guarantee. Refer note 37.3 Company incorporated during the year.4 Company acquired during the year. Refer note 26.5 Company approved for liquidation.
Country of incorporationAUST – AustraliaBD – BangladeshKGZ – Kyrgyz RepublicMY – MalaysiaNL – NetherlandsPNG – Papua New GuineaSG – SingaporeUK – United KingdomUSA – United States of AmericaIn the financial statements of the Company, investments in controlledentities are recognised at cost, less any impairment losses.

110
Santos Annual Report 2007
26.ACQUISITIONS OF SUBSIDIARIES
During the financial year the following controlled entities were acquired and their operating results have been included in the income
statement from the date of acquisition:
Contribution to
Beneficial Purchase consolidated profit
interest acquired consideration since acquisition
Name of entity Date of acquisition % $million $million
Petroleum Ventures B.V. 22 January 2007 100 14.1 (3.4)
Gidgealpa Oil Pty Ltd 7 June 2007 100 1.7 –
Bronco Energy Pty Limited 25 June 2007 100 10.7 –
Cairn Energy Bangladesh Limited 25 October 2007 100 62.9 (0.6)
Petroleum Ventures B.V. holds a 37.5% interest in Block 12 Production Sharing Contract, covering approximately 5,160 square kilometres in
the Nam Con Son Basin, offshore southern Vietnam. Santos acquired the share capital in Petroleum Ventures B.V. following the completion of
a farm in agreement to fund a proportion of the costs of a two-well drilling program in 2006, and the receipt of necessary approvals from the
Government of the Socialist Republic of Vietnam.
Gidgealpa Oil Pty Ltd holds a 4.9% interest in ATP 269P Coolum Block located in South West Queensland and is engaged in the exploration and
production of oil.
Bronco Energy Pty Limited holds interests in coal seam gas assets located in permits ATP 613P, ATP 735P, ATP 803P and ATP 804P in Eastern
Queensland. The assets are not currently producing and the company has no operating revenue. The purchase price includes a performance
payment of $3.0 million payable upon the existence of 2P reserves in the Permit Area such that Bronco Energy Pty Limited’s share of
production of those reserves would be 100PJ, and a second performance payment of $5.0 million when Bronco Energy Pty Limited’s share of
production of those 2P reserves would be 200PJ.
Cairn Energy Bangladesh Limited holds a 37.5% interest in the Sangu gas field and a portfolio of interests in exploration acreage located
offshore Bangladesh. The consideration for the acquisition comprises the initial payment of A$62.8 million, and contingent consideration of
US$20.0 million payable in two tranches, the first tranche of US$10.0 million is payable on determination of the wells being a commercial
success, and the second tranche of US$10.0 million is payable on first production. This acquisition has been provisionally accounted at the
balance date, as all the required information has not yet been received from the vendor to enable the fair value of the net assets acquired to
be finally determined.
If the acquisitions had occurred on 1 January 2007, there would have been a $27.8 million increase in Group revenue and net profit would have
decreased by $16.1 million.
Notes to the Consolidated Financial Statementsfor the year ended 31 December 2007
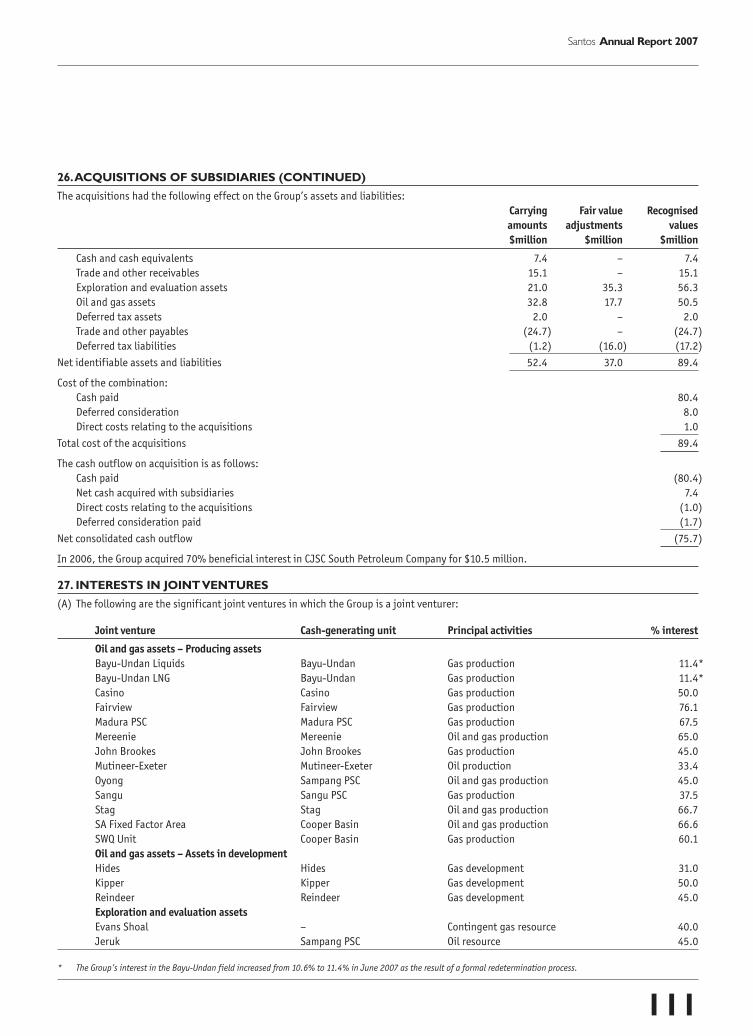
111
Santos Annual Report 2007
26.ACQUISITIONS OF SUBSIDIARIES (CONTINUED)
The acquisitions had the following effect on the Group’s assets and liabilities:
Carrying Fair value Recognised
amounts adjustments values
$million $million $million
Cash and cash equivalents 7.4 – 7.4
Trade and other receivables 15.1 – 15.1
Exploration and evaluation assets 21.0 35.3 56.3
Oil and gas assets 32.8 17.7 50.5
Deferred tax assets 2.0 – 2.0
Trade and other payables (24.7) – (24.7)
Deferred tax liabilities (1.2) (16.0) (17.2)
Net identifiable assets and liabilities 52.4 37.0 89.4
Cost of the combination:
Cash paid 80.4
Deferred consideration 8.0
Direct costs relating to the acquisitions 1.0
Total cost of the acquisitions 89.4
The cash outflow on acquisition is as follows:
Cash paid (80.4)
Net cash acquired with subsidiaries 7.4
Direct costs relating to the acquisitions (1.0)
Deferred consideration paid (1.7)
Net consolidated cash outflow (75.7)
In 2006, the Group acquired 70% beneficial interest in CJSC South Petroleum Company for $10.5 million.
27. INTERESTS IN JOINT VENTURES
(A) The following are the significant joint ventures in which the Group is a joint venturer:
Joint venture Cash-generating unit Principal activities % interest
Oil and gas assets – Producing assets
Bayu-Undan Liquids Bayu-Undan Gas production 11.4*
Bayu-Undan LNG Bayu-Undan Gas production 11.4*
Casino Casino Gas production 50.0
Fairview Fairview Gas production 76.1
Madura PSC Madura PSC Gas production 67.5
Mereenie Mereenie Oil and gas production 65.0
John Brookes John Brookes Gas production 45.0
Mutineer-Exeter Mutineer-Exeter Oil production 33.4
Oyong Sampang PSC Oil and gas production 45.0
Sangu Sangu PSC Gas production 37.5
Stag Stag Oil and gas production 66.7
SA Fixed Factor Area Cooper Basin Oil and gas production 66.6
SWQ Unit Cooper Basin Gas production 60.1
Oil and gas assets – Assets in development
Hides Hides Gas development 31.0
Kipper Kipper Gas development 50.0
Reindeer Reindeer Gas development 45.0
Exploration and evaluation assets
Evans Shoal – Contingent gas resource 40.0
Jeruk Sampang PSC Oil resource 45.0
* The Group’s interest in the Bayu-Undan field increased from 10.6% to 11.4% in June 2007 as the result of a formal redetermination process.

112
Santos Annual Report 2007
27. INTERESTS IN JOINT VENTURES (CONTINUED)
(B) The Group recognises its interests in the following jointly controlled entities using the proportionate consolidation method of accounting:
Joint venture entity % interest
Darwin LNG Pty Ltd 11.4*
Fairview Power Pty Ltd 50.0
Easternwell Drilling Services Holdings Pty Ltd 50.0
* The Group’s interest in the Bayu-Undan field increased from 10.6% to 11.4% in June 2007 as the result of a formal redetermination process.
Consolidated Santos Ltd
2007 2006 2007 2006
$million $million $million $million
The Group’s share of the assets, liabilities, income and expenses of the jointly
controlled entities, which are included in the consolidated financial statements
using the proportionate consolidation method of accounting, are as follows:
Current assets 46.0 70.6 – –
Non-current assets 148.1 161.5 – –
194.1 232.1 – –
Current liabilities (62.9) (19.2) – –
Non-current liabilities (4.3) (8.3) – –
Net assets 126.9 204.6 – –
Revenue 98.2 90.5 – –
Expenses (96.0) (70.3) – –
Profit before income tax 2.2 20.2 – –
(C) The Group’s share of capital expenditure commitments and minimum
exploration commitments in respect of joint ventures are:
Capital expenditure commitments 287.4 264.0 154.4 101.5
Minimum exploration commitments 336.0 149.2 35.0 18.5
Notes to the Consolidated Financial Statementsfor the year ended 31 December 2007
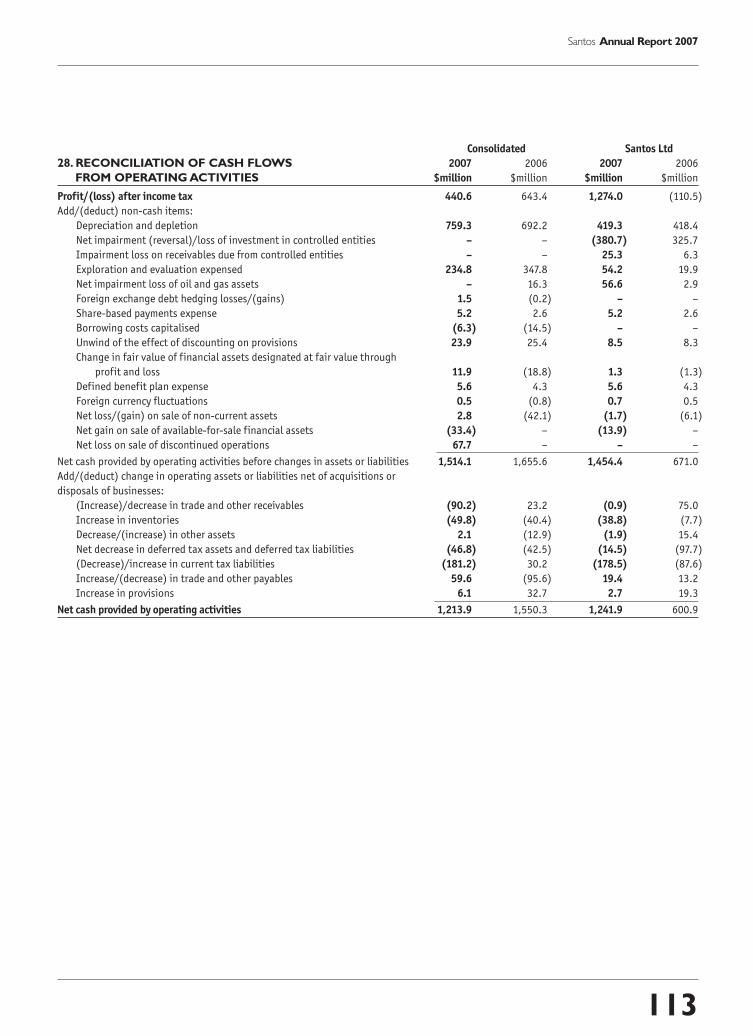
113
Santos Annual Report 2007
Consolidated Santos Ltd
28. RECONCILIATION OF CASH FLOWS 2007 2006 2007 2006
FROM OPERATING ACTIVITIES $million $million $million $million
Profit/(loss) after income tax 440.6 643.4 1,274.0 (110.5)
Add/(deduct) non-cash items:
Depreciation and depletion 759.3 692.2 419.3 418.4
Net impairment (reversal)/loss of investment in controlled entities – – (380.7) 325.7
Impairment loss on receivables due from controlled entities – – 25.3 6.3
Exploration and evaluation expensed 234.8 347.8 54.2 19.9
Net impairment loss of oil and gas assets – 16.3 56.6 2.9
Foreign exchange debt hedging losses/(gains) 1.5 (0.2) – –
Share-based payments expense 5.2 2.6 5.2 2.6
Borrowing costs capitalised (6.3) (14.5) – –
Unwind of the effect of discounting on provisions 23.9 25.4 8.5 8.3
Change in fair value of financial assets designated at fair value through
profit and loss 11.9 (18.8) 1.3 (1.3)
Defined benefit plan expense 5.6 4.3 5.6 4.3
Foreign currency fluctuations 0.5 (0.8) 0.7 0.5
Net loss/(gain) on sale of non-current assets 2.8 (42.1) (1.7) (6.1)
Net gain on sale of available-for-sale financial assets (33.4) – (13.9) –
Net loss on sale of discontinued operations 67.7 – – –
Net cash provided by operating activities before changes in assets or liabilities 1,514.1 1,655.6 1,454.4 671.0
Add/(deduct) change in operating assets or liabilities net of acquisitions or
disposals of businesses:
(Increase)/decrease in trade and other receivables (90.2) 23.2 (0.9) 75.0
Increase in inventories (49.8) (40.4) (38.8) (7.7)
Decrease/(increase) in other assets 2.1 (12.9) (1.9) 15.4
Net decrease in deferred tax assets and deferred tax liabilities (46.8) (42.5) (14.5) (97.7)
(Decrease)/increase in current tax liabilities (181.2) 30.2 (178.5) (87.6)
Increase/(decrease) in trade and other payables 59.6 (95.6) 19.4 13.2
Increase in provisions 6.1 32.7 2.7 19.3
Net cash provided by operating activities 1,213.9 1,550.3 1,241.9 600.9

114
Santos Annual Report 2007
Consolidated Santos Ltd
2007 2006 2007 2006
29. EMPLOYEE BENEFITS $million $million $million $million
(A) LIABILITY FOR DEFINED BENEFIT OBLIGATIONS
Defined benefit members of the Santos Superannuation Plan receive a lump
sum benefit on retirement, death, disablement and withdrawal. The defined
benefit section of the Plan is closed to new members. All new members
receive accumulation only benefits.
Defined benefit plan
Amount recognised in the balance sheet:
Deficit in plan recognised in non-current provisions (refer note 21) 16.3 26.3 16.3 26.3
Other non-current assets (refer note 17) (4.9) (7.9) (4.9) (7.9)
11.4 18.4 11.4 18.4
Movements in the liability for net defined benefit obligations recognised
in the balance sheet
Liability at the beginning of the year 18.4 11.3 18.4 11.3
Expense recognised in income statement 5.6 4.3 5.6 4.3
Amount recognised in retained earnings (6.3) 9.0 (6.3) 9.0
Employer contributions (6.3) (6.2) (6.3) (6.2)
Liability at the end of the year 11.4 18.4 11.4 18.4
Historical information for the current and previous periods
Consolidated
2007 2006 2005 2004
$million $million $million $million
Present value of defined benefit obligations 161.8 158.2 129.5 126.5
Fair value of Plan assets (145.5) (131.9) (113.4) (108.7)
Deficit in Plan 16.3 26.3 16.1 17.8
Experience adjustments on Plan assets (4.0) (6.3) (8.0) (5.5)
Experience adjustments on Plan liabilities (1.2) 17.5 (0.1) (4.5)
Santos Ltd
2007 2006 2005 2004
$million $million $million $million
Present value of defined benefit obligations 161.8 158.2 129.5 126.5
Fair value of Plan assets (145.5) (131.9) (113.4) (108.7)
Deficit in Plan 16.3 26.3 16.1 17.8
Experience adjustments on Plan assets (4.0) (6.3) (8.0) (5.5)
Experience adjustments on Plan liabilities (1.2) 17.5 (0.1) (4.5)
Notes to the Consolidated Financial Statementsfor the year ended 31 December 2007
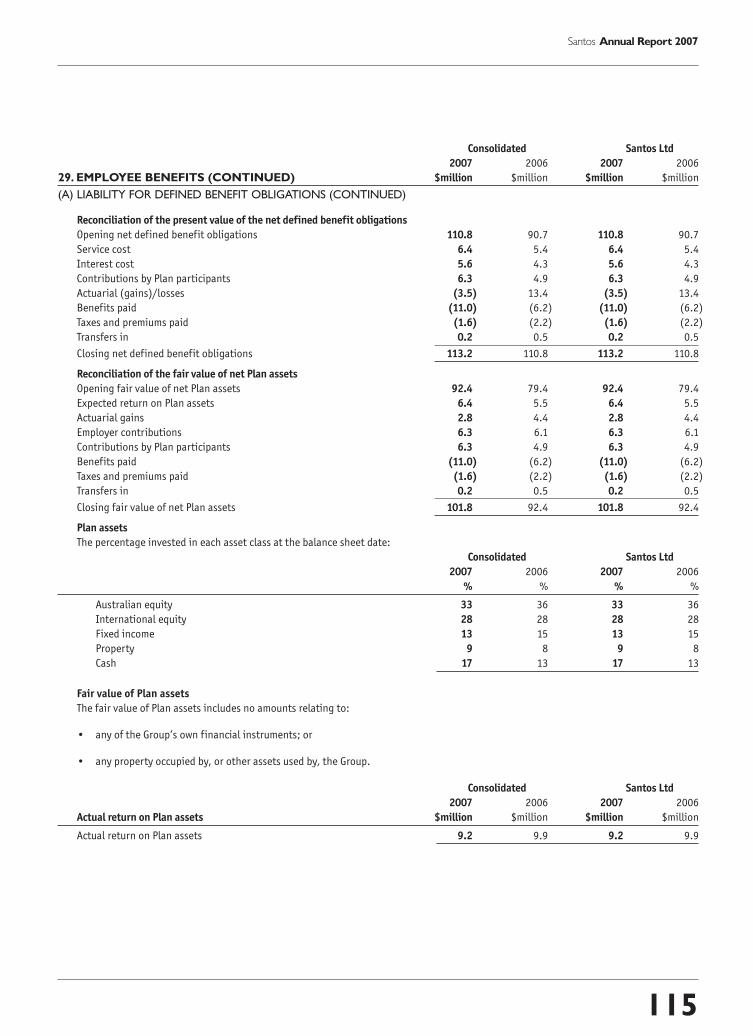
115
Santos Annual Report 2007
Consolidated Santos Ltd
2007 2006 2007 2006
29. EMPLOYEE BENEFITS (CONTINUED) $million $million $million $million
(A) LIABILITY FOR DEFINED BENEFIT OBLIGATIONS (CONTINUED)
Reconciliation of the present value of the net defined benefit obligations
Opening net defined benefit obligations 110.8 90.7 110.8 90.7
Service cost 6.4 5.4 6.4 5.4
Interest cost 5.6 4.3 5.6 4.3
Contributions by Plan participants 6.3 4.9 6.3 4.9
Actuarial (gains)/losses (3.5) 13.4 (3.5) 13.4
Benefits paid (11.0) (6.2) (11.0) (6.2)
Taxes and premiums paid (1.6) (2.2) (1.6) (2.2)
Transfers in 0.2 0.5 0.2 0.5
Closing net defined benefit obligations 113.2 110.8 113.2 110.8
Reconciliation of the fair value of net Plan assets
Opening fair value of net Plan assets 92.4 79.4 92.4 79.4
Expected return on Plan assets 6.4 5.5 6.4 5.5
Actuarial gains 2.8 4.4 2.8 4.4
Employer contributions 6.3 6.1 6.3 6.1
Contributions by Plan participants 6.3 4.9 6.3 4.9
Benefits paid (11.0) (6.2) (11.0) (6.2)
Taxes and premiums paid (1.6) (2.2) (1.6) (2.2)
Transfers in 0.2 0.5 0.2 0.5
Closing fair value of net Plan assets 101.8 92.4 101.8 92.4
Plan assets
The percentage invested in each asset class at the balance sheet date:
Consolidated Santos Ltd
2007 2006 2007 2006
% % % %
Australian equity 33 36 33 36
International equity 28 28 28 28
Fixed income 13 15 13 15
Property 9 8 9 8
Cash 17 13 17 13
Fair value of Plan assets
The fair value of Plan assets includes no amounts relating to:
• any of the Group’s own financial instruments; or
• any property occupied by, or other assets used by, the Group.
Consolidated Santos Ltd
2007 2006 2007 2006
Actual return on Plan assets $million $million $million $million
Actual return on Plan assets 9.2 9.9 9.2 9.9
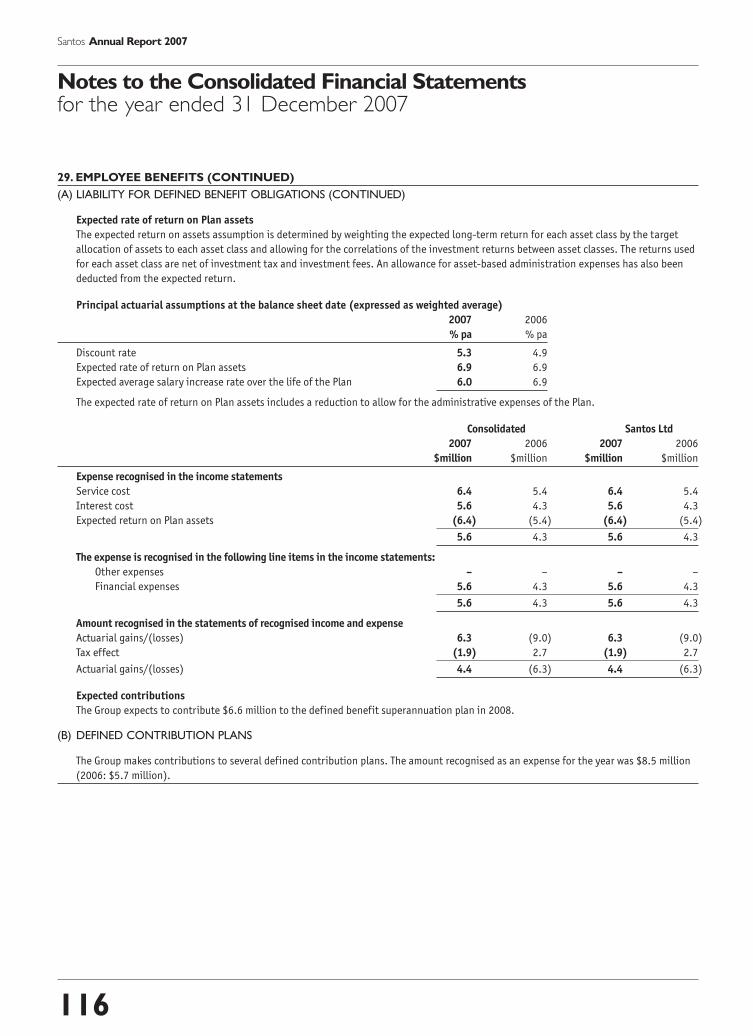
116
Santos Annual Report 2007
29. EMPLOYEE BENEFITS (CONTINUED)
(A) LIABILITY FOR DEFINED BENEFIT OBLIGATIONS (CONTINUED)
Expected rate of return on Plan assets
The expected return on assets assumption is determined by weighting the expected long-term return for each asset class by the target
allocation of assets to each asset class and allowing for the correlations of the investment returns between asset classes. The returns used
for each asset class are net of investment tax and investment fees. An allowance for asset-based administration expenses has also been
deducted from the expected return.
Principal actuarial assumptions at the balance sheet date (expressed as weighted average)
2007 2006
% pa % pa
Discount rate 5.3 4.9
Expected rate of return on Plan assets 6.9 6.9
Expected average salary increase rate over the life of the Plan 6.0 6.9
The expected rate of return on Plan assets includes a reduction to allow for the administrative expenses of the Plan.
Consolidated Santos Ltd
2007 2006 2007 2006
$million $million $million $million
Expense recognised in the income statements
Service cost 6.4 5.4 6.4 5.4
Interest cost 5.6 4.3 5.6 4.3
Expected return on Plan assets (6.4) (5.4) (6.4) (5.4)
5.6 4.3 5.6 4.3
The expense is recognised in the following line items in the income statements:
Other expenses – – – –
Financial expenses 5.6 4.3 5.6 4.3
5.6 4.3 5.6 4.3
Amount recognised in the statements of recognised income and expense
Actuarial gains/(losses) 6.3 (9.0) 6.3 (9.0)
Tax effect (1.9) 2.7 (1.9) 2.7
Actuarial gains/(losses) 4.4 (6.3) 4.4 (6.3)
Expected contributions
The Group expects to contribute $6.6 million to the defined benefit superannuation plan in 2008.
(B) DEFINED CONTRIBUTION PLANS
The Group makes contributions to several defined contribution plans. The amount recognised as an expense for the year was $8.5 million
(2006: $5.7 million).
Notes to the Consolidated Financial Statementsfor the year ended 31 December 2007
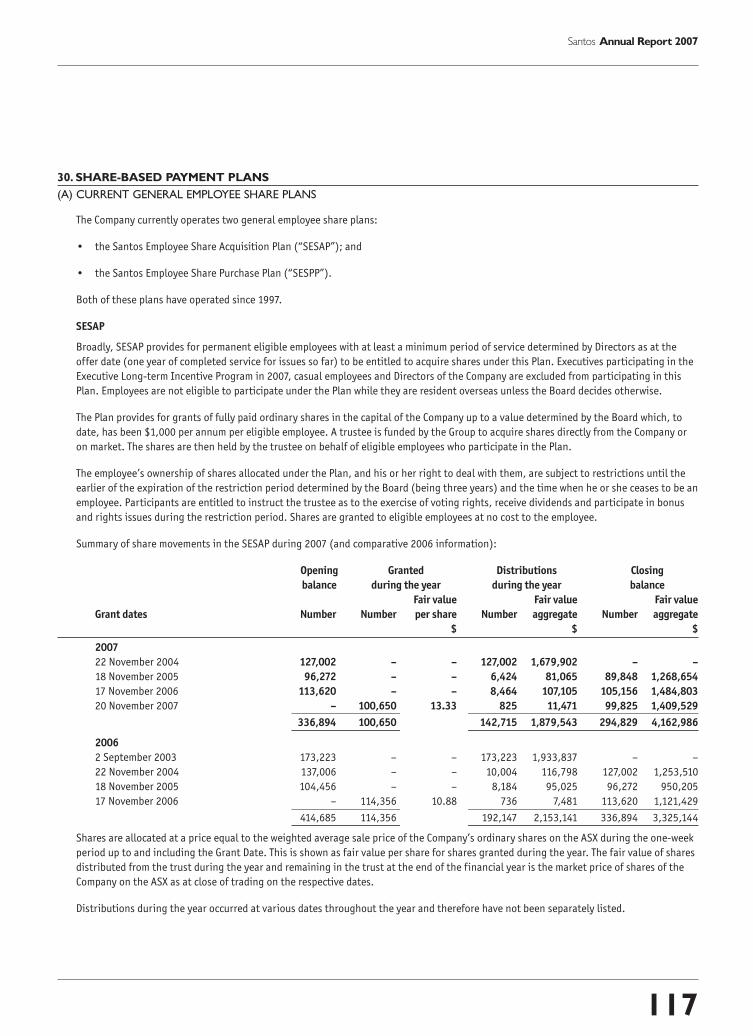
117
Santos Annual Report 2007
30. SHARE-BASED PAYMENT PLANS
(A) CURRENT GENERAL EMPLOYEE SHARE PLANS
The Company currently operates two general employee share plans:
• the Santos Employee Share Acquisition Plan (“SESAP”); and
• the Santos Employee Share Purchase Plan (“SESPP”).
Both of these plans have operated since 1997.
SESAP
Broadly, SESAP provides for permanent eligible employees with at least a minimum period of service determined by Directors as at the
offer date (one year of completed service for issues so far) to be entitled to acquire shares under this Plan. Executives participating in the
Executive Long-term Incentive Program in 2007, casual employees and Directors of the Company are excluded from participating in this
Plan. Employees are not eligible to participate under the Plan while they are resident overseas unless the Board decides otherwise.
The Plan provides for grants of fully paid ordinary shares in the capital of the Company up to a value determined by the Board which, to
date, has been $1,000 per annum per eligible employee. A trustee is funded by the Group to acquire shares directly from the Company or
on market. The shares are then held by the trustee on behalf of eligible employees who participate in the Plan.
The employee’s ownership of shares allocated under the Plan, and his or her right to deal with them, are subject to restrictions until the
earlier of the expiration of the restriction period determined by the Board (being three years) and the time when he or she ceases to be an
employee. Participants are entitled to instruct the trustee as to the exercise of voting rights, receive dividends and participate in bonus
and rights issues during the restriction period. Shares are granted to eligible employees at no cost to the employee.
Summary of share movements in the SESAP during 2007 (and comparative 2006 information):
Opening Granted Distributions Closing
balance during the year during the year balance
Fair value Fair value Fair value
Grant dates Number Number per share Number aggregate Number aggregate
$ $ $
2007
22 November 2004 127,002 – – 127,002 1,679,902 – –
18 November 2005 96,272 – – 6,424 81,065 89,848 1,268,654
17 November 2006 113,620 – – 8,464 107,105 105,156 1,484,803
20 November 2007 – 100,650 13.33 825 11,471 99,825 1,409,529
336,894 100,650 142,715 1,879,543 294,829 4,162,986
2006
2 September 2003 173,223 – – 173,223 1,933,837 – –
22 November 2004 137,006 – – 10,004 116,798 127,002 1,253,510
18 November 2005 104,456 – – 8,184 95,025 96,272 950,205
17 November 2006 – 114,356 10.88 736 7,481 113,620 1,121,429
414,685 114,356 192,147 2,153,141 336,894 3,325,144
Shares are allocated at a price equal to the weighted average sale price of the Company’s ordinary shares on the ASX during the one-week
period up to and including the Grant Date. This is shown as fair value per share for shares granted during the year. The fair value of shares
distributed from the trust during the year and remaining in the trust at the end of the financial year is the market price of shares of the
Company on the ASX as at close of trading on the respective dates.
Distributions during the year occurred at various dates throughout the year and therefore have not been separately listed.

118
Santos Annual Report 2007
30. SHARE-BASED PAYMENT PLANS (CONTINUED)
(A) CURRENT GENERAL EMPLOYEE SHARE PLANS (CONTINUED)
The amounts recognised in the financial statements of the Group and the Company in relation to SESAP during the year were:
Consolidated Santos Ltd
2007 2006 2007 2006
$million $million $million $million
Employee expenses 1.3 1.2 1.3 1.2
Issued ordinary share capital 1.3 1.2 1.3 1.2
At 31 December 2007, the total number of shares acquired under the Plan since its commencement was 2,196,037.
SESPP
The general employee offer under SESPP is open to all employees (other than a casual employee or Director of the Company) determined
by the Board who are continuing employees at the date of the offer. However, employees who are not resident in Australia at the time of
an offer under the Plan and those who have participated in the Executive Long-term Incentive Program during the year will not be eligible
to participate in that offer unless the Board otherwise decides.
Under the Plan, eligible employees may be offered the opportunity to subscribe for or acquire fully paid ordinary shares in the capital of
the Company at a discount to market price, subject to restrictions, including on disposal, determined by the Board (which has been a
period of one year for issues so far). The subscription or acquisition price is Market Value (being the weighted average sale price of the
Company’s ordinary shares on the ASX during the one-week period up to and including the offer date) less any discount determined by
the Board (5% for issues so far). Under the Plan, at the discretion of the Board, financial assistance may be provided to employees to
subscribe for and acquire shares under the Plan. The 5% discount constitutes financial assistance for these purposes. Participants are
entitled to vote, receive dividends and participate in bonus and rights issues while the shares are restricted.
On 20 November 2007, the Company issued 400 ordinary shares to four eligible employees at a subscription price of $14.93 per share under
the Plan, being a 5% discount on the Market Value of $15.72. The total market price of those shares on the issue date was $5,280, being the
market price at the close of trade on the date of issue ($13.20). The total amount received from employees for those shares was $5,972.
A summary of share movements in the SESPP are set out below:
Opening Granted during Restrictions ceased during Closing
balance the year the year balance
Fair value
Grant dates Number Number per share Number Date Number
$
2007
17 November 2006 62,900 – – 62,900 17 November 2007 –
20 November 2007 – 400 15.72 – – 400
62,900 400 62,900 400
2006
18 November 2005 49,800 – – 49,800 18 November 2006 –
17 November 2006 – 62,900 10.48 – – 62,900
49,800 62,900 49,800 62,900
The fair value per share for shares granted during the year is Market Value (as defined above). The consideration received by the Company
per share is Market Value less the discount of 5% referred to above.
Notes to the Consolidated Financial Statementsfor the year ended 31 December 2007

119
Santos Annual Report 2007
30. SHARE-BASED PAYMENT PLANS (CONTINUED)
(A) CURRENT GENERAL EMPLOYEE SHARE PLANS (CONTINUED)
The amounts recognised in the financial statements of the Group and the Company in relation to the general employee offer under the
SESPP during the year were:
Consolidated Santos Ltd
2007 2006 2007 2006
$million $million $million $million
Issued ordinary share capital – 0.6 – 0.6
At 31 December 2007, the total number of shares acquired under the general employee offer of the Plan since its commencement
was 822,300.
(B) EXECUTIVE LONG-TERM INCENTIVE PROGRAM
The Company’s Executive Long-term Incentive Program provides for invitations to be extended to eligible executives selected by the Board.
The Program currently consists of an offer of securities under:
• the Santos Employee Share Purchase Plan (“SESPP”); and
• the Santos Executive Share Option Plan (“SESOP”).
SESOP has operated since 1997 and the SESPP has been used as a component of executive compensation since 2003.
SARs and options
Each SAR and option is a conditional entitlement to a fully paid ordinary share, subject to the satisfaction of performance conditions, on
terms and conditions determined by the Board.
SARs and options carry no voting or dividend rights until the performance conditions are satisfied and, in the case of options, when the
options are exercised or, in the case of SARs, when the SARs vest.
CEO options
The Managing Director receives his long-term incentives in the form of options granted under the SESOP. Each option entitles Mr Ellice-Flint
to acquire one fully paid ordinary share in the Company at a predetermined price, subject to satisfaction of vesting conditions. The grant
size is determined by reference to the median grant size given to executives in similar roles in comparable companies.
No options were granted to Mr Ellice-Flint in 2007.
At the 2006 AGM, shareholder approval was given for the grant of three tranches of options to Mr Ellice-Flint as follows:
Tranche Number of options Performance period
1 500,000 4 May 2006 – 26 August 2007
2 1,000,000 4 May 2006 – 26 August 2008
3 1,000,000 4 May 2006 – 26 August 2009
The exercise price for the options granted is $11.36, being the volume weighted average price in the ten days up to and including
9 March 2006 as approved by shareholders on 4 May 2006.
Vesting of each tranche of options is based on two performance conditions, each applying to one half of the tranche:
• relative Total Shareholder Return (“TSR”) against the ASX 100 at the beginning of the performance period; and
• relative TSR against a group of Australian and international exploration and production (“E&P”) companies.

120
Santos Annual Report 2007
30. SHARE-BASED PAYMENT PLANS (CONTINUED)
(B) EXECUTIVE LONG-TERM INCENTIVE PROGRAM (CONTINUED)
At the time of grant, the Board considered the ASX 100 and E&P companies to be reasonable comparators against the market generally,
and against Santos’ peers. The E&P comparator group comprises: Anadarko Petroleum Ltd, Apache Corp, Australian Worldwide Exploration
Ltd, Cairn Energy PLC, Chesapeake Energy Corp, EOG Resource Inc, Forest Oil Corp, Hardman Resources Ltd, Kerr McGee Corp, Murphy Oil
Corp, Newfield Exploration Co, Nexen Inc, Noble Energy Inc, Oil Search Ltd, Pioneer Natural Resources Co, Pogo Producing Co, Premier Oil
PLC, Talisman Energy Inc, Woodside Petroleum Ltd and XTO Energy Inc.
The options granted vest according to the following schedule:
Santos TSR percentile ranking % of grant vesting
< 50th percentile 0%
= 50th percentile 50%
51st to 74th percentile 52% to 98% (additional 2% for each percentile improvement)
≥ 75th percentile 100%
Performance conditions may be re-tested quarterly during the twelve-month period commencing on the earliest exercise date for a
tranche. If the performance conditions are not satisfied at the end of that twelve-month re-testing period, the options in that tranche will
lapse.
Consistent with the terms of his service agreement, the Managing Director’s options may vest and become exercisable upon cessation of
his employment, whether vesting occurs will depend on the circumstances – for example, where the Managing Director retires by mutual
agreement with the Board, his outstanding options may vest and become exercisable at the Board’s discretion. However, no options will
vest or become exercisable where the Company terminates the Managing Director’s employment for cause.
In addition, where an entity becomes entitled to more than 30% of the Company’s total number of voting shares, the Managing Director
will be entitled to exercise his outstanding options unless the Board, in its discretion, determines otherwise.
Tranche 1 options were tested against the performance conditions in 2007, with the following results:
ASX 100 E&P
comparator group comparator group
(applying to 250,000 options) (applying to 250,000 options)
Santos TSR ranking at 26 August 2007 22nd percentile 50th percentile
Santos TSR ranking at 26 November 2007 (first re-test) 40th percentile 50th percentile
Number of options exercisable Nil 125,000
Tranche 1 options still not vested by 26 August 2008 will lapse.
The fair value of services received in return for share options granted is measured by reference to the fair value of share options granted.
The estimate of the fair value of the services received is measured based on the Monte Carlo simulation method. The contractual life of the
option is used as an input into this model. Expectations of early exercise are incorporated into the models.
Notes to the Consolidated Financial Statementsfor the year ended 31 December 2007

121
Santos Annual Report 2007
30. SHARE-BASED PAYMENT PLANS (CONTINUED)
(B) EXECUTIVE LONG-TERM INCENTIVE PROGRAM (CONTINUED)
2007 CEO options 2006 CEO options
Option grant Tranche 1 Tranche 2 Tranche 3
Fair value at grant date ($) – 1.77 1.94 2.05
Share price on grant date ($) – 11.48 11.48 11.48
Exercise price ($) – 11.36 11.36 11.36
Expected volatility (weighted average, % pa) – 23.0 23.0 23.0
Option life (weighted average) – 10 years 10 years 10 years
Expected dividends (% pa) – 3.3 3.3 3.3
Risk free interest rates (based on government bond yields):
Australia (% pa) – 5.4 5.4 5.4
United States (% pa) – 3.6 3.6 3.6
United Kingdom (% pa) – 4.5 4.5 4.5
The expected volatility is based on the historic volatility (calculated based on the weighted average remaining life of the share options),
adjusted for any expected changes to future volatility due to publicly available information.
Eligible senior executives
The Company made two LTI grants to its senior executives in 2007. These were:
• a “Performance Grant” subject to satisfaction of performance conditions linked to delivery of sustained returns to shareholders; and
• a “Growth Award” that has a specific retention focus and is subject to a service condition.
Both the Performance Grant and the Growth Award were granted, at the executive’s election, in the form of either SARs (under the SESPP)
or options (under the SESOP).
SARs and options were granted at no cost to the executives with the number of SARs awarded being determined by dividing the amount of
the award by the volume weighted average price of the Company’s shares over the week up to and including the award date. The number of
options awarded is of equivalent value calculated by an independent expert based on an acceptable valuation method.

122
Santos Annual Report 2007
30. SHARE-BASED PAYMENT PLANS (CONTINUED)
(B) EXECUTIVE LONG-TERM INCENTIVE PROGRAM (CONTINUED)
Vesting details of the Performance Grant and the Growth Award are summarised in the table below.
Performance Grant Growth Award
Vesting period 1 January 2007 to 31 December 2009. 1 July 2007 to 30 June 2010, except
for Mr D J Knox (see below).
Vesting condition Vesting of this grant is based on two performance conditions, each For all senior executives except
applying to 50% of the grant: Mr D J Knox, vesting of the Growth
• relative TSR against Australian and international E&P companies; and Award is based on continuous service
• an annualised compound absolute TSR target of 11% over the to 30 June 2010, or three years from
performance period. the grant date.
The E&P companies are: Anadarko Petroleum Ltd, Apache Corp, Australian
Worldwide Exploration Ltd, Cairn Energy PLC, Chesapeake Energy Corp, For Mr D J Knox, vesting of the
EOG Resource Inc, Forest Oil Corp, Murphy Oil Corp, Newfield Exploration Co, Growth Award is based on continuous
Nexen Inc, Noble Energy Inc, Oil Search Ltd, Pioneer Natural Resources Co, service to 2 September 2010, which
Pogo Producing Co, Premier Oil PLC, Talisman Energy Inc, Woodside is three years from his date of
Petroleum Ltd and XTO Energy Inc. commencement with the Company.
Vesting schedule Relative TSR condition 0% if the continuous service
Santos TSR Percentile Ranking % of grant vesting condition is not met.
< 50th percentile 0%
= 50th percentile 50% 100% if the continuous service
51st to 74th percentile 52% to 98% (additional 2% condition is met.
for each percentile improvement)
≥ 75th percentile 100%
Absolute TSR condition
0% if annualised compound TSR is less than 11%.
100% if annualised compound TSR is 11% or greater.
Exercise price $14.14 for options, being the volume weighted average price in the week As for Performance Grant.
up to and including the grant date of 1 July 2007.
SARs have no exercise price.
Re-testing of There is no re-testing of the performance conditions if they are not Not applicable.
performance satisfied.
conditions
Upon cessation of employment, SARs which have not already vested and options which are not exercisable will, in general, lapse and be
forfeited. However, if cessation occurs due to death, disability or redundancy, or in special circumstances approved by the Board, then a
proportion of the SARs and options may vest and become exercisable.
Where there is a change in control, the Board may determine whether, and the extent to which, SARs and options may vest.
Notes to the Consolidated Financial Statementsfor the year ended 31 December 2007
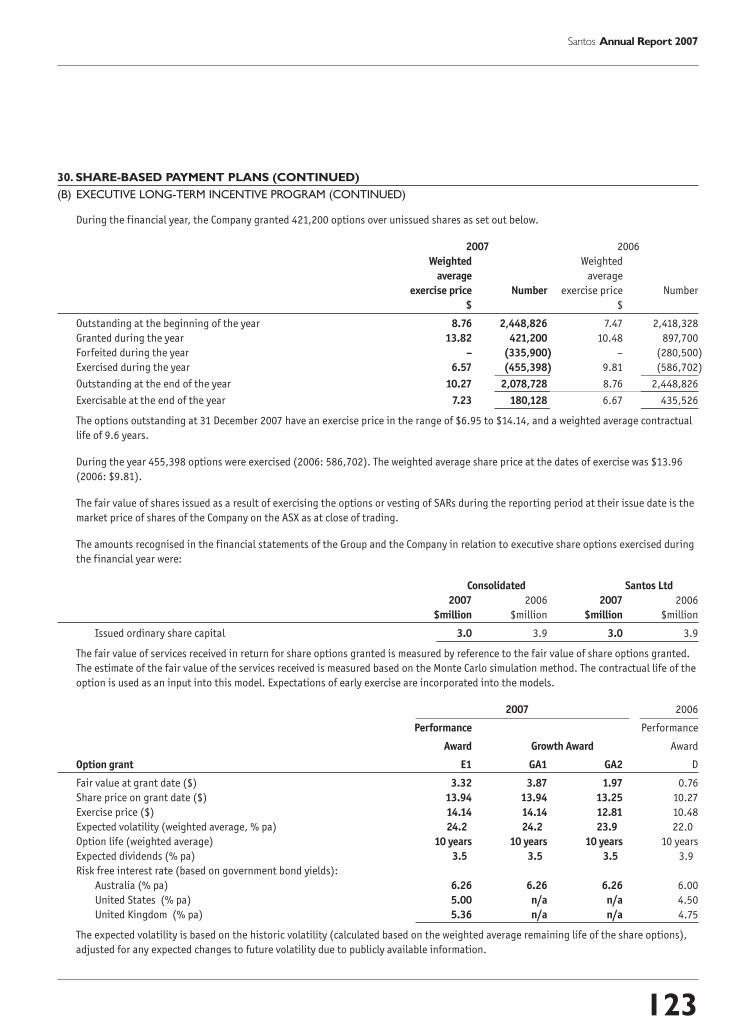
123
Santos Annual Report 2007
30. SHARE-BASED PAYMENT PLANS (CONTINUED)
(B) EXECUTIVE LONG-TERM INCENTIVE PROGRAM (CONTINUED)
During the financial year, the Company granted 421,200 options over unissued shares as set out below.
2007 2006
Weighted Weighted
average average
exercise price Number exercise price Number
$ $
Outstanding at the beginning of the year 8.76 2,448,826 7.47 2,418,328
Granted during the year 13.82 421,200 10.48 897,700
Forfeited during the year – (335,900) – (280,500)
Exercised during the year 6.57 (455,398) 9.81 (586,702)
Outstanding at the end of the year 10.27 2,078,728 8.76 2,448,826
Exercisable at the end of the year 7.23 180,128 6.67 435,526
The options outstanding at 31 December 2007 have an exercise price in the range of $6.95 to $14.14, and a weighted average contractual
life of 9.6 years.
During the year 455,398 options were exercised (2006: 586,702). The weighted average share price at the dates of exercise was $13.96
(2006: $9.81).
The fair value of shares issued as a result of exercising the options or vesting of SARs during the reporting period at their issue date is the
market price of shares of the Company on the ASX as at close of trading.
The amounts recognised in the financial statements of the Group and the Company in relation to executive share options exercised during
the financial year were:
Consolidated Santos Ltd
2007 2006 2007 2006
$million $million $million $million
Issued ordinary share capital 3.0 3.9 3.0 3.9
The fair value of services received in return for share options granted is measured by reference to the fair value of share options granted.
The estimate of the fair value of the services received is measured based on the Monte Carlo simulation method. The contractual life of the
option is used as an input into this model. Expectations of early exercise are incorporated into the models.
2007 2006
Performance Performance
Award Growth Award Award
Option grant E1 GA1 GA2 D
Fair value at grant date ($) 3.32 3.87 1.97 0.76
Share price on grant date ($) 13.94 13.94 13.25 10.27
Exercise price ($) 14.14 14.14 12.81 10.48
Expected volatility (weighted average, % pa) 24.2 24.2 23.9 22.0
Option life (weighted average) 10 years 10 years 10 years 10 years
Expected dividends (% pa) 3.5 3.5 3.5 3.9
Risk free interest rate (based on government bond yields):
Australia (% pa) 6.26 6.26 6.26 6.00
United States (% pa) 5.00 n/a n/a 4.50
United Kingdom (% pa) 5.36 n/a n/a 4.75
The expected volatility is based on the historic volatility (calculated based on the weighted average remaining life of the share options),
adjusted for any expected changes to future volatility due to publicly available information.
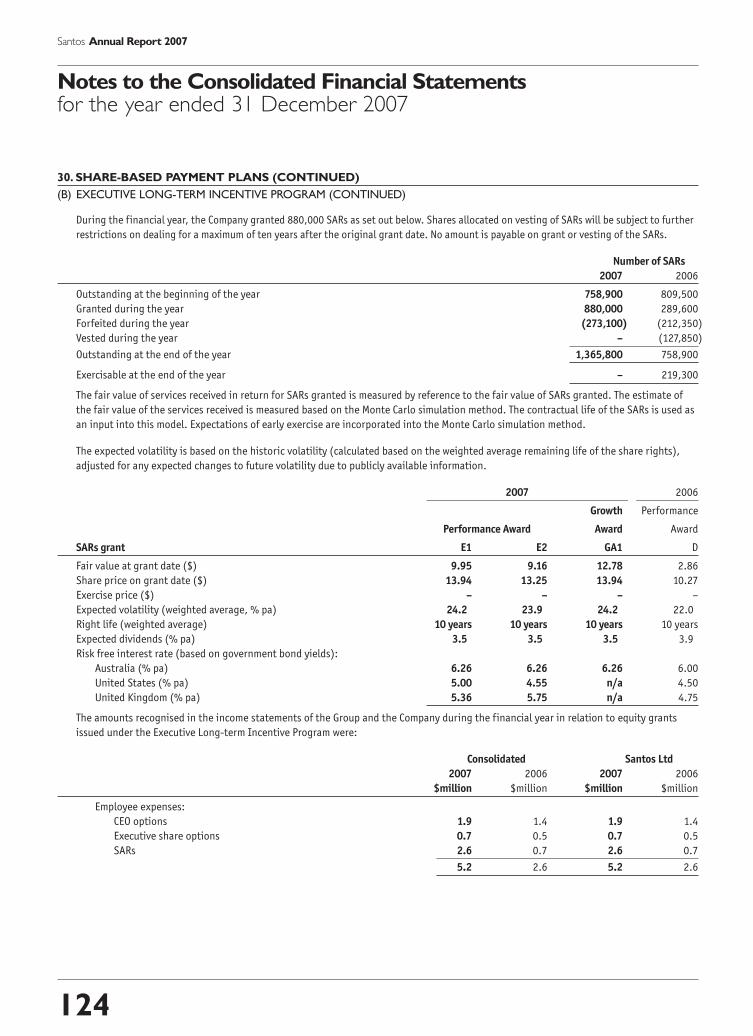
124
Santos Annual Report 2007
30. SHARE-BASED PAYMENT PLANS (CONTINUED)
(B) EXECUTIVE LONG-TERM INCENTIVE PROGRAM (CONTINUED)
During the financial year, the Company granted 880,000 SARs as set out below. Shares allocated on vesting of SARs will be subject to further
restrictions on dealing for a maximum of ten years after the original grant date. No amount is payable on grant or vesting of the SARs.
Number of SARs
2007 2006
Outstanding at the beginning of the year 758,900 809,500
Granted during the year 880,000 289,600
Forfeited during the year (273,100) (212,350)
Vested during the year – (127,850)
Outstanding at the end of the year 1,365,800 758,900
Exercisable at the end of the year – 219,300
The fair value of services received in return for SARs granted is measured by reference to the fair value of SARs granted. The estimate of
the fair value of the services received is measured based on the Monte Carlo simulation method. The contractual life of the SARs is used as
an input into this model. Expectations of early exercise are incorporated into the Monte Carlo simulation method.
The expected volatility is based on the historic volatility (calculated based on the weighted average remaining life of the share rights),
adjusted for any expected changes to future volatility due to publicly available information.
2007 2006
Growth Performance
Performance Award Award Award
SARs grant E1 E2 GA1 D
Fair value at grant date ($) 9.95 9.16 12.78 2.86
Share price on grant date ($) 13.94 13.25 13.94 10.27
Exercise price ($) – – – –
Expected volatility (weighted average, % pa) 24.2 23.9 24.2 22.0
Right life (weighted average) 10 years 10 years 10 years 10 years
Expected dividends (% pa) 3.5 3.5 3.5 3.9
Risk free interest rate (based on government bond yields):
Australia (% pa) 6.26 6.26 6.26 6.00
United States (% pa) 5.00 4.55 n/a 4.50
United Kingdom (% pa) 5.36 5.75 n/a 4.75
The amounts recognised in the income statements of the Group and the Company during the financial year in relation to equity grants
issued under the Executive Long-term Incentive Program were:
Consolidated Santos Ltd
2007 2006 2007 2006
$million $million $million $million
Employee expenses:
CEO options 1.9 1.4 1.9 1.4
Executive share options 0.7 0.5 0.7 0.5
SARs 2.6 0.7 2.6 0.7
5.2 2.6 5.2 2.6
Notes to the Consolidated Financial Statementsfor the year ended 31 December 2007

125
Santos Annual Report 2007
30. SHARE-BASED PAYMENT PLANS (CONTINUED)
(B) EXECUTIVE LONG-TERM INCENTIVE PROGRAM (CONTINUED)
Shares
The shares allocated pursuant to the SESPP were allotted to a trustee at no cost to participants, to be held on their behalf. The allocation
price is Market Value (as defined below) and the trustee was funded by the Company to subscribe for the shares.
In general the shares were restricted for a period of one year from the date of allotment. If a participating executive ceased employment
during this period, the Board in its discretion could determine that a lesser restriction on transfer and dealing applied, having regard to
the circumstances of the cessation. The shares can remain on trust for up to ten years from the date of allotment, during which time the
shares are subject to forfeiture if participants act fraudulently or dishonestly or in breach of their obligations to any Group company.
Participants are entitled to instruct the trustee as to the exercise of voting rights, receive dividends and participate in bonus and rights
issues while the shares are held on trust.
No shares have been issued under the executive long-term incentive component of the Plan since 2004. At 31 December 2007, the total
number of shares acquired under the executive long-term incentive component of the Plan since its commencement was 220,912.
(C) LEGACY PLAN – SANTOS EXECUTIVE SHARE PLAN
The Santos Executive Share Plan operated between 1987 and 1997, when it was discontinued. Under the terms of the Plan, shares were
issued as partly paid to one cent. While partly paid, the Plan shares are not transferable, carry no voting right and no entitlement to
dividend but are entitled to participate in any bonus or rights issue. After a “vesting” period, calls could be made for the balance of the
issue price of the shares, which varied between $2.00 and the market price of the shares on the date of the call being made. Shares were
issued principally on: 22 December 1987; 7 February and 5 December 1989; and 24 December 1990.
At the beginning of the financial year there were 88,000 Plan shares on issue. During the financial year no Plan shares were fully paid and
no aggregate proceeds were received by the Company. As at 31 December 2007 there were 88,000 Plan shares outstanding.
(D) NON-EXECUTIVE DIRECTOR (“NED”) SHARE PLAN
In accordance with shareholder approval given at the 2007 Annual General Meeting, the Non-executive Director (“NED”) Share Plan was
introduced in July 2007. Participation in the NED Share Plan is voluntary and all present and future Non-executive Directors are eligible
to participate. Under the NED Share Plan, Directors elect to sacrifice all or part of their pre-tax fees in return for an allocation of fully paid
ordinary shares of equivalent value. The NED Share Plan therefore does not involve any additional remuneration for participating Directors.
Shares are allocated quarterly and are either issued as new shares or purchased on the ASX at the prevailing market price. The shares
are registered in the name of the participating Director, but are subject to a restriction on dealing. In the absence of exceptional
circumstances, the restriction will apply until the Director ceases to hold office or until ten years have elapsed since the allocation of the
shares, whichever is earlier.
In 2007, 9,419 shares were allocated to participating Directors on 10 October 2007 at $15.4326 per share and 7,896 shares were allocated
to participating Directors on 28 December 2007 at $13.5843 per share.
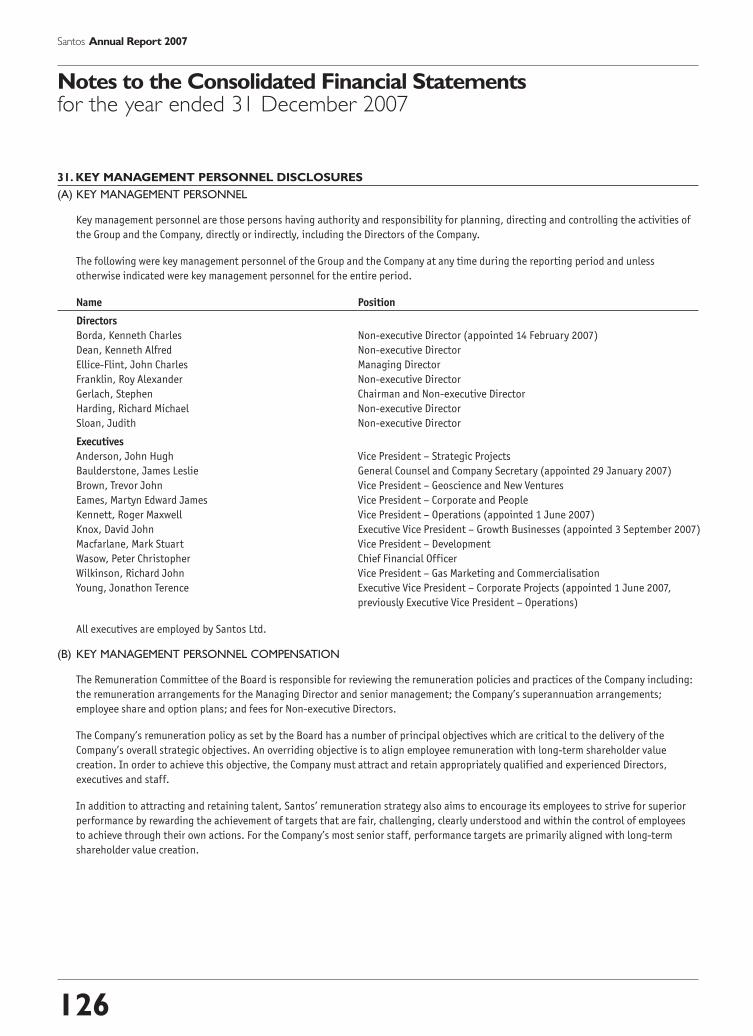
126
Santos Annual Report 2007
31. KEY MANAGEMENT PERSONNEL DISCLOSURES
(A) KEY MANAGEMENT PERSONNEL
Key management personnel are those persons having authority and responsibility for planning, directing and controlling the activities of
the Group and the Company, directly or indirectly, including the Directors of the Company.
The following were key management personnel of the Group and the Company at any time during the reporting period and unless
otherwise indicated were key management personnel for the entire period.
Name Position
Directors
Borda, Kenneth Charles Non-executive Director (appointed 14 February 2007)
Dean, Kenneth Alfred Non-executive Director
Ellice-Flint, John Charles Managing Director
Franklin, Roy Alexander Non-executive Director
Gerlach, Stephen Chairman and Non-executive Director
Harding, Richard Michael Non-executive Director
Sloan, Judith Non-executive Director
Executives
Anderson, John Hugh Vice President – Strategic Projects
Baulderstone, James Leslie General Counsel and Company Secretary (appointed 29 January 2007)
Brown, Trevor John Vice President – Geoscience and New Ventures
Eames, Martyn Edward James Vice President – Corporate and People
Kennett, Roger Maxwell Vice President – Operations (appointed 1 June 2007)
Knox, David John Executive Vice President – Growth Businesses (appointed 3 September 2007)
Macfarlane, Mark Stuart Vice President – Development
Wasow, Peter Christopher Chief Financial Officer
Wilkinson, Richard John Vice President – Gas Marketing and Commercialisation
Young, Jonathon Terence Executive Vice President – Corporate Projects (appointed 1 June 2007,
previously Executive Vice President – Operations)
All executives are employed by Santos Ltd.
(B) KEY MANAGEMENT PERSONNEL COMPENSATION
The Remuneration Committee of the Board is responsible for reviewing the remuneration policies and practices of the Company including:
the remuneration arrangements for the Managing Director and senior management; the Company’s superannuation arrangements;
employee share and option plans; and fees for Non-executive Directors.
The Company’s remuneration policy as set by the Board has a number of principal objectives which are critical to the delivery of the
Company’s overall strategic objectives. An overriding objective is to align employee remuneration with long-term shareholder value
creation. In order to achieve this objective, the Company must attract and retain appropriately qualified and experienced Directors,
executives and staff.
In addition to attracting and retaining talent, Santos’ remuneration strategy also aims to encourage its employees to strive for superior
performance by rewarding the achievement of targets that are fair, challenging, clearly understood and within the control of employees
to achieve through their own actions. For the Company’s most senior staff, performance targets are primarily aligned with long-term
shareholder value creation.
Notes to the Consolidated Financial Statementsfor the year ended 31 December 2007

127
Santos Annual Report 2007
31. KEY MANAGEMENT PERSONNEL DISCLOSURES (CONTINUED)
(B) KEY MANAGEMENT PERSONNEL COMPENSATION (CONTINUED)
Non-executive Directors
Total Non-executive Directors’ fees paid in a year, including Board committee fees, cannot exceed $1,500,000. This amount was approved
by shareholders at the Annual General Meeting held on 7 May 2004. Directors may also be paid additional fees for special duties or
exertions, and are entitled to be reimbursed for all business-related expenses. These payments are not included in the maximum
aggregate amount approved by shareholders. No additional fees were paid during the year.
Superannuation contributions are made on behalf of Non-executive Directors in accordance with the requirements of the Company’s
statutory superannuation obligations.
Non-executive Directors appointed prior to 1 January 2004 (“Participating Directors”) are contractually entitled to receive benefits upon
their retirement pursuant to agreements entered into upon their appointment, the terms of which were approved by shareholders at the
1989 AGM. Non-executive Directors appointed after 1 January 2004 are not entitled to receive a benefit upon retirement other than
statutory entitlements.
The retirement benefits of Participating Directors were frozen with effect from 30 June 2004, at which time their entitlements ceased
to accrue. However, to prevent erosion in the real value of the frozen benefits, the Board determined that the benefits will be indexed
annually against the five-year Australian Government Bond Rate with effect from 1 July 2007.
In accordance with shareholder approval given at the 2007 Annual General Meeting, the NED Share Plan was introduced in July 2007.
Participation in the NED Share Plan, through which Non-executive Directors may elect to sacrifice all or part of their pre-tax fees in return
for an allocation of shares of equivalent value, is voluntary. Further details are provided in note 30(D).
Managing Director
Elements of remuneration
Total remuneration for the Managing Director is made up of the following components:
• Base remuneration – comprising salary and superannuation;
• Short-term incentive (“STI”) – an annual bonus linked to Company performance and achievement of strategic objectives; and
• Long-term incentive (“LTI”) – equity grants linked to vesting conditions dependent on Santos’ achievement of superior performance
relative to its peers.
Base remuneration
Mr Ellice-Flint is paid a salary from which he may, if he wishes, sacrifice a proportion for benefits such as a novated car lease. The Board
receives external advice on Mr Ellice-Flint’s base remuneration, which is market-aligned by comparison to that of managing directors of
comparable Australian companies.
The Company funds Mr Ellice-Flint’s defined benefit superannuation plan. On his birthday in 2007 he became entitled to a superannuation
payment of 3.22 times final average salary. This multiple increases at a rate of approximately 0.5 times final average salary on each
subsequent birthday until the multiple is capped at 6.0 times final average salary at 62 years of age.
Short-term incentive (“STI”)
Mr Ellice-Flint’s STI is based on a number of agreed annual objectives linked to Company performance objectives and delivery of strategic
growth initiatives. Consistent with his role as Managing Director, the performance measures for Mr Ellice-Flint’s STI comprise a combination
of operational, financial, budgetary and ongoing strategic targets that are directly related to the strategic objectives set by the Board for
the relevant financial year.

128
Santos Annual Report 2007
31. KEY MANAGEMENT PERSONNEL DISCLOSURES (CONTINUED)
(B) KEY MANAGEMENT PERSONNEL COMPENSATION (CONTINUED)
The Remuneration Committee assesses performance against Mr Ellice-Flint’s objectives annually and makes a recommendation to the
Board. These objectives are directly linked to the priorities and performance of the Company across a range of measures including an over
riding focus on the creation of shareholder wealth. The maximum STI payable is 150% of base salary.
Half of Mr Ellice-Flint’s STI is paid to him in the Company’s shares. These shares are subject to restrictions on sale, transfer and hedging
for two years from their date of acquisition (restrictions may be lifted earlier upon termination of the Managing Director’s employment
depending on the circumstances). The other half of the STI is paid in cash.
For 2007 performance, Mr Ellice-Flint was awarded an STI payment of $1,950,000 or 115% of base salary.
Long-term incentive (“LTI”)
The Managing Director receives his LTI in the form of options. Details of the LTI component of his remuneration are provided in note 30(B).
Service agreement
The Company has entered into a service agreement with the Managing Director. The service agreement is ongoing until termination by the
Company or the Managing Director.
The service agreement provided that the Company may terminate the Managing Director’s employment on giving 24 months notice.
The contract was varied in 2006 to reduce the notice period to twelve months, effective from 1 January 2008. Where the Company
exercises this general right to terminate, it must make a payment to the Managing Director equivalent to his base salary for the full notice
period.
The Company may terminate the Managing Director’s employment at any time for cause. No payment in lieu of notice will be made in
this circumstance.
Mr Ellice-Flint may initiate termination of his service agreement by giving three months notice.
Senior executives
Elements of remuneration
Total remuneration for senior executives is made up of the following components:
• Base remuneration – comprising salary and superannuation;
• Short-term incentive (“STI”) – annual bonuses linked to individual and Company performance; and
• Long-term incentive (“LTI”) – equity grants linked to vesting conditions tested over a three-year period.
Santos’ executive remuneration structure is consistent with the Company’s “pay for performance” policy.
Base remuneration
Senior executives are paid Total Fixed Remuneration (“TFR”), out of which the Company makes contributions into their superannuation
funds of at least the minimum statutory amount. They may, if they wish, salary sacrifice part of their TFR for additional superannuation
contributions or other benefits such as novated car leases. Senior executives do not receive any benefits in addition to TFR.
Executive remuneration levels are market-aligned by comparison against similar roles in ASX 100 energy, materials and utilities
companies, excluding BHP Billiton Limited and Rio Tinto Limited due to their disproportionately larger size and market capitalisation. This
broad industry group is used as there are too few Australian exploration and production companies of similar size to Santos for
benchmarking purposes.
Notes to the Consolidated Financial Statementsfor the year ended 31 December 2007

129
Santos Annual Report 2007
31. KEY MANAGEMENT PERSONNEL DISCLOSURES (CONTINUED)
(B) KEY MANAGEMENT PERSONNEL COMPENSATION (CONTINUED)
Short-term incentive (“STI”)
Frequency STI is assessed and paid annually.
Maximum STI 75% of TFR for the CFO and Executive Vice Presidents.
50% of TFR for other senior executives.
Performance measures To promote collaboration among senior executives and to focus their efforts towards the overall benefit of the
Company, 70% of their STI is based on Company performance. The remaining 30% is based on the executive’s
individual performance.
A range of Company performance metrics is used in order to drive balanced business performance. These metrics
include lagging indicators to assess the Company’s past performance, as well as forward-looking indicators to
ensure the Company is positioning itself well for future growth. The metrics include reserve growth, reserve
replacement cost, production, margin, new growth options, shareholder value creation, people, environment,
health and safety and continuous improvement.
Individual performance is assessed against targets set within each executive’s area of responsibility.
Assessment of performance Individual performance is assessed by the Managing Director, who makes a recommendation to the Remuneration
Committee.
Company performance is assessed by the Remuneration Committee. Each metric is assessed against target and
assigned a score on a five-point scale. The average of these scores forms the overall Company performance score.
The Remuneration Committee then makes a recommendation to the Board as to the amount of STI to be paid to
each senior executive (based on both individual and Company performance).
The Board believes the above methods of assessment are rigorous and transparent and provide a balanced
assessment of the executive’s performance.
Payment method Cash.
STI awarded in 2007 Company performance against the metrics in 2007 resulted in an average STI of 80% of maximum payable to all
eligible employees.
2007 STI awards made to individual senior executives ranged from 67% to 84% of maximum. The difference
between actual STI paid and maximum STI was forfeited.
Long-term incentive (“LTI”)
The Company’s LTI arrangements are designed to link executive reward with the key performance drivers which underpin sustainable
growth in shareholder value, which comprises both share price and returns to shareholders.
LTI is delivered in the form of equity participation through the Santos Executive Share Option Plan (“SESOP”) and the Santos Employee
Share Purchase Plan (“SESPP”). Participation is determined by the Board, on recommendation by the Remuneration Committee.
Further details are provided in note 30(B).
Service agreementsThe Company has entered into service agreements with the senior executives. The service agreements are ongoing until termination by the
Company or the senior executive.
Mr J T Young’s service agreement may be terminated by either party by giving three months notice. The service agreements of all other
senior executives may be terminated by the relevant executive by giving six months notice, or by the Company by giving twelve months
notice. In the case of a Company-initiated termination, the Company may make a payment in lieu of notice equivalent to the Total Fixed
Remuneration the executive would have received over the notice period.
All senior executives’ service agreements may be terminated immediately for cause, whereupon no payments in lieu of notice or other
termination payments apply.

31.K
EY
MA
NA
GE
ME
NT
PE
RS
ON
NE
L D
ISC
LO
SU
RE
S (
CO
NT
INU
ED
)
(B)
KEY
MA
NA
GEM
EN
T P
ER
SON
NEL C
OM
PEN
SAT
ION
(C
ON
TIN
UED
)
2007
Othe
rPe
rfor
m-
long
-ter
mTe
rmin
-an
ceSh
ort-
term
em
ploy
ee b
enef
its
Post
-em
ploy
men
tSh
are-
base
d pa
ymen
ts5
bene
fits
6at
ion
Tota
lre
late
d
Reti
re-
NED
Fees
/Su
per-
men
tSh
are
Nam
eSa
lary
1ST
IOt
her2
Tota
lan
nuat
ion3
bene
fit4
Tota
lSA
RsOp
tion
sPl
anTo
tal
$$
$$
$$
$$
$$
$$
$$
%
Dire
ctor
sBo
rda,
Ken
neth
Cha
rles
51,7
04–
–51
,704
10,6
72–
10,6
72–
–68
,750
68,7
50–
–13
1,12
6–
Dean
, Ken
neth
Alfr
ed10
5,57
5–
–10
5,57
554
,282
–54
,282
––
16,5
5016
,550
––
176,
407
–El
lice-
Flin
t, J
ohn
Char
les
1,70
2,69
41,
950,
000
1,94
43,
654,
638
987,
357
–98
7,35
7–
1,89
8,27
3–
1,89
8,27
329
7,50
0–
6,83
7,76
856
Fran
klin
, Roy
Ale
xand
er14
0,51
2–
–14
0,51
23,
195
–3,
195
––
––
––
143,
707
–Ge
rlac
h, S
teph
en25
2,22
9–
4,78
825
7,01
711
1,67
837
,925
149,
603
––
39,0
0039
,000
––
445,
620
–H
ardi
ng, R
icha
rd M
icha
el39
,600
––
39,6
0013
6,44
0–
136,
440
––
8,80
08,
800
––
184,
840
–Re
cny,
Chr
isto
pher
Joh
n719
,589
––
19,5
891,
763
–1,
763
––
––
––
21,3
52–
Sloa
n, J
udit
h–
––
–94
,407
11,6
3010
6,03
7–
–81
,500
81,5
00–
–18
7,53
7–
Exec
utiv
esAn
ders
on, J
ohn
Hug
h42
6,90
219
9,50
01,
944
628,
346
44,5
42–
44,5
4261
,371
35,4
58–
96,8
2911
9,45
7–
889,
174
33Ba
ulde
rsto
ne, J
ames
Les
lie37
9,83
316
7,00
01,
463
548,
296
38,3
40–
38,3
4055
,916
33,2
00–
89,1
16–
–67
5,75
238
Brow
n, T
revo
r Joh
n46
5,35
816
3,70
01,
944
631,
002
17,6
27–
17,6
2761
,826
36,3
30–
98,1
5657
,923
–80
4,70
833
Eam
es, M
arty
n Ed
war
d Ja
mes
505,
228
235,
100
1,94
474
2,27
252
,766
–52
,766
135,
576
22,1
81–
157,
757
22,6
82–
975,
477
40Ke
nnet
t, R
oger
Max
wel
l39
1,59
718
7,50
01,
976
581,
073
66,0
82–
66,0
8272
,549
––
72,5
4923
4,56
0–
954,
264
27Kn
ox, D
avid
Joh
n23
0,40
314
3,30
0–
373,
703
21,7
92–
21,7
9265
,429
28,1
43–
93,5
72–
–48
9,06
748
Mac
farl
ane,
Mar
k St
uart
426,
902
180,
700
1,94
460
9,54
644
,542
–44
,542
78,5
1722
,682
–10
1,19
910
8,59
7–
863,
884
33W
asow
, Pet
er C
hris
toph
er63
1,26
140
6,90
01,
944
1,04
0,10
512
,686
–12
,686
158,
421
––
158,
421
57,7
32–
1,26
8,94
445
Wilk
inso
n, R
icha
rd J
ohn
411,
455
207,
800
1,94
462
1,19
981
,752
–81
,752
118,
370
––
118,
370
104,
229
–92
5,55
035
Youn
g, J
onat
hon
Tere
nce
383,
216
239,
200
1,94
462
4,36
012
,686
–12
,686
135,
084
33,1
86–
168,
270
99,3
97–
904,
713
45
Tota
l6,
564,
058
4,08
0,70
023
,779
10,6
68,5
371,
792,
609
49,5
551,
842,
164
943,
059
2,10
9,45
321
4,60
03,
267,
112
1,10
2,07
7–
16,8
79,8
90
1Ea
ch o
f th
e N
on
-exe
cuti
ve D
irec
tors
rec
eive
s fe
es a
nd
no
sa
lary
. Fe
es i
ncl
ud
e D
irec
tor’
s fe
es a
nd
co
mm
itte
e fe
es.
The
fig
ure
s sh
own
fo
r D
irec
tors
’ fe
es a
re a
fter
fee
sa
crif
ice
to s
up
era
nn
ua
tio
n a
nd
/or
the
NED
Sh
are
Pla
n.
Mr
K C
Bo
rda
do
na
ted
his
Dir
ecto
r’s
fees
to
ch
ari
ty.
2Fo
r th
e Ch
air
ma
n,
this
rep
rese
nts
th
e va
lue
of
car
pa
rkin
g p
rovi
ded
in
th
e Co
mp
an
y’s
hea
d o
ffic
e in
Ad
ela
ide.
Fo
r a
ll o
ther
Key
Ma
na
gem
ent
Pers
on
nel
, th
ese
am
ou
nts
rep
rese
nt
the
cost
of
car
pa
rkin
gp
rovi
ded
, u
p t
o 3
0 A
pri
l 20
07.
On
1 M
ay
20
07,
the
cost
of
car
pa
rkin
g i
n t
he
Com
pa
ny’
s cu
rren
t h
ead
off
ice
wa
s a
dd
ed t
o T
FR,
an
d f
rom
th
en o
n e
xecu
tive
s w
ere
requ
ired
to
ob
tain
pa
rkin
g v
ia s
ala
ry s
acr
ific
e.3
Sup
era
nn
ua
tio
n c
on
trib
uti
on
s m
ad
e o
n b
eha
lf o
f N
on
-exe
cuti
ve D
irec
tors
in
clu
de
the
Com
pa
ny’
s o
bli
gati
on
s u
nd
er a
pp
lica
ble
Su
per
an
nu
ati
on
Gu
ara
nte
e le
gis
lati
on
an
d a
ny
volu
nta
ry f
ee s
acr
ific
e to
sup
era
nn
ua
tio
n.
Am
ou
nts
rep
rese
nt
eith
er c
ash
co
ntr
ibu
tio
ns
or
act
ua
ria
l ass
essm
ent
of
the
ben
efit
pro
vid
ed w
her
e re
leva
nt.
4In
dex
ati
on
of
acc
rued
ret
irem
ent
ben
efit
s fo
r N
on
-exe
cuti
ve D
irec
tors
ap
po
inte
d p
rio
r to
1 J
an
ua
ry 2
00
4.
5In
acc
ord
an
ce w
ith
th
e re
quir
emen
ts o
f th
e A
cco
un
tin
g S
tan
da
rds,
rem
un
era
tio
n i
ncl
ud
es a
pro
po
rtio
n o
f th
e n
otio
na
l va
lue
of
equ
ity
com
pen
sati
on
gra
nte
d o
r o
uts
tan
din
g d
uri
ng
th
e ye
ar.
Th
e n
otio
na
lva
lue
of
equ
ity
inst
rum
ents
wh
ich
do
not
ves
t d
uri
ng
th
e re
po
rtin
g p
erio
d i
s d
eter
min
ed a
s a
t th
e gr
an
t d
ate
an
d i
s p
rogr
essi
vely
all
oca
ted
ove
r th
e ve
stin
g p
erio
d.
The
am
ou
nt
incl
ud
ed a
s re
mu
ner
ati
on
is
not
rel
ate
d t
o o
r in
dic
ati
ve o
f th
e b
enef
it (
if a
ny)
th
at
ind
ivid
ua
l exe
cuti
ves
ma
y u
ltim
ate
ly r
eali
se s
ho
uld
th
e eq
uit
y in
stru
men
ts v
est.
Th
e n
otio
na
l va
lue
of
SAR
s a
nd
opt
ion
s a
s a
t th
e d
ate
of
thei
r gr
an
th
as
bee
n d
eter
min
ed i
n a
cco
rda
nce
wit
h A
ASB
2Sh
are
-ba
sed
Pay
men
ts a
pp
lyin
g t
he
Mo
nte
Ca
rlo
sim
ula
tio
n m
eth
od
. D
eta
ils
of
the
ass
um
ptio
ns
un
der
lyin
g t
he
valu
ati
on
are
set
ou
t in
not
e 3
0(B
) to
th
efi
na
nci
al s
tate
men
ts.
The
am
ou
nts
set
ou
t a
bov
e in
clu
de
a p
rop
ort
ion
of
the
valu
e o
f SA
Rs
an
d o
ptio
ns
gra
nte
d d
uri
ng
20
07 u
nd
er t
he
Perf
orm
an
ce G
ran
t a
nd
Gro
wth
Aw
ard
s a
s w
ell a
s a
pro
po
rtio
n o
f th
eva
lue
of
SAR
s a
nd
opt
ion
s gr
an
ted
in
pre
vio
us
fin
an
cia
l yea
rs t
ha
t h
ad
not
ves
ted
as
at
1 J
an
ua
ry 2
007
.6
Thes
e a
mo
un
ts r
epre
sen
t se
nio
r ex
ecu
tive
s’ lo
ng
ser
vice
lea
ve a
ccru
als
as
at
31 D
ecem
ber
20
07.
7Pa
ymen
t to
dec
ease
d e
sta
te.
130
Santos Annual Report 2007
Notes to the Consolidated Financial Statementsfor the year ended 31 December 2007

131
Santos Annual Report 2007
31.K
EY
MA
NA
GE
ME
NT
PE
RS
ON
NE
L D
ISC
LO
SU
RE
S (
CO
NT
INU
ED
)
(B)
KEY
MA
NA
GEM
EN
T P
ER
SON
NEL C
OM
PEN
SAT
ION
(C
ON
TIN
UED
)
2006
Othe
rPe
rfor
m-
Post
-lo
ng-t
erm
ance
Shor
t-te
rm e
mpl
oyee
ben
efit
sem
ploy
men
tSh
are-
base
d pa
ymen
ts4
bene
fits
Term
inat
ion
Tota
lre
late
dFe
es/
Supe
r-N
ame
Sala
ry1
STI
Othe
r2To
tal
annu
atio
n3SA
RsOp
tion
sTo
tal
$$
$$
$$
$$
$$
$%
Dir
ecto
rsB
arne
tt, P
eter
Cha
rles
521
,660
––
21,6
601,
949
––
––
–23
,609
–
Dea
n, K
enne
th A
lfre
d14
9,75
0–
–14
9,75
012
,372
––
––
–16
2,12
2–
Ellic
e-Fl
int,
Joh
n Ch
arle
s1,
500,
000
1,38
0,00
06,
656
2,88
6,65
690
9,95
4–
1,40
6,20
51,
406,
205
169,
650
–5,
372,
465
52
Fran
klin
, Roy
Ale
xand
er33
,568
––
33,5
68–
––
––
–33
,568
–
Ger
lach
, Ste
phen
360,
000
–6,
656
366,
656
12,4
12–
––
––
379,
068
–
Har
ding
, Ric
hard
Mic
hael
155,
000
––
155,
000
12,1
22–
––
––
167,
122
–
O’L
eary
, Mic
hael
Ant
hony
513
5,33
6–
–13
5,33
6–
––
––
–13
5,33
6–
Recn
y, C
hris
toph
er J
ohn5
27,5
00–
–27
,500
2,47
5–
––
––
29,9
75–
Sloa
n, J
udit
h15
1,50
0–
–15
1,50
012
,372
––
––
–16
3,87
2–
Exec
utiv
esA
nder
son,
Joh
n H
ugh
360,
915
143,
800
6,65
651
1,37
137
,896
–32
,181
32,1
8198
,417
–67
9,86
526
Bro
wn,
Tre
vor
John
417,
952
135,
900
6,65
656
0,50
818
,067
–32
,488
32,4
8840
,252
–65
1,31
526
Eam
es, M
arty
n Ed
war
d Ja
mes
452,
865
191,
300
6,65
665
0,82
142
,385
36,2
5322
,181
58,4
3411
,810
–76
3,45
033
Gou
adai
n, J
acqu
es E
lie6
112,
761
–1,
664
114,
425
3,31
1–
––
–14
,469
132,
205
–
Mac
farl
ane,
Mar
k St
uart
376,
849
143,
800
6,65
652
7,30
528
,750
42,4
083,
038
45,4
4688
,575
–69
0,07
627
Was
ow, P
eter
Chr
isto
pher
581,
163
331,
500
6,65
691
9,31
99,
240
105,
694
–10
5,69
438
,199
–1,
072,
452
41
Wilk
inso
n, R
icha
rd J
ohn
441,
649
165,
000
6,65
661
3,30
574
,363
79,2
05–
79,2
0586
,466
–85
3,33
929
Woo
d, B
ruce
Jam
es7
169,
995
–3,
051
173,
046
10,4
16–
––
–22
,689
206,
151
–
Youn
g, J
onat
hon
Tere
nce
606,
379
391,
400
6,65
61,
004,
435
12,4
1211
4,85
54,
459
119,
314
75,1
70–
1,21
1,33
142
Tota
l6,
054,
842
2,88
2,70
064
,619
9,00
2,16
11,
200,
496
378,
415
1,50
0,55
21,
878,
967
608,
539
37,1
5812
,727
,321
1Ea
ch o
f th
e N
on
-exe
cuti
ve D
irec
tors
rec
eive
s fe
es a
nd
no
sa
lary
. Fe
es i
ncl
ud
e D
irec
tor’
s fe
es a
nd
co
mm
itte
e fe
es.
2In
clu
des
th
e co
st o
f ca
r p
ark
ing
pro
vid
ed i
n t
he
Com
pa
ny’
s h
ead
off
ice
in A
del
aid
e fo
r th
e CE
O a
nd
exe
cuti
ves.
3Su
per
an
nu
ati
on
co
ntr
ibu
tio
ns
ma
de
on
beh
alf
of
No
n-e
xecu
tive
Dir
ecto
rs,
wit
h t
he
exce
ptio
n o
f M
r R
A F
ran
klin
, to
sa
tisf
y th
e Co
mp
an
y’s
ob
liga
tio
ns
un
der
ap
pli
cab
le S
up
era
nn
ua
tio
n G
ua
ran
tee
leg
isla
tio
n.
Un
der
Su
per
an
nu
ati
on
Gu
ara
nte
e le
gis
lati
on
, su
per
an
nu
ati
on
co
ntr
ibu
tio
ns
are
not
req
uir
ed t
o b
e m
ad
e o
n b
eha
lf o
f M
r R
A F
ran
klin
as
he
is n
ot a
res
iden
t o
f A
ust
rali
a.
Am
ou
nts
rep
rese
nt
eith
er c
ash
con
trib
uti
on
s o
r a
ctu
ari
al a
sses
smen
t o
f th
e b
enef
it p
rovi
ded
wh
ere
rele
van
t.4
In a
cco
rda
nce
wit
h t
he
requ
irem
ents
of
the
Acc
ou
nti
ng
Sta
nd
ard
s, r
emu
ner
ati
on
in
clu
des
a p
rop
ort
ion
of
the
not
ion
al v
alu
e o
f eq
uit
y co
mp
ensa
tio
n g
ran
ted
or
ou
tsta
nd
ing
du
rin
g t
he
yea
r. T
he
not
ion
al
valu
e o
f eq
uit
y in
stru
men
ts w
hic
h d
o n
ot v
est
du
rin
g t
he
rep
ort
ing
per
iod
is
det
erm
ined
as
at
the
gra
nt
da
te a
nd
is
pro
gres
sive
ly a
llo
cate
d o
ver
the
vest
ing
per
iod
. Th
e a
mo
un
t in
clu
ded
as
rem
un
era
tio
n i
sn
ot r
ela
ted
to
or
ind
ica
tive
of
the
ben
efit
(if
an
y) t
ha
t in
div
idu
al e
xecu
tive
s m
ay
ult
ima
tely
rea
lise
sh
ou
ld t
he
equ
ity
inst
rum
ents
ves
t. T
he
not
ion
al v
alu
e o
f SA
Rs
an
d o
ptio
ns
as
at
the
da
te o
f th
eir
gra
nt
ha
s b
een
det
erm
ined
in
acc
ord
an
ce w
ith
AA
SB 2
Sha
re-b
ase
d P
aym
ents
ap
ply
ing
th
e M
on
te C
arl
o s
imu
lati
on
met
ho
d.
Det
ail
s o
f th
e a
ssu
mpt
ion
s u
nd
erly
ing
th
e va
lua
tio
n a
re s
et o
ut
in n
ote
30
(B)
to t
he
fin
an
cia
l sta
tem
ents
.5
Mr
P C
Ba
rnet
t ce
ase
d a
s a
Dir
ecto
r o
n 2
8 F
ebru
ary
20
06
an
d M
r M
A O
’Lea
ry c
ease
d a
s a
Dir
ecto
r o
n 1
5 D
ecem
ber
20
06
. M
r C
J Re
cny
hel
d o
ffic
e a
s a
Dir
ecto
r u
nti
l his
dea
th o
n 4
Ju
ne
20
06
.6
Mr
J E
Go
ua
da
in c
ease
d e
mp
loym
ent
wit
h t
he
Com
pa
ny
on
30
Ma
rch
20
06
an
d t
he
rig
ht
to h
is 4
0,0
00
SA
Rs
at
the
valu
e o
f $
176
,00
0 la
pse
d.
7M
r B
J W
oo
d c
ease
d e
mp
loym
ent
wit
h t
he
Com
pa
ny
on
15
Ju
ne
20
06
an
d t
he
rig
ht
to h
is 1
10,6
00
opt
ion
s a
t th
e va
lue
of
$11
3,3
65
fo
rfei
ted
.

31.K
EY
MA
NA
GE
ME
NT
PE
RS
ON
NE
L D
ISC
LO
SU
RE
S (
CO
NT
INU
ED
)
(C)
EQ
UIT
Y H
OLD
ING
S O
F K
EY
MA
NA
GEM
EN
T P
ER
SON
NEL
Op
tion
s an
d r
igh
ts h
old
ings
The
mo
vem
ent
du
rin
g t
he
rep
ort
ing
per
iod
in
th
e n
um
ber
of
rig
hts
an
d o
pti
on
s o
ver
ord
inar
y sh
ares
of
the
Com
pan
y h
eld
dir
ectl
y, i
nd
irec
tly
or
ben
efic
iall
y, b
y ea
ch k
eym
anag
emen
t p
erso
n,
incl
ud
ing
th
eir
rela
ted
par
ties
, is
as
foll
ow
s:
20
07O
ptio
ns
Am
oun
t pa
idVe
sted
an
dVe
sted
bu
t n
otB
alan
ce a
tex
erci
sed/
per
opti
onB
alan
ceVe
sted
Vest
edex
erci
sabl
eex
erci
sabl
ebe
gin
nin
gri
ghts
exer
cise
d/O
ther
at e
nd
ofdu
rin
gat
en
d of
at e
nd
ofat
en
d of
Nam
eof
th
e ye
arG
ran
ted1
,2,3
,4ve
sted
5ri
ght
vest
edch
ange
s6th
e ye
arth
e ye
arth
e ye
arth
e ye
arth
e ye
ar
Opt
ion
sD
irec
tors
Elli
ce-F
lin
t, J
oh
n C
har
les
2,5
00
,00
0–
––
–2
,50
0,0
00
125
,00
012
5,0
00
125
,00
0–
Exec
uti
ves
An
der
son
, Jo
hn
Hu
gh
134
,04
4–
––
(28
,80
0)
105
,24
4–
12,7
44
12,7
44
–B
auld
erst
on
e, J
ames
Les
lie
–5
0,0
00
––
–5
0,0
00
––
––
Bro
wn
, Tr
evo
r Jo
hn
184
,76
9–
(27,
09
5)
$6
.38
(29
,00
0)
109
,40
0–
14,5
00
14,5
00
–(1
9,2
74)
$6
.95
Eam
es,
Mar
tyn
Ed
war
d J
ames
50
,00
0–
––
–5
0,0
00
––
––
Ken
net
t, R
og
er M
axw
ell
––
––
––
––
––
Kn
ox,
Dav
id J
oh
n–
100
,00
0–
––
100
,00
0–
––
–M
acfa
rlan
e, M
ark
Stu
art
63
,70
0–
––
–6
3,7
00
––
––
Was
ow
, Pe
ter
Chri
sto
ph
er–
––
––
––
––
–W
ilki
nso
n,
Ric
har
d J
oh
n–
––
––
––
––
–Yo
un
g,
Jon
ath
on
Ter
ence
93
,20
0–
––
–9
3,2
00
––
––
Tota
l3
,02
5,7
1315
0,0
00
(46
,36
9)
(57,
80
0)
3,0
71,5
44
125
,00
015
2,2
44
152
,24
4–
Rig
hts
Exec
uti
ves
An
der
son
, Jo
hn
Hu
gh
–27
,00
0–
––
27,0
00
––
––
Bau
lder
sto
ne,
Jam
es L
esli
e–
36
,90
0–
––
36
,90
0–
––
–B
row
n,
Trev
or
Joh
n–
27,2
00
––
–27
,20
0–
––
–Ea
mes
, M
arty
n E
dw
ard
Jam
es3
9,5
00
32
,00
0–
––
71,5
00
––
––
Ken
net
t, R
og
er M
axw
ell
28
,80
018
,20
0–
–(9
,00
0)
38
,00
0–
––
–K
no
x, D
avid
Jo
hn
–5
0,0
00
––
–5
0,0
00
––
––
Mac
farl
ane,
Mar
k St
uar
t19
,20
027
,00
0–
–(9
,60
0)
36
,60
0–
––
–W
aso
w,
Pete
r Ch
rist
op
her
70
,20
037
,00
0–
–(2
3,6
00
)8
3,6
00
––
––
Wil
kin
son
, R
ich
ard
Jo
hn
51,6
00
28
,20
0–
–(1
7,7
00
)6
2,1
00
––
––
You
ng
, Jo
nat
ho
n T
eren
ce5
2,0
00
39
,00
0–
–(2
6,0
00
)6
5,0
00
––
––
Tota
l2
61,3
00
32
2,5
00
–(8
5,9
00
)4
97,9
00
––
––
1W
ith
th
e ex
cept
ion
of
Mr
D J
Kn
ox,
opti
ons
gran
ted
to e
xecu
tive
s in
th
e cu
rren
t ye
ar w
ere
gran
ted
on 1
Ju
ly 2
007
, h
ave
an e
xpir
atio
n d
ate
of 1
Ju
ly 2
017
an
d an
exe
rcis
e pr
ice
of $
14.1
4.
At t
he
date
of
gran
t, t
he
opti
ons
gran
ted
hav
e a
fair
val
ue
of $
3.3
2 p
er o
ptio
n.
The
opti
ons
wer
e pr
ovid
ed a
t n
o co
st t
o th
e re
cipi
ents
. Pr
ovid
ing
vest
ing
con
diti
ons
are
met
, th
e op
tion
s ar
e ex
erci
sabl
e n
o ea
rlie
r th
an 1
Jan
uar
y 2
010
.2
Opt
ion
s gr
an
ted
to
Mr
D J
Kn
ox i
n t
he
curr
ent
yea
r w
ere
gra
nte
d o
n 3
Sep
tem
ber
20
07,
ha
ve a
n e
xpir
ati
on
da
te o
f 3
Sep
tem
ber
201
7 a
nd
an
exe
rcis
e p
rice
of
$12
.81.
At
the
da
te o
f gr
an
t, a
ll o
f th
e o
ptio
ns
gra
nte
d h
ave
a f
air
va
lue
of
$1.
97 p
er o
ptio
n.
The
opt
ion
s w
ere
pro
vid
ed a
t n
o c
ost
to
Mr
D J
Kn
ox.
Pro
vid
ing
ves
tin
g c
on
dit
ion
s a
re m
et,
all
of
the
opt
ion
s a
re e
xerc
isa
ble
no
ea
rlie
r th
an
3 S
epte
mb
er 2
010
.3
Wit
h t
he
exce
ptio
n o
f M
r D
J K
nox
, SA
Rs
gra
nte
d t
o e
xecu
tive
s in
th
e cu
rren
t ye
ar
wer
e gr
an
ted
on
1 J
uly
20
07,
ha
ve a
n e
xpir
ati
on
da
te o
f 1
Ju
ly 2
017,
an
d v
est
wit
h t
he
reci
pie
nt
for
no
co
nsi
der
ati
on
.A
tth
ed
ate
of
gra
nt,
13
0,1
00
of
the
SAR
s gr
an
ted
ha
ve a
fa
ir v
alu
e o
f $
9.9
5 p
er S
AR
, a
nd
13
0,1
00
of
the
SAR
s gr
an
ted
ha
ve a
fa
ir v
alu
e o
f $
12.7
8 p
er S
AR
.4
SAR
s gr
an
ted
to
Mr
D J
Kn
ox i
n t
he
curr
ent
yea
r w
ere
gra
nte
d o
n 3
Sep
tem
ber
20
07,
ha
ve a
n e
xpir
ati
on
da
te o
f 3
Sep
tem
ber
201
7, a
nd
ves
t w
ith
Mr
D J
Kn
ox f
or
no
co
nsi
der
ati
on
. A
t th
e d
ate
of
gra
nt,
all
of
the
SAR
s gr
an
ted
ha
ve a
fa
ir v
alu
e o
f $
9.1
6 p
er S
AR
.5
Each
opt
ion
exe
rcis
ed o
r SA
R v
este
d r
esu
lts
in t
he
issu
e o
f o
ne
ord
ina
ry s
ha
re o
f th
e Co
mp
an
y to
th
e re
cip
ien
t. T
her
e a
re n
o a
mo
un
ts u
np
aid
on
th
e sh
are
s is
sued
as
a r
esu
lt o
f th
e ex
erci
se o
f o
ptio
ns
an
dve
stin
g o
f SA
Rs.
6O
ther
ch
an
ges
ma
y in
clu
de
the
lap
se o
f o
ptio
ns
on
th
e ex
pir
y o
f th
e ex
erci
se p
erio
d,
red
uct
ion
s in
SA
Rs
enti
tlem
ents
du
e to
per
form
an
ce c
on
dit
ion
s n
ot b
ein
g m
et,
forf
eitu
re o
f SA
Rs
wh
en s
ervi
ce c
on
dit
ion
sa
re n
ot m
et,
or
the
rem
ova
l of
an
em
plo
yee’
s eq
uit
y h
old
ing
fro
m t
he
key
ma
na
gem
ent
per
son
nel
dis
clo
sure
wh
en t
hey
ter
min
ate
em
plo
ymen
t w
ith
th
e Co
mp
an
y.
Det
ails
reg
ard
ing
th
e se
rvic
e an
d p
erfo
rman
ce c
on
dit
ion
s th
at m
ust
be
met
bef
ore
th
e o
pti
on
s an
d S
AR
s ve
st w
ith
th
e re
cip
ien
t ar
e in
clu
ded
in
no
te 3
0(B
).
132
Santos Annual Report 2007
Notes to the Consolidated Financial Statementsfor the year ended 31 December 2007

133
Santos Annual Report 2007
31.K
EY
MA
NA
GE
ME
NT
PE
RS
ON
NE
L D
ISC
LO
SU
RE
S (
CO
NT
INU
ED
)
(C)
EQ
UIT
Y H
OLD
ING
S O
F K
EY
MA
NA
GEM
EN
T P
ER
SON
NEL (
CO
NT
INU
ED
)
20
06
Opt
ion
sA
mou
nt
paid
Vest
ed a
nd
Vest
ed b
ut
not
Bal
ance
at
exer
cise
d/pe
r op
tion
Bal
ance
Vest
edVe
sted
exer
cisa
ble
exer
cisa
ble
begi
nn
ing
righ
tsex
erci
sed/
Oth
erat
en
d of
duri
ng
at e
nd
ofat
en
d of
at e
nd
ofN
ame
of t
he
year
Gra
nte
d1,2
,3ve
sted
4ri
ght
vest
edch
ange
s5th
e ye
arth
e ye
arth
e ye
arth
e ye
arth
e ye
ar
Opt
ion
sD
irec
tors
Elli
ce-F
lin
t, J
oh
n C
har
les
–2
,50
0,0
00
––
–2
,50
0,0
00
––
––
Exec
uti
ves
An
der
son
, Jo
hn
Hu
gh
70
,34
46
3,7
00
––
–1
34
,04
4–
12
,74
41
2,7
44
–B
row
n,
Trev
or
Joh
n3
33
,36
96
5,9
00
(20
0,0
00
)$
6.5
2(1
4,5
00
)1
84
,76
914
,50
06
0,8
69
60
,86
9–
Eam
es,
Mar
tyn
Ed
war
d J
ames
50
,00
0–
––
–5
0,0
00
––
––
Go
uad
ain
, Ja
cqu
es E
lie
20
0,0
00
–(2
00
,00
0)
$6
.52
––
––
––
Mac
farl
ane,
Mar
k St
uar
t–
63
,70
0–
––
63
,70
0–
––
–W
aso
w,
Pete
r Ch
rist
op
her
––
––
––
––
––
Wil
kin
son
, R
ich
ard
Jo
hn
––
––
––
––
––
Wo
od
, B
ruce
Jam
es6
210
,98
5–
(45
,08
5)
$6
.38
(13
8,2
50
)–
11,1
00
––
–(2
7,6
50
)$
8.4
6Yo
un
g,
Jon
ath
on
Ter
ence
–9
3,2
00
––
–9
3,2
00
––
––
Tota
l8
64
,69
82
,78
6,5
00
(472
,73
5)
(15
2,7
50
)3
,02
5,7
13
25
,60
073
,61
373
,61
3–
Rig
hts
Exec
uti
ves
An
der
son
, Jo
hn
Hu
gh
8,6
00
–(4
,30
0)
–(4
,30
0)
–4
,30
0–
––
Bro
wn
, Tr
evo
r Jo
hn
––
––
––
––
––
Eam
es,
Mar
tyn
Ed
war
d J
ames
19,6
00
19,9
00
––
–3
9,5
00
––
––
Go
uad
ain
, Ja
cqu
es E
lie7
60
,00
0–
(10
,00
0)
–(5
0,0
00
)–
10,0
00
––
–M
acfa
rlan
e, M
ark
Stu
art
28
,80
0–
(4,8
00
)–
(4,8
00
)19
,20
04
,80
0–
––
Was
ow
, Pe
ter
Chri
sto
ph
er7
0,8
00
23
,00
0(1
1,8
00
)–
(11,
80
0)
70
,20
011
,80
0–
––
Wil
kin
son
, R
ich
ard
Jo
hn
53
,10
016
,20
0(8
,85
0)
–(8
,85
0)
51,6
00
8,8
50
––
–W
oo
d,
Bru
ce J
ames
––
––
––
––
––
You
ng
, Jo
nat
ho
n T
eren
ce78
,00
0–
(13
,00
0)
–(1
3,0
00
)5
2,0
00
13
,00
0–
––
Tota
l31
8,9
00
59
,10
0(5
2,7
50
)(9
2,7
50
)2
32
,50
05
2,7
50
––
–
12
,50
0,0
00
opt
ion
s w
ere
gra
nte
d t
o M
r J
C El
lice
-Fli
nt
on
4 M
ay
20
06
, w
hic
h h
ave
an
exp
ira
tio
n d
ate
of
3 M
ay
201
6 a
nd
an
exe
rcis
e p
rice
of
$11
.36
. A
t th
e d
ate
of
gra
nt,
50
0,0
00
of
the
opt
ion
s gr
an
ted
ha
vea
fair
va
lue
of
$1.
77 p
er o
ptio
n,
1,0
00
,00
0 o
ptio
ns
ha
ve a
fa
ir v
alu
e o
f $
1.94
per
opt
ion
, a
nd
1,0
00
,00
0 o
ptio
ns
ha
ve a
fa
ir v
alu
e o
f $
2.0
5 p
er o
ptio
n.
The
opt
ion
s w
ere
gra
nte
d a
t n
o c
ost
to
Mr
JC
Elli
ce-F
lin
t.P
rovi
din
g p
erfo
rma
nce
co
nd
itio
ns
are
met
, 5
00
,00
0 o
f th
e o
ptio
ns
are
exe
rcis
ab
le n
o e
arl
ier
tha
n 2
6 A
ug
ust
20
07,
1,0
00
,00
0 o
f th
e o
ptio
ns
are
exe
rcis
ab
le n
o e
arl
ier
tha
n 2
6 A
ug
ust
20
08
, a
nd
1,0
00
,00
0 o
fth
e o
ptio
ns
are
exe
rcis
ab
le n
o e
arl
ier
tha
n 2
8 A
ug
ust
20
09
.2
Opt
ion
s gr
an
ted
to
exe
cuti
ves
in t
he
curr
ent
yea
r w
ere
gra
nte
d o
n 2
4 O
cto
ber
20
06
, h
ave
an
exp
ira
tio
n d
ate
of
24 O
cto
ber
201
6,
an
exe
rcis
e p
rice
of
$10
.48
, a
nd
a f
air
va
lue
of
$0
.76
at
gra
nt
da
te.
The
opt
ion
sw
ere
pro
vid
ed a
t n
o c
ost
to
th
e re
cip
ien
ts.
Pro
vid
ing
per
form
an
ce c
on
dit
ion
s a
re m
et,
the
opt
ion
s a
re e
xerc
isa
ble
no
ea
rlie
r th
an
1 J
an
ua
ry 2
00
9.
3SA
Rs
gra
nte
d t
o e
xecu
tive
s in
th
e cu
rren
t ye
ar
wer
e gr
an
ted
on
24
Oct
ob
er 2
00
6,
ha
ve a
n e
xpir
ati
on
da
te o
f 24
Oct
ob
er 2
016
, ve
st w
ith
th
e re
cip
ien
t fo
r n
o c
on
sid
era
tio
n,
an
d h
ave
a f
air
va
lue
of
$2
.86
at
gra
nt
da
te.
The
SAR
s w
ere
pro
vid
ed a
t n
o c
ost
to
th
e re
cip
ien
ts.
Pro
vid
ing
per
form
an
ce c
on
dit
ion
s a
re m
et,
the
SAR
s ve
st n
o e
arl
ier
tha
n 1
Ja
nu
ary
20
09
.4
Each
opt
ion
exe
rcis
ed o
r SA
R v
este
d r
esu
lts
in t
he
issu
e o
f o
ne
ord
ina
ry s
ha
re o
f th
e Co
mp
an
y to
th
e re
cip
ien
t. T
her
e a
re n
o a
mo
un
ts u
np
aid
on
th
e sh
are
s is
sued
as
a r
esu
lt o
f th
e ex
erci
se o
f o
ptio
ns
an
dve
stin
g o
f SA
Rs.
5O
ther
ch
an
ges
ma
y in
clu
de
the
lap
se o
f o
ptio
ns
on
th
e ex
pir
y o
f th
e ex
erci
se p
erio
d,
red
uct
ion
s in
SA
Rs
enti
tlem
ents
du
e to
per
form
an
ce c
on
dit
ion
s n
ot b
ein
g m
et,
forf
eitu
re o
f SA
Rs
wh
en s
ervi
ce c
on
dit
ion
sa
re n
ot m
et,
or
the
rem
ova
l of
an
em
plo
yee’
s eq
uit
y h
old
ing
fro
m t
he
key
ma
na
gem
ent
per
son
nel
dis
clo
sure
wh
en t
hey
ter
min
ate
em
plo
ymen
t w
ith
th
e Co
mp
an
y.6
Mr
B J
Wo
od
cea
sed
em
plo
ymen
t w
ith
th
e Co
mp
an
y o
n 1
5 J
un
e 2
00
6 a
nd
th
e ri
gh
t to
his
110
,60
0 o
ptio
ns
at
the
valu
e o
f $
113
,36
5 f
orf
eite
d.
7M
r J
E G
ou
ad
ain
cea
sed
em
plo
ymen
t w
ith
th
e Co
mp
an
y o
n 3
0 M
arc
h 2
00
6 a
nd
th
e ri
gh
t to
his
40
,00
0 S
AR
s a
t th
e va
lue
of
$17
6,0
00
lap
sed
.
Det
ails
reg
ard
ing
th
e se
rvic
e an
d p
erfo
rman
ce c
on
dit
ion
s th
at m
ust
be
met
bef
ore
th
e o
pti
on
s o
r S
AR
s ve
st w
ith
th
e re
cip
ien
t ar
e in
clu
ded
in
no
te 3
0(B
).

134
Santos Annual Report 2007
Notes to the Consolidated Financial Statementsfor the year ended 31 December 2007
31.K
EY
MA
NA
GE
ME
NT
PE
RS
ON
NE
L D
ISC
LO
SU
RE
S (
CO
NT
INU
ED
)
(C)
EQ
UIT
Y H
OLD
ING
S O
F K
EY
MA
NA
GEM
EN
T P
ER
SON
NEL (
CO
NT
INU
ED
)
Shar
e h
old
ings
The
mo
vem
ent
du
rin
g t
he
rep
ort
ing
per
iod
in
th
e n
um
ber
of
shar
es o
f th
e Co
mp
any
hel
d d
irec
tly,
in
dir
ectl
y o
r b
enef
icia
lly,
by
each
key
man
agem
ent
per
son
, in
clu
din
g
thei
r re
late
d p
arti
es,
is a
s fo
llo
ws:
20
07B
alan
ceh
eld
Bal
ance
at
Gra
nte
dB
alan
cen
omin
ally
begi
nn
ing
asR
ecei
ved
onR
ecei
ved
at e
nd
at e
nd
of t
he
com
pen
-ex
erci
seon
ves
tin
gO
ther
of t
he
of t
he
Nam
eye
arsa
tion
of o
ptio
ns
of r
igh
tsR
edee
med
chan
ges
year
year
Ord
inar
y sh
ares
– f
ull
y pa
idD
irec
tors
Bo
rda,
Ken
net
h C
har
les
––
––
–3
5,2
073
5,2
07–
Dea
n,
Ken
net
h A
lfre
d3
,00
0–
––
–1,
145
4,1
45
–El
lice
-Fli
nt,
Jo
hn
Ch
arle
s4
,037
,94
0–
––
–75
,40
44
,113
,34
4–
Fran
klin
, R
oy
Ale
xan
der
––
––
––
––
Ger
lach
, St
eph
en4
4,8
80
––
––
4,3
30
49
,210
–H
ard
ing
, R
ich
ard
Mic
hae
l–
––
––
60
86
08
–S
loan
, Ju
dit
h5
,00
0–
––
–5
,63
910
,63
9–
Exec
uti
ves
An
der
son
, Jo
hn
Hu
gh
6,1
75–
––
–6
86
,24
3–
Bau
lder
sto
ne,
Jam
es L
esli
e–
––
––
––
–B
row
n,
Trev
or
Joh
n2
00
,00
0–
46
,36
9–
––
246
,36
9–
Eam
es,
Mar
tyn
Ed
war
d J
ames
––
––
––
––
Ken
net
t, R
og
er M
axw
ell
59
,79
5–
––
––
59
,79
5–
Kn
ox,
Dav
id J
oh
n–
––
––
––
–M
acfa
rlan
e, M
ark
Stu
art
3,2
04
––
––
–3
,20
4–
Was
ow
, Pe
ter
Chri
sto
ph
er27
,93
4–
––
––
27,9
34
–W
ilki
nso
n,
Ric
har
d J
oh
n21
,441
––
––
–21
,441
–Yo
un
g,
Jon
ath
on
Ter
ence
28
0,1
83
––
––
(10
0,0
00
)18
0,1
83
–
Tota
l4
,68
9,5
52
–4
6,3
69
––
22
,401
4,7
58
,32
2–
Red
eem
able
con
vert
ible
pre
fere
nce
sh
ares
Dir
ecto
rsEl
lice
-Fli
nt,
Jo
hn
Ch
arle
s2
25
––
––
–2
25
–S
loan
, Ju
dit
h19
5–
––
––
195
–
Tota
l4
20
––
––
–4
20
–

135
Santos Annual Report 2007
31.K
EY
MA
NA
GE
ME
NT
PE
RS
ON
NE
L D
ISC
LO
SU
RE
S (
CO
NT
INU
ED
)
(C)
EQ
UIT
Y H
OLD
ING
S O
F K
EY
MA
NA
GEM
EN
T P
ER
SON
NEL (
CO
NT
INU
ED
)
20
06
Bal
ance
hel
dB
alan
ce a
tG
ran
ted
Bal
ance
nom
inal
lybe
gin
nin
gas
Rec
eive
d on
Rec
eive
dat
en
dat
en
dof
th
eco
mpe
n-
exer
cise
on v
esti
ng
Oth
erof
th
eof
th
eN
ame
year
sati
onof
opt
ion
sof
rig
hts
Red
eem
edch
ange
s1ye
arye
ar
Ord
inar
y sh
ares
– f
ull
y pa
idD
irec
tors
Bar
net
t, P
eter
Ch
arle
s21
2,3
94
––
––
(12
,39
4)
––
Dea
n,
Ken
net
h A
lfre
d3
,00
0–
––
––
3,0
00
–El
lice
-Fli
nt,
Jo
hn
Ch
arle
s4
,04
2,2
43
––
––
(4,3
03
)4
,037
,94
0–
Fran
klin
, R
oy
––
––
––
––
Ger
lach
, St
eph
en4
3,8
56
––
––
1,0
244
4,8
80
–H
ard
ing
, R
ich
ard
Mic
hae
l–
––
––
––
–O
’Lea
ry,
Mic
hae
l A
nth
on
y24
,89
8–
––
–(4
,89
8)
––
Rec
ny,
Ch
rist
op
her
Jo
hn
2–
––
––
––
–S
loan
, Ju
dit
h5
,00
0–
––
––
5,0
00
–
Exec
uti
ves
An
der
son
, Jo
hn
Hu
gh
1,8
12
––
4,3
00
–6
36
,175
–B
row
n,
Trev
or
Joh
n–
–2
00
,00
0–
––
20
0,0
00
–Ea
mes
, M
arty
n E
dw
ard
Jam
es–
––
––
––
–G
ou
adai
n,
Jacq
ues
Eli
e31
2,2
16–
20
0,0
00
10,0
00
–(2
22
,216
)–
–M
acfa
rlan
e, M
ark
Stu
art
3,2
04
––
4,8
00
–(4
,80
0)
3,2
04
–W
aso
w,
Pete
r Ch
rist
op
her
16,1
34
––
11,8
00
––
27,9
34
–W
ilki
nso
n,
Ric
har
d J
oh
n1
2,5
91–
–8
,85
0–
–2
1,4
41–
Wo
od
, B
ruce
Jam
es3
57,2
90
–72
,73
5–
–(1
30
,02
5)
––
You
ng
, Jo
nat
ho
n T
eren
ce2
67,
18
3–
–1
3,0
00
––
28
0,1
83
–
Tota
l4
,48
1,8
21
–47
2,7
35
52
,75
0–
(37
7,5
49
)4
,62
9,7
57–
Red
eem
able
con
vert
ible
pre
fere
nce
sh
ares
Dir
ecto
rsEl
lice
-Fli
nt,
Jo
hn
Ch
arle
s2
25
––
––
–2
25
–S
loan
, Ju
dit
h19
5–
––
––
195
–
Tota
l4
20
––
––
–4
20
–
1O
ther
ch
an
ges
incl
ud
e th
e re
mov
al o
f a
Dir
ecto
r’s
or
emp
loye
e’s
equ
ity
ho
ldin
g f
rom
th
e ke
y m
an
age
men
t p
erso
nn
el d
iscl
osu
re w
her
e th
ey c
ease
to
be
a D
irec
tor
or
cea
se e
mp
loym
ent
wit
h t
he
Com
pa
ny.
2M
r P
C B
arn
ett
cea
sed
as
a D
irec
tor
on
28
Feb
rua
ry 2
00
6 a
nd
Mr
M A
O’L
eary
cea
sed
as
a D
irec
tor
on
15
Dec
emb
er 2
00
6.
Mr
C J
Recn
y h
eld
off
ice
as
a D
irec
tor
un
til h
is d
eath
on
4 J
un
e 2
00
6.
3M
r J
E G
ou
ad
ain
cea
sed
em
plo
ymen
t w
ith
th
e Co
mp
an
y o
n 3
0 M
arc
h 2
00
6 a
nd
Mr
B J
Wo
od
cea
sed
em
plo
ymen
t w
ith
th
e Co
mp
an
y o
n 1
5 J
un
e 2
00
6.
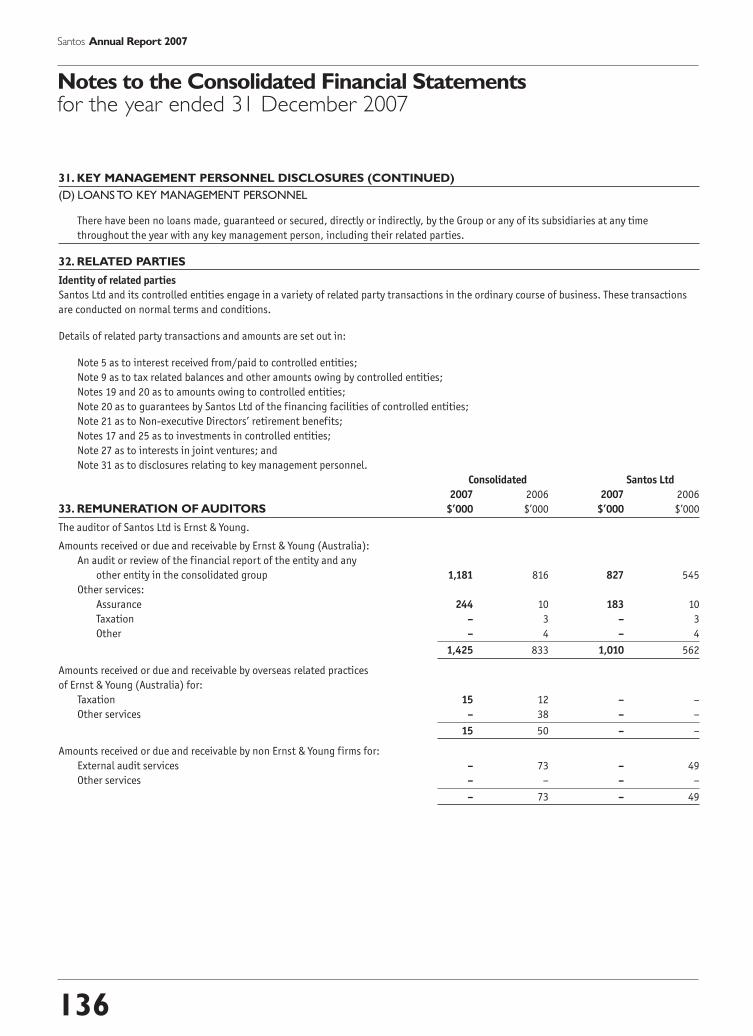
31. KEY MANAGEMENT PERSONNEL DISCLOSURES (CONTINUED)
(D) LOANS TO KEY MANAGEMENT PERSONNEL
There have been no loans made, guaranteed or secured, directly or indirectly, by the Group or any of its subsidiaries at any time
throughout the year with any key management person, including their related parties.
32. RELATED PARTIES
Identity of related parties
Santos Ltd and its controlled entities engage in a variety of related party transactions in the ordinary course of business. These transactions
are conducted on normal terms and conditions.
Details of related party transactions and amounts are set out in:
Note 5 as to interest received from/paid to controlled entities;
Note 9 as to tax related balances and other amounts owing by controlled entities;
Notes 19 and 20 as to amounts owing to controlled entities;
Note 20 as to guarantees by Santos Ltd of the financing facilities of controlled entities;
Note 21 as to Non-executive Directors’ retirement benefits;
Notes 17 and 25 as to investments in controlled entities;
Note 27 as to interests in joint ventures; and
Note 31 as to disclosures relating to key management personnel.
Consolidated Santos Ltd
2007 2006 2007 2006
33. REMUNERATION OF AUDITORS $’000 $’000 $’000 $’000
The auditor of Santos Ltd is Ernst & Young.
Amounts received or due and receivable by Ernst & Young (Australia):
An audit or review of the financial report of the entity and any
other entity in the consolidated group 1,181 816 827 545
Other services:
Assurance 244 10 183 10
Taxation – 3 – 3
Other – 4 – 4
1,425 833 1,010 562
Amounts received or due and receivable by overseas related practices
of Ernst & Young (Australia) for:
Taxation 15 12 – –
Other services – 38 – –
15 50 – –
Amounts received or due and receivable by non Ernst & Young firms for:
External audit services – 73 – 49
Other services – – – –
– 73 – 49
136
Santos Annual Report 2007
Notes to the Consolidated Financial Statementsfor the year ended 31 December 2007
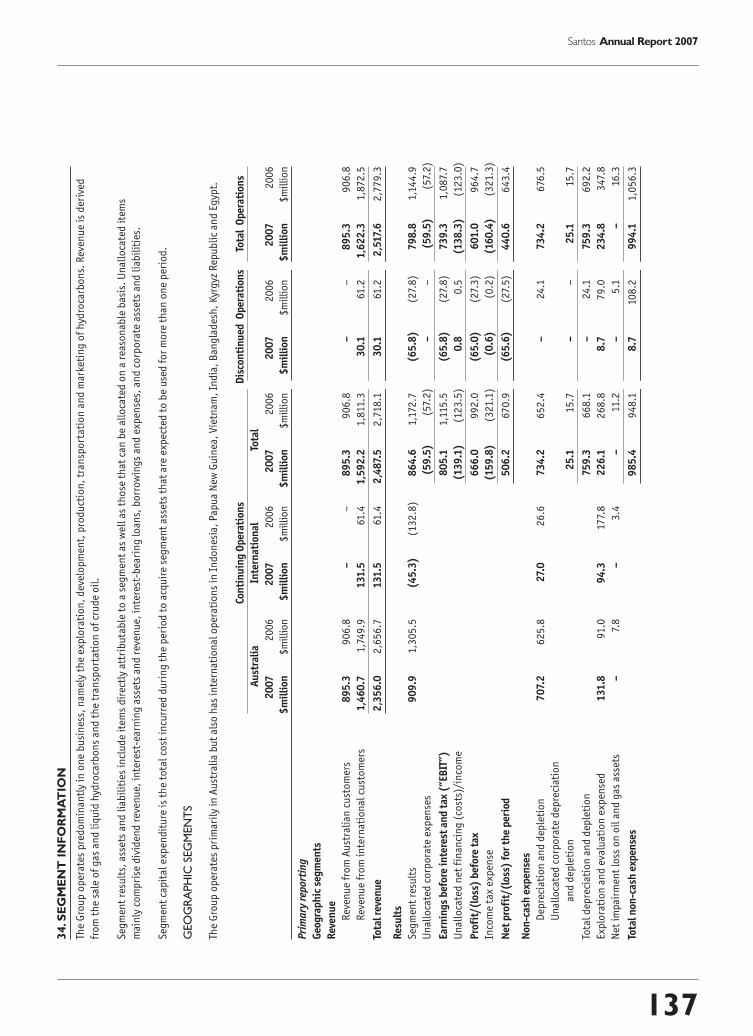
137
Santos Annual Report 2007
34.S
EG
ME
NT
IN
FO
RM
AT
ION
The
Gro
up
op
erat
es p
red
om
inan
tly
in o
ne
bu
sin
ess,
nam
ely
the
exp
lora
tio
n,
dev
elo
pm
ent,
pro
du
ctio
n,
tran
spo
rtat
ion
an
d m
arke
tin
g o
f h
ydro
carb
on
s. R
even
ue
is d
eriv
ed
fro
m t
he
sale
of
gas
an
d l
iqu
id h
ydro
carb
on
s an
d t
he
tran
spo
rtat
ion
of
cru
de
oil
.
Seg
men
t re
sult
s, a
sset
s an
d l
iab
ilit
ies
incl
ud
e it
ems
dir
ectl
y at
trib
uta
ble
to
a s
egm
ent
as w
ell
as t
ho
se t
hat
can
be
allo
cate
d o
n a
rea
son
able
bas
is.
Un
allo
cate
d i
tem
s
mai
nly
co
mp
rise
div
iden
d r
even
ue,
in
tere
st-e
arn
ing
ass
ets
and
rev
enu
e, i
nte
rest
-bea
rin
g l
oan
s, b
orr
ow
ing
s an
d e
xpen
ses,
an
d c
orp
ora
te a
sset
s an
d l
iab
ilit
ies.
Seg
men
t ca
pit
al e
xpen
dit
ure
is
the
tota
l co
st i
ncu
rred
du
rin
g t
he
per
iod
to
acq
uir
e se
gm
ent
asse
ts t
hat
are
exp
ecte
d t
o b
e u
sed
fo
r m
ore
th
an o
ne
per
iod
.
GEO
GR
APH
IC S
EG
MEN
TS
The
Gro
up
op
erat
es p
rim
aril
y in
Au
stra
lia
bu
t al
so h
as i
nte
rnat
ion
al o
per
atio
ns
in I
nd
on
esia
, P
apu
a N
ew G
uin
ea,
Vie
tnam
, In
dia
, B
ang
lad
esh
, K
yrg
yz R
epu
bli
c an
dEg
ypt.
Con
tin
uin
g O
pera
tion
sD
isco
nti
nu
ed O
pera
tion
sTo
tal
Ope
rati
ons
Au
stra
lia
Inte
rnat
ion
alTo
tal
20
072
00
62
007
20
06
20
072
00
62
007
20
06
20
072
00
6
$m
illi
on$
mil
lio
n$
mil
lion
$m
illi
on
$m
illi
on$
mil
lio
n$
mil
lion
$m
illi
on
$m
illi
on$
mil
lio
n
Prim
ary
repo
rtin
g
Geo
grap
hic
seg
men
ts
Rev
enu
e
Rev
enu
e fr
om
Au
stra
lian
cu
sto
mer
s8
95
.39
06
.8–
–8
95
.39
06
.8–
–8
95
.39
06
.8
Rev
enu
e fr
om
in
tern
atio
nal
cu
sto
mer
s1,
46
0.7
1,74
9.9
131.
561
.41,
59
2.2
1,8
11.3
30
.161
.21,
62
2.3
1,8
72.5
Tota
l rev
enu
e2
,35
6.0
2,6
56
.713
1.5
61.4
2,4
87.5
2,7
18
.13
0.1
61.2
2,5
17.6
2,7
79
.3
Res
ult
s
Seg
men
t re
sult
s9
09
.91,
30
5.5
(45
.3)
(13
2.8
)8
64
.61,
172
.7(6
5.8
)(2
7.8
)7
98
.81,
144
.9
Un
allo
cate
d c
orp
ora
te e
xpen
ses
(59
.5)
(57.
2)
––
(59
.5)
(57.
2)
Earn
ings
bef
ore
inte
rest
an
d ta
x (“
EBIT
”)8
05
.11,
115
.5(6
5.8
)(2
7.8
)73
9.3
1,0
87.
7
Un
allo
cate
d n
et f
inan
cin
g (
cost
s)/i
nco
me
(13
9.1
)(1
23
.5)
0.8
0.5
(13
8.3
)(1
23
.0)
Prof
it/(
loss
) be
fore
tax
66
6.0
99
2.0
(65
.0)
(27.
3)
601
.09
64
.7
Inco
me
tax
exp
ense
(15
9.8
)(3
21.
1)
(0.6
)(0
.2)
(16
0.4
)(3
21.
3)
Net
pro
fit/
(los
s) f
or t
he
peri
od5
06
.26
70
.9(6
5.6
)(2
7.5
)4
40
.66
43
.4
Non
-cas
h e
xpen
ses
Dep
reci
atio
n a
nd
dep
leti
on
707
.26
25
.827
.02
6.6
734
.26
52
.4–
24.1
734
.26
76.5
Un
allo
cate
d c
orp
ora
te d
epre
ciat
ion
and
dep
leti
on
25
.11
5.7
––
25
.11
5.7
Tota
l d
epre
ciat
ion
an
d d
eple
tio
n75
9.3
66
8.1
–24
.175
9.3
69
2.2
Exp
lora
tio
n a
nd
eva
luat
ion
exp
ense
d13
1.8
91.0
94
.317
7.8
22
6.1
26
8.8
8.7
79
.02
34
.83
47.8
Net
im
pai
rmen
t lo
ss o
n o
il a
nd
gas
ass
ets
–7.
8–
3.4
–11
.2–
5.1
–16
.3
Tota
l non
-cas
h e
xpen
ses
98
5.4
94
8.1
8.7
108
.29
94
.11,
05
6.3

138
Santos Annual Report 2007
Notes to the Consolidated Financial Statementsfor the year ended 31 December 2007
Con
tin
uin
g O
pera
tion
sD
isco
nti
nu
ed O
pera
tion
sTo
tal O
pera
tion
s
Au
stra
lia
Inte
rnat
ion
alTo
tal
34.S
EG
ME
NT
IN
FO
RM
AT
ION
20
072
00
62
007
20
06
20
072
00
62
007
20
06
20
072
00
6
(CO
NT
INU
ED
)$
mil
lion
$m
illi
on
$m
illi
on$
mil
lio
n$
mil
lion
$m
illi
on
$m
illi
on$
mil
lio
n$
mil
lion
$m
illi
on
Prim
ary
repo
rtin
g (c
onti
nued
)
Geo
grap
hic
seg
men
ts (
con
tin
ued
)
Acq
uis
itio
n o
f n
on-c
urr
ent
asse
ts
Con
tro
lled
en
titi
es12
.4–
77.
010
.58
9.4
10.5
––
89
.410
.5
Oil
an
d g
as a
sset
s, p
rop
erty
, p
lan
t an
d
equ
ipm
ent
1,0
95
.41,
167.
519
3.6
274
.91,
28
9.0
1,4
42
.4–
111.
21,
28
9.0
1,5
53
.6
Un
allo
cate
d c
orp
ora
te a
cqu
isit
ion
of
oil
an
d
gas
ass
ets,
pro
per
ty,
pla
nt
and
eq
uip
men
t4
2.4
59
.1–
–4
2.4
59
.1
Tota
l acq
uis
itio
n o
f n
on-c
urr
ent
asse
ts1,
42
0.8
1,51
2.0
–11
1.2
1,4
20
.81,
62
3.2
Ass
ets
Seg
men
t as
sets
6,0
36
.75
,72
2.0
63
4.5
54
0.7
6,6
71.2
6,2
62
.7–
210
.86
,671
.26
,473
.5
Un
allo
cate
d c
orp
ora
te a
sset
s6
49
.04
29
.4–
–6
49
.04
29
.4
Con
soli
date
d to
tal a
sset
s7,
32
0.2
6,6
92
.1–
210
.87,
32
0.2
6,9
02
.9
Liab
ilit
ies
Seg
men
t li
abil
itie
s1,
718
.91,
42
5.9
149
.824
1.0
1,8
68
.71,
66
6.9
–16
.81,
86
8.7
1,6
83
.7
Un
allo
cate
d c
orp
ora
te l
iab
ilit
ies
2,1
41.0
1,8
63
.7–
–2
,141
.01,
86
3.7
Con
soli
date
d to
tal l
iabi
liti
es4
,00
9.7
3,5
30
.6–
16.8
4,0
09
.73
,547
.4
Seco
nd
ary
rep
orti
ng
Bu
sin
ess
segm
ents
As
des
crib
ed a
bo
ve,
the
Gro
up
op
erat
es p
red
om
inan
tly
in o
ne
bu
sin
ess.
Acc
ord
ing
ly t
her
e ar
e n
o a
dd
itio
nal
bu
sin
ess
seg
men
t d
iscl
osu
res
to b
e m
ade.

139
Santos Annual Report 2007
Consolidated Santos Ltd
2007 2006 2007 2006
35. COMMITMENTS FOR EXPENDITURE $million $million $million $million
The Group has the following commitments for expenditure:
(A) CAPITAL COMMITMENTS
Capital expenditure contracted for at balance date for which no
amounts have been provided in the financial statements, payable:
Not later than one year 324.2 211.4 199.1 107.4
Later than one year but not later than five years 89.0 116.8 53.8 54.4
Later than five years – 3.9 – 1.9
413.2 332.1 252.9 163.7
Santos Ltd has guaranteed the capital commitments of certain
controlled entities (refer note 36 for further details).
(B) MINIMUM EXPLORATION COMMITMENTS
Minimum exploration commitments for which no amounts have been
provided in the financial statements or capital commitments, payable:
Not later than one year 350.1 133.0 46.2 21.9
Later than one year but not later than five years 185.4 74.1 10.6 14.1
Later than five years 29.1 – – –
564.6 207.1 56.8 36.0
The Group has certain obligations to perform minimum exploration
work and expend minimum amounts of money pursuant to the terms
of the granting of petroleum exploration permits in order to maintain
rights of tenure. These commitments may be varied as a result of
renegotiations of the terms of the exploration permits, licences or
contracts or alternatively upon their relinquishment. The minimum
exploration commitments are less than the normal level of exploration
expenditures expected to be undertaken by Santos Ltd and its
controlled entities.
(C) LEASE COMMITMENTS
Non-cancellable operating lease rentals are payable as follows:
Not later than one year 92.2 99.8 38.7 45.8
Later than one year but not later than five years 204.5 266.0 81.1 112.1
Later than five years 52.8 75.0 34.2 39.7
349.5 440.8 154.0 197.6
The Group leases floating production, storage and offtake facilities, floating storage offloading facilities and mobile offshore production
units under operating leases. The leases typically run for a period of four to six years, and may have an option to renew after that date.
The Group also leases building office space and a warehouse under operating leases. The leases are generally for a period of ten years,
with an option to renew the lease after that date. The lease payments typically increase by 5.0% per annum.
During the year ended 31 December 2007 the Group recognised $59.3 million (2006: $73.2 million) as an expense in the income
statement in respect of operating leases.

35. COMMITMENTS FOR EXPENDITURE (CONTINUED)
(D) COMMITMENT ON REMOVAL OF SHARE CAP
Pursuant to a Deed of Undertaking to the Premier of South Australia dated 16 October 2006 and as a consequence of the enactment of the
Santos Limited (Deed of Undertaking) Act 2007 on 29 November 2007, Santos has agreed to:
• continue to make payments under its existing Social Responsibility and Community Benefits Program specified in the Deed totalling
$60.0 million over a ten-year period from the date the legislation was enacted. As at 31 December 2007, approximately $59.4 million
remains to be paid over the next ten years; and
• continue to maintain the South Australian Cooper Basin asset’s Head Office and Operational Headquarters together with other roles
in South Australia for ten years subsequent to the date the legislation was enacted. At 31 December 2007, if this condition had not
been met, the Company would have been liable to pay approximately $100.0 million to the State Government of South Australia.
Santos is required to make these payments only if the State Government of South Australia does not reintroduce a shareholder cap on the
Company’s shares or introduce any other restriction on or in respect of the Company’s Board or senior management which have an adverse
discriminatory effect in their application to the Company relative to other companies domiciled in South Australia.
Consolidated Santos Ltd
2007 2006 2007 2006
$million $million $million $million
(E) REMUNERATION COMMITMENTS
Commitments for the payment of salaries and other remuneration
under the long-term employment contracts in existence at the
reporting date but not recognised in liabilities, payable:
Not later than one year 8.2 3.3 8.2 3.3
Amounts included as remuneration commitments include commitments arising from the service contracts of Directors and executives
referred to in the Remuneration Report of the Directors’ Report that are not recognised as liabilities and are not included in the
compensation of key management personnel.
140
Santos Annual Report 2007
Notes to the Consolidated Financial Statementsfor the year ended 31 December 2007

141
Santos Annual Report 2007
Consolidated Santos Ltd
2007 2006 2007 2006
36. CONTINGENT LIABILITIES $million $million $million $million
The Directors are of the opinion that provisions are not required in
respect of these matters, as it is not that a future sacrifice
of economic benefits will be required or the amount is not capable
of reliable measurement.
Santos Ltd and its controlled entities have the following contingent
liabilities arising in respect of:
The Group:
Performance guarantees 23.2 15.9 10.2 10.1
Actual and possible legal claims and proceedings 12.1 3.0 2.4 2.4
The Group’s share of contingent liabilities of joint venture operations:
Performance guarantees 5.8 5.6 2.9 2.8
Litigation and proceedings – 8.0 – 1.1
41.1 32.5 15.5 16.4
Legal advice in relation to the actual and possible legal claims and proceedings referred to above indicates that on the basis of available
information, any liability in respect of these claims is unlikely to exceed $11.3 million on a consolidated basis.
A number of the Australian interests of the Group are located within areas the subject of one or more claims or applications for native title
determination. Whatever the outcome of those claims or applications, it is not believed that they will significantly impact the Group’s asset
base. Compliance with the “future act” provisions of the Native Title Act 1993 (Cth) can delay the grant of mineral and petroleum tenements
and consequently impact generally the timing of exploration, development and production operations. An assessment of the impact upon the
timing of particular operations may require consideration and determination of complex legal and factual issues.
Guarantees provided by Santos Ltd for borrowings in respect of controlled entities are disclosed in note 20.
Santos Ltd has provided parent company guarantees in respect of:
(a) the funding and performance obligations of a number of subsidiary companies, relating to:
• a floating storage and offloading facilities agreement for the Sampang PSC;
• a mobile offshore production unit agreement for the Madura PSC;
• performance obligations under production sharing contracts; and
(b) a subsidiary company’s obligations to meet distribution charges for gas retail customers.
A subsidiary company has provided a letter of performance guarantee in respect of the performance obligations of its subsidiary company
relating to a production sharing contract.
A subsidiary company has provided a letter of comfort in respect of payment obligations of associated entities.
The total expenditure commitment under these transactions and which are the subject of a parent company guarantee is $236.1 million.

142
Santos Annual Report 2007
Notes to the Consolidated Financial Statementsfor the year ended 31 December 2007
36. CONTINGENT LIABILITIES (CONTINUED)
Sidoarjo mudflow incident
While the Board has made provision in relation to this incident, the provision reflects an assumption that a resolution will ultimately be
reached as between the Government, Lapindo Brantas Inc, the non operating PSC parties (Santos Brantas Pty Ltd (“STOB”) and PT Prakarsa
Brantas) and all other relevant parties as to the costs related to long-term mud management options, proposed costs of infrastructure
relocation and any third party claims. It is also assumed that the present conditions at the site of the incident will remain stable or improve
over the longer term. These assumptions are based upon an updated assessment of information currently available, experience and events
since May 2006 (including the WALHI decision) and progress associated with managing the mudflow.
With the mudflow continuing, the complexity of the incident, and the need to consult with a number of interested parties (both public
and private), the situation remains dynamic. Accordingly, there is continuing uncertainty surrounding the incident and its cost and other
implications for the Group. There remains the possibility that the resolution of these uncertainties may ultimately be on a different basis than
presently assumed, which could result in the ultimate costs to be borne by STOB being significantly different from the current estimate.
Further details of the Sidoarjo mudflow incident are provided in note 3.
37. DEED OF CROSS GUARANTEE
Pursuant to Class Order 98/1418, the wholly-owned subsidiaries listed below are relieved from the Corporations Act 2001 requirements for
preparation, audit and lodgement of their financial reports.
As a condition of the Class Order the Company and each of the listed subsidiaries (“the Closed Group”) entered into a Deed of Cross Guarantee
on 8 December 2006. The effect of the Deed is that the Company has guaranteed to pay any deficiency in the event of winding up of any of the
subsidiaries under certain provisions of the Corporations Act 2001. The subsidiaries have also given a similar guarantee in the event that the
Company is wound up.
The subsidiaries subject to the Deed are:
Alliance Petroleum Australia Pty Ltd
Bridge Oil Developments Pty Limited
Reef Oil Pty Ltd
Santos (BOL) Pty Ltd
Santos Darwin LNG Pty Ltd
Santos Offshore Pty Ltd
Santos Petroleum Management Pty Ltd
Santos Petroleum Pty Ltd
Santos QNT Pty Ltd
Santos QNT (No. 1) Pty Ltd
Santos QNT (No. 2) Pty Ltd
Vamgas Pty Ltd

143
Santos Annual Report 2007
Closed Group
2007 2006
37. DEED OF CROSS GUARANTEE (CONTINUED) $million $million
The consolidated income statement and balance sheet of the entities that are members of the Closed Group are
as follows:
Consolidated income statementProfit before tax 1,121.0 271.8
Income tax expense (103.1) (213.6)
Profit after tax 1,017.9 58.2
Retained earnings at the beginning of the year 1,163.3 1,377.3
Dividends to shareholders (268.6) (268.5)
Share buy-back (231.2) –
Share-based payment transactions 5.2 2.6
Actuarial gain/(loss) on defined benefit plan, net of tax 4.4 (6.3)
Retained earnings at the end of the year 1,691.0 1,163.3
Consolidated balance sheet
Current assetsCash and cash equivalents 60.0 85.7
Trade and other receivables 420.4 336.5
Inventories 215.7 134.7
Other 5.6 17.8
Total current assets 701.7 574.7
Non-current assetsReceivables 61.5 390.0
Exploration and evaluation assets 169.7 28.4
Oil and gas assets 3,730.2 3,825.1
Other land, buildings, plant and equipment 102.9 117.2
Other investments 2,672.8 2,038.2
Deferred tax assets 8.0 16.2
Other 5.9 9.0
Total non-current assets 6,751.0 6,424.1
Total assets 7,452.7 6,998.8
Current liabilitiesTrade and other payables 433.3 708.7
Deferred income 12.0 6.3
Current tax liabilities 28.7 208.1
Provisions 43.2 66.9
Total current liabilities 517.2 990.0
Non-current liabilitiesDeferred income 8.8 11.3
Interest-bearing loans and borrowings 2,294.8 1,922.4
Deferred tax liabilities 149.7 186.1
Provisions 463.0 464.8
Total non-current liabilities 2,916.3 2,584.6
Total liabilities 3,433.5 3,574.6
Net assets 4,019.2 3,424.2
EquityIssued capital 2,331.6 2,254.4
Reserves (3.4) 6.5
Retained earnings 1,691.0 1,163.3
Total equity 4,019.2 3,424.2
38. FINANCIAL RISK MANAGEMENT
Exposure to foreign currency risk, interest rate risk, commodity price risk, credit risk, and liquidity risk arises in the normal course of the
Group’s business. The Group’s overall financial risk management strategy is to seek to ensure that the Group is able to fund its business plans.
Derivative financial instruments may be used to hedge exposure to fluctuations in foreign exchange rates, interest rates, and commodity prices.
The Group uses various methods to measure the types of risk to which it is exposed. These methods include Cash Flow at Risk analysis in the
case of interest rate, foreign exchange and commodity price risk, and ageing analysis for credit risk.
Financial risk management is carried out by a central treasury department (“Treasury”) under policies approved by the Board of Directors.
The Board provides written principles for overall risk management, as well as policies covering specific areas, such as foreign exchange risk,
interest rate risk and credit risk, use of derivative financial instruments and non-derivative financial instruments, and investment of
excess liquidity.
(A) FOREIGN CURRENCY RISK
Foreign exchange risk arises from commercial transactions and recognised assets and liabilities that are denominated in a currency that is
not the entity’s functional currency. The risk is measured using cash flow forecasting and Cash Flow at Risk analysis.
The Group is exposed to foreign currency risk principally through the sale of liquid petroleum products denominated in US dollars,
US dollar borrowings and US dollar expenditure. In order to hedge this foreign currency risk, the Group has from time to time entered into
forward foreign exchange, foreign currency swap and foreign currency option contracts.
All US dollar denominated borrowings are either designated as a hedge of US dollar denominated investments in foreign operations
(2007: US$1,199.6 million; 2006: US$825.6 million) or swapped using cross-currency swaps to Australian dollars. As a result, there were
no net foreign currency gains or losses arising from translation of US denominated dollar borrowings recognised in the income statements
in 2007.
The Group’s risk management policy is to hedge between 0% and 50% of forecasted cash flows in US dollars for the current financial year.
The following table demonstrates the estimated sensitivity to a 10% increase/decrease in the US dollar exchange rate, with all other
variables held constant, on post-tax profit and equity.
Consolidated Santos Ltd
2007 2006 2007 2006
$million $million $million $million
Impact on post-tax profit:
AUD/USD +10% (84.8) (99.8) – –
AUD/USD –10% 103.6 122.0 – –
Impact on equity:
AUD/USD +10% (120.7) (137.4) – –
AUD/USD –10% 139.6 159.5 – –
(B) MARKET RISK
Cash flow and fair value interest rate risk
The Group’s main interest rate risk arises from long-term borrowings. Borrowings issued at variable rates expose the Group to cash flow
interest rate risk. Borrowings issued at fixed rates expose the Group to fair value interest rate risk.
The Group adopts a policy of ensuring that the majority of its exposure to changes in interest rates on borrowings is on a floating rate
basis. Interest rate swaps, denominated in Australian dollars and US dollars, have been entered into as fair value hedges of medium-term
notes and long-term notes respectively. The swaps have maturities ranging from one to twenty years, aligned with the maturity of the
related notes. At 31 December 2007, the Group had interest rate swaps with a notional contract amount of $1,067.7 million
(2006: $615.4 million).
144
Santos Annual Report 2007
Notes to the Consolidated Financial Statementsfor the year ended 31 December 2007

145
Santos Annual Report 2007
38. FINANCIAL RISK MANAGEMENT (CONTINUED)
(B) MARKET RISK (CONTINUED)
The net fair value of swaps at 31 December 2007 was $67.3 million (2006: $10.6 million), comprising assets of $77.2 million and liabilities
of $9.9 million. These amounts were recognised as fair value derivatives.
Based upon the average balance of gross debt during the year, if interest rates changed by +/–1%, with all other variables held constant,
the estimated impact on post-tax profit and equity would have been:
Consolidated Santos Ltd
2007 2006 2007 2006
$million $million $million $million
Impact on post-tax profit:
Interest rates +1% (11.7) (10.6) – –
Interest rates –1% 11.7 10.6 – –
Impact on equity:
Interest rates +1% (11.7) (10.6) – –
Interest rates –1% 11.7 10.6 – –
Commodity price risk exposure
The Group is exposed to commodity price fluctuations through the sale of petroleum products denominated in US dollars. The Group may
enter into commodity crude oil price swap and option contracts to manage its commodity price risk.
At 31 December 2007 the Group has no open oil price swap contracts (2006: nil).
If the US dollar oil price changed by +/–10% from the average oil price during the year, with all other variables held constant, the
estimated impact on post-tax profit and equity would have been:
Consolidated Santos Ltd
2007 2006 2007 2006
$million $million $million $million
Impact on post-tax profit:
US dollar oil price +10% 116.6 129.8 – –
US dollar oil price –10% (116.6) (129.8) – –
Impact on equity:
US dollar oil price +10% 116.6 129.8 – –
US dollar oil price –10% (116.6) (129.8) – –

38. FINANCIAL RISK MANAGEMENT (CONTINUED)
(C) CREDIT RISK
Credit risk arises from cash and cash equivalents, derivative financial instruments and deposits with banks and financial institutions,
as well as credit exposures to customers, including outstanding receivables and committed transactions, and represents the potential
financial loss if counterparties fail to perform as contracted. Management has credit policies in place and the exposure to credit risk is
monitored on an ongoing basis. The majority of Santos’ gas contracts are spread across major Australian energy retailers and industrial
users. Contracts exist in every mainland state whilst the largest customer accounts for less than 20% of contracted gas.
The Group controls credit risk by setting minimum creditworthiness requirements of counterparties, which for banks and financial
institutions is a Standard & Poor’s rating of A or better. If customers are independently rated these ratings are used, otherwise the credit
quality of the customer is assessed by taking into account its financial position, past experience and other factors including credit
support from a third party. Individual risk limits for banks and financial institutions are set based on external ratings in accordance with
limits set by the Board. Limits for customers are determined within contract terms. The daily nomination of gas demand by customers and
the utilisation of credit limits by customers is monitored by line management.
In addition, receivables balances are monitored on an ongoing basis with the result that the Group’s exposure to bad debts is not
significant. The Group does not hold collateral, nor does it securitise its trade and other receivables.
At the balance sheet date there were no significant concentrations of credit risk within the Group and financial instruments are spread
amongst a number of financial institutions to minimise the risk of default by counterparties.
The maximum exposure to credit risk is represented by the carrying amount of financial assets of the Group, excluding investments,
which have been recognised on the balance sheet.
(D) LIQUIDITY RISK
Prudent liquidity risk management implies maintaining sufficient cash and marketable securities, the availability of funding through an
adequate amount of committed credit facilities and the ability to close out market positions. The Group aims at maintaining flexibility in
funding to meet ongoing operational requirements, exploration and development expenditure, and small-to-medium-sized opportunistic
projects and investments, by keeping committed credit facilities available.
146
Santos Annual Report 2007
Notes to the Consolidated Financial Statementsfor the year ended 31 December 2007

147
Santos Annual Report 2007
38. FINANCIAL RISK MANAGEMENT (CONTINUED)
(D) LIQUIDITY RISK (CONTINUED)
The following table analyses the contractual maturities of the Group’s financial liabilities into relevant maturity groupings based on
the remaining period at the reporting date to the contractual maturity date. The amounts disclosed in the table are the contractual
undiscounted cash flows comprising principal and interest repayments, except for interest rate swaps. Estimated variable interest expense is
based upon appropriate yield curves existing as at 31 December 2007.
Less than 1 to 2 2 to 5 More than
1 year years years 5 years
$million $million $million $million
Consolidated
2007
Non-derivative financial liabilities
Trade and other payables 661.4 – – –
Bank loans 41.1 40.8 259.2 133.7
Commercial paper 65.0 – – –
Medium-term notes 27.8 6.5 19.6 469.5
Long-term notes 75.2 111.7 502.9 1,151.4
Derivative financial liabilities
Interest rate swaps (9.5) (21.3) (31.9) (27.0)
861.0 137.7 749.8 1,727.6
2006
Non-derivative financial liabilities
Trade and other payables 441.8 – – –
Bank loans 47.1 34.3 159.2 140.6
Commercial paper 130.0 – – –
Medium-term notes 7.6 27.8 19.5 475.9
Long-term notes 183.3 42.4 298.2 541.6
Derivative financial liabilities
Interest rate swaps (0.8) (2.6) (8.2) (1.8)
809.0 101.9 468.7 1,156.3
Santos Ltd
2007
Trade and other payables 642.9 – – –
Amounts owing to controlled entities – – – 2,478.2
642.9 – – 2,478.2
2006
Trade and other payables 562.9 – – –
Amounts owing to controlled entities – – – 2,583.6
562.9 – – 2,583.6
Amounts owing to controlled entities are shown at their carrying value as any interest charged on the loans is added to the loan balance.
The loans are made in the ordinary course of business on normal market terms and conditions and are not repayable for a minimum of
nine years.
38. FINANCIAL RISK MANAGEMENT (CONTINUED)
(E) FAIR VALUES
The financial assets and liabilities of the Group and the Company are recognised on the balance sheets at their fair value in accordance
with the accounting policies in note 1, except for long-term notes that do not form part of an interest rate swap, and bank borrowings,
which are recognised at face value. The carrying value of these long-term notes is US$156.5 million and their fair value is estimated at
US$163.3 million based on discounting the future cash flows excluding the credit spread at the time of issue. The discount rate used is the
interest rate swap rate for the remaining term to maturity of the note as at 31 December 2007.
The carrying value of the bank borrowings approximates fair value as it is a floating rate instrument.
Basis for determining fair values
The following summarises the significant methods and assumptions used in estimating the fair values of financial instruments:
Trade and other receivables
The carrying value less impairment provision of trade receivables is a reasonable approximation of their fair values due to the short-
term nature of trade receivables.
Available-for-sale financial assets
The fair value of available-for-sale financial assets is determined by reference to their quoted bid price at the reporting date.
Derivatives
The fair value of interest rate swaps is calculated by discounting estimated future cash flows based on the terms of maturity of each
contract and using market interest rates for a similar instrument at the reporting date. Where these cash flows are in a foreign
currency the present value is converted to Australian dollars at the foreign exchange spot rate prevailing at reporting date.
Financial liabilities
Fair value is calculated based on the present value of future principal and interest cash flows, discounted at the market rate of
interest at the reporting date. Where these cash flows are in a foreign currency the present value is converted to Australian dollars at
the foreign exchange spot rate prevailing at reporting date.
Interest rates used for determining fair value
The interest rates used to discount estimated future cash flows, where applicable, are based on the market yield curve at the reporting
date. The dealt credit spread is assumed to be the same as the market rate for the credit as at reporting date as allowed under AASB 139
Financial Instruments: Recognition and Measurement. The interest rates including credit spreads used to determined fair value were as
follows:
2007 2006
Derivatives 5.4% – 7.8% 6.2% – 7.0%
Loans and borrowings 5.8% – 9.1% 6.1% – 9.0%
148
Santos Annual Report 2007
Notes to the Consolidated Financial Statementsfor the year ended 31 December 2007
149
Santos Annual Report 2007
Directors’ Declarationfor the year ended 31 December 2007
In accordance with a resolution of the Directors of Santos Ltd (“the Company”), we state that:
1. In the opinion of the Directors:
(a) the financial statements and notes of the Company and of the consolidated entity are in accordance with the Corporations Act 2001,
including:
(i) giving a true and fair view of the Company's and consolidated entity's financial position as at 31 December 2007 and of their
performance for the year ended on that date; and
(ii) complying with Accounting Standards and the Corporations Regulations 2001; and
(b) there are reasonable grounds to believe that the Company will be able to pay its debts as and when they become due and payable.
2. This declaration has been made after receiving the declarations required to be made to the Directors in accordance with section 295A of
the Corporations Act 2001 for the financial year ending 31 December 2007.
3. As at the date of this declaration, there are reasonable grounds to believe that the members of the Closed Group identified in note 37 will
be able to meet any obligations or liabilities to which they are or may become subject, by virtue of the Deed of Cross Guarantee between
the Company and those members of the Closed Group pursuant to Class Order 98/1418.
Dated this 21st day of February 2008
On behalf of the Board:
Director Director
Adelaide

150
Santos Annual Report 2007
Auditor’s Independence Declaration to the Directors of Santos Ltd
In relation to our audit of the financial report of Santos Ltd for the financial year ended 31 December 2007, to the best of my knowledge and
belief, there have been no contraventions of the auditor independence requirements of the Corporations Act 2001 or any applicable code of
professional conduct.
Ernst & Young R J Curtin
Partner
Adelaide, South Australia
21 February 2008

151
Santos Annual Report 2007
Independent Audit Report
TO THE MEMBERS OF SANTOS LTD
We have audited the accompanying financial report of Santos Ltd,
which comprises the balance sheet as at 31 December 2007, and the
income statement, cash flow statement and statement of recognised
income and expense for the year ended on that date, a summary of
significant accounting policies, other explanatory notes and the
directors’ declaration of the consolidated entity comprising the
company and the entities it controlled at the year’s end or from time
to time during the financial year.
DIRECTORS’ RESPONSIBILITY FOR THE FINANCIAL REPORT
The Directors of the company are responsible for the preparation and
fair presentation of the financial report in accordance with the
Australian Accounting Standards (including the Australian
Accounting Interpretations) and the Corporations Act 2001. This
responsibility includes establishing and maintaining internal controls
relevant to the preparation and fair presentation of the financial
report that is free from material misstatement, whether due to fraud
or error; selecting and applying appropriate accounting policies; and
making accounting estimates that are reasonable in the
circumstances. In note 1(A), the Directors also state that the
financial report, comprising the financial statements and notes
comply with International Financial Reporting Standards.
AUDITOR’S RESPONSIBILITY
Our responsibility is to express an opinion on the financial report
based on our audit. We conducted our audit in accordance with
Australian Auditing Standards. These Auditing Standards require that
we comply with relevant ethical requirements relating to audit
engagements and plan and perform the audit to obtain reasonable
assurance whether the financial report is free from material
misstatement.
An audit involves performing procedures to obtain audit evidence
about the amounts and disclosures in the financial report. The
procedures selected depend on our judgement, including the
assessment of the risks of material misstatement of the financial
report, whether due to fraud or error. In making those risk
assessments, we consider internal controls relevant to the entity’s
preparation and fair presentation of the financial report in order to
design audit procedures that are appropriate in the circumstances,
but not for the purpose of expressing an opinion on the effectiveness
of the entity’s internal controls. An audit also includes evaluating the
appropriateness of accounting policies used and the reasonableness
of accounting estimates made by the Directors, as well as evaluating
the overall presentation of the financial report.
We believe that the audit evidence we have obtained is sufficient and
appropriate to provide a basis for our audit opinion.
INDEPENDENCE
In conducting our audit we have met the independence requirements
of the Corporations Act 2001. We have given to the Directors of the
company a written Auditor’s Independence Declaration, signed on
21 February 2008. In addition to our audit of the financial report, we
were engaged to undertake the services disclosed in the notes to the
financial statements. The provision of these services has not impaired
our independence.
AUDITOR’S OPINION
In our opinion:
1. the financial report of Santos Ltd is in accordance with the
Corporations Act 2001, including:
(i) giving a true and fair view of the financial position of Santos
Ltd and the consolidated entity at 31 December 2007 and of
their performance for the year ended on that date; and
(ii) complying with Australian Accounting Standards (including
the Australian Accounting Interpretations) and the
Corporations Regulations 2001.
2. the financial report also complies with International Financial
Reporting Standards as disclosed in note 1(A).
Ernst & Young RJ Curtin
Partner
Adelaide
21 February 2008

152
Santos Annual Report 2007
Listed on Australian Securities Exchange at 29 February 2008 were 585,810,959 fully paid ordinary shares and 6,000,000 redeemable
convertible preference shares. Unlisted were 46,500 partly paid Plan 0 shares, 41,500 partly paid Plan 2 shares, 400 fully paid ordinary shares
issued pursuant to the Santos Employee Share Purchase Plan (SESPP) for General Employee Participation, 75,746 fully paid ordinary shares
issued pursuant to SESPP for Senior Executive Long Term Incentive (LTI), 187,150 restricted fully paid ordinary shares issued pursuant to the
vesting of LTI Share Acquisition Rights and 14,847 fully paid ordinary shares issued pursuant to the Non-executive Director Share Plan. There
were: 76,812 holders of all classes of issued ordinary shares (including 6 holders of Plan 0 shares; 5 holders of Plan 2 shares; 4 holders of
SESPP shares; and 13 holders of restricted shares) compared with 82,862 a year earlier; 14,455 holders of redeemable convertible preference
shares; and 46 holders of the 4,199,378 options granted pursuant to the Santos Executive Share Option Plan and 68 holders of 1,123,400
Share Acquisition Rights.
The listed issued ordinary shares plus the ordinary shares issued pursuant to SESPP and the restricted ordinary shares issued pursuant to the
vesting of LTI Share Acquisition Rights represent all of the voting power in Santos. The holdings of the 20 largest holders of ordinary shares
represent 57.26% of the total voting power in Santos (last year 53.30%) and the holdings of the 20 largest holders of redeemable convertible
preference shares represent 36.37% of the issued redeemable convertible preference shares.
The 20 largest shareholders of fully paid ordinary shares in Santos as shown in the Company’s Register of Members at 29 February 2008 were:
Name Number of fully paid ordinary shares %
National Nominees Limited 92,999,815 15.88
HSBC Custody Nominees (Australia) Limited 76,495,136 13.06
JP Morgan Nominees Australia Limited 57,481,193 9.81
ANZ Nominees Limited (Cash Income A/c) 32,294,311 5.51
Citicorp Nominees Pty Limited 19,668,014 3.36
ANZ Nominees Limited (Income Reinvest Plan A/c) 16,028,265 2.74
Cogent Nominees Pty Limited 6,098,512 1.04
Australian Foundation Investment Company Limited 4,489,289 0.77
HSBC Custody Nominees (Australia) Limited – A/c 2 4,481,300 0.76
AMP Life Limited 4,231,941 0.72
Mr John Charles Ellice-Flint 3,000,000 0.51
Argo Investments Limited 2,650,000 0.45
HSBC Custody Nominees (Australia) Limited – GSI ECSA 2,469,289 0.42
RBC Dexia Investor Services Australia Nominees Pty Limited 2,435,913 0.42
UBS Nominees Pty Ltd 2,233,973 0.38
Queensland Investment Corporation 2,070,053 0.35
Merrill Lynch (Australia) Nominees Pty Limited 1,794,338 0.31
Djerriwarrh Investments Limited 1,664,915 0.28
Cogent Nominees Pty Limited (SMP Accounts) 1,618,848 0.28
Australian Reward Investment Alliance 1,230,630 0.21
Total 335,435,735 57.26
ANALYSIS OF SHARES – RANGE OF SHARES HELD
Redeemable
Fully paid convertible
ordinary % of preference % of
shares % of shares shares % of shares
(holders) holders held (holders) holders held
1 - 1,000 29,062 37.84 2.72 13,989 96.77 45.55
1,001 – 5,000 38,083 49.58 15.33 412 2.85 13.39
5,001 – 10,000 6,380 8.30 7.76 27 0.19 3.22
10,001 – 100,000 3,158 4.11 11.12 21 0.15 10.71
100,001 and over 129 0.17 63.07 6 0.04 27.13
Total 76,812 100.00 100.00 14,455 100.00 100.00
Less than a marketable parcel of $500 1,278 8
Securities exchange and shareholder information

153
Santos Annual Report 2007
The 20 largest shareholders of redeemable convertible preference shares in Santos as shown in the Company’s Register of Members at
29 February 2008 were:
Number of redeemable
Name convertible preference shares %
JP Morgan Nominees Australia Limited 761,487 12.69
HSBC Custody Nominees (Australia) Limited 209,030 3.48
ANZ Nominees Limited (Cash Income A/c) 188,549 3.14
RBC Dexia Investor Services Australia Nominees Pty Limited (GSENIP A/C) 179,304 2.99
Australian Foundation Investment Company Limited 175,000 2.92
Cogent Nominees Pty Limited (SMP Accounts) 114,634 1.91
UBS Wealth Management Australia Nominees Pty Ltd 76,192 1.27
Hastings Funds Management Limited (Hasting Yield Fund A/c) 70,000 1.17
M F Custodians Ltd 68,562 1.14
RBC Dexia Investor Services Australia Nominees Pty Limited (MLCI A/c) 57,369 0.96
Goldman Sachs JBWere Capital Markets Ltd (Hybrid Portfolio A/c) 46,241 0.77
Citicorp Nominees Pty Limited 42,861 0.71
Questor Financial Serivces Limited (TPS RF A/c) 35,999 0.60
Cambooya Pty Limited 29,950 0.50
Cogent Nominees Pty Limited 27,337 0.46
Australian Executor Trustees Limited (No 1 Account) 22,618 0.38
Merrill Lynch (Australia) Nominees Pty Limited 20,209 0.34
Argo Investments Limited 20,000 0.33
Tallen Pty Ltd 20,000 0.33
ANZ Trustees Limited (Franked Income CF1 A/c) 16,885 0.28
Total 2,182,227 36.37
Substantial Shareholders, as at 29 February 2008, as disclosed by notices received by the Company:
Name No of voting shares held
Barclays Global Investors Australia Limited 43,275,199
For Directors’ Shareholdings see the Directors’ Statutory Report as set out on page 51 of this Annual Report.
VOTING RIGHTS
Every member present in person or by an attorney, a proxy or a representative shall on a show of hands, have one vote and upon a poll, one
vote for every fully paid ordinary share held. Pursuant to the Rules of the Santos Executive Share Plan, Plan 2 and Plan 0 shares do not carry
any voting rights except on a proposal to vary the rights attached to Plan shares.
Holders of redeemable convertible preference shares (Preference Shares) do not have voting rights at any general meeting of the company
except in the following circumstances:
(a) on a proposal:
(1) to reduce the share capital of the Company;
(2) that affects rights attached to the Preference Shares;
(3) to wind up the Company; or
(4) for the disposal of the whole of the property, business and undertaking of the Company;
(b) on a resolution to approve the terms of a buy-back agreement;
(c) during a period in which a dividend or part of a dividend on the Preference Shares is in arrears; or
(d) during the winding up of the Company.

154
Santos Annual Report 2007
AIFRS
Australian equivalents to InternationalFinancial Reporting Standards.
BARREL/bbl
The standard unit of measurement for all production and sales. One barrel = 159 litres or 35 imperial gallons.
bcf
Billion cubic feet, a billion defined as 109, on average 1 bcf of sales gas = 1.055 PJ.
boe
Barrels of oil equivalent. The factor used by Santos to convert volumes of different hydrocarbon production to barrels of oil equivalent.
bopd
Barrels of oil per day.
THE COMPANY OR SANTOS
Santos Ltd and its subsidiaries.
CONDENSATE
A natural gas liquid that occurs in associationwith natural gas and is mainly composed ofpropane, butane, pentane and heavierhydrocarbon fractions.
CONTINGENT RESOURCES
Those quantities of hydrocarbons which areestimated, on a given date, to be potentiallyrecoverable from known accumulations, butwhich are not currently considered to becommercially recoverable. Contingentresources may be of a significant size, but still have constraints to development.These constraints, preventing the booking of reserves, may relate to lack of gasmarketing arrangements or to technical,environmental or political barriers.
CRUDE OIL
A general term for unrefined liquid petroleumor hydrocarbons.
CULTURAL HERITAGE
Definitions of cultural heritage are highlyvaried. Cultural heritage can be considered to include property (‘things’ such aslandscapes, places, structures, artefacts andarchives) or a social, intellectual or spiritualinheritance.
DELINEATION WELL
Comprises two categories: near-fieldexploration wells and appraisal wells. Near-field exploration wells are wells locatednear existing fields/discoveries and have ahigher expectation of success than wildcatexploration wells. These wells testindependent structures or traps and have a higher risk of failure than appraisal ordevelopment wells. An appraisal well is a well drilled for the purpose of identifyingextensions to known fields or discoveries.
DEVELOPMENT WELL
Wells designed to produce hydrocarbons froma gas or oil field within a proven productivereservoir defined by exploration or appraisaldrilling.
EBIT
Earnings before interest and tax.
EBITDAX
Earnings before interest, tax, depreciation,depletion, exploration and impairment.
EXPLORATION
Drilling, seismic or technical studiesundertaken to identify and evaluate regionsor prospects with the potential to containhydrocarbons.
FINDING COST PER BARREL OF OIL EQUIVALENT
Exploration and delineation expenditure per annum divided by reserve additions net of acquisitions and divestments.
GEOSCIENCE
Scientific disciplines related to the study of the earth.
GREENHOUSE EFFECT
The trapping of heat by certain gases in the earth’s atmosphere in the same way that the glass in a greenhouse prevents heat from escaping and warms its internal environment.
GREENHOUSE GAS
A gas that contributes to the greenhouseeffect by absorbing infrared radiation.
HYDROCARBONS
Solid, liquid or gas compounds of theelements hydrogen and carbon.
IFRS
International Financial Reporting Standards.
LIQUIDS
A sales product in liquid form produced as aresult of further processing by the onshoreplant; for example, condensate and LPG.
LNG
Liquefied natural gas.
LPG
Liquefied petroleum gas, the name given to propane and butane in their liquid state.
MARKET CAPITALISATION
A measurement of a company’s stock marketvalue at a given date. Market capitalisation iscalculated as the number of shares on issuemultiplied by the closing share price on thatgiven date.
mbbl
Thousand barrels.
MEAN RESOURCE POTENTIAL
The average of the range of recoverableresources.
mmbbl
Million barrels.
mmboe
Million barrels of oil equivalent.
mmscf/d
Million standard cubic feet per day.
NETBACK
Total product sales revenue less operating costs (namely production costs, tariffs/tolls, royalties, PRRT and gas purchases and movement in stock). Netback per boe is netback divided by total sales volumes.
OIL
A mixture of liquid hydrocarbons of differentmolecular weights.
Glossary

155
Santos Annual Report 2007
PETROLEUM LIQUIDS
Crude oil, condensate, or its derivative naphtha, and the liquefied petroleum gases propane and butane.
PJ
Petajoules are the metric measurement unit for energy. A petajoule is equal to 1 joule x 1015. The equivalent imperialmeasure to joules is British Thermal Units (BTU). One kilojoule = 0.9478 BTU.
PROVEN RESERVES (1P)
Proven reserves (1P) are those reserves that, to a high degree of certainty (90%confidence), are recoverable. There isrelatively little risk associated with thesereserves. Proven developed reserves arereserves that can be recovered from existingwells with existing infrastructure andoperating methods. Proven undevelopedreserves require development.
PROVEN PLUS PROBABLE RESERVES (2P)
Proven plus Probable reserves (2P) are thosereserves that analysis of geological andengineering data suggests are more likelythan not to be recoverable. There is at least a 50% probability that reserves recovered will exceed Proven plus Probable reserves.
PROVEN, PROBABLE PLUSPOSSIBLE RESERVES (3P)
Proven, Probable plus Possible reserves (3P)are those reserves that, to a low degree ofcertainty (10% confidence), are recoverable.There is relatively high risk associated withthese reserves.
PSC
Production sharing contract.
RESERVE REPLACEMENT COST PER BARREL OF OIL EQUIVALENT
Exploration, delineation and developmentexpenditure per annum divided by reserveadditions net of acquisitions and divestments.Development includes all development andfixed asset expenditure net of stay-in-business and corporate capital expenditure.
RESERVE REPLACEMENT RATIO
Reserves added during the reporting perioddivided by the production over the sameperiod, reported as a percentage.
RESOURCE POTENTIAL
Resource potential refers to those quantitiesof petroleum yet to be discovered. It mayrefer to single opportunities or a group of opportunities.
ROAE
Return on average equity.
ROACE
Return on average capital employed.
SEISMIC SURVEY
Data used to gain an understanding of rock formations beneath the earth’ssurface using reflected sound waves.
tcf
Trillion cubic feet.
TJ
Terajoules are the metric measurement unit for energy. A terajoule is equal to 1 joule x 1012.
TOTAL RECORDABLE CASEFREQUENCY RATE (TRCFR)
A statistical measure of safety performance.Total recordable case frequency rate iscalculated as the total number of recordablecases (medical treatment injuries and losttime injuries) per million hours worked. A lost time injury is a work-related injury or illness that results, or would result, in a permanent disability or time lost of onecomplete shift or day or more any time afterthe injury or illness. A medical treatmentinjury is a work-related injury or illness,other than a lost time injury, where the injury is serious enough to require more than minor first aid treatment. Santosclassifies injuries that result in modifiedduties as medical treatment injuries.
WILDCAT EXPLORATION
Exploration wells testing new play conceptsor structures distanced from current fields.
PAPER AND PRINTING OF THEANNUAL REPORT
This report is printed on Monza Recycled andOzone Offset paper, which contains elementalchlorine-free (ECF) recycled fibre and fibrefrom sustainable plantation forests.
The paper is certified by the ForestStewardship Council (FSC), which promotes environmentally appropriate,socially beneficial, and economically viable management of the world’s forests.
The report was printed by Vega Press, one of a small number of printers in Australiacertified by the FSC to continue the chain ofcustody when printing on FSC-certified paper.Vega Press is certified for ISO 14001:2004(Environmental Management Systems).
The printing process uses digital printingplates which eliminate film and associatedchemicals. The vegetable-based inks userenewable sources such as flax, rather thanthe traditional mineral oils which emit highervolumes of greenhouse gases.
CONVERSION
crude oil 1 barrel = 1 boe
sales gas 1 petajoule = 171,937 boe
condensate/naphtha 1 barrel = 0.935 boe
LPG 1 tonne = 8.458 boe
For a comprehensive online conversion
calculator tool, visit the Santos website,
www.santos.com.

156
Santos Annual Report 2007
Information for shareholders
NOTICE OF MEETING
The Annual General Meeting of Santos Ltd will be held in the Festival
Theatre at Adelaide Festival Centre, King William Road, Adelaide, South
Australia on Friday 2 May 2008 at 10:00 am.
FINAL DIVIDEND
The 2007 final ordinary dividend will be paid on 31 March 2008 to
shareholders registered in the books of the Company at the close of
business on 3 March 2008 in respect of fully paid shares held at record
date.
SECURITIES EXCHANGE LISTING
Santos Ltd. Incorporated in Adelaide, South Australia, on 18 March 1954.
Quoted on the official list of the Australian Securities Exchange (ordinary
shares code STO; FUELS code STOPB).
AMERICAN DEPOSITORY RECEIPTS
Santos American Depository Receipts are issued by Citibank, N.A. and
are listed on NASDAQ (code STOSY).
DIRECTORS
S Gerlach (Chairman), J C Ellice-Flint (Managing Director), K C Borda,
K A Dean, R A Franklin, R M Harding, J Sloan.
SECRETARY
J L Baulderstone
CHANGE OF SHAREHOLDER DETAILS
Issuer Sponsored Shareholders wishing to update their details must notify
the Share Registrar in writing. The relevant shareholder forms can be
obtained from the Share Registrar or via the Investor Centre on the Santos
website, www.santos.com.
Forms are available to advise the Company of changes relating to change
of address, direct crediting of dividends, Tax File Number and Australian
Business Number, Annual Report and Sustainability Report mailing
preferences and Dividend Reinvestment Plan participation.
INVESTOR INFORMATION AND SERVICES
SANTOS WEBSITE
A wide range of information for investors is available from Santos’
website, www.santos.com, including Annual Reports, Full Year and Interim
Reports and Presentations, News Announcements, Quarterly Activities
Reports and Current Well Information.
Comprehensive archives of these materials dating back to 1997 are
available on the Santos website.
Other investor information available on the Santos website includes:
• webcasts of investor briefings;
• an email alert facility where people can register to be notified, free
of charge, of Santos’ News Announcements via email; and
• an RSS feed of Santos’ News Announcements, which allows people
to view these announcements using RSS reader software.
The Santos website provides shareholder forms to help shareholders
manage their holdings, as well as a full history of Santos’ dividend
payments and equity issues. Shareholders can also check their holdings
and payment history in the secure View Shareholding section.
Santos’ website also provides an online Conversion Calculator, which
instantly computes equivalent values of the most common units of
measurement in the oil and gas industry.
PUBLICATIONS
The Annual Report, First-Half Report and the Sustainability Report are the
major sources of printed information about Santos. A brief Shareholder
Update was mailed to shareholders who had not elected to receive a 2007
Annual Report. Printed copies of the reports are available from the Share
Register or Investor Relations.
SHAREHOLDER ENQUIRIES
Enquiries about shareholdings should be directed to:
Share Register, Santos Ltd, GPO Box 2455,
Adelaide, South Australia 5001.
Telephone: 08 8116 5000.
Email: [email protected]
Investor information, other than that relating to a shareholding,
can be obtained from:
Investor Relations, Santos Ltd, GPO Box 2455,
Adelaide, South Australia 5001.
Telephone: 08 8116 5000.
Email: [email protected]
Electronic enquiries can also be submitted through the Contact Us section
of the Santos website, www.santos.com.
SHAREHOLDERS’ CALENDAR
2007 Full Year Results announcement 21 February 2008
Ex-dividend date for 2007 full year dividend 26 February 2008
Record date for 2007 full year dividend 3 March 2008
Payment date for 2007 full year dividend 31 March 2008
Annual General Meeting 2 May 2008
2008 Interim Results announcement 21 August 2008
Ex-dividend date for 2008 interim dividend 27 August 2008
Record date for 2008 interim dividend 2 September 2008
Payment date for 2008 interim dividend 30 September 2008
Full year end 31 December 2008
QUARTERLY REPORTING CALENDAR
2008 First Quarter Activities Report 23 April 2008
2008 Second Quarter Activities Report 24 July 2008
2008 Third Quarter Activities Report 23 October 2008
2008 Fourth Quarter Activities Report 22 January 2009

AAnnouncements: 2007 9
Annual General Meeting 156
Audit Committee 40, 42, 52, 54
Audit Report 151
Australian Business & Climate Group 6, 29
BBalance Sheets 71
Bangladesh 3, 4, 5, 10–11, 23
Basins 10–11
Bayu-Undan 8, 11
Board of Directors 32–33
CCarbon storage 7, 19
Cash Flow Statements 72
Casino 11, 17
Chairman’s review 4
Chief Executive Officer’s review 5–7
Chief Financial Officer’s review 8
Climate change 6, 7, 19, 29, 43
Committees 40–42, 52
Company profile Inside front cover
Continuous disclosure 9, 44–45
Cooper Basin 3, 5, 17, 18–19, 26, 29, 30
Cooper Basin Oil project 3, 18–19
Corporate directory Back cover
Corporate governance statement 36–45
Corporate structure 31
DDarwin LNG 3, 5, 8, 15
Development projects 4, 7, 10–11, 15,
17, 21, 23
Directors’ fees 58–59
Directors’ profiles 32–33
Directors’ remuneration 58–59
Directors’ shareholdings 51
Dividends 2, 4, 49, 53, 68, 154
Drilling results 3, 19, 23
EEarnings 2, 4, 6, 8, 48–49, 88
Earnings per share 2, 49, 107–108
Egypt 10
Employee programs and statistics 26–28
Environment 6, 7, 17, 25, 27, 28–29
Environment, Health, Safety and
Sustainability Committee 41
Executive management team 34–35
Exploration 3, 5–6, 10–11, 15, 19, 21, 23
FFairview 11, 15, 16–17, 26
Finance Committee 42
Financial summary 2
Financial statements 5, 70–151
GGas contracts 3, 17, 21
Gas fields 10–11
Gladstone LNG 3, 5–6, 11, 14–15, 17, 26, 31
Glossary 154–156
Greenhouse 5, 25, 28–29, 41
Group interests 46–47
Growth progress 3, 5–7
HHenry 3, 7, 11, 17
History Inside front cover
IIncome Statements 70
India 3, 4, 5, 10–11, 23
Indigenous relations 31
Indonesia 4, 5, 7, 10–11, 15, 22–23, 29, 31
JJeruk 11
John Brookes 3, 11, 21
KKey performance indicators 67–68
Kipper 3, 7, 11, 17
Kyrgyzstan 10–11, 23
LLicence areas and percentage interests 46–47
LNG 1, 3, 4, 5–7, 8, 14–15, 16–17, 21, 26, 31
MMaleo 8, 11, 23
Management structure 31
Maps 10–11
Moomba Carbon Storage project 7, 19
Mutineer-Exeter 11, 20–21
NNew ventures 3, 4, 5, 23
Nomination Committee 38, 41
OOccupational health and safety 2, 5–6, 25–28
Oil fields 10–11
Oil spill performance 19, 28–29,
Operating highlights 2–3
Oyong 3, 8, 11, 22–23
PPapua New Guinea 4, 5, 7, 11, 15, 29
Performance (10-year summary) 48–49
Performance (three-year summary) 2–3
Production statistics 12
PNG LNG 3, 5, 7, 15
RReindeer 3, 7, 11, 21
Remuneration 56–69
Remuneration Committee 38, 41, 60, 63
Reserves statistics 2, 3, 6, 13, 15, 19
Risk management 40, 42–43, 144
SSafety performance 2, 5–6, 25–26
Senior executives 34–35
Share information 2, 3, 4, 67–68, 152–153
Share price 3, 4, 67
Shareholders: top 20 152–153
Sidoarjo (Banjar Panji-1) mudflow 4, 53
Statements of Recognised Income
and Expense 73
Strategy Inside front cover,
1, 3, 4, 5–6, 25, 27
Sustainability 6–7, 24–31
Sponsorship 29–31
T10-year summary 48–49
Total recordable case frequency rate 2, 5–6, 26
UUnited States 5–6, 19, 29–30
VValues Inside front cover, 25, 27, 30, 44
Vietnam 3, 4, 6, 10, 23
Vision Inside front cover, 5
Des
ign
ed a
nd
pro
du
ced
by
Pers
pe
xa.c
om
. A
ll p
ho
tog
rap
hy
by
Ro
ber
t G
arve
y e
xcep
t p
ages
4,
5,
7, 3
2–
33
an
d 3
4–
35
by
Mil
ton
Wo
rdle
y an
d p
ages
7,
24,
28
an
d 3
6 b
y A
nd
y R
ash
eed
.
Index
157

Santos LtdABN 80 007 550 923
Registered and Head Office
Ground Floor Santos Centre
60 Flinders Street
Adelaide South Australia 5000
GPO Box 2455
Adelaide South Australia 5001
Telephone: 61 8 8116 5000
Facsimile: 61 8 8116 5050
Share Register
Ground Floor Santos Centre
60 Flinders Street
Adelaide South Australia 5000
GPO Box 2455
Adelaide South Australia 5001
Telephone: 61 8 8116 5000
Facsimile: 61 8 8116 5950
Offices
BrisbaneLevel 14 Santos House
60 Edward Street
Brisbane Queensland 4000
Telephone: 61 7 3228 6666
Facsimile: 61 7 3228 6700
PerthLevel 28 Forrest Centre
221 St Georges Terrace
Perth Western Australia 6000
Telephone: 61 8 9460 8900
Facsimile: 61 8 9460 8971
Port BonythonPO Box 344
Whyalla South Australia 5600
Telephone: 61 8 8640 3100
Facsimile: 61 8 8640 3200
Roma39 Currey Street
Roma Queensland 4455
Telephone: 61 7 4622 2400
Facsimile: 61 7 4622 3476
HanoiSantos Vietnam Pty Ltd
Suite 701 Level 7
39 A Ngo Quyen
Hanoi Vietnam
Telephone: 84 4 220 6000
Facsimile: 84 4 220 6002
JakartaSantos Asia Pacific Pty Ltd
Level 4 Ratu Plaza Office Tower
Jalan Jendral Sudirman Kav 9
Jakarta 10270 Indonesia
PO Box 6221 JKS GN
Jakarta 12060 Indonesia
Telephone: 62 21 2750 2750
Facsimile: 62 21 720 4503
New DelhiSantos International
Operations Pty Ltd
Suite 1907 Level 19
Shangri-La Hotel
19 Ashoka Road
Connaught Place
New Delhi 110 001 India
Telephone: 91 11 4119 6900
Facsimile: 91 11 4119 1908
Port MoresbyBarracuda Ltd
Level 8 Pacific Place
Cnr Champion Parade and
Musgrave Street
Port Moresby
Papua New Guinea
Telephone: 675 321 2633
Facsimile: 675 321 2847
Useful email contacts
Share register enquiries:
Investor enquiries:
Employment enquiries:
Website
www.santos.com
Corporate directory


![Shipyard and Cadmium (59.1) [Correc y Enm]](https://img.pdfslide.us/doc/110x75/5695cf171a28ab9b028c8aa2/shipyard-and-cadmium-591-correc-y-enm.jpg)