Embed Size (px)
Citation preview

Santa Margarita Water District Comprehensive Annual Financial Report For the Fiscal Year Ended June 30, 2014
Rancho Santa Margarita, California
Comprehensive Annual Financial Report
For the Fiscal Year Ended June 30, 2014
Prepared by the Finance Department
26111 Antonio Parkway, Rancho Santa Margarita, CA 92688 • www.smwd.com
Contents
Introductory Section
Letter of Transmittal i
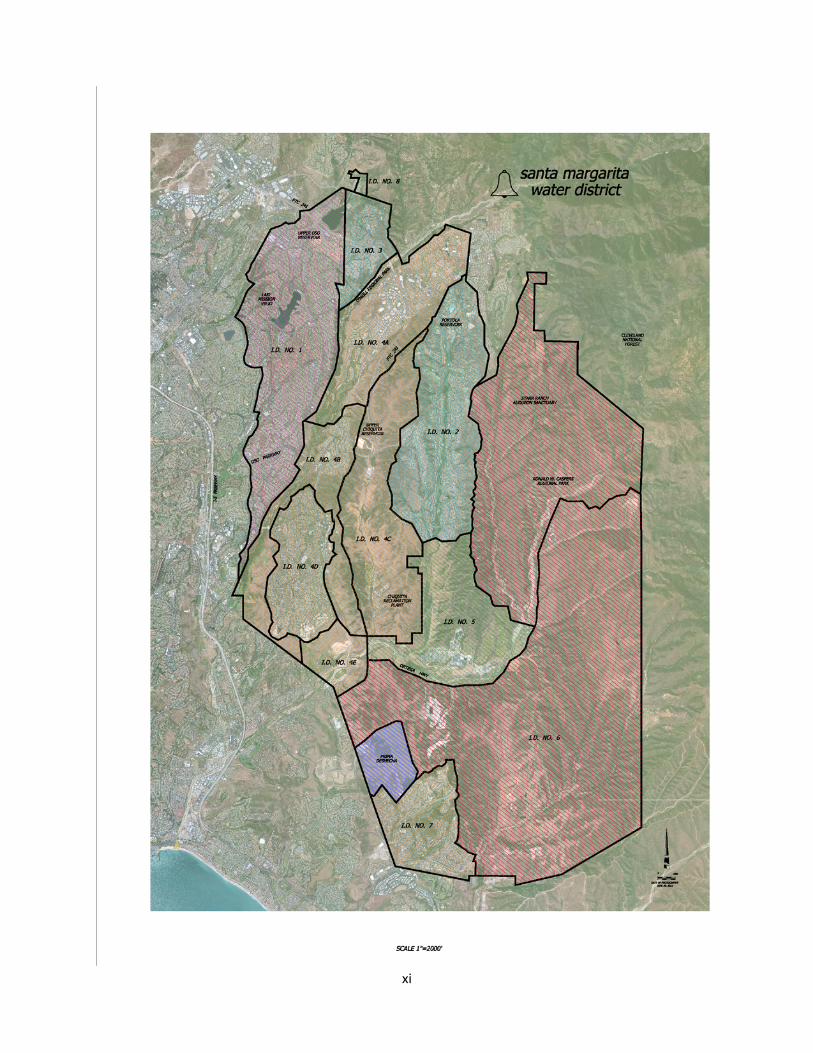
District Boundary Map xi
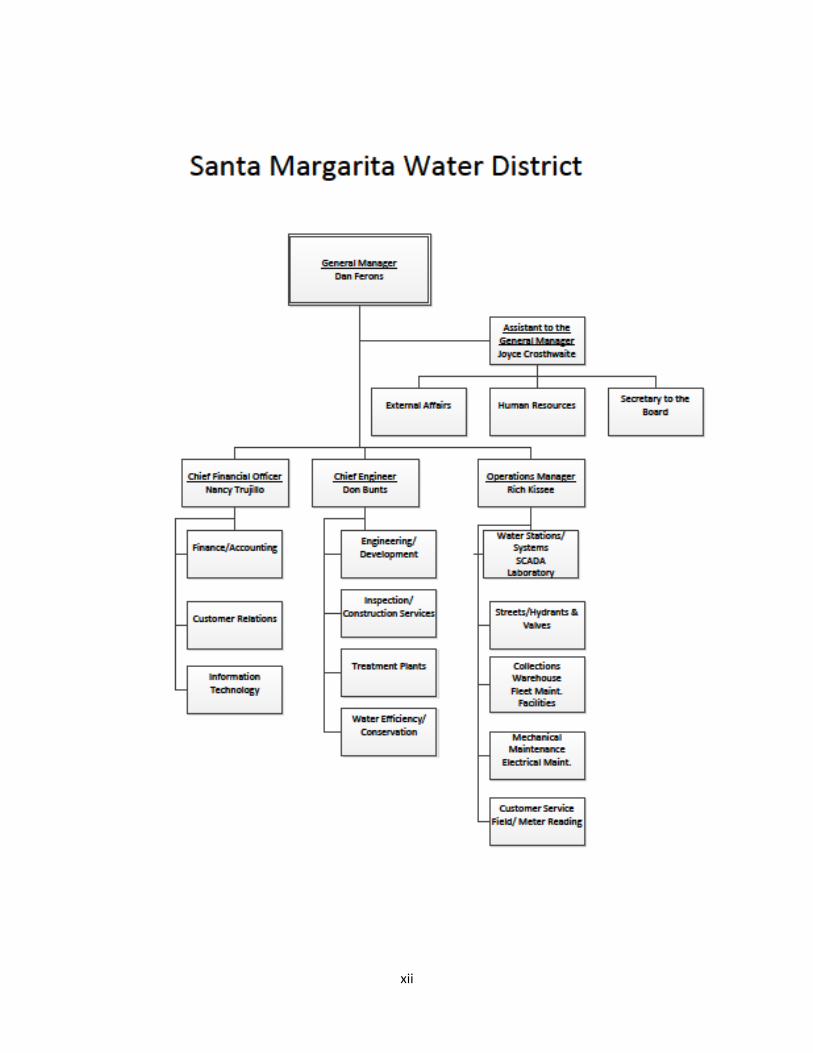
District Organizational Chart xii
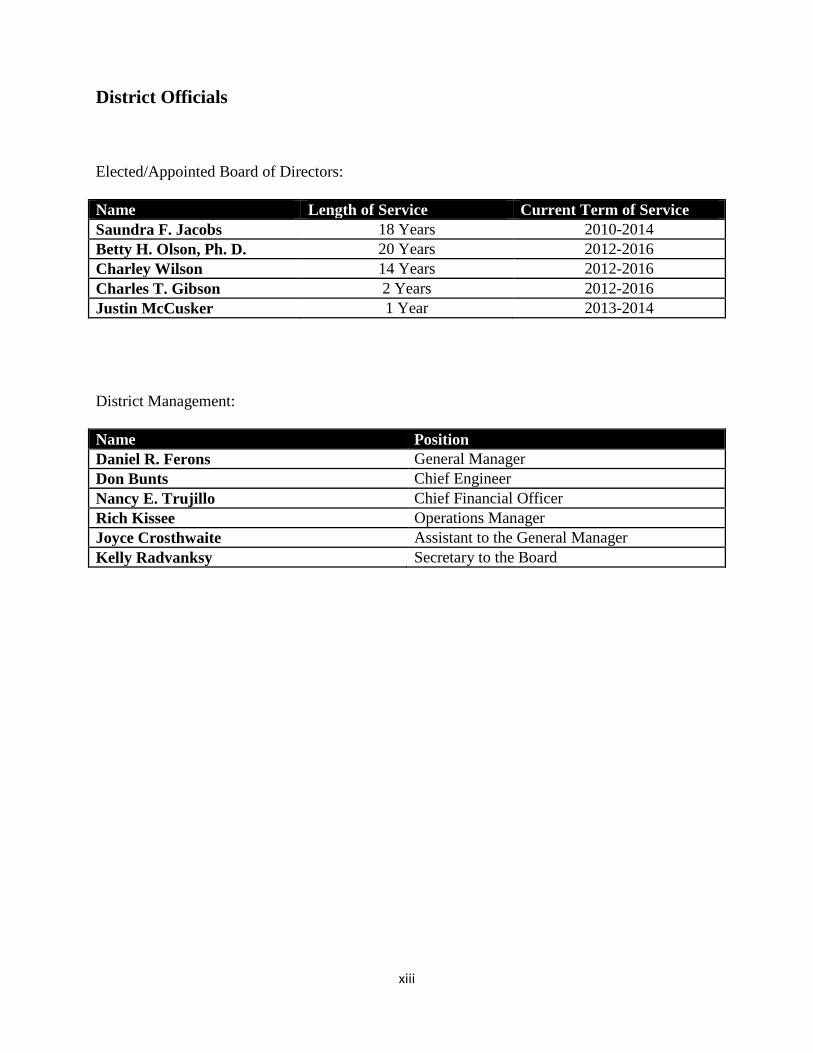
District Officers xiii
Financial Section
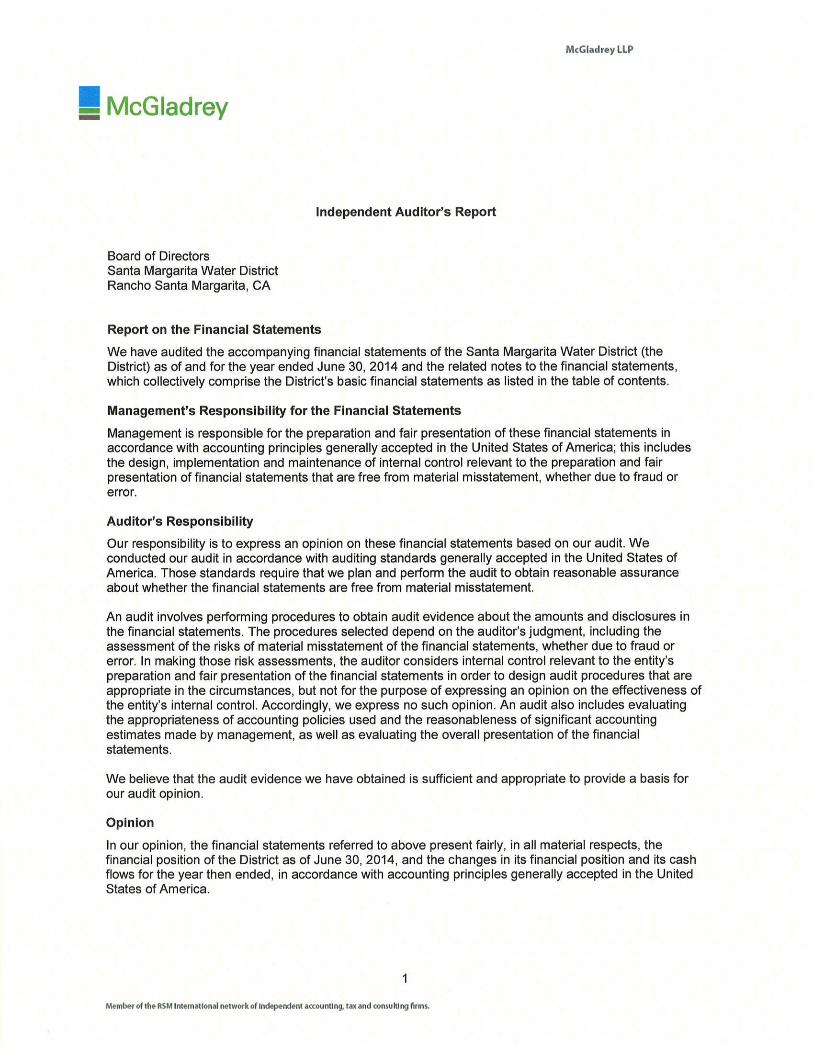
Independent Auditor’s Report 1
Management’s Discussion and Analysis 3
Basic Financial Statements:
Statement of Net Position 9
Statement of Revenues, Expenses and Changes in Net Position 11
Statement of Cash Flows 13
Notes to the Basic Financial Statements 15
Required Supplementary Information:
Funding Progress for Defined Benefit Pension Plan 40
Statistical Section
Summary of Statistical Section 41
Financial Trends 42
Revenue Schedules 47
Debt Schedules 51
Demographic and Economic Information 61
Operating Information 63

Introductory Section
26111 Antonio Parkway, Rancho Santa Margarita, CA 92688 Mailing - P.O. Box 7005, Mission Viejo, CA 92690-7005 Web: www.SMWD.com
Customer Service (949) 459-6420 Administration (949) 459-6507 Operations (949) 459-6551 i
October 16, 2014 The Honorable Board of Directors Santa Margarita Water District 26111 Antonio Parkway Rancho Santa Margarita, CA 92688 Dear Members of the Board of Directors: We are pleased to introduce the inaugural issue of the Santa Margarita Water District (District) Comprehensive Annual Financial Report (CAFR) for the fiscal year ended on June 30, 2014. It is a very interesting time for the District and the water/wastewater industry. We are in a historic drought with the last three years being the driest in 120 years in the San Juan Basin where the majority of the District resides, while the State of California projects continual growth in population. The challenge for water providers is to promote water use efficiency and to develop a sustainable supply for the future. This CAFR provides significant highlights and trends along with explanation of the changes to the financial condition of the District. The primary purpose is to provide an opportunity to pause and reflect on the current financial picture and provide a vision of the near and long-term future for the District. The District’s accounting policies are in conformity with Generally Accepted Accounting Principles (GAAP) using pronouncements issued by the Governmental Accounting Standards Board (GASB). Management assumes full responsibility for the completeness and fairness of the information contained in this report, based upon a comprehensive framework of internal control that it has established for this purpose. To the best of its knowledge, Management believes that all the enclosed data and disclosures are complete and accurate in all material respects, and reported in a manner designed to fairly present the District’s financial position and results from its operations. The report is organized with the following sections:
• This Letter of Transmittal which provides a discussion on the District and its current activities.
• Independent Auditor’s Report expressing an opinion on the basic financial statements based on the audit.
• The Management’s Discussion and Analysis (MD&A) immediately follows the independent auditor’s
report. It provides a narrative consisting of highlights, an overview, and analysis of the financial activity for the fiscal year.
• Basic financial statements and the accompanying notes to the financial statements for the year ended
June 30, 2014.
• Statistical section that provides detailed information augmenting the basic financial statements about the District’s overall financial health.
BOARD OF DIRECTORS
BETTY H. OLSON, PH.D
CHARLEY WILSON
CHARLES T. GIBSON
SAUNDRA F. JACOBS
JUSTIN McCUSKER
ii
Santa Margarita Water District and Its Services The District is celebrating its fiftieth year having been formed by local ranchers in 1964 on a portion of the historic Rancho Mission Viejo (RMV). With its current population of approximately 156,000 it means we have averaged a growth rate of 3,300 new residents per year or approximately 1,200 new dwelling units per year. Of course, the growth was not straight-lined; the first years were much slower, with the initial board comprised of landowners responsible for master planning the developments of Mission Viejo and Coto de Caza. The first connections to the District were in the late 1960’s and early 1970’s. The District’s story has a history and culture of continual growth and the incumbent planning for that growth. In the last 10 years, as the District has matured, it has started to split its focus to include planning for capital replacement and water reliability as well as accommodating ongoing growth. Over the next 20 years, the District expects to add another 14,000 new connections as a result of community development in the undeveloped portions of RMV under the General Plan amendment known as “The Ranch Plan.” Service Area
The District provides potable water, recycled water and wastewater service within its boundaries. The District also has responsibility for inter-agency coordination and long range planning to meet future water supply and wastewater treatment needs for its service area. Individual improvement districts (further referenced in the Statistical section - Assessed Values by Improvement District) function as operating units and provide a basis for facilities design and adoption of plans of work for construction of facilities, and authorization and sale of bonds. The improvement districts are not operated as separate or independent governmental entities, nor do they have governing boards or any staff. They are geographical subdivisions of the District through which the District funds capital improvements. Land within the improvement districts, that have plans of work that have been adopted and with bonds authorized by landowner vote, account for 83.5% of the District, or 52,424 acres. The remaining acreage within the District includes County of Orange Ronald W. Caspers Wilderness Park, County of Orange Prima Deshecha Landfill, and Starr Ranch (an Audubon Society preserve), all of which encompass 10,250 acres. The District includes approximately the easterly half of the territory within the City of Mission Viejo, the City of Rancho Santa Margarita, the Talega community within the City of San Clemente, and the unincorporated cities of Coto de Caza, Ladera Ranch, and Las Flores. Governance The District is governed by a five-member Board of Directors elected at large by registered voters. The terms are for four years and the elections are staggered every two years on even years. The Directors are active in the community and in the water industry, holding leadership positions in advocacy groups such as Association of California Water Agencies, Southern California Water Committee and the Western States Water Council. They are recognized as leaders in Orange County and in the State, bringing a variety of backgrounds to establish policy direction for the District. The powers and functions of the District are exercised by its Board of Directors. Employees The District has 122 full time equivalent employees who effectively operate a complex business that delivers a product that is vital to the health of the community. The District is organized under the direction of a General Manager; only the sixth General Manager in the 50-year history of the District which shows the stability over the years. The District has recognized one employee bargaining unit, the Santa Margarita Water District Employee Association (SMWDEA). SMWDEA represents the District hourly and non-confidential
iii
employees and includes 93 individuals. The District and SMWDEA have a four-year Memorandum of Understanding that governs the employee policies, procedures, and benefits in effect during the fiscal year. The District is organized into four primary divisions: Administration, Engineering, Finance and Operations under the executive team. While we have divisions, the work efforts and teams are supportive across department lines. The philosophy of the management has been to push the authority and responsibility to rank and file and allow people to perform at a higher level. This philosophy allows for development of leadership skills throughout the organization and benefits the District by having well-rounded employees. The average tenure is 11 years. District Services The District provides three core services to the community: Drinking or “Potable” Water System The District is a member of Municipal Water District of Orange County (MWDOC), which wholesales water within Orange County and is a member of the Metropolitan Water District of Southern California (MWD). Currently the District provides potable water treated by MWD at the Diemer Filtration Plant. The District has made major improvements over the last 10 years to enhance the reliability of the water supply system including the construction of the Upper Chiquita Reservoir, interconnections with Irvine Ranch Water District to deliver water from North Orange County and participation in the ongoing construction of the Baker Filtration Plant, which will treat raw water delivered by MWD via MWDOC or water from Irvine Lake. These facilities, in addition to the other District storage facilities including the El Toro Water District R-6 Reservoir, help provide the District with up to 30 days of average water supply in event of a failure of the importation system. The District delivers water that meets or exceeds all the Federal and State requirements for drinking water and issues an annual Water Quality Report that summarizes the testing. We operate a certified laboratory to perform the majority of the testing. Wastewater System The District operates the sewage collection system and three wastewater treatment plants and is also a member of the South Orange County Wastewater Authority (SOCWA) which is a Joint Powers Authority that operates regional treatment plants. The District owns capacity in two treatment plants operated by SOCWA, the Jay B. Latham and the 3A Water Reclamation Plants and approximately 2.5 million gallons per day (MGD) are treated on behalf of the District. The plants operated by the District are:
• Chiquita Water Reclamation Plant treating approximately 6.3 MGD • Oso Creek Water Reclamation Plant treating approximately 1.8 MGD • Nichols Water Reclamation Plant, a small plant operated by the District under contract with Quest
Diagnostics The District is located in a series of valleys and it requires the operation of 17 sewage lift stations to pump wastewater to the various treatment plants. Operation of the collection system is a very important activity and the District video tapes the sewer lines to check for blockages and problem areas as well as operates a fleet of vactor trucks to clean the system. The lift stations are regularly maintained and tested to ensure continuous operation. Back-up power supplies are also maintained by the District in case of outages. The treatment plants are connected to the Dana Point Ocean Outfall for disposal of secondary effluent if the water is not recycled. Recycled Water System The District has the capacity to produce up to 7.8 MGD. Currently 17% of the District’s water supply is from recycled water and urban return flows; used for irrigation and construction purposes within the District.
iv
Recycled water is an important element of the District’s current and future water supply portfolio with plans to increase to 30% of the overall supply. Recycled water is produced at the Oso Creek and Chiquita Water Reclamation Plants and stored in the Upper Oso Seasonal Storage Reservoir. The water is delivered to parks, medians, slopes, golf courses and schools in Mission Viejo, Las Flores, Ladera Ranch, Village of Sendero and the Talega community. The District is actively working on sites for conversion to recycled water to offset the demand for domestic water. Water, Recycled and Wastewater Rates Rates are established to cover the fixed and variable costs of delivering water and wastewater services to the District’s customers. Due to steadily rising costs of imported water from our supplier, MWD, and general inflationary cost increases as measured by the Consumer Price Index (CPI), the District increased its water and sewer rates beginning January 1, 2014. Since more than half of the District’s operating budget is dedicated to purchasing water and energy, an increase in rates was necessary to ensure the delivery of a safe, reliable water supply. The District’s Board reviews water, wastewater and recycled water rates and fees annually (and more frequently if warranted) to ensure the District continues to operate cost-effectively while delivering a safe, reliable water supply to the customer’s tap. The review also ensures compliance with stringent wastewater treatment and disposal regulations, and re-use of recycled water for irrigation. Water and Recycled Water Charges The District charges all customers a fixed basic service rate for domestic water and recycled water. As of January 1, 2014, for a residential account with a ¾-inch meter, these fixed monthly costs are $6.41 for water. Additionally, there is a tiered rate structure for the volumetric charge for water based on the amount of water used by residential customers. The commercial and irrigation customers are charged a flat rate per unit for all water passed through a meter. To encourage conservation and cover the cost of buying water from MWD at a higher rate, a tiered rate system on actual units of water per hundred cubic feet (ccf) used is in place for residential water usage. This system imposes higher rates on customers who use larger amounts of water. One ccf unit equals 748 gallons. The per-unit charge covers the water delivery cost. It also covers the cost of treating the water to ensure that it's safe to drink, as well as energy costs for pumping the water to customers. Customers who live in an elevated area within the District where water is pumped to their location may pay a power surcharge. The surcharge passes through to the customer the cost the District pays for electricity to pump the water. The surcharge is determined by the pumping zone. There are three pumping zones in the District that are assessed a surcharge. This rate applies to domestic and non-domestic water. Wastewater Charges The District charges a fixed basic service rate for all wastewater/sewer customers. As of January 1, 2014, a residential account with a ¾-inch meter, the fixed monthly costs is $9.26 for sewer. Additionally, there is a sanitation volumetric charge of $1.06 per unit. For commercial customers, the fixed basic service rate is based on meter size and the sanitation volumetric charge is calculated on 90% of the total water consumption and is also based on the type (quality) of wastewater discharged by different classes of users. Customer Base and Growth in the District (number of accounts, types of accounts and population) The District has a strong customer base of approximately 156,000 residents in well-planned communities throughout southeast Orange County including Mission Viejo, Rancho Santa Margarita, Coto de Caza, Las
v
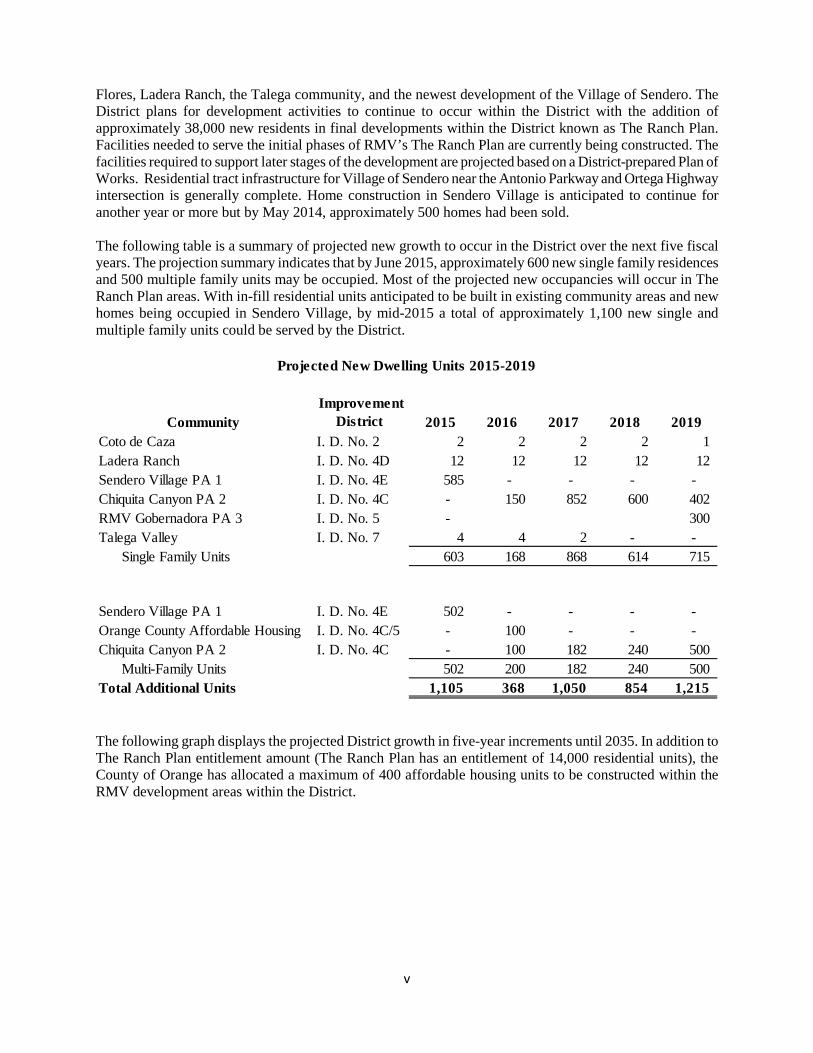
Flores, Ladera Ranch, the Talega community, and the newest development of the Village of Sendero. The District plans for development activities to continue to occur within the District with the addition of approximately 38,000 new residents in final developments within the District known as The Ranch Plan. Facilities needed to serve the initial phases of RMV’s The Ranch Plan are currently being constructed. The facilities required to support later stages of the development are projected based on a District-prepared Plan of Works. Residential tract infrastructure for Village of Sendero near the Antonio Parkway and Ortega Highway intersection is generally complete. Home construction in Sendero Village is anticipated to continue for another year or more but by May 2014, approximately 500 homes had been sold. The following table is a summary of projected new growth to occur in the District over the next five fiscal years. The projection summary indicates that by June 2015, approximately 600 new single family residences and 500 multiple family units may be occupied. Most of the projected new occupancies will occur in The Ranch Plan areas. With in-fill residential units anticipated to be built in existing community areas and new homes being occupied in Sendero Village, by mid-2015 a total of approximately 1,100 new single and multiple family units could be served by the District.
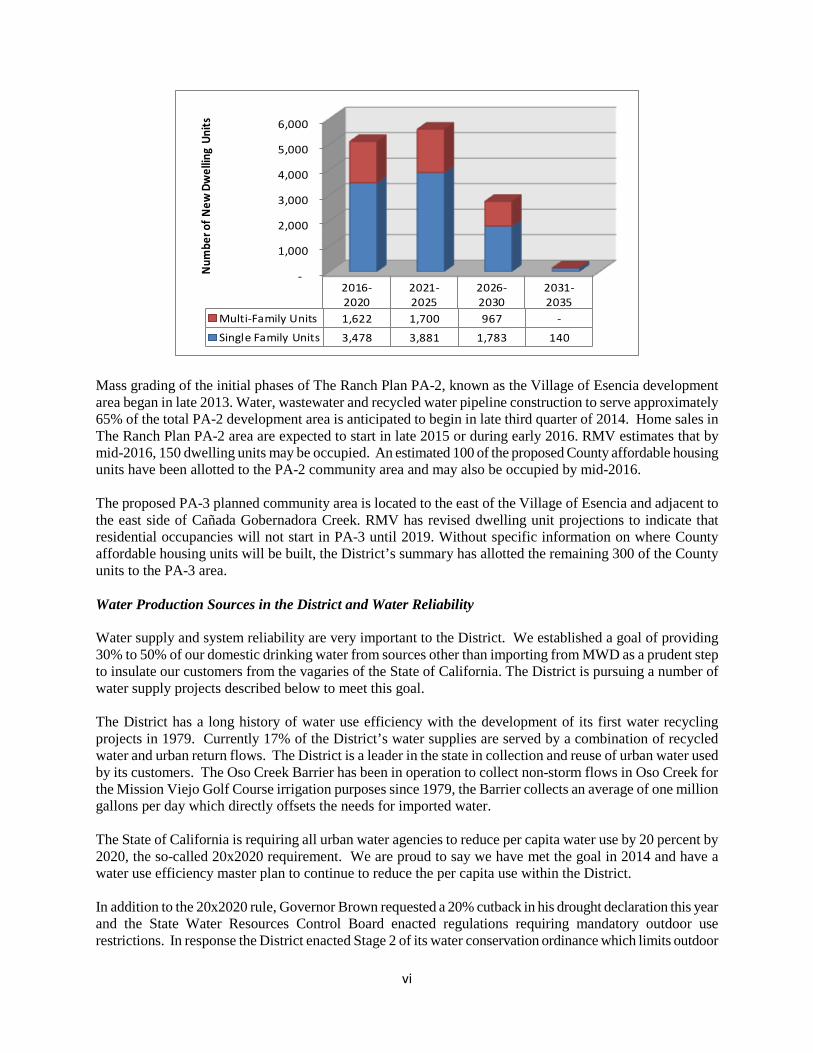
The following graph displays the projected District growth in five-year increments until 2035. In addition to The Ranch Plan entitlement amount (The Ranch Plan has an entitlement of 14,000 residential units), the County of Orange has allocated a maximum of 400 affordable housing units to be constructed within the RMV development areas within the District.
Community Improvement
District 2015 2016 2017 2018 2019Coto de Caza I. D. No. 2 2 2 2 2 1 Ladera Ranch I. D. No. 4D 12 12 12 12 12 Sendero Village PA 1 I. D. No. 4E 585 - - - - Chiquita Canyon PA 2 I. D. No. 4C - 150 852 600 402 RMV Gobernadora PA 3 I. D. No. 5 - 300 Talega Valley I. D. No. 7 4 4 2 - -
Single Family Units 603 168 868 614 715
Sendero Village PA 1 I. D. No. 4E 502 - - - - Orange County Affordable Housing I. D. No. 4C/5 - 100 - - - Chiquita Canyon PA 2 I. D. No. 4C - 100 182 240 500
Multi-Family Units 502 200 182 240 500 Total Additional Units 1,105 368 1,050 854 1,215
Projected New Dwelling Units 2015-2019
vi
-
1,000
2,000
3,000
4,000
5,000
6,000
2016-2020
2021-2025
2026-2030
2031-2035
Multi-Family Units 1,622 1,700 967 -Single Family Units 3,478 3,881 1,783 140
Num
ber o
f New
Dw
ellin
g Un
its
Mass grading of the initial phases of The Ranch Plan PA-2, known as the Village of Esencia development area began in late 2013. Water, wastewater and recycled water pipeline construction to serve approximately 65% of the total PA-2 development area is anticipated to begin in late third quarter of 2014. Home sales in The Ranch Plan PA-2 area are expected to start in late 2015 or during early 2016. RMV estimates that by mid-2016, 150 dwelling units may be occupied. An estimated 100 of the proposed County affordable housing units have been allotted to the PA-2 community area and may also be occupied by mid-2016. The proposed PA-3 planned community area is located to the east of the Village of Esencia and adjacent to the east side of Cañada Gobernadora Creek. RMV has revised dwelling unit projections to indicate that residential occupancies will not start in PA-3 until 2019. Without specific information on where County affordable housing units will be built, the District’s summary has allotted the remaining 300 of the County units to the PA-3 area. Water Production Sources in the District and Water Reliability Water supply and system reliability are very important to the District. We established a goal of providing 30% to 50% of our domestic drinking water from sources other than importing from MWD as a prudent step to insulate our customers from the vagaries of the State of California. The District is pursuing a number of water supply projects described below to meet this goal. The District has a long history of water use efficiency with the development of its first water recycling projects in 1979. Currently 17% of the District’s water supplies are served by a combination of recycled water and urban return flows. The District is a leader in the state in collection and reuse of urban water used by its customers. The Oso Creek Barrier has been in operation to collect non-storm flows in Oso Creek for the Mission Viejo Golf Course irrigation purposes since 1979, the Barrier collects an average of one million gallons per day which directly offsets the needs for imported water. The State of California is requiring all urban water agencies to reduce per capita water use by 20 percent by 2020, the so-called 20x2020 requirement. We are proud to say we have met the goal in 2014 and have a water use efficiency master plan to continue to reduce the per capita use within the District. In addition to the 20x2020 rule, Governor Brown requested a 20% cutback in his drought declaration this year and the State Water Resources Control Board enacted regulations requiring mandatory outdoor use restrictions. In response the District enacted Stage 2 of its water conservation ordinance which limits outdoor
vii
irrigation and has increased its public outreach program to engage customers in helping the District meet the requested flow reductions. Efficiencies in District Operations We are proud of the efforts of the District employees to continuously improve and plan for efficiencies. In 1994, the District had over 160 employees and currently we have less than 130, but have added over 20,000 new connections. The District has implemented a variety of new technologies to maintain a high level of service while efficiently managing its resources. Examples include being the first water quality laboratory to fully automate its data collection and reporting; the water distribution and wastewater collection systems are also fully automated through the state of the art Supervisory, Control and Data Acquisition System (SCADA) which allows for remote operation of all facilities including the treatment plants. We are embarking on a review of the District’s enterprise software during the upcoming year to implement our current master plan. The effort includes the financial software as well as the customer service and web interface. The proposed system upgrades will allow for planned growth within the District and enhance the ability of the staff to provide water use efficiency data and customer service. We are particularly proud to note this year, the District has reduced the weekly customer turn-offs for non-payment by over 200%, from an average of 75 to less than 25. The staff took the initiative to reach out and make personal contact with customers to assist them with payment options. This was done during regular hours and has resulted in saving two days a week for a field crew to turn meters on and off. This is an example of the culture at the District, to continuously review current practices and look for innovative solutions. Accounting and Budgetary Controls In developing and evaluating the District’s accounting system, consideration is given to the adequacy of internal controls. Internal accounting controls are designed to provide reasonable, but not absolute assurance regarding: (1) the safeguarding of assets against loss from unauthorized use or disposition; and (2) the reliability of financial records for preparing financial statements and maintaining accountability for assets. The concept of reasonable assurance recognizes that: (1) the costs of a control should not exceed the benefits likely to be derived; and (2) the evaluation of costs and benefits requires estimates and judgments by management. We believe that the District’s internal accounting controls adequately safeguard assets and provide reasonable assurance of proper recording of financial transactions. On an annual basis, each department head is responsible for developing a detailed budget for their area of responsibility. The annual budget serves as each manager’s plan to meet the goals of the District for the coming year, as well as employing its guiding principles and overall mission statement. The annual operating budget and capital budget are also used to develop the goals and objectives for the District and its employees. The budget is viewed as the financial control over the District’s operations and provides accountability for the District. Each month the financial results are compared to the budget with variance explanations provided. On a quarterly basis, the District reforecasts the annual budget and identifies the cause of any variances from the budget. The Board of Directors annually adopts the operating and capital budget prior to the new fiscal year. Debt Administration At June 30, 2014, the District had $142,120,000 in general obligation bonds outstanding, and $151,130,000 in community facility bonds outstanding. The weighted average cost on all outstanding general obligation and community facilities district debt as of year-end was 5.177%. The District also had $10,383,922 of notes payable as of June 30, 2014. It is the general intent of the District that non-operating revenues, primarily special assessment for debt service, are adequate to provide for debt service. In addition, the District may
viii
collect funds from standby charges, connection charges, and various other revenue sources should they occur. The pledged revenues exceed the annual debt service of the bonds. Reserves Policy The Board of Directors adopted a reserve policy for the District which states the purpose, source, and funding limits for each of its unrestricted and designated reserves in 3 categories: Operating Reserves, Capital Reserves, and Pension Reserves. The reserves are necessary to maintain liquidity enabling the District to invest these funds for future operating and capital requirements, such as for operating and capital emergencies, and planned replacement, repairs, and refurbishment. The funding level and types of reserves are reviewed, and modified as necessary, annually by the Board of Directors. Administrative Code and Investment Policy The Board of Directors adopted an Administrative Code, which includes policies, procedures, and controls over various operating and administrative duties. An Investment Policy, as adopted by the Board of Directors, gives guidance to the District in terms of how to invest its funds in instruments permitted by the California Government Code Sections 53601 et seq. The investment objectives of the District are to provide a balanced portfolio with the overall objective to preserve capital, maintain liquidity, and maximize the rate of return. Annual Audit The District is required by bond covenants and state statutes to obtain an annual audit of its financial statements by an independent certified public accountant. Based on best practices, the Board requires that the District rotate audit firm every 5 years or sooner. The accounting firm of McGladrey LLP conducted this year’s audit for the first time. Their audit report, which contains an unmodified opinion, is included in the financial section of this report. Major Initiatives Cadiz Valley Water Conservation, Recovery and Storage Project Cadiz, Inc. and the District entered into a public private partnership to develop the Cadiz Water Conservation, Recovery and Storage Project located in the Fenner Valley in the County of San Bernardino. The project will develop an underutilized water supply that currently evaporates from dry lakes and put it to beneficial use. The project is designed to average 50,000 acre-feet (AF) per year of water supply delivered to the MWD Colorado River Aqueduct for transporting to South California Water Agencies. The District has a firm capacity of 5,000 AF in the project and an option for an additional 10,000 AF. Several other public and private water purveyors have signed letters of intent to purchase water from the project. The District is the lead agency on the project and certified the environmental impact report in 2012, the Orange County Superior Court recently ruled in favor of the District on challenges brought against the certification. The County of San Bernardino is also a strong partner in the project, providing additional oversight with the Groundwater Monitoring, Management and Mitigation Plan, an agreement between the County, the District and Cadiz which puts into place the joint controls for ensuring the project operates as planned. The next steps include finalizing the design of the project including the well field, pipeline, water quality and interconnection with the MWD facilities. In addition, the District will be working to develop an agreement with MWD for delivery of the water and finalizing the formation of the Fenner Valley Joint Powers Authority for the operation of the project.
ix
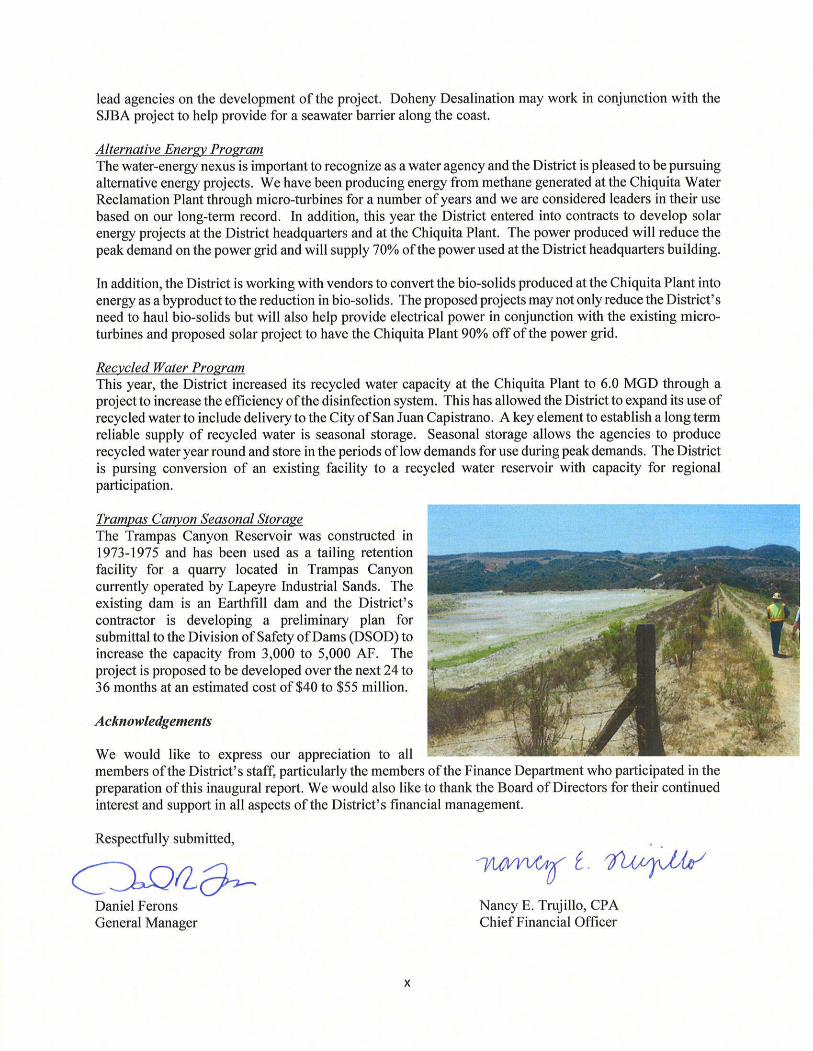
San Juan Basin Authority Project The San Juan Basin Authority (SJBA) is a joint powers agency; its members include the City of San Juan Capistrano, South Coast Water District, Moulton Niguel Water District and the District. SJBA was formed to manage and develop the potential groundwater supplies in the San Juan Basin which is formed by the San Juan Creek and its tributaries. SJBA recently completed the draft San Juan Basin Groundwater and Facilities Plan Update and identified that it may be possible to develop a project to recharge the basin with a combination of storm flows, urban return flows and recycled water to maximize the potential water supply. Currently the San Juan Basin is experiencing its lowest rainfall in any three–year period in recorded history. This has required groundwater producers to reduce production. The proposed project would help alleviate this situation from occurring in the future and would result in a reliable local supply for the District. The project would reduce the District’s dependency on imported water. Current activities include reviewing recharge basin project sites and availability of recycled water. The District has obtained a grant from the United States Bureau of Reclamation for funding assistance on the project. Gobernadora Multipurpose Basin Cañada Gobernadora is the rechannelized creek that transverses the development of Coto de Caza, it was developed along with the community to serve as the storm flow and urban runoff channel. It was built primarily in the 1980’s and met the design criteria in place at the time and did not include facilities to reduce or detain flows. The downstream ecological area and critical District facilities were impacted by high storm flows in Cañada Gobernadora. The District, worked with RMV and the County of Orange to develop the Gobernadora Multipurpose Basin to capture urban return flows, develop a wetlands treatment process and reduce peak storm flow rates. The first phase of the project is nearing completion and will be placed in operation before the end of 2014. The project will divert low flows into the upper basin and they will transverse a series of basins to settle debris and continue through wetlands for collection and reuse in the irrigation system. The project will provide 400 to 750 AF per year of new supply to the District that reduces demand for imported water. The lower basin is also under construction. The lower basin will provide for storm retention and may be used for recharging the basin with recycled water. Baker Filtration Plant The Baker Filtration Plant is a joint project being constructed by Irvine Ranch Water District on behalf of the District, Moulton Niguel Water District, El Toro Water District, Trabuco Canyon Water District and itself. The Baker Plant treats raw water from MWD and/or Irvine Lake to meet drinking water standards. It provides an important system reliability component to the District as an alternative to the Diemer Filtration Plant which is currently the primary supply of drinking water to South Orange County. The District will obtain 13 cubic feet per second (cfs) delivered to the existing South County Pipeline when the plant is completed in 2016. The Baker Plant, along with Upper Chiquita and R-6 Reservoirs, helps the District meet its goals for system reliability to be able to sustain a short-term outage of 30 days of the MWD domestic water system. Desalination Poseidon Water is proposing to develop a privately owned 50 MGD ocean desalination plant in Huntington Beach. The project is in the permitting stages and Poseidon is working with the Coastal Commission to obtain a coastal development permit. The activities include developing a report on alternatives to open ocean intake facilities. The District has entered into a non-binding letter of intent to purchase 5,000 AF per year in the project. A second ocean desalination project is proposed for Dana Point - the Doheny Desalination Plant is proposed to produce up to 15 MGD and is under preliminary design. MWDOC and South Coast Water District are the
xi
xii
xiii
District Officials Elected/Appointed Board of Directors: Name Length of Service Current Term of Service Saundra F. Jacobs 18 Years 2010-2014 Betty H. Olson, Ph. D. 20 Years 2012-2016 Charley Wilson 14 Years 2012-2016 Charles T. Gibson 2 Years 2012-2016 Justin McCusker 1 Year 2013-2014 District Management: Name Position Daniel R. Ferons General Manager Don Bunts Chief Engineer Nancy E. Trujillo Chief Financial Officer Rich Kissee Operations Manager Joyce Crosthwaite Assistant to the General Manager Kelly Radvanksy Secretary to the Board

Financial Section
Santa Margarita Water District Management’s Discussion and Analysis
For the Year Ended June 30, 2014
3
This section of the Santa Margarita Water District’s (District) annual financial report presents Management’s Discussion and Analysis of the District’s financial performance during the fiscal year ended June 30, 2014. The information presented here is to be read and considered in conjunction with additional information provided with the letter of transmittal and the basic financial statements and accompanying notes.
Fiscal Highlights
• Cash and investments of $202.6 million on June 30, 2014 represents an increase of $35.4 million (21%) compared to the prior year balance of $167.2 million. This is primarily due to the addition of construction cash resulting from the bond issued during the fiscal year.
• The net capital asset balance of $532.7 million at June 30, 2014 increased $21.8 million (4.3%) compared with the prior year balance of $510.9 million. The largest increase in capital assets was in construction in progress. There are several construction projects that were active during the year but not completed including: Gobernadora Multi-Purpose Basin project, PA-1 (Sendero) costs for the District’s share of the Middle Chiquita Reservoir, and domestic and recycled water transmission pipelines.
• The District’s total revenues increased $13.0 million or 14.3% from the prior fiscal year. This is due to a rate increase during the fiscal year, and the increase in ad-valorem property tax resulting from an increase in assessed values and the sale of excess capacity in a pipeline.
• The District’s total expenses increased $3.8 million or 10.4% from the prior fiscal year. This is due to the need to purchase additional water due to weather conditions and increased interest expense resulting from the additional 2013 Series CFD bonds that were issued during the fiscal year.
Overview of the Financial Statements
This annual financial report consists of two parts, Management’s Discussion and Analysis and the basic financial statements, including notes to the financial statements. The District’s financial statements offer key, high-level financial information about the District’s activities.
The District is a self-supporting entity that follows enterprise fund accounting and presents its financial statements on the accrual basis of accounting.
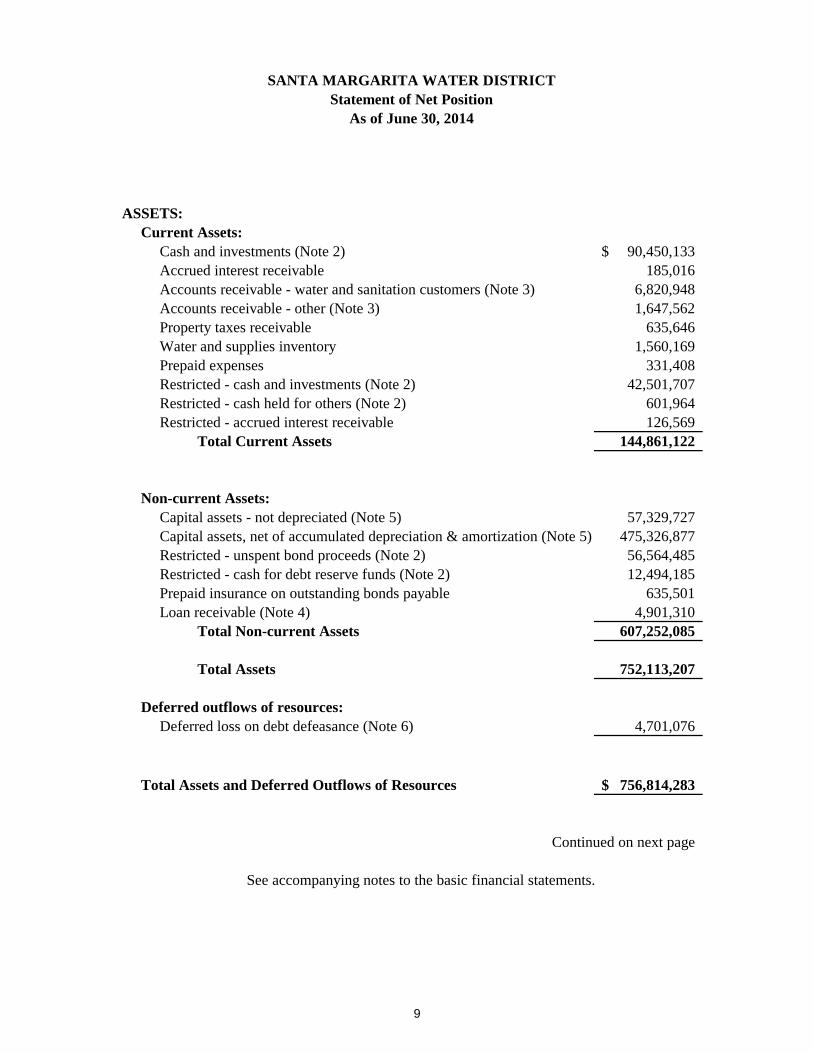
The Statement of Net Position includes information on all the District’s assets and deferred outflows, liabilities and deferred inflows, with the difference between assets and deferred outflows and liabilities and deferred inflows reported as net position. Changes in net position may serve as a useful indicator of whether the financial position of the District is improving or deteriorating.
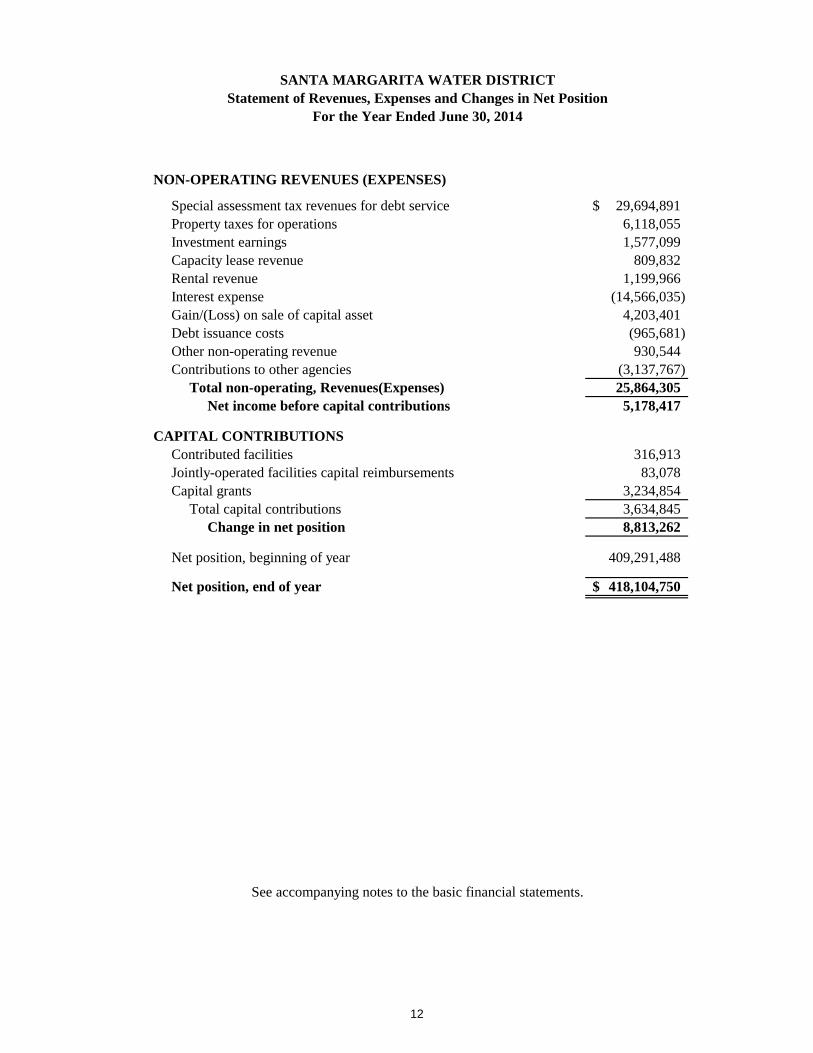
The Statement of Revenues, Expenses and Changes in Net Position presents information regarding how the District’s net position changed during the fiscal year ended June 30, 2014. All changes in net position reflect the transactions giving rise to the change.
The Statement of Cash Flows provides information about the District’s cash receipts and cash payments during the reporting period. The Statement of Cash Flows reports cash receipts, cash payments and net
Santa Margarita Water District Management’s Discussion and Analysis
For the Year Ended June 30, 2014
4
changes in cash resulting from operations, investing, non-capital financing, and capital and related financing activities and provides information on the sources and uses of the District’s cash.
Financial Analysis of the District
The District’s financial statements begin on page 9 of this document. In reviewing the statements, one of the most important questions to ask about the District’s finances is “Is the District, as a whole, better off or worse off as a result of the year’s activities?” The statement of Net Position, and the Statement of Revenues, Expenses and Changes in Net Position report information about the District’s activities in a way that will help answer this question. Over time, increases or decreases in the District’s net position is one indicator of whether its financial health is improving or deteriorating. However, one needs to consider other non-financial factors such as changes in economic conditions, population growth, zoning, and new or changed government legislation.
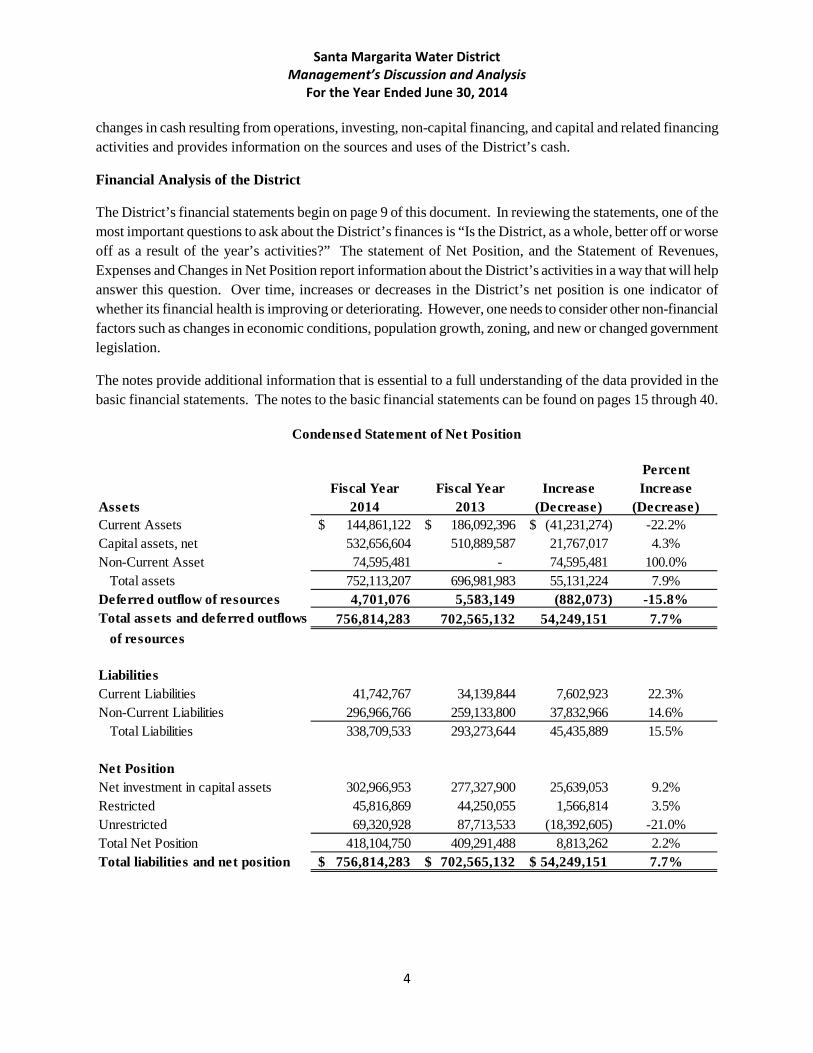
The notes provide additional information that is essential to a full understanding of the data provided in the basic financial statements. The notes to the basic financial statements can be found on pages 15 through 40.
PercentFiscal Year Fiscal Year Increase Increase
Assets 2014 2013 (Decrease) (Decrease)Current Assets 144,861,122$ 186,092,396$ (41,231,274)$ -22.2%Capital assets, net 532,656,604 510,889,587 21,767,017 4.3%Non-Current Asset 74,595,481 - 74,595,481 100.0% Total assets 752,113,207 696,981,983 55,131,224 7.9%Deferred outflow of resources 4,701,076 5,583,149 (882,073) -15.8%Total assets and deferred outflows 756,814,283 702,565,132 54,249,151 7.7%
of resources
LiabilitiesCurrent Liabilities 41,742,767 34,139,844 7,602,923 22.3%Non-Current Liabilities 296,966,766 259,133,800 37,832,966 14.6% Total Liabilities 338,709,533 293,273,644 45,435,889 15.5%
Net PositionNet investment in capital assets 302,966,953 277,327,900 25,639,053 9.2%Restricted 45,816,869 44,250,055 1,566,814 3.5%Unrestricted 69,320,928 87,713,533 (18,392,605) -21.0%Total Net Position 418,104,750 409,291,488 8,813,262 2.2%Total liabilities and net position 756,814,283$ 702,565,132$ 54,249,151$ 7.7%
Condensed Statement of Net Position
Santa Margarita Water District Management’s Discussion and Analysis
For the Year Ended June 30, 2014
5
The District’s total assets increased $55,131,224 or 7.9% to $752,113,207 compared with the prior year of $696,981,983 primarily due to the issuance of new debt which includes construction funds that had not all been spent by the end of the fiscal year. This new debt also impacted the increase in total liabilities to $338,709,539 from $293,273,644 or 15.5% from the prior year.
Net Position increased by $8,813,262 or 2.2% to $418,104,750 compared to prior year. By far the largest portion of the District’s net position (72% as of June 30, 2014 and 68% as of June 30, 2013) reflects the District’s investment in capital assets (net of accumulated depreciation) less any related debt used to acquire those assets that is still outstanding. The District uses these capital assets to provide services to customers within the District’s service area; consequently, these assets are not available for future spending.
At the end of fiscal year 2014 and 2013, The District shows a positive balance in its unrestricted net position of $69,320,928 and 87,713,533 respectively to be utilized in future years. Unrestricted net position decreased primarily due to more funds being restricted with the issuance of the 2013 Series Special Tax bonds and the use of funds to prepay the Allen-McCulloch Pipeline operating lease.
Santa Margarita Water District Management’s Discussion and Analysis
For the Year Ended June 30, 2014
6
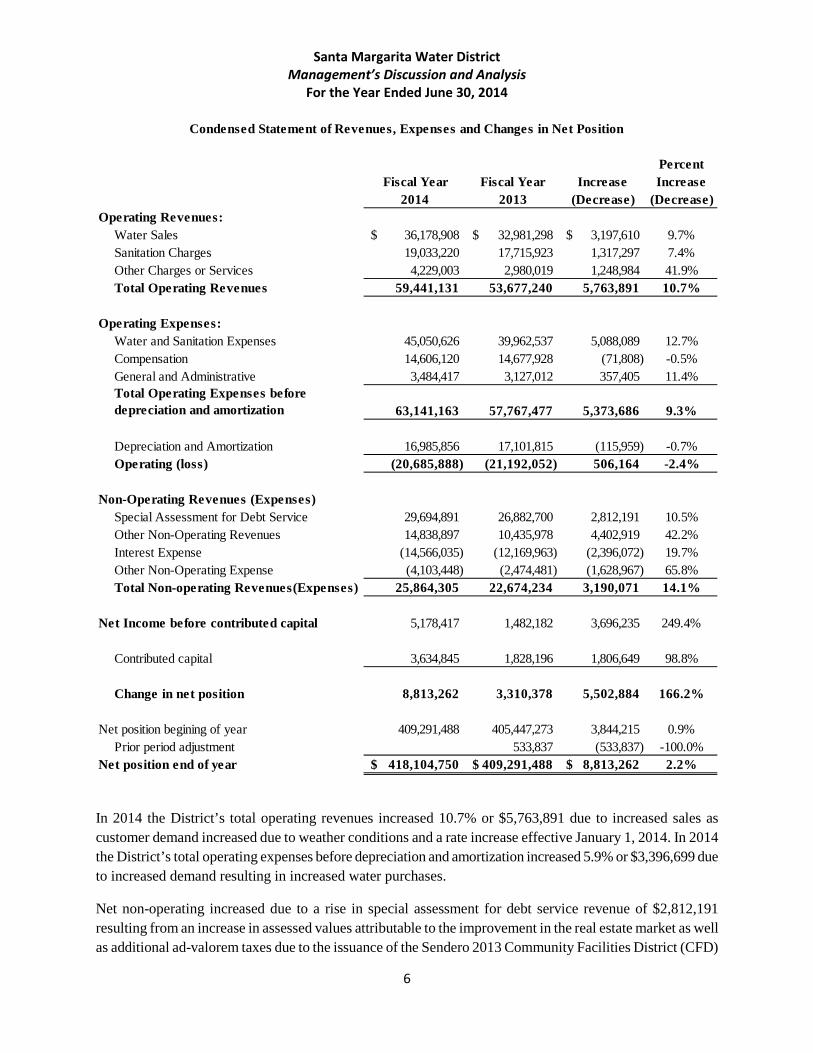
In 2014 the District’s total operating revenues increased 10.7% or $5,763,891 due to increased sales as customer demand increased due to weather conditions and a rate increase effective January 1, 2014. In 2014 the District’s total operating expenses before depreciation and amortization increased 5.9% or $3,396,699 due to increased demand resulting in increased water purchases.
Net non-operating increased due to a rise in special assessment for debt service revenue of $2,812,191 resulting from an increase in assessed values attributable to the improvement in the real estate market as well as additional ad-valorem taxes due to the issuance of the Sendero 2013 Community Facilities District (CFD)
PercentFiscal Year Fiscal Year Increase Increase
2014 2013 (Decrease) (Decrease)Operating Revenues:
Water Sales 36,178,908$ 32,981,298$ 3,197,610$ 9.7%Sanitation Charges 19,033,220 17,715,923 1,317,297 7.4%Other Charges or Services 4,229,003 2,980,019 1,248,984 41.9%Total Operating Revenues 59,441,131 53,677,240 5,763,891 10.7%
Operating Expenses:Water and Sanitation Expenses 45,050,626 39,962,537 5,088,089 12.7%Compensation 14,606,120 14,677,928 (71,808) -0.5%General and Administrative 3,484,417 3,127,012 357,405 11.4%Total Operating Expenses before depreciation and amortization 63,141,163 57,767,477 5,373,686 9.3%
Depreciation and Amortization 16,985,856 17,101,815 (115,959) -0.7%Operating (loss) (20,685,888) (21,192,052) 506,164 -2.4%
Non-Operating Revenues (Expenses)Special Assessment for Debt Service 29,694,891 26,882,700 2,812,191 10.5%Other Non-Operating Revenues 14,838,897 10,435,978 4,402,919 42.2%Interest Expense (14,566,035) (12,169,963) (2,396,072) 19.7%Other Non-Operating Expense (4,103,448) (2,474,481) (1,628,967) 65.8%Total Non-operating Revenues(Expenses) 25,864,305 22,674,234 3,190,071 14.1%
Net Income before contributed capital 5,178,417 1,482,182 3,696,235 249.4%
Contributed capital 3,634,845 1,828,196 1,806,649 98.8%
Change in net position 8,813,262 3,310,378 5,502,884 166.2%
Net position begining of year 409,291,488 405,447,273 3,844,215 0.9%Prior period adjustment 533,837 (533,837) -100.0%
Net position end of year 418,104,750$ 409,291,488$ 8,813,262$ 2.2%
Condensed Statement of Revenues, Expenses and Changes in Net Position
Santa Margarita Water District Management’s Discussion and Analysis
For the Year Ended June 30, 2014
7
and the sale of excess capacity in a pipeline for $4,117,110. These revenues were partially offset by issuance costs for the new CFD bond issued as well as payment of reimbursement agreements from the bond funds.
In 2014 the District’s capital contribution increased 98.8% or $1,806,649 primarily due to an increase in receipt of grant funds for capital facilities.
Restrictions, commitments or other limitations significantly affect the availability of fund resources for future use. Future commitments include bond refinancing in fiscal year 2015 that will reduce the total debt for the District.
Capital Asset Administration
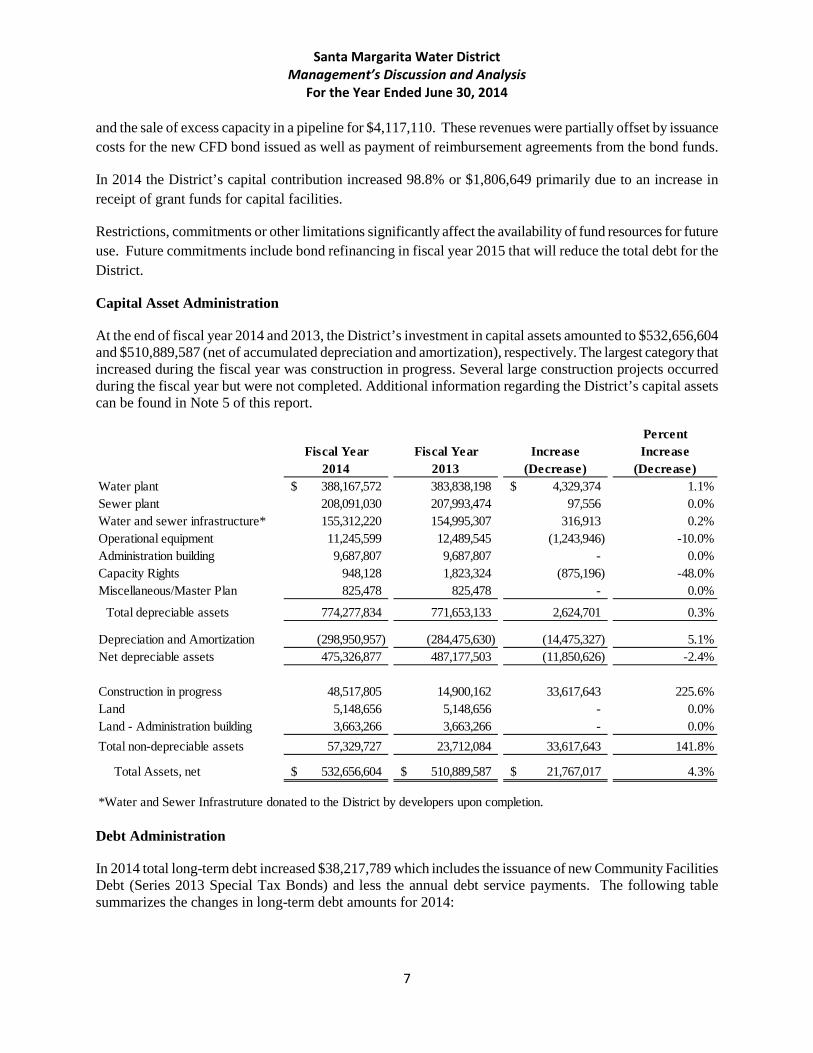
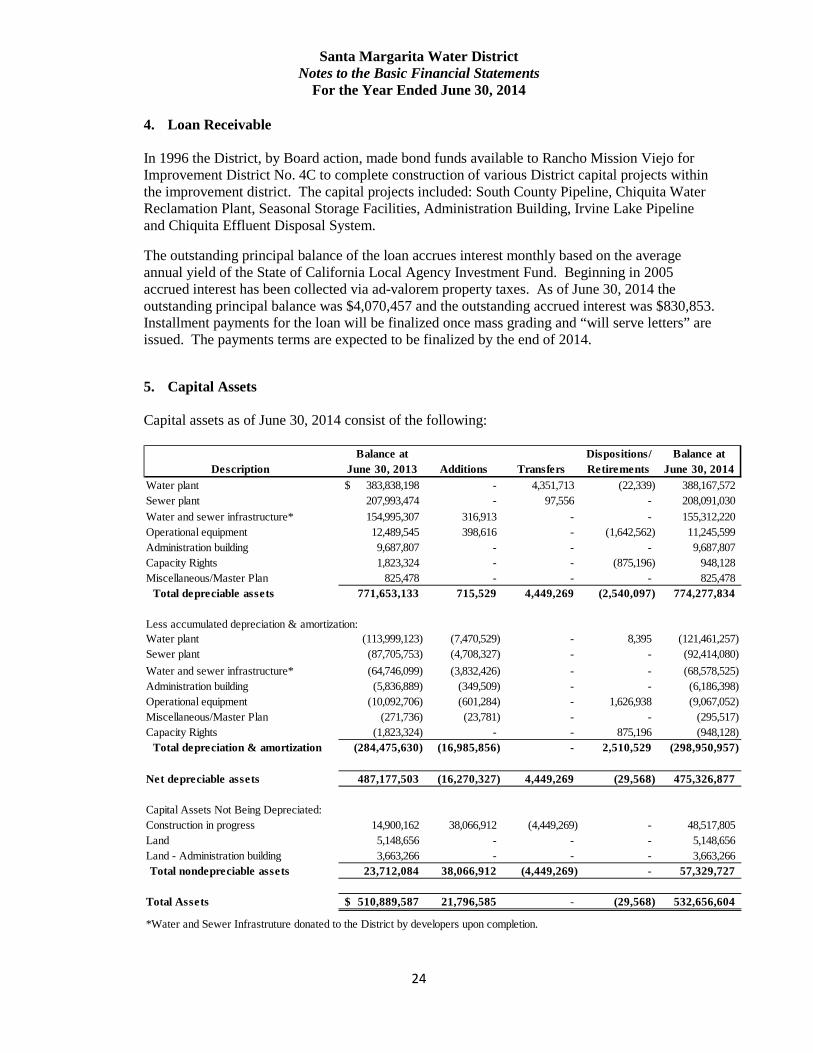
At the end of fiscal year 2014 and 2013, the District’s investment in capital assets amounted to $532,656,604 and $510,889,587 (net of accumulated depreciation and amortization), respectively. The largest category that increased during the fiscal year was construction in progress. Several large construction projects occurred during the fiscal year but were not completed. Additional information regarding the District’s capital assets can be found in Note 5 of this report.
Debt Administration
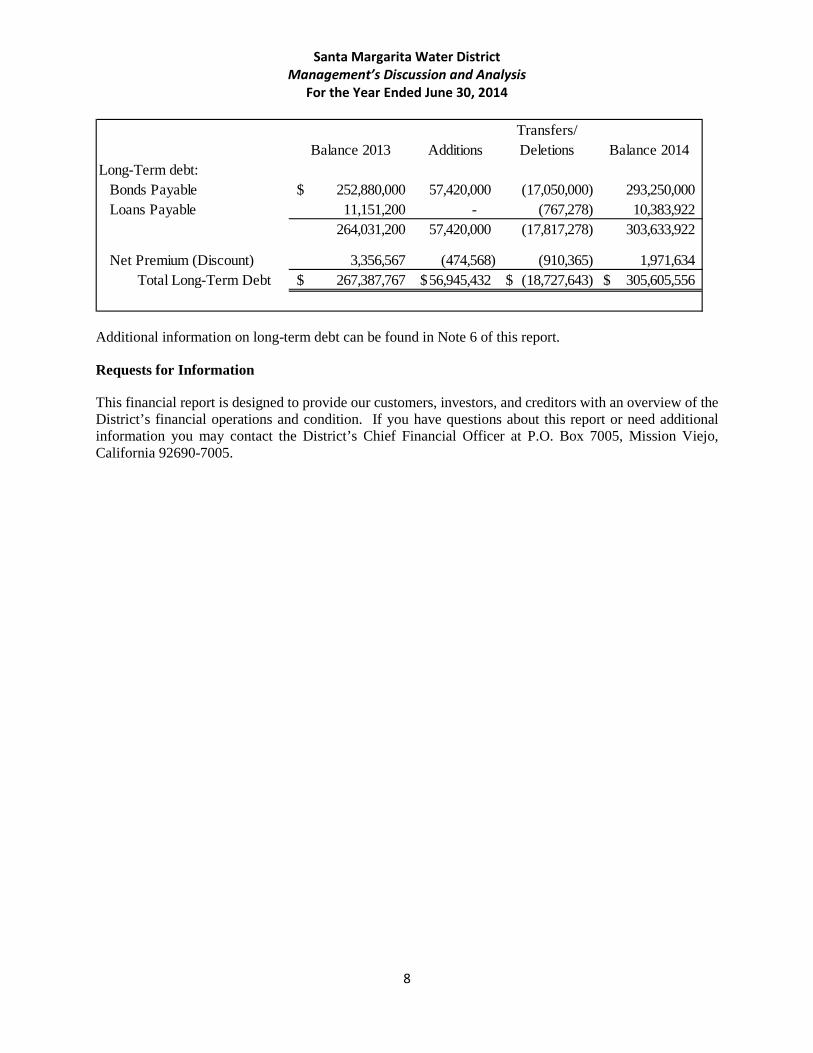
In 2014 total long-term debt increased $38,217,789 which includes the issuance of new Community Facilities Debt (Series 2013 Special Tax Bonds) and less the annual debt service payments. The following table summarizes the changes in long-term debt amounts for 2014:
PercentFiscal Year Fiscal Year Increase Increase
2014 2013 (Decrease) (Decrease)Water plant 388,167,572$ 383,838,198 4,329,374$ 1.1%Sewer plant 208,091,030 207,993,474 97,556 0.0%Water and sewer infrastructure* 155,312,220 154,995,307 316,913 0.2%Operational equipment 11,245,599 12,489,545 (1,243,946) -10.0%Administration building 9,687,807 9,687,807 - 0.0%Capacity Rights 948,128 1,823,324 (875,196) -48.0%Miscellaneous/Master Plan 825,478 825,478 - 0.0%
Total depreciable assets 774,277,834 771,653,133 2,624,701 0.3%
Depreciation and Amortization (298,950,957) (284,475,630) (14,475,327) 5.1%Net depreciable assets 475,326,877 487,177,503 (11,850,626) -2.4%
Construction in progress 48,517,805 14,900,162 33,617,643 225.6%Land 5,148,656 5,148,656 - 0.0%Land - Administration building 3,663,266 3,663,266 - 0.0%Total non-depreciable assets 57,329,727 23,712,084 33,617,643 141.8%
Total Assets, net 532,656,604$ 510,889,587$ 21,767,017$ 4.3%
*Water and Sewer Infrastruture donated to the District by developers upon completion.
Santa Margarita Water District Management’s Discussion and Analysis
For the Year Ended June 30, 2014
8
Additional information on long-term debt can be found in Note 6 of this report.
Requests for Information
This financial report is designed to provide our customers, investors, and creditors with an overview of the District’s financial operations and condition. If you have questions about this report or need additional information you may contact the District’s Chief Financial Officer at P.O. Box 7005, Mission Viejo, California 92690-7005.
Balance 2013 AdditionsTransfers/ Deletions Balance 2014
Long-Term debt:Bonds Payable 252,880,000$ 57,420,000 (17,050,000) 293,250,000 Loans Payable 11,151,200 - (767,278) 10,383,922
264,031,200 57,420,000 (17,817,278) 303,633,922
Net Premium (Discount) 3,356,567 (474,568) (910,365) 1,971,634 Total Long-Term Debt 267,387,767$ 56,945,432$ (18,727,643)$ 305,605,556$

This page intentionally left blank
Basic Financial Statements and Accompanying Notes
9
ASSETS:Current Assets:
Cash and investments (Note 2) 90,450,133$ Accrued interest receivable 185,016 Accounts receivable - water and sanitation customers (Note 3) 6,820,948 Accounts receivable - other (Note 3) 1,647,562 Property taxes receivable 635,646 Water and supplies inventory 1,560,169 Prepaid expenses 331,408 Restricted - cash and investments (Note 2) 42,501,707 Restricted - cash held for others (Note 2) 601,964 Restricted - accrued interest receivable 126,569
Total Current Assets 144,861,122
Non-current Assets:Capital assets - not depreciated (Note 5) 57,329,727 Capital assets, net of accumulated depreciation & amortization (Note 5) 475,326,877 Restricted - unspent bond proceeds (Note 2) 56,564,485 Restricted - cash for debt reserve funds (Note 2) 12,494,185 Prepaid insurance on outstanding bonds payable 635,501 Loan receivable (Note 4) 4,901,310
Total Non-current Assets 607,252,085
Total Assets 752,113,207
Deferred outflows of resources:Deferred loss on debt defeasance (Note 6) 4,701,076
Total Assets and Deferred Outflows of Resources 756,814,283$
Continued on next page
SANTA MARGARITA WATER DISTRICTStatement of Net Position
As of June 30, 2014
See accompanying notes to the basic financial statements.
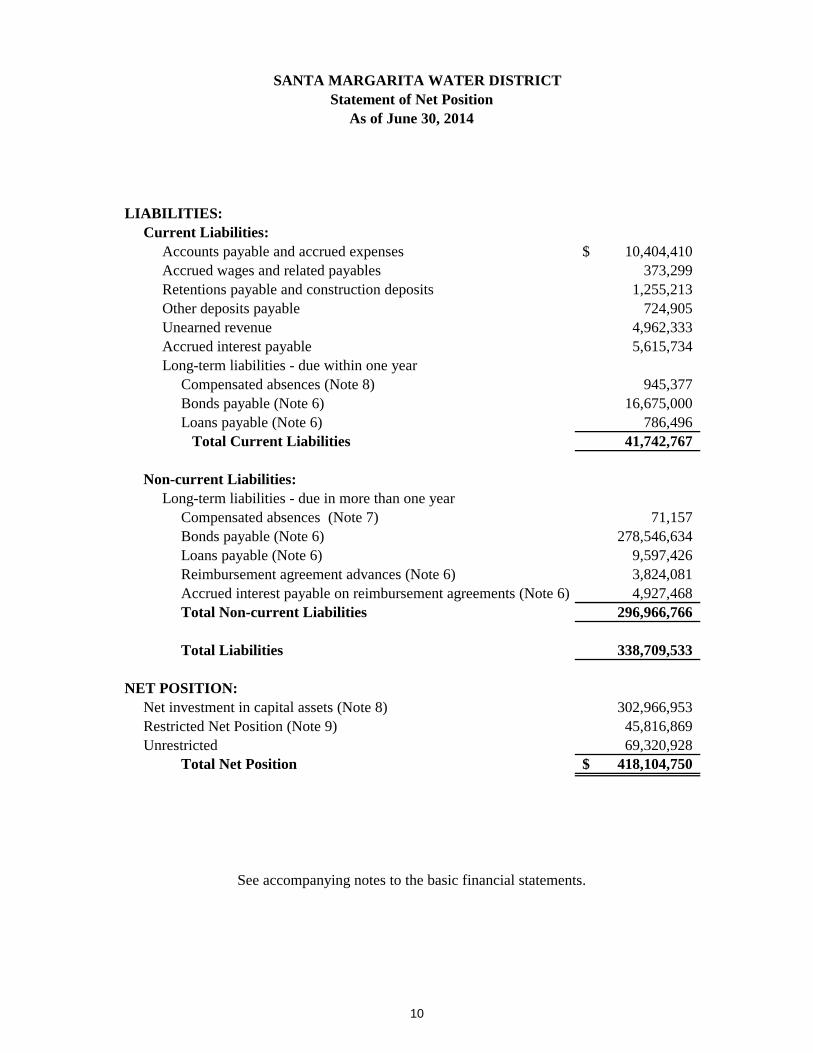
10
LIABILITIES:Current Liabilities:
Accounts payable and accrued expenses 10,404,410$ Accrued wages and related payables 373,299 Retentions payable and construction deposits 1,255,213 Other deposits payable 724,905 Unearned revenue 4,962,333 Accrued interest payable 5,615,734 Long-term liabilities - due within one year
Compensated absences (Note 8) 945,377 Bonds payable (Note 6) 16,675,000 Loans payable (Note 6) 786,496
Total Current Liabilities 41,742,767
Non-current Liabilities:Long-term liabilities - due in more than one year
Compensated absences (Note 7) 71,157 Bonds payable (Note 6) 278,546,634 Loans payable (Note 6) 9,597,426 Reimbursement agreement advances (Note 6) 3,824,081 Accrued interest payable on reimbursement agreements (Note 6) 4,927,468 Total Non-current Liabilities 296,966,766
Total Liabilities 338,709,533
NET POSITION:Net investment in capital assets (Note 8) 302,966,953 Restricted Net Position (Note 9) 45,816,869 Unrestricted 69,320,928
Total Net Position 418,104,750$
SANTA MARGARITA WATER DISTRICTStatement of Net Position
As of June 30, 2014
See accompanying notes to the basic financial statements.

11
OPERATING REVENUES:Water sales:
Water commodity charge 29,088,099$ Monthly service charge 5,294,867 Transmission charge 1,795,942
Total water sales 36,178,908
Sanitation services charges:Sanitation service charge 12,385,305 Monthly service charge 6,252,730 Transmission charge 395,185
Total sanitation service charges 19,033,220
Other charges or services:Jointly operated facilities and other reimbursements 1,080,018 Construction related revenues 708,874 Rebates 221,760 Customer related revenues 698,786 Other revenues 1,519,565
Total other charges or services 4,229,003 Total Operating Revenues 59,441,131
OPERATING EXPENSES:Source of supply - water purchases 28,264,492 Power 4,944,194 Transmission and distribution 6,283,927 Regional facilities 3,076,129 Sewage treatment 2,481,884 Salaries, wages and related benefits 14,606,120 Customer relations 448,664 General and administrative 3,035,753
Total Operating Expenses 63,141,163
Operating (loss) before depreciation and amortization expense (3,700,032) Depreciation and amortization expense (16,985,856)
Operating (loss) (20,685,888)$
Continued on next page
SANTA MARGARITA WATER DISTRICTStatement of Revenues, Expenses and Changes in Net Position
For the Year Ended June 30, 2014
See accompanying notes to the basic financial statements.
12
SANTA MARGARITA WATER DISTRICTStatement of Revenues, Expenses and Changes in Net Position
For the Year Ended June 30, 2014
NON-OPERATING REVENUES (EXPENSES)
Special assessment tax revenues for debt service 29,694,891$ Property taxes for operations 6,118,055 Investment earnings 1,577,099 Capacity lease revenue 809,832 Rental revenue 1,199,966 Interest expense (14,566,035) Gain/(Loss) on sale of capital asset 4,203,401 Debt issuance costs (965,681) Other non-operating revenue 930,544 Contributions to other agencies (3,137,767)
Total non-operating, Revenues(Expenses) 25,864,305 Net income before capital contributions 5,178,417
CAPITAL CONTRIBUTIONSContributed facilities 316,913 Jointly-operated facilities capital reimbursements 83,078 Capital grants 3,234,854
Total capital contributions 3,634,845 Change in net position 8,813,262
Net position, beginning of year 409,291,488
Net position, end of year 418,104,750$
See accompanying notes to the basic financial statements.
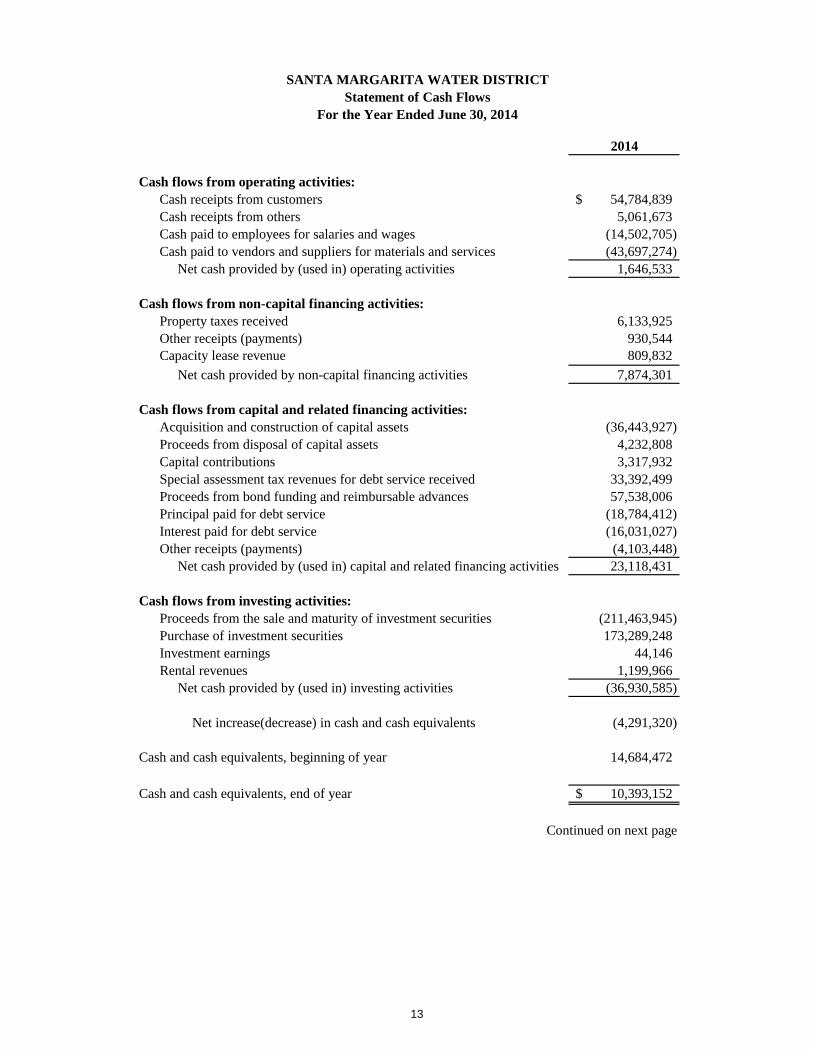
13
2014
Cash flows from operating activities:Cash receipts from customers 54,784,839$ Cash receipts from others 5,061,673 Cash paid to employees for salaries and wages (14,502,705) Cash paid to vendors and suppliers for materials and services (43,697,274)
Net cash provided by (used in) operating activities 1,646,533
Cash flows from non-capital financing activities:Property taxes received 6,133,925 Other receipts (payments) 930,544 Capacity lease revenue 809,832
Net cash provided by non-capital financing activities 7,874,301
Cash flows from capital and related financing activities:Acquisition and construction of capital assets (36,443,927) Proceeds from disposal of capital assets 4,232,808 Capital contributions 3,317,932 Special assessment tax revenues for debt service received 33,392,499 Proceeds from bond funding and reimbursable advances 57,538,006 Principal paid for debt service (18,784,412) Interest paid for debt service (16,031,027) Other receipts (payments) (4,103,448)
Net cash provided by (used in) capital and related financing activities 23,118,431
Cash flows from investing activities:Proceeds from the sale and maturity of investment securities (211,463,945) Purchase of investment securities 173,289,248 Investment earnings 44,146 Rental revenues 1,199,966
Net cash provided by (used in) investing activities (36,930,585)
Net increase(decrease) in cash and cash equivalents (4,291,320)
Cash and cash equivalents, beginning of year 14,684,472
Cash and cash equivalents, end of year 10,393,152$
Continued on next page
SANTA MARGARITA WATER DISTRICTStatement of Cash Flows
For the Year Ended June 30, 2014
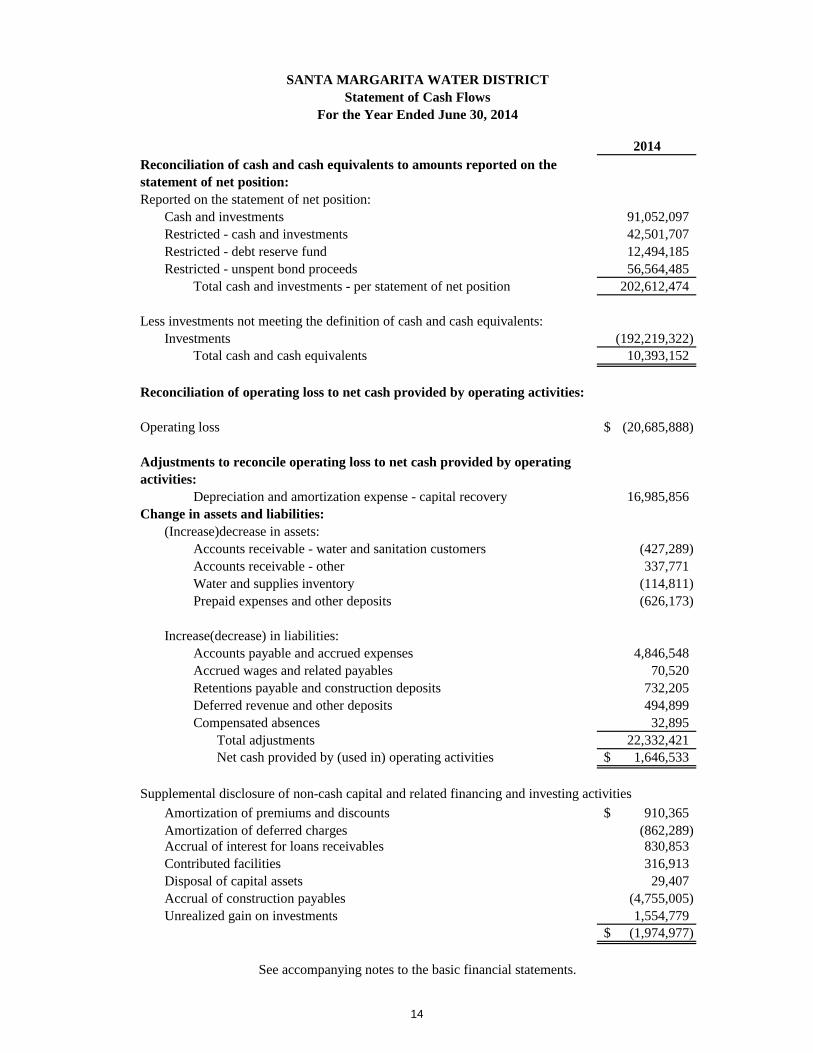
14
2014
Reported on the statement of net position:Cash and investments 91,052,097 Restricted - cash and investments 42,501,707 Restricted - debt reserve fund 12,494,185 Restricted - unspent bond proceeds 56,564,485
Total cash and investments - per statement of net position 202,612,474
Less investments not meeting the definition of cash and cash equivalents:Investments (192,219,322)
Total cash and cash equivalents 10,393,152
Reconciliation of operating loss to net cash provided by operating activities:
Operating loss (20,685,888)$
Depreciation and amortization expense - capital recovery 16,985,856 Change in assets and liabilities:
(Increase)decrease in assets:Accounts receivable - water and sanitation customers (427,289) Accounts receivable - other 337,771 Water and supplies inventory (114,811) Prepaid expenses and other deposits (626,173)
Increase(decrease) in liabilities:Accounts payable and accrued expenses 4,846,548 Accrued wages and related payables 70,520 Retentions payable and construction deposits 732,205 Deferred revenue and other deposits 494,899 Compensated absences 32,895
Total adjustments 22,332,421 Net cash provided by (used in) operating activities 1,646,533$
Supplemental disclosure of non-cash capital and related financing and investing activitiesAmortization of premiums and discounts 910,365$
Amortization of deferred charges (862,289) Accrual of interest for loans receivables 830,853 Contributed facilities 316,913 Disposal of capital assets 29,407 Accrual of construction payables (4,755,005) Unrealized gain on investments 1,554,779
(1,974,977)$
For the Year Ended June 30, 2014
See accompanying notes to the basic financial statements.
SANTA MARGARITA WATER DISTRICTStatement of Cash Flows
Reconciliation of cash and cash equivalents to amounts reported on the statement of net position:
Adjustments to reconcile operating loss to net cash provided by operating activities:
Santa Margarita Water District Notes to the Basic Financial Statements
For the Year Ended June 30, 2014
15
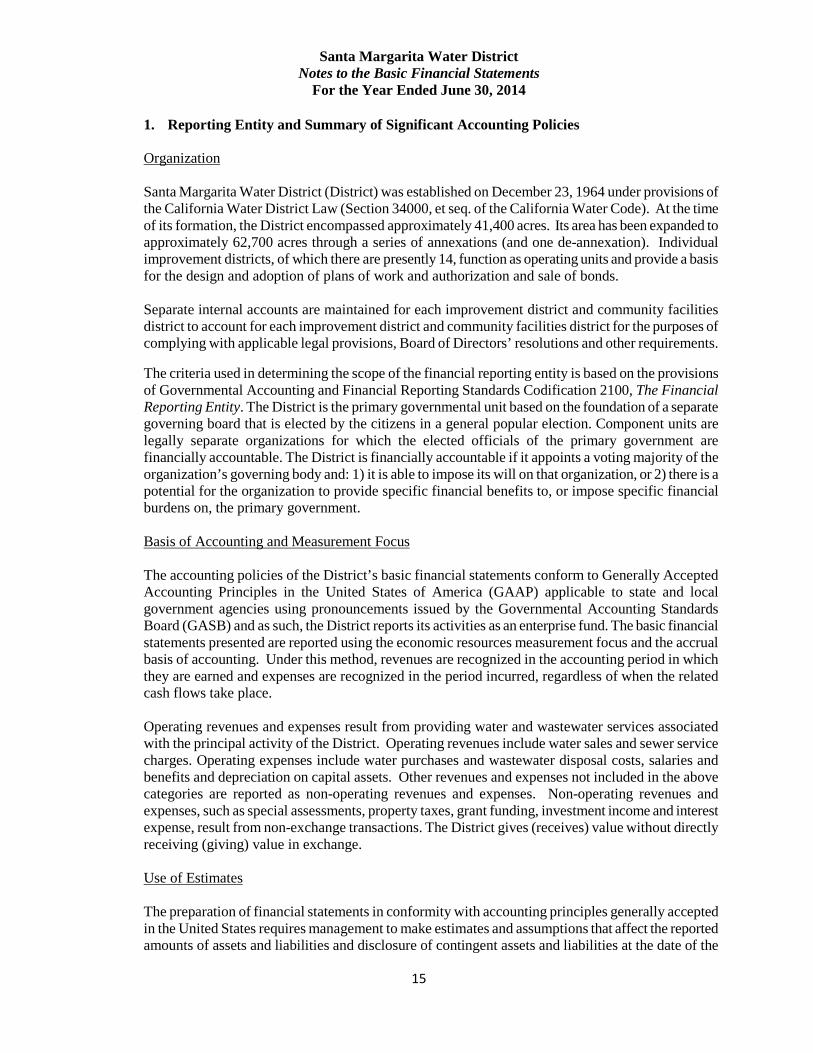
1. Reporting Entity and Summary of Significant Accounting Policies
Organization Santa Margarita Water District (District) was established on December 23, 1964 under provisions of the California Water District Law (Section 34000, et seq. of the California Water Code). At the time of its formation, the District encompassed approximately 41,400 acres. Its area has been expanded to approximately 62,700 acres through a series of annexations (and one de-annexation). Individual improvement districts, of which there are presently 14, function as operating units and provide a basis for the design and adoption of plans of work and authorization and sale of bonds.
Separate internal accounts are maintained for each improvement district and community facilities district to account for each improvement district and community facilities district for the purposes of complying with applicable legal provisions, Board of Directors’ resolutions and other requirements.
The criteria used in determining the scope of the financial reporting entity is based on the provisions of Governmental Accounting and Financial Reporting Standards Codification 2100, The Financial Reporting Entity. The District is the primary governmental unit based on the foundation of a separate governing board that is elected by the citizens in a general popular election. Component units are legally separate organizations for which the elected officials of the primary government are financially accountable. The District is financially accountable if it appoints a voting majority of the organization’s governing body and: 1) it is able to impose its will on that organization, or 2) there is a potential for the organization to provide specific financial benefits to, or impose specific financial burdens on, the primary government. Basis of Accounting and Measurement Focus The accounting policies of the District’s basic financial statements conform to Generally Accepted Accounting Principles in the United States of America (GAAP) applicable to state and local government agencies using pronouncements issued by the Governmental Accounting Standards Board (GASB) and as such, the District reports its activities as an enterprise fund. The basic financial statements presented are reported using the economic resources measurement focus and the accrual basis of accounting. Under this method, revenues are recognized in the accounting period in which they are earned and expenses are recognized in the period incurred, regardless of when the related cash flows take place. Operating revenues and expenses result from providing water and wastewater services associated with the principal activity of the District. Operating revenues include water sales and sewer service charges. Operating expenses include water purchases and wastewater disposal costs, salaries and benefits and depreciation on capital assets. Other revenues and expenses not included in the above categories are reported as non-operating revenues and expenses. Non-operating revenues and expenses, such as special assessments, property taxes, grant funding, investment income and interest expense, result from non-exchange transactions. The District gives (receives) value without directly receiving (giving) value in exchange.
Use of Estimates The preparation of financial statements in conformity with accounting principles generally accepted in the United States requires management to make estimates and assumptions that affect the reported amounts of assets and liabilities and disclosure of contingent assets and liabilities at the date of the
Santa Margarita Water District Notes to the Basic Financial Statements
For the Year Ended June 30, 2014
16
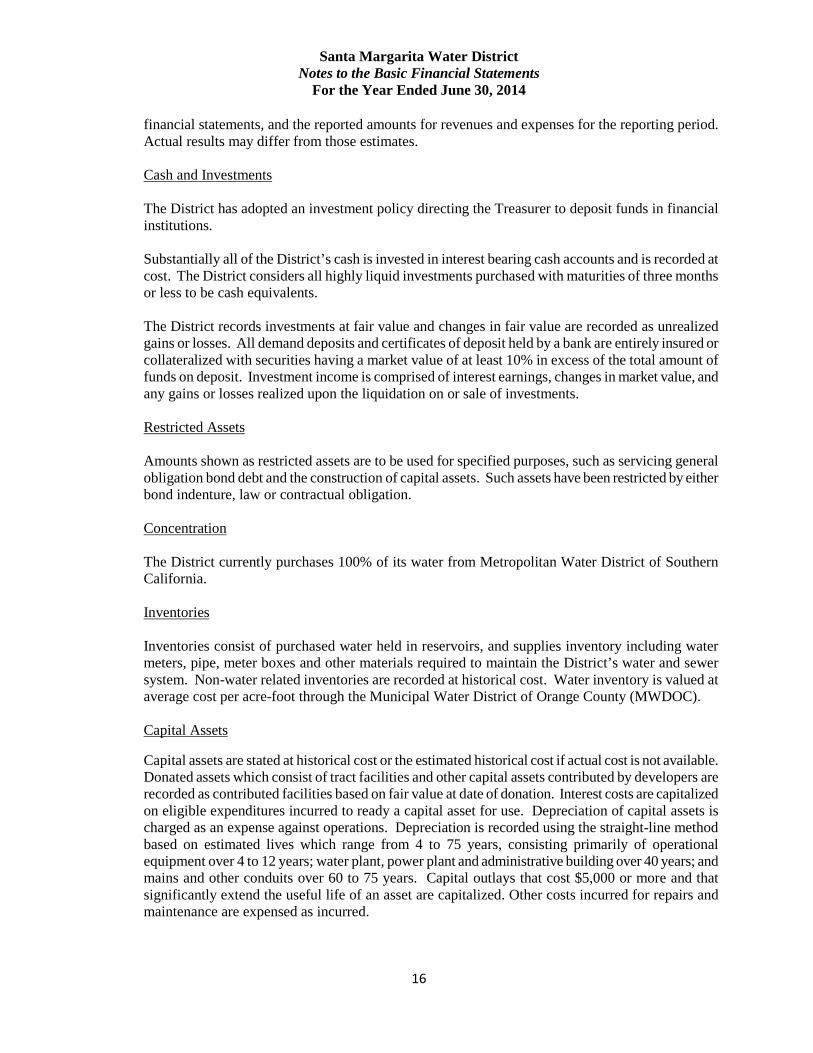
financial statements, and the reported amounts for revenues and expenses for the reporting period. Actual results may differ from those estimates.
Cash and Investments The District has adopted an investment policy directing the Treasurer to deposit funds in financial institutions. Substantially all of the District’s cash is invested in interest bearing cash accounts and is recorded at cost. The District considers all highly liquid investments purchased with maturities of three months or less to be cash equivalents. The District records investments at fair value and changes in fair value are recorded as unrealized gains or losses. All demand deposits and certificates of deposit held by a bank are entirely insured or collateralized with securities having a market value of at least 10% in excess of the total amount of funds on deposit. Investment income is comprised of interest earnings, changes in market value, and any gains or losses realized upon the liquidation on or sale of investments. Restricted Assets Amounts shown as restricted assets are to be used for specified purposes, such as servicing general obligation bond debt and the construction of capital assets. Such assets have been restricted by either bond indenture, law or contractual obligation. Concentration The District currently purchases 100% of its water from Metropolitan Water District of Southern California. Inventories Inventories consist of purchased water held in reservoirs, and supplies inventory including water meters, pipe, meter boxes and other materials required to maintain the District’s water and sewer system. Non-water related inventories are recorded at historical cost. Water inventory is valued at average cost per acre-foot through the Municipal Water District of Orange County (MWDOC). Capital Assets
Capital assets are stated at historical cost or the estimated historical cost if actual cost is not available. Donated assets which consist of tract facilities and other capital assets contributed by developers are recorded as contributed facilities based on fair value at date of donation. Interest costs are capitalized on eligible expenditures incurred to ready a capital asset for use. Depreciation of capital assets is charged as an expense against operations. Depreciation is recorded using the straight-line method based on estimated lives which range from 4 to 75 years, consisting primarily of operational equipment over 4 to 12 years; water plant, power plant and administrative building over 40 years; and mains and other conduits over 60 to 75 years. Capital outlays that cost $5,000 or more and that significantly extend the useful life of an asset are capitalized. Other costs incurred for repairs and maintenance are expensed as incurred.
Santa Margarita Water District Notes to the Basic Financial Statements
For the Year Ended June 30, 2014
17
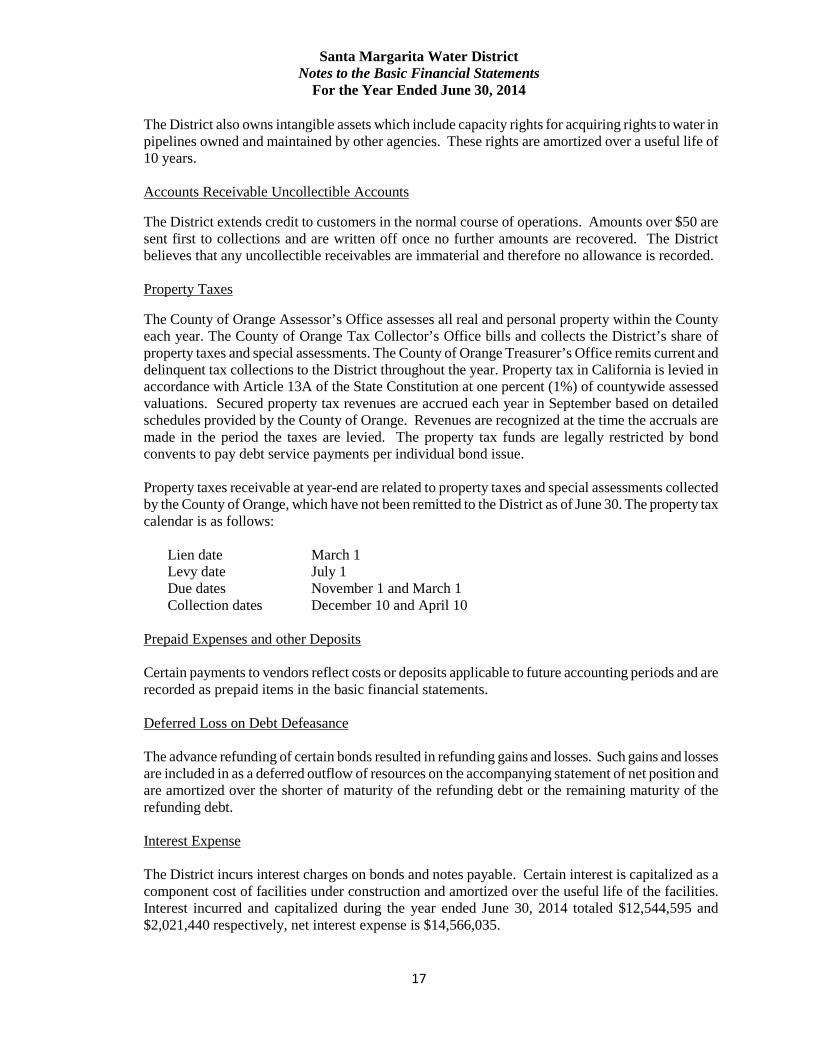
The District also owns intangible assets which include capacity rights for acquiring rights to water in pipelines owned and maintained by other agencies. These rights are amortized over a useful life of 10 years. Accounts Receivable Uncollectible Accounts
The District extends credit to customers in the normal course of operations. Amounts over $50 are sent first to collections and are written off once no further amounts are recovered. The District believes that any uncollectible receivables are immaterial and therefore no allowance is recorded. Property Taxes
The County of Orange Assessor’s Office assesses all real and personal property within the County each year. The County of Orange Tax Collector’s Office bills and collects the District’s share of property taxes and special assessments. The County of Orange Treasurer’s Office remits current and delinquent tax collections to the District throughout the year. Property tax in California is levied in accordance with Article 13A of the State Constitution at one percent (1%) of countywide assessed valuations. Secured property tax revenues are accrued each year in September based on detailed schedules provided by the County of Orange. Revenues are recognized at the time the accruals are made in the period the taxes are levied. The property tax funds are legally restricted by bond convents to pay debt service payments per individual bond issue. Property taxes receivable at year-end are related to property taxes and special assessments collected by the County of Orange, which have not been remitted to the District as of June 30. The property tax calendar is as follows:
Lien date March 1 Levy date July 1 Due dates November 1 and March 1 Collection dates December 10 and April 10
Prepaid Expenses and other Deposits Certain payments to vendors reflect costs or deposits applicable to future accounting periods and are recorded as prepaid items in the basic financial statements.
Deferred Loss on Debt Defeasance The advance refunding of certain bonds resulted in refunding gains and losses. Such gains and losses are included in as a deferred outflow of resources on the accompanying statement of net position and are amortized over the shorter of maturity of the refunding debt or the remaining maturity of the refunding debt. Interest Expense The District incurs interest charges on bonds and notes payable. Certain interest is capitalized as a component cost of facilities under construction and amortized over the useful life of the facilities. Interest incurred and capitalized during the year ended June 30, 2014 totaled $12,544,595 and $2,021,440 respectively, net interest expense is $14,566,035.
Santa Margarita Water District Notes to the Basic Financial Statements
For the Year Ended June 30, 2014
18
Compensated Absences The District’s personnel policies provide for the accumulation of general leave for vacation and sick time. Full-time employees earn from 140 to 272 hours per year, depending on their length of employment. General leave may be accumulated to a maximum of twice the employee’s annual entitlement or 400 hours, whichever occurs first. Eligible part-time employees accrue general leave on a pro-rata based on the number of hours worked in a regular workweek divided by 40 hours. All accrued and unused general leave is paid to the employee upon termination of employment or retirement. The cost of vested or accumulated general leave is accrued as an expense as benefits are incurred to the employee. Net Position Net position consists of the difference between assets and deferred outflows, and liabilities and deferred inflows. Net position is categorized as follows: Net Investment in Capital Assets– This component of net position consists of capital assets, net of accumulated depreciation and reduced by any debt outstanding against the acquisition, construction or improvement of those assets. Deferred outflows of resources and deferred inflows or resources that are attributable to the acquisition, construction or improvement of those assets or related debt are included in this component of net position.
Restricted – This component of net position consists of assets that have limitations imposed on their use through external restrictions imposed by creditors or other state and federal government regulatory agencies. These are then reduced by liabilities and deferred inflows of resources related to those assets. Unrestricted– This component of net position is the net amount of the assets, deferred outflows or resources, liabilities, and deferred inflows of resources that are not included in the determination of the net investment in capital assets or restricted net position. New Accounting Pronouncements The GASB has issued pronouncements that will impact future financial presentations. Management has not currently determined the specific amounts, but it believes that GASB No. 68 will result in a material liability being recognized in the financial statements during fiscal year 2015.
GASB No. 68, Accounting and Financial Reporting for Pensions – an amendment of GASB Statement No. 27. Effective for the District’s fiscal year ending June 30, 2015. GASB No. 69, Government Combinations and Disposal of Government Operations. Effective for the District’s fiscal year ending June 30, 2015. GASB No. 71, Pension Transition for Contributions Made Subsequent to the Measurement Date-An Amendment of GASB Statement No. 68. Effective for the District’s fiscal year ending June 30, 2015.
Santa Margarita Water District Notes to the Basic Financial Statements
For the Year Ended June 30, 2014
19
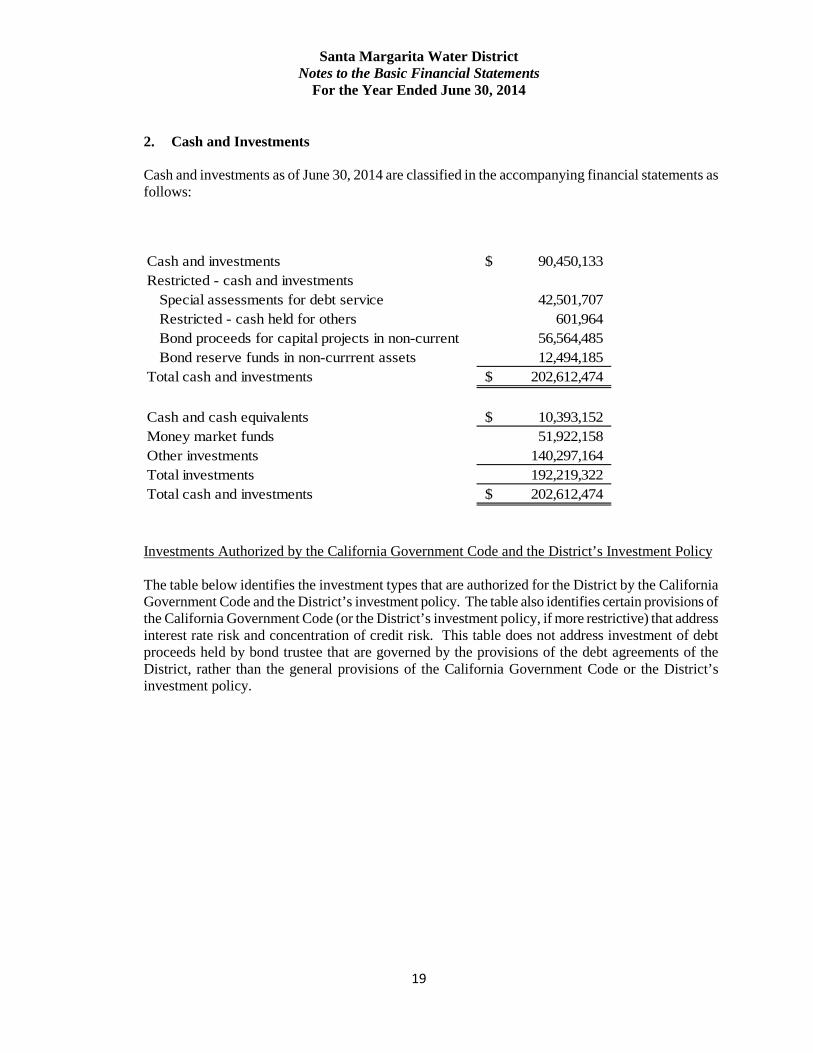
2. Cash and Investments
Cash and investments as of June 30, 2014 are classified in the accompanying financial statements as follows:
Cash and investments 90,450,133$ Restricted - cash and investments
Special assessments for debt service 42,501,707 Restricted - cash held for others 601,964 Bond proceeds for capital projects in non-current 56,564,485 Bond reserve funds in non-currrent assets 12,494,185
Total cash and investments 202,612,474$
Cash and cash equivalents 10,393,152$ Money market funds 51,922,158 Other investments 140,297,164 Total investments 192,219,322 Total cash and investments 202,612,474$
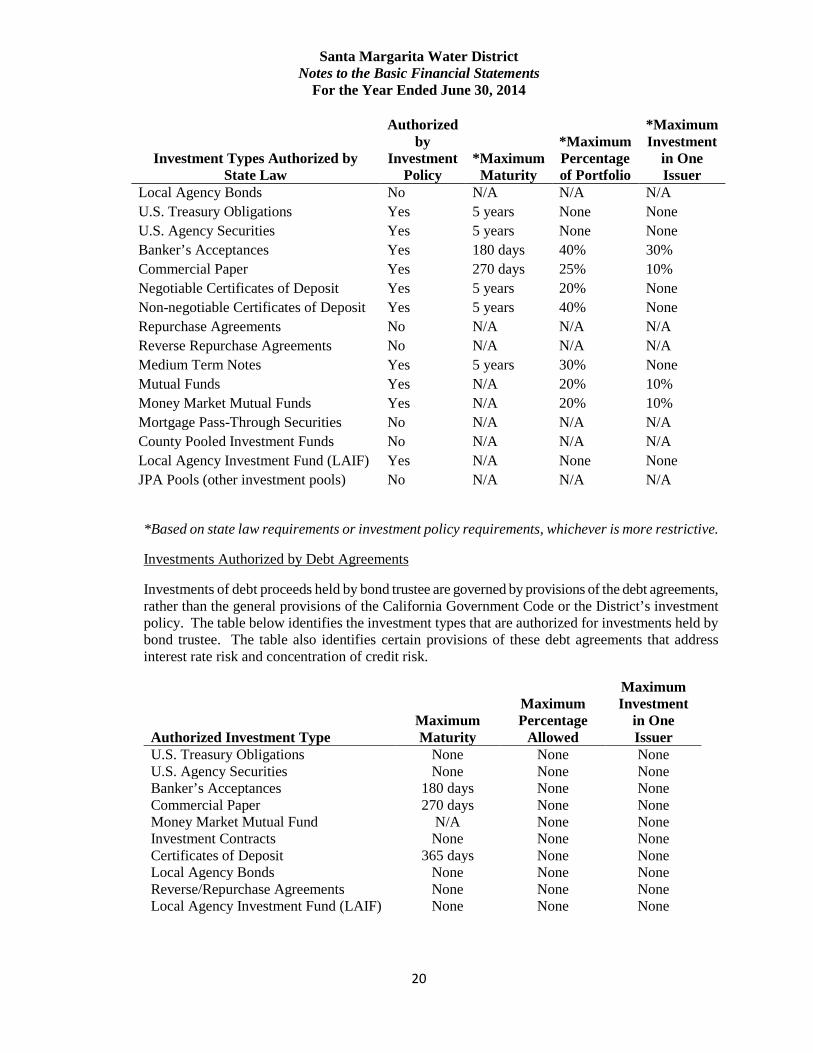
Investments Authorized by the California Government Code and the District’s Investment Policy The table below identifies the investment types that are authorized for the District by the California Government Code and the District’s investment policy. The table also identifies certain provisions of the California Government Code (or the District’s investment policy, if more restrictive) that address interest rate risk and concentration of credit risk. This table does not address investment of debt proceeds held by bond trustee that are governed by the provisions of the debt agreements of the District, rather than the general provisions of the California Government Code or the District’s investment policy.
Santa Margarita Water District Notes to the Basic Financial Statements
For the Year Ended June 30, 2014
20
Investment Types Authorized by State Law
Authorized by
Investment Policy
*Maximum Maturity
*Maximum Percentage of Portfolio
*Maximum Investment
in One Issuer
Local Agency Bonds No N/A N/A N/A U.S. Treasury Obligations Yes 5 years None None U.S. Agency Securities Yes 5 years None None Banker’s Acceptances Yes 180 days 40% 30% Commercial Paper Yes 270 days 25% 10% Negotiable Certificates of Deposit Yes 5 years 20% None Non-negotiable Certificates of Deposit Yes 5 years 40% None Repurchase Agreements No N/A N/A N/A Reverse Repurchase Agreements No N/A N/A N/A Medium Term Notes Yes 5 years 30% None Mutual Funds Yes N/A 20% 10% Money Market Mutual Funds Yes N/A 20% 10% Mortgage Pass-Through Securities No N/A N/A N/A County Pooled Investment Funds No N/A N/A N/A Local Agency Investment Fund (LAIF) Yes N/A None None JPA Pools (other investment pools) No N/A N/A N/A
*Based on state law requirements or investment policy requirements, whichever is more restrictive.
Investments Authorized by Debt Agreements
Investments of debt proceeds held by bond trustee are governed by provisions of the debt agreements, rather than the general provisions of the California Government Code or the District’s investment policy. The table below identifies the investment types that are authorized for investments held by bond trustee. The table also identifies certain provisions of these debt agreements that address interest rate risk and concentration of credit risk.
Authorized Investment Type Maximum Maturity
Maximum Percentage
Allowed
Maximum Investment
in One Issuer
U.S. Treasury Obligations None None None U.S. Agency Securities None None None Banker’s Acceptances 180 days None None Commercial Paper 270 days None None Money Market Mutual Fund N/A None None Investment Contracts None None None Certificates of Deposit 365 days None None Local Agency Bonds None None None Reverse/Repurchase Agreements None None None Local Agency Investment Fund (LAIF) None None None
Santa Margarita Water District Notes to the Basic Financial Statements
For the Year Ended June 30, 2014
21
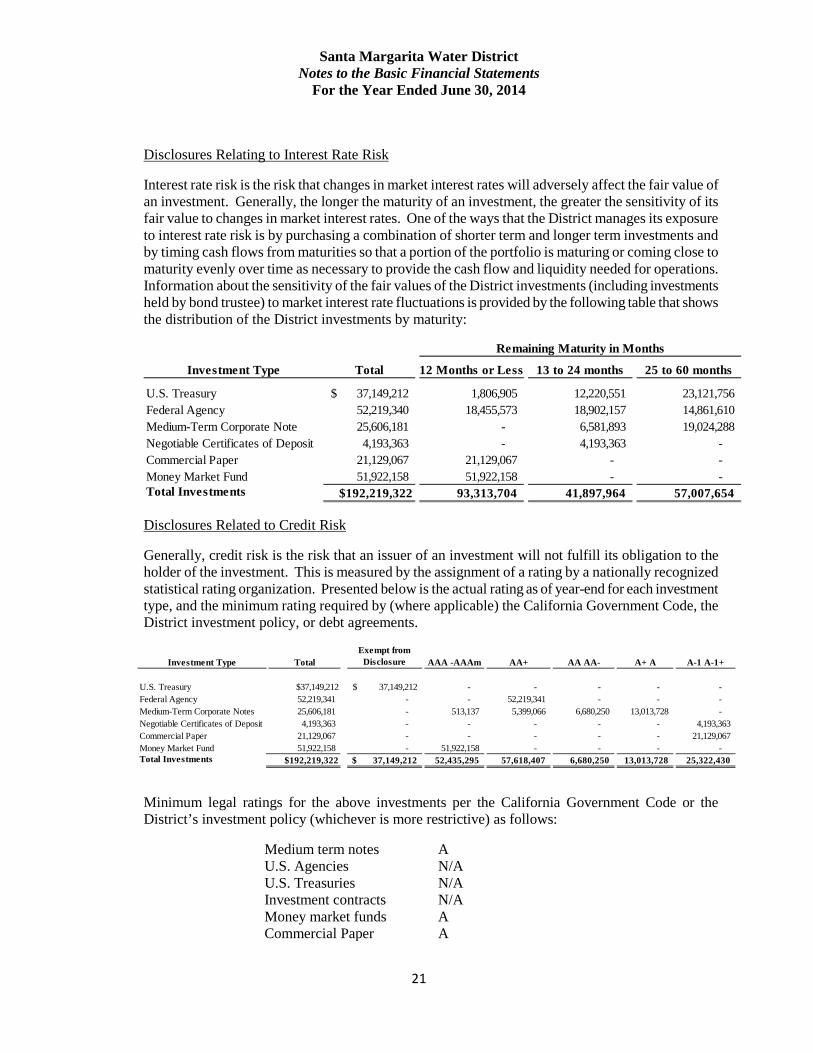
Disclosures Relating to Interest Rate Risk
Interest rate risk is the risk that changes in market interest rates will adversely affect the fair value of an investment. Generally, the longer the maturity of an investment, the greater the sensitivity of its fair value to changes in market interest rates. One of the ways that the District manages its exposure to interest rate risk is by purchasing a combination of shorter term and longer term investments and by timing cash flows from maturities so that a portion of the portfolio is maturing or coming close to maturity evenly over time as necessary to provide the cash flow and liquidity needed for operations. Information about the sensitivity of the fair values of the District investments (including investments held by bond trustee) to market interest rate fluctuations is provided by the following table that shows the distribution of the District investments by maturity:
Disclosures Related to Credit Risk
Generally, credit risk is the risk that an issuer of an investment will not fulfill its obligation to the holder of the investment. This is measured by the assignment of a rating by a nationally recognized statistical rating organization. Presented below is the actual rating as of year-end for each investment type, and the minimum rating required by (where applicable) the California Government Code, the District investment policy, or debt agreements.
Minimum legal ratings for the above investments per the California Government Code or the District’s investment policy (whichever is more restrictive) as follows:
Medium term notes A U.S. Agencies N/A U.S. Treasuries N/A Investment contracts N/A Money market funds A Commercial Paper A
Remaining Maturity in Months
Investment Type Total 12 Months or Less 13 to 24 months 25 to 60 months
U.S. Treasury 37,149,212$ 1,806,905 12,220,551 23,121,756 Federal Agency 52,219,340 18,455,573 18,902,157 14,861,610 Medium-Term Corporate Note 25,606,181 - 6,581,893 19,024,288 Negotiable Certificates of Deposit 4,193,363 - 4,193,363 - Commercial Paper 21,129,067 21,129,067 - - Money Market Fund 51,922,158 51,922,158 - - Total Investments $192,219,322 93,313,704 41,897,964 57,007,654
Investment Type TotalExempt from
Disclosure AAA -AAAm AA+ AA AA- A+ A A-1 A-1+
U.S. Treasury $37,149,212 37,149,212$ - - - - - Federal Agency 52,219,341 - - 52,219,341 - - - Medium-Term Corporate Notes 25,606,181 - 513,137 5,399,066 6,680,250 13,013,728 - Negotiable Certificates of Deposit 4,193,363 - - - - - 4,193,363 Commercial Paper 21,129,067 - - - - - 21,129,067 Money Market Fund 51,922,158 - 51,922,158 - - - - Total Investments $192,219,322 37,149,212$ 52,435,295 57,618,407 6,680,250 13,013,728 25,322,430
Santa Margarita Water District Notes to the Basic Financial Statements
For the Year Ended June 30, 2014
22
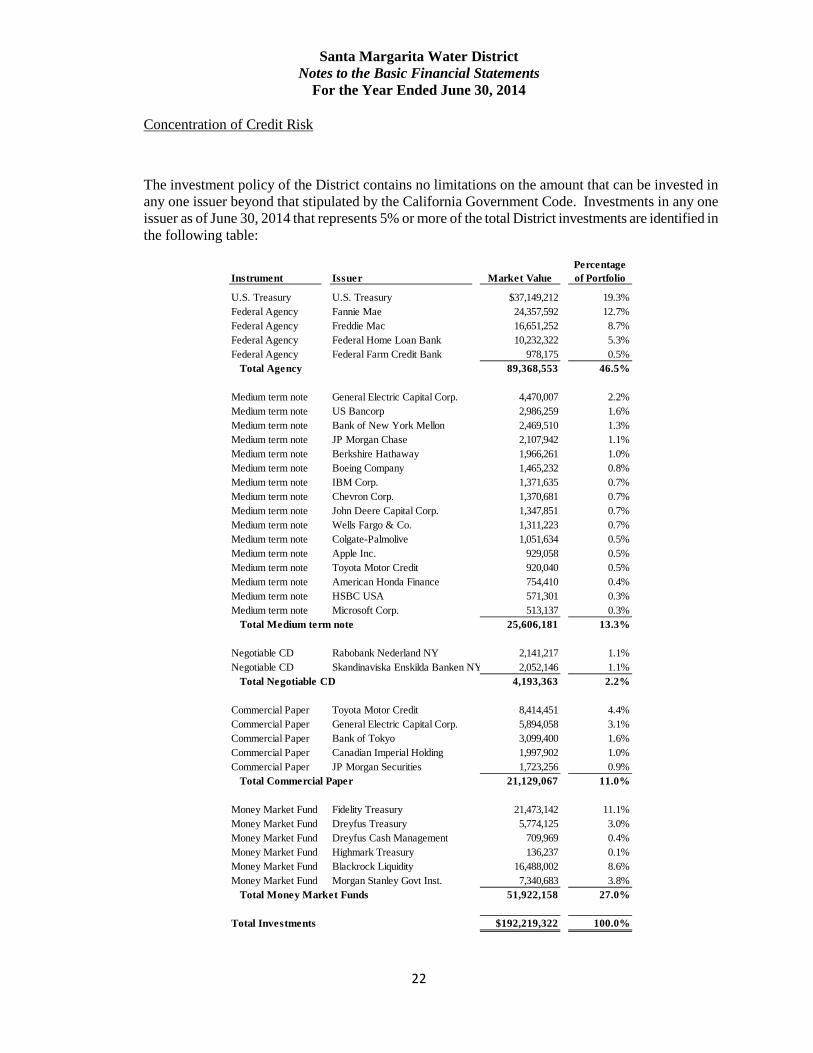
Concentration of Credit Risk
The investment policy of the District contains no limitations on the amount that can be invested in any one issuer beyond that stipulated by the California Government Code. Investments in any one issuer as of June 30, 2014 that represents 5% or more of the total District investments are identified in the following table:
Instrument Issuer Market ValuePercentage of Portfolio
U.S. Treasury U.S. Treasury $37,149,212 19.3%Federal Agency Fannie Mae 24,357,592 12.7%Federal Agency Freddie Mac 16,651,252 8.7%Federal Agency Federal Home Loan Bank 10,232,322 5.3%Federal Agency Federal Farm Credit Bank 978,175 0.5%
Total Agency 89,368,553 46.5%
Medium term note General Electric Capital Corp. 4,470,007 2.2%Medium term note US Bancorp 2,986,259 1.6%Medium term note Bank of New York Mellon 2,469,510 1.3%Medium term note JP Morgan Chase 2,107,942 1.1%Medium term note Berkshire Hathaway 1,966,261 1.0%Medium term note Boeing Company 1,465,232 0.8%Medium term note IBM Corp. 1,371,635 0.7%Medium term note Chevron Corp. 1,370,681 0.7%Medium term note John Deere Capital Corp. 1,347,851 0.7%Medium term note Wells Fargo & Co. 1,311,223 0.7%Medium term note Colgate-Palmolive 1,051,634 0.5%Medium term note Apple Inc. 929,058 0.5%Medium term note Toyota Motor Credit 920,040 0.5%Medium term note American Honda Finance 754,410 0.4%Medium term note HSBC USA 571,301 0.3%Medium term note Microsoft Corp. 513,137 0.3%
Total Medium term note 25,606,181 13.3%
Negotiable CD Rabobank Nederland NY 2,141,217 1.1%Negotiable CD Skandinaviska Enskilda Banken NY 2,052,146 1.1%
Total Negotiable CD 4,193,363 2.2%
Commercial Paper Toyota Motor Credit 8,414,451 4.4%Commercial Paper General Electric Capital Corp. 5,894,058 3.1%Commercial Paper Bank of Tokyo 3,099,400 1.6%Commercial Paper Canadian Imperial Holding 1,997,902 1.0%Commercial Paper JP Morgan Securities 1,723,256 0.9%
Total Commercial Paper 21,129,067 11.0%
Money Market Fund Fidelity Treasury 21,473,142 11.1%Money Market Fund Dreyfus Treasury 5,774,125 3.0%Money Market Fund Dreyfus Cash Management 709,969 0.4%Money Market Fund Highmark Treasury 136,237 0.1%Money Market Fund Blackrock Liquidity 16,488,002 8.6%Money Market Fund Morgan Stanley Govt Inst. 7,340,683 3.8%
Total Money Market Funds 51,922,158 27.0%
Total Investments $192,219,322 100.0%
Santa Margarita Water District Notes to the Basic Financial Statements
For the Year Ended June 30, 2014
23
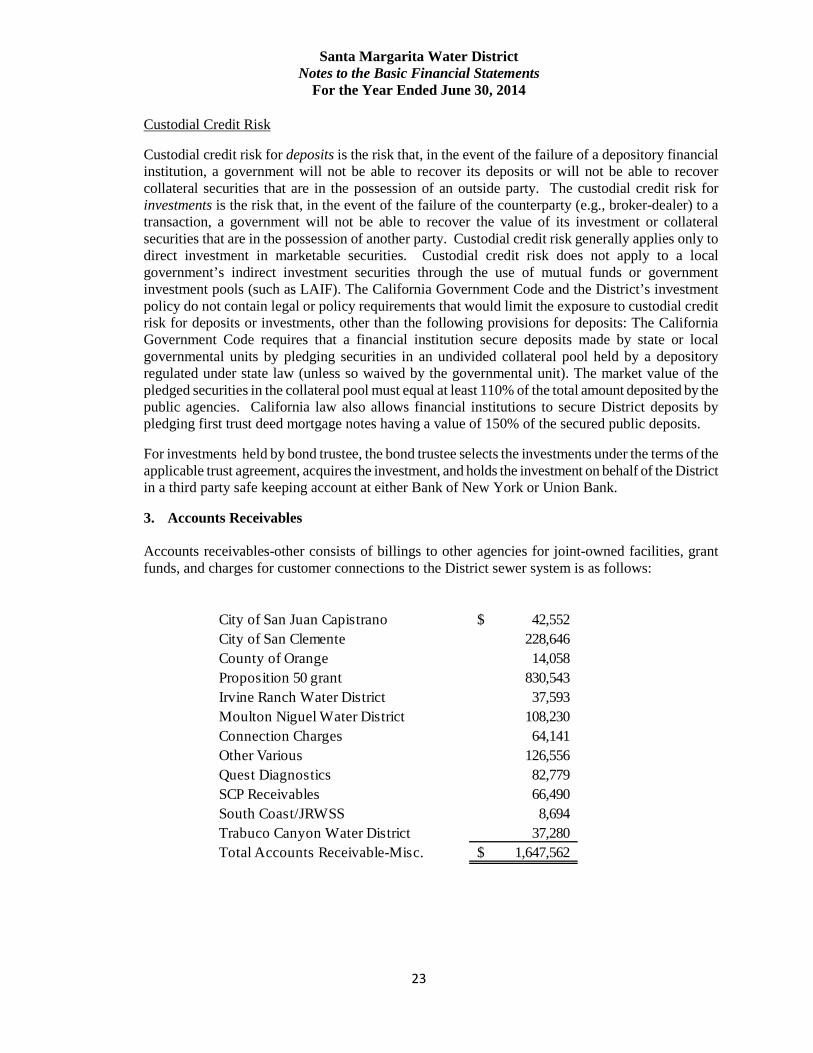
City of San Juan Capistrano 42,552$ City of San Clemente 228,646 County of Orange 14,058 Proposition 50 grant 830,543 Irvine Ranch Water District 37,593 Moulton Niguel Water District 108,230 Connection Charges 64,141 Other Various 126,556 Quest Diagnostics 82,779 SCP Receivables 66,490 South Coast/JRWSS 8,694 Trabuco Canyon Water District 37,280 Total Accounts Receivable-Misc. 1,647,562$
Custodial Credit Risk
Custodial credit risk for deposits is the risk that, in the event of the failure of a depository financial institution, a government will not be able to recover its deposits or will not be able to recover collateral securities that are in the possession of an outside party. The custodial credit risk for investments is the risk that, in the event of the failure of the counterparty (e.g., broker-dealer) to a transaction, a government will not be able to recover the value of its investment or collateral securities that are in the possession of another party. Custodial credit risk generally applies only to direct investment in marketable securities. Custodial credit risk does not apply to a local government’s indirect investment securities through the use of mutual funds or government investment pools (such as LAIF). The California Government Code and the District’s investment policy do not contain legal or policy requirements that would limit the exposure to custodial credit risk for deposits or investments, other than the following provisions for deposits: The California Government Code requires that a financial institution secure deposits made by state or local governmental units by pledging securities in an undivided collateral pool held by a depository regulated under state law (unless so waived by the governmental unit). The market value of the pledged securities in the collateral pool must equal at least 110% of the total amount deposited by the public agencies. California law also allows financial institutions to secure District deposits by pledging first trust deed mortgage notes having a value of 150% of the secured public deposits.
For investments held by bond trustee, the bond trustee selects the investments under the terms of the applicable trust agreement, acquires the investment, and holds the investment on behalf of the District in a third party safe keeping account at either Bank of New York or Union Bank.
3. Accounts Receivables
Accounts receivables-other consists of billings to other agencies for joint-owned facilities, grant funds, and charges for customer connections to the District sewer system is as follows:
Santa Margarita Water District Notes to the Basic Financial Statements
For the Year Ended June 30, 2014
24
4. Loan Receivable In 1996 the District, by Board action, made bond funds available to Rancho Mission Viejo for Improvement District No. 4C to complete construction of various District capital projects within the improvement district. The capital projects included: South County Pipeline, Chiquita Water Reclamation Plant, Seasonal Storage Facilities, Administration Building, Irvine Lake Pipeline and Chiquita Effluent Disposal System.
The outstanding principal balance of the loan accrues interest monthly based on the average annual yield of the State of California Local Agency Investment Fund. Beginning in 2005 accrued interest has been collected via ad-valorem property taxes. As of June 30, 2014 the outstanding principal balance was $4,070,457 and the outstanding accrued interest was $830,853. Installment payments for the loan will be finalized once mass grading and “will serve letters” are issued. The payments terms are expected to be finalized by the end of 2014.
5. Capital Assets
Capital assets as of June 30, 2014 consist of the following:
Balance at Dispositions/ Balance atDescription June 30, 2013 Additions Transfers Retirements June 30, 2014
Water plant 383,838,198$ - 4,351,713 (22,339) 388,167,572 Sewer plant 207,993,474 - 97,556 - 208,091,030 Water and sewer infrastructure* 154,995,307 316,913 - - 155,312,220 Operational equipment 12,489,545 398,616 - (1,642,562) 11,245,599 Administration building 9,687,807 - - - 9,687,807 Capacity Rights 1,823,324 - - (875,196) 948,128 Miscellaneous/Master Plan 825,478 - - - 825,478
Total depreciable assets 771,653,133 715,529 4,449,269 (2,540,097) 774,277,834
Less accumulated depreciation & amortization:Water plant (113,999,123) (7,470,529) - 8,395 (121,461,257) Sewer plant (87,705,753) (4,708,327) - - (92,414,080) Water and sewer infrastructure* (64,746,099) (3,832,426) - - (68,578,525) Administration building (5,836,889) (349,509) - - (6,186,398) Operational equipment (10,092,706) (601,284) - 1,626,938 (9,067,052) Miscellaneous/Master Plan (271,736) (23,781) - - (295,517) Capacity Rights (1,823,324) - - 875,196 (948,128)
Total depreciation & amortization (284,475,630) (16,985,856) - 2,510,529 (298,950,957)
Net depreciable assets 487,177,503 (16,270,327) 4,449,269 (29,568) 475,326,877
Capital Assets Not Being Depreciated:Construction in progress 14,900,162 38,066,912 (4,449,269) - 48,517,805 Land 5,148,656 - - - 5,148,656 Land - Administration building 3,663,266 - - - 3,663,266 Total nondepreciable assets 23,712,084 38,066,912 (4,449,269) - 57,329,727
Total Assets 510,889,587$ 21,796,585 - (29,568) 532,656,604
*Water and Sewer Infrastruture donated to the District by developers upon completion.
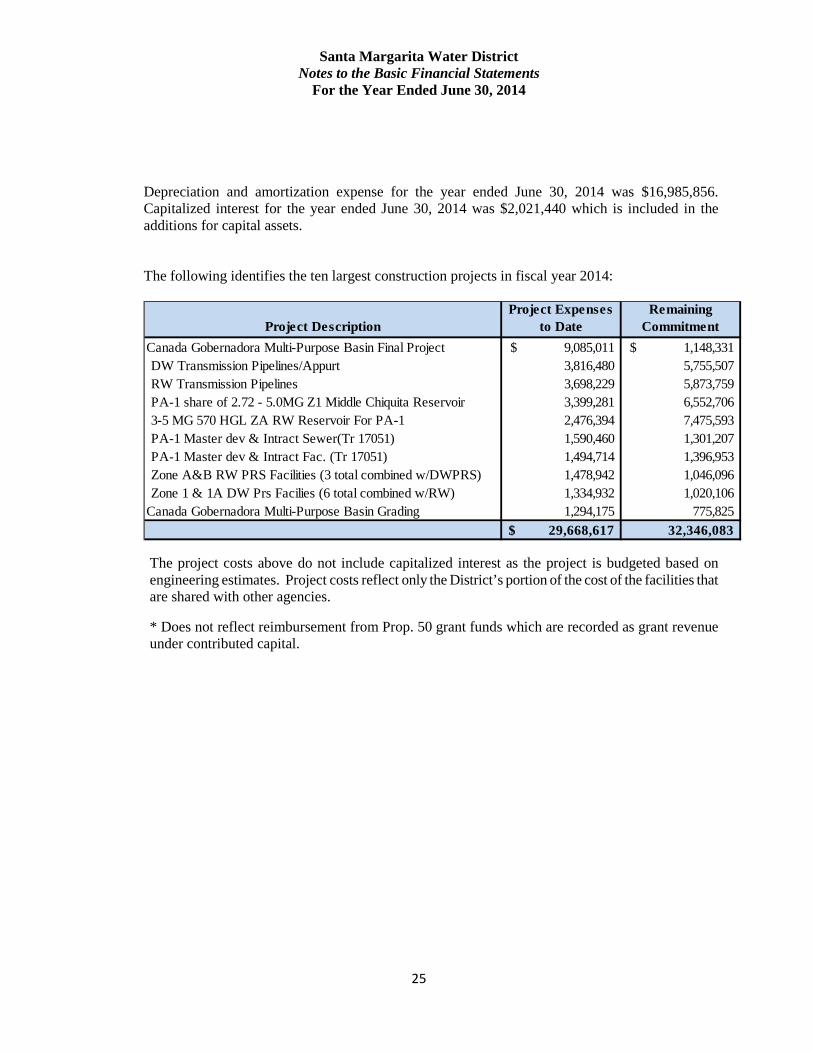
Santa Margarita Water District Notes to the Basic Financial Statements
For the Year Ended June 30, 2014
25
Depreciation and amortization expense for the year ended June 30, 2014 was $16,985,856. Capitalized interest for the year ended June 30, 2014 was $2,021,440 which is included in the additions for capital assets. The following identifies the ten largest construction projects in fiscal year 2014:
The project costs above do not include capitalized interest as the project is budgeted based on engineering estimates. Project costs reflect only the District’s portion of the cost of the facilities that are shared with other agencies.
* Does not reflect reimbursement from Prop. 50 grant funds which are recorded as grant revenue under contributed capital.
Project DescriptionProject Expenses
to DateRemaining
CommitmentCanada Gobernadora Multi-Purpose Basin Final Project 9,085,011$ 1,148,331$ DW Transmission Pipelines/Appurt 3,816,480 5,755,507 RW Transmission Pipelines 3,698,229 5,873,759 PA-1 share of 2.72 - 5.0MG Z1 Middle Chiquita Reservoir 3,399,281 6,552,706 3-5 MG 570 HGL ZA RW Reservoir For PA-1 2,476,394 7,475,593 PA-1 Master dev & Intract Sewer(Tr 17051) 1,590,460 1,301,207 PA-1 Master dev & Intract Fac. (Tr 17051) 1,494,714 1,396,953 Zone A&B RW PRS Facilities (3 total combined w/DWPRS) 1,478,942 1,046,096 Zone 1 & 1A DW Prs Facilies (6 total combined w/RW) 1,334,932 1,020,106
Canada Gobernadora Multi-Purpose Basin Grading 1,294,175 775,825 29,668,617$ 32,346,083
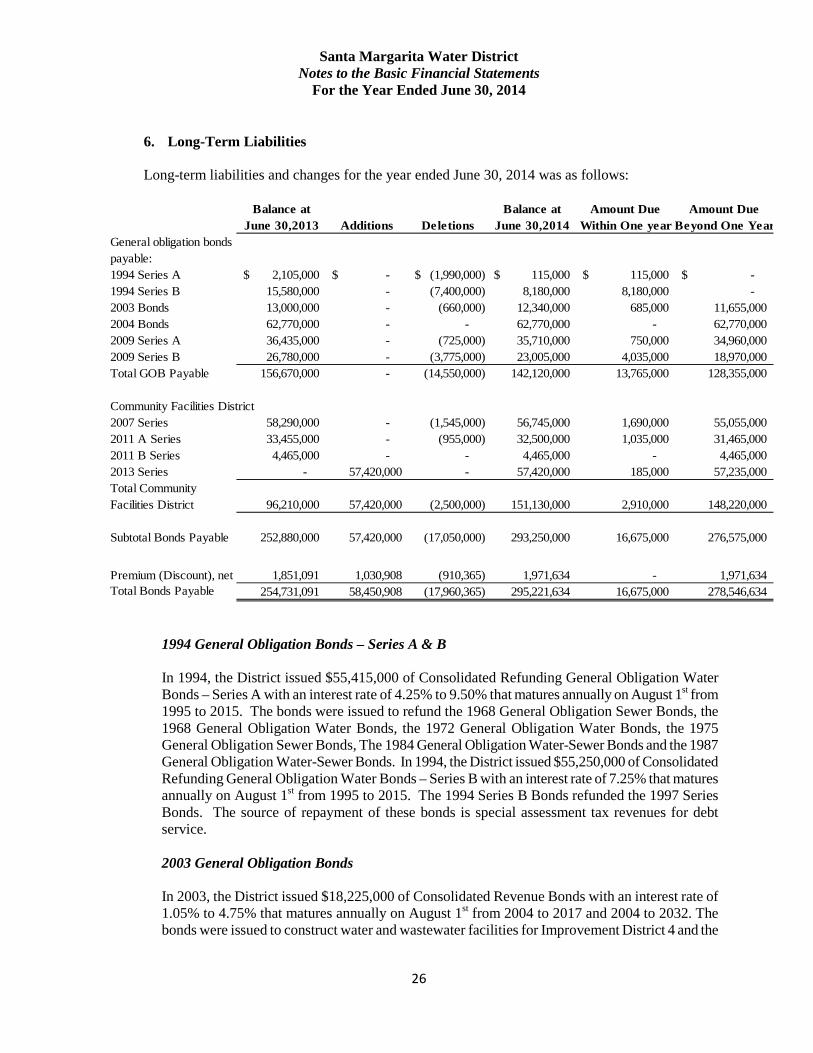
Santa Margarita Water District Notes to the Basic Financial Statements
For the Year Ended June 30, 2014
26
6. Long-Term Liabilities
Long-term liabilities and changes for the year ended June 30, 2014 was as follows:
1994 General Obligation Bonds – Series A & B
In 1994, the District issued $55,415,000 of Consolidated Refunding General Obligation Water Bonds – Series A with an interest rate of 4.25% to 9.50% that matures annually on August 1st from 1995 to 2015. The bonds were issued to refund the 1968 General Obligation Sewer Bonds, the 1968 General Obligation Water Bonds, the 1972 General Obligation Water Bonds, the 1975 General Obligation Sewer Bonds, The 1984 General Obligation Water-Sewer Bonds and the 1987 General Obligation Water-Sewer Bonds. In 1994, the District issued $55,250,000 of Consolidated Refunding General Obligation Water Bonds – Series B with an interest rate of 7.25% that matures annually on August 1st from 1995 to 2015. The 1994 Series B Bonds refunded the 1997 Series Bonds. The source of repayment of these bonds is special assessment tax revenues for debt service. 2003 General Obligation Bonds In 2003, the District issued $18,225,000 of Consolidated Revenue Bonds with an interest rate of 1.05% to 4.75% that matures annually on August 1st from 2004 to 2017 and 2004 to 2032. The bonds were issued to construct water and wastewater facilities for Improvement District 4 and the
Balance at Balance at Amount Due Amount DueJune 30,2013 Additions Deletions June 30,2014 Within One year Beyond One Year
General obligation bonds payable:1994 Series A 2,105,000$ -$ (1,990,000)$ 115,000$ 115,000$ -$ 1994 Series B 15,580,000 - (7,400,000) 8,180,000 8,180,000 - 2003 Bonds 13,000,000 - (660,000) 12,340,000 685,000 11,655,000 2004 Bonds 62,770,000 - - 62,770,000 - 62,770,000 2009 Series A 36,435,000 - (725,000) 35,710,000 750,000 34,960,000 2009 Series B 26,780,000 - (3,775,000) 23,005,000 4,035,000 18,970,000 Total GOB Payable 156,670,000 - (14,550,000) 142,120,000 13,765,000 128,355,000
Community Facilities District2007 Series 58,290,000 - (1,545,000) 56,745,000 1,690,000 55,055,000 2011 A Series 33,455,000 - (955,000) 32,500,000 1,035,000 31,465,000 2011 B Series 4,465,000 - - 4,465,000 - 4,465,000 2013 Series - 57,420,000 - 57,420,000 185,000 57,235,000 Total Community Facilities District 96,210,000 57,420,000 (2,500,000) 151,130,000 2,910,000 148,220,000
Subtotal Bonds Payable 252,880,000 57,420,000 (17,050,000) 293,250,000 16,675,000 276,575,000
Premium (Discount), net 1,851,091 1,030,908 (910,365) 1,971,634 - 1,971,634 Total Bonds Payable 254,731,091 58,450,908 (17,960,365) 295,221,634 16,675,000 278,546,634
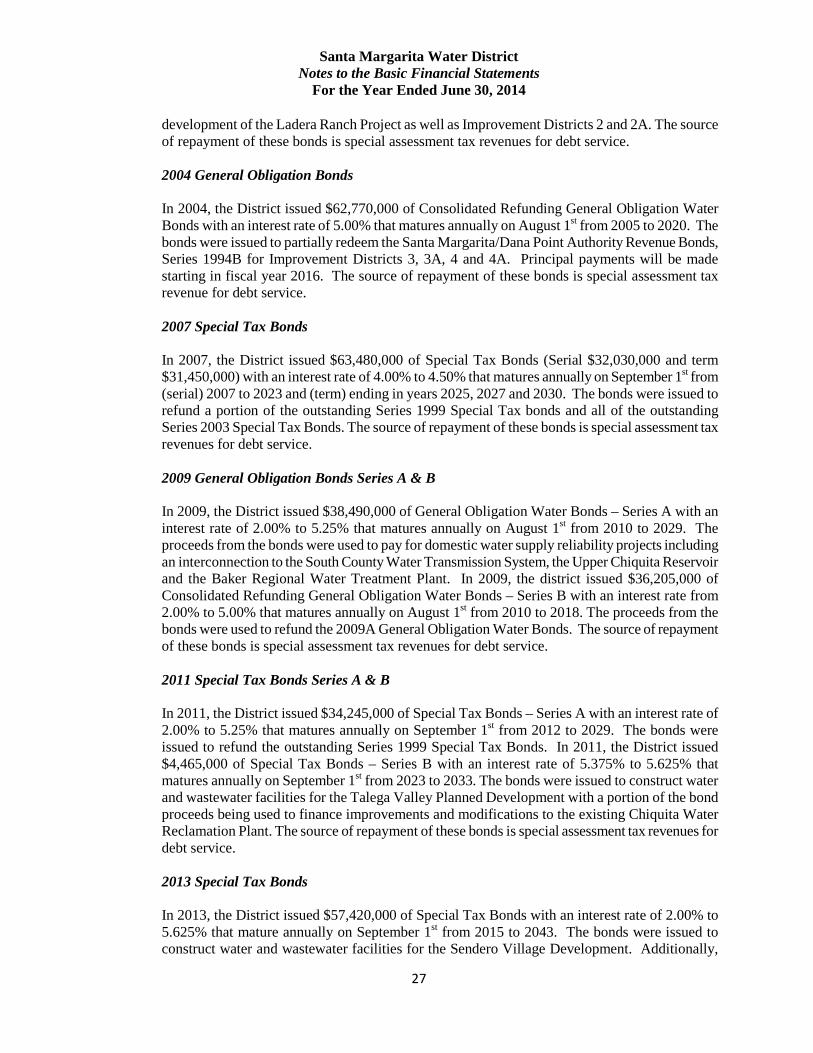
Santa Margarita Water District Notes to the Basic Financial Statements
For the Year Ended June 30, 2014
27
development of the Ladera Ranch Project as well as Improvement Districts 2 and 2A. The source of repayment of these bonds is special assessment tax revenues for debt service. 2004 General Obligation Bonds In 2004, the District issued $62,770,000 of Consolidated Refunding General Obligation Water Bonds with an interest rate of 5.00% that matures annually on August 1st from 2005 to 2020. The bonds were issued to partially redeem the Santa Margarita/Dana Point Authority Revenue Bonds, Series 1994B for Improvement Districts 3, 3A, 4 and 4A. Principal payments will be made starting in fiscal year 2016. The source of repayment of these bonds is special assessment tax revenue for debt service. 2007 Special Tax Bonds In 2007, the District issued $63,480,000 of Special Tax Bonds (Serial $32,030,000 and term $31,450,000) with an interest rate of 4.00% to 4.50% that matures annually on September 1st from (serial) 2007 to 2023 and (term) ending in years 2025, 2027 and 2030. The bonds were issued to refund a portion of the outstanding Series 1999 Special Tax bonds and all of the outstanding Series 2003 Special Tax Bonds. The source of repayment of these bonds is special assessment tax revenues for debt service. 2009 General Obligation Bonds Series A & B In 2009, the District issued $38,490,000 of General Obligation Water Bonds – Series A with an interest rate of 2.00% to 5.25% that matures annually on August 1st from 2010 to 2029. The proceeds from the bonds were used to pay for domestic water supply reliability projects including an interconnection to the South County Water Transmission System, the Upper Chiquita Reservoir and the Baker Regional Water Treatment Plant. In 2009, the district issued $36,205,000 of Consolidated Refunding General Obligation Water Bonds – Series B with an interest rate from 2.00% to 5.00% that matures annually on August 1st from 2010 to 2018. The proceeds from the bonds were used to refund the 2009A General Obligation Water Bonds. The source of repayment of these bonds is special assessment tax revenues for debt service. 2011 Special Tax Bonds Series A & B In 2011, the District issued $34,245,000 of Special Tax Bonds – Series A with an interest rate of 2.00% to 5.25% that matures annually on September 1st from 2012 to 2029. The bonds were issued to refund the outstanding Series 1999 Special Tax Bonds. In 2011, the District issued $4,465,000 of Special Tax Bonds – Series B with an interest rate of 5.375% to 5.625% that matures annually on September 1st from 2023 to 2033. The bonds were issued to construct water and wastewater facilities for the Talega Valley Planned Development with a portion of the bond proceeds being used to finance improvements and modifications to the existing Chiquita Water Reclamation Plant. The source of repayment of these bonds is special assessment tax revenues for debt service. 2013 Special Tax Bonds In 2013, the District issued $57,420,000 of Special Tax Bonds with an interest rate of 2.00% to 5.625% that mature annually on September 1st from 2015 to 2043. The bonds were issued to construct water and wastewater facilities for the Sendero Village Development. Additionally,
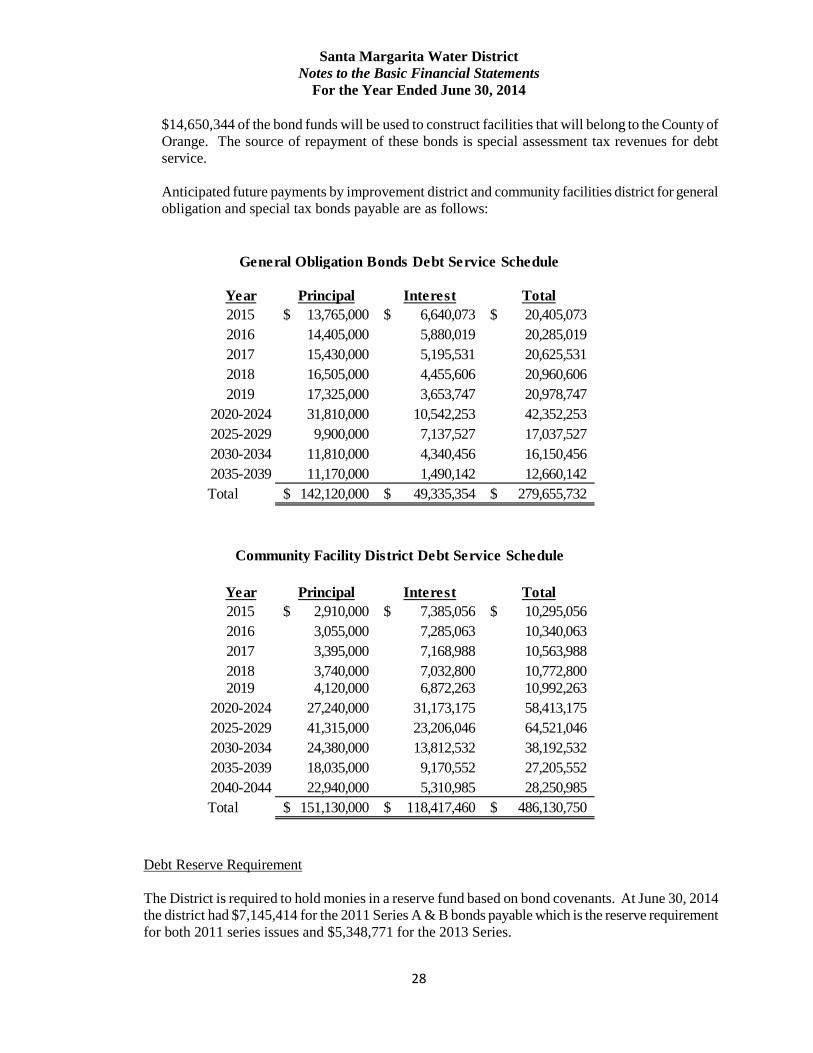
Santa Margarita Water District Notes to the Basic Financial Statements
For the Year Ended June 30, 2014
28
Year Principal Interest Total2015 13,765,000$ 6,640,073$ 20,405,073$ 2016 14,405,000 5,880,019 20,285,019 2017 15,430,000 5,195,531 20,625,531 2018 16,505,000 4,455,606 20,960,606 2019 17,325,000 3,653,747 20,978,747
2020-2024 31,810,000 10,542,253 42,352,253 2025-2029 9,900,000 7,137,527 17,037,527 2030-2034 11,810,000 4,340,456 16,150,456 2035-2039 11,170,000 1,490,142 12,660,142 Total 142,120,000$ 49,335,354$ 279,655,732$
Year Principal Interest Total2015 2,910,000$ 7,385,056$ 10,295,056$ 2016 3,055,000 7,285,063 10,340,063 2017 3,395,000 7,168,988 10,563,988 2018 3,740,000 7,032,800 10,772,800 2019 4,120,000 6,872,263 10,992,263
2020-2024 27,240,000 31,173,175 58,413,175 2025-2029 41,315,000 23,206,046 64,521,046 2030-2034 24,380,000 13,812,532 38,192,532 2035-2039 18,035,000 9,170,552 27,205,552 2040-2044 22,940,000 5,310,985 28,250,985 Total 151,130,000$ 118,417,460$ 486,130,750$
General Obligation Bonds Debt Service Schedule
Community Facility District Debt Service Schedule
$14,650,344 of the bond funds will be used to construct facilities that will belong to the County of Orange. The source of repayment of these bonds is special assessment tax revenues for debt service. Anticipated future payments by improvement district and community facilities district for general obligation and special tax bonds payable are as follows:
Debt Reserve Requirement The District is required to hold monies in a reserve fund based on bond covenants. At June 30, 2014 the district had $7,145,414 for the 2011 Series A & B bonds payable which is the reserve requirement for both 2011 series issues and $5,348,771 for the 2013 Series.
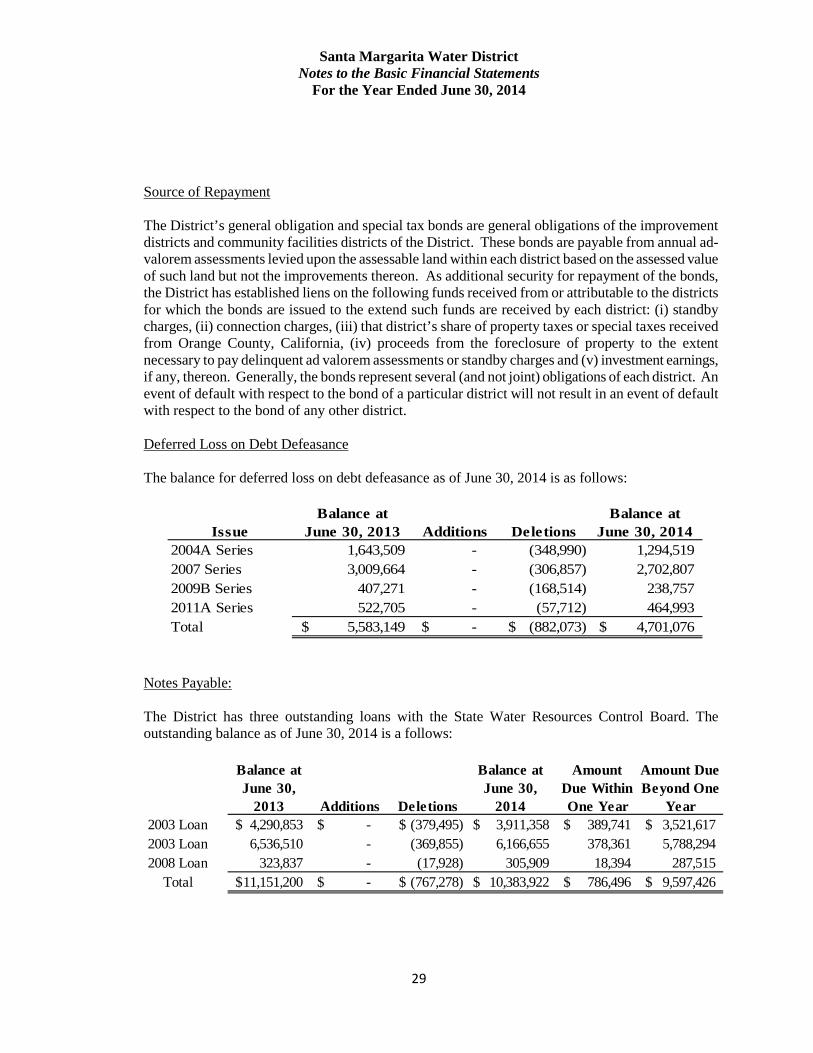
Santa Margarita Water District Notes to the Basic Financial Statements
For the Year Ended June 30, 2014
29
Source of Repayment
The District’s general obligation and special tax bonds are general obligations of the improvement districts and community facilities districts of the District. These bonds are payable from annual ad-valorem assessments levied upon the assessable land within each district based on the assessed value of such land but not the improvements thereon. As additional security for repayment of the bonds, the District has established liens on the following funds received from or attributable to the districts for which the bonds are issued to the extend such funds are received by each district: (i) standby charges, (ii) connection charges, (iii) that district’s share of property taxes or special taxes received from Orange County, California, (iv) proceeds from the foreclosure of property to the extent necessary to pay delinquent ad valorem assessments or standby charges and (v) investment earnings, if any, thereon. Generally, the bonds represent several (and not joint) obligations of each district. An event of default with respect to the bond of a particular district will not result in an event of default with respect to the bond of any other district.
Deferred Loss on Debt Defeasance
The balance for deferred loss on debt defeasance as of June 30, 2014 is as follows:
Additions Deletions2004A Series 1,643,509 - (348,990) 1,294,519 2007 Series 3,009,664 - (306,857) 2,702,807 2009B Series 407,271 - (168,514) 238,757 2011A Series 522,705 - (57,712) 464,993 Total 5,583,149$ -$ (882,073)$ 4,701,076$
Balance at June 30, 2013
Balance at June 30, 2014Issue
Notes Payable:
The District has three outstanding loans with the State Water Resources Control Board. The outstanding balance as of June 30, 2014 is a follows:
Additions Deletions2003 Loan 4,290,853$ -$ (379,495)$ 3,911,358$ 389,741$ 3,521,617$ 2003 Loan 6,536,510 - (369,855) 6,166,655 378,361 5,788,294 2008 Loan 323,837 - (17,928) 305,909 18,394 287,515
Total 11,151,200$ -$ (767,278)$ 10,383,922$ 786,496$ 9,597,426$
Amount Due Beyond One
Year
Balance at June 30,
2013
Balance at June 30,
2014
Amount Due Within One Year
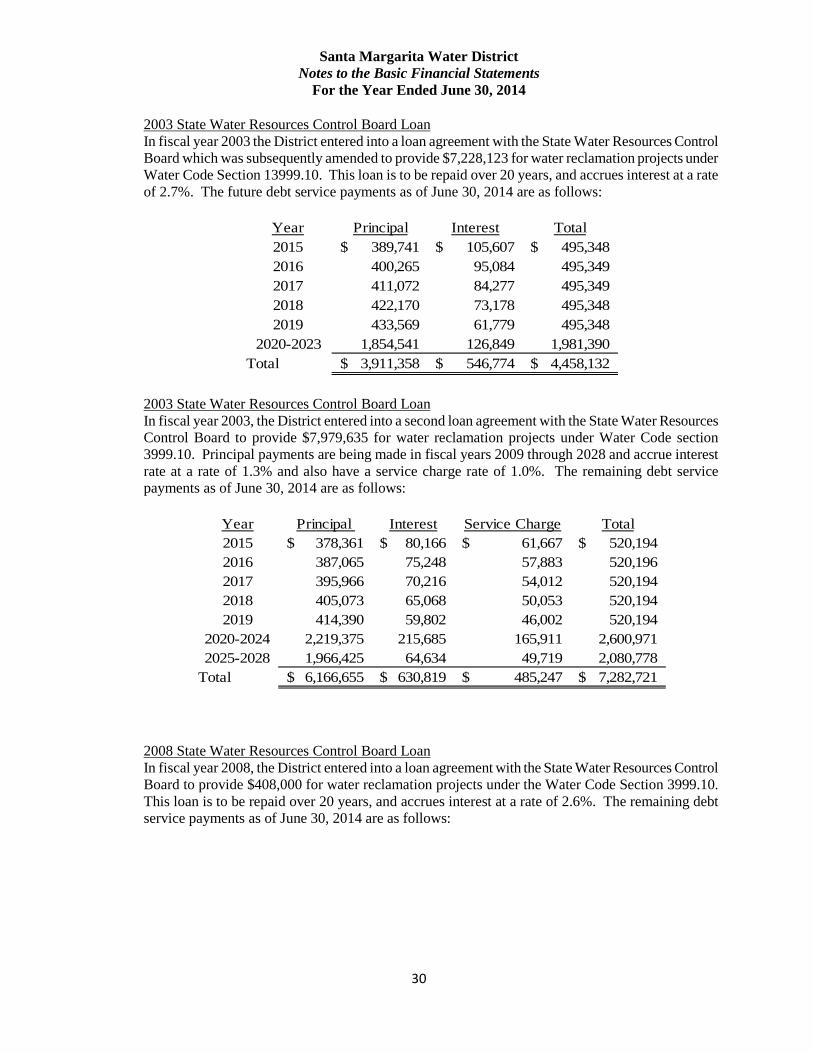
Santa Margarita Water District Notes to the Basic Financial Statements
For the Year Ended June 30, 2014
30
2003 State Water Resources Control Board Loan In fiscal year 2003 the District entered into a loan agreement with the State Water Resources Control Board which was subsequently amended to provide $7,228,123 for water reclamation projects under Water Code Section 13999.10. This loan is to be repaid over 20 years, and accrues interest at a rate of 2.7%. The future debt service payments as of June 30, 2014 are as follows:
Year Principal Interest Total2015 389,741$ 105,607$ 495,348$ 2016 400,265 95,084 495,349 2017 411,072 84,277 495,349 2018 422,170 73,178 495,348 2019 433,569 61,779 495,348
2020-2023 1,854,541 126,849 1,981,390 Total 3,911,358$ 546,774$ 4,458,132$
2003 State Water Resources Control Board Loan In fiscal year 2003, the District entered into a second loan agreement with the State Water Resources Control Board to provide $7,979,635 for water reclamation projects under Water Code section 3999.10. Principal payments are being made in fiscal years 2009 through 2028 and accrue interest rate at a rate of 1.3% and also have a service charge rate of 1.0%. The remaining debt service payments as of June 30, 2014 are as follows:
Year Principal Interest Service Charge Total2015 378,361$ 80,166$ 61,667$ 520,194$ 2016 387,065 75,248 57,883 520,196 2017 395,966 70,216 54,012 520,194 2018 405,073 65,068 50,053 520,194 2019 414,390 59,802 46,002 520,194
2020-2024 2,219,375 215,685 165,911 2,600,971 2025-2028 1,966,425 64,634 49,719 2,080,778
Total 6,166,655$ 630,819$ 485,247$ 7,282,721$
2008 State Water Resources Control Board Loan In fiscal year 2008, the District entered into a loan agreement with the State Water Resources Control Board to provide $408,000 for water reclamation projects under the Water Code Section 3999.10. This loan is to be repaid over 20 years, and accrues interest at a rate of 2.6%. The remaining debt service payments as of June 30, 2014 are as follows:
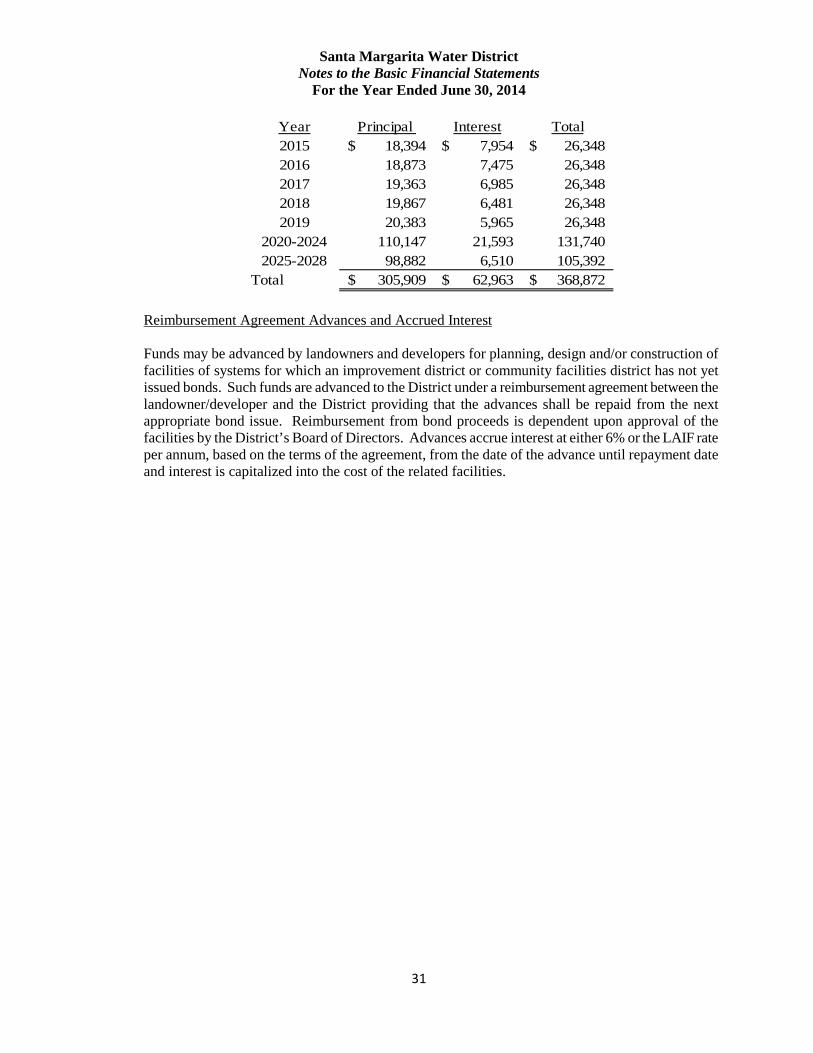
Santa Margarita Water District Notes to the Basic Financial Statements
For the Year Ended June 30, 2014
31
Year Principal Interest Total2015 18,394$ 7,954$ 26,348$ 2016 18,873 7,475 26,348 2017 19,363 6,985 26,348 2018 19,867 6,481 26,348 2019 20,383 5,965 26,348
2020-2024 110,147 21,593 131,740 2025-2028 98,882 6,510 105,392
Total 305,909$ 62,963$ 368,872$
Reimbursement Agreement Advances and Accrued Interest
Funds may be advanced by landowners and developers for planning, design and/or construction of facilities of systems for which an improvement district or community facilities district has not yet issued bonds. Such funds are advanced to the District under a reimbursement agreement between the landowner/developer and the District providing that the advances shall be repaid from the next appropriate bond issue. Reimbursement from bond proceeds is dependent upon approval of the facilities by the District’s Board of Directors. Advances accrue interest at either 6% or the LAIF rate per annum, based on the terms of the agreement, from the date of the advance until repayment date and interest is capitalized into the cost of the related facilities.
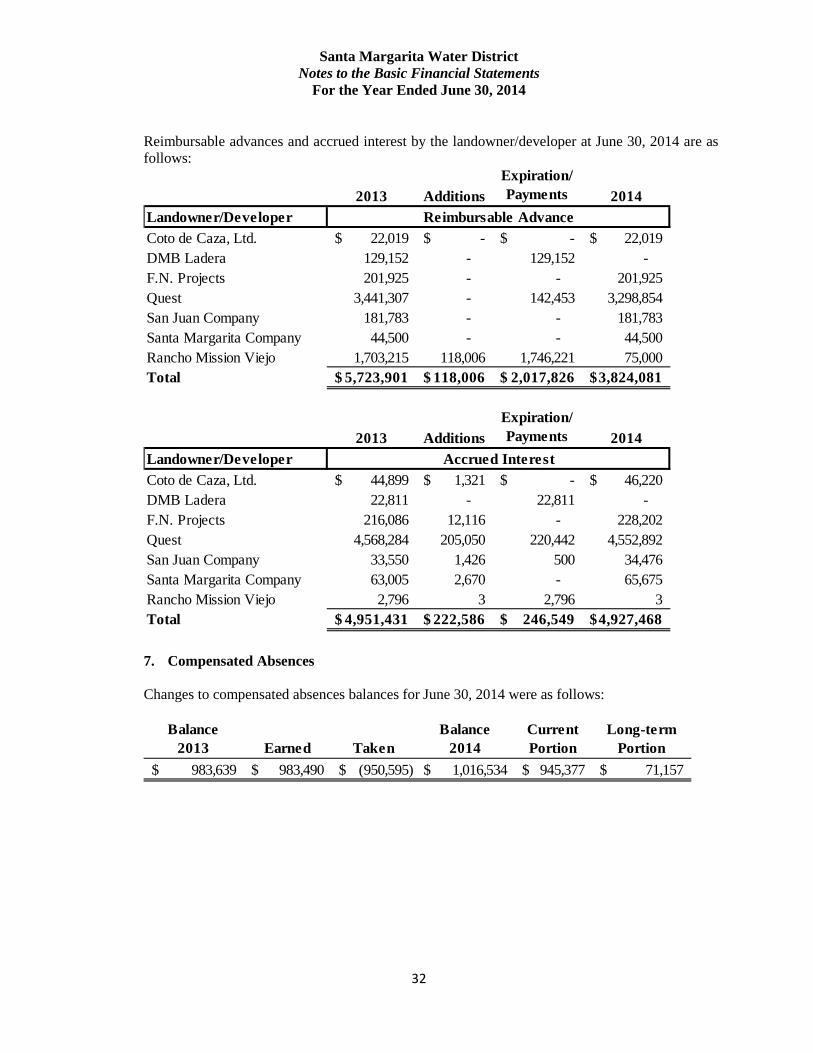
Santa Margarita Water District Notes to the Basic Financial Statements
For the Year Ended June 30, 2014
32
Reimbursable advances and accrued interest by the landowner/developer at June 30, 2014 are as follows:
7. Compensated Absences
Changes to compensated absences balances for June 30, 2014 were as follows:
2013 AdditionsExpiration/Payments 2014
Landowner/DeveloperCoto de Caza, Ltd. 22,019$ -$ -$ 22,019$ DMB Ladera 129,152 - 129,152 - F.N. Projects 201,925 - - 201,925 Quest 3,441,307 - 142,453 3,298,854 San Juan Company 181,783 - - 181,783 Santa Margarita Company 44,500 - - 44,500 Rancho Mission Viejo 1,703,215 118,006 1,746,221 75,000 Total 5,723,901$ 118,006$ 2,017,826$ 3,824,081$
2013 AdditionsExpiration/Payments 2014
Landowner/DeveloperCoto de Caza, Ltd. 44,899$ 1,321$ -$ 46,220$ DMB Ladera 22,811 - 22,811 - F.N. Projects 216,086 12,116 - 228,202 Quest 4,568,284 205,050 220,442 4,552,892 San Juan Company 33,550 1,426 500 34,476 Santa Margarita Company 63,005 2,670 - 65,675 Rancho Mission Viejo 2,796 3 2,796 3 Total 4,951,431$ 222,586$ 246,549$ 4,927,468$
Reimbursable Advance
Accrued Interest
Balance 2013 Earned Taken
Balance 2014
Current Portion
Long-term Portion
983,639$ 983,490$ (950,595)$ 1,016,534$ 945,377$ 71,157$

Santa Margarita Water District Notes to the Basic Financial Statements
For the Year Ended June 30, 2014
33
8. Net Investment In Capital Assets
Calculations of net investment in capital assets as of June 30 were as follows:
Net investment in capital assetsCapital assets, net 532,656,604$ Deferred loss on debt defeasance, net 4,701,076 Bond proceeds not used for capital projects 56,564,485
Current:Bonds payable (16,675,000) Loans payable (786,496)
Non-Current:Bonds payable (278,546,634) Bond funds for county projects 14,650,344 Loans payable (9,597,426)
Total net investment in capital assets 302,966,953$
9. Restricted Net Position
Restricted net position consists of the following:Bond Reserves 12,494,185$ Special assessments for debt service 42,501,707 Bond proceeds not used for capital projects 56,564,485 Property taxes receivable 635,646 Restricted cash held for others 601,964 Restricted accrued interest receivable 126,569
Less:Bond proceeds not used for capital projects (56,564,485)
Liabilities payable from restricted assetsAccrued interest payable (5,615,734) Accrued interest payable on reimbursement agreements (4,927,468)
Total restricted net position 45,816,869$
Restricted assets include restricted property taxes receivable, restricted cash and investments, and restricted accrued interest receivables.
10. Defined Benefit Pension Plan with California Public Employee’s Retirement System
Plan Description
The District contributes to the California Public Employees’ Retirement System (CalPERS), an agent multiple-employer public employee defined benefit pension plan. CalPERS provides retirement and disability benefits, annual cost of living adjustments and death benefits to plan members and
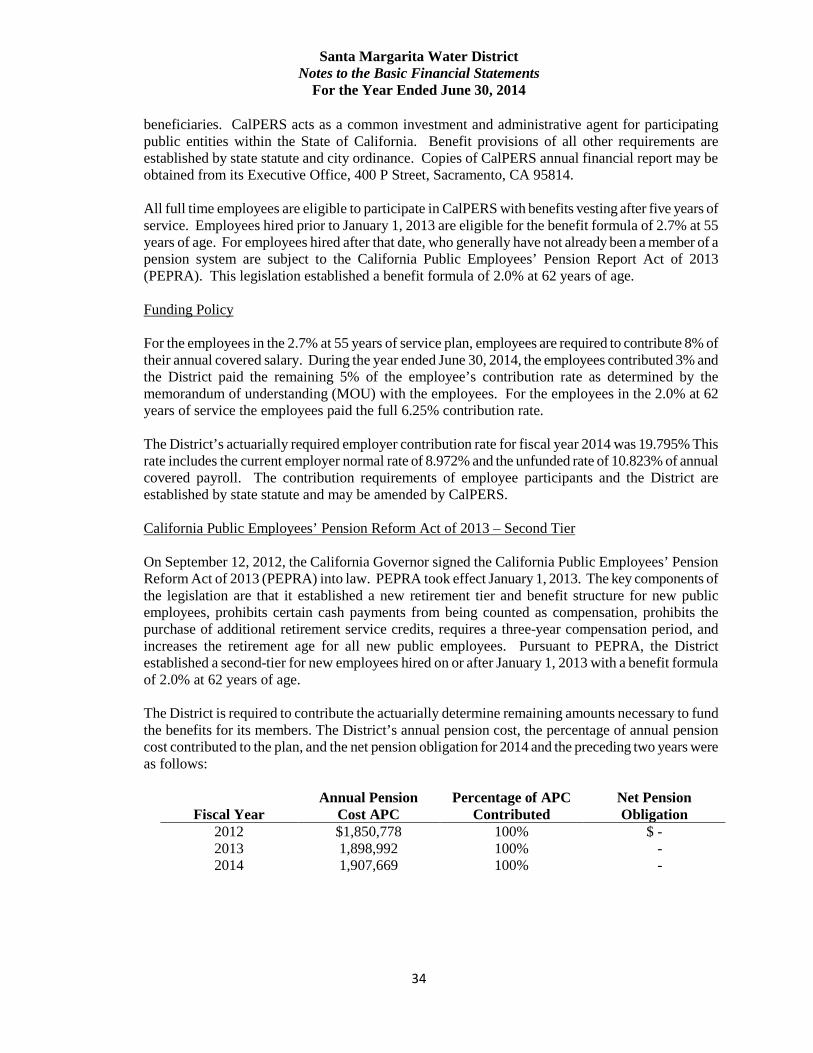
Santa Margarita Water District Notes to the Basic Financial Statements
For the Year Ended June 30, 2014
34
beneficiaries. CalPERS acts as a common investment and administrative agent for participating public entities within the State of California. Benefit provisions of all other requirements are established by state statute and city ordinance. Copies of CalPERS annual financial report may be obtained from its Executive Office, 400 P Street, Sacramento, CA 95814. All full time employees are eligible to participate in CalPERS with benefits vesting after five years of service. Employees hired prior to January 1, 2013 are eligible for the benefit formula of 2.7% at 55 years of age. For employees hired after that date, who generally have not already been a member of a pension system are subject to the California Public Employees’ Pension Report Act of 2013 (PEPRA). This legislation established a benefit formula of 2.0% at 62 years of age.
Funding Policy
For the employees in the 2.7% at 55 years of service plan, employees are required to contribute 8% of their annual covered salary. During the year ended June 30, 2014, the employees contributed 3% and the District paid the remaining 5% of the employee’s contribution rate as determined by the memorandum of understanding (MOU) with the employees. For the employees in the 2.0% at 62 years of service the employees paid the full 6.25% contribution rate. The District’s actuarially required employer contribution rate for fiscal year 2014 was 19.795% This rate includes the current employer normal rate of 8.972% and the unfunded rate of 10.823% of annual covered payroll. The contribution requirements of employee participants and the District are established by state statute and may be amended by CalPERS. California Public Employees’ Pension Reform Act of 2013 – Second Tier On September 12, 2012, the California Governor signed the California Public Employees’ Pension Reform Act of 2013 (PEPRA) into law. PEPRA took effect January 1, 2013. The key components of the legislation are that it established a new retirement tier and benefit structure for new public employees, prohibits certain cash payments from being counted as compensation, prohibits the purchase of additional retirement service credits, requires a three-year compensation period, and increases the retirement age for all new public employees. Pursuant to PEPRA, the District established a second-tier for new employees hired on or after January 1, 2013 with a benefit formula of 2.0% at 62 years of age. The District is required to contribute the actuarially determine remaining amounts necessary to fund the benefits for its members. The District’s annual pension cost, the percentage of annual pension cost contributed to the plan, and the net pension obligation for 2014 and the preceding two years were as follows:
Fiscal Year Annual Pension
Cost APC Percentage of APC
Contributed Net Pension Obligation
2012 $1,850,778 100% $ - 2013 1,898,992 100% - 2014 1,907,669 100% -
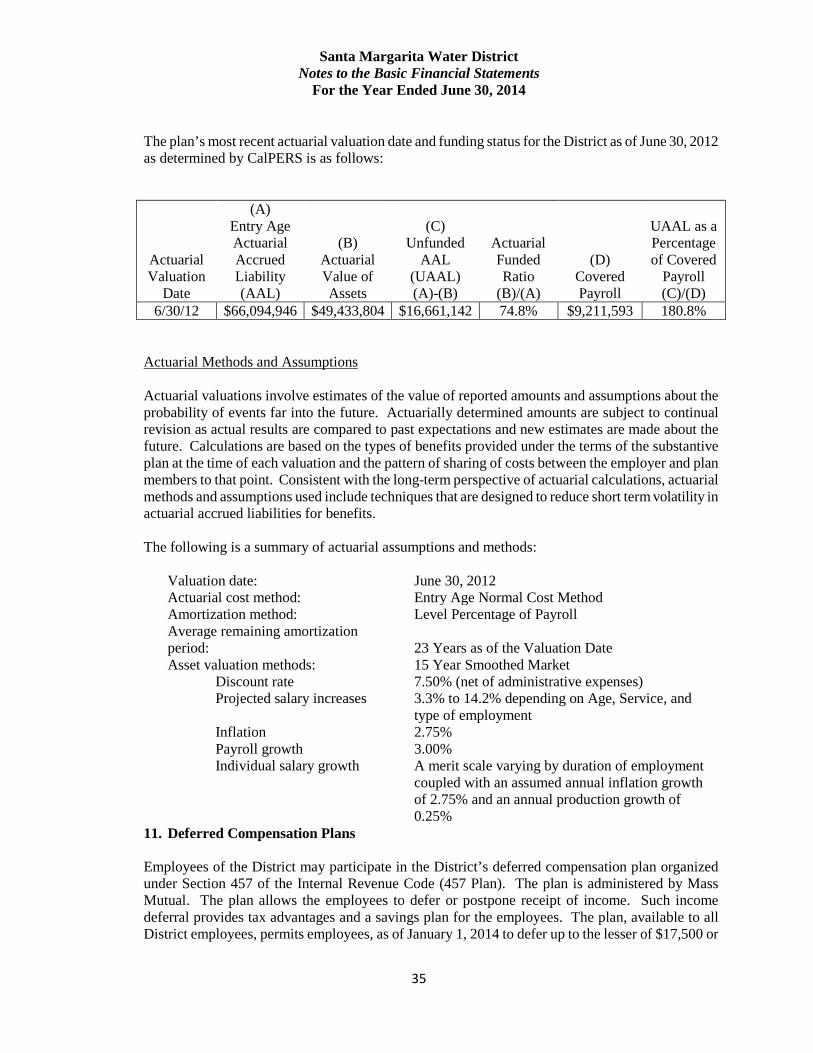
Santa Margarita Water District Notes to the Basic Financial Statements
For the Year Ended June 30, 2014
35
The plan’s most recent actuarial valuation date and funding status for the District as of June 30, 2012 as determined by CalPERS is as follows:
Actuarial Valuation
Date
(A) Entry Age Actuarial Accrued Liability (AAL)
(B) Actuarial Value of Assets
(C) Unfunded
AAL (UAAL) (A)-(B)
Actuarial Funded Ratio
(B)/(A)
(D) Covered Payroll
UAAL as a Percentage of Covered
Payroll (C)/(D)
6/30/12 $66,094,946 $49,433,804 $16,661,142 74.8% $9,211,593 180.8%
Actuarial Methods and Assumptions
Actuarial valuations involve estimates of the value of reported amounts and assumptions about the probability of events far into the future. Actuarially determined amounts are subject to continual revision as actual results are compared to past expectations and new estimates are made about the future. Calculations are based on the types of benefits provided under the terms of the substantive plan at the time of each valuation and the pattern of sharing of costs between the employer and plan members to that point. Consistent with the long-term perspective of actuarial calculations, actuarial methods and assumptions used include techniques that are designed to reduce short term volatility in actuarial accrued liabilities for benefits.
The following is a summary of actuarial assumptions and methods:
Valuation date: June 30, 2012 Actuarial cost method: Entry Age Normal Cost Method Amortization method: Level Percentage of Payroll Average remaining amortization period: 23 Years as of the Valuation Date Asset valuation methods: 15 Year Smoothed Market
Discount rate 7.50% (net of administrative expenses) Projected salary increases 3.3% to 14.2% depending on Age, Service, and
type of employment Inflation 2.75% Payroll growth 3.00% Individual salary growth A merit scale varying by duration of employment
coupled with an assumed annual inflation growth of 2.75% and an annual production growth of 0.25%
11. Deferred Compensation Plans
Employees of the District may participate in the District’s deferred compensation plan organized under Section 457 of the Internal Revenue Code (457 Plan). The plan is administered by Mass Mutual. The plan allows the employees to defer or postpone receipt of income. Such income deferral provides tax advantages and a savings plan for the employees. The plan, available to all District employees, permits employees, as of January 1, 2014 to defer up to the lesser of $17,500 or
Santa Margarita Water District Notes to the Basic Financial Statements
For the Year Ended June 30, 2014
36
100% of includable compensation, as defined until future years. The deferred compensation is not available to employees until termination, retirement, death or unforeseeable emergency. In 2001, the District adopted a deferred compensation plan organized under section 401(a) of the Internal Revenue Code. The 401(a) plan, in conjunction with the 457 Plan allows employees to shelter matching contributions by the District from income taxes. All employees are eligible to participate up to the maximum employer contribution of $1,740 per year. Withdrawals can be made upon retirement, disability or termination, but not later than 70 ½. For the year ended June 30, 2014, the employer contributions totaled $180,284. The maximum contribution rate is included in the MOU and can be amended in the MOU and approved by the Board of Directors.
In 2003, the district adopted a deferred compensation plan organized under section 414(h) of the Internal Revenue Code. Contract “at will” employee(s) may contribute one-time bonus money stipulated by the Board of Directors. Regular earned compensation may not be deferred into the 414(h) account and Contract “at will” employees will not have the option of receiving such amount directly instead of having the District contribute it to the Plan. The annual addition that may be contributed or allocated to the participant’s individual account under the plan for 2014 shall not exceed $49,000, as adjusted for increases allowed in the Code.
12. Joint Powers Agreement
San Juan Basin Authority
The District is a member of the San Juan Basin Authority (SJBA) which operates under a joint powers agreement with the member agencies consisting of:
Santa Margarita Water District South Coast Water District Moulton Niguel Water District City of San Juan Capistrano
The general purpose of the SJBA is to acquire, construct, use, operate and maintain facilities to supply water for irrigation, domestic, and municipal purposes, provide for the development and conservation of water supplies, and to coordinate regional management of the San Juan Creek basin and its tributary waters.
During the year ended June 30, 2014 the District paid $0 to the SJBA for various costs of which the majority related to the development and maintenance of the facilities. In Fiscal Year 2014 the SJBA choose to use reserves to pay for their operating costs. Payments to SJBA are charged by the District to maintenance and operations expense. Copies of SJBA annual financial statements can be obtained at the District: San Juan Basin Authority c/o Santa Margarita Water District, P.O. Box 7005, Mission Viejo, California 92690-7005.
Santa Margarita/Dana Point Authority
The Santa Margarita/Dana Point Authority (SMDP) was created on August 25, 1987 between the Santa Margarita Water district and the Dana Point Sanitary District for the purpose of selling bonds to finance the acquisition of capacity in the JayB. Latham treatment plant. In addition, SMDP issued revenue bonds, Series A and Series B dated July 15, 1994, and Series 1997A dated October 1, 1997 for the purpose of acquiring the 1994 and 1997 refunding Bonds, respectively, issued by the District
Santa Margarita Water District Notes to the Basic Financial Statements
For the Year Ended June 30, 2014
37
(Note 6). During 1999, the Dana Point Sanitary District was dissolved and the South Coast Water District became the successor agency.
Each member is responsible for the debt service of Authority debt to the extent that the member benefits from the use of the debt proceeds. Authority issuances for which the district is responsible for debt service have been accounted for as a bond payable liability in the financial statements. During the year ended June 30, 2014 the District paid bond principal payments totaling $14,550,000 and interest payments totaling $7,496,925 to SMDP to service all of the District’s general obligation debt.
South Orange County Wastewater Authority
The District is a member of the South Orange County Wastewater Authority (SOCWA), formerly the South East Regional Reclamation Authority, which operates under a joint powers agreement with member agencies consisting of:
City of Laguna Beach (CLB) City of San Clemente (CSC) City of San Juan Capistrano (CSJC) El Toro Water District (ETWD) Emerald Bay Services District (EBSD) Irvine Ranch Water District (IRWD) Moulton Niguel Water District (MNWD) Santa Margarita Water District (SMWD) South Coast Water District (SCWD) Trabuco Canyon Water District (TCWD)
The general purpose of SOCWA is to plan for, acquire, construct, maintain, repair, manage, operate and control facilities for the collection, transmission, treatment and disposal of waste water, the reclamation of waste water and the use of reclaimed waste water for any beneficial purpose. Revenues and expenses are allocated to each member agency based on its participation in the various projects.
During the year ended June 30, 2014 the District paid $2,417,842 to SOCWA for various costs, the majority of which related to the plant operating costs. Copies of SOCWA’s annual financial statements can be obtained by contacting SOCWA at 34156 Del Obispo Street, Dana Point, CA 92629.
13. Operating Lease
Allen-McCulloch Pipeline/Santiago Aqueduct Parallel System
The District in a participant in subleases with the Municipal Water District of Orange County (MWDOC) in a project known as the Allen-McCulloch Pipeline/Santiago Aqueduct Parallel System. Under the terms of the subleases, the District makes annual lease payments equal to an allocated portion of the annual debt service requirements of the nonprofit corporation bonds sold by Municipal Water District of Orange County Public Facilities Corporation to finance the project. In fiscal year 1995 MWDOC sold the pipeline to the Metropolitan Water District (MWD). Under the terms of the sale agreement, MWD assumed a portion of the debt service obligations of MWDOC related to the nonprofit corporation bonds. The future payment commitments of the District were reduced by the allocated portion of the debt service obligations assumed by MWD. The 1996 Refunding Certificates
Santa Margarita Water District Notes to the Basic Financial Statements
For the Year Ended June 30, 2014
38
of Participation bonds matured in fiscal year 2007 releasing bond reserve funds totaling $2,386,310 for the debt service payment. The original terms of the lease agreement had the final payment in 2017. In fiscal year 2014, the District chose to pay the remaining balance of $4,320,147 in full and has no future obligation for future benefits, so the amount has been expensed in 2014.
14. Risk Management
The District is exposed to various risks of loss related to torts, theft of, damage to, and destruction of assets, errors and omissions, injuries to employees, and natural disasters. The District is a member of the California Sanitation Risk Management Authority and through the Authority the District participates in several of its programs including liability, property, and worker’s compensation insurance. There were no significant settlements or reductions in insurance coverage from settlements for the past three years.
The District maintains $300,000 in an unrestricted but designated uninsured expenses reserve for small claims not paid from operating funds that are not covered by insurance. Management believes that the insurance policies and reserve funds are adequate to cover the cost of claims incurred to date. However, such liabilities are, by necessity, based upon estimates and there can be no assurance that the ultimate cost will not exceed such estimates.
15. Contingencies
The District’s contingencies include lawsuits and disputes that may arise in the ordinary course of business. The District believes there are no existing matters that will have a material adverse effect on the District’s financial position.
16. Commitment to Purchase Water
In June 2010, the District entered into the Environmental Processing and Cost Sharing Agreement (Environmental Agreement) with a private enterprise, Cadiz, Inc. for the Cadiz Water Conservation and Storage Project (Cadiz Project). The Environmental Agreement contemplated that the District would be the Lead Agency for the Cadiz Project, and be responsible for the preparation and adequacy of the California Environmental Quality Act documentation.
The Cadiz Project is located in Eastern San Bernardino County. Phase 1 of this project would pump an average of 50,000 acre-feet per year of water from the groundwater basin underlying the Cadiz and Fenner Valleys and the adjacent Bristol Valley over a 50-year period and deliver the water to Project participants. Phase II of the Cadiz Project, the Imported Water Storage Component, if considered and approved, would construct spreading basins to recharge surface water in to the groundwater basin and convey stored water back to project participants.
Once the project starts delivering water, the District would be required to purchase on an annual take-or-pay basis 5,000 acre-feet of water from the project (to the extend such quantities are available). Management’s estimate of the annual cost for this allocation of water is approximately five to six million dollars per year. This estimate is based upon projections of uncertain future costs, including the cost to be incurred by Cadiz, Inc. to construct the related facilities and the cost to operate and maintain, the facilities to provide the procured water. An additional optional annual allocation of 10,000 acre-feet of water is available to the District as the District’s option.
This agreement is subject to approval by certain local and regional agencies and the results of litigation by parties that have alleged that the extraction of water from the aforementioned groundwater basin might jeopardize the environmental stability of the basin. If the project is halted
Santa Margarita Water District Notes to the Basic Financial Statements
For the Year Ended June 30, 2014
39
due to this litigation, the District would continue its current practice of purchasing water from Metropolitan Water District of Southern California. The amount of possible future litigation costs associated with this matter are not known. Cadiz, Inc. has agreed to indemnify the District for such costs.
In July 2012, the board approved certain resolutions relating to these agreements. Resolution No. 2012-07-02 states the District certification of the Final EIR for the Cadiz Project. Resolution No. 2012-07-03 adopts the CEQA findings, a mitigation monitoring and reporting program, a statement of overriding considerations, approved the water purchases and sale agreements, and approved the updated groundwater management, monitoring and mitigation plan with regard to phase I of the Cadiz Valley Water Conservation, Recovery and Storage Project.
17. Subsequent Events 2014A Refunding General Obligation Bonds
In July 2014 the District issued $65,340,000 Refunding General Obligation Bonds Series 2014A with interest rates from 3.00% to 5.00% that matures annually on August 1 from 2015 to 2029. The proceeds of the bonds were used to refund the 2003A and 2004A (Improvement District Nos. 2, 2A, 3, 3A, 4, 4A & 4B) of the Santa Margarita Water District/Dana Point Authority. The source of repayment of these bonds is special assessment tax revenues for debt service.
2014B Refunding General Obligation Bonds
In August 2014 the District issued $32,810,000 of Special Tax Refunding Bonds series 2014B with interest rates from 2.00% to 5.00% that matures annually on September 1 from 2015 to 2033. The proceeds of the bonds were used to refund the 2011A and 2011B Community Facilities District 99-1 (Talega) of the Santa Margarita Water District Special Tax Refunding Bonds. The source of repayment of these bonds is special assessment tax revenues for debt service.
Required Supplementary Information
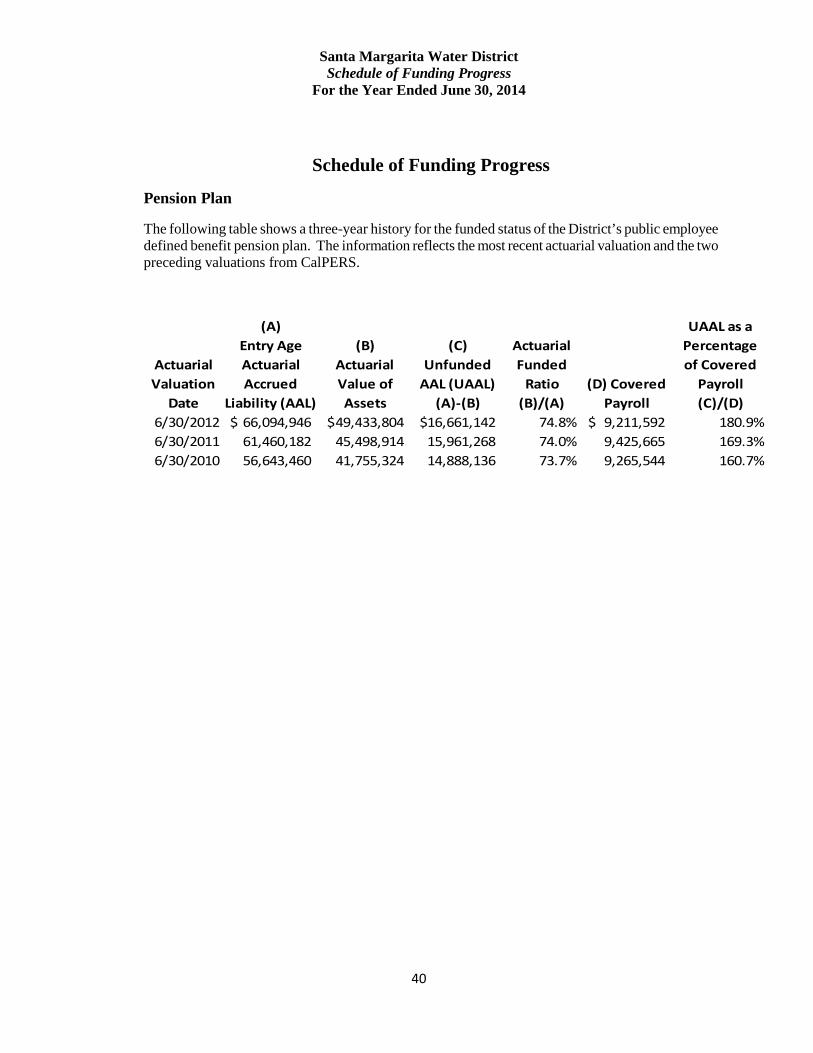
Santa Margarita Water District Schedule of Funding Progress
For the Year Ended June 30, 2014
40
Schedule of Funding Progress
Pension Plan
The following table shows a three-year history for the funded status of the District’s public employee defined benefit pension plan. The information reflects the most recent actuarial valuation and the two preceding valuations from CalPERS.
Actuarial Valuation
Date
(A)Entry Age Actuarial Accrued
Liability (AAL)
(B)Actuarial Value of Assets
(C)Unfunded
AAL (UAAL) (A)-(B)
Actuarial Funded
Ratio (B)/(A)
(D) Covered Payroll
UAAL as a Percentage of Covered
Payroll (C)/(D)
6/30/2012 66,094,946$ 49,433,804$ 16,661,142$ 74.8% 9,211,592$ 180.9%6/30/2011 61,460,182 45,498,914 15,961,268 74.0% 9,425,665 169.3%6/30/2010 56,643,460 41,755,324 14,888,136 73.7% 9,265,544 160.7%
Statistical Section
41
This section of the Santa Margarita Water District’s Comprehensive Annual Financial Report presents detailed information as a context for understanding what the information in the financial statements, note disclosures, and required supplementary information says about the District’s overall financial health.
Financial Trends Schedules – These schedules contain trend information to help the reader understand how the District’s financial performance and well-being have changed over time.
Net position Changes in net position Operating revenue by source Operating expenses by type
Revenue Schedules – These schedules contain information to help the reader assess the factors affecting the District’s ability to generate its sales and property taxes.
Water sales by customer class Water and sewer rates Ten largest water and sewer customers Assessment rate by improvement district
Debt Schedules – These schedules present information to help the reader assess the affordability of the District’s current levels of outstanding debt and the District’s ability to issue additional debt in the future.
Direct and overlapping property tax rates Debt service coverage ratio Outstanding debt by type Outstanding debt ratios
Demographic and Economic Information – These schedules offer demographic and economic indicators to help the reader understand the environment within which the District’s financial activities take place and to help make comparisons over time and with other governments
Principal employers Demographic and economic statistics
Operating Information – These schedules contain information about the District’s operations and resources to help the reader understand how the District’s financial information relates to the services the District provides and the activities it performs
Water and sewer connections Capital asset statistics Employee information
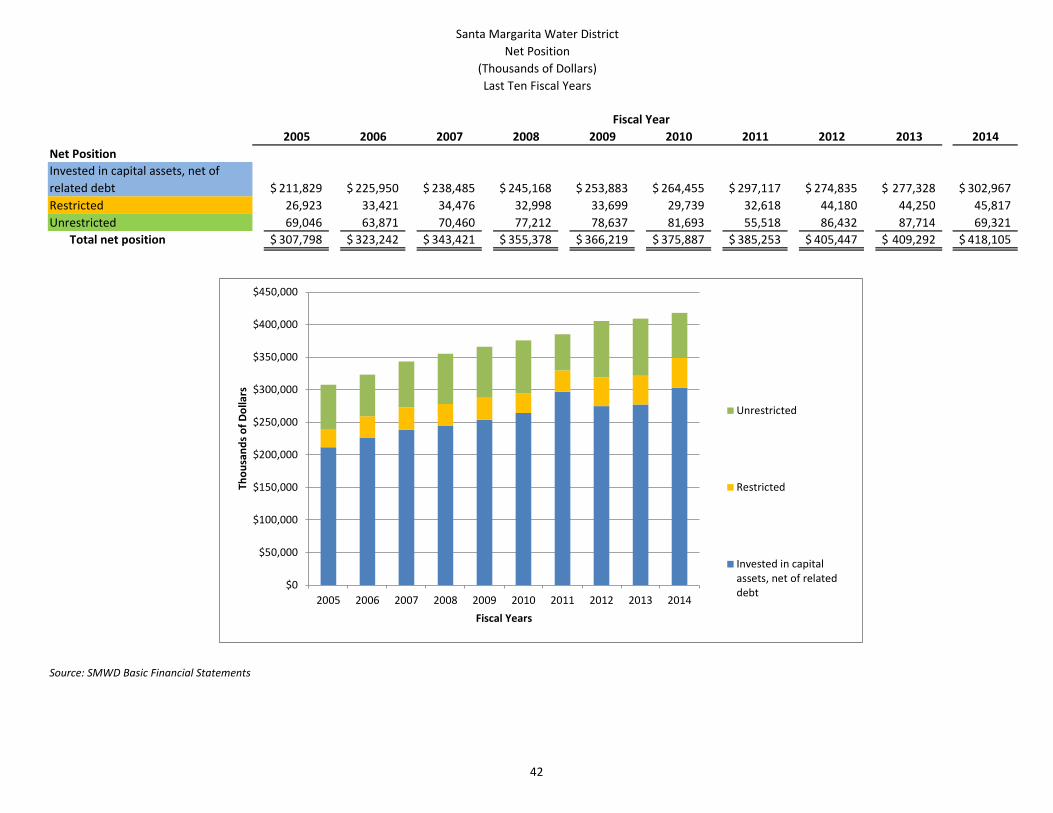
Santa Margarita Water DistrictNet Position
(Thousands of Dollars)Last Ten Fiscal Years
42
2005 2006 2007 2008 2009 2010 2011 2012 2013 2014Net PositionInvested in capital assets, net of related debt 211,829$ 225,950$ 238,485$ 245,168$ 253,883$ 264,455$ 297,117$ 274,835$ 277,328$ 302,967$ Restricted 26,923 33,421 34,476 32,998 33,699 29,739 32,618 44,180 44,250 45,817 Unrestricted 69,046 63,871 70,460 77,212 78,637 81,693 55,518 86,432 87,714 69,321
Total net position 307,798$ 323,242$ 343,421$ 355,378$ 366,219$ 375,887$ 385,253$ 405,447$ 409,292$ 418,105$
Source: SMWD Basic Financial Statements
Fiscal Year
$0
$50,000
$100,000
$150,000
$200,000
$250,000
$300,000
$350,000
$400,000
$450,000
2005 2006 2007 2008 2009 2010 2011 2012 2013 2014
Thou
sand
s of D
olla
rs
Fiscal Years
Unrestricted
Restricted
Invested in capitalassets, net of relateddebt
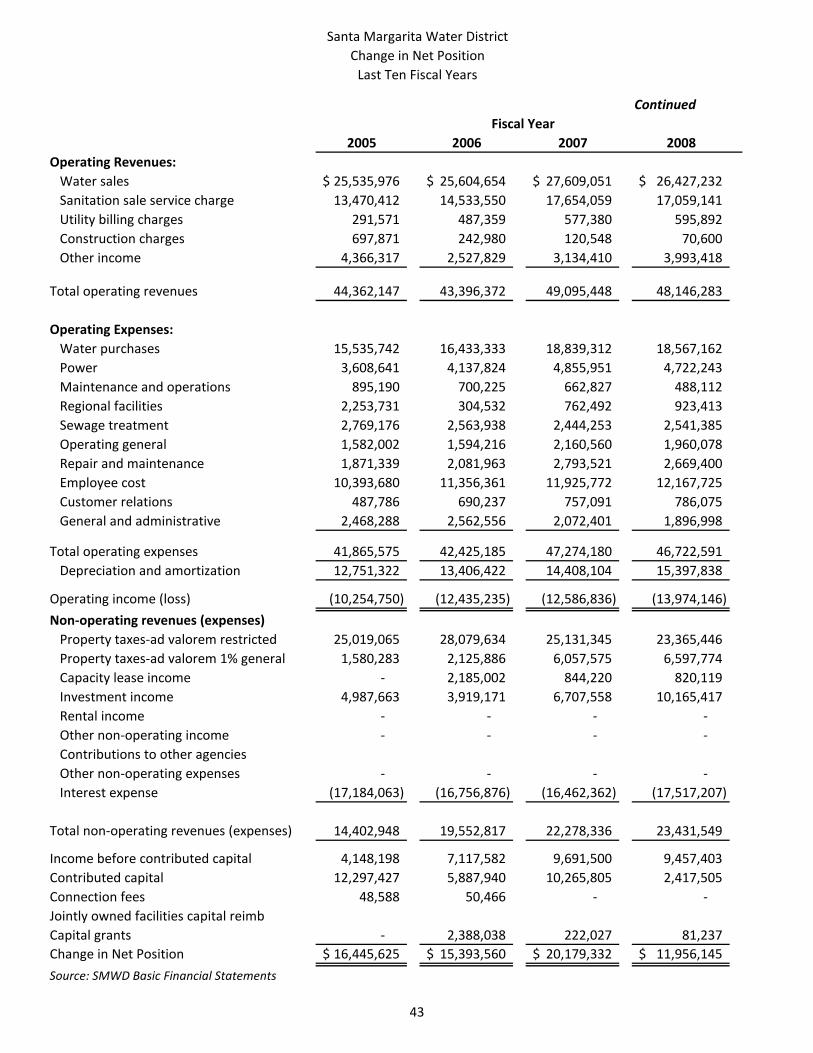
Santa Margarita Water DistrictChange in Net Position
Last Ten Fiscal Years
43
Continued
2005 2006 2007 2008Operating Revenues:
Water sales 25,535,976$ 25,604,654$ 27,609,051$ 26,427,232$ Sanitation sale service charge 13,470,412 14,533,550 17,654,059 17,059,141 Utility billing charges 291,571 487,359 577,380 595,892 Construction charges 697,871 242,980 120,548 70,600 Other income 4,366,317 2,527,829 3,134,410 3,993,418
Total operating revenues 44,362,147 43,396,372 49,095,448 48,146,283
Operating Expenses:Water purchases 15,535,742 16,433,333 18,839,312 18,567,162 Power 3,608,641 4,137,824 4,855,951 4,722,243 Maintenance and operations 895,190 700,225 662,827 488,112 Regional facilities 2,253,731 304,532 762,492 923,413 Sewage treatment 2,769,176 2,563,938 2,444,253 2,541,385 Operating general 1,582,002 1,594,216 2,160,560 1,960,078 Repair and maintenance 1,871,339 2,081,963 2,793,521 2,669,400 Employee cost 10,393,680 11,356,361 11,925,772 12,167,725 Customer relations 487,786 690,237 757,091 786,075 General and administrative 2,468,288 2,562,556 2,072,401 1,896,998
Total operating expenses 41,865,575 42,425,185 47,274,180 46,722,591 Depreciation and amortization 12,751,322 13,406,422 14,408,104 15,397,838
Operating income (loss) (10,254,750) (12,435,235) (12,586,836) (13,974,146) Non-operating revenues (expenses)
Property taxes-ad valorem restricted 25,019,065 28,079,634 25,131,345 23,365,446 Property taxes-ad valorem 1% general 1,580,283 2,125,886 6,057,575 6,597,774 Capacity lease income - 2,185,002 844,220 820,119 Investment income 4,987,663 3,919,171 6,707,558 10,165,417 Rental income - - - - Other non-operating income - - - - Contributions to other agenciesOther non-operating expenses - - - - Interest expense (17,184,063) (16,756,876) (16,462,362) (17,517,207)
Total non-operating revenues (expenses) 14,402,948 19,552,817 22,278,336 23,431,549
Income before contributed capital 4,148,198 7,117,582 9,691,500 9,457,403 Contributed capital 12,297,427 5,887,940 10,265,805 2,417,505 Connection fees 48,588 50,466 - - Jointly owned facilities capital reimbCapital grants - 2,388,038 222,027 81,237 Change in Net Position 16,445,625$ 15,393,560$ 20,179,332$ 11,956,145$ Source: SMWD Basic Financial Statements
Fiscal Year
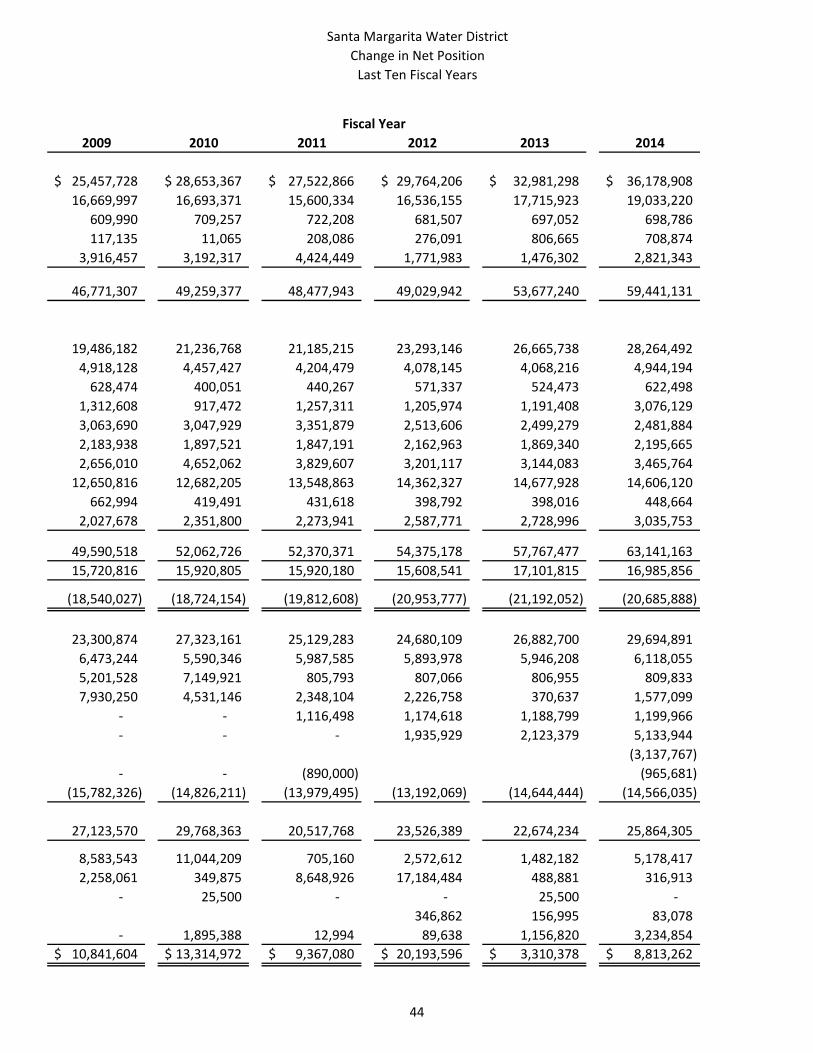
Santa Margarita Water DistrictChange in Net Position
Last Ten Fiscal Years
44
2009 2010 2011 2012 2013 2014
25,457,728$ 28,653,367$ 27,522,866$ 29,764,206$ 32,981,298$ 36,178,908$ 16,669,997 16,693,371 15,600,334 16,536,155 17,715,923 19,033,220
609,990 709,257 722,208 681,507 697,052 698,786 117,135 11,065 208,086 276,091 806,665 708,874
3,916,457 3,192,317 4,424,449 1,771,983 1,476,302 2,821,343
46,771,307 49,259,377 48,477,943 49,029,942 53,677,240 59,441,131
19,486,182 21,236,768 21,185,215 23,293,146 26,665,738 28,264,492 4,918,128 4,457,427 4,204,479 4,078,145 4,068,216 4,944,194
628,474 400,051 440,267 571,337 524,473 622,498 1,312,608 917,472 1,257,311 1,205,974 1,191,408 3,076,129 3,063,690 3,047,929 3,351,879 2,513,606 2,499,279 2,481,884 2,183,938 1,897,521 1,847,191 2,162,963 1,869,340 2,195,665 2,656,010 4,652,062 3,829,607 3,201,117 3,144,083 3,465,764
12,650,816 12,682,205 13,548,863 14,362,327 14,677,928 14,606,120 662,994 419,491 431,618 398,792 398,016 448,664
2,027,678 2,351,800 2,273,941 2,587,771 2,728,996 3,035,753
49,590,518 52,062,726 52,370,371 54,375,178 57,767,477 63,141,163 15,720,816 15,920,805 15,920,180 15,608,541 17,101,815 16,985,856
(18,540,027) (18,724,154) (19,812,608) (20,953,777) (21,192,052) (20,685,888)
23,300,874 27,323,161 25,129,283 24,680,109 26,882,700 29,694,891 6,473,244 5,590,346 5,987,585 5,893,978 5,946,208 6,118,055 5,201,528 7,149,921 805,793 807,066 806,955 809,833 7,930,250 4,531,146 2,348,104 2,226,758 370,637 1,577,099
- - 1,116,498 1,174,618 1,188,799 1,199,966 - - - 1,935,929 2,123,379 5,133,944
(3,137,767) - - (890,000) (965,681)
(15,782,326) (14,826,211) (13,979,495) (13,192,069) (14,644,444) (14,566,035)
27,123,570 29,768,363 20,517,768 23,526,389 22,674,234 25,864,305
8,583,543 11,044,209 705,160 2,572,612 1,482,182 5,178,417 2,258,061 349,875 8,648,926 17,184,484 488,881 316,913
- 25,500 - - 25,500 - 346,862 156,995 83,078
- 1,895,388 12,994 89,638 1,156,820 3,234,854 10,841,604$ 13,314,972$ 9,367,080$ 20,193,596$ 3,310,378$ 8,813,262$
Fiscal Year
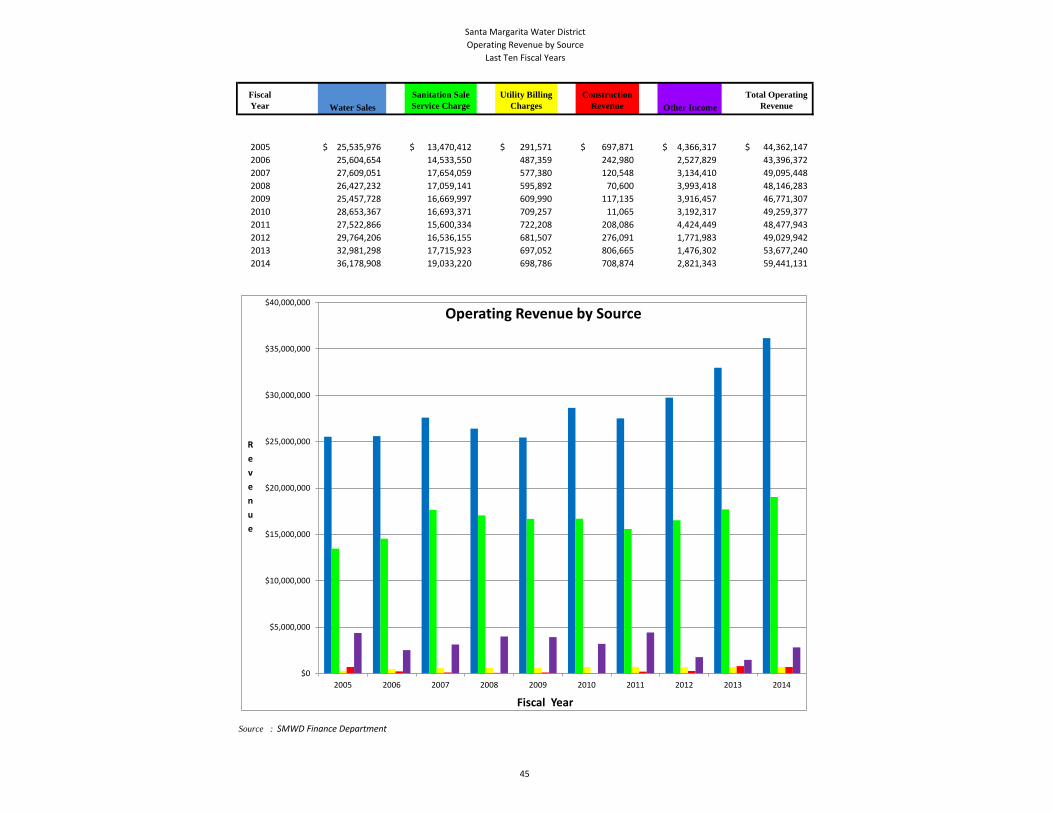
Santa Margarita Water DistrictOperating Revenue by Source
Last Ten Fiscal Years
45
Fiscal Year Water Sales
Sanitation Sale Service Charge
Utility Billing Charges
Construction Revenue Other Income
Total Operating Revenue
2005 25,535,976$ 13,470,412$ 291,571$ 697,871$ 4,366,317$ 44,362,147$ 2006 25,604,654 14,533,550 487,359 242,980 2,527,829 43,396,372 2007 27,609,051 17,654,059 577,380 120,548 3,134,410 49,095,448 2008 26,427,232 17,059,141 595,892 70,600 3,993,418 48,146,283 2009 25,457,728 16,669,997 609,990 117,135 3,916,457 46,771,307 2010 28,653,367 16,693,371 709,257 11,065 3,192,317 49,259,377 2011 27,522,866 15,600,334 722,208 208,086 4,424,449 48,477,943 2012 29,764,206 16,536,155 681,507 276,091 1,771,983 49,029,942 2013 32,981,298 17,715,923 697,052 806,665 1,476,302 53,677,240 2014 36,178,908 19,033,220 698,786 708,874 2,821,343 59,441,131
Source : SMWD Finance Department
$0
$5,000,000
$10,000,000
$15,000,000
$20,000,000
$25,000,000
$30,000,000
$35,000,000
$40,000,000
2005 2006 2007 2008 2009 2010 2011 2012 2013 2014
Revenue
Fiscal Year
Operating Revenue by Source
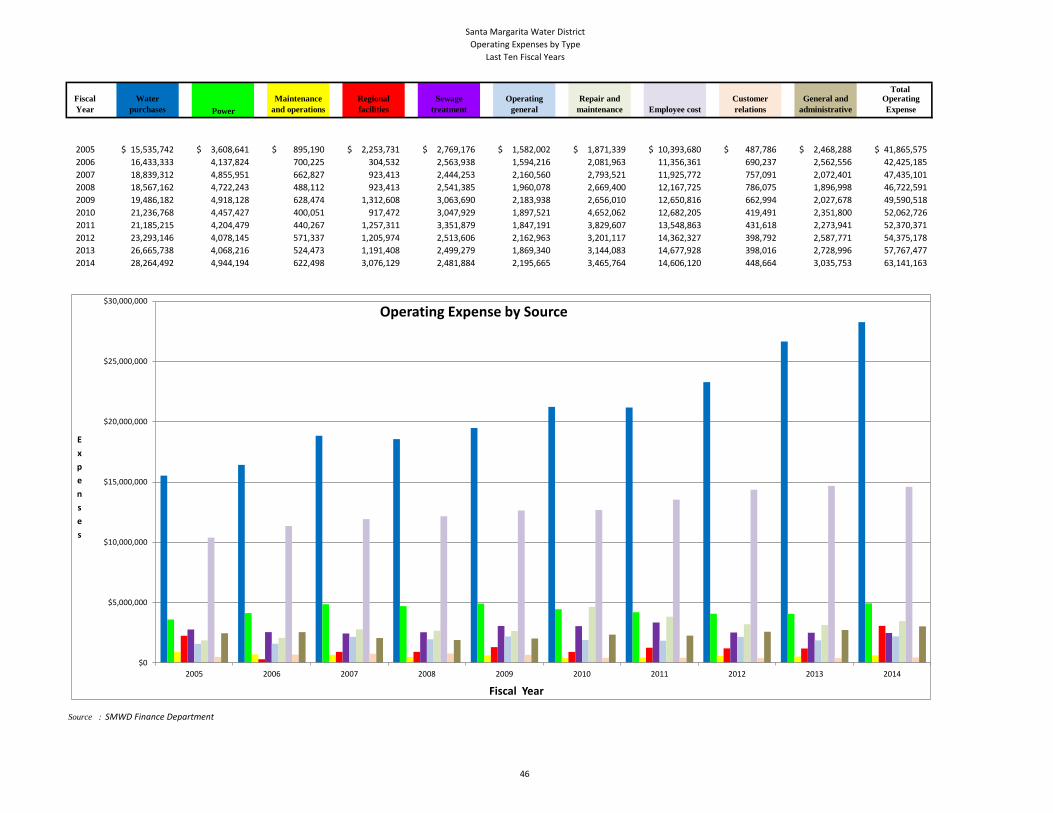
Santa Margarita Water DistrictOperating Expenses by Type
Last Ten Fiscal Years
46
Total Fiscal Year
Water purchases Power
Maintenance and operations
Regional facilities
Sewage treatment
Operating general
Repair and maintenance Employee cost
Customer relations
General and administrative
Operating Expense
2005 15,535,742$ 3,608,641$ 895,190$ 2,253,731$ 2,769,176$ 1,582,002$ 1,871,339$ 10,393,680$ 487,786$ 2,468,288$ 41,865,575$ 2006 16,433,333 4,137,824 700,225 304,532 2,563,938 1,594,216 2,081,963 11,356,361 690,237 2,562,556 42,425,185 2007 18,839,312 4,855,951 662,827 923,413 2,444,253 2,160,560 2,793,521 11,925,772 757,091 2,072,401 47,435,101 2008 18,567,162 4,722,243 488,112 923,413 2,541,385 1,960,078 2,669,400 12,167,725 786,075 1,896,998 46,722,591 2009 19,486,182 4,918,128 628,474 1,312,608 3,063,690 2,183,938 2,656,010 12,650,816 662,994 2,027,678 49,590,518 2010 21,236,768 4,457,427 400,051 917,472 3,047,929 1,897,521 4,652,062 12,682,205 419,491 2,351,800 52,062,726 2011 21,185,215 4,204,479 440,267 1,257,311 3,351,879 1,847,191 3,829,607 13,548,863 431,618 2,273,941 52,370,371 2012 23,293,146 4,078,145 571,337 1,205,974 2,513,606 2,162,963 3,201,117 14,362,327 398,792 2,587,771 54,375,178 2013 26,665,738 4,068,216 524,473 1,191,408 2,499,279 1,869,340 3,144,083 14,677,928 398,016 2,728,996 57,767,477 2014 28,264,492 4,944,194 622,498 3,076,129 2,481,884 2,195,665 3,465,764 14,606,120 448,664 3,035,753 63,141,163
Source : SMWD Finance Department
$0
$5,000,000
$10,000,000
$15,000,000
$20,000,000
$25,000,000
$30,000,000
2005 2006 2007 2008 2009 2010 2011 2012 2013 2014
Expenses
Fiscal Year
Operating Expense by Source
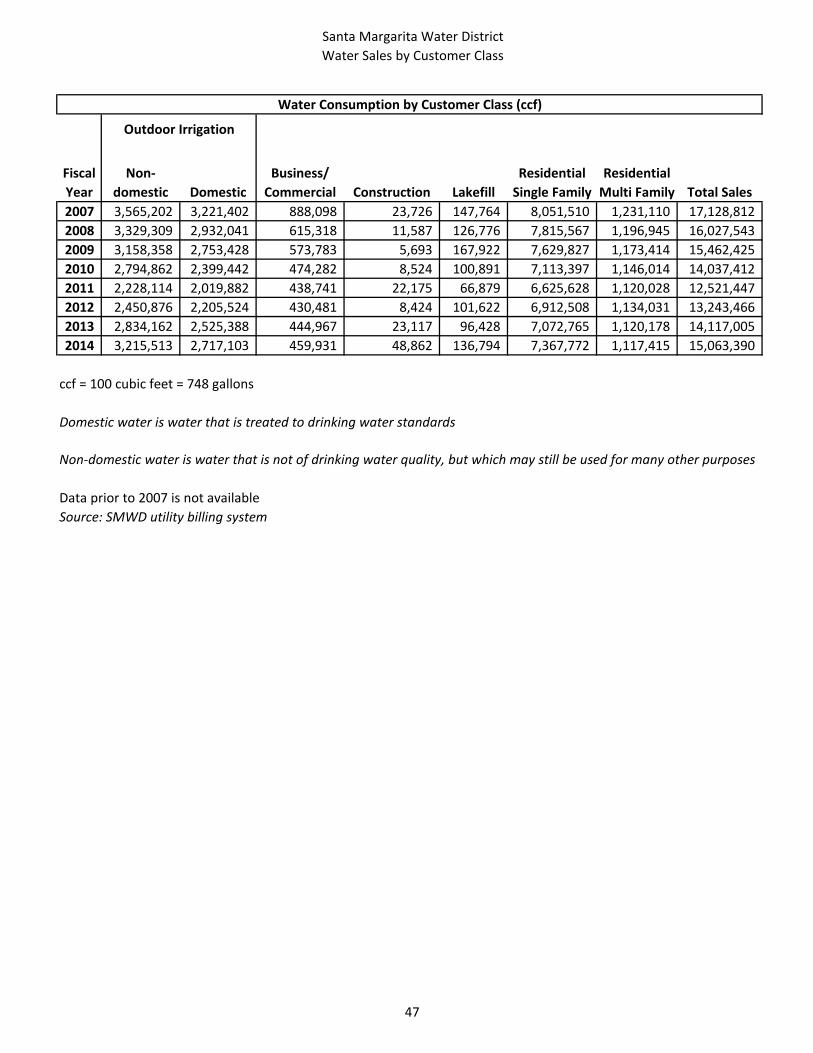
Santa Margarita Water DistrictWater Sales by Customer Class
47
Fiscal Year
Non-domestic Domestic
Business/Commercial Construction Lakefill
Residential Single Family
Residential Multi Family Total Sales
2007 3,565,202 3,221,402 888,098 23,726 147,764 8,051,510 1,231,110 17,128,812 2008 3,329,309 2,932,041 615,318 11,587 126,776 7,815,567 1,196,945 16,027,543 2009 3,158,358 2,753,428 573,783 5,693 167,922 7,629,827 1,173,414 15,462,425 2010 2,794,862 2,399,442 474,282 8,524 100,891 7,113,397 1,146,014 14,037,412 2011 2,228,114 2,019,882 438,741 22,175 66,879 6,625,628 1,120,028 12,521,447 2012 2,450,876 2,205,524 430,481 8,424 101,622 6,912,508 1,134,031 13,243,466 2013 2,834,162 2,525,388 444,967 23,117 96,428 7,072,765 1,120,178 14,117,005 2014 3,215,513 2,717,103 459,931 48,862 136,794 7,367,772 1,117,415 15,063,390
ccf = 100 cubic feet = 748 gallons
Domestic water is water that is treated to drinking water standards
Data prior to 2007 is not availableSource: SMWD utility billing system
Water Consumption by Customer Class (ccf)
Outdoor Irrigation
Non-domestic water is water that is not of drinking water quality, but which may still be used for many other purposes
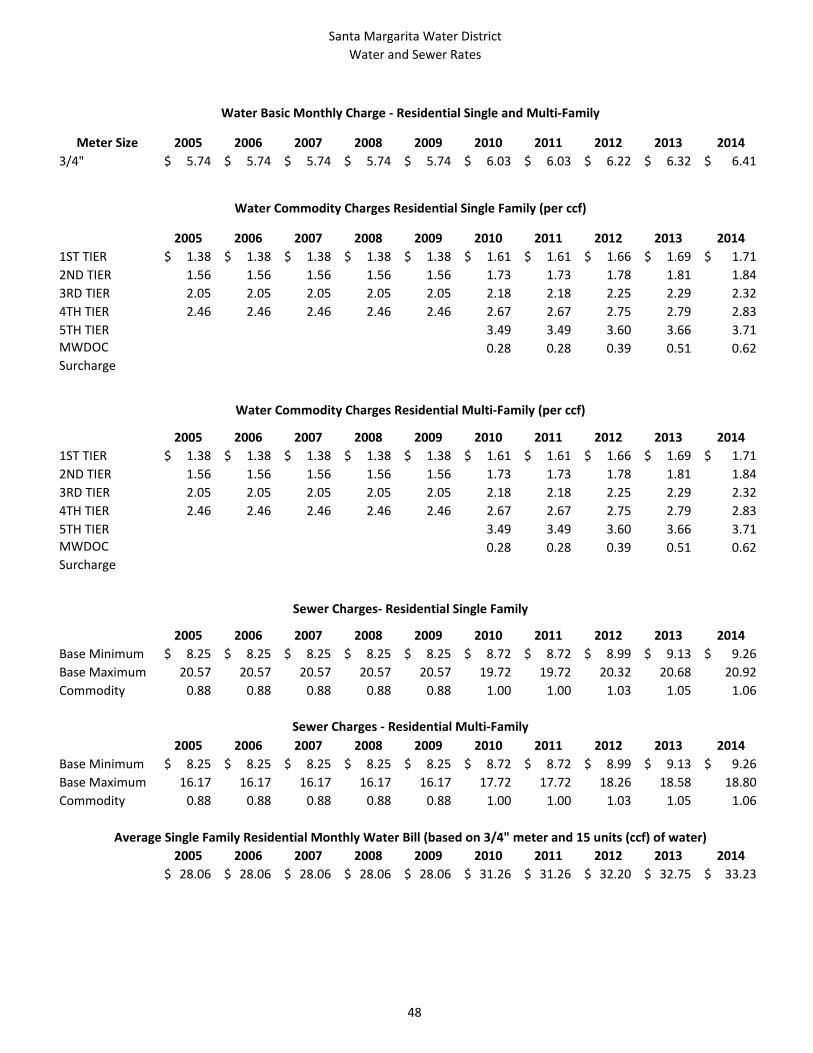
Santa Margarita Water DistrictWater and Sewer Rates
48
Meter Size 2005 2006 2007 2008 2009 2010 2011 2012 2013 20143/4" 5.74$ 5.74$ 5.74$ 5.74$ 5.74$ 6.03$ 6.03$ 6.22$ 6.32$ 6.41$
2005 2006 2007 2008 2009 2010 2011 2012 2013 20141ST TIER 1.38$ 1.38$ 1.38$ 1.38$ 1.38$ 1.61$ 1.61$ 1.66$ 1.69$ 1.71$ 2ND TIER 1.56 1.56 1.56 1.56 1.56 1.73 1.73 1.78 1.81 1.84 3RD TIER 2.05 2.05 2.05 2.05 2.05 2.18 2.18 2.25 2.29 2.32 4TH TIER 2.46 2.46 2.46 2.46 2.46 2.67 2.67 2.75 2.79 2.83 5TH TIER 3.49 3.49 3.60 3.66 3.71 MWDOC Surcharge
0.28 0.28 0.39 0.51 0.62
2005 2006 2007 2008 2009 2010 2011 2012 2013 2014Base Minimum 8.25$ 8.25$ 8.25$ 8.25$ 8.25$ 8.72$ 8.72$ 8.99$ 9.13$ 9.26$ Base Maximum 20.57 20.57 20.57 20.57 20.57 19.72 19.72 20.32 20.68 20.92 Commodity 0.88 0.88 0.88 0.88 0.88 1.00 1.00 1.03 1.05 1.06
2005 2006 2007 2008 2009 2010 2011 2012 2013 2014Base Minimum 8.25$ 8.25$ 8.25$ 8.25$ 8.25$ 8.72$ 8.72$ 8.99$ 9.13$ 9.26$ Base Maximum 16.17 16.17 16.17 16.17 16.17 17.72 17.72 18.26 18.58 18.80 Commodity 0.88 0.88 0.88 0.88 0.88 1.00 1.00 1.03 1.05 1.06
2005 2006 2007 2008 2009 2010 2011 2012 2013 201428.06$ 28.06$ 28.06$ 28.06$ 28.06$ 31.26$ 31.26$ 32.20$ 32.75$ 33.23$
Average Single Family Residential Monthly Water Bill (based on 3/4" meter and 15 units (ccf) of water)
Water Basic Monthly Charge - Residential Single and Multi-Family
Water Commodity Charges Residential Single Family (per ccf)
Water Commodity Charges Residential Multi-Family (per ccf)
Sewer Charges- Residential Single Family
Sewer Charges - Residential Multi-Family
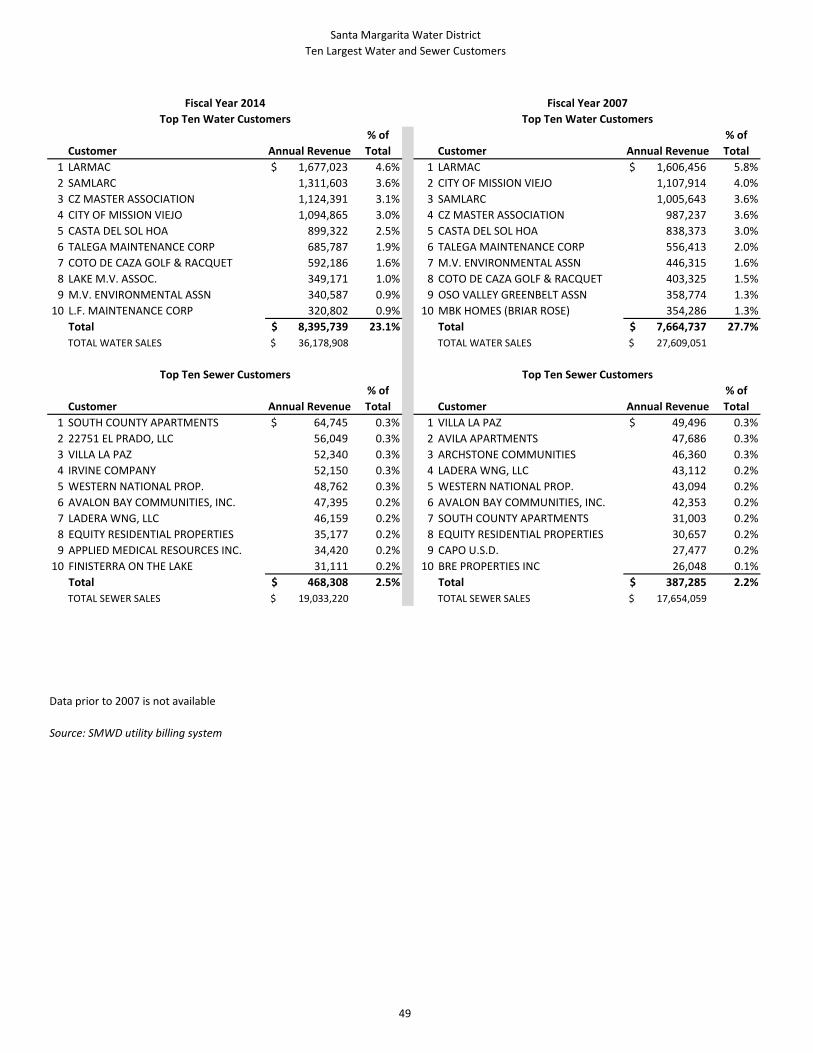
Santa Margarita Water DistrictTen Largest Water and Sewer Customers
49
Customer Annual Revenue% of Total Customer Annual Revenue
% of Total
1 LARMAC 1,677,023$ 4.6% 1 LARMAC 1,606,456$ 5.8%2 SAMLARC 1,311,603 3.6% 2 CITY OF MISSION VIEJO 1,107,914 4.0%3 CZ MASTER ASSOCIATION 1,124,391 3.1% 3 SAMLARC 1,005,643 3.6%4 CITY OF MISSION VIEJO 1,094,865 3.0% 4 CZ MASTER ASSOCIATION 987,237 3.6%5 CASTA DEL SOL HOA 899,322 2.5% 5 CASTA DEL SOL HOA 838,373 3.0%6 TALEGA MAINTENANCE CORP 685,787 1.9% 6 TALEGA MAINTENANCE CORP 556,413 2.0%7 COTO DE CAZA GOLF & RACQUET 592,186 1.6% 7 M.V. ENVIRONMENTAL ASSN 446,315 1.6%8 LAKE M.V. ASSOC. 349,171 1.0% 8 COTO DE CAZA GOLF & RACQUET 403,325 1.5%9 M.V. ENVIRONMENTAL ASSN 340,587 0.9% 9 OSO VALLEY GREENBELT ASSN 358,774 1.3%
10 L.F. MAINTENANCE CORP 320,802 0.9% 10 MBK HOMES (BRIAR ROSE) 354,286 1.3%Total 8,395,739$ 23.1% Total 7,664,737$ 27.7%TOTAL WATER SALES 36,178,908$ TOTAL WATER SALES 27,609,051$
Customer Annual Revenue% of Total Customer Annual Revenue
% of Total
1 SOUTH COUNTY APARTMENTS 64,745$ 0.3% 1 VILLA LA PAZ 49,496$ 0.3%2 22751 EL PRADO, LLC 56,049 0.3% 2 AVILA APARTMENTS 47,686 0.3%3 VILLA LA PAZ 52,340 0.3% 3 ARCHSTONE COMMUNITIES 46,360 0.3%4 IRVINE COMPANY 52,150 0.3% 4 LADERA WNG, LLC 43,112 0.2%5 WESTERN NATIONAL PROP. 48,762 0.3% 5 WESTERN NATIONAL PROP. 43,094 0.2%6 AVALON BAY COMMUNITIES, INC. 47,395 0.2% 6 AVALON BAY COMMUNITIES, INC. 42,353 0.2%7 LADERA WNG, LLC 46,159 0.2% 7 SOUTH COUNTY APARTMENTS 31,003 0.2%8 EQUITY RESIDENTIAL PROPERTIES 35,177 0.2% 8 EQUITY RESIDENTIAL PROPERTIES 30,657 0.2%9 APPLIED MEDICAL RESOURCES INC. 34,420 0.2% 9 CAPO U.S.D. 27,477 0.2%
10 FINISTERRA ON THE LAKE 31,111 0.2% 10 BRE PROPERTIES INC 26,048 0.1%Total 468,308$ 2.5% Total 387,285$ 2.2%TOTAL SEWER SALES 19,033,220$ TOTAL SEWER SALES 17,654,059$
Data prior to 2007 is not available
Source: SMWD utility billing system
Fiscal Year 2014 Fiscal Year 2007Top Ten Water Customers Top Ten Water Customers
Top Ten Sewer Customers Top Ten Sewer Customers
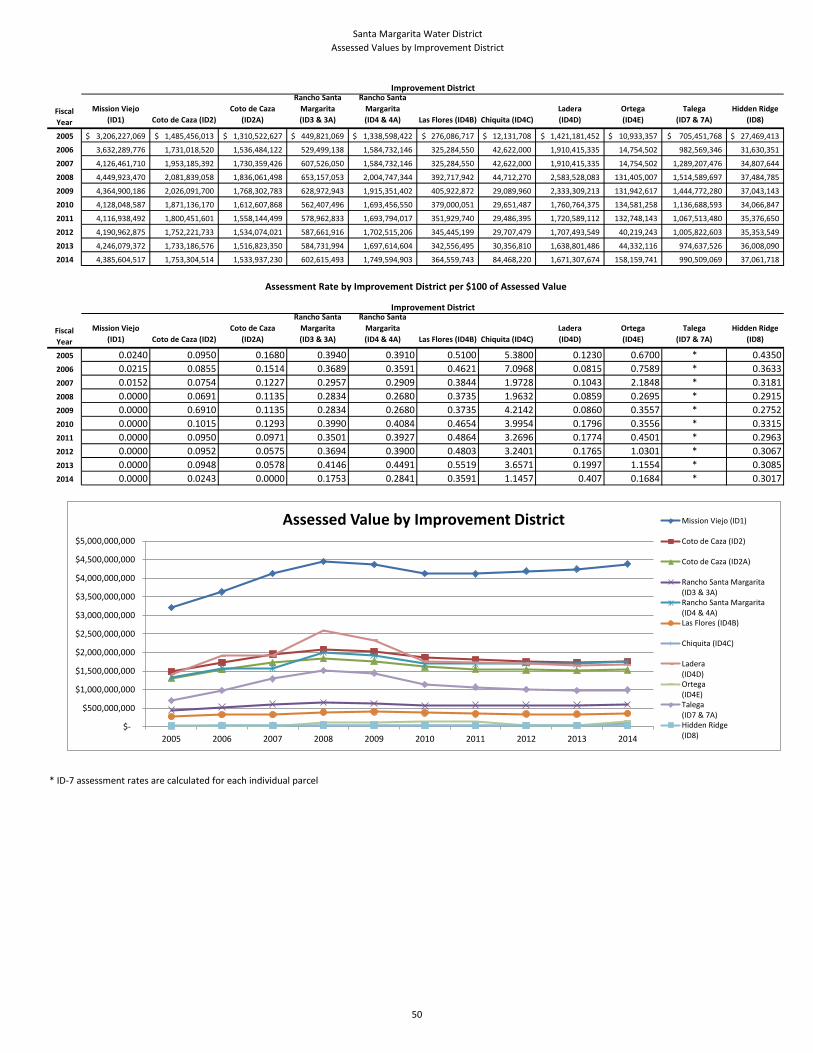
Santa Margarita Water DistrictAssessed Values by Improvement District
50
Mission Viejo (ID1) Coto de Caza (ID2)
Coto de Caza (ID2A)
Rancho Santa Margarita (ID3 & 3A)
Rancho Santa Margarita (ID4 & 4A) Las Flores (ID4B) Chiquita (ID4C)
Ladera (ID4D)
Ortega (ID4E)
Talega (ID7 & 7A)
Hidden Ridge (ID8)
2005 3,206,227,069$ 1,485,456,013$ 1,310,522,627$ 449,821,069$ 1,338,598,422$ 276,086,717$ 12,131,708$ 1,421,181,452$ 10,933,357$ 705,451,768$ 27,469,413$
2006 3,632,289,776 1,731,018,520 1,536,484,122 529,499,138 1,584,732,146 325,284,550 42,622,000 1,910,415,335 14,754,502 982,569,346 31,630,351
2007 4,126,461,710 1,953,185,392 1,730,359,426 607,526,050 1,584,732,146 325,284,550 42,622,000 1,910,415,335 14,754,502 1,289,207,476 34,807,644
2008 4,449,923,470 2,081,839,058 1,836,061,498 653,157,053 2,004,747,344 392,717,942 44,712,270 2,583,528,083 131,405,007 1,514,589,697 37,484,785
2009 4,364,900,186 2,026,091,700 1,768,302,783 628,972,943 1,915,351,402 405,922,872 29,089,960 2,333,309,213 131,942,617 1,444,772,280 37,043,143
2010 4,128,048,587 1,871,136,170 1,612,607,868 562,407,496 1,693,456,550 379,000,051 29,651,487 1,760,764,375 134,581,258 1,136,688,593 34,066,847
2011 4,116,938,492 1,800,451,601 1,558,144,499 578,962,833 1,693,794,017 351,929,740 29,486,395 1,720,589,112 132,748,143 1,067,513,480 35,376,650
2012 4,190,962,875 1,752,221,733 1,534,074,021 587,661,916 1,702,515,206 345,445,199 29,707,479 1,707,493,549 40,219,243 1,005,822,603 35,353,549
2013 4,246,079,372 1,733,186,576 1,516,823,350 584,731,994 1,697,614,604 342,556,495 30,356,810 1,638,801,486 44,332,116 974,637,526 36,008,090
2014 4,385,604,517 1,753,304,514 1,533,937,230 602,615,493 1,749,594,903 364,559,743 84,468,220 1,671,307,674 158,159,741 990,509,069 37,061,718
Mission Viejo (ID1) Coto de Caza (ID2)
Coto de Caza (ID2A)
Rancho Santa Margarita (ID3 & 3A)
Rancho Santa Margarita (ID4 & 4A) Las Flores (ID4B) Chiquita (ID4C)
Ladera (ID4D)
Ortega (ID4E)
Talega (ID7 & 7A)
Hidden Ridge (ID8)
2005 0.0240 0.0950 0.1680 0.3940 0.3910 0.5100 5.3800 0.1230 0.6700 * 0.43502006 0.0215 0.0855 0.1514 0.3689 0.3591 0.4621 7.0968 0.0815 0.7589 * 0.36332007 0.0152 0.0754 0.1227 0.2957 0.2909 0.3844 1.9728 0.1043 2.1848 * 0.31812008 0.0000 0.0691 0.1135 0.2834 0.2680 0.3735 1.9632 0.0859 0.2695 * 0.29152009 0.0000 0.6910 0.1135 0.2834 0.2680 0.3735 4.2142 0.0860 0.3557 * 0.27522010 0.0000 0.1015 0.1293 0.3990 0.4084 0.4654 3.9954 0.1796 0.3556 * 0.33152011 0.0000 0.0950 0.0971 0.3501 0.3927 0.4864 3.2696 0.1774 0.4501 * 0.29632012 0.0000 0.0952 0.0575 0.3694 0.3900 0.4803 3.2401 0.1765 1.0301 * 0.30672013 0.0000 0.0948 0.0578 0.4146 0.4491 0.5519 3.6571 0.1997 1.1554 * 0.30852014 0.0000 0.0243 0.0000 0.1753 0.2841 0.3591 1.1457 0.407 0.1684 * 0.3017
* ID-7 assessment rates are calculated for each individual parcel
Fiscal Year
Improvement District
Fiscal Year
Improvement District
Assessment Rate by Improvement District per $100 of Assessed Value
$-
$500,000,000
$1,000,000,000
$1,500,000,000
$2,000,000,000
$2,500,000,000
$3,000,000,000
$3,500,000,000
$4,000,000,000
$4,500,000,000
$5,000,000,000
2005 2006 2007 2008 2009 2010 2011 2012 2013 2014
Assessed Value by Improvement District Mission Viejo (ID1)
Coto de Caza (ID2)
Coto de Caza (ID2A)
Rancho Santa Margarita(ID3 & 3A)Rancho Santa Margarita(ID4 & 4A)Las Flores (ID4B)
Chiquita (ID4C)
Ladera(ID4D)Ortega(ID4E)Talega(ID7 & 7A)Hidden Ridge(ID8)
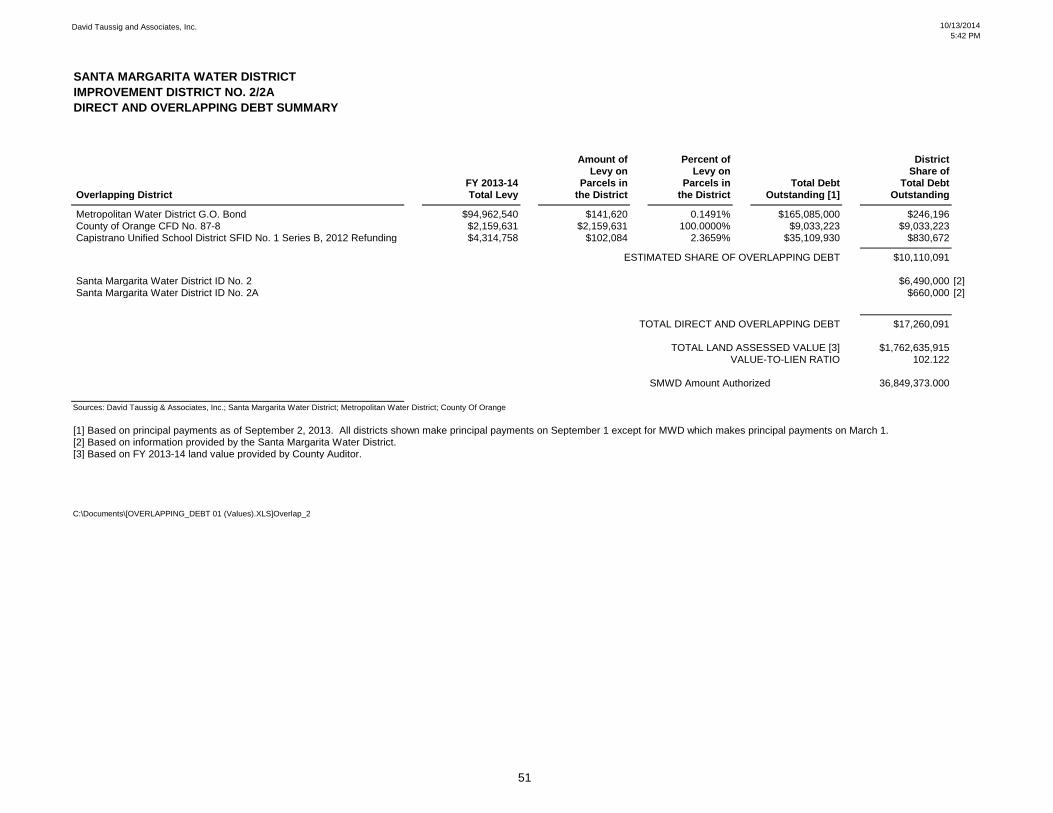
David Taussig and Associates, Inc. 10/13/20145:42 PM
51
SANTA MARGARITA WATER DISTRICTIMPROVEMENT DISTRICT NO. 2/2ADIRECT AND OVERLAPPING DEBT SUMMARY
Amount of Percent of DistrictLevy on Levy on Share of
FY 2013-14 Parcels in Parcels in Total Debt Total Debt Overlapping District Total Levy the District the District Outstanding [1] Outstanding
Metropolitan Water District G.O. Bond $94,962,540 $141,620 0.1491% $165,085,000 $246,196 County of Orange CFD No. 87-8 $2,159,631 $2,159,631 100.0000% $9,033,223 $9,033,223 Capistrano Unified School District SFID No. 1 Series B, 2012 Refunding $4,314,758 $102,084 2.3659% $35,109,930 $830,672
ESTIMATED SHARE OF OVERLAPPING DEBT $10,110,091
Santa Margarita Water District ID No. 2 $6,490,000 [2] Santa Margarita Water District ID No. 2A $660,000 [2]
TOTAL DIRECT AND OVERLAPPING DEBT $17,260,091
TOTAL LAND ASSESSED VALUE [3] $1,762,635,915VALUE-TO-LIEN RATIO 102.122
SMWD Amount Authorized 36,849,373.000
Sources: David Taussig & Associates, Inc.; Santa Margarita Water District; Metropolitan Water District; County Of Orange
[1] Based on principal payments as of September 2, 2013. All districts shown make principal payments on September 1 except for MWD which makes principal payments on March 1.[2] Based on information provided by the Santa Margarita Water District.[3] Based on FY 2013-14 land value provided by County Auditor.
C:\Documents\[OVERLAPPING_DEBT 01 (Values).XLS]Overlap_2
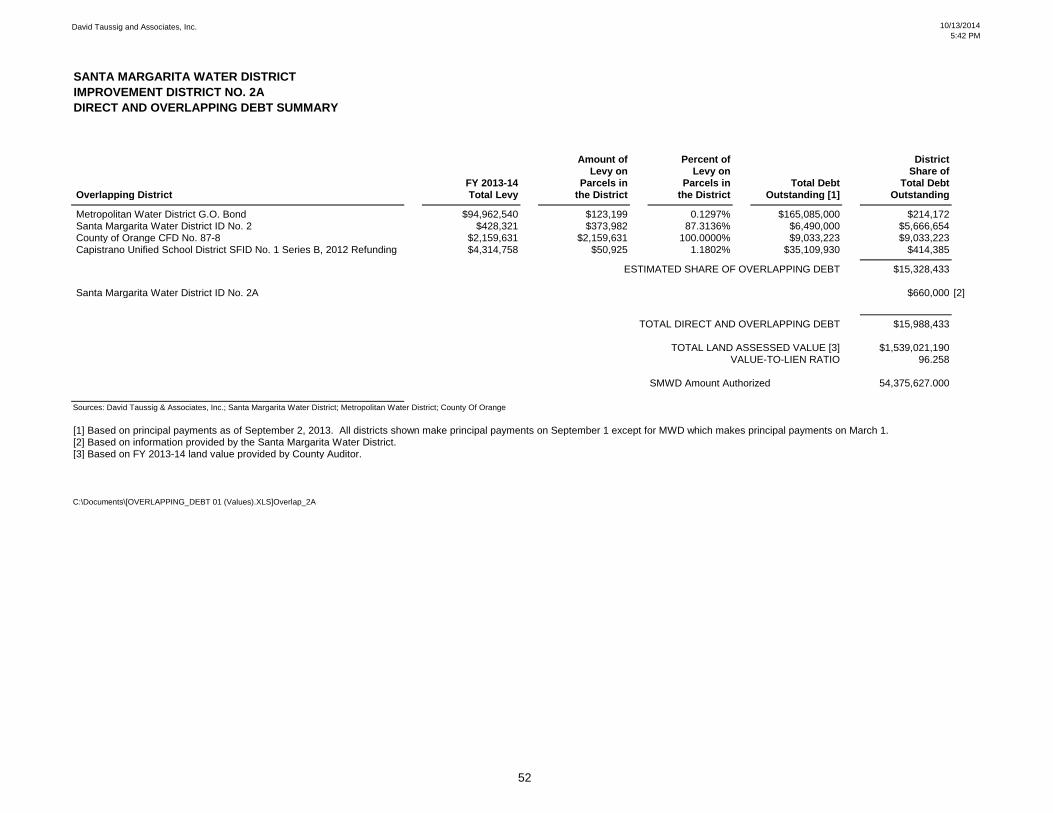
David Taussig and Associates, Inc. 10/13/20145:42 PM
52
SANTA MARGARITA WATER DISTRICTIMPROVEMENT DISTRICT NO. 2ADIRECT AND OVERLAPPING DEBT SUMMARY
Amount of Percent of DistrictLevy on Levy on Share of
FY 2013-14 Parcels in Parcels in Total Debt Total Debt Overlapping District Total Levy the District the District Outstanding [1] Outstanding
Metropolitan Water District G.O. Bond $94,962,540 $123,199 0.1297% $165,085,000 $214,172 Santa Margarita Water District ID No. 2 $428,321 $373,982 87.3136% $6,490,000 $5,666,654 County of Orange CFD No. 87-8 $2,159,631 $2,159,631 100.0000% $9,033,223 $9,033,223 Capistrano Unified School District SFID No. 1 Series B, 2012 Refunding $4,314,758 $50,925 1.1802% $35,109,930 $414,385
ESTIMATED SHARE OF OVERLAPPING DEBT $15,328,433
Santa Margarita Water District ID No. 2A $660,000 [2]
TOTAL DIRECT AND OVERLAPPING DEBT $15,988,433
TOTAL LAND ASSESSED VALUE [3] $1,539,021,190VALUE-TO-LIEN RATIO 96.258
SMWD Amount Authorized 54,375,627.000
Sources: David Taussig & Associates, Inc.; Santa Margarita Water District; Metropolitan Water District; County Of Orange
[1] Based on principal payments as of September 2, 2013. All districts shown make principal payments on September 1 except for MWD which makes principal payments on March 1.[2] Based on information provided by the Santa Margarita Water District.[3] Based on FY 2013-14 land value provided by County Auditor.
C:\Documents\[OVERLAPPING_DEBT 01 (Values).XLS]Overlap_2A

David Taussig and Associates, Inc. 10/13/20145:42 PM
53
SANTA MARGARITA WATER DISTRICTIMPROVEMENT DISTRICT NO. 3/3ADIRECT AND OVERLAPPING DEBT SUMMARY
Amount of Percent of DistrictLevy on Levy on Share of
FY 2013-14 Parcels in Parcels in Total Debt Total Debt Overlapping District Total Levy the District the District Outstanding [1] Outstanding
Metropolitan Water District G.O. Bond $94,962,540 $44,646 0.0470% $165,085,000 $77,613 County of Orange CFD No. 87-5B $2,071,794 $384,178 18.5433% $5,895,560 $1,093,229 County of Orange CFD No. 87-5C $1,311,416 $1,311,416 100.0000% $4,374,591 $4,374,591 County of Orange CFD No. 87-5D $1,066,933 $1,066,933 100.0000% $3,968,488 $3,968,488 Capistrano Unified School District CFD No. 88-1 $1,470,880 $242,176 16.4647% $1,330,000 $218,981 Capistrano Unified School District SFID No. 1 Series B, 2012 Refunding $4,314,758 $104 0.0024% $35,109,930 $844 Saddleback Valley Unified School District G.O. Bond Series 2004 $5,382,673 $204,731 3.8035% $2,125,000 $80,825 Saddleback Valley Unified School District G.O. Bond Series 2007 $3,581,616 $136,227 3.8035% $44,065,000 $1,676,019 Saddleback Valley Unified School District G.O. Bond Series 2013 Refunding $432,122 [4] $16,263 3.7634% $70,650,000 $2,658,862 Saddleback Valley Unified School District CFD No. 89-2 $1,648,415 $1,648,415 100.0000% $7,311,602 $7,311,602 Saddleback Valley Unified School District CFD No. 89-3 $1,133,456 $1,133,456 100.0000% $4,838,718 $4,838,718
ESTIMATED SHARE OF OVERLAPPING DEBT $26,299,771
Santa Margarita Water District ID No. 3/3A $17,385,000 [2]
TOTAL DIRECT AND OVERLAPPING DEBT $43,684,771
TOTAL LAND ASSESSED VALUE [3] $625,629,187VALUE-TO-LIEN RATIO 14.321
SMWD Amount Authorized 71,823,634.000
Sources: David Taussig & Associates, Inc.; Santa Margarita Water District; Metropolitan Water District; Saddleback Valley USD; County Of Orange
[1] Based on principal payments as of September 2, 2013. All districts shown make principal payments on September 1 except for MWD which makes principal payments on March 1.[2] Based on information provided by the Santa Margarita Water District.[3] Based on FY 2013-14 land value provided by County Auditor.
C:\Documents\[OVERLAPPING_DEBT 01 (Values).XLS]Overlap_3
[4] FY 2013-2014 levy information was not available from the County of Orange Auditor as of December 4, 2013. FY 2013-2014 levy approximated by multiplying the district's FY 2013-2014 secured assessed value by the FY 2013-2014 ad valorem rate.
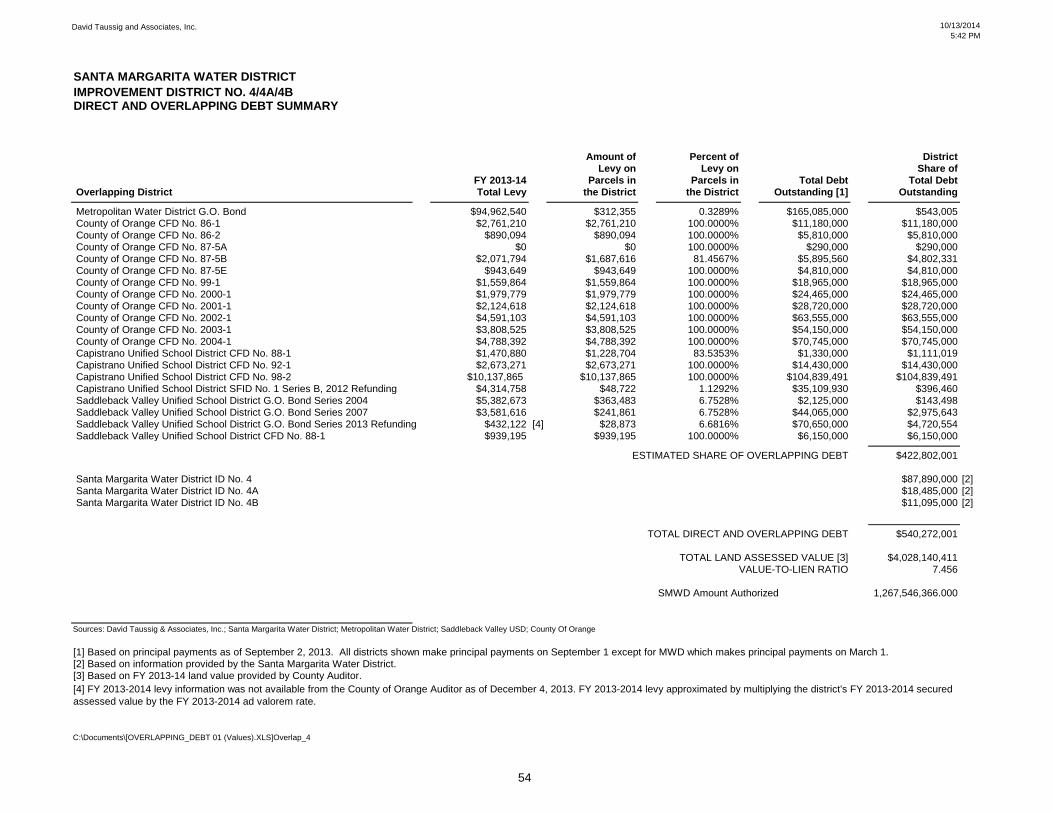
David Taussig and Associates, Inc. 10/13/20145:42 PM
54
SANTA MARGARITA WATER DISTRICTIMPROVEMENT DISTRICT NO. 4/4A/4BDIRECT AND OVERLAPPING DEBT SUMMARY
Amount of Percent of DistrictLevy on Levy on Share of
FY 2013-14 Parcels in Parcels in Total Debt Total Debt Overlapping District Total Levy the District the District Outstanding [1] Outstanding
Metropolitan Water District G.O. Bond $94,962,540 $312,355 0.3289% $165,085,000 $543,005 County of Orange CFD No. 86-1 $2,761,210 $2,761,210 100.0000% $11,180,000 $11,180,000 County of Orange CFD No. 86-2 $890,094 $890,094 100.0000% $5,810,000 $5,810,000 County of Orange CFD No. 87-5A $0 $0 100.0000% $290,000 $290,000 County of Orange CFD No. 87-5B $2,071,794 $1,687,616 81.4567% $5,895,560 $4,802,331 County of Orange CFD No. 87-5E $943,649 $943,649 100.0000% $4,810,000 $4,810,000 County of Orange CFD No. 99-1 $1,559,864 $1,559,864 100.0000% $18,965,000 $18,965,000 County of Orange CFD No. 2000-1 $1,979,779 $1,979,779 100.0000% $24,465,000 $24,465,000 County of Orange CFD No. 2001-1 $2,124,618 $2,124,618 100.0000% $28,720,000 $28,720,000 County of Orange CFD No. 2002-1 $4,591,103 $4,591,103 100.0000% $63,555,000 $63,555,000 County of Orange CFD No. 2003-1 $3,808,525 $3,808,525 100.0000% $54,150,000 $54,150,000 County of Orange CFD No. 2004-1 $4,788,392 $4,788,392 100.0000% $70,745,000 $70,745,000 Capistrano Unified School District CFD No. 88-1 $1,470,880 $1,228,704 83.5353% $1,330,000 $1,111,019 Capistrano Unified School District CFD No. 92-1 $2,673,271 $2,673,271 100.0000% $14,430,000 $14,430,000 Capistrano Unified School District CFD No. 98-2 $10,137,865 $10,137,865 100.0000% $104,839,491 $104,839,491 Capistrano Unified School District SFID No. 1 Series B, 2012 Refunding $4,314,758 $48,722 1.1292% $35,109,930 $396,460 Saddleback Valley Unified School District G.O. Bond Series 2004 $5,382,673 $363,483 6.7528% $2,125,000 $143,498 Saddleback Valley Unified School District G.O. Bond Series 2007 $3,581,616 $241,861 6.7528% $44,065,000 $2,975,643 Saddleback Valley Unified School District G.O. Bond Series 2013 Refunding $432,122 [4] $28,873 6.6816% $70,650,000 $4,720,554 Saddleback Valley Unified School District CFD No. 88-1 $939,195 $939,195 100.0000% $6,150,000 $6,150,000
ESTIMATED SHARE OF OVERLAPPING DEBT $422,802,001
Santa Margarita Water District ID No. 4 $87,890,000 [2] Santa Margarita Water District ID No. 4A $18,485,000 [2] Santa Margarita Water District ID No. 4B $11,095,000 [2]
TOTAL DIRECT AND OVERLAPPING DEBT $540,272,001
TOTAL LAND ASSESSED VALUE [3] $4,028,140,411VALUE-TO-LIEN RATIO 7.456
SMWD Amount Authorized 1,267,546,366.000
Sources: David Taussig & Associates, Inc.; Santa Margarita Water District; Metropolitan Water District; Saddleback Valley USD; County Of Orange
[1] Based on principal payments as of September 2, 2013. All districts shown make principal payments on September 1 except for MWD which makes principal payments on March 1.[2] Based on information provided by the Santa Margarita Water District.[3] Based on FY 2013-14 land value provided by County Auditor.
C:\Documents\[OVERLAPPING_DEBT 01 (Values).XLS]Overlap_4
[4] FY 2013-2014 levy information was not available from the County of Orange Auditor as of December 4, 2013. FY 2013-2014 levy approximated by multiplying the district's FY 2013-2014 secured assessed value by the FY 2013-2014 ad valorem rate.
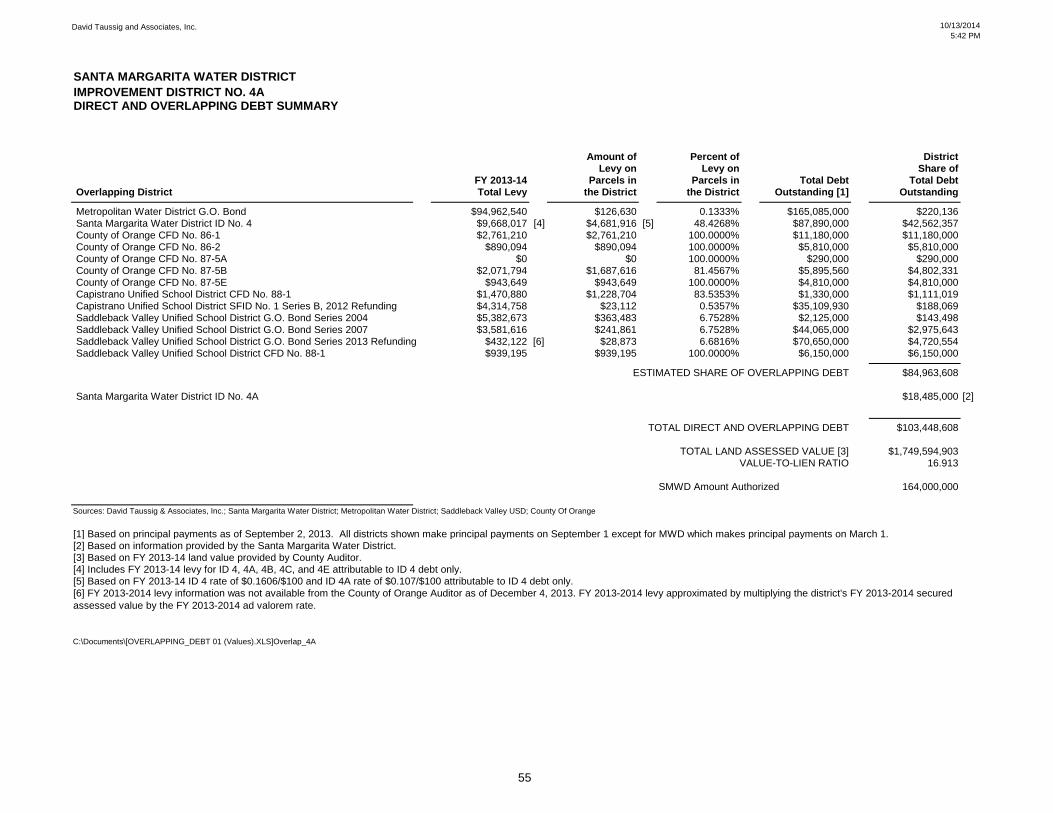
David Taussig and Associates, Inc. 10/13/20145:42 PM
55
SANTA MARGARITA WATER DISTRICTIMPROVEMENT DISTRICT NO. 4ADIRECT AND OVERLAPPING DEBT SUMMARY
Amount of Percent of DistrictLevy on Levy on Share of
FY 2013-14 Parcels in Parcels in Total Debt Total Debt Overlapping District Total Levy the District the District Outstanding [1] Outstanding
Metropolitan Water District G.O. Bond $94,962,540 $126,630 0.1333% $165,085,000 $220,136 Santa Margarita Water District ID No. 4 $9,668,017 [4] $4,681,916 [5] 48.4268% $87,890,000 $42,562,357 County of Orange CFD No. 86-1 $2,761,210 $2,761,210 100.0000% $11,180,000 $11,180,000 County of Orange CFD No. 86-2 $890,094 $890,094 100.0000% $5,810,000 $5,810,000 County of Orange CFD No. 87-5A $0 $0 100.0000% $290,000 $290,000 County of Orange CFD No. 87-5B $2,071,794 $1,687,616 81.4567% $5,895,560 $4,802,331 County of Orange CFD No. 87-5E $943,649 $943,649 100.0000% $4,810,000 $4,810,000 Capistrano Unified School District CFD No. 88-1 $1,470,880 $1,228,704 83.5353% $1,330,000 $1,111,019 Capistrano Unified School District SFID No. 1 Series B, 2012 Refunding $4,314,758 $23,112 0.5357% $35,109,930 $188,069 Saddleback Valley Unified School District G.O. Bond Series 2004 $5,382,673 $363,483 6.7528% $2,125,000 $143,498 Saddleback Valley Unified School District G.O. Bond Series 2007 $3,581,616 $241,861 6.7528% $44,065,000 $2,975,643 Saddleback Valley Unified School District G.O. Bond Series 2013 Refunding $432,122 [6] $28,873 6.6816% $70,650,000 $4,720,554 Saddleback Valley Unified School District CFD No. 88-1 $939,195 $939,195 100.0000% $6,150,000 $6,150,000
ESTIMATED SHARE OF OVERLAPPING DEBT $84,963,608
Santa Margarita Water District ID No. 4A $18,485,000 [2]
TOTAL DIRECT AND OVERLAPPING DEBT $103,448,608
TOTAL LAND ASSESSED VALUE [3] $1,749,594,903VALUE-TO-LIEN RATIO 16.913
SMWD Amount Authorized 164,000,000
Sources: David Taussig & Associates, Inc.; Santa Margarita Water District; Metropolitan Water District; Saddleback Valley USD; County Of Orange
[1] Based on principal payments as of September 2, 2013. All districts shown make principal payments on September 1 except for MWD which makes principal payments on March 1.[2] Based on information provided by the Santa Margarita Water District.[3] Based on FY 2013-14 land value provided by County Auditor.[4] Includes FY 2013-14 levy for ID 4, 4A, 4B, 4C, and 4E attributable to ID 4 debt only.[5] Based on FY 2013-14 ID 4 rate of $0.1606/$100 and ID 4A rate of $0.107/$100 attributable to ID 4 debt only.
C:\Documents\[OVERLAPPING_DEBT 01 (Values).XLS]Overlap_4A
[6] FY 2013-2014 levy information was not available from the County of Orange Auditor as of December 4, 2013. FY 2013-2014 levy approximated by multiplying the district's FY 2013-2014 secured assessed value by the FY 2013-2014 ad valorem rate.

David Taussig and Associates, Inc. 10/13/20145:42 PM
56
SANTA MARGARITA WATER DISTRICTIMPROVEMENT DISTRICT NO. 4B [6]DIRECT AND OVERLAPPING DEBT SUMMARY
Amount of Percent of DistrictLevy on Levy on Share of
FY 2013-14 Parcels in Parcels in Total Debt Total Debt Overlapping District Total Levy the District the District Outstanding [2] Outstanding
Metropolitan Water District G.O. Bond $94,962,540 $182,766 0.1925% $165,085,000 $317,724 Santa Margarita Water District ID No. 4 $9,668,017 [4] $4,886,336 [5] 50.5412% $87,890,000 $44,420,697 Capistrano Unified School District CFD No. 92-1 $2,673,271 $2,673,271 100.0000% $14,430,000 $14,430,000 Capistrano Unified School District SFID No. 1 Series B, 2012 Refunding $4,314,758 $17,390 0.4030% $35,109,930 $141,509
ESTIMATED SHARE OF OVERLAPPING DEBT $59,309,930
Santa Margarita Water District ID No. 4B $11,095,000 [1]
TOTAL DIRECT AND OVERLAPPING DEBT $70,404,930
TOTAL LAND ASSESSED VALUE [3] $2,194,027,158VALUE-TO-LIEN RATIO 31.163
SMWD Amount Authorized 339,000,000Sources: David Taussig & Associates, Inc.; Santa Margarita Water District; Metropolitan Water District; County Of Orange
[1] Based on information provided by the Santa Margarita Water District.[2] Based on principal payments as of September 2, 2013. All districts shown make principal payments on September 1 except for MWD which makes principal payments on March 1.[3] Based on FY 2013-14 land value provided by the County Auditor. Includes land value for property in ID 4B, ID 4D, and ID 4E.[4] Includes FY 2013-14 levy for ID 4, 4A, 4B, 4C, and 4E attributable to ID 4 debt only.
[6] Includes property that pays for ID 4B debt (i.e., ID 4B, ID 4D, and ID 4E).
C:\Documents\[OVERLAPPING_DEBT 01 (Values).XLS]Overlap_4B
[5] Based on FY 2013-14 ID 4 rate of $0.1606/$100 for property in ID 4B, ID 4D, and ID 4E. Also includes ID 4B rate of $0.3184/$100, ID 4D rate of $0.0000/$100, and ID 4E rate of $0.1277/$100 attributable to ID 4 debt only.
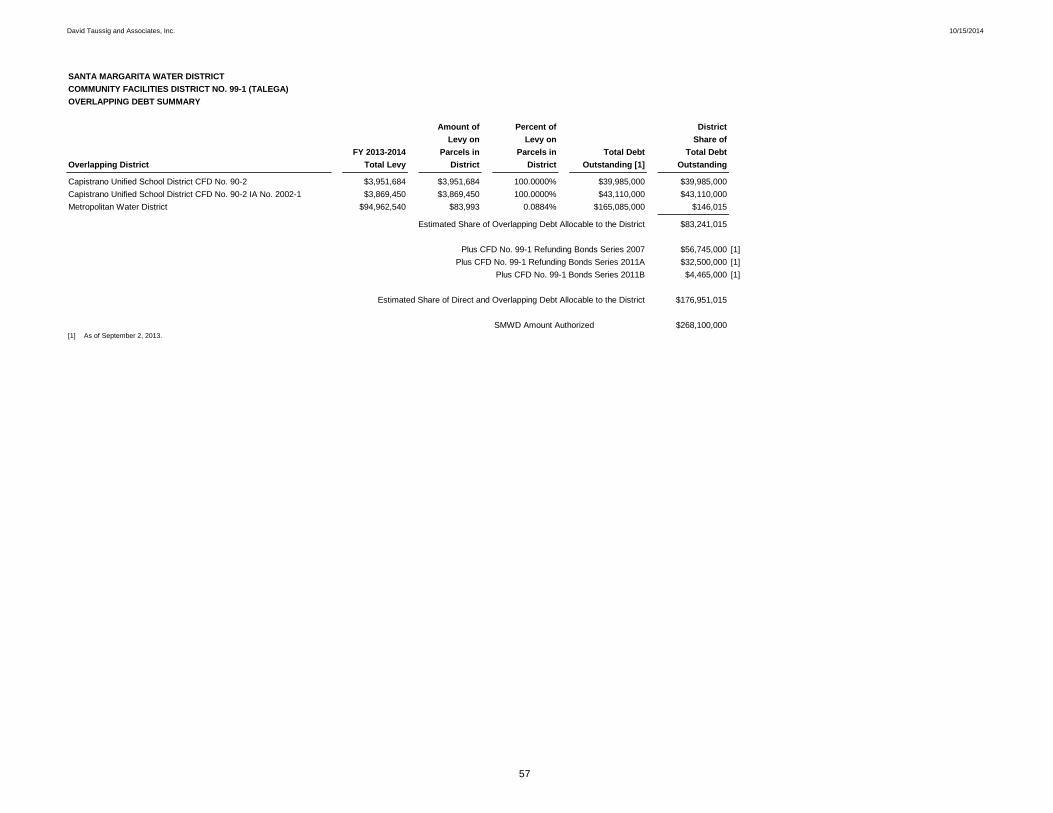
David Taussig and Associates, Inc. 10/15/2014
57
SANTA MARGARITA WATER DISTRICTCOMMUNITY FACILITIES DISTRICT NO. 99-1 (TALEGA)OVERLAPPING DEBT SUMMARY
Amount of Percent of DistrictLevy on Levy on Share of
FY 2013-2014 Parcels in Parcels in Total Debt Total DebtOverlapping District Total Levy District District Outstanding [1] Outstanding
Capistrano Unified School District CFD No. 90-2 $3,951,684 $3,951,684 100.0000% $39,985,000 $39,985,000Capistrano Unified School District CFD No. 90-2 IA No. 2002-1 $3,869,450 $3,869,450 100.0000% $43,110,000 $43,110,000Metropolitan Water District $94,962,540 $83,993 0.0884% $165,085,000 $146,015
Estimated Share of Overlapping Debt Allocable to the District $83,241,015
$56,745,000 [1]$32,500,000 [1]$4,465,000 [1]
$176,951,015
SMWD Amount Authorized $268,100,000[1] As of September 2, 2013.
Plus CFD No. 99-1 Refunding Bonds Series 2007Plus CFD No. 99-1 Refunding Bonds Series 2011A
Estimated Share of Direct and Overlapping Debt Allocable to the District
Plus CFD No. 99-1 Bonds Series 2011B
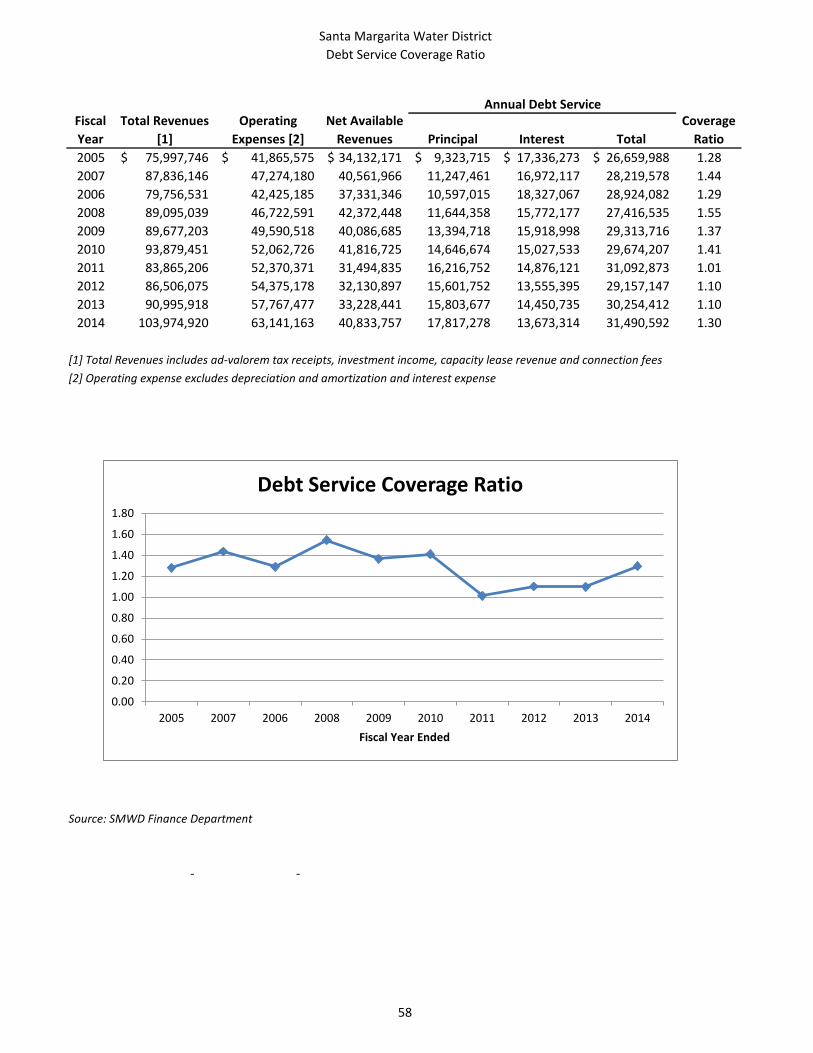
Santa Margarita Water DistrictDebt Service Coverage Ratio
58
Fiscal Year
Total Revenues [1]
Operating Expenses [2]
Net Available Revenues Principal Interest Total
Coverage Ratio
2005 75,997,746$ 41,865,575$ 34,132,171$ 9,323,715$ 17,336,273$ 26,659,988$ 1.282007 87,836,146 47,274,180 40,561,966 11,247,461 16,972,117 28,219,578 1.442006 79,756,531 42,425,185 37,331,346 10,597,015 18,327,067 28,924,082 1.292008 89,095,039 46,722,591 42,372,448 11,644,358 15,772,177 27,416,535 1.552009 89,677,203 49,590,518 40,086,685 13,394,718 15,918,998 29,313,716 1.372010 93,879,451 52,062,726 41,816,725 14,646,674 15,027,533 29,674,207 1.412011 83,865,206 52,370,371 31,494,835 16,216,752 14,876,121 31,092,873 1.012012 86,506,075 54,375,178 32,130,897 15,601,752 13,555,395 29,157,147 1.102013 90,995,918 57,767,477 33,228,441 15,803,677 14,450,735 30,254,412 1.102014 103,974,920 63,141,163 40,833,757 17,817,278 13,673,314 31,490,592 1.30
[1] Total Revenues includes ad-valorem tax receipts, investment income, capacity lease revenue and connection fees[2] Operating expense excludes depreciation and amortization and interest expense
Source: SMWD Finance Department
- -
Annual Debt Service
0.00
0.20
0.40
0.60
0.80
1.00
1.20
1.40
1.60
1.80
2005 2007 2006 2008 2009 2010 2011 2012 2013 2014Fiscal Year Ended
Debt Service Coverage Ratio
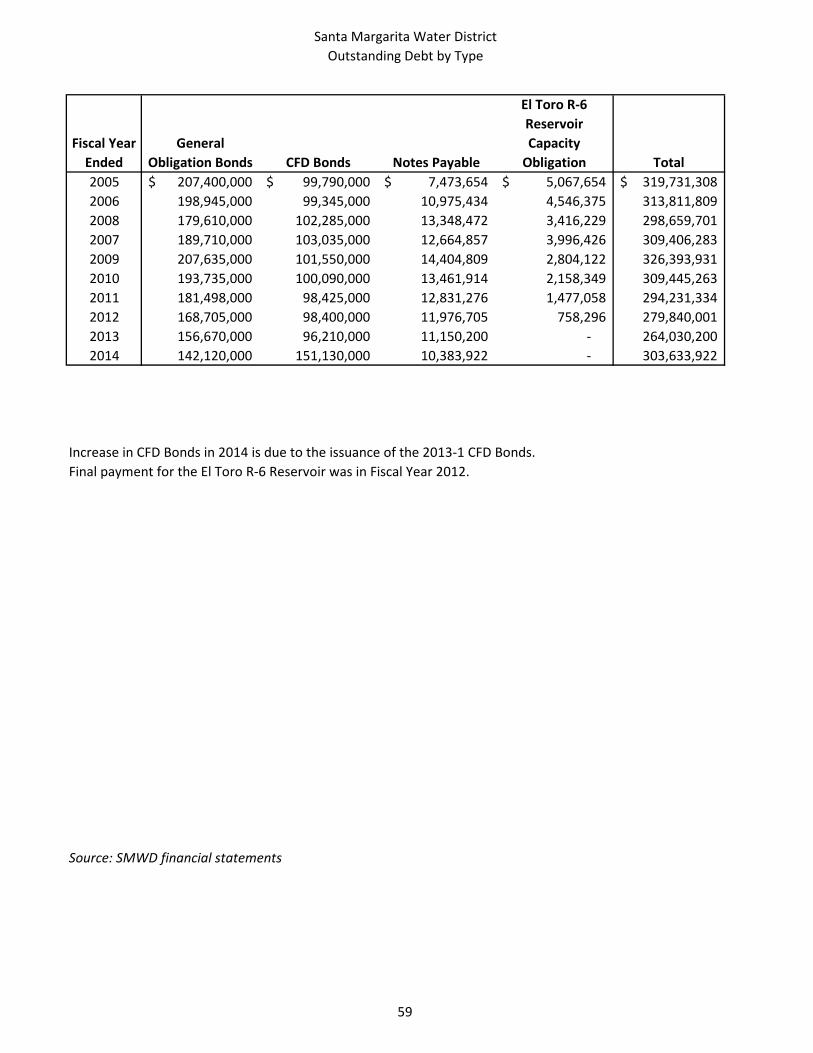
Santa Margarita Water DistrictOutstanding Debt by Type
59
Fiscal Year Ended
General Obligation Bonds CFD Bonds Notes Payable
El Toro R-6 Reservoir Capacity
Obligation Total2005 207,400,000$ 99,790,000$ 7,473,654$ 5,067,654$ 319,731,308$ 2006 198,945,000 99,345,000 10,975,434 4,546,375 313,811,809 2008 179,610,000 102,285,000 13,348,472 3,416,229 298,659,701 2007 189,710,000 103,035,000 12,664,857 3,996,426 309,406,283 2009 207,635,000 101,550,000 14,404,809 2,804,122 326,393,931 2010 193,735,000 100,090,000 13,461,914 2,158,349 309,445,263 2011 181,498,000 98,425,000 12,831,276 1,477,058 294,231,334 2012 168,705,000 98,400,000 11,976,705 758,296 279,840,001 2013 156,670,000 96,210,000 11,150,200 - 264,030,200 2014 142,120,000 151,130,000 10,383,922 - 303,633,922
Increase in CFD Bonds in 2014 is due to the issuance of the 2013-1 CFD Bonds.Final payment for the El Toro R-6 Reservoir was in Fiscal Year 2012.
Source: SMWD financial statements
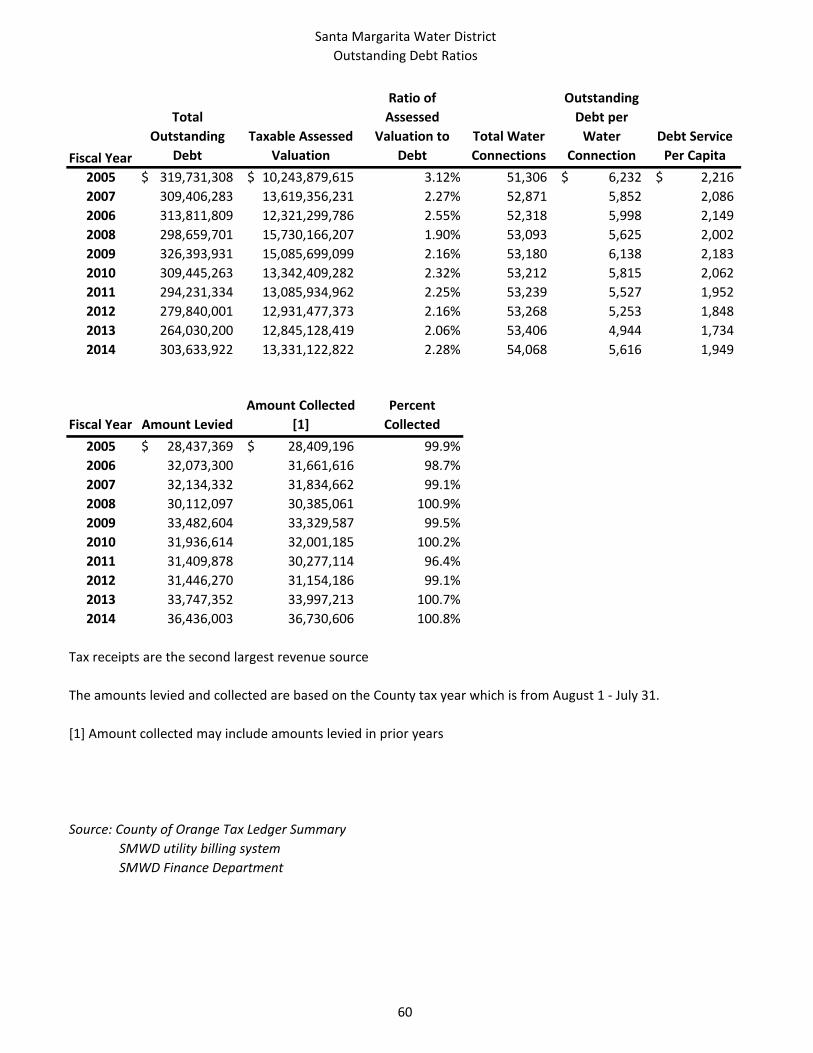
Santa Margarita Water DistrictOutstanding Debt Ratios
60
Total Outstanding
DebtTaxable Assessed
Valuation
Ratio of Assessed
Valuation to Debt
Total Water Connections
Outstanding Debt per
Water Connection
Debt Service Per Capita
2005 319,731,308$ 10,243,879,615$ 3.12% 51,306 6,232$ 2,216$ 2007 309,406,283 13,619,356,231 2.27% 52,871 5,852 2,086 2006 313,811,809 12,321,299,786 2.55% 52,318 5,998 2,149 2008 298,659,701 15,730,166,207 1.90% 53,093 5,625 2,002 2009 326,393,931 15,085,699,099 2.16% 53,180 6,138 2,183 2010 309,445,263 13,342,409,282 2.32% 53,212 5,815 2,062 2011 294,231,334 13,085,934,962 2.25% 53,239 5,527 1,952 2012 279,840,001 12,931,477,373 2.16% 53,268 5,253 1,848 2013 264,030,200 12,845,128,419 2.06% 53,406 4,944 1,734 2014 303,633,922 13,331,122,822 2.28% 54,068 5,616 1,949
Fiscal Year Amount LeviedAmount Collected
[1]Percent
Collected2005 28,437,369$ 28,409,196$ 99.9%2006 32,073,300 31,661,616 98.7%2007 32,134,332 31,834,662 99.1%2008 30,112,097 30,385,061 100.9%2009 33,482,604 33,329,587 99.5%2010 31,936,614 32,001,185 100.2%2011 31,409,878 30,277,114 96.4%2012 31,446,270 31,154,186 99.1%2013 33,747,352 33,997,213 100.7%2014 36,436,003 36,730,606 100.8%
Tax receipts are the second largest revenue source
The amounts levied and collected are based on the County tax year which is from August 1 - July 31.
[1] Amount collected may include amounts levied in prior years
Source: County of Orange Tax Ledger SummarySMWD utility billing systemSMWD Finance Department
Fiscal Year
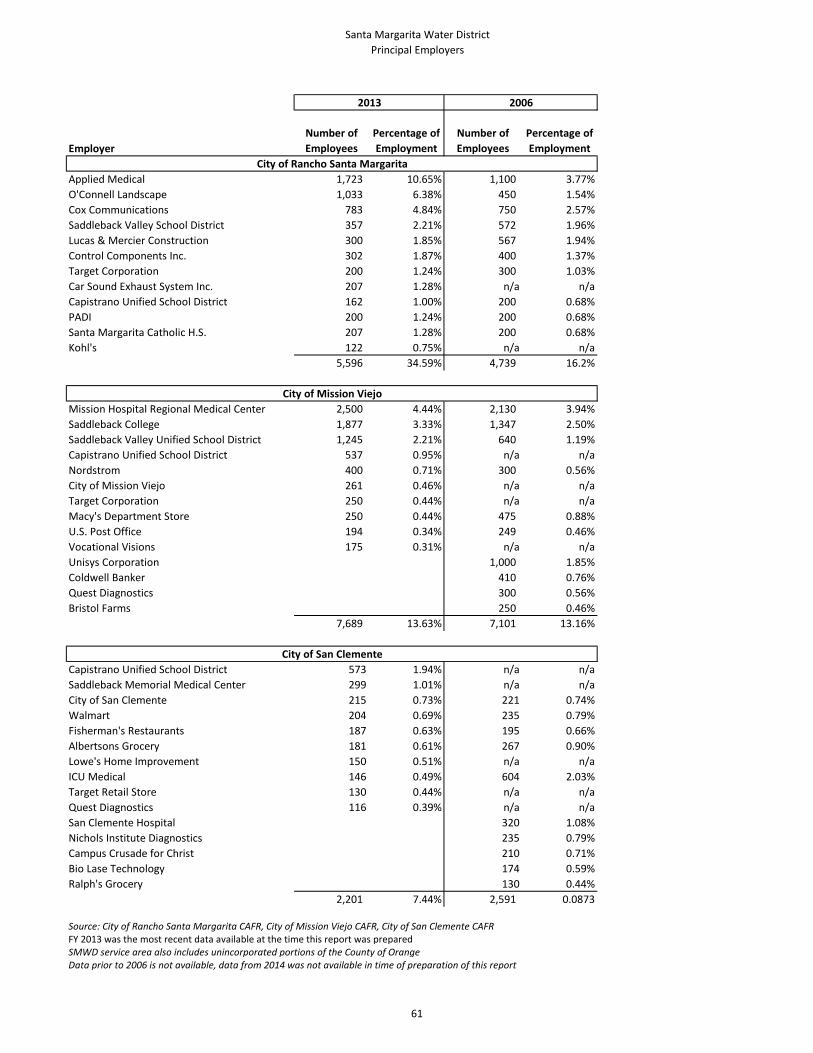
Santa Margarita Water DistrictPrincipal Employers
61
EmployerNumber of Employees
Percentage of Employment
Number of Employees
Percentage of Employment
Applied Medical 1,723 10.65% 1,100 3.77%O'Connell Landscape 1,033 6.38% 450 1.54%Cox Communications 783 4.84% 750 2.57%Saddleback Valley School District 357 2.21% 572 1.96%Lucas & Mercier Construction 300 1.85% 567 1.94%Control Components Inc. 302 1.87% 400 1.37%Target Corporation 200 1.24% 300 1.03%Car Sound Exhaust System Inc. 207 1.28% n/a n/aCapistrano Unified School District 162 1.00% 200 0.68%PADI 200 1.24% 200 0.68%Santa Margarita Catholic H.S. 207 1.28% 200 0.68%Kohl's 122 0.75% n/a n/a
5,596 34.59% 4,739 16.2%
Mission Hospital Regional Medical Center 2,500 4.44% 2,130 3.94%Saddleback College 1,877 3.33% 1,347 2.50%Saddleback Valley Unified School District 1,245 2.21% 640 1.19%Capistrano Unified School District 537 0.95% n/a n/aNordstrom 400 0.71% 300 0.56%City of Mission Viejo 261 0.46% n/a n/aTarget Corporation 250 0.44% n/a n/aMacy's Department Store 250 0.44% 475 0.88%U.S. Post Office 194 0.34% 249 0.46%Vocational Visions 175 0.31% n/a n/aUnisys Corporation 1,000 1.85%Coldwell Banker 410 0.76%Quest Diagnostics 300 0.56%Bristol Farms 250 0.46%
7,689 13.63% 7,101 13.16%
Capistrano Unified School District 573 1.94% n/a n/aSaddleback Memorial Medical Center 299 1.01% n/a n/aCity of San Clemente 215 0.73% 221 0.74%Walmart 204 0.69% 235 0.79%Fisherman's Restaurants 187 0.63% 195 0.66%Albertsons Grocery 181 0.61% 267 0.90%Lowe's Home Improvement 150 0.51% n/a n/aICU Medical 146 0.49% 604 2.03%Target Retail Store 130 0.44% n/a n/aQuest Diagnostics 116 0.39% n/a n/aSan Clemente Hospital 320 1.08%Nichols Institute Diagnostics 235 0.79%Campus Crusade for Christ 210 0.71%Bio Lase Technology 174 0.59%Ralph's Grocery 130 0.44%
2,201 7.44% 2,591 0.0873
Source: City of Rancho Santa Margarita CAFR, City of Mission Viejo CAFR, City of San Clemente CAFR FY 2013 was the most recent data available at the time this report was preparedSMWD service area also includes unincorporated portions of the County of OrangeData prior to 2006 is not available, data from 2014 was not available in time of preparation of this report
2013 2006
City of Rancho Santa Margarita
City of Mission Viejo
City of San Clemente

Santa Margarita Water DistrictDemographic and Economic Information
62
Fiscal Year
Ended
SMWD Population
[1] PopulationMedian
Age PopulationMedian
Age PopulationMedian
Age
Personal Income(thousands of
dollars) [2]
Per Capita Personal
Income [2]Unemployment
Rate2004 138,367 48,809 * 97,845 39.7 62,988 38.0 130,200,000$ 52,871$ 4.5%2005 144,301 49,006 * 97,848 38.0 65,031 38.0 139,300,000 54,127 3.9%2007 148,317 49,306 31.9 98,030 38.4 66,833 38.0 153,300,000 55,172 4.0%2006 146,047 48,969 31.9 98,165 38.1 66,077 38.0 150,500,000 56,114 3.6%2008 149,214 49,501 31.9 99,781 39.6 67,549 38.0 155,000,000 53,552 5.2%2009 149,533 49,643 31.9 100,122 38.8 68,234 40.0 148,300,000 51,374 9.3%2010 150,043 49,945 32.7 93,297 39.0 68,763 39.0 153,300,000 52,124 9.5%2011 150,762 48,278 33.5 93,483 39.0 63,743 39.0 163,300,000 53,733 9.1%2012 151,411 48,079 34.1 94,196 35.2 64,208 39.0 166,900,000 54,319 8.0%2013 152,245 48,550 36.0 94,824 41.6 64,542 40.0 168,966,400 54,827 6.7%2014 155,798 # # # # # # # # 5.2%
SMWD service area also includes unincorporated portions of the County of Orange
* Data is not available# Data was not available at the time the report was prepared[1] Data for FY2014 is an estimate[2] Personal income information is not available by city
Sources:Bureau of Labor StatisticsCity of Rancho Santa Margarita CAFRCity of Mission Viejo CAFRCity of San Clemente CAFRMWDOC Water Rate & Financial Information Reports
City of Rancho Santa Margarita City of Mission Viejo County of OrangeCity of San Clemente
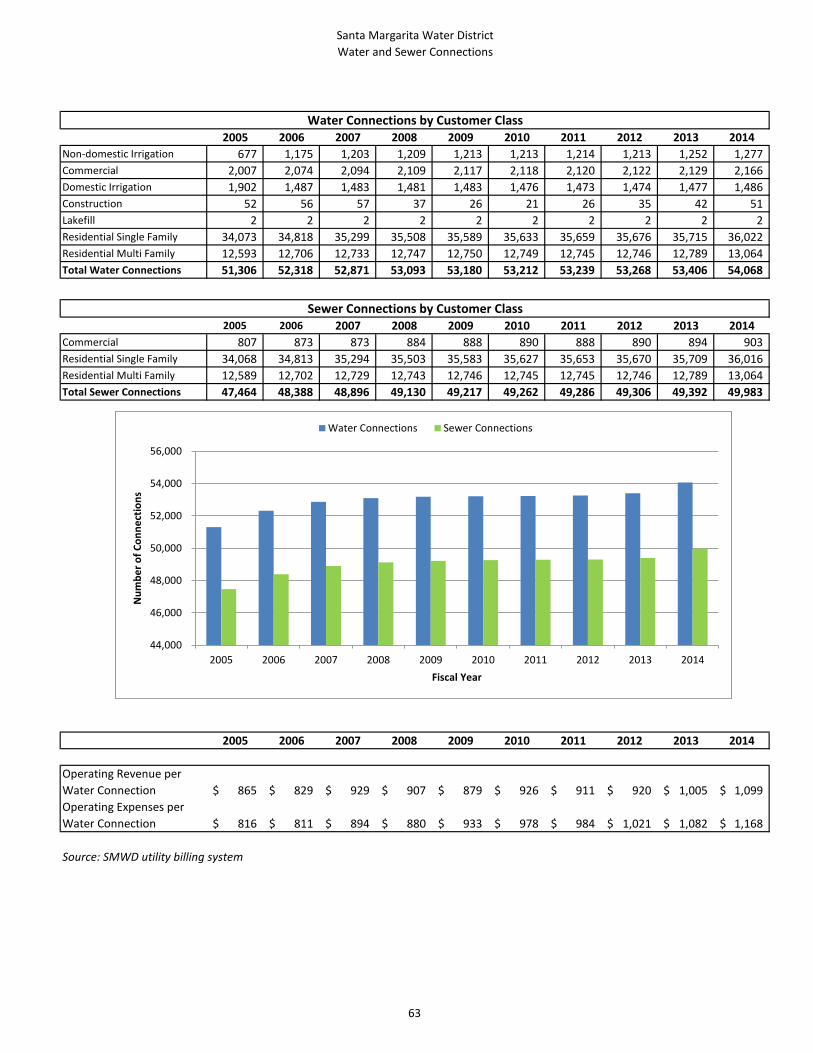
Santa Margarita Water DistrictWater and Sewer Connections
63
2005 2006 2007 2008 2009 2010 2011 2012 2013 2014Non-domestic Irrigation 677 1,175 1,203 1,209 1,213 1,213 1,214 1,213 1,252 1,277 Commercial 2,007 2,074 2,094 2,109 2,117 2,118 2,120 2,122 2,129 2,166 Domestic Irrigation 1,902 1,487 1,483 1,481 1,483 1,476 1,473 1,474 1,477 1,486 Construction 52 56 57 37 26 21 26 35 42 51 Lakefill 2 2 2 2 2 2 2 2 2 2 Residential Single Family 34,073 34,818 35,299 35,508 35,589 35,633 35,659 35,676 35,715 36,022 Residential Multi Family 12,593 12,706 12,733 12,747 12,750 12,749 12,745 12,746 12,789 13,064 Total Water Connections 51,306 52,318 52,871 53,093 53,180 53,212 53,239 53,268 53,406 54,068
2005 2006 2007 2008 2009 2010 2011 2012 2013 2014Commercial 807 873 873 884 888 890 888 890 894 903 Residential Single Family 34,068 34,813 35,294 35,503 35,583 35,627 35,653 35,670 35,709 36,016 Residential Multi Family 12,589 12,702 12,729 12,743 12,746 12,745 12,745 12,746 12,789 13,064 Total Sewer Connections 47,464 48,388 48,896 49,130 49,217 49,262 49,286 49,306 49,392 49,983
2005 2006 2007 2008 2009 2010 2011 2012 2013 2014
Operating Revenue per Water Connection 865$ 829$ 929$ 907$ 879$ 926$ 911$ 920$ 1,005$ 1,099$ Operating Expenses per Water Connection 816$ 811$ 894$ 880$ 933$ 978$ 984$ 1,021$ 1,082$ 1,168$
Source: SMWD utility billing system
Water Connections by Customer Class
Sewer Connections by Customer Class
44,000
46,000
48,000
50,000
52,000
54,000
56,000
2005 2006 2007 2008 2009 2010 2011 2012 2013 2014
Num
ber o
f Con
nect
ions
Fiscal Year
Water Connections Sewer Connections
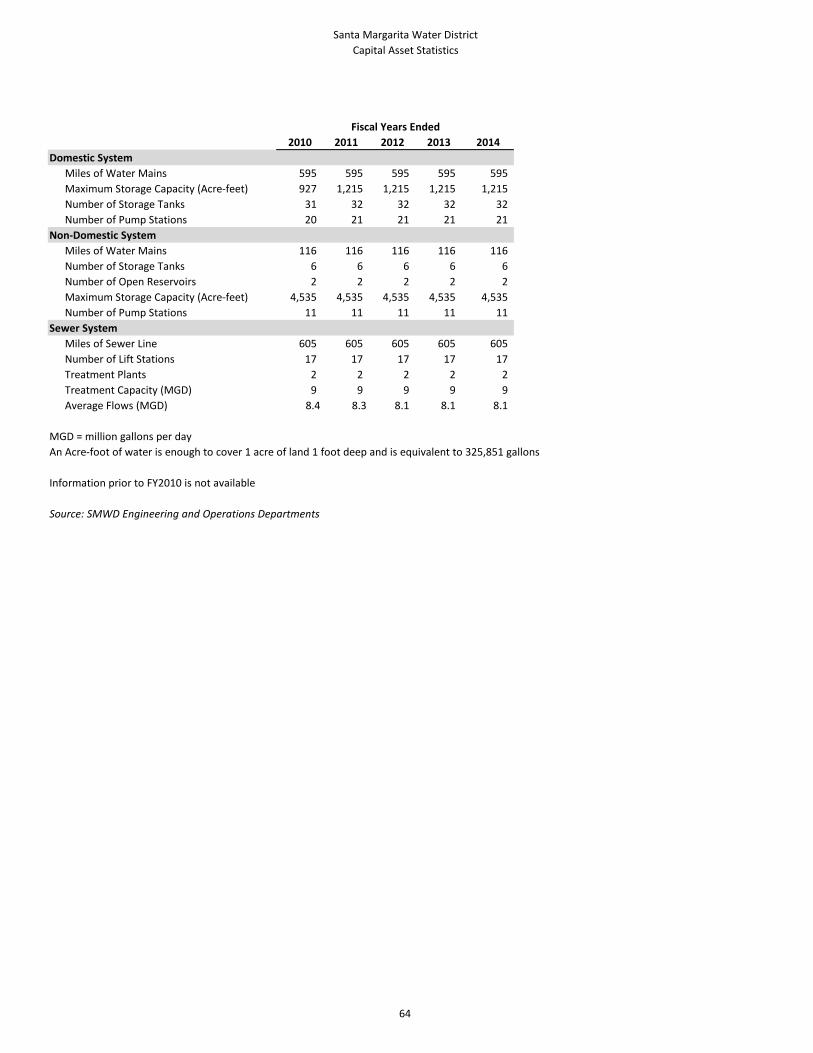
Santa Margarita Water DistrictCapital Asset Statistics
64
2010 2011 2012 2013 2014Domestic System
Miles of Water Mains 595 595 595 595 595 Maximum Storage Capacity (Acre-feet) 927 1,215 1,215 1,215 1,215 Number of Storage Tanks 31 32 32 32 32 Number of Pump Stations 20 21 21 21 21
Non-Domestic SystemMiles of Water Mains 116 116 116 116 116 Number of Storage Tanks 6 6 6 6 6 Number of Open Reservoirs 2 2 2 2 2 Maximum Storage Capacity (Acre-feet) 4,535 4,535 4,535 4,535 4,535 Number of Pump Stations 11 11 11 11 11
Sewer SystemMiles of Sewer Line 605 605 605 605 605 Number of Lift Stations 17 17 17 17 17 Treatment Plants 2 2 2 2 2 Treatment Capacity (MGD) 9 9 9 9 9 Average Flows (MGD) 8.4 8.3 8.1 8.1 8.1
MGD = million gallons per dayAn Acre-foot of water is enough to cover 1 acre of land 1 foot deep and is equivalent to 325,851 gallons
Information prior to FY2010 is not available
Source: SMWD Engineering and Operations Departments
Fiscal Years Ended
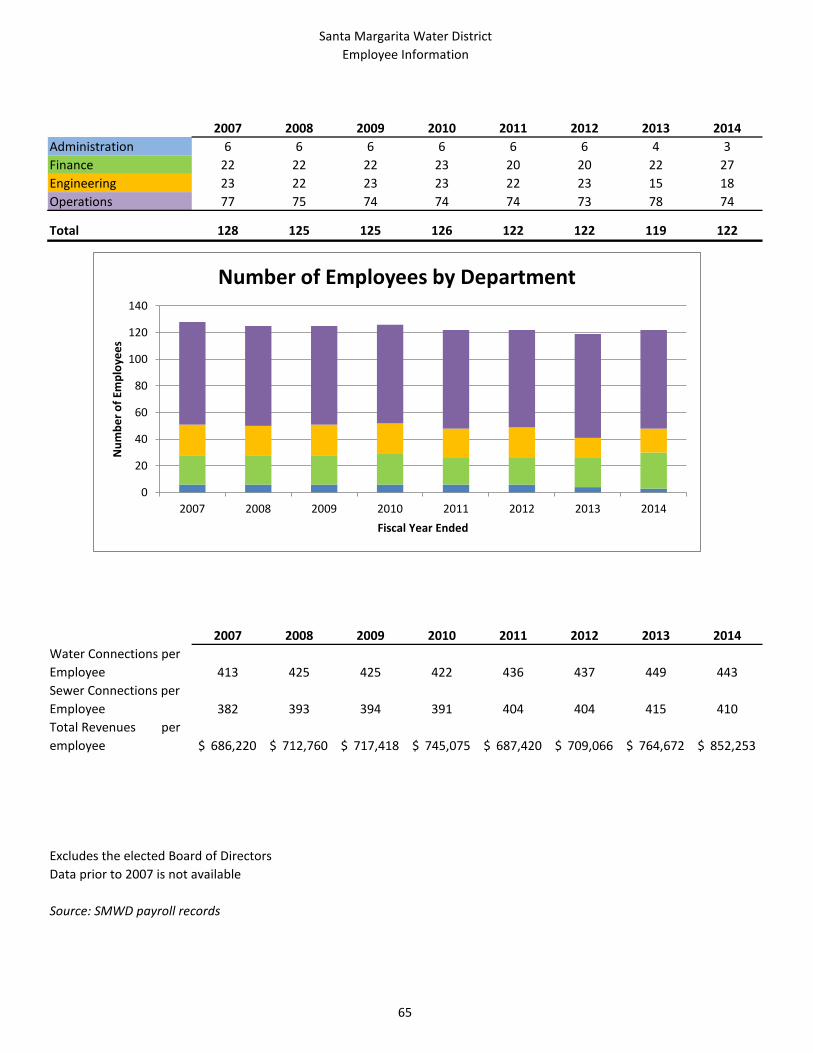
Santa Margarita Water DistrictEmployee Information
65
2007 2008 2009 2010 2011 2012 2013 2014Administration 6 6 6 6 6 6 4 3Finance 22 22 22 23 20 20 22 27Engineering 23 22 23 23 22 23 15 18Operations 77 75 74 74 74 73 78 74
Total 128 125 125 126 122 122 119 122
2007 2008 2009 2010 2011 2012 2013 2014Water Connections per Employee 413 425 425 422 436 437 449 443Sewer Connections per Employee 382 393 394 391 404 404 415 410Total Revenues per employee 686,220$ 712,760$ 717,418$ 745,075$ 687,420$ 709,066$ 764,672$ 852,253$
Excludes the elected Board of DirectorsData prior to 2007 is not available
Source: SMWD payroll records
0
20
40
60
80
100
120
140
2007 2008 2009 2010 2011 2012 2013 2014
Num
ber o
f Em
ploy
ees
Fiscal Year Ended
Number of Employees by Department
Board of Directors
Saundra F. Jacobs President
Betty Olson, Ph.d
Vice President
Charley Wilson Treasurer
Charles T. Gibson
Director
Justin McCusker Director
General Manager
Daniel R. Ferons
26111 Antonio Parkway Rancho Santa Margarita, California 92688
949.459.6420 www.smwd.com