Embed Size (px)
Citation preview
1
2
3
4
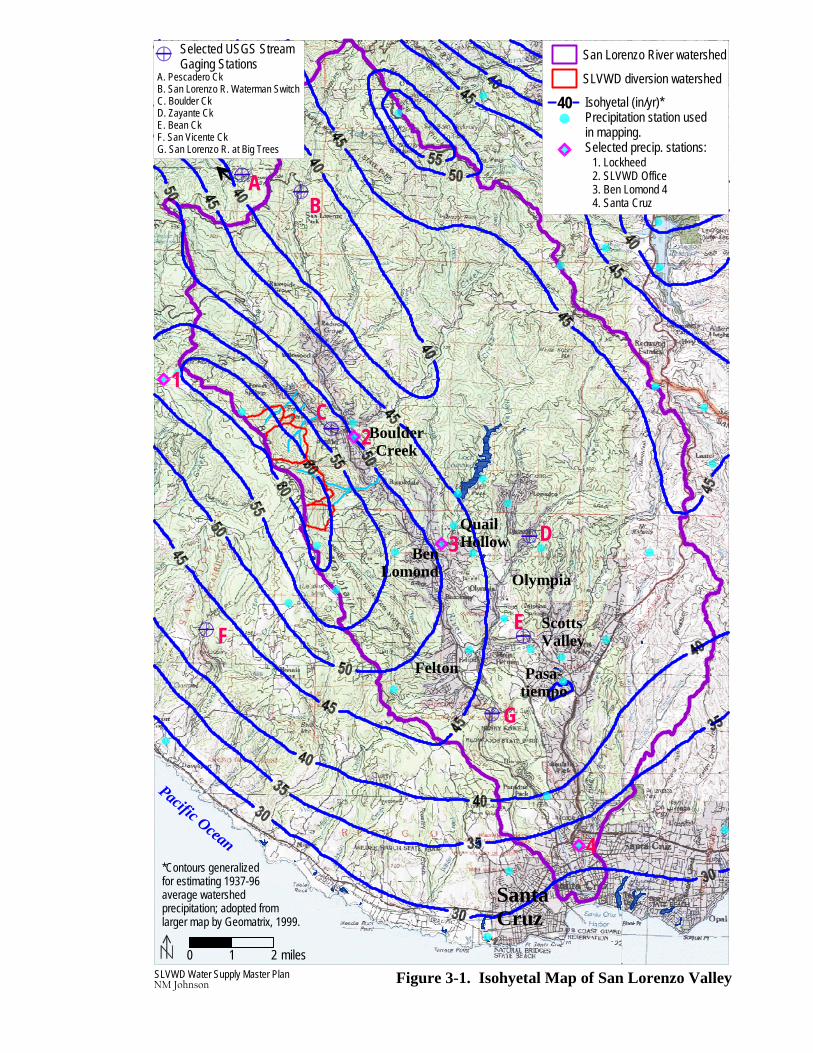
Figure 3-1. Isohyetal Map of San Lorenzo Valley
Pacific Ocean
0 1 2 miles
BenLomond
BoulderCreek
QuailHollow
Olympia
Felton
SantaCruz
Pasa-tiempo
ScottsValley
*Contours generalized for estimating 1937-96 average watershed precipitation; adopted from larger map by Geomatrix, 1999.
San Lorenzo River watershed
SLVWD diversion watershed
NM JohnsonSLVWD Water Supply Master Plan
40 Isohyetal (in/yr)*Precipitation station used in mapping.Selected precip. stations:
1. Lockheed2. SLVWD Office3. Ben Lomond 44. Santa Cruz
A. Pescadero CkB. San Lorenzo R. Waterman SwitchC. Boulder CkD. Zayante CkE. Bean CkF. San Vicente CkG. San Lorenzo R. at Big Trees
AB
D
C
G
F
Selected USGS Stream Gaging Stations
E
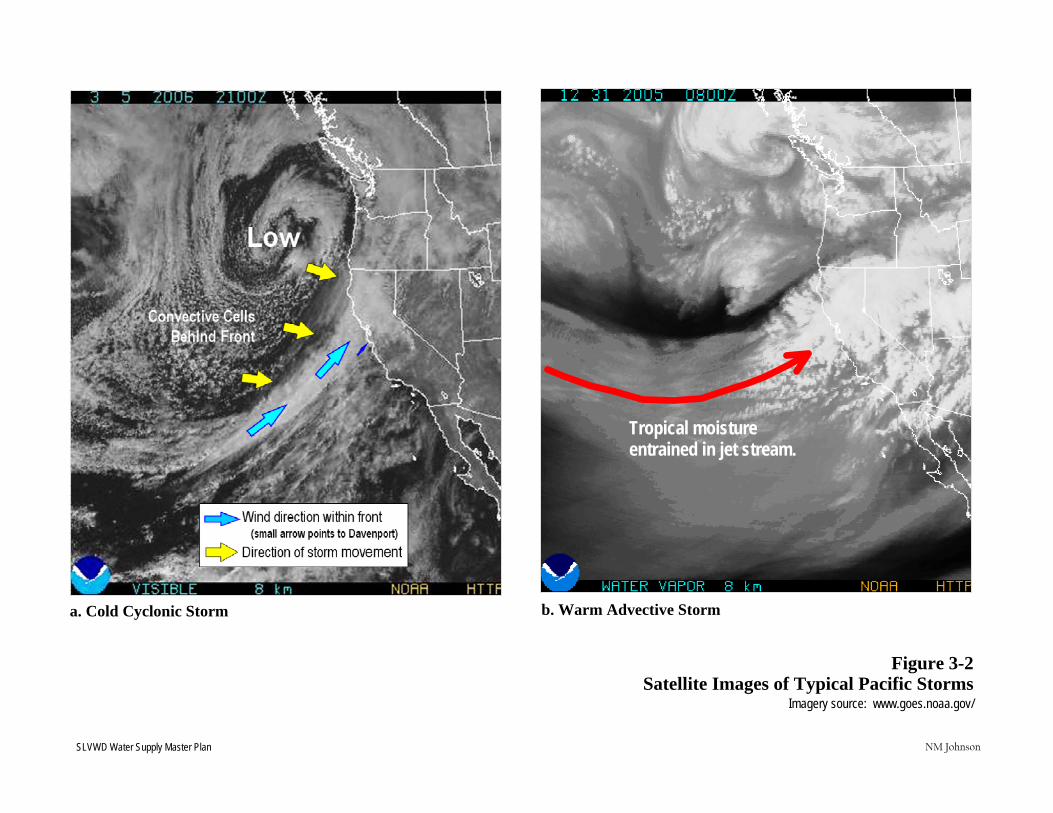
Figure 3-2Satellite Images of Typical Pacific Storms
Imagery source: www.goes.noaa.gov/
Tropical moisture entrained in jet stream.
SLVWD Water Supply Master Plan NM Johnson
a. Cold Cyclonic Storm b. Warm Advective Storm
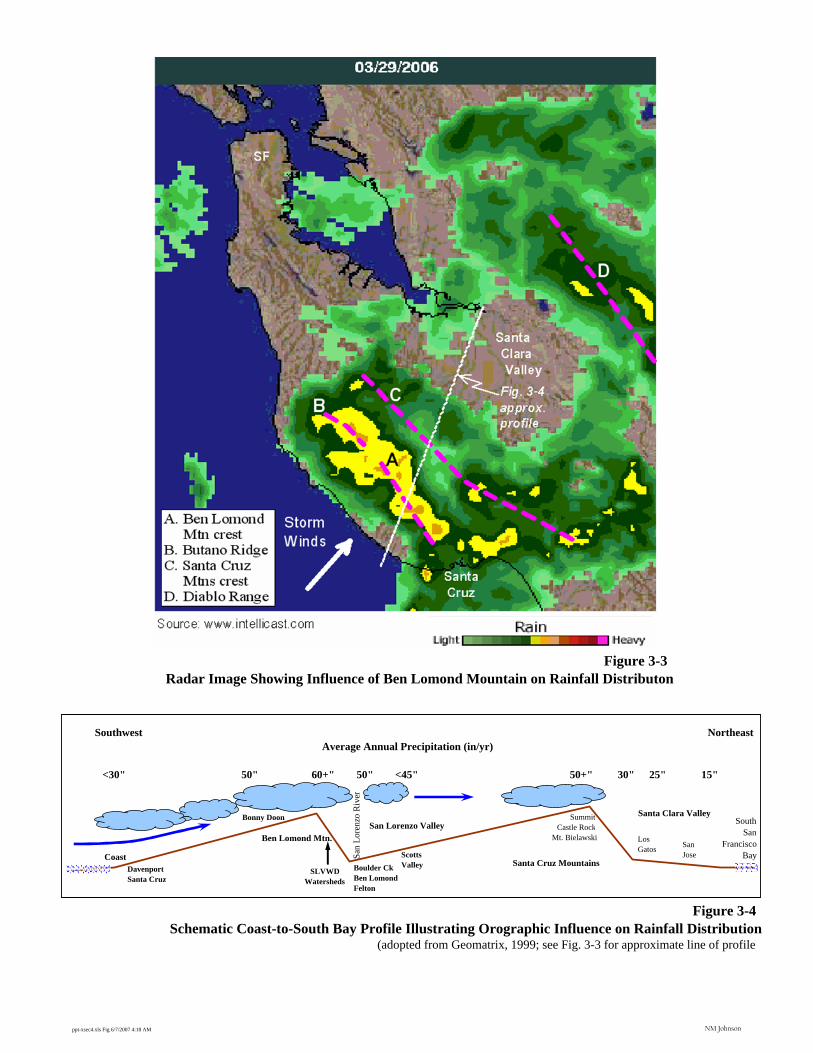
Southwest Northeast
<30" 50" 60+" 50" <45" 50+" 30" 25" 15"
Santa Clara Valley
Santa Cruz Mountains
Average Annual Precipitation (in/yr)
Ben Lomond Mtn.San Lorenzo Valley
Coast San
Lore
nzo
Riv
er
SouthSan
FranciscoBay
Bonny Doon SummitCastle Rock
Mt. Bielawski
SLVWD Watersheds
Boulder CkBen LomondFelton
DavenportSanta Cruz
ScottsValley
Los Gatos
Figure 3-4Schematic Coast-to-South Bay Profile Illustrating Orographic Influence on Rainfall Distribution
(adopted from Geomatrix, 1999; see Fig. 3-3 for approximate line of profile)
San Jose
Santa Clara Valley
Figure 3-3Radar Image Showing Influence of Ben Lomond Mountain on Rainfall Distributon
ppt-xsec4.xls Fig 6/7/2007 4:18 AM NM Johnson
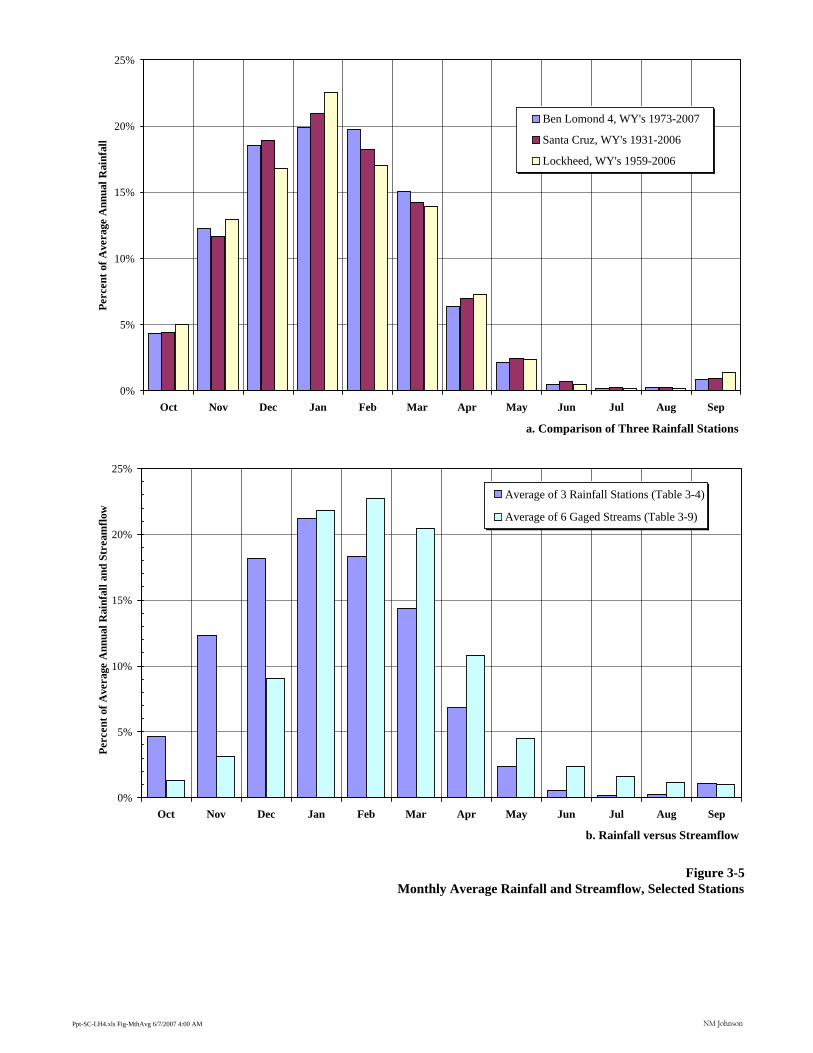
Figure 3-5Monthly Average Rainfall and Streamflow, Selected Stations
a. Comparison of Three Rainfall Stations
0%
5%
10%
15%
20%
25%
Oct Nov Dec Jan Feb Mar Apr May Jun Jul Aug Sep
Perc
ent o
f Ave
rage
Ann
ual R
ainf
all
Ben Lomond 4, WY's 1973-2007
Santa Cruz, WY's 1931-2006
Lockheed, WY's 1959-2006
b. Rainfall versus Streamflow
0%
5%
10%
15%
20%
25%
Oct Nov Dec Jan Feb Mar Apr May Jun Jul Aug Sep
Perc
ent o
f Ave
rage
Ann
ual R
ainf
all a
nd S
trea
mflo
w
Average of 3 Rainfall Stations (Table 3-4)
Average of 6 Gaged Streams (Table 3-9)
Ppt-SC-LH4.xls Fig-MthAvg 6/7/2007 4:00 AM NM Johnson
BL4-Daily-Hist2.xls Fig 6/7/2007 4:19 AM NM Johnson
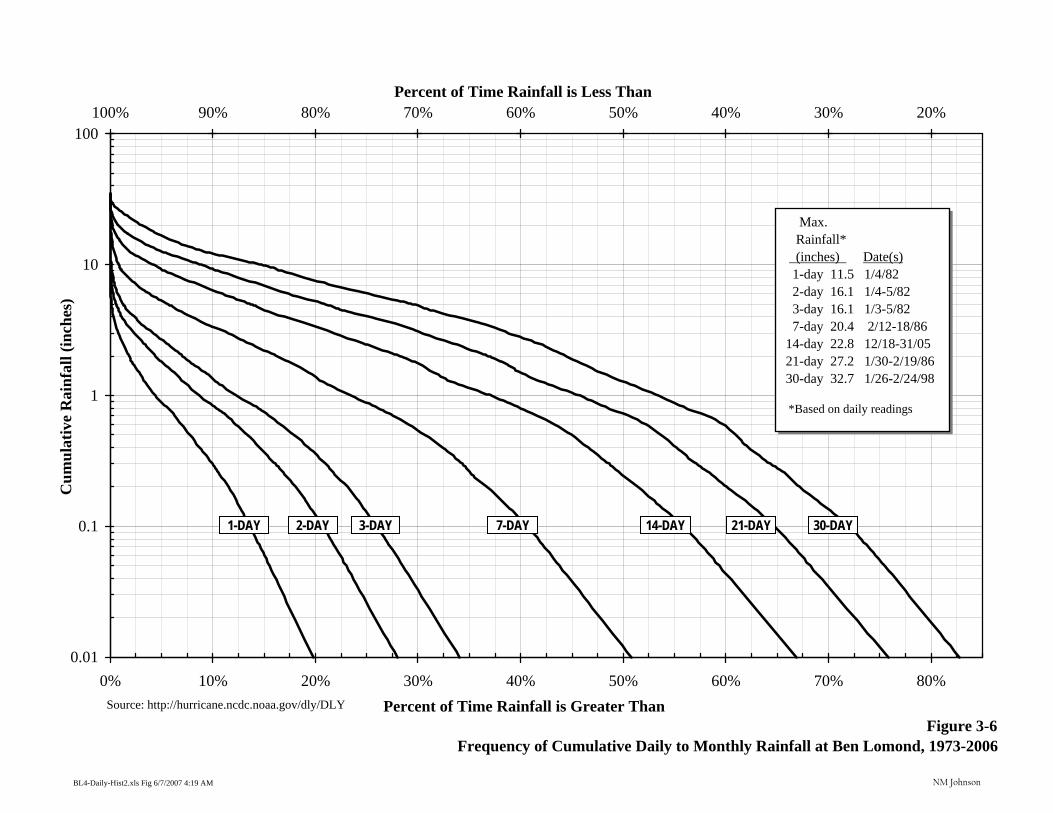
Figure 3-6Frequency of Cumulative Daily to Monthly Rainfall at Ben Lomond, 1973-2006
50% 20%30%40%60%70%80%90%100%
0.01
0.1
1
10
100
0% 10% 20% 30% 40% 50% 60% 70% 80%Percent of Time Rainfall is Greater Than
Cum
ulat
ive
Rai
nfal
l (in
ches
)Percent of Time Rainfall is Less Than
1-DAY 14-DAY7-DAY3-DAY2-DAY 30-DAY21-DAY
Max. Rainfall* (inches) Date(s) 1-day 11.5 1/4/82 2-day 16.1 1/4-5/82 3-day 16.1 1/3-5/82 7-day 20.4 2/12-18/8614-day 22.8 12/18-31/0521-day 27.2 1/30-2/19/8630-day 32.7 1/26-2/24/98
*Based on daily readings
Source: http://hurricane.ncdc.noaa.gov/dly/DLY
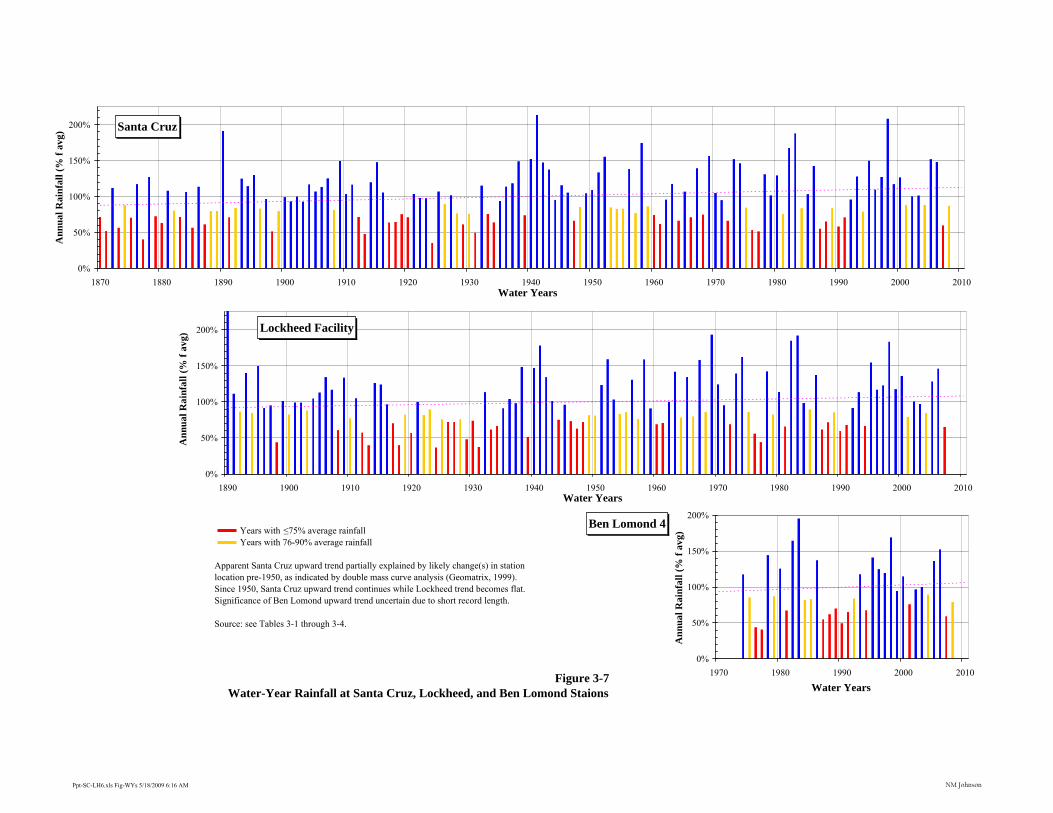
Santa Cruz
0%
50%
100%
150%
200%
1870 1880 1890 1900 1910 1920 1930 1940 1950 1960 1970 1980 1990 2000 2010Water Years
Ann
ual R
ainf
all (
% f
avg)
Lockheed Facility
0%
50%
100%
150%
200%
1890 1900 1910 1920 1930 1940 1950 1960 1970 1980 1990 2000 2010Water Years
Ann
ual R
ainf
all (
% f
avg)
Ben Lomond 4
0%
50%
100%
150%
200%
1970 1980 1990 2000 2010
Water YearsA
nnua
l Rai
nfal
l (%
f av
g)Figure 3-7
Water-Year Rainfall at Santa Cruz, Lockheed, and Ben Lomond Staions
Years with ≤75% average rainfall Years with 76-90% average rainfall
Apparent Santa Cruz upward trend partially explained by likely change(s) in station location pre-1950, as indicated by double mass curve analysis (Geomatrix, 1999). Since 1950, Santa Cruz upward trend continues while Lockheed trend becomes flat. Significance of Ben Lomond upward trend uncertain due to short record length.
Source: see Tables 3-1 through 3-4.
Ppt-SC-LH6.xls Fig-WYs 5/18/2009 6:16 AM NM Johnson
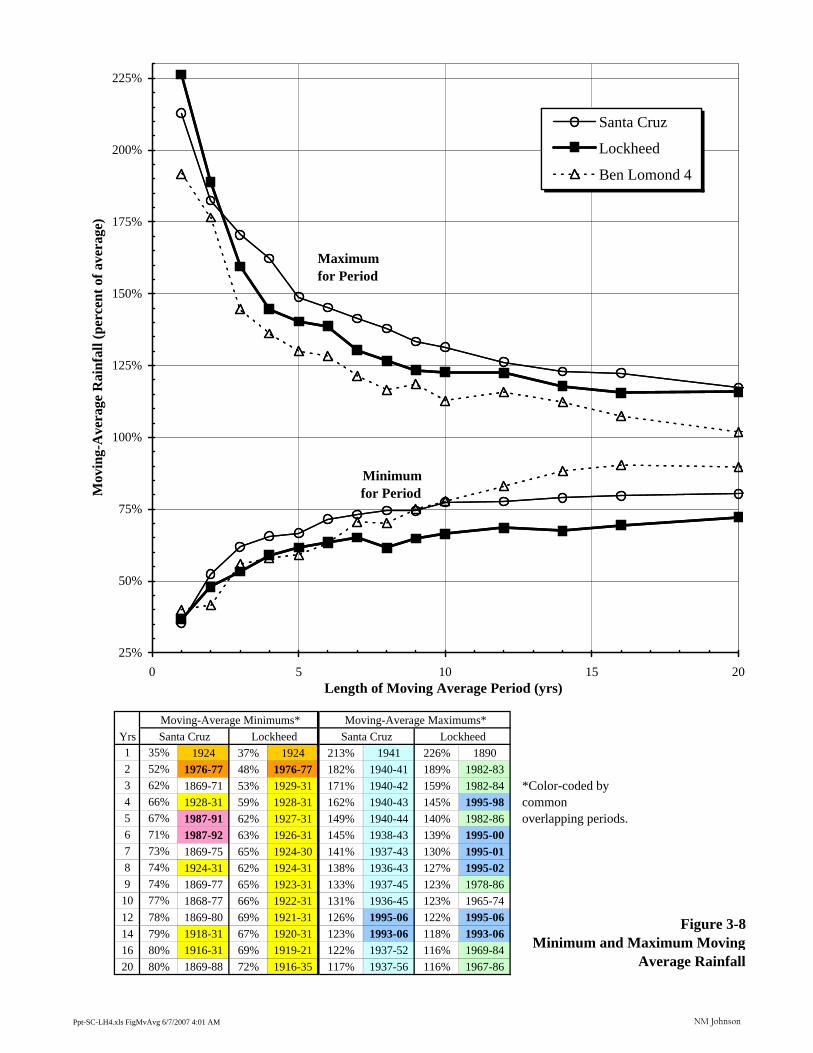
Moving-Average Minimums* Moving-Average Maximums*Yrs Santa Cruz Lockheed Santa Cruz Lockheed1 35% 1924 37% 1924 213% 1941 226% 18902 52% 1976-77 48% 1976-77 182% 1940-41 189% 1982-833 62% 1869-71 53% 1929-31 171% 1940-42 159% 1982-84 *Color-coded by
common overlapping periods.
4 66% 1928-31 59% 1928-31 162% 1940-43 145% 1995-985 67% 1987-91 62% 1927-31 149% 1940-44 140% 1982-866 71% 1987-92 63% 1926-31 145% 1938-43 139% 1995-007 73% 1869-75 65% 1924-30 141% 1937-43 130% 1995-018 74% 1924-31 62% 1924-31 138% 1936-43 127% 1995-029 74% 1869-77 65% 1923-31 133% 1937-45 123% 1978-8610 77% 1868-77 66% 1922-31 131% 1936-45 123% 1965-7412 78% 1869-80 69% 1921-31 126% 1995-06 122% 1995-0614 79% 1918-31 67% 1920-31 123% 1993-06 118% 1993-0616 80% 1916-31 69% 1919-21 122% 1937-52 116% 1969-8420 80% 1869-88 72% 1916-35 117% 1937-56 116% 1967-86
25%
50%
75%
100%
125%
150%
175%
200%
225%
0 5 10 15 20Length of Moving Average Period (yrs)
Mov
ing-
Ave
rage
Rai
nfal
l (pe
rcen
t of a
vera
ge)
Santa Cruz
Lockheed
Ben Lomond 4
Minimumfor Period
Maximum for Period
Figure 3-8Minimum and Maximum Moving-
Average Rainfall
Ppt-SC-LH4.xls FigMvAvg 6/7/2007 4:01 AM NM Johnson
Ppt-SC-LH6.xls FigCumDepAvg 5/18/2009 6:17 AM NM Johnson
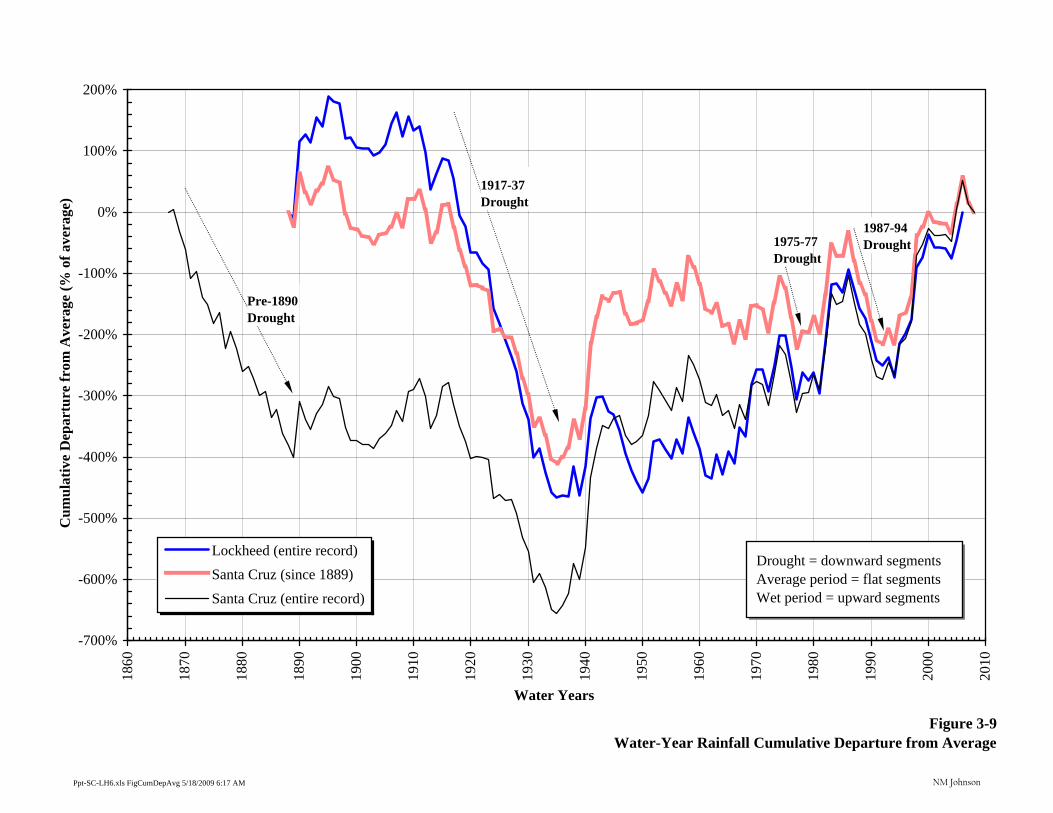
Figure 3-9Water-Year Rainfall Cumulative Departure from Average
-700%
-600%
-500%
-400%
-300%
-200%
-100%
0%
100%
200%
1860
1870
1880
1890
1900
1910
1920
1930
1940
1950
1960
1970
1980
1990
2000
2010
Water Years
Cum
ulat
ive
Dep
artu
re fr
om A
vera
ge (%
of a
vera
ge)
Lockheed (entire record)Santa Cruz (since 1889)
Santa Cruz (entire record)
Drought = downward segmentsAverage period = flat segmentsWet period = upward segments
1917-37 Drought
Pre-1890 Drought
1987-94 Drought1975-77
Drought
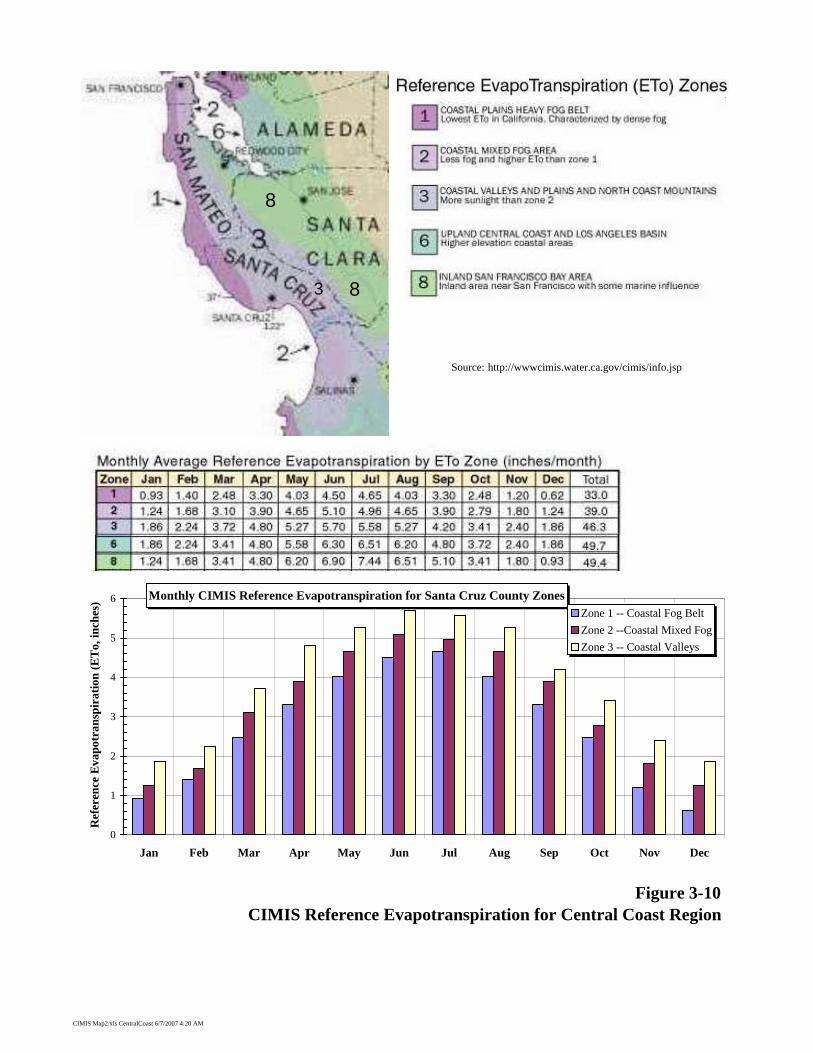
Source: http://wwwcimis.water.ca.gov/cimis/info.jsp
Figure 3-10CIMIS Reference Evapotranspiration for Central Coast Region
8
3 8
Monthly CIMIS Reference Evapotranspiration for Santa Cruz County Zones
0
1
2
3
4
5
6
Jan Feb Mar Apr May Jun Jul Aug Sep Oct Nov Dec
Ref
eren
ce E
vapo
tran
spir
atio
n (E
To,
inch
es)
Zone 1 -- Coastal Fog BeltZone 2 --Coastal Mixed FogZone 3 -- Coastal Valleys
CIMIS Map2.xls CentralCoast 6/7/2007 4:20 AM
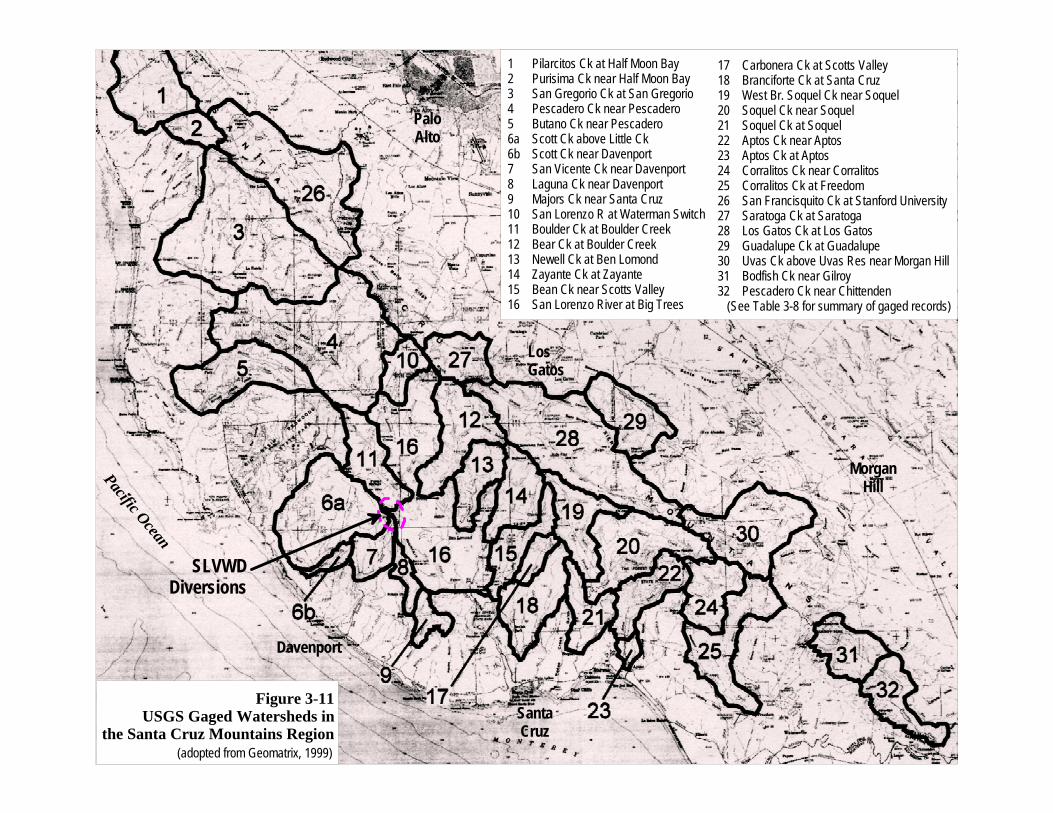
1 Pilarcitos Ck at Half Moon Bay 2 Purisima Ck near Half Moon Bay 3 San Gregorio Ck at San Gregorio4 Pescadero Ck near Pescadero5 Butano Ck near Pescadero6a Scott Ck above Little Ck6b Scott Ck near Davenport7 San Vicente Ck near Davenport8 Laguna Ck near Davenport9 Majors Ck near Santa Cruz10 San Lorenzo R at Waterman Switch11 Boulder Ck at Boulder Creek12 Bear Ck at Boulder Creek13 Newell Ck at Ben Lomond14 Zayante Ck at Zayante15 Bean Ck near Scotts Valley16 San Lorenzo River at Big Trees
17 Carbonera Ck at Scotts Valley18 Branciforte Ck at Santa Cruz19 West Br. Soquel Ck near Soquel20 Soquel Ck near Soquel21 Soquel Ck at Soquel22 Aptos Ck near Aptos23 Aptos Ck at Aptos24 Corralitos Ck near Corralitos25 Corralitos Ck at Freedom26 San Francisquito Ck at Stanford University 27 Saratoga Ck at Saratoga28 Los Gatos Ck at Los Gatos 29 Guadalupe Ck at Guadalupe 30 Uvas Ck above Uvas Res near Morgan Hill31 Bodfish Ck near Gilroy32 Pescadero Ck near Chittenden (See Table 3-8 for summary of gaged records)
Figure 3-11USGS Gaged Watersheds in
the Santa Cruz Mountains Region(adopted from Geomatrix, 1999)
SantaCruz
Davenport
PaloAlto
MorganHill
LosGatos
SLVWDDiversions
Pacific Ocean
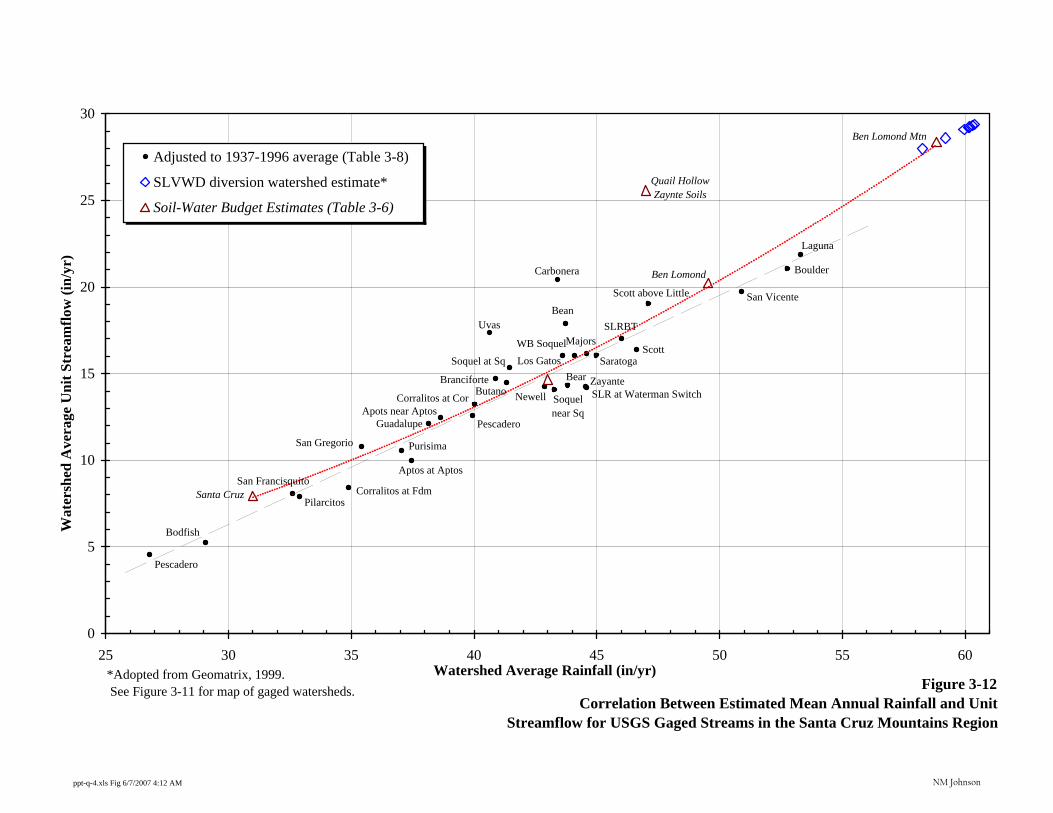
ppt-q-4.xls Fig 6/7/2007 4:12 AM NM Johnson
Figure 3-12Correlation Between Estimated Mean Annual Rainfall and Unit
Streamflow for USGS Gaged Streams in the Santa Cruz Mountains Region
Soquelnear Sq
Soquel at Sq SaratogaScott
SLRBT
Scott above Little San Vicente
Boulder
Laguna
ZayanteNewell
BearSLR at Waterman Switch
MajorsWB Soquel
Branciforte
Corralitos at Cor
Bean
Carbonera
Uvas
Butano
Apots near AptosGuadalupe
Purisima
Aptos at Aptos
Corralitos at Fdm
San Gregorio
San Francisquito
Pilarcitos
Bodfish
Pescadero
Pescadero
Los Gatos
Ben Lomond Mtn
Ben Lomond
Santa Cruz
Quail HollowZaynte Soils
0
5
10
15
20
25
30
25 30 35 40 45 50 55 60Watershed Average Rainfall (in/yr)
Wat
ersh
ed A
vera
ge U
nit S
trea
mflo
w (i
n/yr
)
Adjusted to 1937-1996 average (Table 3-8)
SLVWD diversion watershed estimate*
Soil-Water Budget Estimates (Table 3-6)
*Adopted from Geomatrix, 1999. See Figure 3-11 for map of gaged watersheds.

Figure 3-13Water-Year Streamflow of San Lorenzo River and Pescadero Creek
Source: see Table 3-10.
San Lorenzo River at Big Trees*
0%
50%
100%
150%
200%
250%
300%
1930 1940 1950 1960 1970 1980 1990 2000 2010
Water Years
Ann
ual S
trea
mflo
w (%
f av
g)
*Adjusted (Table 3-9)
Pescadero Creek
0%
50%
100%
150%
200%
250%
300%
350%
400%
1950 1960 1970 1980 1990 2000 2010
Water Years
Ann
ual S
trea
mflo
w (%
f av
g)
Years with ≤50% average streamflowYears with 50-90% average streamflow
Sec3 USGS-Gaged-Records2.xls Fig-WY 5/18/2009 6:34 AM NM Johnson
Pescadero Creek near Pescadero
0
10
20
30
40
50
Boulder Creek at Boulder Creek
0
5
10
15
20
25
San Lorenzo River at Waterman Switch
0
5
10
15
Zayante Creek at Zayante
0
5
10
15
San Lorenzo River at Big Trees
0
50
100
150
Oct
-74
Oct
-75
Oct
-76
Oct
-77
Oct
-78
Oct
-79
Oct
-80
Oct
-81
Oct
-82
Oct
-83
Oct
-84
Oct
-85
Oct
-86
Oct
-87
Oct
-88
Oct
-89
Oct
-90
Oct
-91
Oct
-92
Oct
-93
Oct
-94
Mea
n D
aily
Str
eam
flow
(cfs
)
Bean Creek near Scotts Valley
0
5
10
15
Oct
-88
Oct
-89
Oct
-90
Oct
-91
Oct
-92
Oct
-93
Oct
-94
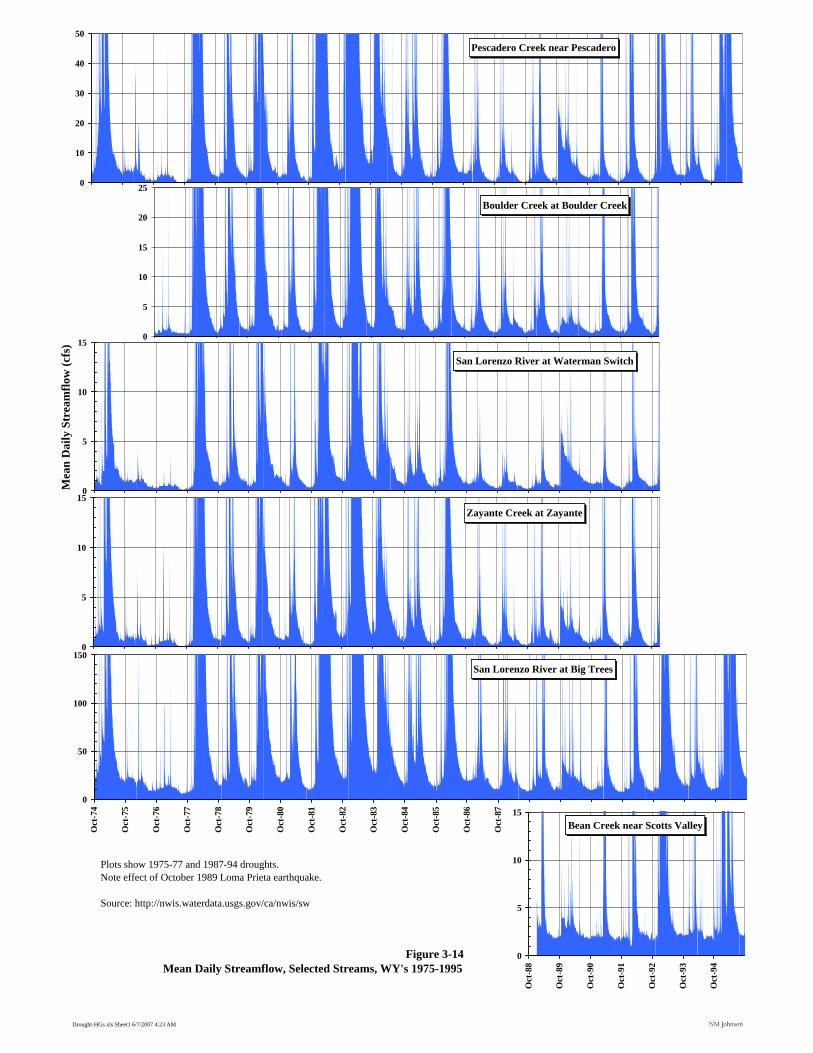
Plots show 1975-77 and 1987-94 droughts. Note effect of October 1989 Loma Prieta earthquake.
Source: http://nwis.waterdata.usgs.gov/ca/nwis/sw
Figure 3-14Mean Daily Streamflow, Selected Streams, WY's 1975-1995
Drought-HGs.xls Sheet1 6/7/2007 4:23 AM NM Johnson
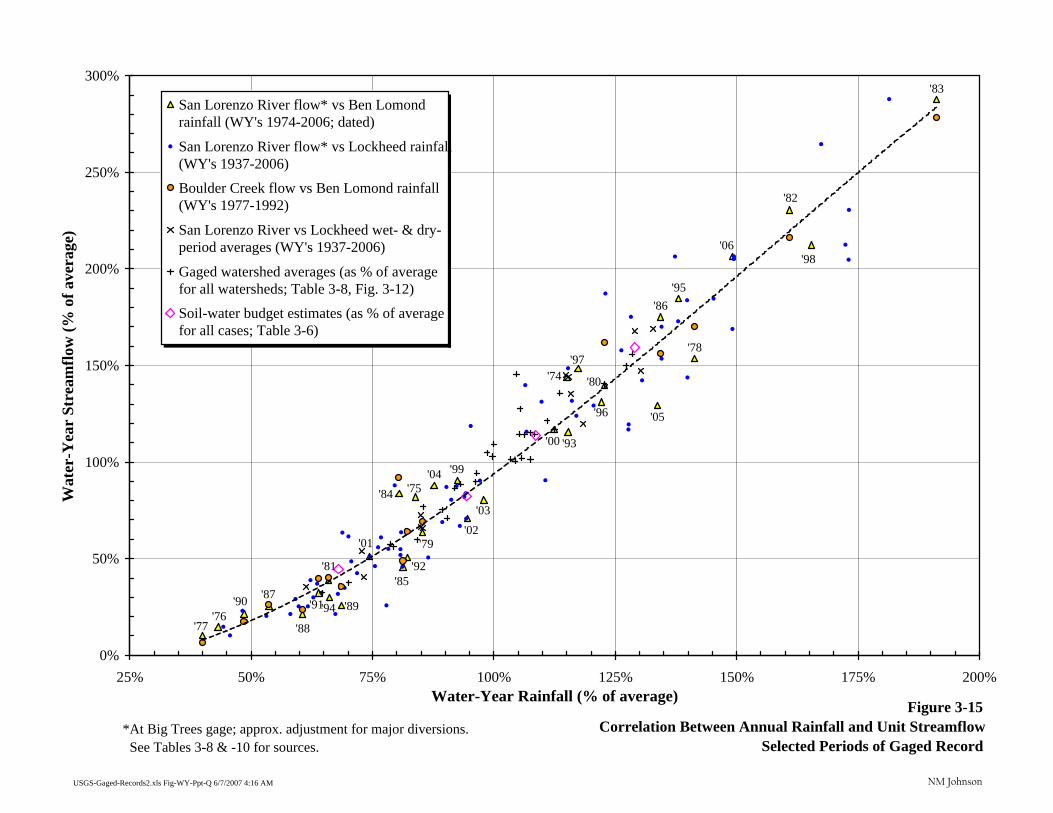
USGS-Gaged-Records2.xls Fig-WY-Ppt-Q 6/7/2007 4:16 AM NM Johnson
Figure 3-15Correlation Between Annual Rainfall and Unit Streamflow
Selected Periods of Gaged Record
'74
'75
'76'77
'78
'79
'80
'81
'82
'83
'84
'85
'86
'87
'88
'89'90 '91
'92
'93
'94
'95
'96
'97
'98
'99
'00
'01'02
'03
'04
'05
'06
0%
50%
100%
150%
200%
250%
300%
25% 50% 75% 100% 125% 150% 175% 200%Water-Year Rainfall (% of average)
Wat
er-Y
ear
Stre
amflo
w (%
of a
vera
ge)
San Lorenzo River flow* vs Ben Lomondrainfall (WY's 1974-2006; dated)
San Lorenzo River flow* vs Lockheed rainfall(WY's 1937-2006)
Boulder Creek flow vs Ben Lomond rainfall(WY's 1977-1992)
San Lorenzo River vs Lockheed wet- & dry-period averages (WY's 1937-2006)
Gaged watershed averages (as % of averagefor all watersheds; Table 3-8, Fig. 3-12)
Soil-water budget estimates (as % of averagefor all cases; Table 3-6)
*At Big Trees gage; approx. adjustment for major diversions. See Tables 3-8 & -10 for sources.
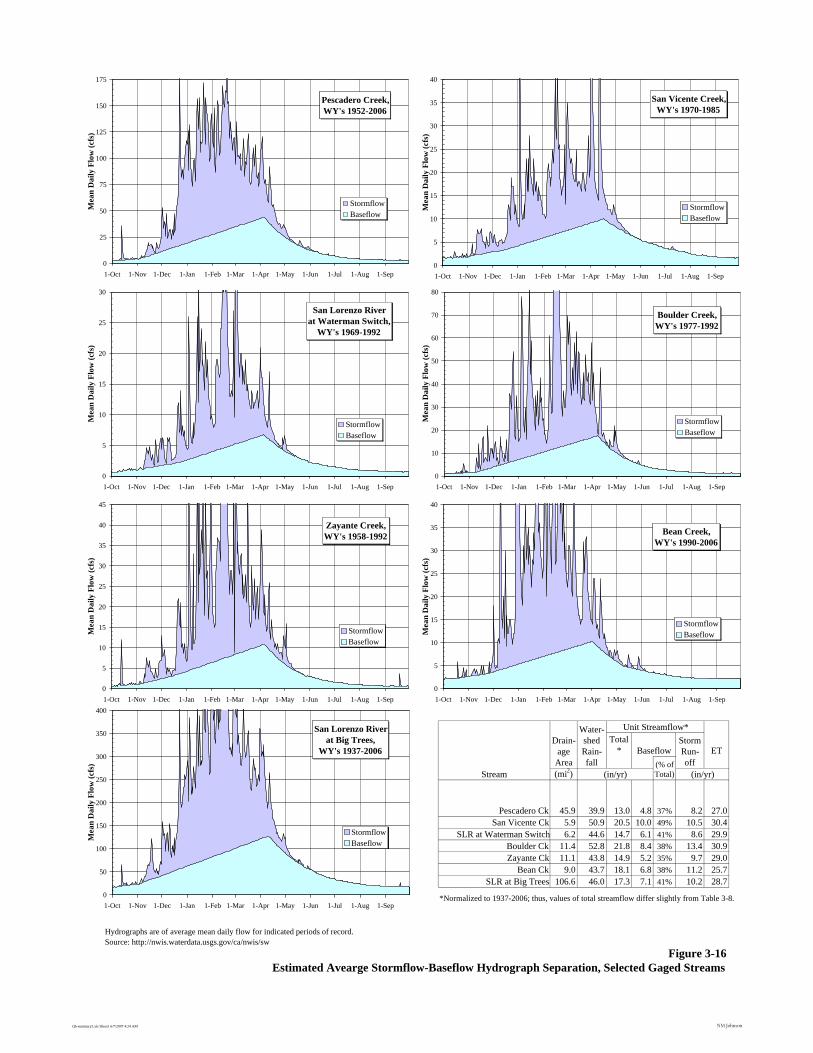
Drain-age
Area
Water-shed Rain-fall
Unit Streamflow*
ETTotal
* BaseflowStorm Run-off(% of
Total)Stream (mi2) (in/yr) (in/yr)
Pescadero Ck 45.9 39.9 13.0 4.8 37% 8.2 27.0San Vicente Ck 5.9 50.9 20.5 10.0 49% 10.5 30.4
SLR at Waterman Switch 6.2 44.6 14.7 6.1 41% 8.6 29.9Boulder Ck 11.4 52.8 21.8 8.4 38% 13.4 30.9Zayante Ck 11.1 43.8 14.9 5.2 35% 9.7 29.0
Bean Ck 9.0 43.7 18.1 6.8 38% 11.2 25.7SLR at Big Trees 106.6 46.0 17.3 7.1 41% 10.2 28.7
*Normalized to 1937-2006; thus, values of total streamflow differ slightly from Table 3-8.
Hydrographs are of average mean daily flow for indicated periods of record.Source: http://nwis.waterdata.usgs.gov/ca/nwis/sw
Pescadero Creek,WY's 1952-2006
0
25
50
75
100
125
150
175
1-Oct 1-Nov 1-Dec 1-Jan 1-Feb 1-Mar 1-Apr 1-May 1-Jun 1-Jul 1-Aug 1-Sep
Mea
n D
aily
Flo
w (c
fs)
StormflowBaseflow
San Lorenzo Riverat Waterman Switch,
WY's 1969-1992
0
5
10
15
20
25
30
1-Oct 1-Nov 1-Dec 1-Jan 1-Feb 1-Mar 1-Apr 1-May 1-Jun 1-Jul 1-Aug 1-Sep
Mea
n D
aily
Flo
w (c
fs)
StormflowBaseflow
Boulder Creek,WY's 1977-1992
0
10
20
30
40
50
60
70
80
1-Oct 1-Nov 1-Dec 1-Jan 1-Feb 1-Mar 1-Apr 1-May 1-Jun 1-Jul 1-Aug 1-Sep
Mea
n D
aily
Flo
w (c
fs)
StormflowBaseflow
Zayante Creek,WY's 1958-1992
0
5
10
15
20
25
30
35
40
45
1-Oct 1-Nov 1-Dec 1-Jan 1-Feb 1-Mar 1-Apr 1-May 1-Jun 1-Jul 1-Aug 1-Sep
Mea
n D
aily
Flo
w (c
fs)
StormflowBaseflow
Bean Creek,WY's 1990-2006
0
5
10
15
20
25
30
35
40
1-Oct 1-Nov 1-Dec 1-Jan 1-Feb 1-Mar 1-Apr 1-May 1-Jun 1-Jul 1-Aug 1-Sep
Mea
n D
aily
Flo
w (c
fs)
StormflowBaseflow
San Lorenzo Riverat Big Trees,
WY's 1937-2006
0
50
100
150
200
250
300
350
400
1-Oct 1-Nov 1-Dec 1-Jan 1-Feb 1-Mar 1-Apr 1-May 1-Jun 1-Jul 1-Aug 1-Sep
Mea
n D
aily
Flo
w (c
fs)
StormflowBaseflow
Figure 3-16Estimated Avearge Stormflow-Baseflow Hydrograph Separation, Selected Gaged Streams
San Vicente Creek,WY's 1970-1985
0
5
10
15
20
25
30
35
40
1-Oct 1-Nov 1-Dec 1-Jan 1-Feb 1-Mar 1-Apr 1-May 1-Jun 1-Jul 1-Aug 1-Sep
Mea
n D
aily
Flo
w (c
fs)
StormflowBaseflow
Qb-summary2.xls Sheet1 6/7/2007 4:24 AM NM Johnson
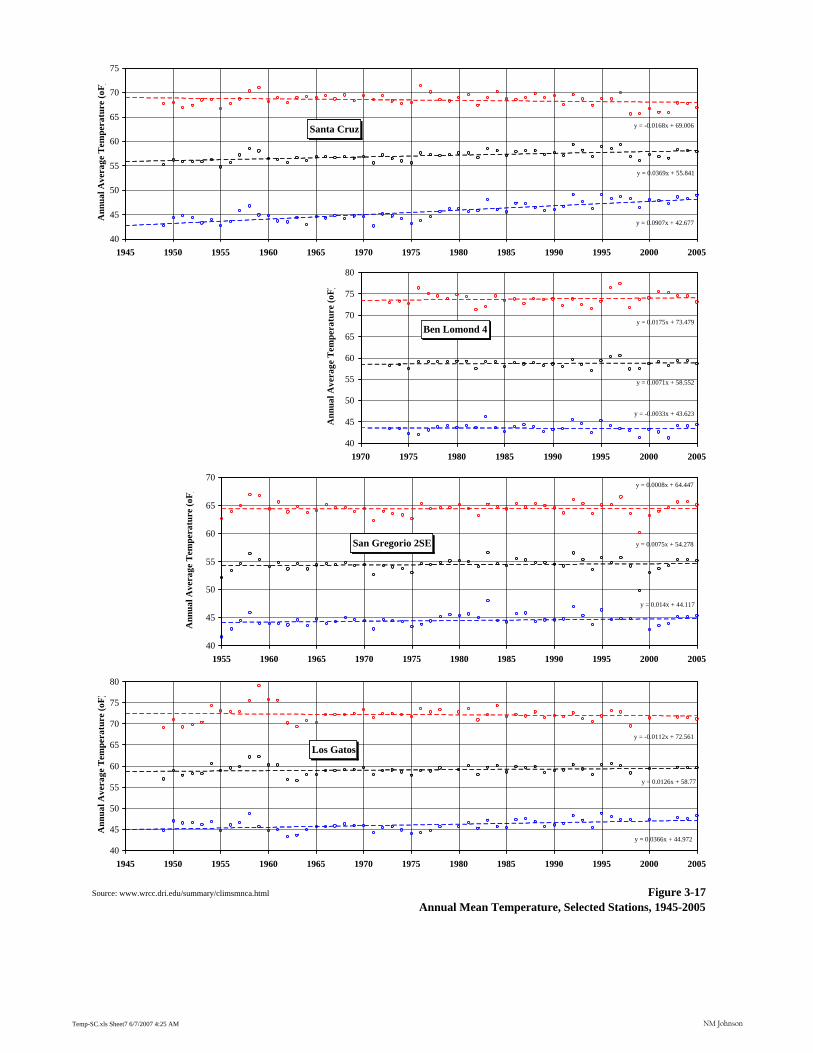
Source: www.wrcc.dri.edu/summary/climsmnca.html Figure 3-17Annual Mean Temperature, Selected Stations, 1945-2005
Santa Cruz y = -0.0168x + 69.006
y = 0.0369x + 55.841
y = 0.0907x + 42.677
40
45
50
55
60
65
70
75
1945 1950 1955 1960 1965 1970 1975 1980 1985 1990 1995 2000 2005
Ann
ual A
vera
ge T
empe
ratu
re (o
F)
Ben Lomond 4y = 0.0175x + 73.479
y = 0.0071x + 58.552
y = -0.0033x + 43.623
40
45
50
55
60
65
70
75
80
1970 1975 1980 1985 1990 1995 2000 2005
Ann
ual A
vera
ge T
empe
ratu
re (o
F)
San Gregorio 2SE
y = 0.014x + 44.117
y = 0.0075x + 54.278
y = 0.0008x + 64.447
40
45
50
55
60
65
70
1955 1960 1965 1970 1975 1980 1985 1990 1995 2000 2005
Ann
ual A
vera
ge T
empe
ratu
re (o
F)
Los Gatos
y = 0.0366x + 44.972
y = 0.0126x + 58.77
y = -0.0112x + 72.561
40
45
50
55
60
65
70
75
80
1945 1950 1955 1960 1965 1970 1975 1980 1985 1990 1995 2000 2005
Ann
ual A
vera
ge T
empe
ratu
re (o
F)
Temp-SC.xls Sheet7 6/7/2007 4:25 AM NM Johnson
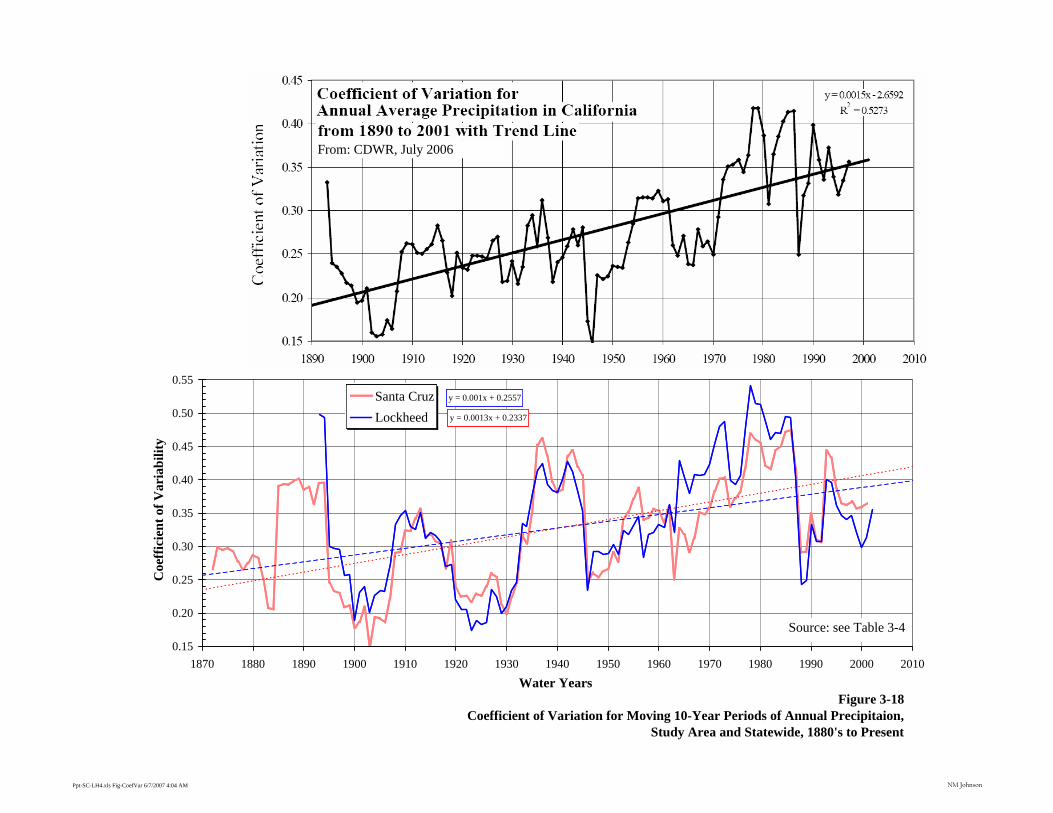
y = 0.001x + 0.2557
y = 0.0013x + 0.2337
0.15
0.20
0.25
0.30
0.35
0.40
0.45
0.50
0.55
1870 1880 1890 1900 1910 1920 1930 1940 1950 1960 1970 1980 1990 2000 2010Water Years
Coe
ffic
ient
of V
aria
bilit
y
Santa CruzLockheed
Figure 3-18Coefficient of Variation for Moving 10-Year Periods of Annual Precipitaion,
Study Area and Statewide, 1880's to Present
From: CDWR, July 2006
Source: see Table 3-4
Ppt-SC-LH4.xls Fig-CoefVar 6/7/2007 4:04 AM NM Johnson