Embed Size (px)
Citation preview

C O N T E N T S
Reinforcing our Purpose. Embracing our Potential. 1
Letter from the President 2
Converging Markets. Compelling Opportunities. 4
Inventive Solutions. Breakthrough Applications. 7
Positioned for Success 8
Selected Financial Data 10
Supplementary Quarterly Data 11
Management’s Discussion and Analysis 12
Balance Sheets 29
Statements of Income 30
Statements of Stockholders’ Equity 31
Statements of Cash Flows 32
Notes to Financial Statements 33
Report of Independent Auditors 44
Worldwide Locations 45
Corporate Information 46
SanDisk 1999 Annual ReportTable of Contents

a n n u a l r e p o r t 1999
InStepwith theFuture

Flash MemoryCompatibility
Digital
mainstreetalliances
breakthrough

Reinforcing our purpose.Embracing our potential.
SanDisk products were in strong demand during 1999. This fact is clearly reflected in our business and financial
performance for the year, which is detailed in the following pages. Our mission, “to be the global leader in flash data
storage,” continued to be a major focus for the company, and we retained our position as the world’s top supplier of flash
data storage.
SanDisk’s alliances with leading manufacturers expanded in scope in 1999. We gained a solid foothold in many emerging
consumer markets as SanDisk products became widely used in digital cameras, portable digital music players, cell
phones, and a host of other wireless devices which are quickly growing in popularity with consumers around the world.
As the digital information age continues to open up new markets, we are committed to embracing our potential as
technology innovators ready to shape the future.

Reaping the rewardsof relentless focus.
Fiscal 1999 was a year of remarkable growth and progress
for SanDisk. During the year, the vision that we have nurtured for
the past decade finally began to fall into place as a beautiful quilt
of emerging mega-markets. For several years we have talked about
the post-PC era which will see the accelerating conversion of con-
sumer electronics from analog to digital, the explosive growth in
wireless/portable communications, and the swift transformations
wrought by the advent of the internet and e-commerce. These
mega-market forces will shape our lives in the new century. Each
will require the power to compute, transmit and store vast
amounts of digital information, be it e-mail, voice mail, music,
video, images, digital books, maps or video games, and the infra-
structure for switching, routing and storing this expanding
bandwidth. This is SanDisk’s opportunity, and our challenge: to
provide the most reliable, most competitive flash storage to these
new markets, and to be able to rapidly scale the volume of our
business to allow us to maintain our leading market share position
globally. I am happy to report that in 1999 we made great strides
toward meeting our long-term strategic objectives. At the same
time, we continued to demonstrate our attention to the daily details,
and our relentless pursuit of lower costs through accelerated
introductions of advanced technology.
The numbers speak for themselves. Revenues for 1999 totaled
$247 million, an increase of 82 percent over the previous year.
Product revenues grew 99 percent over 1998 due to increased sales
of CompactFlash™ and MultiMediaCard products. Royalty revenues
increased 27 percent to $41 million. Net income grew 124% to $27
million, or $0.43 a share on a fully diluted basis. We greeted the
new millennium with our balance sheet stronger than ever, with cash
and investments of $457 million following a successful secondary
financing in November. The
company continues to operate
conservatively with essentially
no debt.
Driving these impressive numbers is a growing demand from
consumer retail sales of our products, particularly into the digital
camera market, which began to grow rapidly in the second half
of the year. After a decade of working closely with key manufac-
turers such as Kodak, Canon, Nikon, and Hewlett-Packard to
develop the digital camera market, we are beginning to realize
considerable returns on our investment. By the end of 1999,
SanDisk had shipped over three million CompactFlash memory
cards to major OEMs and to more than 13,000 retail outlets
worldwide. Today, more than 130 digital camera models sold in
retail outlets throughout the world have slots for CompactFlash.
Also during the year, the MultiMediaCard product family gained
strong support from the emerging Internet music player market, as
well as the digital camcorder and smart cell phone markets. Because
of the strong increase in demand, we were supply constrained for
flash memory, and as a result were unable to meet our customer
demand for MultiMediaCards during 1999. We are focusing signifi-
cant efforts on adding new flash memory capacity to meet this
burgeoning demand.
One of the most significant events of 1999 was the agreement
between SanDisk, Matsushita Electric Industrial, and Toshiba to
jointly develop and promote the new Secure Digital Memory Card.
This high-speed, read/write memory card heralds the next genera-
tion of flash memory storage by providing cryptographic security
A L E T T E R F R O M T H E P R E S I D E N T
2 A n n u a l R e p o r t 1 9 9 9

through its intelligent flash memory controller for protection of
copyrighted data, including music, movies, and other digitally
available commercial content. We believe that the security features
of the Secure Digital Memory Card will be a key enabler for the
secure electronic distribution of copyrighted works. First shipments
of our new Secure Digital Memory Card are slated for the second
quarter of 2000, however, we do not expect to generate substantial
Secure Digital Memory Card revenues until 2001, when numerous
new designs are expected to arrive on the market.
In the fourth quarter, we announced the signing of a memorandum
of understanding with Toshiba for the long-term strategic cooperation
in the development and manufacturing of advanced flash memory
technology. We expect this partnership to become an important
element in SanDisk’s market leadership in the years ahead.
During 1999, we relied exclusively on our foundry partnership
with UMC for our flash memory production. Despite the severe
earthquake in Taiwan in September, UMC was able to recover
quickly, minimizing the interruption in our fourth quarter wafer
supply. All in all, we shipped almost four times more megabytes
of flash memory in 1999 than we shipped in all of 1998.
I am pleased to report the excellent progress we made in 1999 in
our operations and technology groups. We began the year focused
on the production of our 64Mbit flash chip. By the middle of
1999, we successfully transitioned to 128Mbit production. By the
fourth quarter of 1999, we completed the production transition to
our first 256Mbit double density flash chip. We believe that now,
with the 256Mbit flash chip and its high performance, low cost
controller in full production, SanDisk is very well positioned as a
world class high volume, low cost producer of flash storage cards.
On the production side, we strengthened our manufacturing
infrastructure through the increased emphasis on leveraging
outside subcontractors for much of our manufacturing, assembly,
and test operations. In fiscal 2000, we expect the majority of our
production to be completed by subcontractors in China and Taiwan.
As a result, our U.S. operations are now focused primarily on new
and custom product development and production. With our world
class manufacturing partners, we believe that we are well posi-
tioned to capitalize on the significant future growth in the market
for flash memory.
It is an exciting time at SanDisk. We are breaking new ground in
many areas. We believe we are just at the beginning of a long period
of sustainable growth. The key to SanDisk’s ability to sustain our
success lies in the execution of our plan by our employees, our
greatest asset. Our employees are enthusiastic, highly dedicated
and passionate. Their hard work has brought us to where we are
today, a world class, highly respected, market leader. As we look
ahead, we are confident that we will continue to reap the rewards
of our passion for quality and our relentless focus on lowering
the cost and improving the value to our customers of our flash
memory products.
We are most grateful for your continued support.
REVENUES(in thousands)
95
$6
2,8
39
$9
7,5
99
$1
25
,25
3
$1
35
,76
1
$2
46
,99
0
96 97 98 99
50
100
150
200
250
WORKING CAPITAL(in thousands)
95
$4
82
,79
3
96 97 98 99
$6
8,0
02
$7
7,0
29
$1
34
,29
8
$1
38
,47
1
100
200
300
400
500
OPERATING INCOME(in thousands)
95
$1
2,4
74
$1
9,6
80
$1
2,8
10
$3
0,0
85
96 97 98 99
$7
,77
7
10
15
20
25
30
10
15
20
25
30
NET INCOME(in thousands)
95
$1
4,4
85
$1
9,8
39
$2
6,5
50
96 97 98 99
$9
,06
5
$1
1,8
36
S a n D i s k C o r p o r a t i o n 3
Eli Harari
President and Chief Executive Officer

Converging markets.Compelling opportunities.
SanDisk has focused its research and development efforts on flash memory storage
products since we were founded in 1988. We introduced CompactFlash in 1994, and today
have a team of engineers dedicated to increasing memory capacity, developing advanced features,
and reducing manufacturing costs. During 1999, SanDisk shipped more than three million
CompactFlash memory cards — more than any previous year — and there are currently more than
220 products on the market that use CompactFlash as their primary storage medium. Last year,
sales of CompactFlash accounted for 60 percent of our product revenues.
The rapid emergence of the digital camera market is one of the chief factors driving demand
for CompactFlash. Today there are more than 130 digital cameras available with slots for
CompactFlash. Using CompactFlash as their “digital film”, consumers can capture and store high
resolution photographs, and then transport the images directly to a computer, photo printer, or
other digital device. A whole new generation is discovering the time- and cost-efficiency of
CompactFlash: instead of buying roll after roll of photographic film, they can reuse a single
CompactFlash card over a lifetime.
During 1999, we also began to witness the convergence of the markets for consumer electronics,
wireless communications, and the Internet. The marketplace is being transformed as consumers
opt for smaller, more user-friendly devices that offer mobility, flexibility, and access to a full range
of content. SanDisk’s MultiMediaCard, originally targeted at cellular phone and pager markets, is
finding new applications in emerging markets such as portable digital music players, digital video
cameras, and smart phones.
5
SanDisk’s CompactFlash memory cardscurrently range in capacity from 8 to192MB, and are widely used in digitalcameras, handheld PCs, voice recordersand any other CompactFlash compatible device.
SanDisk Type II PC Cards are as con-venient as floppy disks, but require farless power and provide considerablymore storage. SanDisk PC Cards arecurrently available in capacities rangingfrom 8MB to 1.2GB.
The SanDisk MultiMediaCard lets youcarry more music, images, data, and voicerecordings. This small but rugged memorycard is great for Internet music players,voice recorders, smart phones, and digitalcamcorders. It is currently available incapacities ranging from 8 to 64MB.
SanDisk’s ImageMate external drive isthe fastest, most convenient way totransfer data between your memorycards and your computer. The SanDiskFlashPath is a convenient floppy disk-shaped adapter that lets you read andwrite data to memory cards using yourcomputer’s floppy disk drive.
SanDisk IDE FlashDrives are solid-statemass storage systems for use in mobilecomputers, communications platforms,and embedded systems. They maintainfull compatibility with a hard disk drivebut consume less power.
4 A n n u a l R e p o r t 1 9 9 9
CompactFlash Memory Cards
FlashDisk Type II PC Cards
SanDisk MultiMediaCards
ImageMate™ Drives and FlashPath™ Adapters
FlashDrives

SanDisk Flash Memory Cards are used in a variety of handheld PCs.
SanDisk MultiMediaCards store music files for today’s popular Internet music players.
More than 130 digital cameras now take SanDisk'sCompactFlash cards.

SanDisk's Personal Tag (P-Tag) makes critical health information accessible to authorized medical personnel.
Over 75 Internet music players now take SanDisk'sMultiMediaCard.
The Secure Digital Memory Cardprovides security for copyrightprotection of digital data.

Inventive solutions.Breakthrough applications.
SanDisk Secure Digital Memory Card
Just as our passion for innovation drove the creation of flash memory in 1988, SanDisk’s
ongoing quest for inventive solutions continued in 1999 with the introduction of two revolu-
tionary new products.
The Secure Digital Memory Card, introduced in August 1999, takes the technology introduced in
our MultiMediaCard to new levels. This universal flash memory storage device, about the size of
a postage stamp, offers cryptographic security along with high storage capacity. We believe the
Secure Digital Memory Card will unleash entirely new business models built around the delivery
of high-value, copyright-protected content that can be transferred from the Internet to a computer
and a full range of portable wireless devices without compromising the ownership and licensing
rights of its creator.
In August 1999, SanDisk joined forces with Matsushita Electric (best known for its Panasonic
brand name products) and Toshiba to jointly develop, specify, and promote the Secure Digital
Memory Card. As part of this collaboration, all three companies will foster the development of
application products using the Secure Digital Memory Card. In January 2000, Matsushita,
Toshiba, and SanDisk announced the formation of the SD Association, a new industry-wide
organization created to promote the Secure Digital Memory Card standard and to encourage its
acceptance in digital applications. Membership in the SD Association is expected to include more
than 100 leading technology companies from around the world.
In September 1999, SanDisk broke new ground with the introduction of the Personal Tag (P-Tag),
the world’s first solid-state, wearable personal storage device. Originally developed for the U.S.
Army, P-Tag weighs just two grams and is designed to be comfortably worn 24 hours a day, 7 days
a week. The initial application for P-Tag is for storing medical information for military personnel,
but it also holds great promise as a storage solution for health care organizations.
The next generation of security for
protection of valued content. The
Secure Digital Memory Card meets
the growing demand for flash
memory based storage cards while
addressing the increasingly complex
issue of copyright protection for
artists and other content owners.
Jointly developed by Matsushita,
SanDisk, and Toshiba, the Secure
Digital Memory Card provides a high
level of security for protection of
content, which can be distributed
over the Internet. The Secure
Digital Memory Card balances the
needs of content owners for copy-
right protection with the needs of
the consumer for ease of use and
flexibility. Consumers will soon be
able to move protected content from
the Internet, CDs, or DVDs for their
own personal enjoyment without
compromising the copyrights of the
content owners. The Secure Digital
Memory Card is expected to gain
endorsement from content providers
worldwide, as it will enable them to
take full advantage of the Internet-
based content distribution model
and engage in secure e-commerce
transactions involving copyrighted
and protected information.
S a n D i s k C o r p o r a t i o n 7
This wearable electronic card, less than an inch in diameter, holds from8MB to 32MB of the carrier’s medicalhistory. Designed to be worn at alltimes, it makes critical health informa-tion instantly accessible to authorizedmedical personnel any time, any place.
Personal Tag (P-Tag)

As we look to the future, we are determined and optimistic. We are continuing our relentless focus on increasing
the capacity and lowering the cost of our flash data storage products. At the same time, we are anticipating the
market demands of a new generation by pursuing research and development of innovative solutions that align with
the digital age.
We are confident in our capabilities to execute our strategic plans, and we remain firmly committed to creating and
enabling new consumer mega-markets by providing world-leading technology, enabling scalable, high-volume production,
and developing and promoting industry standards.
As a company, in our many alliances, and as a force for innovation, SanDisk is positioned for success.
8 A n n u a l R e p o r t 1 9 9 9
Positioned for success.

9S a n D i s k C o r p o r a t i o n
C O N T E N T S
Selected Financial Data 10
Supplementary Quarterly Data 11
Management’s Discussion and Analysis 12
Balance Sheets 29
Statements of Income 30
Statements of Stockholders’ Equity 31
Statements of Cash Flows 32
Notes to Financial Statements 33
Report of Independent Auditors 44
Worldwide Locations 45
Corporate Information 46
SanDisk 1999Financial Review

10 A n n u a l R e p o r t 1 9 9 9
S A N D I S K C O R P O R A T I O N S E L E C T E D F I N A N C I A L D A T A
( I n t h o u s a n d s , e x c e p t p e r s h a r e d a t a )
Ye a r E n d e d D e c e m b e r 3 1 , 1 9 9 9 1 9 9 8 1 9 9 7 1 9 9 6 1 9 9 5
Revenues
Product $ 205,770 $ 103,190 $ 105,675 $ 89,599 $ 61,589
License and royalty 41,220 32,571 19,578 8,000 1,250
Total revenues 246,990 135,761 125,253 97,599 62,839
Cost of revenues 152,143 80,311 72,280 58,707 36,613
Gross profits 94,847 55,450 52,973 38,892 26,226
Operating income 30,085 12,810 19,680 12,474 7,777
Net income $ 26,550 $ 11,836 $ 19,839 $ 14,485 $ 9,065
Net income per share
Basic $ 0.48 $ 0.23 $ 0.43 $ 0.33 $ 0.24
Diluted $ 0.43 $ 0.21 $ 0.40 $ 0.30 $ 0.22
Shares used in per share calculations
Basic 55,834 52,596 45,760 44,324 37,494
Diluted 61,433 55,344 49,940 48,412 40,656
A t D e c e m b e r 3 1 , 1 9 9 9 1 9 9 8 1 9 9 7 1 9 9 6 1 9 9 5
Working capital $ 482,793 $ 138,471 $ 134,298 $ 77,029 $ 68,002
Total assets 657,724 255,741 245,467 108,268 92,147
Total stockholders’ equity 572,127 207,838 191,374 87,810 72,381
See Notes to the Consolidated Financial Statements and Management’s Discussion and Analysis of Financial Condition and Results of Operations.

Q u a r t e r l y / 1 9 9 9 1 s t 2 n d 3 r d 4 t h
Revenues
Product $ 35,926 $ 42,300 $ 57,624 $ 69,920
License and royalty 8,210 10,249 9,910 12,851
Total revenues 44,136 52,549 67,534 82,771
Gross profits 17,627 21,691 23,637 31,892
Operating income 4,848 7,033 6,956 11,248
Net income 4,323 5,694 6,505 10,028
Net income per share
Basic $ 0.08 $ 0.11 $ 0.12 $ 0.17
Diluted $ 0.07 $ 0.10 $ 0.11 $ 0.15
Q u a r t e r l y / 1 9 9 8 1 s t 2 n d 3 r d 4 t h
Revenues
Product $ 25,426 $ 23,480 $ 24,143 $ 30,141
License and royalty 8,676 7,881 7,935 8,079
Total revenues 34,102 31,361 32,078 38,220
Gross profits 16,330 10,801 13,238 15,081
Operating income 6,004 370 2,633 3,803
Net income 4,703 1,053 2,506 3,574
Net income per share
Basic $ 0.09 $ 0.02 $ 0.05 $ 0.07
Diluted $ 0.08 $ 0.02 $ 0.05 $ 0.07
11S a n D i s k C o r p o r a t i o n
S A N D I S K C O R P O R A T I O N S U P P L E M E N T A R Y Q U A R T E R L Y D A T A
( U n a u d i t e d . I n t h o u s a n d s , e x c e p t p e r s h a r e d a t a )

12 A n n u a l R e p o r t 1 9 9 9
M A N A G E M E N T ’ S D I S C U S S I O N A N D A N A L Y S I S
O F F I N A N C I A L C O N D I T I O N A N D R E S U L T S O F O P E R A T I O N S
OverviewSanDisk was founded in 1988 to develop and market flash data
storage systems. We sell our products to the consumer electronics
and industrial/communications markets. In 1999, the percentage of
our product sales attributable to the consumer electronics market,
particularly sales of CompactFlash for use in digital camera appli-
cations, continued to grow. This increase in sales to the consumer
market resulted in a further shift in sales mix to products with aver-
age capacities between 8 and 64 megabytes, which typically have
lower average selling prices and gross margins than our higher
capacity FlashDisk and FlashDrive products. In addition, a substan-
tial portion of our CompactFlash products are sold into the retail
channel, which usually has shorter customer order lead-times than
our other channels. A majority of our sales to the retail channel are
turns business, with orders received and fulfilled in the same quar-
ter, thereby decreasing our ability to accurately forecast future
production needs. We believe sales to the consumer market will con-
tinue to represent a majority of our sales as the popularity of
consumer applications, including digital cameras, increases.
Our operating results are affected by a number of factors including
the volume of product sales, availability of foundry capacity, varia-
tions in manufacturing cycle times, fluctuations in manufacturing
yields and manufacturing utilization, the timing of significant
orders, competitive pricing pressures, our ability to match supply
with demand, changes in product and customer mix, market accept-
ance of new or enhanced versions of our products, changes in the
channels through which our products are distributed, timing of new
product announcements and introductions by us and our competi-
tors, the timing of license and royalty revenues, fluctuations in
product costs, increased research and development expenses, and
exchange rate fluctuations. In addition, as the proportion of our
products sold for use in consumer electronics applications
increases, our revenues may become subject to seasonal declines in
the first quarter of each year. See “Factors That May Affect Future
Results — Our operating results may fluctuate significantly” and “
— There is seasonality in our business.”
Beginning in late 1995, we adopted a strategy of licensing our flash
technology, including our patent portfolio, to selected third party
manufacturers of flash products. To date, we have entered into
patent cross-license agreements with several companies, and intend
to pursue opportunities to enter into additional licenses. Our current
license agreements provide for the payment of license fees, royal-
ties, or a combination thereof. The timing and amount of these
payments can vary substantially from quarter to quarter, depending
on the terms of each agreement and, in some cases, the timing of
sales of products by the other parties. As a result, license and roy-
alty revenues have fluctuated significantly in the past and are likely
to continue to fluctuate in the future. Given the relatively high gross
margins associated with license and royalty revenues, gross margins
and net income are likely to fluctuate more with changes in license
and royalty revenues than with changes in product revenues.
We market our products using a direct sales organization, distributors,
manufacturers’ representatives, private label partners, OEMs and
retailers. We expect that sales through the retail channel will com-
prise an increasing share of total revenues in the future, and that a
substantial portion of our sales into the retail channel will be made
to participants that will have the right to return unsold products.
We do not recognize revenues from these sales until the products
are sold to the end customers.
Historically, a majority of our sales have been to a limited number
of customers. Product sales to our top 10 customers accounted for
approximately 57%, 59% and 67%, respectively, of our product rev-
enues for 1999, 1998 and 1997. In addition, in 1999 and 1998
revenues from one customer exceeded 10% of total revenues. No
single customer accounted for greater than 10% of total revenues in
1997. We expect that sales of our products to a limited number of
customers will continue to account for a substantial portion of our
product revenues for the foreseeable future. We have also experi-
enced significant changes in the composition of our customer base
from year to year and expect this pattern to continue as market
demand for such customers’ products fluctuates. The loss of, or
Certain statements in this discussion and analysis are forward looking statements based on current expectations, and entail various risks
and uncertainties that could cause actual results to differ materially from those expressed in such forward looking statements. Such risks
and uncertainties are set forth in “Factors That May Affect Future Results.” The following discussion should be read in conjunction with
our consolidated financial statements and the notes thereto.

significant reduction in purchases by major customers, could have
a material adverse effect on our business, financial condition and
results of operations. See “Factors That May Affect Future Results
— Sales to a small number of customers represent a significant
portion of our revenues.”
All of our products require silicon wafers, which are currently
manufactured by UMC in Taiwan. Industry wide demand for semi-
conductors increased significantly in 1999, due to increased
demand in the consumer electronics and cellular phone markets.
This increased demand is expected to continue in 2000 causing
supply to become constrained and prices to increase. Under our
wafer supply agreements, there are limits on the number of wafers
we can order and our ability to change that quantity is restricted.
Accordingly, our ability to react to significant fluctuations in
demand for our products is limited. If customer demand exceeds
our forecasts, we may be unable to obtain an adequate supply of
wafers to fill customer orders, which could result in lost sales and
lower revenues. If we are unable to obtain adequate quantities of
flash memory wafers with acceptable prices and yields from our
current and future wafer foundries, our business, financial condition
and results of operations could be harmed. If customer demand falls
below our forecast and we are unable to reschedule or cancel our
wafer orders, we may end up with excess wafer inventories, which
could result in higher operating expenses and reduced gross mar-
gins. We have from time to time taken write downs for excess
inventories. For example, in the second quarter of 1998, our prod-
uct gross margins were negatively impacted by such an inventory
write down. These adjustments decrease gross margins in the quar-
ter reported and have resulted, and could in the future result, in
fluctuations in gross margins on a quarter to quarter basis. See
“Factors That May Affect Future Results — Our operating results
may fluctuate significantly.”
Export sales are an important part of our business, representing
53%, 56% and 57% of our total revenues in 1999, 1998, and
1997, respectively. Our sales may be impacted by changes in eco-
nomic conditions in our international markets. For example, in
1998, product sales to Japan declined 19% from the prior year, due
in part to the Asian economic crisis. While a majority of our rev-
enues from sales to Japan and other Asian countries are derived
from OEM customers who plan to export a portion of their products
to countries outside of Asia, economic conditions in Asia may con-
tinue to adversely effect our revenues to the extent that demand for
our products in Asia declines. Given the recent economic conditions
in Asia and the weakness of many Asian currencies relative to the
United States dollar, our products may be relatively more expensive
in Asia, which could result in a decrease our sales in that region. We
may also experience pressure on our gross margins as a result of
increased price competition from Asian competitors. While most of
our sales are denominated in U.S. Dollars, we invoice certain
Japanese customers in Japanese Yen and are subject to exchange
rate fluctuations on these transactions which could affect our busi-
ness, financial condition and results of operations. See “Factors
That May Affect Future Results — Our international operations make
us vulnerable to changing conditions and currency fluctuations.”
For the foreseeable future, we expect to realize a significant portion
of our revenues from recently introduced and new products.
Typically new products initially have lower gross margins than more
mature products because the manufacturing yields are lower at the
start of manufacturing each successive product generation. In addi-
tion, manufacturing yields are generally lower at the start of
manufacturing any product at a new foundry. To remain competitive,
we are focusing on a number of programs to lower manufacturing
costs, including development of future generations of D2 flash and
advanced technology wafers. There can be no assurance that we will
successfully develop such products or processes or that develop-
ment of such processes will lower manufacturing costs. In addition,
if the industry wide supply of flash memory products grows faster
than customer demand, we could experience increased price com-
petition in the future, which could result in decreased average
selling prices and lower gross margins. See “Factors That May Affect
Future Results — We must achieve acceptable manufacturing yields.”
Results of Operations
P R O D U C T R E V E N U E S .
In 1999, our product revenues increased 99% to $205.8 million from
$103.2 million in 1998. The increase consisted of an increase of
157% in unit sales, which was partially offset by a 22% decline in
average selling prices. In 1999, the largest increase in unit volume
came from sales of CompactFlash which represented 61% of product
revenues and MultiMediaCard products which represented 7% of prod-
uct revenues. A shift in product mix to higher capacity cards in 1999
partially offset a decline in the average selling price per megabyte of
capacity shipped. In 1999, the average megabyte capacity per unit
shipped increased 65% while the average selling price per megabyte
of flash memory shipped declined 52% compared to the prior year. The
mix of products sold varies from quarter to quarter and may vary in the
future, affecting our overall average selling prices and gross margins.
13S a n D i s k C o r p o r a t i o n
M A N A G E M E N T ’ S D I S C U S S I O N A N D A N A L Y S I S

14 A n n u a l R e p o r t 1 9 9 9
M A N A G E M E N T ’ S D I S C U S S I O N A N D A N A L Y S I S
In 1998, our product revenues were $103.2 million, a decline of
2% from $105.7 million in 1997. The 1998 decrease consisted of
an increase in unit shipments of 34% which was offset by a decline
in average selling prices of 28%. In 1998, the largest increase in
unit volume came from sales of CompactFlash products, primarily
for use in digital cameras and other consumer electronics applica-
tions. CompactFlash products represented approximately 50% of
product revenues in 1998.
SanDisk’s backlog at the end of 1999 was $157.2 million compared to
$13.4 million in 1998 and $18.6 million in 1997. See “Factors That
May Affect Future Results — Our operating results may fluctuate
significantly” and “ — There is seasonality in our business.”
L I C E N S E A N D R O YA LT Y R E V E N U E S .
We currently earn patent license fees and royalties under seven
cross-license agreements with Hitachi, Intel, Sharp, Samsung,
SmartDisk, SST and Toshiba. License and royalty revenue from
patent cross-license agreements was $41.2 million in 1999, up
from $32.6 million in 1998 and $19.6 million in 1997. The
increase in license and royalty revenues in 1999 was primarily due
to an increase in patent royalty revenues. The increase in license
and royalty revenues in 1998 was partially due to the recognition of
a full year of revenues under the Hitachi, Toshiba and Samsung
agreements, which were entered into in the third quarter of 1997.
Revenues from licenses and royalties were 17% of total revenues in
1999, 24% in 1998 and 16% in 1997.
G R O S S P R O F I T S .
In fiscal 1999, gross profits increased to $94.8 million, or 38.4% of
total revenues from $55.5 million, or 40.8% of total revenues in
1998 and $53.0 million, or 42.3% of total revenues in 1997. In
1999, product gross margins increased to 26.1% of product revenues
from 22.2% in 1998, primarily due to the lower cost per megabyte
of our 256 megabit and 128 megabit flash memory products, which
began shipping in volume in the second half of 1999. We expect
product gross margins to improve from the 1999 level in the first
quarter of 2000 as we transition to our 256 megabit technology for
the majority of our product sales.
In 1998, the growth in overall gross profits resulted from an increase
in license and royalty revenues, which was partially offset by a decline
in gross profit from product sales. Product gross profits declined as a
percentage of product revenues to 22.2% in 1998 compared to
31.6% in 1997, primarily due to competitive pricing pressures.
R E S E A R C H A N D D E V E L O P M E N T.
Research and development expenses consist principally of salaries
and payroll related expenses for design and development engineers,
prototype supplies and contract services. Research and development
expenses increased to $26.9 million in 1999 from $18.2 million in
1998 and $13.6 million in 1997. As a percentage of revenues,
research and development expenses represented 10.9% in 1999,
13.4% in 1998 and 10.8% in 1997. In 1999 and 1998, the
increase in research and development expenses was primarily due to
an increase in salaries and payroll-related expenses associated with
additional personnel and higher project related expenses. Increased
depreciation due to capital equipment additions also contributed to
the growth in research and development expenses in both years. We
expect research and development expenses to continue to increase,
in absolute dollars and perhaps as a percentage of revenue, to sup-
port the development of new generations of flash data storage
products, including the proposed 512 megabit and 1 gigabit flash
memory co-development and manufacturing joint venture with
Toshiba. If we successfully enter ito a definitive agreement with
Toshiba, we expect the incremental research and development
expenses related to the Toshiba joint development project to be in
the range of $6.0 million to $8.0 million in fiscal 2000.
S A L E S A N D M A R K E T I N G .
Sales and marketing expenses include salaries, sales commissions,
benefits and travel expenses for our sales, marketing, customer serv-
ice and applications engineering personnel. These expenses also
include other selling and marketing expenses, such as independent
manufacturer’s representative commissions, advertising and
tradeshow expenses. Sales and marketing expenses increased to
$25.3 million in 1999 from $16.9 million in 1998 and $12.6 mil-
lion in 1997. The increase in 1999 was primarily due to increased
salaries and payroll related expenses and increased commission
expenses due to higher product revenues and increased marketing
expenses. The increase in 1998 was primarily due to increased mar-
keting and sales expenses related to the development of the retail
channel. Increased salaries and payroll related expenses associated
with additional personnel also contributed significantly to the
increase in 1998. Sales and marketing expenses represented
10.2% of total revenues in 1999 compared to 12.5% in 1998 and
10.0% in 1997. We expect sales and marketing expenses to
increase as sales of our products grow and as we further develop the
retail channel for our products.

G E N E R A L A N D A D M I N I S T R AT I V E .
General and administrative expenses include the cost of our finance,
information systems, human resources, shareholder relations, legal
and administrative functions. General and administrative expenses
were $12.6 million in 1999 compared to $7.5 million in 1998 and
$7.1 million in 1997. The increase in 1999 was primarily due to
higher salaries and payroll related expenses, increased legal fees
and an increase in the allowance for doubtful accounts. The
increase in 1998 was primarily due to increased consulting
expenses related to the implementation of our new management
information system and an increase in the allowance for doubtful
accounts. General and administrative expenses represented 5.1% of
total revenues in 1999 compared to 5.5% in 1998 and 5.7% in
1997. We expect general and administrative expenses to increase as
our general and administrative functions grow to support our overall
growth. General and administrative expenses could also increase
substantially in the future if we pursue additional litigation to
defend our patent portfolio. See “Factors That May Affect Future
Results — Risks associated with patents, proprietary rights and
related litigation.”
I N T E R E S T I N C O M E .
Interest income was $8.3 million in 1999 compared to $5.3 million
in 1998 and $3.7 million in 1997. The increase in 1999 is prima-
rily due to higher interest income in the fourth quarter due to the
investment of the proceeds from the sale of common stock in our
November 1999 follow-on public offering. The increase in 1998 is
primarily due to higher investment balances as a result of the invest-
ment of the proceeds from the sale of common stock in our
November 1997 follow-on public offering.
O T H E R I N C O M E ( L O S S ) , N E T.
Other income (loss), net was $1.3 million in 1999 compared to
$374,000 in 1998 and ($1,000) in 1997. The increases in 1999 and
1998 were primarily due to increased foreign currency transaction
gains of
$1.1 million and $412,000 respectively.
P R O V I S I O N F O R I N C O M E TA X E S .
Our 1999, 1998 and 1997 effective tax rates were approximately
33.0%, 36.0% and 15.0%, respectively. Our 1999 effective tax
rate was lower than our 1998 rate due to benefits from federal
and state tax credits. Our 1998 tax rate is substantially higher than
our 1997 rate due to the utilization of all remaining federal and
state tax credit carry forwards in 1997.
Liquidity and Capital ResourcesAs of December 31, 1999, we had working capital of $482.8 million,
which included $146.2 million in cash and cash equivalents and
$311.0 million in short-term investments. Operating activities pro-
vided $17.0 million of cash in 1999 primarily from net income, an
increase in accounts payable of $23.8 million, and an increase in
accrued liabilities of $23.7 million, which were partially offset by an
increase in accounts receivable of $33.6 million, as a direct result of
increased sales in the fourth quarter, and an increase in inventory of
$26.8 million to support anticipated levels of growth. Cash provided
by operations was $15.1 million in 1998 and $29.3 million in 1997.
Net cash used in investing activities of $214.4 million in 1999
included $21.4 million of capital equipment purchases and net pur-
chases of investments of $193.0 million. In 1998, net cash used in
investing activities of $23.0 million consisted of a second invest-
ment in the USIC foundry of $10.9 million, $7.5 million of capital
equipment purchases and net purchases of investments of $4.6
million. In 1997, net cash used in investing activities of $108.9
million consisted of net purchases of investments of $59.0 million,
an investment of $40.3 in the USIC foundry and $9.6 million of
capital equipment purchases.
In 1999, financing activities provided $328.2 million of cash
including $320.3 million from the net proceeds of the sale of com-
mon stock in our November 1999 follow-on stock offering and $7.9
million from the sale of common stock through the SanDisk stock
option and employee stock purchase plans. During 1998, cash pro-
vided by financing activities of $2.4 million was primarily from the
sale of common stock through the SanDisk stock option and
employee stock purchase plans. Financing activities provided $81.2
million of cash in 1997, primarily from the sale of common stock in
our November 1997 follow-on stock offering.
In October 1999, we entered into a nonbinding memorandum of
understanding with Toshiba providing for the joint development and
manufacturing of 512 megabit and 1 gigabit flash memory chips
and Secure Digital Memory Card controllers. Further, we and
Toshiba intend to form and fund a joint venture to equip and oper-
ate a silicon wafer manufacturing line in Virginia. The cost of
equipping the Virginia wafer manufacturing line is estimated at
between $700 million and $800 million. We, as part of our 50%
ownership of the joint venture, expect to invest up to $150 million
in cash, and, if necessary, guarantee equipment lease lines for an
additional $250 million.
15S a n D i s k C o r p o r a t i o n
M A N A G E M E N T ’ S D I S C U S S I O N A N D A N A L Y S I S

16 A n n u a l R e p o r t 1 9 9 9
M A N A G E M E N T ’ S D I S C U S S I O N A N D A N A L Y S I S
Depending on the demand for our products, we may decide to make
additional investments, which could be substantial, in assembly and
test manufacturing equipment or foundry capacity to support our
business in the future. We expect operating expenses to continue to
increase as a result of the need to hire additional personnel to support
expected growth in sales unit volumes, sales and marketing efforts
and research and development activities, including our proposed col-
laboration with Toshiba providing for the joint development of 512
megabit and 1 gigabit flash memory chips. We believe the existing
cash and cash equivalents and short-term investments will be suffi-
cient to meet our currently anticipated working capital and capital
expenditure requirements for the next twelve months.
On January 3, 2000, the USIC foundry was merged into UMC. We
previously invested $51.2 million in USIC. In exchange for our USIC
shares, we received 111 million UMC shares. These shares were val-
ued at approximately $396 million at the time of the merger,
resulting in a pretax gain of $344 million ($204 million after-tax).
All the UMC shares we received as a result of the merger are sub-
ject to trading restrictions imposed by UMC and the Taiwan Stock
Exchange. The trading restrictions will expire on one-half of the
shares six months after the date of the merger. The remaining shares
will become available for sale over a two year period beginning in
January 2002. When the shares are ultimately sold, it is likely that
we will report additional gains or losses. To the extent we can liqui-
date the UMC shares, we will plan to use such funds to support our
operations and capital expenditures.
Impact of Currency Exchange Rates A portion of our revenues are denominated in Japanese Yen. We
enter into foreign exchange forward contracts to hedge against
changes in foreign currency exchange rates. At December 31,
1999, two forward contracts with notional amounts of $8.2 million
were outstanding. Future exchange rate fluctuations could have a
material adverse effect on our business, financial condition and
results of operations.
Impact of Recently Issued Accounting StandardsIn June 1998, the Financial Accounting Standards Board issued
Statement 133, Accounting for Derivative Instruments and Hedging
Activities, which is required to be adopted in years beginning after
June 15, 2000. Because of our minimal use of derivatives, we do
not anticipate that the adoption of the new Statement will have a
significant effect on our earnings or financial position, however, we
are in the process of studying the actual impact.
Year 2000 Readiness DisclosureYear 2000 problems are the result of common computer
programming techniques that result in systems that do not function
properly when manipulating dates later than December 31, 1999.
The issue is complex and wide-ranging. The problem may affect
transaction processing computer applications we use for account-
ing, distribution, manufacturing planning, and communications.
The problem may also affect embedded systems such as building
security systems, machine controllers and production testing equip-
ment. Year 2000 problems with these systems may affect the ability
or efficiency with which we can perform many significant functions,
including but not limited to order processing and fulfillment, material
planning, product assembly, product testing, invoicing and financial
reporting. We have not to date experienced any material impact in
any of these areas. The Year 2000 problem may also affect the com-
puter systems of our suppliers and customers, potentially disrupting
their operations. Year 2000 problems with our business partners
may impact our sources of supply and demand.
Y E A R 2 0 0 0 R E A D I N E S S .
We conducted a Year 2000 risk management program to assess the
impact of the Year 2000 issue on us, and to coordinate remediation
activities. We completed the evaluation of out products for Year
2000 compliance in the third quarter of 1998. Our storage and con-
nectivity products are used as components in a variety of host
systems. The firmware, operating system and application software of
these host systems are designed and manufactured by others. We
make no claim with regard to the Year 2000 readiness of host sys-
tems designed by others in which products are used. In addition,
independent system designers make derivative works from out Host
Developer’s Toolkit source code product. We make no claims with
regard to the Year 2000 readiness of host firmware and operating sys-
tems designed by others that contain derivative works of the Toolkit.
The Year 2000 remediation of our transaction processing systems
was completed with the installation and testing of our new manage-
ment information system in the fourth quarter of 1998. In the
second quarter of 1999, we completed all of the primary elements
of our Year 2000 assessment and remediation program for our prin-
cipal hardware and software. Tests of software applications, which
have been identified by their vendors as Year 2000 compliant, and
several minor software upgrades were successfully completed in the
third quarter of 1999.

Our assessment and remediation of Year 2000 problems in computer
systems used for facilities control, machine control and manufactur-
ing testing is complete. We are phasing in new Year 2000 compliant
wafer testing equipment in conjunction with the introduction of new
generations of flash memory.
Our assessment of Year 2000 risks related to material suppliers,
customers and other third parties is complete. Inquiries were made
of all critical suppliers and an assessment of their Year 2000 readi-
ness was the basis for strategic decisions regarding alternate
material sourcing and/or increasing inventory safety stocks. We also
attempted to contact our significant customers regarding their Year
2000 readiness in order to understand the potential for any disrup-
tions in their ordering patterns.
Y E A R 2 0 0 0 R I S K M A N A G E M E N T P R O G R A M C O S T S .
The cost of Year 2000 project related to upgrading our core
management information system was approximately $1.0 million,
$400,000 of which was related to the purchase of software and
hardware which was capitalized. Upgrading application software
and replacing non-compliant personal computer systems cost an
additional $175,000. The majority of these costs would have been
incurred, in spite of Year 2000 issues, due to the need to upgrade
our management information system, application software and per-
sonal computers to support our growth. Our Year 2000 remediation
projects were funded from operating cash flows. No material proj-
ects were deferred in order to complete our Year 2000 assessment
and remediation projects.
R I S K S R E L AT E D T O Y E A R 2 0 0 0 R E A D I N E S S .
Success of our Year 2000 compliance effort depends, in part, on
the success of our key suppliers and customers in dealing with their
Year 2000 issues. We do not have any control over the remediation
efforts of our key suppliers and customers and cannot fully deter-
mine the extent to which they have resolved their Year 2000
compliance issues. We currently purchase several critical compo-
nents from single or sole source vendors. While this issue is being
carefully managed, disruptions in the supply of components from
any of these sole source suppliers due to Year 2000 issues, could
cause delays in our fulfillment of customer orders which could result
in reduced or lost revenues. Furthermore, our sales have historically
been to a limited number of customers. Any disruptions in the pur-
chasing patterns of these customers or potential customers due to
Year 2000 issues could cause a decline in our revenues. If our key
suppliers and customers have year 2000 problems, our business
could be harmed.
Factors That May Affect Future Results
Our operating results may fluctuate significantlywhich may adversely affect our stock price.Our quarterly and annual operating results have fluctuated signifi-
cantly in the past and we expect that they will continue to fluctuate
in the future. This fluctuation is a result of a variety of factors,
including the following:
• unpredictable demand for our products;
• decline in the average selling prices of our products due to
competitive pricing pressures;
• seasonality in sales of our products;
• adverse changes in product and customer mix;
• slower than anticipated market acceptance of new or enhanced
versions of our products;
• competing flash memory card standards which displace the
standards used in our products;
• changes in our distribution channels;
• timing of license and royalty revenue;
• fluctuations in product costs, particularly due to fluctuations in
manufacturing yields and utilization;
• availability of sufficient silicon wafer foundry capacity to meet
customer demand;
• excess capacity of flash memory from our competitors and our
own new flash wafer capacity;
• significant yield losses which could affect our ability to fulfill
customer orders and could increase our costs;
• lengthening in manufacturing cycle times due to our suppliers
operating at peak capacity;
• increased research and development expenses;
• exchange rate fluctuations, particularly the U.S. dollar to
Japanese yen exchange rate;
• changes in general economic conditions, in particular the
economic recession in Japan;
• natural disasters affecting the countries in which we conduct
our business, particularly Taiwan, Japan and the United States;
• difficulty of forecasting and management of inventory levels;
and
• expenses related to obsolescence of unsold inventory.
17S a n D i s k C o r p o r a t i o n
M A N A G E M E N T ’ S D I S C U S S I O N A N D A N A L Y S I S

18 A n n u a l R e p o r t 1 9 9 9
M A N A G E M E N T ’ S D I S C U S S I O N A N D A N A L Y S I S
D I F F I C U LT Y O F E S T I M AT I N G S I L I C O N WA F E R N E E D S
When we order silicon wafers from our foundries, we have to estimate
the number of silicon wafers needed to fill product orders several
months into the future. If we overestimate this number, we will build
excess inventories which could harm our gross margins and operat-
ing results. For example, in the second quarter of 1998, our product
gross margins declined to 12% from 30% in the previous quarter
due in part to a write down of inventory to reflect net realizable
value. If we underestimate the number of silicon wafers needed to
fill product orders, we may be unable to obtain an adequate supply
of wafers which could harm our product revenues. Because our
largest volume product, CompactFlash, is sold into an emerging
consumer market, it has been difficult to accurately forecast future
sales. A substantial majority of our quarterly sales have historically
been from orders received and fulfilled in the same quarter. In addi-
tion, our product order backlog may fluctuate substantially from
quarter to quarter.
A N T I C I PAT E D G R O W T H I N E X P E N S E L E V E L S
We increased our expense levels in 1999 to support our growth. We
expect operating expenses to continue to increase in fiscal 2000 as
a result of the need to hire additional personnel to support expected
growth in sales unit volumes, sales and marketing efforts and
research and development activities, including our proposed collab-
oration with Toshiba providing for the joint development of 512
megabit and 1 gigabit flash memory chips. For example in fiscal
2000, the incremental research and development expenses related
to the proposed Toshiba joint development project are projected to
be in the range of $6 million to $8 million. In addition, we have sig-
nificant fixed costs and we cannot readily reduce these expenses
over the short term. If revenues do not increase proportionately to
operating expenses, or if revenues decrease or do not meet expec-
tations for a particular period, our business, financial condition and
results of operations will be harmed.
VA R I A B I L I T Y O F AV E R A G E S E L L I N G P R I C E S A N D
G R O S S M A R G I N
Our product mix varies quarterly, which affects our overall average
selling prices and gross margins. Our CompactFlash products, which
currently represent the majority of our product revenues, have lower
average selling prices and gross margins than our higher capacity
FlashDisk and FlashDrive products. We believe that sales of
CompactFlash products will continue to represent a significant per-
centage of our product revenues as consumer applications, such as
digital cameras, become more popular. Dependence on
CompactFlash sales, together with lower pricing caused by
increased competition, caused average unit selling prices to decline
22% during fiscal 1999 compared to a decline of 28% during
fiscal 1998. We expect this trend to continue.
VA R I A B I L I T Y O F L I C E N S E F E E S A N D R O YA LT I E S
Our intellectual property strategy is to cross-license our patents to
other manufacturers of flash products. Under these arrangements,
we earn license fees and royalties on individually negotiated terms.
The timing of revenue recognition from these payments is depend-
ent on the terms of each contract and on the timing of product
shipments by the third parties. This may cause license and royalty
revenues to fluctuate significantly from quarter to quarter. Because
these revenues have higher gross margins than product revenues,
gross margins and net income fluctuate significantly with changes
in license and royalty revenues.
In transitioning to new processes and products we face production and market acceptance risks.
G E N E R A L
Successive generations of our products have incorporated
semiconductor devices with greater memory capacity per chip. Two
important factors that enable us to decrease the costs per megabyte
of our flash data storage products are the development of higher
capacity semiconductor devices and the implementation of smaller
geometry manufacturing processes. A number of challenges exist in
achieving a lower cost per megabyte, including:
• overcoming lower yields often experienced in the early
production of new semiconductor devices;
• problems with design and manufacturing of products
that will incorporate these devices; and
• production delays.
Because our products are complex, we periodically experience
significant delays in the development and volume production ramp
up of our products. Similar delays could occur in the future and could
harm our business, financial condition and results of operations.
1 2 8 M E G A B I T T E C H N O L O G Y
We began shipments of 128 megabit products in the second quarter
of 1999. In the third quarter of 1999, we accelerated the produc-
tion ramp up of our 128 megabit flash memory technology to meet
increased demand. In the third quarter of 1999, during the pro-
duction ramp up of our 128 megabit technology, lower than
anticipated yields contributed to a decline in gross margins. If we
experience unplanned yield problems on our 128Mbit technology in
the future, we may be unable to meet our customers’ demand for
high capacity MultiMediaCard and CompactFlash products which
could result in lost sales and reduced revenues. In addition, our
gross margins may be harmed by any problems we encounter in the
production of our 128 megabit flash memory. We plan to decrease
production of our 128 megabit products in the second quarter of
2000 as we ramp up production of our 256 megabit products.
D 2 F L A S H T E C H N O L O G Y
We have developed new products based on D2 flash technology, a
new flash architecture designed to store two bits in each flash mem-
ory cell. High density flash memory, such as D2 flash, is a complex
technology that requires strict manufacturing controls and effective
test screens. Problems encountered in the shift to volume produc-
tion for new flash products could impact both reliability and yields,
and result in increased manufacturing costs and reduced product
availability. We may not be able to manufacture future generations
of our D2 products with yields sufficient to result in lower costs per
megabyte. In fiscal 2000, we expect to increase production of our
256 megabit flash memory technology, which has a lower cost per
megabyte than the 128 megabit technology. If we are unable to
bring future generations of our 256 megabit flash memory into full
production as quickly as planned or if we experience unplanned
yield problems, we will not be able to meet our customers’ fore-
casted demand, which would result in lost sales, reduced revenues
and reduced margins.
M U LT I M E D I A C A R D P R O D U C T S
We expect to increase the MultiMediaCard product family production
volumes in the first quarter of 2000. This product presents new
challenges in assembly and testing. In the third quarter of 1999,
during the MultiMediaCard production startup phase, we experi-
enced fluctuations in yields which reduced MultiMediaCard product
availability, increased manufacturing costs and reduced product
margins for this product family. We are currently unable to meet
customer demand for MultiMediaCard products. This is primarily
due to demand exceeding previous forecasts from our customers
and the lead time required to adjust our levels of manufacturing to
support changes in demand. We have not yet achieved the produc-
tion assembly yields necessary for high volume production.
S E C U R E D I G I TA L M E M O RY C A R D P R O D U C T S
In the third quarter of 1999, we announced a memorandum of
understanding under which we, along with Matsushita and Toshiba,
will jointly develop and promote the Secure Digital Memory Card.
The Secure Digital Memory Card is an enhanced version of our
MultiMediaCard that will incorporate advanced security and copyright
protection features required by the emerging markets for the elec-
tronic distribution of music, video and other copyrighted works. We
expect to begin shipping our Secure Digital Memory Card products in
the second quarter of 2000. Negotiations for a definitive agreement
concerning this collaboration are underway, but we cannot assure
you that these negotiations will be successful or that we, Matsushita
and Toshiba will enter into a definitive agreement.
The Secure Digital Memory Card will incorporate a number of new
features, including SDMI compliant security and copy protection, a
mechanical write protect switch and a high data transfer rate. We
have never built products incorporating these features. Any prob-
lems or delays in establishing production capabilities or ramping up
production volumes of our Secure Digital Memory Card products
could result in lost sales or increased manufacturing costs in 2000.
In addition, we cannot be sure that manufacturers of consumer
electronic products will develop new products that use the Secure
Digital Memory Card. Conversely, broad acceptance of our Secure
Digital Memory Card by consumers may reduce demand for our
MultiMediaCard and CompactFlash card products. See “ — The suc-
cess of our business depends on emerging markets and new products.”
We depend on third party foundries for silicon wafers.All of our products require silicon wafers. We rely on UMC in Taiwan
to supply all of our silicon wafers. We depend on UMC to allocate a
portion of its capacity to our needs, produce acceptable quality
wafers with acceptable manufacturing yields and deliver our wafers
on a timely basis at a competitive price. If UMC is unable to satisfy
these requirements, our business, financial condition and operating
results may suffer. For example, in September 1999, both UMC
foundries producing our flash memory wafers were damaged and
temporarily shut down by an earthquake in Taiwan. As a result,
approximately 10% of our silicon wafers in production at the time
of the earthquake had to be discarded and no new wafers could be
manufactured for 11 days, resulting in the loss or destruction of a
portion of our fourth quarter 1999 wafer supply. Future earth-
quakes, aftershocks or other natural disasters in Taiwan could
preclude us from obtaining an adequate supply of wafers to fill cus-
tomer orders, and could significantly harm our business, financial
condition and results of operations.
19S a n D i s k C o r p o r a t i o n
M A N A G E M E N T ’ S D I S C U S S I O N A N D A N A L Y S I S

20 A n n u a l R e p o r t 1 9 9 9
M A N A G E M E N T ’ S D I S C U S S I O N A N D A N A L Y S I S
Industry-wide demand for semiconductor wafers has increased
significantly due to increased demand in the consumer electronics
and cellular phone markets. Increased demand for advanced tech-
nology silicon wafers is increasing the price of these wafers as
supply becomes constrained. We expect this trend to continue
throughout 2000 which could adversely impact the rate of growth of
our business, either through reduced supply, higher wafer prices or
a combination of the two.
In January 2000, the USIC foundry was merged into UMC. Before
the merger, we owned 10% of USIC, had the right to appoint one of
its directors and were entitled to 12.5% of its total wafer production.
As a result of the merger, we received UMC shares in exchange for
our USIC shares. However, we will not have a right to a seat on the
board of directors of the combined company. We have received
assurances from the senior management of UMC that it intends to
continue to supply us the same wafer capacity at the prices we cur-
rently enjoy under our agreement with USIC. However, there can be
no assurance that we will be able to maintain our current wafer
capacity and competitive pricing arrangement in our future supply
negotiations with UMC.
Under the terms of our wafer supply agreements with UMC, we are
obligated to provide a rolling forecast of anticipated purchase orders
for the next six calendar months. Generally, the estimates for the
first three months of each forecast are binding commitments. The
estimates for the remaining months may only be changed by a cer-
tain percentage from the previous month’s forecast. This limits our
ability to react to fluctuations in demand for our products. For exam-
ple, if customer demand falls below our forecast and we are unable
to reschedule or cancel our wafer orders, we may end up with excess
wafer inventories, which could result in higher operating expenses
and reduced gross margins. Conversely, if customer demand
exceeds our forecasts, we may be unable to obtain an adequate sup-
ply of wafers to fill customer orders, which could result in
dissatisfied customers, lost sales and lower revenues. In addition, in
February 2000, we entered into a capacity and reservation deposit
agreement with UMC. To reserve additional foundry capacity under
this agreement, we paid UMC a reservation deposit. This deposit will
be refunded to us on a quarterly basis over the agreement term, if
we purchase the full wafer capacity reserved for us. We may forfeit
part of our deposit if we are unable to utilize our reserved capacity
within four quarters of the end of the agreement term. If we are
unable to obtain scheduled quantities of wafers with acceptable
price and yields from any foundry, our business, financial condition
and results of operations could be harmed.
The success of our business depends on emergingmarkets and new products.In order for demand for our products to grow, the markets for new
products that use CompactFlash and the MultiMediaCard, such as
portable digital music players and smart phones, must develop and
grow. If sales of these products do not grow, our revenues and profit
margins could level off or decline.
Because we sell our products for use in many new applications, it is
difficult to forecast demand. For example, in 1999, demand for our
32 megabyte capacity MultiMediaCard for use in portable digital
music players grew faster than anticipated and we were unable to
fill all customer orders during the quarter. Although we are increas-
ing production of the MultiMediaCard, if we are unable to fulfill
customer demand for these products in the future, we may lose
sales to our competitors.
S E C U R E D I G I TA L M E M O RY C A R D P R O D U C T S
In the third quarter of 1999, we announced a collaboration under
which we will jointly develop our Secure Digital Memory Card, an
enhanced version of our MultiMediaCard, which will incorporate
advanced security and copyright protection features required by the
emerging markets for the electronic distribution of music, video and
other copyrighted works. We expect to begin shipping our Secure
Digital Memory Cards in 32 and 64 megabyte capacities in the sec-
ond quarter of 2000. The Secure Digital Memory Card is slightly
thicker and uses a different interface than our MultiMediaCard.
Because of these differences, the Secure Digital Memory Card will
not work in current products that include a MultiMediaCard slot. In
order for the market for our Secure Digital Memory Card to develop,
manufacturers of digital audio/video and portable computing prod-
ucts must include a Secure Digital Memory Card compatible slot in
their products and acquire a license to the security algorithms. If
OEMs do not incorporate Secure Digital Memory Card slots in their
products or do not buy our Secure Digital Memory Cards, our busi-
ness, financial condition and results of operations may be harmed.
In addition, consumers may postpone or altogether forego buying
products that utilize our MultiMediaCard and CompactFlash cards
in anticipation of new products that will incorporate the Secure
Digital Memory Card. If this occurs, sales of our MultiMediaCard
and CompactFlash products may be harmed. The main competition
for the Secure Digital Memory Card is expected to come from the
Sony Memory Stick. Sony has substantially greater financial and
other resources than we do and extensive marketing and sales chan-
nels and brand recognition. We cannot assure you that our Secure
Digital Memory Card will be successful in the face of such competition.

In addition, the market for portable digital music players is very new
and it is uncertain how quickly consumer demand for these players
will grow. If this market does not grow as quickly as anticipated or
our customers are not successful in selling their portable digital
music players to consumers, our revenues could be adversely
affected. In addition, it is often the case with new consumer mar-
kets that after an initial period of new market formation and initial
acceptance by early adopters, the market enters a period of slow
growth as standards emerge and infrastructure develops. In the
event that this occurs in the portable digital music player market or
other emerging markets, sales of our products would be harmed.
The success of our new product strategy will depend upon, among
other things, the following:
• our ability to successfully develop new products with higher
memory capacities and enhanced features at a lower cost
per megabyte;
• the development of new applications or markets for our flash
data storage products;
• the extent to which prospective customers design our products
into their products and successfully introduce their products; and
• the extent to which our products or technologies become
obsolete or noncompetitive due to products or technologies
developed by others.
5 1 2 M E G A B I T A N D 1 G I G A B I T S C A L E F L A S H M E M O RY
C A R D P R O D U C T S
In October 1999, we entered into a nonbinding memorandum of
understanding with Toshiba providing for the joint development and
manufacture of 512 megabit and 1 gigabit flash memory chips and
Secure Digital Memory Card controllers. As part of this proposed col-
laboration, we and Toshiba plan to employ Toshiba’s future 0.16
micron and 0.13 micron NAND flash integrated circuit manufactur-
ing technology and SanDisk’s multilevel cell flash and controller
system technology. The development of 512 megabit and 1 gigabit
flash memory chips and Secure Digital Memory Card controllers is
expected to be complex and may incorporate SanDisk and Toshiba
technology that is still under development. We cannot assure you
that we and Toshiba will successfully develop these new products or
the underlying technology, or that any development will be com-
pleted in a timely or cost-effective manner. If we are not successful
in any of the above, our business, financial condition and results of
operations could suffer.
We may be unable to maintain market share.We may be unable to increase our production volumes at a sufficiently
rapid rate so as to maintain our market share. Ultimately, our growth
rate depends on our ability to obtain sufficient flash memory wafers
and other components to meet demand. If we are unable to do so in
a timely manner, we may lose market share to our competitors.
Currently, our supply constraints are forcing some of our largest cus-
tomers to seek alternate sources of supply to meet their growing
flash memory product needs.
Our selling prices may be affected by future excesscapacity in the market for flash memory products.Currently industry wide demand for flash memory products far
exceeds the available supply. This is primarily driven by an explo-
sion in the growth of cellular phones and internet appliances and
the accelerating shift in consumer electronics from analog to digital
devices. This strong demand had manifested itself in improved
bookings visibility and a more stable pricing environment. All major
flash memory suppliers, including SanDisk, are responding to this
strong demand by significantly increasing investments in new
advanced flash memory production capacity due to the broadly held
assumption that our industry is entering a prolonged growth phase
which will be able to absorb the new flash production output. If this
assumption should prove to be erroneous, or if one or several of our
target markets experience delays in anticipated growth, there may
be excess supply in market for our products. This excess capacity,
even if temporary in nature, could cause average selling prices to
drop significantly, thereby adversely impacting our product gross
margins and operating results in future quarters.
Our international operations make us vulnerable tochanging conditions and currency fluctuations.
P O L I T I C A L R I S K S
Currently, all of our flash memory wafers are produced by two UMC
foundries in Taiwan. We also use a third-party subcontractor in Taiwan
for the assembly and testing of our MultiMediaCard products. We may
therefore be affected by the political, economic and military conditions
in Taiwan. Taiwan is currently engaged in various political disputes with
China and both countries have recently conducted military exercises in
or near the other’s territorial waters and airspace. The Taiwanese and
Chinese governments may continue to escalate these disputes, resulting
in an economic embargo, a disruption in shipping routes or even mili-
tary hostilities. This could harm our business by interrupting or delaying
the production or shipment of flash memory wafers or MultiMediaCard
products by our Taiwanese foundries and subcontractor. See “ — We
depend on our suppliers and third party subcontractors.”
21S a n D i s k C o r p o r a t i o n
M A N A G E M E N T ’ S D I S C U S S I O N A N D A N A L Y S I S

22 A n n u a l R e p o r t 1 9 9 9
M A N A G E M E N T ’ S D I S C U S S I O N A N D A N A L Y S I S
In addition, in the second quarter of 1999, we began using a third-
party subcontractor in China for the assembly and testing of our
CompactFlash products. As a result, our business could be harmed
by the effect of political, economic, legal and other uncertainties in
China. Under its current leadership, the Chinese government has
been pursuing economic reform policies, including the encourage-
ment of foreign trade and investment and greater economic
decentralization. The Chinese government may not continue to pur-
sue these policies and, even if it does continue, these policies may
not be successful. The Chinese government may also significantly
alter these policies from time to time. In addition, China does not
currently have a comprehensive and highly developed legal system,
particularly with respect to the protection of intellectual property
rights. As a result, enforcement of existing and future laws and con-
tracts is uncertain, and the implementation and interpretation of
such laws may be inconsistent. Such inconsistency could lead to
piracy and degradation of our intellectual property protection.
E C O N O M I C R I S K S
We price our products primarily in U.S. dollars. As a result, if the
value of the U.S. dollar increases relative to foreign currencies, our
products could become less competitive in international markets.
For example, our products are relatively more expensive in Asia
because of the weakness of many Asian currencies relative to the
US dollar. In addition, we currently invoice some of our customers
in Japanese yen. Therefore, fluctuations in the Japanese yen against
the U.S. dollar could harm our business, financial condition and
results of operations. Similarly, the weakness of the Euro may make
our products less competitive in Europe relative to Japanese flash
memory suppliers.
Our sales are also highly dependent upon global economic conditions.
In fiscal 1998, sales to Japan declined to 31.6% of total product
sales from 38.1% in 1997. In 1999, sales to Japan represented 22.4%
of product revenue. We believe these declines were primarily due to the
Japanese recession.
G E N E R A L R I S K S
Our international business activities could also be limited or
disrupted by any of the following factors:
• the need to comply with foreign government regulation;
• general geopolitical risks such as political and economic
instability, potential hostilities and changes in diplomatic
and trade relationships;
• natural disasters affecting the countries in which we conduct
our business, particularly Taiwan and Japan;
• imposition of regulatory requirements, tariffs, import and
export restrictions and other barriers and restrictions,
particularly in China;
• longer payment cycles and greater difficulty in accounts
receivable collection, particularly as we increase our sales
through the retail distribution channel;
• potentially adverse tax consequences;
• less protection of our intellectual property rights; and
• delays in product shipments due to local customs restrictions.
We depend on our suppliers and third party subcontractors.We rely on our vendors, some of which are sole source suppliers, for
several of our critical components. We do not have long-term supply
agreements with some of these vendors. Our business, financial
condition and operating results could be harmed by delays or reduc-
tions in shipments if we are unable to develop alternative sources or
obtain sufficient quantities of these components. For example, we
rely on UMC for all of our flash memory wafers, and NEC to supply
certain designs of microcontrollers. In September 1999, both UMC
foundries producing our flash memory wafers were damaged and
temporarily shut down by an earthquake in Taiwan. In addition, due
to industry-wide increasing demand for semiconductors, we have
recently experienced resistance to price reductions from some of our
important suppliers. See “—We depend on third party foundries for
silicon wafers.” In addition, we have begun to experience long order
lead times on standard components due to high industry demand.
Shortages of any of these standard components could result in
higher manufacturing costs or lower revenues due to production
delays or reduced product shipments. Additionally, where possible,
we are building buffer inventories of critical components. If we
accumulate excess inventories or these buffer inventories become
obsolete, we will have to write down inventories which will adversely
affect our gross margins and results of operations.
We also rely on third-party subcontractors to assemble and test the
memory components for our products. We have no long-term con-
tracts with these subcontractors and cannot directly control product
delivery schedules. This could lead to product shortages or quality
assurance problems which could increase the manufacturing costs
of our products and have adverse effects on our operating results.
During the second half of 1999, we transferred a substantial portion
of wafer testing, packaged memory final testing, card assembly and
card testing to Silicon Precision Industries Co., Ltd. in Taiwan and
Celestica, Inc. in China. In fiscal 2000, we expect that they will be
assembling and testing a majority of our mature, high-volume prod-
ucts. This increased reliance on subcontractors is expected to
reduce manufacturing costs and give us access to increased pro-
duction capacity. During the transition period, we will continue full
operations at our Sunnyvale production facility while simultaneously
transferring test equipment and training personnel of our subcon-
tractors. However, we do not have sufficient duplicative production
testing equipment at Sunnyvale and at our subcontractors. Therefore,
any significant problems in this complex transfer of operations may
result in a disruption of production and a shortage of product to meet
customer demand in the first half of 2000 and beyond.
Continuing declines in our average sales pricesmay result in declines in our gross margins.In 1999, the average unit selling prices of our products declined
22% compared to 1998. In 1999, the average price per megabyte
shipped declined 52% compared to 1998. Because flash data stor-
age markets are characterized by intense competition and price
reductions for our products are necessary to meet consumer price
points, we expect that market-driven pricing pressures will continue.
This will likely result in a further decline in average sales prices for
our products. We believe that we can offset declining average sales
prices by achieving manufacturing cost reductions and developing
new products that incorporate more advanced technology, include
more advanced features and can be sold at stable average gross
margins despite continued declines in average selling price per
megabyte. However, if we are unable to achieve such cost reduc-
tions and technological advances, this could result in lost sales and
declining gross margins, and as a result, our business, financial
condition and results of operations could suffer.
The semiconductor industry is cyclical and we believe it is currently
in a recovery from one of its most severe down cycles. During most
of 1997 and 1998, the semiconductor industry experienced signif-
icant production over capacity, which reduced margins for
substantially all flash memory suppliers. Currently, the markets for
our products are supply constrained and our selling prices have
stayed relatively stable. There can be no assurance that this trend
will continue throughout 2000.
Our markets are highly competitive.
F L A S H M E M O RY M A N U FA C T U R E R S A N D
M E M O RY C A R D A S S E M B L E R S
We compete in an industry characterized by intense competition,
rapid technological changes, evolving industry standards, declining
average selling prices and rapid product obsolescence. Our
competitors include many large domestic and international compa-
nies that have greater access to advanced wafer foundry capacity,
substantially greater financial, technical, marketing and other
resources, broader product lines and longer standing relationships
with customers. Our primary competitors include:
• storage flash chip producers, such as Hitachi Ltd., Samsung
Electronics Company Ltd. and Toshiba Corporation;
• socket flash, linear flash and component manufacturers, such
as Advanced Micro Devices, Inc., Atmel Corporation, Intel
Corporation, Macronix International Co., Ltd., Micron
Technology, Inc., Mitsubishi Electronic Corporation, Sharp
Electronics Corporation and STMicroelectronics NV; and
• module or card assemblers, such as Lexar Media, Inc., M-Systems,
Inc., Pretec Electronics Corp., Simple Technology Inc., Sony
Corporation, Kingston Technology Company, Panasonic Consumer
Electronic Company, Silicon Storage Technology, Inc., TDK
Corporation, Matsushita Battery, Inc. Delkin Devices, Inc., Silicon
Tek and Viking Components, Inc., who combine controllers and
flash memory chips developed by others into flash storage cards.
In addition, over 25 companies have been certified by the
CompactFlash Association to manufacture and sell their own brand
of CompactFlash. We believe additional manufacturers will enter the
CompactFlash market in the future.
We have announced a memorandum of understanding under which
we, Matsushita and Toshiba will jointly develop and promote a next
generation flash memory card called the Secure Digital Memory
Card. Under this agreement, Secure Digital Memory Card licenses
will be granted to other flash memory card manufacturers, which
will increase the competition for our Secure Digital Memory Card,
CompactFlash and MultiMediaCard products. In addition,
Matsushita and Toshiba will sell Secure Digital Memory Cards that
will compete directly with our products. Other flash card manufac-
turers will be required to pay the SD Association license fees and
royalties which will be shared between Matsushita, Toshiba and
SanDisk. There will be no royalties or license fees payable among
the three companies for their respective sales of the Secure Digital
Memory Card. Thus, we will forfeit potential royalty income from
Secure Digital Memory Card sales by Matsushita and Toshiba.
23S a n D i s k C o r p o r a t i o n
M A N A G E M E N T ’ S D I S C U S S I O N A N D A N A L Y S I S
24 A n n u a l R e p o r t 1 9 9 9
M A N A G E M E N T ’ S D I S C U S S I O N A N D A N A L Y S I S
In October 1999, we entered into a nonbinding memorandum of
understanding with Toshiba providing for the joint development and
manufacture of 512 megabit and 1 gigabit flash memory chips and
Secure Digital Memory Card controllers. We and Toshiba will each
separately market and sell any products developed and manufactured
under this relationship. Accordingly, we will compete directly with
Toshiba for sales of these advanced chips and controllers.
We have entered into patent cross-license agreements with several
of our leading competitors including, Hitachi, Samsung, Toshiba,
Intel and Sharp. Under these agreements, each party may manu-
facture and sell products that incorporate technology covered by the
other party’s patents related to flash memory devices. As we con-
tinue to license our patents to certain of our competitors,
competition will increase and may harm our business, financial con-
dition and results of operations. Currently, we are engaged in
licensing discussions with several of our competitors. There can be
no assurance that we will be successful in concluding licensing
agreements under terms which are favorable to us.
A LT E R N AT I V E S T O R A G E M E D I A
Competing products have been introduced that promote industry
standards that are different from our CompactFlash and
MultiMediaCard products, including Toshiba’s SmartMedia, Sony
Corporation’s Memory Stick, Sony’s standard floppy disk used for
digital storage in its Mavica digital cameras, Panasonic’s Mega
Storage cards, Iomega’s Clik drive, a miniaturized, mechanical,
removable disk drive, M-Systems’ Diskonchip for embedded storage
applications and the Secure MultiMediaCard from Hitachi and
Infineon. Each competing standard is mechanically and
electronically incompatible with CompactFlash and
MultiMediaCard. If a manufacturer of digital cameras or other con-
sumer electronic devices designs in one of these alternative
competing standards, CompactFlash or MultiMediaCard will be
eliminated from use in that product.
In September 1998, IBM introduced the microdrive, a rotating disk
drive in a Type II CompactFlash format. This product competes
directly with our Type II CompactFlash memory cards for use in
high-end professional digital cameras. In October 1998, M-Systems
introduced their Diskonchip 2000 Millennium product which com-
petes against our Flash ChipSet products in embedded storage
applications such as set top boxes and networking appliances.
According to independent industry analysts, Sony’s Mavica digital
camera captured a considerable portion of the United States market
for digital cameras in 1998 and 1999. The Mavica uses a standard
floppy disk to store digital images and therefore uses no
CompactFlash, or any other flash cards. Our sales prospects for
CompactFlash cards have been adversely impacted by the success
of the Mavica. Recently, Sony has shifted its focus to the use of its
flash Memory Stick in its latest digital camera models.
Our MultiMediaCard products also have faced significant competition
from Toshiba’s SmartMedia flash cards and we expect to face simi-
larly significant competition from Sony’s Memory Stick. Sony has
licensed its proprietary Memory Stick to other companies. If it is
adopted and achieves widespread use in future products, sales of
our MultiMediaCard and CompactFlash products may decline.
Recently, Hitachi, Infineon, Sanyo and Fujitsu have proposed their
Secure MultiMediaCard which provides the copy protection function
that is included in our Secure Digital Memory Card. Should this ini-
tiative gain industry wide acceptance, it may reduce the widespread
adoption of the Secure Digital Memory Card.
A LT E R N AT I V E F L A S H T E C H N O L O G I E S
We also face competition from products based on multilevel cell
flash technology such as Intel’s 64 megabit and 128 megabit
StrataFlash chips and Hitachi’s 256 megabit multilevel cell flash
chip. These products compete with our D2 multilevel cell flash
technology. Multilevel cell flash is a technological innovation that
allows each flash memory cell to store two bits of information
instead of the traditional single bit stored by the industry standard
flash technology. In the second quarter of 1999, Intel announced
their new 128 megabit multilevel cell chip and Hitachi began ship-
ping customer samples of CompactFlash cards employing their new
multilevel cell flash chip. In addition, Toshiba has begun customer
shipments of 32 megabyte SmartMedia cards employing their new
256 megabit flash chip. Although Toshiba has not incorporated mul-
tilevel cell flash technology in their 256 megabit flash chip, their
use of more advanced lithographic design rules may allow them to
achieve a more competitive cost structure than that of our 256
megabit D2 flash chip.
Furthermore, we expect to face competition from existing competitors
and from other companies that may enter our existing or future mar-
kets that have similar or alternative data storage solutions which
may be less costly or provide additional features. Price is an impor-
tant competitive factor in the market for consumer products.
Increased price competition could lower gross margins if our average
selling prices decrease faster than our costs and could also result in
lost sales.

Our business depends upon consumer products.In 1999, we received more product revenue and shipped more units of
products destined for consumer electronics applications, principally
digital cameras, than for any other application. We believe that these
products will encounter intense competition and be more price sensi-
tive than products sold into our other target markets. In addition, we
must spend more on marketing and promotion in consumer markets to
establish brand name recognition and preference.
A significant portion of sales to the consumer electronics market is
made through distributors and to retailers. Sales through these chan-
nels typically include rights to return unsold inventory. As a result,
we do not recognize revenue until after the product has been sold to
the end user. If our distributors and retailers are not successful in
this market, there could be substantial product returns, which would
harm our business, financial condition and results of operations.
Sales to a small number of customers represent a significant portion of our revenues.More than half of our revenues come from a small number of
customers. For example, sales to our top 10 customers accounted
for approximately 57%, 59%, and 67%, respectively, of our product
revenues for 1999, 1998, and 1997. In fiscal 1999, one customer
accounted for more than 10% of product sales. In fiscal year 1998,
two customers each accounted for 10% or more of our product
sales. If we were to lose any of these customers or experience any
material reduction in orders from these customers, our revenues and
operating results would suffer. Our sales are generally made by
standard purchase orders rather than long-term contracts. In addi-
tion, the composition of our major customer base changes from year
to year as the market demand for our customers’ products change.
Our multiple sales channels may compete for alimited number of customer sales.Web based sales of our products today represent a small but growing
portion of our overall sales. Sales on the Internet tend to undercut
the traditional distribution channels and may dramatically change
the way our consumer products are purchased in future years. We
cannot assure you that we will successfully manage the inherent
channel conflicts between our retail channel customers and cus-
tomers that wish to purchase directly on the Internet.
There is seasonality in our business.Sales of our products, in particular the sale of CompactFlash
products, in the consumer electronics applications market may be
subject to seasonality. As a result, product sales may be impacted by
seasonal purchasing patterns with higher sales generally occurring in
the second half of each year. In addition, in the past we have
experienced a decrease in orders in the first quarter from our
Japanese OEM customers primarily because most customers in
Japan operate on a fiscal year ending in March and prefer to delay
purchases until the beginning of their next fiscal year. For example,
our product revenues were 24% lower in the first quarter of 1998
than in the fourth quarter of 1997, mostly due to these seasonal fac-
tors. Although we did not experience this seasonality in the first
quarter of 1999 and are not able to fulfill all demand from our
Japanese customers in the first quarter of 2000, we cannot assure
you that we will not experience seasonality in the future.
We must achieve acceptable wafer manufacturing yields.The fabrication of our products requires wafers to be produced in a
highly controlled and ultra clean environment. Semiconductor com-
panies that supply our wafers sometimes have experienced
problems achieving acceptable wafer manufacturing yields.
Semiconductor manufacturing yields are a function of both our
design technology and the foundry’s manufacturing process tech-
nology. Low yields may result from design errors or manufacturing
failures. Yield problems may not be determined or improved until an
actual product is made and can be tested. As a result, yield prob-
lems may not be identified until the wafers are well into the
production process. The risks associated with yields are even greater
because we rely on independent offshore foundries for our wafers
which increases the effort and time required to identify, communi-
cate and resolve manufacturing yield problems. If the foundries
cannot achieve the planned yields, this will result in higher costs
and reduced product availability, and could harm our business,
financial condition and results of operations.
Under the terms of our nonbinding memorandum of understanding
with Toshiba, we and Toshiba will jointly form and fund a joint ven-
ture which will equip and operate a silicon wafer manufacturing line
in Virginia to manufacture 512 megabit and 1 gigabit flash memory
chips and Secure Digital Memory Card controllers. However, we can-
not assure you that this manufacturing line will produce satisfactory
quantities of wafers with acceptable prices and yields. Any failure in
this regard could materially harm our business, financial condition
and results of operations. In addition, the construction and opera-
tion of this line will cause us to incur significant expense and may
result in the diversion of resources from other important areas of
business. We cannot assure you that we or Toshiba will be able to
secure sufficient funding to support this manufacturing line. In
addition, we have no experience in operating a wafer manufacturing
25S a n D i s k C o r p o r a t i o n
M A N A G E M E N T ’ S D I S C U S S I O N A N D A N A L Y S I S
26 A n n u a l R e p o r t 1 9 9 9
M A N A G E M E N T ’ S D I S C U S S I O N A N D A N A L Y S I S
line and we cannot assure you that we will be successful in operat-
ing it on a cost-effective basis or at all.
Risks associated with patents, proprietary rightsand related litigation.
G E N E R A L
We rely on a combination of patents, trademarks, copyright and
trade secret laws, confidentiality procedures and licensing arrange-
ments to protect our intellectual property rights. In the past, we
have been involved in significant disputes regarding our intellectual
property rights and claims that we may be infringing third parties’
intellectual property rights. We expect that we may be involved in
similar disputes in the future. We cannot assure you that:
• any of our existing patents will not be invalidated;
• patents will be issued for any of our pending applications;
• any claims allowed from existing or pending patents will
have sufficient scope or strength;
• our patents will be issued in the primary countries where
our products are sold in order to protect our rights and
potential commercial advantage; or
• any of our products may infringe on the patents of
other companies.
In addition, our competitors may be able to design their products
around our patents.
We intend to vigorously enforce our patents but we cannot be sure
that our efforts will be successful. If we were to have an adverse
result in any litigation, we could be required to pay substantial dam-
ages, cease the manufacture, use and sale of infringing products,
expend significant resources to develop non-infringing technology,
discontinue the use of certain processes or obtain licenses to the
infringing technology. Any litigation is likely to result in significant
expense to us, as well as divert the efforts of our technical and man-
agement personnel. For example the Lexar litigation described
below has resulted in cumulative litigation expenses of approxi-
mately $1.3 million.
C R O S S - L I C E N S E S A N D I N D E M N I F I C AT I O N O B L I G AT I O N S
If we decide to incorporate third party technology into our products
or if we are found to infringe on others’ intellectual property, we
could be required to license intellectual property from a third party.
We may also need to license some of our intellectual property to
others in order to enable us to obtain cross-licenses to third party
patents. Currently, we have patent cross-license agreements with
several companies, including Hitachi, Intel, Samsung, Sharp and
Toshiba and we are in discussions with other companies regarding
potential cross-license agreements. We cannot be certain that
licenses will be offered when we need them, or that the terms
offered will be acceptable. If we do obtain licenses from third par-
ties, we may be required to pay license fees or royalty payments. In
addition, if we are unable to obtain a license that is necessary to the
manufacture of our products, we could be required to suspend the
manufacture of products or stop our wafer suppliers from using
processes that may infringe the rights of third parties. We cannot
assure you that we would be successful in redesigning our products or
that the necessary licenses will be available under reasonable terms.
We have historically agreed to indemnify various suppliers and
customers for alleged patent infringement. The scope of such
indemnity varies, but may, in some instances, include indemnifica-
tion for damages and expenses, including attorney’s fees. We may
periodically engage in litigation as a result of these indemnification
obligations. We are not currently engaged in any such indemnifica-
tion proceedings. Our insurance policies exclude coverage for third
party claims for patent infringement. Any future obligation to
indemnify our customers or suppliers could harm our business,
financial condition or results of operations.
L I T I G AT I O N R I S K S A S S O C I AT E D W I T H
O U R I N T E L L E C T U A L P R O P E RT Y
From time to time, it may be necessary to initiate litigation against
third parties to preserve our intellectual property rights. These par-
ties could in turn bring suit against us. For example, in March 1998
we filed a complaint in federal court against Lexar Media, Inc. for
infringement of one of our flash card patents. Lexar disputed this
claim and asserted that our patent was invalid or unenforceable, as
well as asserting various counterclaims including unfair competi-
tion, violation of the Lanham Act, patent misuse, interference with
prospective economic advantage, trade defamation and fraud. We
have denied all of these counterclaims. In July 1998, the court
denied Lexar’s request to have the case dismissed. Discovery in this
suit began in August 1998. On February 22, 1999, the court con-
sidered arguments and papers submitted by the parties regarding

the scope and proper interpretation of the asserted claims in our
patent at issue in the Lexar suit. On March 4, 1999, the court
issued its ruling on the proper construction of the claim terms in our
patent. On July 30, 1999, we filed a motion for partial summary
judgment that Lexar CompactFlash and PC Cards contributorily
infringe our patent. Lexar filed a motion for summary judgement
that our patent is invalid in view of prior art. A hearing on both of
these motions was held on March 17, 2000. Both matters were
taken under submission by the court and we are waiting for the
court’s order on both motions. In August 1999, we had a mandatory
settlement meeting with Lexar. No settlement was reached through
this meeting. A trial date has not yet been set.
Our rapid growth may strain our operations.We are currently experiencing rapid growth, which has placed, and
continues to place, a significant strain on our personnel and other
resources. To accommodate this growth, we must continue to hire,
train, motivate and manage our employees. We are having difficulty
hiring the necessary engineering, sales and marketing personnel to
support our growth. In addition, we must make a significant invest-
ment in our existing internal information management systems to
support increased manufacturing, as well as accounting and other
management related functions. Our systems, procedures and controls
may not be adequate to support our rapid growth, which could in turn
harm our business, financial condition and results of operations.
Our success depends on key personnel, includingour executive officers, the loss of whom could disrupt our business.Our success greatly depends on the continued contributions of our
senior management and other key research and development, sales,
marketing and operations personnel, including Dr. Eli Harari, our
founder, President and Chief Executive Officer. Our success will also
depend on our ability to recruit additional highly skilled personnel.
We cannot assure you that we will be successful in hiring or retain-
ing such key personnel, or that any of our key personnel will remain
employed with us.
Anti-takeover provisions in our charter documents,stockholder rights plan and in Delaware law couldprevent or delay a change in control and, as aresult, negatively impact our stockholders.We have taken a number of actions that could have the effect of
discouraging a takeover attempt. For example, we have adopted a
stockholder rights plan that would cause substantial dilution to
a stockholder who attempts to acquire us on terms not approved by
our board of directors. In addition, our certificate of incorporation
grants the board of directors the authority to fix the rights, preferences
and privileges of and issue up to 4,000,000 shares of preferred
stock without stockholder action. Although we have no present
intention to issue shares of preferred stock, such an issuance could
have the effect of making it more difficult and less attractive for a
third party to acquire a majority of our outstanding voting stock.
Preferred stock may also have other rights, including economic
rights senior to the common stock that could have a material
adverse effect on the market value of the common stock. In addi-
tion, we are subject to the anti-takeover provisions of Section 203
of the Delaware General Corporation Law. This section provides that
a corporation shall not engage in any business combination with any
interested stockholder during the three-year period following the
time that such stockholder becomes an interested stockholder. This
provision could have the effect of delaying or preventing a change
of control of SanDisk.
Our stock price has been, and may continue to be, volatile.The market price of our stock has fluctuated significantly in the past
and is likely to continue to fluctuate in the future. For example in the
twelve month period ending December 31, 1999 our stock price has
fluctuated from a low of $6.25 to a high of $50.31. We believe that
such fluctuations will continue as a result of future announcements
concerning us, our competitors or principal customers regarding tech-
nological innovations, new product introductions, governmental
regulations, litigation or changes in earnings estimates by analysts. In
addition, in recent years the stock market has experienced significant
price and volume fluctuations and the market prices of the securities
of high technology companies have been especially volatile, often for
reasons outside the control of the particular companies. These fluctu-
ations, as well as general economic, political and market conditions
may have an adverse affect on the market price of our common stock.
Market Risk Disclosure Information
I N T E R E S T R AT E R I S K
Our exposure to market risk for changes in interest rates relates
primarily to our investment portfolio. The primary objective of our
investment activities is to preserve principal while maximizing yields
without significantly increasing risk. This is accomplished by invest-
ing in widely diversified short-term investments, consisting primarily
of investment grade securities, substantially all of which either
mature within the next twelve months or have characteristics of
short-term investments. A hypothetical 50 basis point increase in
interest rates would result in an approximate $950,000 decline (less
than 0.32%) in the fair value of our available-for-sale securities.
27S a n D i s k C o r p o r a t i o n
M A N A G E M E N T ’ S D I S C U S S I O N A N D A N A L Y S I S
28 A n n u a l R e p o r t 1 9 9 9
M A N A G E M E N T ’ S D I S C U S S I O N A N D A N A L Y S I S
F O R E I G N C U R R E N C Y R I S K
A substantial majority of our revenue, expense and capital purchasing
activities are transacted in U.S. dollars. However, we do enter into
transactions in other currencies, primarily the Japanese Yen. To pro-
tect against reductions in value and the volatility of future cash flows
caused by changes in foreign exchange rates, we have established a
hedging program. Currency forward contracts are utilized in these
hedging programs. Our hedging programs reduce, but do not always
entirely eliminate, the impact of foreign currency exchange rate
movements. An adverse change of 10% in exchange rates would
result in a decline in income before taxes of approximately $575,000.
All of the potential changes noted above are based on sensitivity
analysis performed on our financial positions at December 31, 1999.

D e c e m b e r 3 1 , 1 9 9 9 1 9 9 8
ASSETS
Current assets:
Cash and cash equivalents $ 146,170 $ 15,384
Short-term investments 311,049 119,074
Accounts receivable, net of allowance for doubtful accounts of $1,871 in 1999 and $1,069 in 1998 52,434 18,818
Inventories 35,679 8,922
Deferred tax assets 17,000 15,900
Prepaid expenses and other current assets 6,058 8,276
Total current assets 568,390 186,374
Property and equipment, net 31,788 17,542
Investment in foundry 51,208 51,208
Deposits and other assets 6,338 617
Total assets $ 657,724 $ 255,741
LIABILITIES AND STOCKHOLDERS’ EQUITY
Current liabilities:
Accounts payable $ 30,734 $ 6,938
Accrued payroll and related expenses 8,259 3,768
Income taxes payable 5,843 4,668
Other accrued liabilities 11,378 5,077
Deferred revenue 29,383 27,452
Total current liabilities 85,597 47,903
Commitments and contingencies
Stockholders’ equity:
Preferred stock, $0.001 par value
Authorized shares: 4,000,000
Issued: none — —
Common stock, $0.001 par value
Authorized shares: 125,000,000
Issued and outstanding: 65,248,308 in 1999 and 53,256,220 in 1998 65 54
Capital in excess of par value 524,066 186,066
Retained earnings 47,797 21,247
Accumulated other comprehensive income 199 471
Total stockholders’ equity 572,127 207,838
Total liabilities and stockholders’ equity $ 657,724 $ 255,741
The accompanying notes are an integral part of these consolidated financial statements
29S a n D i s k C o r p o r a t i o n
S A N D I S K C O R P O R A T I O N C O N S O L I D A T E D B A L A N C E S H E E T S
( I n t h o u s a n d s , e x c e p t s h a r e a n d p e r s h a r e a m o u n t s )

30 A n n u a l R e p o r t 1 9 9 9
S A N D I S K C O R P O R A T I O N C O N S O L I D A T E D S T A T E M E N T S O F I N C O M E
( I n t h o u s a n d s , e x c e p t p e r s h a r e d a t a )
Ye a r s E n d e d D e c e m b e r 3 1 , 1 9 9 9 1 9 9 8 1 9 9 7
Revenues
Product $ 205,770 $ 103,190 $ 105,675
License and royalty 41,220 32,571 19,578
Total revenues 246,990 135,761 125,253
Cost of revenues 152,143 80,311 72,280
Gross profits 94,847 55,450 52,973
Operating expenses
Research and development 26,883 18,174 13,577
Sales and marketing 25,294 16,933 12,568
General and administrative 12,585 7,533 7,148
Total operating expenses 64,762 42,640 33,293
Operating income 30,085 12,810 19,680
Interest income 8,280 5,307 3,661
Other income (loss), net 1,261 374 ( 1 )
Income before taxes 39,626 18,491 23,340
Provision for income taxes 13,076 6,655 3,501
Net income $ 26,550 $ 11,836 $ 19,839
Net income per share
Basic $ 0.48 $ 0.23 $ 0.43
Diluted $ 0.43 $ 0.21 $ 0.40
Shares used in computing net income per share
Basic 55,834 52,596 45,760
Diluted 61,433 55,344 49,940
The accompanying notes are an integral part of these consolidated financial statements

AccumulatedCapital In Other TotalExcess of Retained Comprehensive Stockholders
Shares Amount Par Value Earnings Income Equity
Balance at December 31, 1996 44,654 $ 45 $98,188 $ ( 10,428 ) $ 5 $ 87,810
Net income — — — 19,839 — 19,839
Unrealized gain on available for sale securities — — — — 37 37
Comprehensive Income 19,876
Exercise of stock options for cash 714 1 583 — — 584
Issuance of stock pursuant to
employee stock purchase plan 252 — 1,189 — — 1,189
Net exercise of common stock warrants 110 — — — — —
Sale of common stock, net of issuance costs 6,000 6 79,411 — — 79,417
Income tax benefit from stock options exercised — — 2,498 — — 2,498
Balance at December 31, 1997 51,730 52 181,869 9,411 42 191,374
Net income — — — 11,836 — 11,836
Unrealized gain on available for sale securities — — — — 429 429
Comprehensive income 12,265
Exercise of stock options for cash 1,260 1 929 — — 930
Issuance of stock pursuant to
employee stock purchase plan 260 1 1,474 — — 1,475
Net exercise of common stock warrants 6 — — — — —
Income tax benefit from stock options exercised — — 1,761 — — 1,761
Compensation expense related to
modification of stock options — — 33 — — 33
Balance at December 31, 1998 53,256 54 186,066 21,247 471 207,838
Net income — — — 26,550 — 26,550
Unrealized loss on available for sale securities — — — — ( 272 ) ( 272 )
Comprehensive income 26,278
Exercise of stock options for cash 1,766 2 6,107 — — 6,109
Issuance of stock pursuant to
employee stock purchase plan 268 — 1,807 — — 1,807
Net exercise of common stock warrants 58 — — — — —
Sale of common stock, net of issuance costs 9,900 9 320,277 — — 320,286
Income tax benefit from stock options exercised — — 9,809 — — 9,809
Balance at December 31, 1999 65,248 $ 65 $ 524,066 $ 47,797 $ 199 $ 572,127
The accompanying notes are an integral part of these consolidated financial statements
31S a n D i s k C o r p o r a t i o n
S A N D I S K C O R P O R A T I O N C O N S O L I D A T E D S T A T E M E N T S O F S T O C K H O L D E R S ’ E Q U I T Y
( I n t h o u s a n d s )
Common Stock

32 A n n u a l R e p o r t 1 9 9 9
S A N D I S K C O R P O R A T I O N C O N S O L I D A T E D S T A T E M E N T S O F C A S H F L O W S
( I n t h o u s a n d s )
Ye a r s E n d e d D e c e m b e r 3 1 , 1 9 9 9 1 9 9 8 1 9 9 7
Cash flows from operating activities:
Net income $ 26,550 $ 11,836 $ 19,839
Adjustments to reconcile net income to net cash
provided by operating activities:
Depreciation 7,145 5,839 3,985
Deferred tax asset ( 1,100 ) 1,160 ( 16,055 )
Compensation related to modification of
stock option terms — 33 —
Changes in assets and liabilities:
Accounts receivable ( 33,616 ) ( 247 ) ( 7,643 )
Inventories ( 26,757 ) 6,726 ( 6,018 )
Prepaid expenses and other current assets 2,959 ( 6,089 ) ( 946 )
Deposits and other assets ( 5,721 ) 283 ( 9 )
Accounts payable 23,796 ( 7,174 ) 6,516
Accrued payroll and related expenses 4,491 ( 906 ) 1,817
Income taxes payable 10,984 2,617 4,495
Other accrued liabilities 6,301 1,548 990
Deferred revenue 1,931 ( 515 ) 22,315
Total adjustments ( 9,587 ) 3,275 9,447
Net cash provided by operating activities 16,963 15,111 29,286
Cash flows from investing activities:
Purchases of short-term investments ( 332,379 ) ( 137,822 ) ( 148,954 )
Proceeds from short-term investments 139,391 133,214 89,919
Acquisition of property and equipment ( 21,391 ) ( 7,489 ) ( 9,592 )
Investment in foundry — ( 10,923 ) ( 40,284 )
Net cash used in investing activities ( 214,379 ) ( 23,020 ) ( 108,911 )
Cash flows from financing activities:
Sale of common stock and warrants 328,202 2,405 81,190
Net cash provided by financing activities 328,202 2,405 81,190
Net increase (decrease) in cash and cash equivalents 130,786 ( 5,504 ) 1,565
Cash and cash equivalents at beginning of year 15,384 20,888 19,323
Cash and cash equivalents at end of year $ 146,170 $ 15,384 $ 20,888
Supplemental disclosure of cash flow information:
Cash paid for income taxes $ 4,306 $ 8,277 $ 15,172
The accompanying notes are an integral part of these consolidated financial statements

NOTE 1: Organization and Summary of SignificantAccounting Policies
O R G A N I Z AT I O N A N D N AT U R E O F O P E R AT I O N S
SanDisk Corporation (the Company) was incorporated in Delaware
on June 1, 1988, to design, manufacture, and market industry-stan-
dard, solid-state mass storage products using proprietary,
high-density flash memory technology. The Company operates in
one segment and serves customers in the consumer electronics,
industrial, communications and highly portable computing markets.
Principal geographic markets for the Company’s products include
the United States, Japan, Europe and the Far East.
S U P P L I E R A N D C U S T O M E R C O N C E N T R AT I O N S
A limited number of customers historically have accounted for a
substantial portion of the Company’s revenues. In each of 1999 and
1998, one customer accounted for more than 10% of total rev-
enues. In 1997, no single customer accounted for greater than 10%
of total revenues. Sales of the Company’s products will vary as a
result of fluctuations in market demand. Further, the flash data stor-
age markets in which the Company competes are characterized by
rapid technological change, evolving industry standards, declining
average selling prices and rapid technological obsolescence.
Certain of the raw materials used by the Company in the manufacture
of its products are available from a limited number of suppliers. For
example, all of the Company’s products require silicon wafers which
are currently supplied by United Microelectronics Corporation
(“UMC”) in Taiwan. The Company is dependent on its foundries to
allocate to the Company a portion of their foundry capacity suffi-
cient to meet the Company’s needs, to produce wafers of acceptable
quality and with acceptable manufacturing yields and to deliver
those wafers to the Company on a timely basis. On occasion, the
Company has experienced difficulties in each of these areas.
Under each of the Company’s wafer supply agreements, the
Company is obligated to provide a monthly rolling forecast of antic-
ipated purchase orders. Except in limited circumstances and
subject to acceptance by the foundries, the estimates for the first
three months of each forecast constitute a binding commitment and
the estimates for the remaining months may not increase or
decrease by more than a certain percentage from the previous
month’s forecast. These restrictions limit the Company’s ability to
react to significant fluctuations in demand for its products. As a
result, the Company has not been able to match its purchases of
wafers to specific customer orders, and therefore the Company has
taken write downs for potential excess inventory purchased prior to
the receipt of customer orders and may be required to do so in the
future. These adjustments decrease gross margins in the quarter
reported and have resulted, and could in the future result in fluctu-
ations in gross margins on a quarter to quarter basis. To the extent
the Company inaccurately forecasts the number of wafers required,
it may have either a shortage or an excess supply of wafers, either
of which could have a material adverse effect on the Company’s
business, financial condition and results of operations. Additionally, if
the Company is unable to obtain scheduled quantities of wafers from
any foundry with acceptable yields, the Company’s business, financial
condition and results of operations could be negatively impacted.
In addition, certain key components are purchased from single
source vendors for which alternative sources are currently not avail-
able. Shortages could occur in these essential materials due to an
interruption of supply or increased demand in the industry. If the
Company were unable to procure certain of such materials, it would
be required to reduce its manufacturing operations which could
have a material adverse effect upon its results of operations. We also
rely on third-party subcontractors to assemble and test the memory
components for our products. We have no long-term contracts with
these subcontractors and cannot directly control product delivery
schedules. This could lead to product shortages or quality assurance
problems which could increase the manufacturing costs of our prod-
ucts and have adverse effects on our operating results.
U S E O F E S T I M AT E S
The preparation of financial statements in conformity with generally
accepted accounting principles requires management to make esti-
mates and assumptions that affect the amounts reported in the
financial statements and accompanying notes. Actual results could
differ from those estimates.
B A S I S O F P R E S E N TAT I O N
The Company’s fiscal year ends on the Sunday closest to December, 31.
Fiscal year 1999 ended on January 2, 2000 and was 53 weeks in
length. Fiscal years 1998 and 1997 ended on December 27, 1998
and December 28, 1997, respectively, and were each 52 weeks in
length. For ease of presentation, the accompanying financial statements
have been shown as ending on the last day of the calendar month.
33S a n D i s k C o r p o r a t i o n
N O T E S T O C O N S O L I D A T E D F I N A N C I A L S T A T E M E N T S

34 A n n u a l R e p o r t 1 9 9 9
N O T E S T O C O N S O L I D A T E D F I N A N C I A L S T A T E M E N T S
P R I N C I P L E S O F C O N S O L I D AT I O N
The consolidated financial statements include the accounts of the
Company and its wholly owned subsidiaries. All significant inter-
company balances and transactions have been eliminated.
F O R E I G N C U R R E N C Y T R A N S A C T I O N S
Foreign operations are measured using the U.S. dollar as the
functional currency. Accordingly, monetary accounts (principally
cash, accounts receivable and liabilities) are remeasured using the
foreign exchange rate at the balance sheet date. Operations
accounts and nonmonetary balance sheet accounts are remeasured at
the rate in effect at the date of transaction. The effects of foreign cur-
rency remeasurement are reported in current operations. See Note 2.
R E C L A S S I F I C AT I O N S
Certain reclassifications have been made to prior year’s amounts to
conform to the current year’s presentation.
C A S H E Q U I VA L E N T S A N D S H O RT- T E R M I N V E S T M E N T S
Cash equivalents consist of short-term, highly liquid financial
instruments with insignificant interest rate risk that are readily con-
vertible to cash and have maturities of three months or less from the
date of purchase. Cash equivalents and short-term investments con-
sist of money market funds, taxable commercial paper, U.S.
government agency obligations, corporate / municipal notes and
bonds with high-credit quality, money market preferred stock and
auction rate preferred stock. The fair market value, based on quoted
market prices, of cash equivalents and short-term investments is
substantially equal to their carrying value at December 31, 1999
and 1998.
Under FAS 115, management classifies investments as available-
for-sale at the time of purchase and periodically reevaluates such
designation. Debt securities classified as available-for-sale are
reported at fair value. Unrecognized gains or losses on available-for-
sale securities are included, in equity until their disposition.
Realized gains and losses and declines in value judged to be other
than temporary on available-for-sale securities are included in inter-
est income. The cost of securities sold is based on the specific
identification method.
All cash equivalents and short-term investments as of December 31,
1999 and 1998 are classified as available-for-sale securities and
consist of the following:
Unrealized holding losses and gains on available-for-sale securities
at December 31, 1999 and 1998 were ($536,000) and $471,000,
respectively. Gross realized gains and losses on sales of available-
for-sale securities during the years ended December 31, 1999 and
1998 were immaterial.
Debt securities at December 31, 1999 and 1998, by contractual
maturity, are shown below. Actual maturities may differ from con-
tractual maturities because issuers of the securities may have the
right to prepay obligations.
D e c e m b e r 3 1 , 1 9 9 9 1 9 9 8
(In thousands)
Short-term investments:
Due in one year or less $ 170,097 $ 93,983
Due after one year
through two years 140,952 25,091
Total $ 311,049 $ 119,074
D e c e m b e r 3 1 , 1 9 9 9 1 9 9 8
(In thousands)
Cash equivalents:
Money market fund $ 21,853 $ 1,389
Commercial paper 117,769 9,178
Corporate notes / bonds — 2,251
Total $ 139,622 $ 12,818
Short term investments:
U.S. government
agency obligations $ 2,969 $ —
Municipal notes / bonds 133,462 91,073
Corporate notes / bonds 58,969 12,550
Commercial paper 4,009 —
Auction rate preferred stock 111,640 15,451
Total $ 311,049 $ 119,074

I N V E N T O R I E S
Inventories are stated at the lower of cost or market. Cost is computed
on a currently adjusted standard basis (which approximates actual
costs on a first-in, first-out basis). Market value is based upon an
estimated average selling price reduced by normal gross margins.
Inventories are as follows:
Given the volatility of the market, the Company writes down inventories
to net realizable value based on backlog and forecasted demand.
However, backlog is subject to revisions, cancellations and resched-
uling. Actual demand may differ from forecasted demand and such
differences may have a material effect on the Company’s financial
position and results of operations.
P R O P E RT Y A N D E Q U I P M E N T
Property and equipment consist of the following:
D E P R E C I AT I O N A N D A M O RT I Z AT I O N
Depreciation is computed using the straight-line method over the
estimated useful lives of the assets or the remaining lease term,
whichever is shorter, generally two to seven years.
I N V E S T M E N T I N F O U N D RY
In 1997, the Company invested $40.3 million in United Silicon,
Inc., (“USIC”) a semiconductor manufacturing subsidiary of United
Microelectronics Corporation in Taiwan (“UMC”). The transaction
gave the Company an equity stake of approximately 10% in the
facility (which is accounted for on the cost basis) and guaranteed
access to approximately 12.5% of the wafer output from the facility.
In 1998, the Company increased its investment by $10.9 million to
retain its 10% ownership interest. No changes were made to the
production agreement. In January 2000, the USIC foundry was
merged into UMC. SanDisk received 111 million shares of UMC
stock in exchange for its USIC shares. (See Note 11).
R E V E N U E R E C O G N I T I O N
Product revenue, less a provision for estimated sales returns, is
recognized when title passes which is generally at the time of ship-
ment. However, revenue on shipments to distributors and retailers,
subject to certain rights of return and price protection, is deferred
until the merchandise is sold by the distributors or retailers, or the
rights expire.
The Company earns patent license and royalty revenue under patent
cross-license agreements with Hitachi Ltd., Intel Corporation,
Samsung Electronics Company Ltd., Sharp Electronics Corporation,
Silicon Storage Technology, Inc., SmartDisk Corporation and
Toshiba Corporation. The Company’s current license agreements
provide for the payment of license fees, royalties, or a combination
thereof, to the Company. The timing and amount of these payments
can vary substantially from quarter to quarter, depending on the terms
of each agreement and, in some cases, the timing of sales of products
by the other parties.
Patent license and royalty revenue is recognized when earned. In
1999, 1998 and 1997, the Company received payments under
these cross license agreements, portions of which were recognized
as revenue and portions of which are deferred revenue. Recognition of
deferred revenue is expected to occur in future periods as the Company
meets certain obligations as provided in the various agreements.
35S a n D i s k C o r p o r a t i o n
N O T E S T O C O N S O L I D A T E D F I N A N C I A L S T A T E M E N T S
D e c e m b e r 3 1 , 1 9 9 9 1 9 9 8
Raw materials $ 10,387 $ 2,710
Work-in-process 20,708 3,818
Finished goods 4,584 2,394
Total $ 35,679 $8,922
D e c e m b e r 3 1 , 1 9 9 9 1 9 9 8
Machinery and equipment $ 47,004 $ 30,008
Software 5,994 3,413
Furniture and fixtures 1,335 1,173
Leasehold improvements 3,772 2,120
Property and equipment, at cost 58,105 36,714
Accumulated depreciation
and amortization ( 26,317 ) ( 19,172 )
Property and equipment, net $ 31,788 $ 17,542

36 A n n u a l R e p o r t 1 9 9 9
N O T E S T O C O N S O L I D A T E D F I N A N C I A L S T A T E M E N T S
N E T I N C O M E P E R S H A R E
The Company determines net income per share in accordance with
Financial Accounting Standards Statement 128, “Earnings Per Share”.
The following table sets forth the computation of basic and diluted
net income per share (in thousands, except per share amounts):
Options and warrants to purchase 190,807; 1,802,886 and
514,016 shares of common stock in 1999, 1998 and 1997,
respectively, have been omitted from the earnings per share calcu-
lation, as their effect is antidilutive.
S T O C K B A S E D C O M P E N S AT I O N
The Company accounts for employee stock based compensation
under APB Opinion No. 25, “Accounting for Stock Issued to
Employees” and related interpretations. Pro forma net income and
net income per share disclosures are required by Statement of
Financial Accounting Standards No. 123, “Accounting for Stock
Based Compensation,” and are included in Note 4.
I M PA C T O F R E C E N T LY I S S U E D A C C O U N T I N G S TA N D A R D S
In June 1998, the Financial Accounting Standards Board issued
Statement 133, Accounting for Derivative Instruments and Hedging
Activities, which is required to be adopted in fiscal years beginning
after June 15, 2000. Because of the Company’s minimal use of
derivatives, management does not anticipate that the adoption of
the new Statement will have a significant effect on earnings or the
financial position of the Company, however, the Company is in the
process of studying the impact.
NOTE 2: Financial Instruments
C O N C E N T R AT I O N O F C R E D I T R I S K
The Company’s concentration of credit risk consists principally of
cash, cash equivalents, short-term investments and trade receiv-
ables. The Company’s investment policy restricts investments to
high-credit quality investments and limits the amounts invested
with any one issuer. The Company sells to original equipment man-
ufacturers, retailers and distributors in the United States, Japan,
Europe and the Far East, performs ongoing credit evaluations of its
customers’ financial condition, and generally requires no collateral.
Reserves are maintained for potential credit losses.
O F F B A L A N C E S H E E T R I S K
Certain of the Company’s balance sheet accounts are denominated in
Japanese Yen. The Company enters into foreign exchange contracts
to hedge against changes in foreign currency exchange rates. The
effects of movements in currency exchange rates on these instru-
ments are recognized when the related operating revenues and
expenses are recognized. The Company has a foreign exchange con-
tract line in the amount of $15.0 million at December 31, 1999.
Under this line, the Company may enter into forward exchange con-
tracts which require the Company to sell or purchase foreign
currencies. Two forward exchange contracts in the notional amount
of $8.2 million were outstanding at December 31, 1999. Foreign
currency translation gains of $122,000 were deferred at December
31, 1999 in connection with these contracts as the contracts have
been identified as hedging contracts. One forward exchange contract
in the amount of $4.3 million was outstanding at December 31,
1998. Foreign currency translation losses of $34,000 were deferred
at December 31, 1998 in connection with this forward contract.
The impact of movements in currency exchange rates on foreign
exchange contracts substantially mitigates the related impact on the
underlying items hedged. The Company had net transaction gains
(losses) of approximately $1,467,000, $412,000 and ($7,000) for
D e c e m b e r 3 1 , 1 9 9 9 1 9 9 8 1 9 9 7
Numerator:
Numerator for basic
and diluted
net income per share
— net income $ 26,550 $ 11,836 $ 19,839
Denominator for basic net
income per share:
Weighted average
common shares 55,834 52,596 45,760
Shares used in computing
basic net income
per share 55,834 52,596 45,760
Basic net income
per share $ 0.48 $ 0.23 $ 0.43
Denominator for diluted
net income per share:
Weighted average
common shares 55,834 52,596 45,760
Employee stock options
and warrants to purchase
common stock 5,599 2,748 4,180
Shares used in computing
diluted net income
per share 61,433 55,344 49,940
Diluted net income
per share $ 0.43 $ 0.21 $ 0.40
the years ended December 31, 1999, 1998 and 1997, respectively.
These amounts are included in other income (loss), net, in the
statement of income.
NOTE 3: Commitments and Contingencies
COMMIT MENTS
The Company leases its headquarters and sales offices under operating
leases that expire at various dates through 2001. Future minimum lease
payments under operating leases at December 31, 1999 are as follows:
Rental expense under all operating leases was $2.1 million, $1.7
million and $1.3 million for the years ended December 31, 1999,
1998 and 1997, respectively.
C O N T I N G E N C I E S
The Company relies on a combination of patents, trademarks,
copyright and trade secret laws, confidentiality procedures and
licensing arrangements to protect its intellectual property rights.
There can be no assurance that there will not be any disputes
regarding the Company’s intellectual property rights. Specifically,
there can be no assurance that any patents held by the Company
will not be invalidated, that patents will be issued for any of the
Company’s pending applications or that any claims allowed from
existing or pending patents will be of sufficient scope or strength or
be issued in the primary countries where the Company’s products
can be sold to provide meaningful protection or any commercial
advantage to the Company. Additionally, competitors of the
Company may be able to design around the Company’s patents.
To preserve its intellectual property rights, the Company believes it
may be necessary to initiate litigation with one or more third parties,
including but not limited to those the Company has notified of pos-
sible patent infringement. In addition, one or more of these parties
may bring suit against the Company. Any litigation, whether as a
plaintiff or as a defendant, would likely result in significant expense
to the Company and divert the efforts of the Company’s technical
and management personnel, whether or not such litigation is ulti-
mately determined in favor of the Company.
In March 1998, the Company filed a complaint in federal court
against Lexar Media, Inc. (“Lexar”) for infringement of a funda-
mental flashdisk patent. Lexar has disputed the Company’s claim of
patent infringement, claimed SanDisk’s patent is invalid or unen-
forceable and asserted various counterclaims including unfair
competition, violation of the Lanham Act, patent misuse, interfer-
ence with prospective economic advantage, trade defamation and
fraud. SanDisk has denied each of Lexar’s counterclaims.
In July 1998, the federal district court denied Lexar’s request to
have the case dismissed on the grounds the Company failed to per-
form an adequate prefiling investigation. Discovery in the Lexar suit
commenced in August 1998. The claims construction phase com-
menced in February 1999. The Company intends to vigorously
enforce its patents, but there can be no assurance that these efforts
will be successful.
On February 22, 1999, the court considered arguments and papers
submitted by the parties regarding the scope and proper interpreta-
tion of the asserted claims in our patent at issue in the Lexar suit.
On March 4, 1999, the court issued its ruling on the proper con-
struction of the claim terms in our patent. On July 30, 1999, we
filed a motion for partial summary judgement that Lexar
CompactFlash and PC Cards contributorily infringe our patent. In
December 1999, Lexar filed a counter motion for partial summary
judgement for invalidity of our patent. Both motions were heard by
the court on March 17, 2000 and the matters were taken under
submission by the court. We are waiting for the court's ruling on
both matters. In August 1999, we had a mandatory settlement
meeting with Lexar. No Settlement was reached through this meeting.
A trial date has not yet been set.
In May 1999, Lexar filed a complaint against us in federal court for
claims of unfair competition, false advertising, trade libel and inten-
tional and negligent interference with prospective business
advantage. In Lexar's complaint, Lexar alleged that statements by us
regarding the comparative performance of our products and Lexar's
in digital cameras were false, and further alleged that we had inter-
fered with the certification of certain Lexar products by the
CompactFlash Association. On July 1, 1999, we filed a motion to
dismiss the Lexar complaint. Also, in July 1999, Lexar filed a
motion for preliminary injunction seeking to stop certain advertising
practices that Lexar alleges were misleading. On August 26, 1999,
the parties executed and filed with the court a joint stipulation with-
drawing our motion to dismiss and granting Lexar permission to
amend its complaint. Lexar has amended its complaint to remove
37S a n D i s k C o r p o r a t i o n
N O T E S T O C O N S O L I D A T E D F I N A N C I A L S T A T E M E N T S
Ye a r E n d i n g D e c e m b e r 3 1 ,
(In thousands)
2000 $ 1,868
2001 1,035
Total $ 2,903

38 A n n u a l R e p o r t 1 9 9 9
N O T E S T O C O N S O L I D A T E D F I N A N C I A L S T A T E M E N T S
any allegations and causes of action based on our alleged interfer-
ence in certification by the CompactFlash Association. On
September 17, 1999, the court conducted a hearing on Lexar's
motion for preliminary injunction. On September 24, 1999, the
court issued an order granting a limited preliminary injunction,
which enjoins us from using or implying certain terminology in
advertising regarding the comparative performance of our memory
products in digital cameras. On October 1, 1999, we filed counter-
claims against Lexar asserting causes of action including unfair
competition and false advertising under both federal and California
law. Although we cannot predict the ultimate outcome of the case,
we believe that Lexar's claims are without merit and that we have
meritorious counterclaims against Lexar.
In the event of an adverse result in any such litigation, the Company
could be required to pay substantial damages, cease the manufac-
ture, use and sale of infringing products, expend significant
resources to develop non-infringing technology or obtain licenses to
the infringing technology, or discontinue the use of certain processes.
From time to time the Company agrees to indemnify certain of its
suppliers and customers for alleged patent infringement. The scope
of such indemnity varies but may in some instances include indem-
nification for damages and expenses, including attorneys fees. The
Company may from time to time be engaged in litigation as a result
of such indemnification obligations. Third party claims for patent
infringement are excluded from coverage under the Company’s
insurance policies. There can be no assurance that any future obli-
gation to indemnify the Company’s customers or suppliers, will not
have a material adverse effect on the Company’s business, financial
condition and results of operations.
Litigation frequently involves substantial expenditures and can
require significant management attention, even if the Company ulti-
mately prevails. In addition, the results of any litigation matters are
inherently uncertain. Accordingly, there can be no assurance that
any of the foregoing matters, or any future litigation, will not have a
material adverse effect on the Company’s business, financial condi-
tion and results of operations.
NOTE 4: Stockholders’ Equity
S T O C K B E N E F I T P L A N
The 1989 Stock Benefit Plan, in effect through August 1995,
comprised two separate programs, the Stock Issuance Program and
the Option Grant Program. The Stock Issuance Program allowed eli-
gible individuals to immediately purchase the Company’s common
stock at a fair value as determined by the Board of Directors. Under
the Option Grant Program, eligible individuals were granted options
to purchase shares of the Company’s common stock at a fair value,
as determined by the Board of Directors, of such shares on the date
of grant. The options generally vest over a four-year period, expiring
no later than ten years from the date of grant. Unexercised options
are canceled upon the termination of employment or services.
Options that are canceled under this plan will be available for future
grants under the 1995 Stock Option Plan. There were no shares
available for option grants under the 1989 Stock Benefit Plan at
December 31, 1999.
1 9 9 5 S T O C K B E N E F I T P L A N
The 1995 Stock Option Plan provides for the issuance of incentive
stock options and nonqualified stock options. Under this plan, the
vesting and exercise provisions of option grants are determined by
the Board of Directors. The options generally vest over a four-year
period, expiring no later than ten years from the date of grant.
On July 17, 1998, the Board of Directors approved an option can-
cellation/regrant program. Under the cancellation/regrant program,
employees could elect to exchange their stock options with exercise
prices in excess of $6.00 per share for new options priced at $5.00
per share, the market price of the Company’s common stock on the
date of implementation, August 21, 1998. Under the new options,
shares become exercisable six to twelve months later than under the
old higher-priced options. The new options have a maximum term of
ten years from the August 21, 1998, grant date. Officers and direc-
tors of the Company were not eligible for participation in the option
cancellation/regrant program. Options covering a total of approxi-
mately 1,806,846 shares were canceled and regranted in
connection with the program. The number of options shown as
granted and canceled in the table below reflect this exchange of
options. Such options had a weighted average exercise price before
repricing of $10.3305, and the new options were granted at an
exercise price of $5.00.
In May 1999, the stockholders increased the shares available for
future issuance under the 1995 Stock Benefit Plan by 7,000,000
Shares and approved an automatic share increase feature pursuant
to which the number of shares available for issuance under the plan
will automatically increase on the first trading day in January each
calendar year, beginning with calendar Year 2002 and continuing
over the remaining term of the plan, by an amount equal to four and
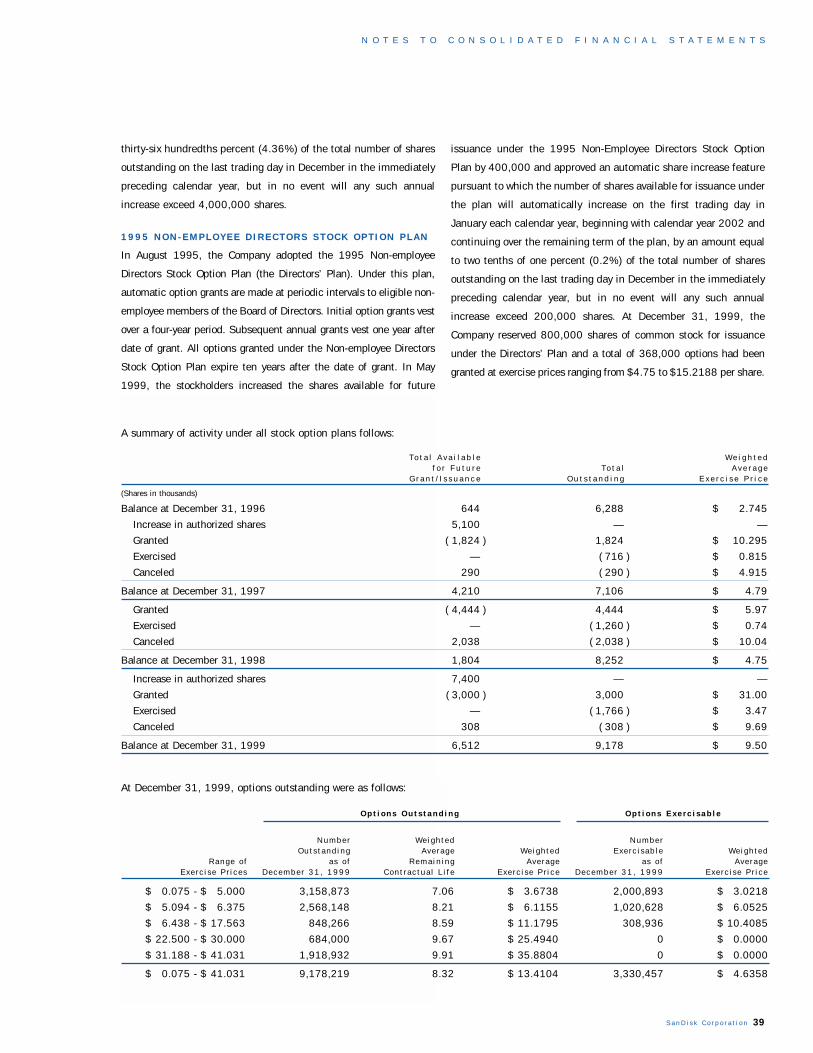
thirty-six hundredths percent (4.36%) of the total number of shares
outstanding on the last trading day in December in the immediately
preceding calendar year, but in no event will any such annual
increase exceed 4,000,000 shares.
1 9 9 5 N O N - E M P L O Y E E D I R E C T O R S S T O C K O P T I O N P L A N
In August 1995, the Company adopted the 1995 Non-employee
Directors Stock Option Plan (the Directors’ Plan). Under this plan,
automatic option grants are made at periodic intervals to eligible non-
employee members of the Board of Directors. Initial option grants vest
over a four-year period. Subsequent annual grants vest one year after
date of grant. All options granted under the Non-employee Directors
Stock Option Plan expire ten years after the date of grant. In May
1999, the stockholders increased the shares available for future
issuance under the 1995 Non-Employee Directors Stock Option
Plan by 400,000 and approved an automatic share increase feature
pursuant to which the number of shares available for issuance under
the plan will automatically increase on the first trading day in
January each calendar year, beginning with calendar year 2002 and
continuing over the remaining term of the plan, by an amount equal
to two tenths of one percent (0.2%) of the total number of shares
outstanding on the last trading day in December in the immediately
preceding calendar year, but in no event will any such annual
increase exceed 200,000 shares. At December 31, 1999, the
Company reserved 800,000 shares of common stock for issuance
under the Directors’ Plan and a total of 368,000 options had been
granted at exercise prices ranging from $4.75 to $15.2188 per share.
N O T E S T O C O N S O L I D A T E D F I N A N C I A L S T A T E M E N T S
To t a l A v a i l a b l e We i g h t e df o r F u t u r e To t a l A v e r a g e
G r a n t / I s s u a n c e O u t s t a n d i n g E x e r c i s e P r i c e
(Shares in thousands)
Balance at December 31, 1996 644 6,288 $ 2.745
Increase in authorized shares 5,100 — —
Granted ( 1,824 ) 1,824 $ 10.295
Exercised — ( 716 ) $ 0.815
Canceled 290 ( 290 ) $ 4.915
Balance at December 31, 1997 4,210 7,106 $ 4.79
Granted ( 4,444 ) 4,444 $ 5.97
Exercised — ( 1,260 ) $ 0.74
Canceled 2,038 ( 2,038 ) $ 10.04
Balance at December 31, 1998 1,804 8,252 $ 4.75
Increase in authorized shares 7,400 — —
Granted ( 3,000 ) 3,000 $ 31.00
Exercised — ( 1,766 ) $ 3.47
Canceled 308 ( 308 ) $ 9.69
Balance at December 31, 1999 6,512 9,178 $ 9.50
O p t i o n s O u t s t a n d i n g O p t i o n s E x e r c i s a b l e
Number Weighted NumberOuts tand ing Average Weighted Exerc i sab le Weighted
Range o f as o f Remain ing Average as o f AverageExerc i se Pr ices December 31, 1999 Cont rac tua l L i fe Exerc i se Pr ice December 31, 1999 Exerc i se Pr ice
$ 0.075 - $ 5.000 3,158,873 7.06 $ 3.6738 2,000,893 $ 3.0218
$ 5.094 - $ 6.375 2,568,148 8.21 $ 6.1155 1,020,628 $ 6.0525
$ 6.438 - $ 17.563 848,266 8.59 $ 11.1795 308,936 $ 10.4085
$ 22.500 - $ 30.000 684,000 9.67 $ 25.4940 0 $ 0.0000
$ 31.188 - $ 41.031 1,918,932 9.91 $ 35.8804 0 $ 0.0000
$ 0.075 - $ 41.031 9,178,219 8.32 $ 13.4104 3,330,457 $ 4.6358
A summary of activity under all stock option plans follows:
At December 31, 1999, options outstanding were as follows:
39S a n D i s k C o r p o r a t i o n

40 A n n u a l R e p o r t 1 9 9 9
N O T E S T O C O N S O L I D A T E D F I N A N C I A L S T A T E M E N T S
E M P L O Y E E S T O C K P U R C H A S E P L A N
In August 1995, the Company adopted the Employee Stock
Purchase Plan (the Purchase Plan). In May 1999, the stockholders
increased the shares available for future issuance under the
Employee Stock Purchase Plan by 600,000 and approved an auto-
matic share increase feature pursuant to which the number of
shares available for issuance under the plan will automatically
increase on the first trading day in January each calendar year,
beginning with calendar year 2002 and continuing over the remain-
ing term of the plan, by an amount equal to forty-three hundredths
of one percent (0.43%) of the total number of shares outstanding
on the last trading day in December in the immediately preceding
calendar year, but in no event will any such annual increase exceed
400,000 shares. Under the Purchase Plan, qualified employees are
entitled to purchase shares through payroll deductions at 85% of
the fair market value at the beginning or end of the offering period,
whichever is lower. As of December 31, 1999, the Company had
reserved 2,366,666 shares of common stock for issuance under the
Directors’ Plan and a total of 964,870 shares had been issued.
A C C O U N T I N G F O R S T O C K B A S E D C O M P E N S AT I O N
The Company has elected to follow APB 25 and related interpretations
in accounting for its employee stock options because, as discussed
below, the alternative fair value accounting provided for under SFAS
123 “Accounting for Stock-Based Compensation,” requires use of
option valuation models that were not developed for use in valuing
employee stock options. Under APB 25, because the exercise price of
the Company’s stock options equals the market price of the underlying
stock on the date of grant, no compensation expense is recognized.
Pro forma information regarding net income and earnings per share
is required by SFAS 123, which also requires that the information
be determined as if the Company has accounted for its employee
stock options granted subsequent to December 31, 1994 under the
fair value method of this Statement. For all grants subsequent to
December 31, 1994 that were granted prior to the Company’s
initial public offering in November 1995, the fair value of these
options was determined using the minimum value method with a
weighted average risk free interest rate of 6.32% and an expected
life of 5 years. The fair value for the options granted subsequent to
the Company’s initial public offering in November 1995 was esti-
mated at the date of grant using a Black-Scholes single option
pricing model with the following weighted average assumptions:
risk-free interest rates of 5.52%, 4.84% and 6.24% for 1999,
1998 and 1997, respectively; a dividend yield of 0.0%, a volatility
factor of the expected market price of the Company’s common stock
of 0.888, 0.60 and 0.655 for 1999, 1998 and 1997 respectively;
and a weighted-average expected life of the option of 5 years. The
weighted average fair value of those options granted were $22.38,
$3.325 and $6.225 for 1999, 1998 and 1997, respectively.
The Black-Scholes option valuation model was developed for use in
estimating the fair value of traded options which have no vesting
restrictions and are fully transferable. In addition, option models
require the input of highly subjective assumptions including the
expected stock price volatility. Because the Company’s employee
stock options have characteristics significantly different from those
of traded options, and because changes in the subjective assump-
tions can materially affect the fair value estimate, in management’s
opinion, the existing models do not necessarily provide a reliable
single measure of the fair value of its employee stock options.
Under the 1995 Employee Stock Purchase Plan participating
employees can choose to have up to 10% of their annual base earn-
ings withheld to purchase the Company’s common stock. The
purchase price of the stock is 85% of the lower of the subscription
date fair market value and the purchase date fair market value.
Approximately 79% of eligible employees have participated in the
plan in 1999 and 65% and 75% in 1998 and 1997, respectively.
Under the Plan, the Company sold 269,092, 259,484 and
251,591 shares to employees in 1999, 1998 and 1997, respec-
tively. Pursuant to APB 25 and related interpretations, the Company
does not recognize compensation cost related to employee purchase
rights under the Plan. To comply with the pro forma reporting
requirements of SFAS 123, compensation cost is estimated for the
fair value of the employees’ purchase rights using the Black-Scholes
model with the following assumptions for those rights granted in
1999, 1998 and 1997: dividend yield of 0.0%; and expected life
of 6 months; expected volatility factor of .98 and 1.16 in 1999, .65
and 1.02 in 1998 and 0.63 and 0.89 in 1997; and a risk free inter-
est rate ranging from 5.35% to 6.08%. The weighted average fair
value of those purchase rights granted in February 1997, August
1997, February 1998, August 1998, February 1999 and August 1999
were $1.71, $2.345, $3.5, $2.25, $6.01 and $17.72, respectively.

Had compensation cost for the Company’s stock-based compensation
plans been determined based on the fair value at the grant dates for
awards under those plans consistent with the method of SFAS 123,
the Company’s net income and earnings per share would have been
reduced to the pro forma amounts indicated below:
Because SFAS 123 is applicable only to options granted subsequent
to December 31, 1994, its pro forma effect was not fully reflected
until 1999.
S H A R E H O L D E R R I G H T S P L A N
On April 21, 1997, the Company adopted a shareholder rights plan
(the Rights Agreement). Under the Rights Agreement, rights were
distributed as a dividend at the rate of one right for each share of
common stock of the Company held by stockholders of record as of
the close of business on April 28, 1997. The rights will expire on
April 28, 2007 unless redeemed or exchanged. Under the Rights
Agreement, each right will initially entitle the registered holder to buy
one one-fiftieth of a share of Series A Junior Participating Preferred
Stock for $250.00. The rights will become exercisable only if a per-
son or group (other than Seagate Technology, Inc., which is permitted
to own up to 25 percent of outstanding common stock of the
Company) acquires beneficial ownership of 15 percent or more of the
Company’s common stock or commences a tender offer or exchange
offer upon consummation of which such person or group would bene-
ficially own 15 percent or more of the Company’s common stock.
WA R R A N T S
The Company has periodically granted warrants in connection with
the sale of its stock and certain lease and bank agreements. The
Company had no warrants outstanding at December 31, 1999.
During 1999, the Company issued 59,340 shares of common stock
for no proceeds in the net issuance of shares upon the exercise of
64,246 warrants with an exercise price of $1.65 per share.
S T O C K S P L I T
On January 26, 2000, the Company’s board of directors approved a
2-for-1 stock split, in the form of a 100% stock dividend, payable to
stockholders of record as of February 8, 2000. The dividend was paid
and the split was effected on February 22, 2000. Shares, per share
amounts, common stock at par value and additional paid in capital
have been restated to reflect the stock split for all periods presented.
NOTE 5: Retirement PlanEffective January 1, 1992, the Company adopted a tax-deferred
savings plan, the SanDisk 401(k) Plan, for the benefit of qualified
employees. The plan is designed to provide employees with an accu-
mulation of funds at retirement. Qualified employees may elect to
make contributions to the plan on a monthly basis. The Company
may make annual contributions to the plan at the discretion of the
Board of Directors. The Company contributed $105,000 for the
plan year ended December 31, 1999. No contributions were made
by the Company for the years ended December 31, 1998 and 1997
NOTE 6: Income TaxesThe provision for income taxes consists of the following:
The tax benefits associated with stock options reduces taxes cur-
rently payable as shown above by $9,809,000, $1,761,000 and
$2,498,000 in 1999, 1998 and 1997, respectively. Such benefits
are credited to capital in excess of par when realized.
41S a n D i s k C o r p o r a t i o n
N O T E S T O C O N S O L I D A T E D F I N A N C I A L S T A T E M E N T S
Ye a r s e n d e d D e c e m b e r 3 1 , 1 9 9 9 1 9 9 8 1 9 9 7
(in thousands, except per share amounts)
Pro forma net income $ 16,213 $ 5,178 $ 17,156
Pro forma net income
per share
Basic $ 0.29 $ 0.10 $ 0.37
Diluted $ 0.26 $ 0.09 $ 0.34
D e c e m b e r 3 1 , 1 9 9 9 1 9 9 8 1 9 9 7
(In thousands)
Current:
Federal $ 10,354 $ 1,413 $ 12,131
State 2,117 651 2,662
Foreign 4,105 2,936 5,263
16,576 5,000 20,056
Deferred:
Federal ( 2,600 ) 1,305 ( 13,205 )
State ( 400 ) 350 ( 3,350 )
Foreign ( 500 ) — —
( 3,500 ) 1,655 ( 16,555 )
Provision for income taxes $ 13,076 $ 6,655 $ 3,501

42 A n n u a l R e p o r t 1 9 9 9
N O T E S T O C O N S O L I D A T E D F I N A N C I A L S T A T E M E N T S
The Company’s provision for income taxes differs from the amount
computed by applying the federal statutory rates to income before
taxes as follows:
Deferred income taxes reflect the net tax effects of temporary dif-
ferences between the carrying amounts of assets and liabilities for
financial reporting purposes and the amount used for income tax
purposes. Significant components of the Company’s deferred tax
assets as of December 31, 1999 and 1998 are as follows:
NOTE 7: Related Party TransactionsThe Company invested $51.2 million in United Silicon, Inc., a
semiconductor manufacturing subsidiary of United Microelectronics
Corporation in Taiwan. The transaction gave the Company an equity
stake of approximately 10% in the facility (which was accounted for
on the cost basis) and guarantees access to approximately 12.5% of
the wafer output from the facility. In 1999 and 1998, the Company
purchased wafers from USIC totaling approximately $22.8 million
and $11.6 million, respectively. The amount payable to USIC for
wafer purchases was $9.3 million and $0.2 million at December
31, 1999 and 1998, respectively. In January 2000, the USIC
foundry was merged into UMC. SanDisk received 111 million shares
of UMC stock in exchange for its USIC shares (See Note 11).
NOTE 8: Toshiba Joint VentureIn October 1999, the Company entered into a nonbinding memo-
randum of understanding with Toshiba providing for the joint
development and manufacturing of 512 megabit and 1 gigabit flash
memory chips and Secure Digital Memory Card controllers. Further,
the Company and Toshiba intend to form and fund a joint venture to
equip and operate a silicon wafer manufacturing line in Virginia. The
cost of equipping the Virginia wafer manufacturing line is estimated
at between $700 million and $800 million. The Company, as part
of its 50% ownership of the joint venture, expects to invest up to
$150 million in cash and, if necessary, guarantee equipment lease
lines for an additional $250 million. The Company does not expect
any material revenues from the 512 megabit technology for at least
one year and from the 1 gigabit technology for at least two years. A
definitive agreement based upon this memorandum of understand-
ing is being negotiated and is expected to be concluded by the
second quarter of fiscal 2000, subject to final approval by the
Company’s board of directors and that of Toshiba.
NOTE 9: Segment InformationThe Company adopted SFAS No. 131, Disclosures about Segments
of an Enterprise and Related Information, in fiscal 1998. SFAS No.
131 supersedes SFAS No. 14, Financial Reporting for Segments of
a Business Enterprise and establishes standards for reporting
information about operating segments. Operating segments are
defined as components of an enterprise about which separate finan-
cial information is available that is evaluated regularly by the chief
operating decision maker, or group, in deciding how to allocate
resources and in assessing performance.
The Company operates in one segment, flash memory products. The
Company markets its products in the United States and in foreign
countries through its sales personnel, dealers, distributors, retailers
and its subsidiaries. The Chief Executive Officer has been identified
as the Chief Operating Decision Maker (“CODM”) because he has
final authority over resource allocation decisions and performance
assessment. The CODM does not receive discrete financial informa-
tion about individual components of the market.
D e c e m b e r 3 1 , 1 9 9 9 1 9 9 8 1 9 9 7
Federal statutory rate 35.0 % 35.0 % 35.0 %
State taxes,
net of federal benefit 2.8 3.5 ( 1.9 )
Research credit ( 1.7 ) ( 1.9 ) ( 3.8 )
Valuation allowance — — ( 14.9 )
Foreign tax in excess
of U.S. rate — — 0.4
Other individually
immaterial items 0.8 5.5 0.2
Tax exempt
interest income ( 3.9 ) ( 6.1 ) —
33.0 % 36.0 % 15.0 %
D e c e m b e r 3 1 , 1 9 9 9 1 9 9 8
(In thousands)
Deferred tax assets:
Inventory reserves $ 3,400 $ 2,700
Deferred revenue 10,600 10,300
Accruals and reserves 3,500 2,900
Other 1,300 —
$ 18,800 $ 15,900

G E O G R A P H I C I N F O R M AT I O N :
Information regarding geographic areas for the years ended
December 31, 1999, 1998, and 1997 are as follows:
Revenues are attributed to countries based on the location of the
customers. Long lived assets in other foreign countries includes
the investment in USIC of $51.2 million in 1999 and 1998, and
$40.3 million in 1997.
M A J O R C U S T O M E R S
In 1999 and 1998, revenues from one customer represented
approximately $28.0 million and $14.0 million, respectively, of
consolidated revenues. In 1997, there were no customers who
accounted for more than 10% of total revenue.
NOTE 10: Accumulated Other Comprehensive IncomeAs of January 1, 1998, the Company adopted Statement No. 130,
Reporting Comprehensive Income. Statement 130 establishes new rules
for the reporting and displaying of comprehensive income and its com-
ponents; however, the adoption of this Statement had no impact on the
Company’s net income or shareholders’ equity. Statement 130 requires
unrealized gains or losses on the Company’s available-for-sale securities,
which prior to adoption were reported separately in shareholders’ equity,
to be included in other comprehensive income. Comprehensive income
consists of net income and other comprehensive income.
Accumulated other comprehensive income presented in the accom-
panying balance sheet consists of the accumulated unrealized gains
and loses on available-for-sale marketable securities for all periods
presented. The tax effects for other comprehensive income were
immaterial for all periods presented.
NOTE 11: Subsequent EventsOn January 3, 2000, the USIC foundry was merged into UMC. The
Company had invested $51.2 million in USIC. In exchange for its
USIC shares, the Company received 111 million UMC shares. These
shares were valued at approximately $396 million at the time of the
merger, resulting in a pretax gain of $344 million ($204 million
after-tax). All of the UMC shares received by the Company are sub-
ject to trading restrictions imposed by UMC and the Taiwan Stock
Exchange. The trading restrictions will expire on one-half of the
shares six months after the date of the merger. The remaining shares
will become available for sale, over a two year period beginning in
January 2002. When the shares are ultimately sold, it is likely that
the Company will report additional gains or losses.
43S a n D i s k C o r p o r a t i o n
N O T E S T O C O N S O L I D A T E D F I N A N C I A L S T A T E M E N T S
1 9 9 9 1 9 9 8 1 9 9 7
(In thousands)
Accumulated other comprehensive income
at beginning of year $ 471 $ 42 $ 5
Change of accumulated other comprehensive
income during the yearUnrealized gain (loss)
on available-for-sale securities $ ( 272) $ 429 $ 37
Accumulated other comprehensive income
at year end $ 199 $ 471 $ 42
Ye a r s E n d e d D e c e m b e r 3 1 , 1 9 9 9 1 9 9 8 1 9 9 7
(In thousands)
Revenues:
United States $ 116,922 $ 60,113 $ 53,820
Japan 62,176 46,276 51,677
Europe 22,674 9,810 10,774
Other foreign countries 45,218 19,562 8,982
Total $ 246,990 $ 135,761 $ 125,253
Long Lived Assets:
United States $ 25,442 $ 16,779 $ 15,422
Japan 261 445 246
Europe 20 9 3
Other foreign countries 57,273 51,517 40,505
Total 82,996 68,750 56,176

T H E B O A R D O F D I R E C T O R S A N D S T O C K H O L D E R S
S A N D I S K C O R P O R AT I O N
We have audited the accompanying consolidated balance sheets of SanDisk Corporation as of December 31, 1999 and 1998, and the
related consolidated statements of income, stockholders’ equity, and cash flows for each of the three years in the period ended December
31, 1999. Our audits also included the financial statement schedule listed in the Index at Item 14(a). These financial statements and
schedule are the responsibility of the Company’s management. Our responsibility is to express an opinion on these financial statements
and schedule based on our audits.
We conducted our audits in accordance with generally accepted auditing standards in the United States. Those standards require that we
plan and perform the audit to obtain reasonable assurance about whether the financial statements are free of material misstatement. An
audit includes examining, on a test basis, evidence supporting the amounts and disclosures in the financial statements. An audit also
includes assessing the accounting principles used and significant estimates made by management, as well as evaluating the overall finan-
cial statement presentation. We believe that our audits provide a reasonable basis for our opinion.
In our opinion, the consolidated financial statements referred to above present fairly, in all material respects, the consolidated financial
position of SanDisk Corporation at December 31, 1999 and 1998 and the consolidated results of its operations and its cash flows for each
of the three years in the period ended December 31, 1999, in conformity with generally accepted accounting principles in the United
States. Also, in our opinion, the related financial statement schedule, when considered in relation to the basic financial statements taken
as a whole, presents fairly in all material respects the information set forth therein.
San Jose, California
January 25, 2000
44 A n n u a l R e p o r t 1 9 9 9
R E P O R T O F E R N S T & Y O U N G L L P , I N D E P E N D E N T A U D I T O R S

45S a n D i s k C o r p o r a t i o n
S A N D I S K C O R P O R A T I O N W O R L D W I D E L O C A T I O N S
S A N D I S K C O R P O R AT E
H E A D Q U A RT E R S
140 Caspian CourtSunnyvale, CA 94089 USAT: 408.542.0500F: 408.542.0503www.sandisk.com
S A N D I S K I N D U S T R I A L /
O E M S A L E S O F F I C E S
Northwestern Region USA140 Caspian Court
Sunnyvale, CA 94089
T: 408.542.0730
F: 408.542.0403
Western Region USA8 Corporate Park, Suite 300
Irvine, CA 92606
T: 949.442.8370
F: 949.442.8371
Central Region USA545 MetroPlace
MetroPlace South, Suite 100
Dublin, OH 43017
T: 614.760.3700
F: 614.760.3701
Mid-Atlantic Region USA620 Herndon Pkwy, Suite 200
Herndon, VA 22070
T: 703.481.9828
F: 703.437.9215
New England & Canada20 Trafalgar Square, Suite 400
Nashua, NH 30363
T: 603.882.0888
F: 603.882.2201
Southern & Latin America101 Southhall Lane, Suite 400
Maitland, FL 32751
T: 614.760.3700
F: 614.760.3701
GermanyKarlsruher Str. 2C
D-30519 Hannover
Germany
T: 49.511.875.9185
F: 49.511.875.9187
Eutelis Plaz 3
D-40878 Ratingen
Germany
T: 49.210.299.9666
F: 49.210.299.9667
Japan8F Nisso Building 15
2-17-19 Shin-Yokohama
Kohoku-ku
Yokohama 222-0033
Japan
T: 81.45.474.0181
F: 81.45.474.0371
Asia/Pacific Rim89 Queensway, Lippo Center
Tower II, Suite 4104
Admiralty
Hong Kong
T: 852.2712.0501
F: 852.2712.9385
SANDISK RETAIL SALES OFFICES
US Retail Sales21842 Las Nubes Drive
Trabuco Canyon, CA 92679
T: 949.589.8351
F: 949.589.8364
32500 Mills Road
Avon, OH 44011
T: 440.327.0490
F: 440.327.0295
2220 Airport Frwy. #440-129
Bedford, TX 76022
T: 817.355.9365
F: 817.571.0958
European Retail SalesWilhelminastraat 18
2011 VM Haarlem
The Netherlands
T: 31.23.5514226
F: 31.23.5348625
47 Long Fallow
Chiswell Green
St. Albans
Herfordshire AL23ED
T: 44.788.7847100
F: 44.1727.864583
Japan Retail SalesUmeda-Shinmichi Building 10F
1-1-5 Dojima, Kita-ku
Osaka 530-0003
T: 81.6.6343.6480
F: 81.6.6343.6481

B O A R D O F D I R E C T O R S
William V. Campbell (2)
Intuit Inc.
Chairman of the Board
Irwin Federman (1)
U.S. Venture Partners
Chairman of the Board, General Partner
Dr. Eli HarariSanDisk Corporation
President and CEO
Catherine P. Lego (1) (2)
Photonics Fund
General Partner
Dr. James D. MeindlGeorgia Institute of Technology
Alan F. Shugart (2)
Al Shugart International
President and CEO,
(1) Audit Committee(2) Compensation Committee
E X E C U T I V E O F F I C E R S
Daniel AuclairSenior Vice President,
Business Development and
Intellectual Property
Frank CalderoniCFO, Senior Vice President,
Finance and Administration
Nelson ChanSenior Vice President, Marketing
Dr. Eli HarariPresident and CEO
Ralph HudsonSenior Vice President, Operations
Jocelyn ScarboroughVice President, Human Resources
REGISTRAR AND TRANSFER AGENT
Harris Trust and Savings BankChicago, Illinois
I N D E P E N D E N T P U B L I C A U D I T O R S
Ernst & Young LLPSan Jose, California
I N V E S T O R / S H A R E H O L D E R R E L AT I O N S
Frank CalderoniCFO, Senior Vice President,
Finance and Administration
Michael GrayVice President, Finance
Sharon SpeharShareholder Relations
L E G A L C O U N S E L
Brobeck, Phleger & Harrison LLPPalo Alto, California
46 A n n u a l R e p o r t 1 9 9 9
S A N D I S K C O R P O R A T E I N F O R M A T I O N

©2000 SanDisk Corporation. All rights reserved. SanDisk and the SanDisk logo are registered trademarks, and CompactFlash and ImageMate are trademarks of SanDisk Corporation.FlashPath is a trademark of SmartDisk. Other brands and products are trademarks of their respective holder(s). 4/00

SanDisk Corporation
140 Caspian Court
Sunnyvale, CA 94089-1000
P: 408.542.0500
F: 408.542.0403
www.sandisk.com
San
Disk
An
nu
al Rep
ort 19
99