Embed Size (px)
Citation preview

Sand Plant Particulate/Silica Research Update
Crispin Pierce PhD
University of Wisconsin-Eau Claire
7 June 2013
Overview of Health Risks
• Waterborne pollutants that can be ingested.
• Airborne pollutants that can be inhaled.
• Noise pollution that can be heard.
• Light pollution that can be seen.
• Wetland loss that affects local water quality.
• Truck traffic that affects road safety.
• Greenhouse gas generation that increases climate change.

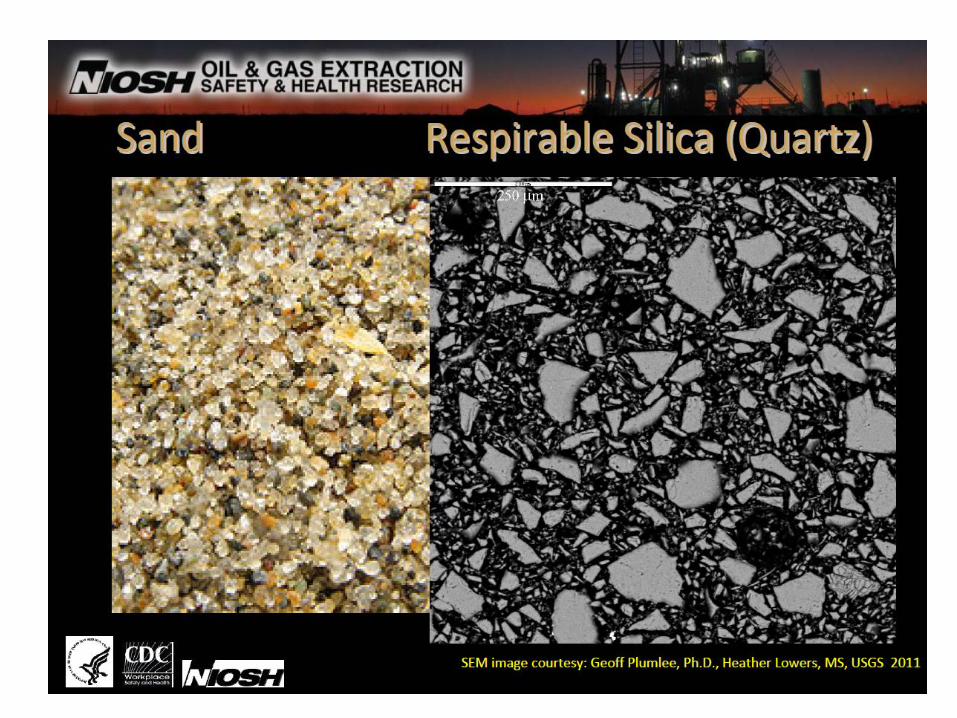
Chemicals of Concern: Particulate Matter (PM)
Increased respiratory symptoms, such as irritation of the airways, coughing, or difficulty breathing, for example;
Decreased lung function; Aggravated asthma; Development of chronic bronchitis; Irregular heartbeat; Nonfatal heart attacks; and Premature death in people with heart or lung
disease.

Particle Size is Important
Image: Modified from http://www.riverpartners.org


• Silicosis –a fibrosis (scarring) of the lungs. Silicosis is progressive and leads to disability and death.
• About 200 people in the US will die this year due to workplace exposure to silica (NIOSH 2008).
• Between 8-18 people are expected to die in Wisconsin from workplace silicosis in 2012.
SOURCE: National Center for Health Statistics multiple cause of death data. Population estimates from U.S. Bureau of the Census, http://www.cdc.gov/niosh/docs/96-134/pdfs/96-134e.pdf
Health Effects

Lung Cancer – Crystalline silica (quartz) is classified as a human carcinogen by the following regulatory agencies: International Agency for Research on Cancer (IARC)
National Toxicology Program
California Proposition 65
American Conference of Governmental Industrial Hygienists
Occupational Safety and Health Administration - Potential Cancer Hazard
National Institute for Occupational Safety and Health (NIOSH) – Potential Cancer Hazard

Sand Mining and Processing Generate PM and Silica
• Frac sand mining and processing generate PM and silica through blasting, loading, and hauling; processing activities such as crushing; and transporting frac sand and “waste sand.”
Image: upstreamonline.com

Particulates and Silica From Sand Plants
Photos taken of the silica sand mine and processing site at CTH DD and STH 64 in the Town of Auburn on October 7, 2011 by James Torseth. Note visible emissions from sand piles. Photographer noted "Upwind of the site the sky was clear. Downwind of the site there was a whitish gray haze extending for a mile or more."
Regulation
• Five states (but not Wisconsin) are now regulating crystalline silica exposure: the State of California OEHHS has done a careful job of establishing a non-cancer risk threshold of 3 ug/m3 to protect the public from silicosis (Myers 2010).
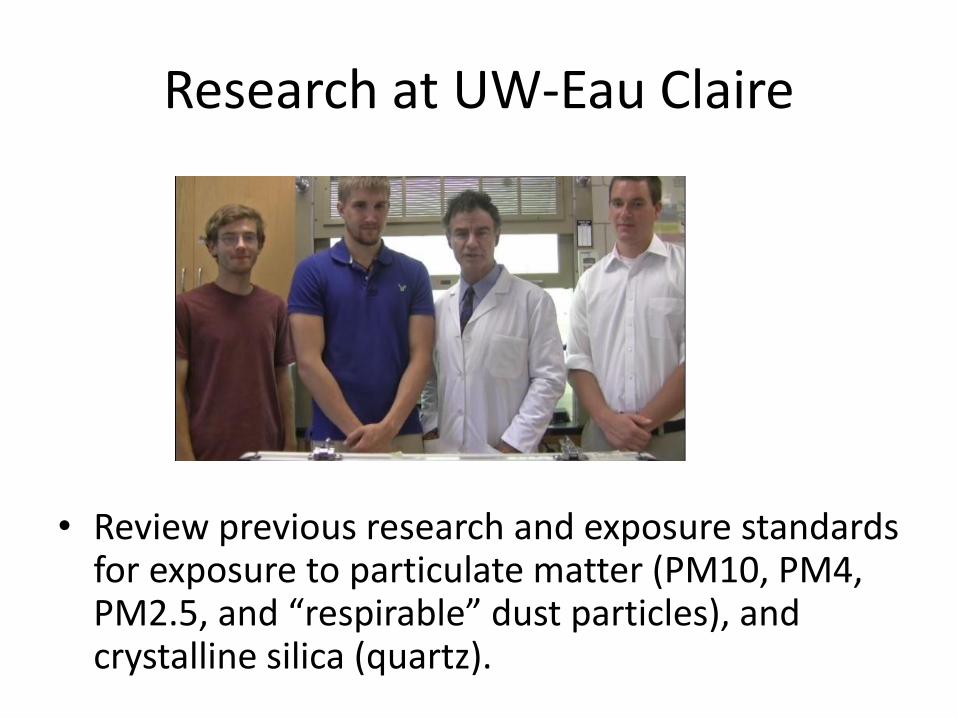
Research at UW-Eau Claire
• Review previous research and exposure standards for exposure to particulate matter (PM10, PM4, PM2.5, and “respirable” dust particles), and crystalline silica (quartz).

• Record GPS coordinates, wind speed and direction, particulate matter concentrations and crystalline silica concentrations surrounding sand mining, transporting, and processing plants in Wisconsin.

RESULTS

PM2.5 Levels May be the Best Indicator of Public Health Risk
• A 1995 American Cancer Society study, 2002 follow-up, and published 2012 study of six cities found that each 10-microgram per-cubic-meter increase in long-term average PM2.5 concentration was associated with, – a 4-14% increased risk of death from all natural
causes,
– a 6-26% increased risk of death from cardiopulmonary/cardiovascular disease, and
– an 8-37% increased risk of death from lung cancer. References: http://toxicology.usu.edu/endnote/1132.pdf, http://dx.doi.org/10.1289/ehp.1104660

PM2.5 Samples in Winona, MN Prior to Sand Plant Construction Were
Lower Than DNR Background Levels
0
5
10
15
20
25
30
35
PM
2.5
(u
g/m
3)
Winona
DNR Background(LaCrosse)
EPA Annual Standard
Site 1 Site 2

Measured Levels of PM2.5/4 Increased from EOG Plant Construction Through
Full Operation
• Our 1- to 5-minute multiple “snapshot” samples found the following:
– Measured values of PM 2.5 or PM 4 increased across sampling dates between 30-31 July 2011 and 2 January 2013.
– Measured values during full operation were above the EPA annual and 24-hour PM2.5 standards.
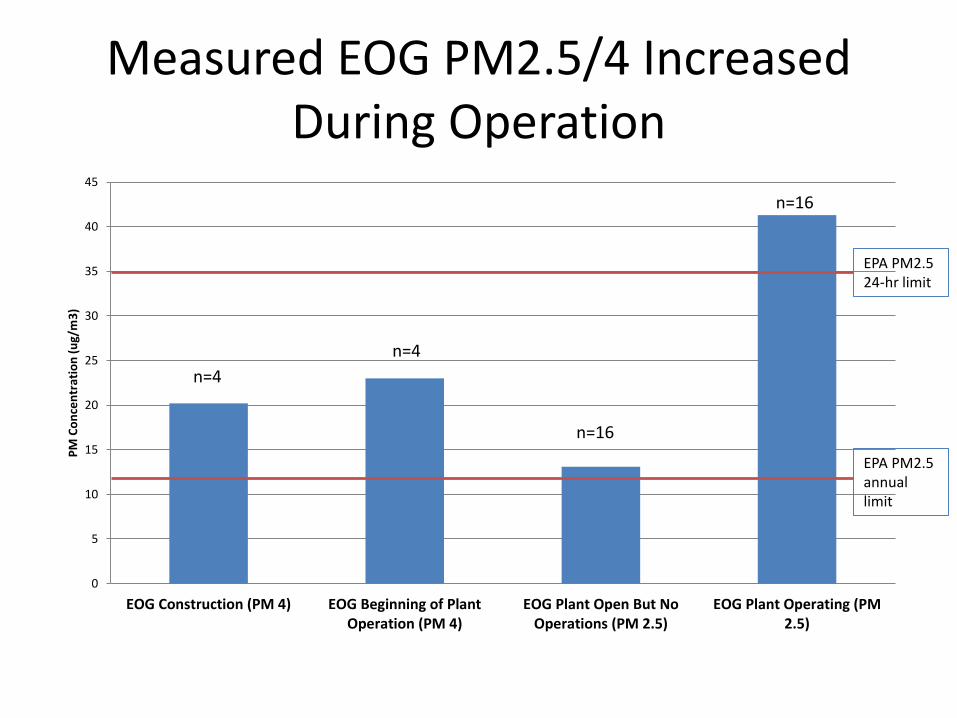
Measured EOG PM2.5/4 Increased During Operation
0
5
10
15
20
25
30
35
40
45
EOG Construction (PM 4) EOG Beginning of PlantOperation (PM 4)
EOG Plant Open But NoOperations (PM 2.5)
EOG Plant Operating (PM2.5)
PM
Co
nce
ntr
atio
n (
ug/
m3
)
n=16
n=4
EPA PM2.5 24-hr limit
EPA PM2.5 annual limit
n=16
n=4

Measured PM10 Levels During Operation Were Higher than the DNR
Model-Predicted Maximum Concentration and the EOG 24-Hour
Measured Levels

UWEC Measured PM10 Higher Than DNR Predicted or EOG Measured
0
25
50
75
100
125
150
PM
10
(m
icro
gram
s/m
3)
PM 10
EOG 24-hr Averages DNR Predicted Max. Offsite
UWEC Offsite 1-min Samples
EPA Standard

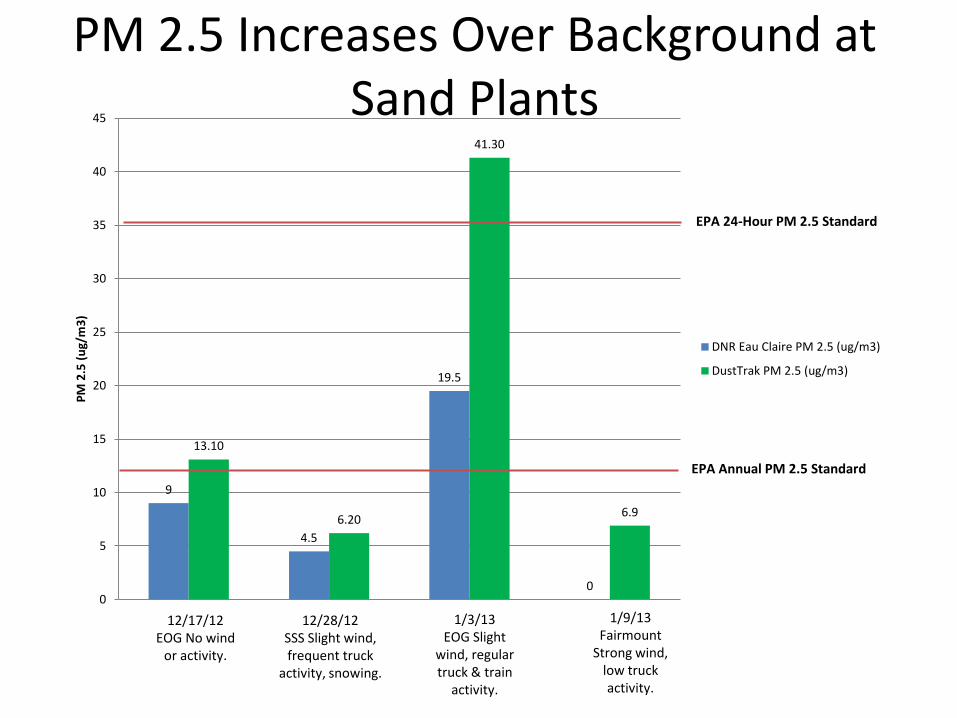
Measured Levels of PM2.5 at EOG, Superior Silica Sands (Auburn), and
Fairmount Mine (Menomonie) Were 1.7-22 micrograms/m3 Higher Than
Concurrent DNR Regional Levels
• Average measured PM2.5 levels were compared to listed Eau Claire DNR PM2.5 levels over the same hourly periods.
9
4.5
19.5
0
13.10
6.20
41.30
6.9
0
5
10
15
20
25
30
35
40
45
PM
2.5
(u
g/m
3)
DNR Eau Claire PM 2.5 (ug/m3)
DustTrak PM 2.5 (ug/m3)
12/17/12 EOG No wind
or activity.
12/28/12 SSS Slight wind, frequent truck
activity, snowing.
1/3/13 EOG Slight
wind, regular truck & train
activity.
1/9/13 Fairmount
Strong wind, low truck activity.
EPA Annual PM 2.5 Standard
EPA 24-Hour PM 2.5 Standard
PM 2.5 Increases Over Background at Sand Plants

Measurement and Enforcement of the Current EPA 12 micrograms/m3 PM2.5
Standard is Likely to Protect Against Silicosis Risk
• Measured 14.5% silica concentration in 41 respirable dust samples collected in Wisconsin by MSHA.
• State of California OEHHA reference concentration of 3 micrograms/m3 respirable crystalline silica.
• 12 micrograms/m3 PM2.5 x 14.5% = 1.74 micrograms/m3.
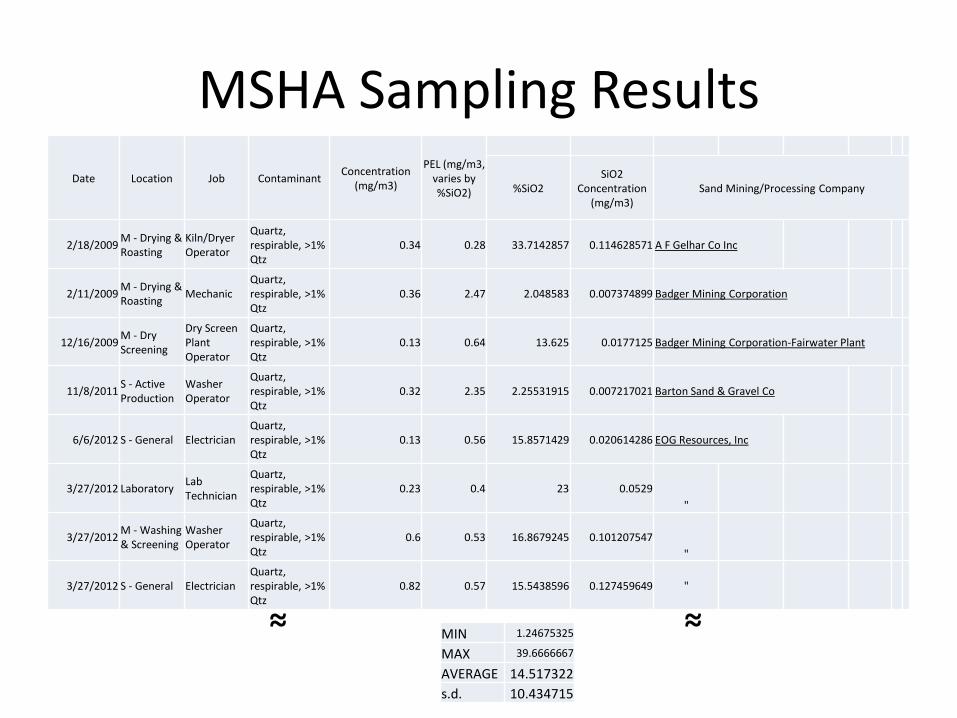
MSHA Sampling Results
Date Location Job Contaminant Concentration
(mg/m3)
PEL (mg/m3, varies by %SiO2)
%SiO2
SiO2 Concentration
(mg/m3) Sand Mining/Processing Company
2/18/2009 M - Drying & Roasting
Kiln/Dryer Operator
Quartz, respirable, >1% Qtz
0.34 0.28 33.7142857 0.114628571 A F Gelhar Co Inc
2/11/2009 M - Drying & Roasting
Mechanic
Quartz, respirable, >1% Qtz
0.36 2.47 2.048583 0.007374899 Badger Mining Corporation
12/16/2009 M - Dry Screening
Dry Screen Plant Operator
Quartz, respirable, >1% Qtz
0.13 0.64 13.625 0.0177125 Badger Mining Corporation-Fairwater Plant
11/8/2011 S - Active Production
Washer Operator
Quartz, respirable, >1% Qtz
0.32 2.35 2.25531915 0.007217021 Barton Sand & Gravel Co
6/6/2012 S - General Electrician
Quartz, respirable, >1% Qtz
0.13 0.56 15.8571429 0.020614286 EOG Resources, Inc
3/27/2012 Laboratory Lab Technician
Quartz, respirable, >1% Qtz
0.23 0.4 23 0.0529
"
3/27/2012 M - Washing & Screening
Washer Operator
Quartz, respirable, >1% Qtz
0.6 0.53 16.8679245 0.101207547
"
3/27/2012 S - General Electrician
Quartz, respirable, >1% Qtz
0.82 0.57 15.5438596 0.127459649 "
MIN 1.24675325
MAX 39.6666667
AVERAGE 14.517322
s.d. 10.434715

Snow, Wind and Degree of Plant Activity Appear to Influence Measured
PM2.5 Levels
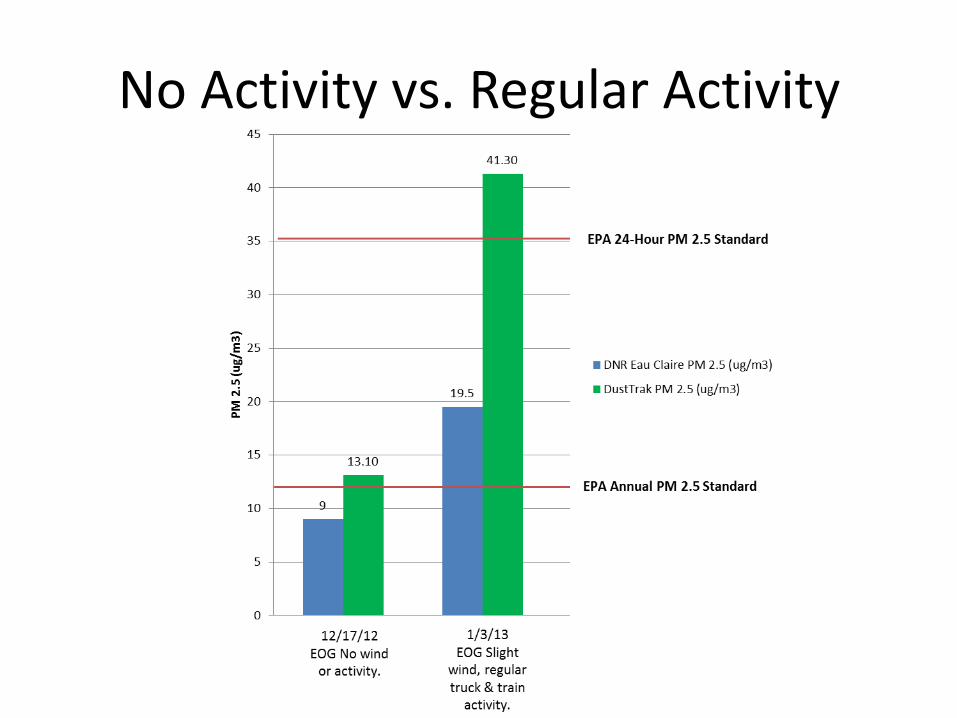
No Activity vs. Regular Activity

Bridge Creek Samples Were Higher than DNR Background Levels


Conclusions
• PM2.5 (particles with diameters of 2.5 micrometers and less) are of most concern to public health;
• Measurement and enforcement of the current EPA annual PM2.5 standard of 12 micrograms/m3 is likely to protect against silicosis risk from respirable crystalline silica;
• Our 1- to 5-minute multiple "snapshot" samples found that the measured levels of PM2.5/4 increased starting from the Chippewa Falls EOG plant construction through full operation;
• Our measured PM10 levels during operation were higher than the DNR model-predicted maximum concentration and the EOG 24-hour measured levels;
• Measured levels of PM2.5 at EOG, Superior Silica Sands (Auburn), Fairmount mine (Menomonie), and Hi-Crush (Bridge Creek) were 1.7-22 micrograms/m3 higher than concurrent DNR regional levels; and
• Snow, wind and degree of plant activity appear to influence measured PM2.5 levels.
Next Steps
1. Awaiting DNR response to our request to co-locate our instruments with theirs in Eau Claire to assess any bias.
2. Sampling along train route corridors.
3. Revisit sites measured in winter to assess differences in PM10 and PM2.5 during summer months.

DNR Violations of Truck-to-Train Transfer
“Pattison Sand South Main Street older conveyor spout not properly sealed to railcar (01/09/2013)”


Questions?
• Crispin Pierce, PhD
• Associate Professor, University of Wisconsin-Eau Claire
• 715-836-5589
• http://www.uwec.edu/CONHS/programs/enph/silica/silicaresearch1.htm