Embed Size (px)
Citation preview

San Francisco Department of Public Health: Sustainable Communities Health Assessment
Date: July 23, 2012 Project: Jewish Home of San Francisco
Preliminary project plans include the addition of 23,000 gross square feet of retail space along Mission Street and 338 senior residences.1
Requestor: Andrea Contreras
Environmental Planning, San Francisco Planning Department Objectives:
Characterize existing conditions specifically as they relate to pedestrian safety
Make design recommendations based on the existing conditions assessment
Scope:
Assessed existing conditions utilizing SFDPH GIS-based health and sustainability tools:
o Generated corridor characteristics on transit, transportation, neighborhood demographics, and pedestrian injury factors, utilizing the Pedestrian Geodatabase
o Audited streets adjacent and proximate to the project using the Pedestrian Environmental Quality Index (PEQI), then mapped and analyzed the data
Reviewed other analyses related or proximate to the site generated by various city processes in recent years
Made site-specific recommendations informed by the above data and analyses and empirical evidence regarding effective measures to protect pedestrian safety and promote safe walking, particularly among seniors
Contact: Megan Wier, San Francisco Department of Public Health [email protected]; 415-252-3972
1 Available at http://www.sfplanning.org/ftp/files/notice/2011.1323U.pdf

Existing Conditions
Project
Preliminary project plans for the Jewish Home of San Francisco include the addition of 23,000 gross
square feet of retail space along Mission Street and 338 senior residences.7 These changes will attract
more transit riders and pedestrians to sidewalks and street crossings along Mission Street and Silver
Avenue. Given the nature of the project, it is likely that a significant proportion of the existing and future
pedestrian population are and will be seniors, who may have mobility impairments or other disabilities
that make street crossings difficult and more time consuming, and who are particularly vulnerable to
serious and fatal injury in traffic collisions. Based on analyses conducted by SFDPH, the pedestrian
death rate for seniors in San Francisco is four times that of adults, and eleven times that of children and
youth.
Analyses: SFDPH GIS-Based Health and Sustainability Tools
SFDPH has two principle GIS-based tools for examining existing pedestrian conditions that are utilized in
the following analyses: the pedestrian safety geodatabase, which can be used to generate corridor
characteristics for a ¼ mile buffer around a street corridor and for summarizing available information on
pedestrian injuries resulting from motor vehicle collisions in a particular area, and the Pedestrian
Environmental Quality Index (PEQI), which is an audit-based tool for gathering information on built
environment conditions and comparing streets and intersections in a project area based on direct
observation. Corridor and collision profiles based on the most recent available data are included in
Appendix A. An explanation of the PEQI is included in Appendix B.
Transportation and Transit Characteristics
The Jewish Home is located in a lower density residential area of the Excelsior/Outer Mission
neighborhood of southeastern San Francisco. With the current configuration, the main entrance is from
Silver Street to the North, with egress east onto Mission Street. The site is also bordered by Lisbon
Street to the west and Avalon Street to the South. The site is surrounded on all sides by a low wall and
foliage that separates it from the street. The only pedestrian entrance is located on Silver Avenue,
separated from the main drive by bollards and a fence (Figure 1).
7 Available at http://www.sfplanning.org/ftp/files/notice/2011.1323U.pdf

Figure 2. Intersection of Mission Street and Silver Avenue near entrance to Jewish Home. Source: Google StreetView
Six Muni lines have stops along Mission Street near Mission Street and Silver Avenue (52, 49, 14, 14L,
14X, SM) running an estimated 75 buses per day along Mission Street between Silver and Leo Street. An
additional Muni line (49) runs down Silver Avenue, with transit stops 175 feet from the main entrance to
the Jewish Home, shown in Figure 2. Estimated traffic volume along this corridor is 10,500 vehicles per
day, while estimated transit ridership is 33,693 passengers per day and an estimated pedestrian volume
of 7,500 trips per day. See the Transportation and Transit Characteristics of the Corridor Profile for
Mission Street between Silver Avenue and Leo Street in Appendix A for more detail regarding these
statistics.
Figure 1. Entrance to Jewish Home of San Francisco on Silver Avenue and exit on Mission Street. Source: Google StreetView
Neighborhood Demographics
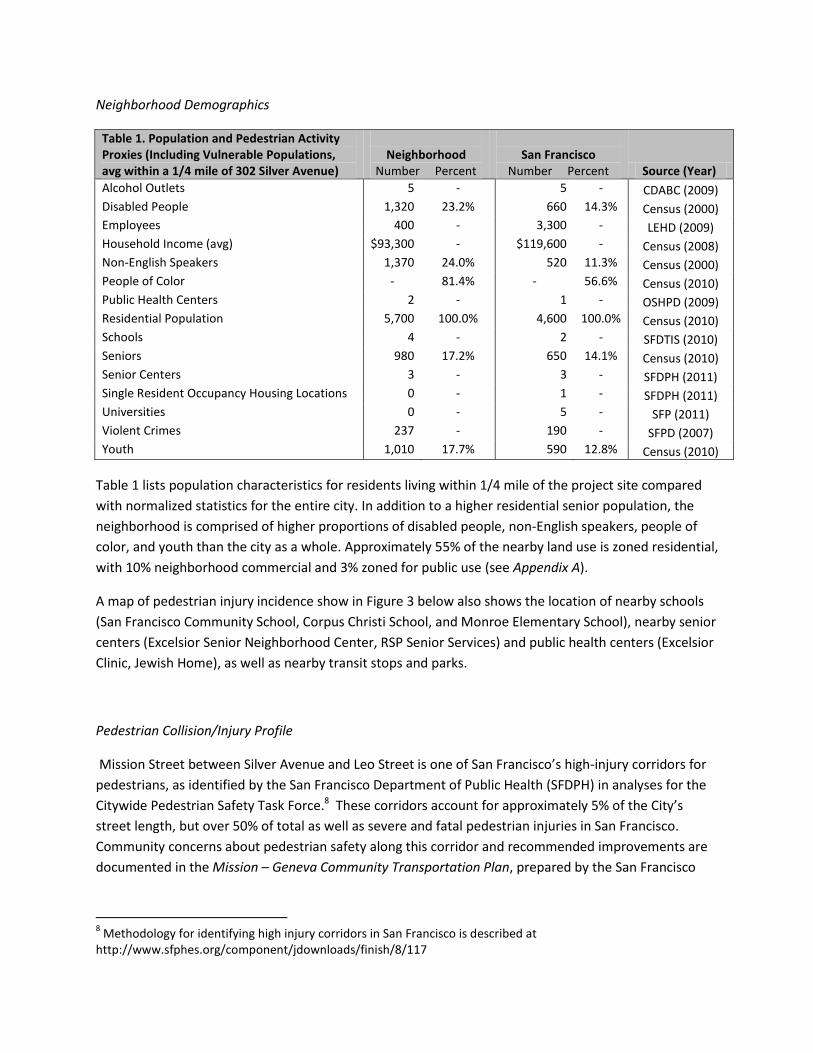
Table 1. Population and Pedestrian Activity Proxies (Including Vulnerable Populations, avg within a 1/4 mile of 302 Silver Avenue)
Neighborhood
Number Percent
San Francisco
Number Percent Source (Year)
Alcohol Outlets 5 - 5 - CDABC (2009) Disabled People 1,320 23.2% 660 14.3% Census (2000) Employees 400 - 3,300 - LEHD (2009) Household Income (avg) $93,300 - $119,600 - Census (2008) Non-English Speakers 1,370 24.0% 520 11.3% Census (2000) People of Color - 81.4% - 56.6% Census (2010) Public Health Centers 2 - 1 - OSHPD (2009) Residential Population 5,700 100.0% 4,600 100.0% Census (2010) Schools 4 - 2 - SFDTIS (2010) Seniors 980 17.2% 650 14.1% Census (2010) Senior Centers 3 - 3 - SFDPH (2011) Single Resident Occupancy Housing Locations 0 - 1 - SFDPH (2011) Universities 0 - 5 - SFP (2011) Violent Crimes 237 - 190 - SFPD (2007) Youth 1,010 17.7% 590 12.8% Census (2010)
Table 1 lists population characteristics for residents living within 1/4 mile of the project site compared
with normalized statistics for the entire city. In addition to a higher residential senior population, the
neighborhood is comprised of higher proportions of disabled people, non-English speakers, people of
color, and youth than the city as a whole. Approximately 55% of the nearby land use is zoned residential,
with 10% neighborhood commercial and 3% zoned for public use (see Appendix A).
A map of pedestrian injury incidence show in Figure 3 below also shows the location of nearby schools
(San Francisco Community School, Corpus Christi School, and Monroe Elementary School), nearby senior
centers (Excelsior Senior Neighborhood Center, RSP Senior Services) and public health centers (Excelsior
Clinic, Jewish Home), as well as nearby transit stops and parks.
Pedestrian Collision/Injury Profile
Mission Street between Silver Avenue and Leo Street is one of San Francisco’s high-injury corridors for
pedestrians, as identified by the San Francisco Department of Public Health (SFDPH) in analyses for the
Citywide Pedestrian Safety Task Force.8 These corridors account for approximately 5% of the City’s
street length, but over 50% of total as well as severe and fatal pedestrian injuries in San Francisco.
Community concerns about pedestrian safety along this corridor and recommended improvements are
documented in the Mission – Geneva Community Transportation Plan, prepared by the San Francisco
8 Methodology for identifying high injury corridors in San Francisco is described at
http://www.sfphes.org/component/jdownloads/finish/8/117

County Transportation Authority in 2007.9 The intersection of Mission Street, Ocean Avenue, and Persia
Avenue 1/3 mile from the project site also has the third highest pedestrian injuries per estimated
pedestrian crossing rate of any intersection in the city.13 Community feedback collected by the SFCTA
suggests that residents generally do not perceive the area as comfortable or safe for pedestrians.14 The
neighborhood is characterized by wide streets and limited pedestrian amenities or engineering features
to make pedestrians more visible or crossings safer.
Figure 3. Area map including vehicle-pedestrian injuries (SWITRS 2006-2010).
Figure 3 maps vehicle-pedestrian injuries near the Jewish Home. According to the Statewide Integrated
Traffic Records System (SWITRS, see Appendix A), there were 37 reported pedestrian injuries along
Mission Street between Silver and Leo between 2006 and 2010, 4 of which were severe. 24% of those
injured were over the age of 65, compared to 14% of pedestrians injured citywide. 73% of those injured
were crossing the street in a crosswalk at an intersection. In 46% of collisions, drivers were turning left -
compared to 25% of vehicle-pedestrian injury collisions citywide.
9 Available at http://www.mtc.ca.gov/planning/cbtp/Mission-Geneva.pdf
13 A case study of the Persia Triangle is included in the Walk First Final Report, http://www.sf-
planning.org/ftp/files/Citywide/WalkFirst/WalkFirst_Final_Document_102711.pdf 14
Mission-Geneva Neighborhood Transportation Plan, http://www.mtc.ca.gov/planning/cbtp/Mission-Geneva.pdf
The highest number of injuries per intersection along this corridor (n=11) occurred at Mission Street and
Silver Avenue. In 7 of the 11 injuries, the driver was making a left hand turn, 6 out of 7 times from
Mission Street onto Silver Avenue, and 5 out of 7 times from the southbound lanes of Mission Street
onto Silver Avenue near the entrance to the Jewish Home.
Pedestrian Infrastructure and Environment
Sidewalks along Mission Street are wide (12 feet or greater), and on other area streets are of sufficient
width and reasonably good condition. There are street lights along Mission Street, however, street light
configurations are not optimized to illuminate pedestrians in the crosswalk at some intersections, and
there is no pedestrian scale lighting to illuminate sidewalks along any area sidewalks.
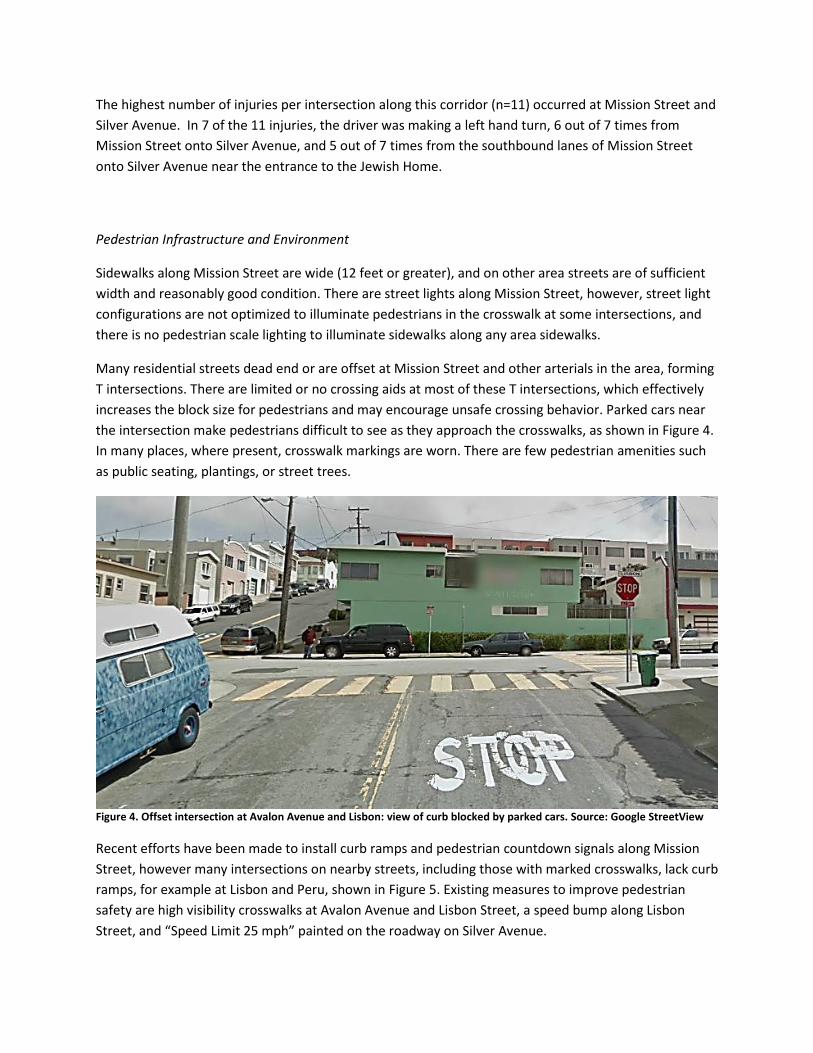
Many residential streets dead end or are offset at Mission Street and other arterials in the area, forming
T intersections. There are limited or no crossing aids at most of these T intersections, which effectively
increases the block size for pedestrians and may encourage unsafe crossing behavior. Parked cars near
the intersection make pedestrians difficult to see as they approach the crosswalks, as shown in Figure 4.
In many places, where present, crosswalk markings are worn. There are few pedestrian amenities such
as public seating, plantings, or street trees.
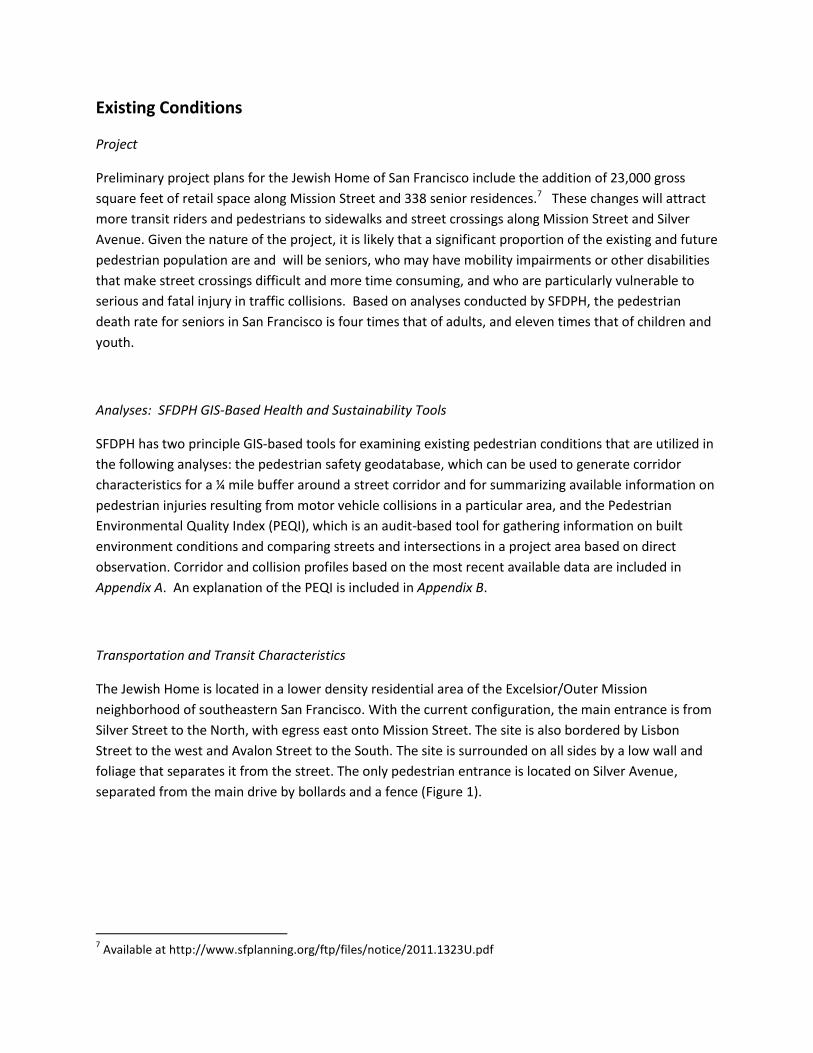
Figure 4. Offset intersection at Avalon Avenue and Lisbon: view of curb blocked by parked cars. Source: Google StreetView
Recent efforts have been made to install curb ramps and pedestrian countdown signals along Mission
Street, however many intersections on nearby streets, including those with marked crosswalks, lack curb
ramps, for example at Lisbon and Peru, shown in Figure 5. Existing measures to improve pedestrian
safety are high visibility crosswalks at Avalon Avenue and Lisbon Street, a speed bump along Lisbon
Street, and “Speed Limit 25 mph” painted on the roadway on Silver Avenue.
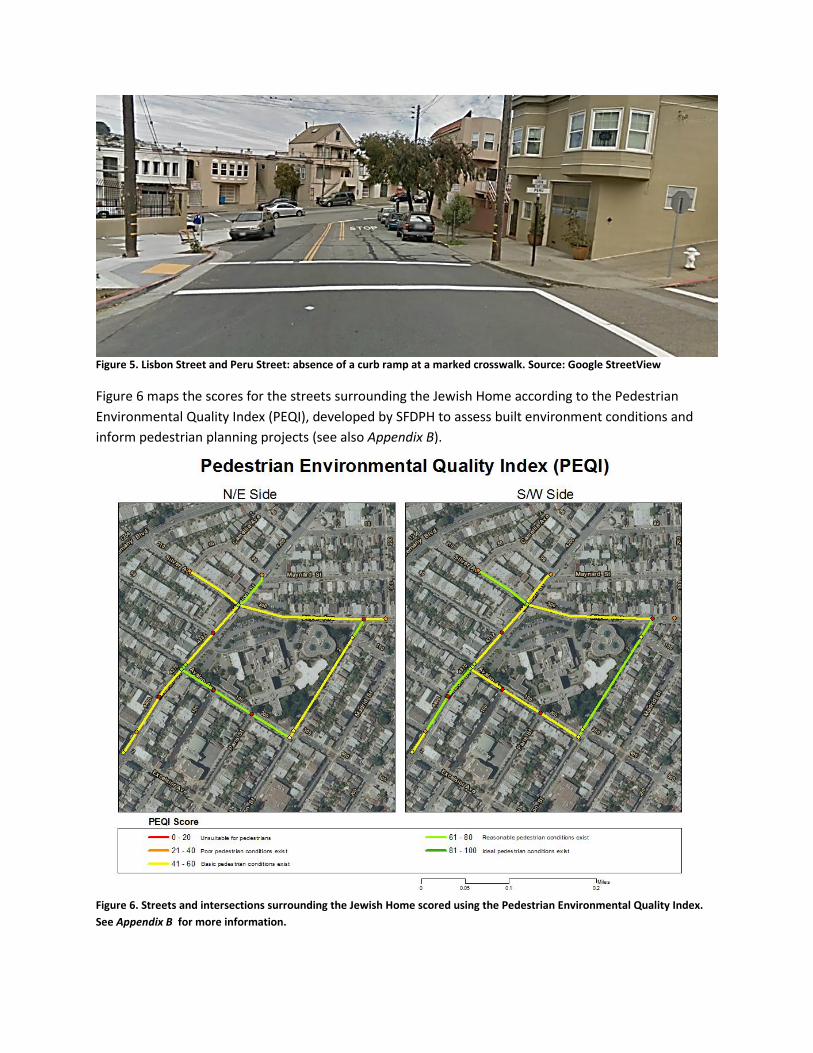
Figure 5. Lisbon Street and Peru Street: absence of a curb ramp at a marked crosswalk. Source: Google StreetView
Figure 6 maps the scores for the streets surrounding the Jewish Home according to the Pedestrian
Environmental Quality Index (PEQI), developed by SFDPH to assess built environment conditions and
inform pedestrian planning projects (see also Appendix B).
Figure 6. Streets and intersections surrounding the Jewish Home scored using the Pedestrian Environmental Quality Index.
See Appendix B for more information.
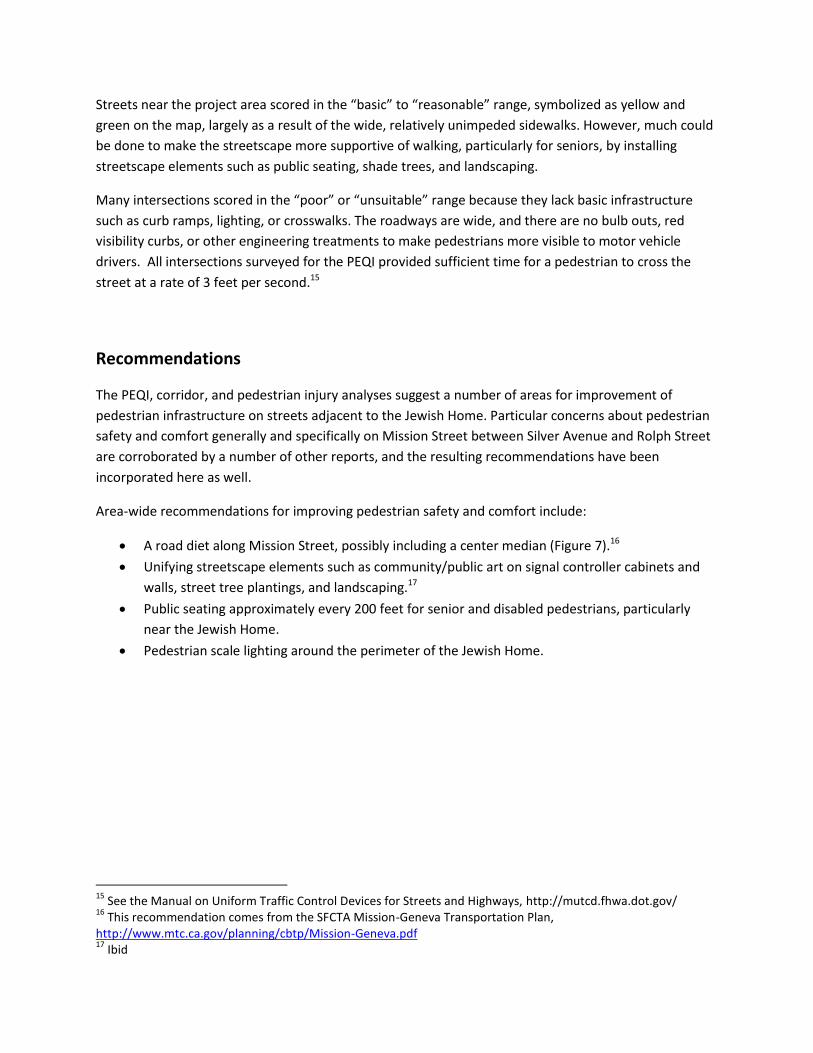
Streets near the project area scored in the “basic” to “reasonable” range, symbolized as yellow and
green on the map, largely as a result of the wide, relatively unimpeded sidewalks. However, much could
be done to make the streetscape more supportive of walking, particularly for seniors, by installing
streetscape elements such as public seating, shade trees, and landscaping.
Many intersections scored in the “poor” or “unsuitable” range because they lack basic infrastructure
such as curb ramps, lighting, or crosswalks. The roadways are wide, and there are no bulb outs, red
visibility curbs, or other engineering treatments to make pedestrians more visible to motor vehicle
drivers. All intersections surveyed for the PEQI provided sufficient time for a pedestrian to cross the
street at a rate of 3 feet per second.15
Recommendations
The PEQI, corridor, and pedestrian injury analyses suggest a number of areas for improvement of
pedestrian infrastructure on streets adjacent to the Jewish Home. Particular concerns about pedestrian
safety and comfort generally and specifically on Mission Street between Silver Avenue and Rolph Street
are corroborated by a number of other reports, and the resulting recommendations have been
incorporated here as well.
Area-wide recommendations for improving pedestrian safety and comfort include:
A road diet along Mission Street, possibly including a center median (Figure 7).16
Unifying streetscape elements such as community/public art on signal controller cabinets and
walls, street tree plantings, and landscaping.17
Public seating approximately every 200 feet for senior and disabled pedestrians, particularly
near the Jewish Home.
Pedestrian scale lighting around the perimeter of the Jewish Home.
15
See the Manual on Uniform Traffic Control Devices for Streets and Highways, http://mutcd.fhwa.dot.gov/ 16
This recommendation comes from the SFCTA Mission-Geneva Transportation Plan, http://www.mtc.ca.gov/planning/cbtp/Mission-Geneva.pdf 17
Ibid
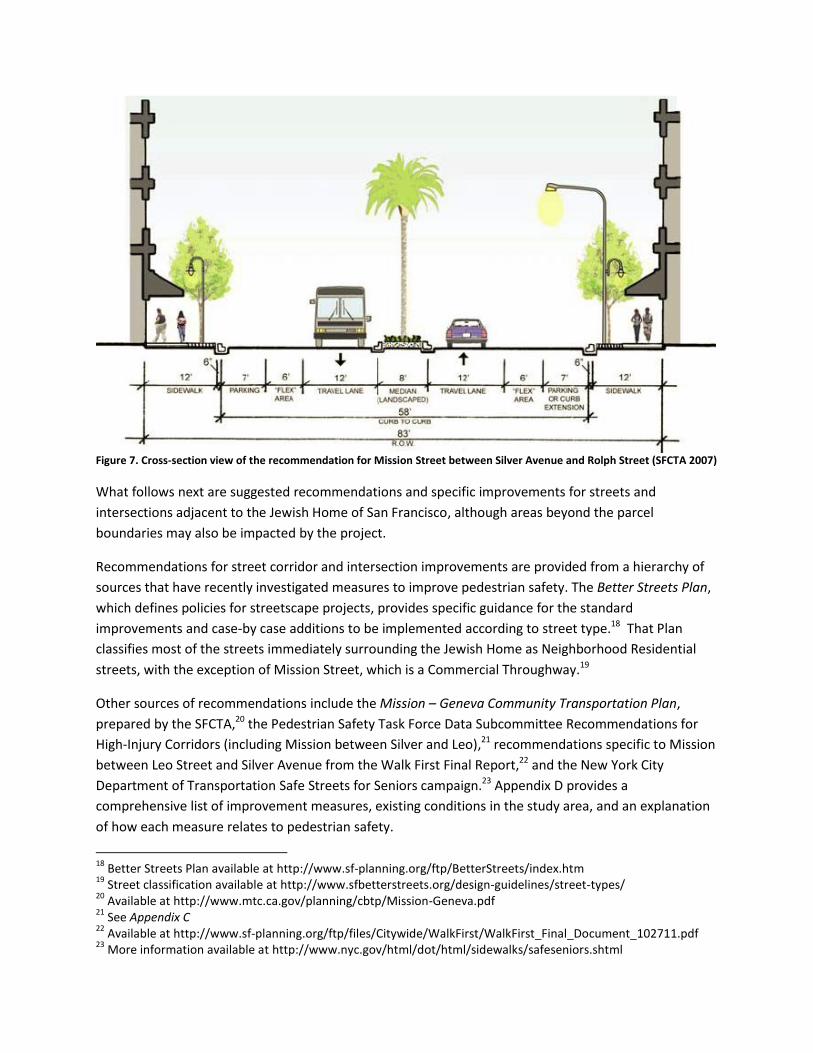
Figure 7. Cross-section view of the recommendation for Mission Street between Silver Avenue and Rolph Street (SFCTA 2007)
What follows next are suggested recommendations and specific improvements for streets and
intersections adjacent to the Jewish Home of San Francisco, although areas beyond the parcel
boundaries may also be impacted by the project.
Recommendations for street corridor and intersection improvements are provided from a hierarchy of
sources that have recently investigated measures to improve pedestrian safety. The Better Streets Plan,
which defines policies for streetscape projects, provides specific guidance for the standard
improvements and case-by case additions to be implemented according to street type.18 That Plan
classifies most of the streets immediately surrounding the Jewish Home as Neighborhood Residential
streets, with the exception of Mission Street, which is a Commercial Throughway.19
Other sources of recommendations include the Mission – Geneva Community Transportation Plan,
prepared by the SFCTA,20 the Pedestrian Safety Task Force Data Subcommittee Recommendations for
High-Injury Corridors (including Mission between Silver and Leo),21 recommendations specific to Mission
between Leo Street and Silver Avenue from the Walk First Final Report,22 and the New York City
Department of Transportation Safe Streets for Seniors campaign.23 Appendix D provides a
comprehensive list of improvement measures, existing conditions in the study area, and an explanation
of how each measure relates to pedestrian safety.
18
Better Streets Plan available at http://www.sf-planning.org/ftp/BetterStreets/index.htm 19
Street classification available at http://www.sfbetterstreets.org/design-guidelines/street-types/ 20
Available at http://www.mtc.ca.gov/planning/cbtp/Mission-Geneva.pdf 21
See Appendix C 22
Available at http://www.sf-planning.org/ftp/files/Citywide/WalkFirst/WalkFirst_Final_Document_102711.pdf 23
More information available at http://www.nyc.gov/html/dot/html/sidewalks/safeseniors.shtml

MISSION STREET
Recommendations for the Mission Street Corridor: 1. Decrease vehicle speed. 2. Make pedestrians more visible to drivers. 3. Create a streetscape that supports walking.
Specific improvements:
Rumble strips, speed radar signs
Median
Traffic lane narrowing / remove traffic lanes
Public seating and other street furnishings
Street trees, landscaping, planters
Public art
MISSION STREET
Recommendations for intersections along Mission Street:
Eliminate left-turn collisions.
Increase pedestrian visibility/vehicle yielding during vehicle turning movement and near Muni stops.
Ensure that senior pedestrians can safely and comfortably cross the street.
Mission Street / Silver Avenue – specific improvements:
Accessible pedestrian signals
Advanced stop lines
Bus bulb outs
Flashing beacon
High visibility crosswalks
Leading pedestrian interval
Left turn pockets, protected turn phases
Lighting for eastern crosswalk on Silver Avenue
Pedestrian refuge island or nose cone
Mission Street / Tingley St – specific improvements:
Accessible pedestrian signals
Parking restrictions near intersection
Left turn pockets
Lighting
If midblock crossing is feasible: o High visibility crosswalks across Mission Street o Bulb outs o Flashing beacon o Advanced stop / limit lines
Mission Street / Avalon Avenue / Theresa Street – specific improvements:
Parking restrictions near the intersection
Accessible pedestrian signals
Advanced stop/limit lines
Bulb outs
Leading pedestrian interval
Lighting for crosswalks on Avalon Avenue / Theresa Street
Median island, nose cone, or pedestrian refuge island
MISSION AND SILVER
MISSION AND TINGLEY
MISSION AND AVALON / THERESA
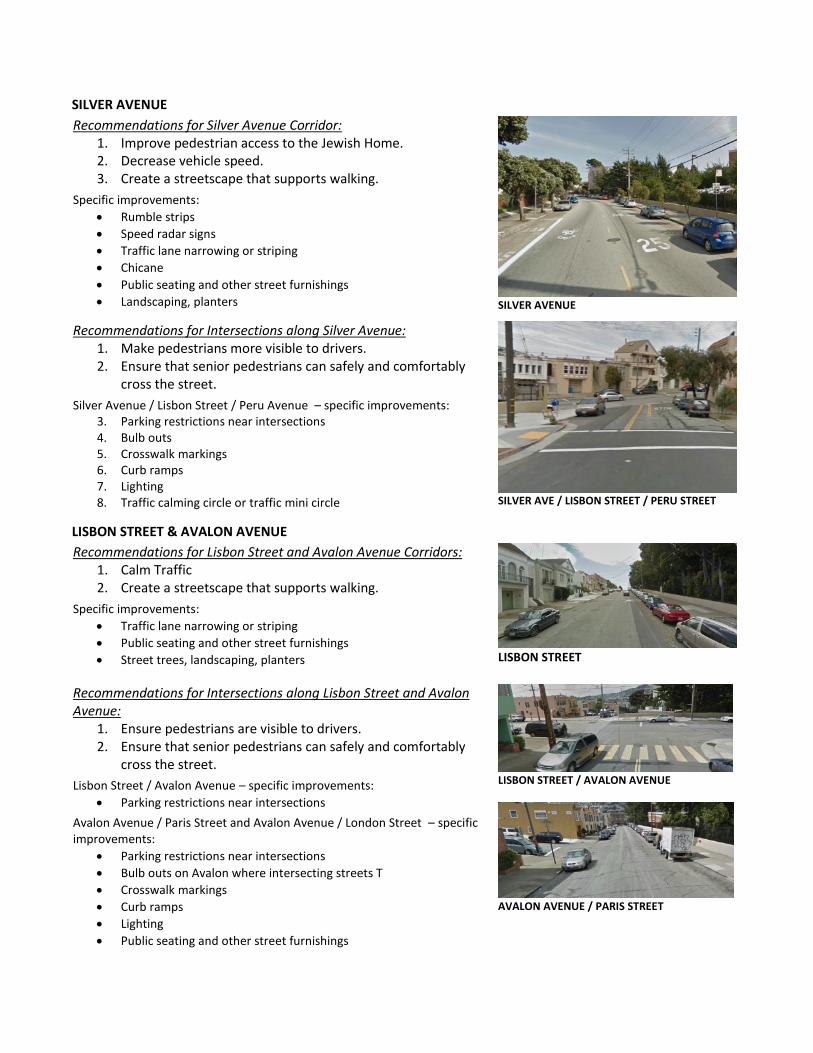
SILVER AVENUE
Recommendations for Silver Avenue Corridor: 1. Improve pedestrian access to the Jewish Home. 2. Decrease vehicle speed. 3. Create a streetscape that supports walking.
Specific improvements:
Rumble strips
Speed radar signs
Traffic lane narrowing or striping
Chicane
Public seating and other street furnishings
Landscaping, planters
SILVER AVENUE
Recommendations for Intersections along Silver Avenue: 1. Make pedestrians more visible to drivers. 2. Ensure that senior pedestrians can safely and comfortably
cross the street.
Silver Avenue / Lisbon Street / Peru Avenue – specific improvements: 3. Parking restrictions near intersections 4. Bulb outs 5. Crosswalk markings 6. Curb ramps 7. Lighting 8. Traffic calming circle or traffic mini circle
SILVER AVE / LISBON STREET / PERU STREET
LISBON STREET & AVALON AVENUE
Recommendations for Lisbon Street and Avalon Avenue Corridors: 1. Calm Traffic 2. Create a streetscape that supports walking.
Specific improvements:
Traffic lane narrowing or striping
Public seating and other street furnishings
Street trees, landscaping, planters
LISBON STREET
Recommendations for Intersections along Lisbon Street and Avalon Avenue:
1. Ensure pedestrians are visible to drivers. 2. Ensure that senior pedestrians can safely and comfortably
cross the street.
Lisbon Street / Avalon Avenue – specific improvements:
Parking restrictions near intersections
Avalon Avenue / Paris Street and Avalon Avenue / London Street – specific improvements:
Parking restrictions near intersections
Bulb outs on Avalon where intersecting streets T
Crosswalk markings
Curb ramps
Lighting
Public seating and other street furnishings
LISBON STREET / AVALON AVENUE
AVALON AVENUE / PARIS STREET

Street trees, landscaping, planters
SFDPH additionally recommends obtaining the following additional sources of information to inform the
transportation study:
Analysis of pedestrian flow patterns including from bus stops along Mission Street, Silver Street,
Alemany Boulevard and Excelsior Avenue during different times of day, which could help prioritize
infrastructure improvements.
A speed study to assess the extent to which vehicle speed limits are exceeded in the project area (85th
percentile speed on Mission Street was not available from the SFMTA).
Feedback from community and Jewish Home residents about perceived hazards and preferred
countermeasures and improvements.
Recommendations from SFMTA on how to improve pedestrian safety mindful of potential impacts on
transit effectiveness.
SFDPH understands that the project is still in a preliminary phase, and the number of residential units, retail
square footage, and parking spaces may change along with other details of the project. It is recommended
that the configuration of internal roads, driveways, loading zones, entrances, exits and walkways also be
reviewed when available to ensure they take pedestrian safety and comfort into account.
We look forward to helping to ensure the project promotes safe walking for seniors and all pedestrians.
Please contact Megan Wier ([email protected]) with questions or any additional requests for data or
analysis.

Number Percent Number Percent Number Percent
Transportation and Transit Characteristics Length (miles) 0.5 - 58 - 1,117 - SFDPW (2010)Segments (total) 15 - 1,119 - 15,444 - SFDPW (2010) Bike Lane (count of segments) 0 0.0% 243 21.7% 2,171 14.1% SFMTA (2010)Block Length (feet, avg) 180 - 370 - 410 - SFDPW (2011)Bus Traffic Volume (estimated daily, avg) 75 - 49 - 11 - SFCTA (2005)Freeway Ramps (count of segments) 0 0.0% 0 0.0% 141 0.9% SFMTA (2010)Lanes (avg) 2 - 2 - 1 - SFCTA (2005)Legs (avg) 3 - 4 - 3 - SFDPW (2010)Legs (max) 4 - 6 - 7 - SFDPW (2010)Muni Lines (avg) 5 - 4 - 1 - SFMTA (2010)Muni Lines (min) 4 - 0 - 0 - SFMTA (2010)Muni Lines (max) 6 - 26 - 26 - SFMTA (2010)Muni Stops 7 - 700 - 4,100 - SFMTA (2010)One-Way Street (count of segments) 0 0.0% 306 27.3% 1,673 10.8% SFCTA (2005)Pedestrian Volume (estimated daily, avg) 7,500 - 14,900 - 3,500 - SFMTA (2011)Regional Transit Stops (count of segments, 1/4 mile) 0 0.0% 278 24.8% 1,215 7.9% SFMTA (2010)Slope (avg, degrees) 2 - 3 - 6 - SFDPH (2007)Speed Limit (max) 25 - 35 - 45 - SFMTA (2010)Street Width (ft, avg) 31 - 40 - 38 - SFDPH (2004)Traffic Calming Features (count) 0 - 5 - 463 - SFDPW (2011)Traffic Volume (estimated daily, avg) 10,500 - 19,000 - 6,600 - SFCTA (2005)Transit Ridership (estimated daily, avg 1/8 mile) 33,693 - 35,568 - 12,472 - SFMTA (2011)Truck Route 14 93.3% 886 79.2% 3,396 22.0% SFMTA (2009)
Vehicle Speed (mph, avg) 1 n/a - 29 - 28 - SFMTA (2011)Street Characteristics Standardized (per 1/4 Mile)Parking Spots: Off-Street 139 - 453 - 106 - SFMTA (2011)Parking Spots: On-Street 64 - 46 - 26 - SFMTA (2011)Parking Spots: Metered 81 - 43 - 7 - SFMTA (2001)Muni Stops 3 - 3 - 1 - SFMTA (2010)Street Lights (SFPUC) 76 - 62 - 19 - SFMTA (2011)Trees 2 - 22 - 20 - SAIC (2007)Intersection Characteristics (Count)Accessible Pedestrian Signal 1 6.3% 56 7.0% 124 1.3% SFMTA (2011)High Visibility Crosswalk 2 12.5% 115 14.4% 1024 11.0% SFMTA (2011)
Appendix A: Corridor and Collision Profiles for Mission Street between Silver Avenue and Leo Street
Transportation, Land Use, and Population Factors
Corridor Profile Source (Year)Mission St San FranciscoHigh-Injury Corridors
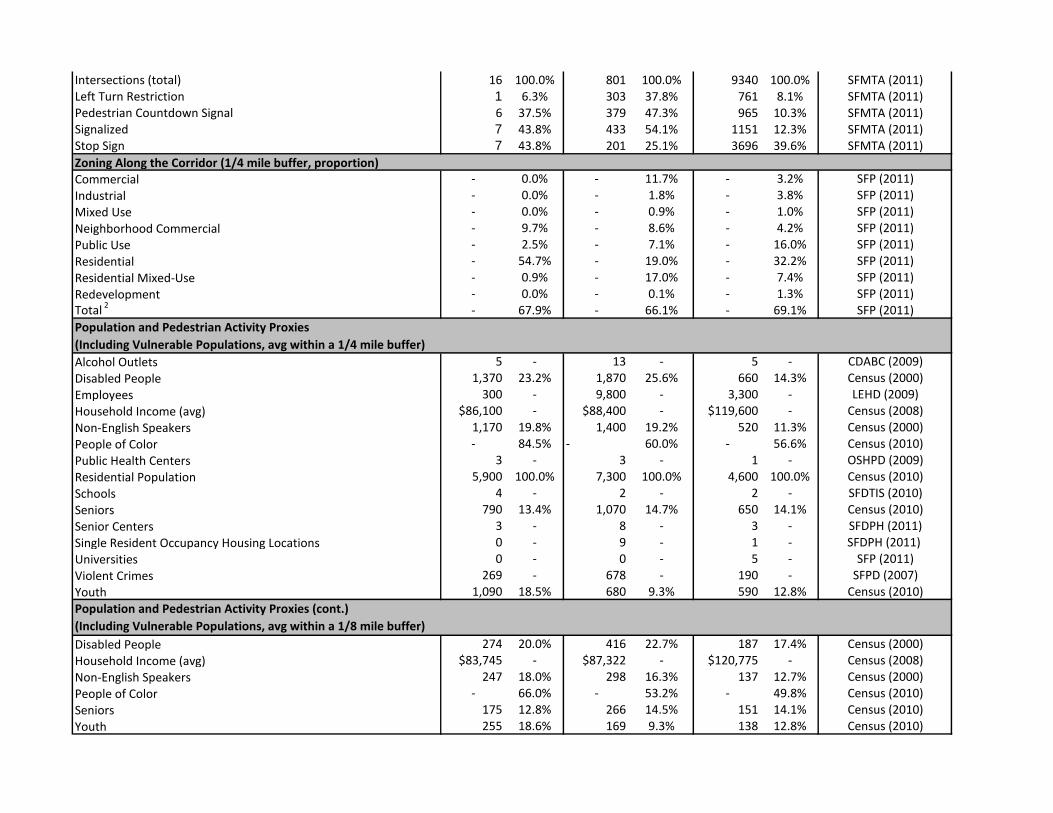
Intersections (total) 16 100.0% 801 100.0% 9340 100.0% SFMTA (2011)Left Turn Restriction 1 6.3% 303 37.8% 761 8.1% SFMTA (2011)Pedestrian Countdown Signal 6 37.5% 379 47.3% 965 10.3% SFMTA (2011)Signalized 7 43.8% 433 54.1% 1151 12.3% SFMTA (2011)Stop Sign 7 43.8% 201 25.1% 3696 39.6% SFMTA (2011)
Zoning Along the Corridor (1/4 mile buffer, proportion)Commercial - 0.0% - 11.7% - 3.2% SFP (2011)
Industrial - 0.0% - 1.8% - 3.8% SFP (2011)
Mixed Use - 0.0% - 0.9% - 1.0% SFP (2011)
Neighborhood Commercial - 9.7% - 8.6% - 4.2% SFP (2011)
Public Use - 2.5% - 7.1% - 16.0% SFP (2011)
Residential - 54.7% - 19.0% - 32.2% SFP (2011)
Residential Mixed-Use - 0.9% - 17.0% - 7.4% SFP (2011)
Redevelopment - 0.0% - 0.1% - 1.3% SFP (2011)Total 2 - 67.9% - 66.1% - 69.1% SFP (2011)
Alcohol Outlets 5 - 13 - 5 - CDABC (2009)
Disabled People 1,370 23.2% 1,870 25.6% 660 14.3% Census (2000)
Employees 300 - 9,800 - 3,300 - LEHD (2009)
Household Income (avg) $86,100 - $88,400 - $119,600 - Census (2008)
Non-English Speakers 1,170 19.8% 1,400 19.2% 520 11.3% Census (2000)
People of Color - 84.5% - 60.0% - 56.6% Census (2010)
Public Health Centers 3 - 3 - 1 - OSHPD (2009)
Residential Population 5,900 100.0% 7,300 100.0% 4,600 100.0% Census (2010)
Schools 4 - 2 - 2 - SFDTIS (2010)
Seniors 790 13.4% 1,070 14.7% 650 14.1% Census (2010)
Senior Centers 3 - 8 - 3 - SFDPH (2011)
Single Resident Occupancy Housing Locations 0 - 9 - 1 - SFDPH (2011)
Universities 0 - 0 - 5 - SFP (2011)
Violent Crimes 269 - 678 - 190 - SFPD (2007)
Youth 1,090 18.5% 680 9.3% 590 12.8% Census (2010)
Disabled People 274 20.0% 416 22.7% 187 17.4% Census (2000)
Household Income (avg) $83,745 - $87,322 - $120,775 - Census (2008)
Non-English Speakers 247 18.0% 298 16.3% 137 12.7% Census (2000)
People of Color - 66.0% - 53.2% - 49.8% Census (2010)
Seniors 175 12.8% 266 14.5% 151 14.1% Census (2010)
Youth 255 18.6% 169 9.3% 138 12.8% Census (2010)
Population and Pedestrian Activity Proxies (cont.)
(Including Vulnerable Populations, avg within a 1/8 mile buffer)
Population and Pedestrian Activity Proxies
(Including Vulnerable Populations, avg within a 1/4 mile buffer)
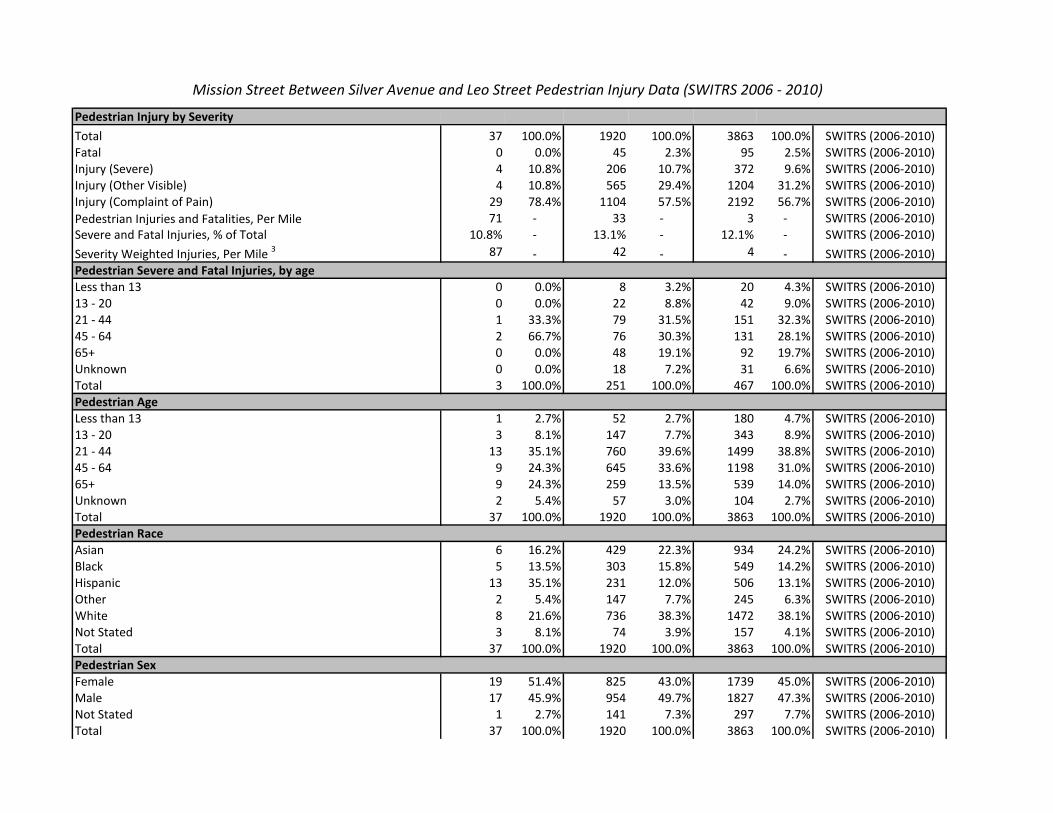
Pedestrian Injury by Severity
Total 37 100.0% 1920 100.0% 3863 100.0% SWITRS (2006-2010)Fatal 0 0.0% 45 2.3% 95 2.5% SWITRS (2006-2010)Injury (Severe) 4 10.8% 206 10.7% 372 9.6% SWITRS (2006-2010)Injury (Other Visible) 4 10.8% 565 29.4% 1204 31.2% SWITRS (2006-2010)Injury (Complaint of Pain) 29 78.4% 1104 57.5% 2192 56.7% SWITRS (2006-2010)
Pedestrian Injuries and Fatalities, Per Mile 71 - 33 - 3 - SWITRS (2006-2010)Severe and Fatal Injuries, % of Total 10.8% - 13.1% - 12.1% - SWITRS (2006-2010)
Severity Weighted Injuries, Per Mile 3 87 - 42 - 4 - SWITRS (2006-2010)Pedestrian Severe and Fatal Injuries, by age Less than 13 0 0.0% 8 3.2% 20 4.3% SWITRS (2006-2010)13 - 20 0 0.0% 22 8.8% 42 9.0% SWITRS (2006-2010)21 - 44 1 33.3% 79 31.5% 151 32.3% SWITRS (2006-2010)45 - 64 2 66.7% 76 30.3% 131 28.1% SWITRS (2006-2010)65+ 0 0.0% 48 19.1% 92 19.7% SWITRS (2006-2010)Unknown 0 0.0% 18 7.2% 31 6.6% SWITRS (2006-2010)Total 3 100.0% 251 100.0% 467 100.0% SWITRS (2006-2010)Pedestrian Age Less than 13 1 2.7% 52 2.7% 180 4.7% SWITRS (2006-2010)13 - 20 3 8.1% 147 7.7% 343 8.9% SWITRS (2006-2010)21 - 44 13 35.1% 760 39.6% 1499 38.8% SWITRS (2006-2010)45 - 64 9 24.3% 645 33.6% 1198 31.0% SWITRS (2006-2010)65+ 9 24.3% 259 13.5% 539 14.0% SWITRS (2006-2010)Unknown 2 5.4% 57 3.0% 104 2.7% SWITRS (2006-2010)Total 37 100.0% 1920 100.0% 3863 100.0% SWITRS (2006-2010)Pedestrian RaceAsian 6 16.2% 429 22.3% 934 24.2% SWITRS (2006-2010)Black 5 13.5% 303 15.8% 549 14.2% SWITRS (2006-2010)Hispanic 13 35.1% 231 12.0% 506 13.1% SWITRS (2006-2010)Other 2 5.4% 147 7.7% 245 6.3% SWITRS (2006-2010)White 8 21.6% 736 38.3% 1472 38.1% SWITRS (2006-2010)Not Stated 3 8.1% 74 3.9% 157 4.1% SWITRS (2006-2010)Total 37 100.0% 1920 100.0% 3863 100.0% SWITRS (2006-2010)Pedestrian SexFemale 19 51.4% 825 43.0% 1739 45.0% SWITRS (2006-2010)Male 17 45.9% 954 49.7% 1827 47.3% SWITRS (2006-2010)Not Stated 1 2.7% 141 7.3% 297 7.7% SWITRS (2006-2010)Total 37 100.0% 1920 100.0% 3863 100.0% SWITRS (2006-2010)
Mission Street Between Silver Avenue and Leo Street Pedestrian Injury Data (SWITRS 2006 - 2010)
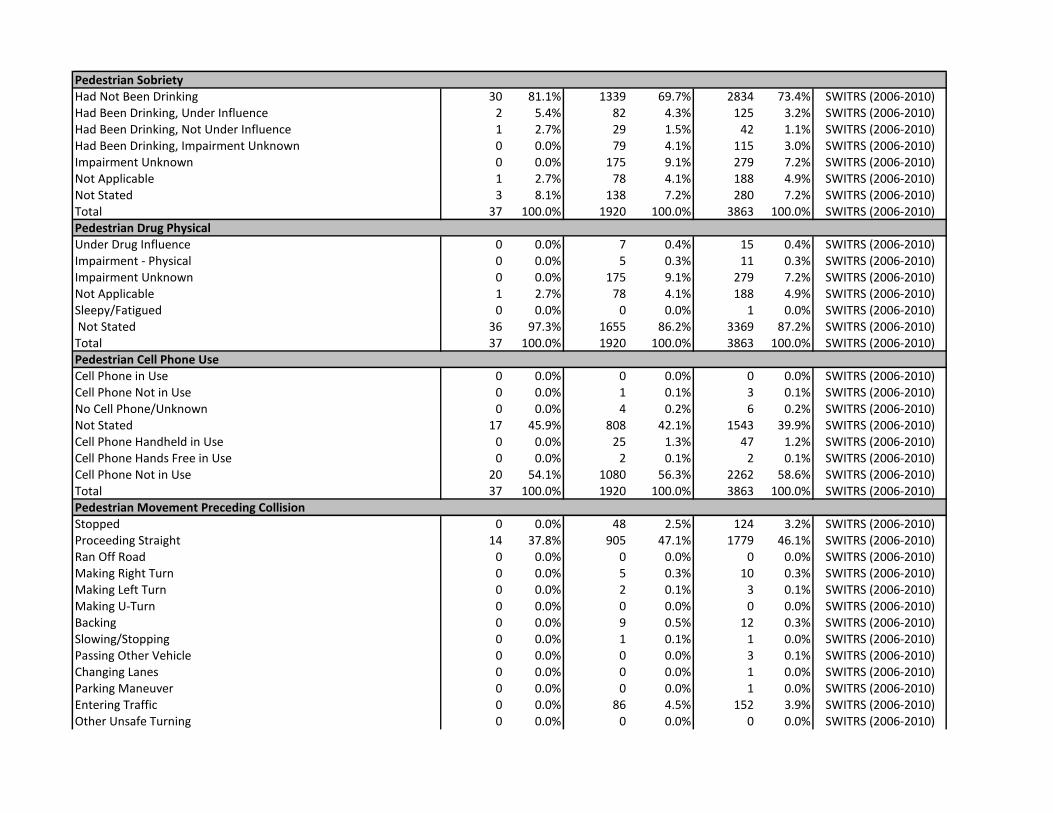
Pedestrian SobrietyHad Not Been Drinking 30 81.1% 1339 69.7% 2834 73.4% SWITRS (2006-2010)Had Been Drinking, Under Influence 2 5.4% 82 4.3% 125 3.2% SWITRS (2006-2010)Had Been Drinking, Not Under Influence 1 2.7% 29 1.5% 42 1.1% SWITRS (2006-2010)Had Been Drinking, Impairment Unknown 0 0.0% 79 4.1% 115 3.0% SWITRS (2006-2010)Impairment Unknown 0 0.0% 175 9.1% 279 7.2% SWITRS (2006-2010)Not Applicable 1 2.7% 78 4.1% 188 4.9% SWITRS (2006-2010)Not Stated 3 8.1% 138 7.2% 280 7.2% SWITRS (2006-2010)Total 37 100.0% 1920 100.0% 3863 100.0% SWITRS (2006-2010)Pedestrian Drug PhysicalUnder Drug Influence 0 0.0% 7 0.4% 15 0.4% SWITRS (2006-2010)Impairment - Physical 0 0.0% 5 0.3% 11 0.3% SWITRS (2006-2010)Impairment Unknown 0 0.0% 175 9.1% 279 7.2% SWITRS (2006-2010)Not Applicable 1 2.7% 78 4.1% 188 4.9% SWITRS (2006-2010)Sleepy/Fatigued 0 0.0% 0 0.0% 1 0.0% SWITRS (2006-2010) Not Stated 36 97.3% 1655 86.2% 3369 87.2% SWITRS (2006-2010)Total 37 100.0% 1920 100.0% 3863 100.0% SWITRS (2006-2010)Pedestrian Cell Phone UseCell Phone in Use 0 0.0% 0 0.0% 0 0.0% SWITRS (2006-2010)Cell Phone Not in Use 0 0.0% 1 0.1% 3 0.1% SWITRS (2006-2010)No Cell Phone/Unknown 0 0.0% 4 0.2% 6 0.2% SWITRS (2006-2010)Not Stated 17 45.9% 808 42.1% 1543 39.9% SWITRS (2006-2010)Cell Phone Handheld in Use 0 0.0% 25 1.3% 47 1.2% SWITRS (2006-2010)Cell Phone Hands Free in Use 0 0.0% 2 0.1% 2 0.1% SWITRS (2006-2010)Cell Phone Not in Use 20 54.1% 1080 56.3% 2262 58.6% SWITRS (2006-2010)Total 37 100.0% 1920 100.0% 3863 100.0% SWITRS (2006-2010)Pedestrian Movement Preceding CollisionStopped 0 0.0% 48 2.5% 124 3.2% SWITRS (2006-2010)Proceeding Straight 14 37.8% 905 47.1% 1779 46.1% SWITRS (2006-2010)Ran Off Road 0 0.0% 0 0.0% 0 0.0% SWITRS (2006-2010)Making Right Turn 0 0.0% 5 0.3% 10 0.3% SWITRS (2006-2010)Making Left Turn 0 0.0% 2 0.1% 3 0.1% SWITRS (2006-2010)Making U-Turn 0 0.0% 0 0.0% 0 0.0% SWITRS (2006-2010)Backing 0 0.0% 9 0.5% 12 0.3% SWITRS (2006-2010)Slowing/Stopping 0 0.0% 1 0.1% 1 0.0% SWITRS (2006-2010)Passing Other Vehicle 0 0.0% 0 0.0% 3 0.1% SWITRS (2006-2010)Changing Lanes 0 0.0% 0 0.0% 1 0.0% SWITRS (2006-2010)Parking Maneuver 0 0.0% 0 0.0% 1 0.0% SWITRS (2006-2010)Entering Traffic 0 0.0% 86 4.5% 152 3.9% SWITRS (2006-2010)Other Unsafe Turning 0 0.0% 0 0.0% 0 0.0% SWITRS (2006-2010)
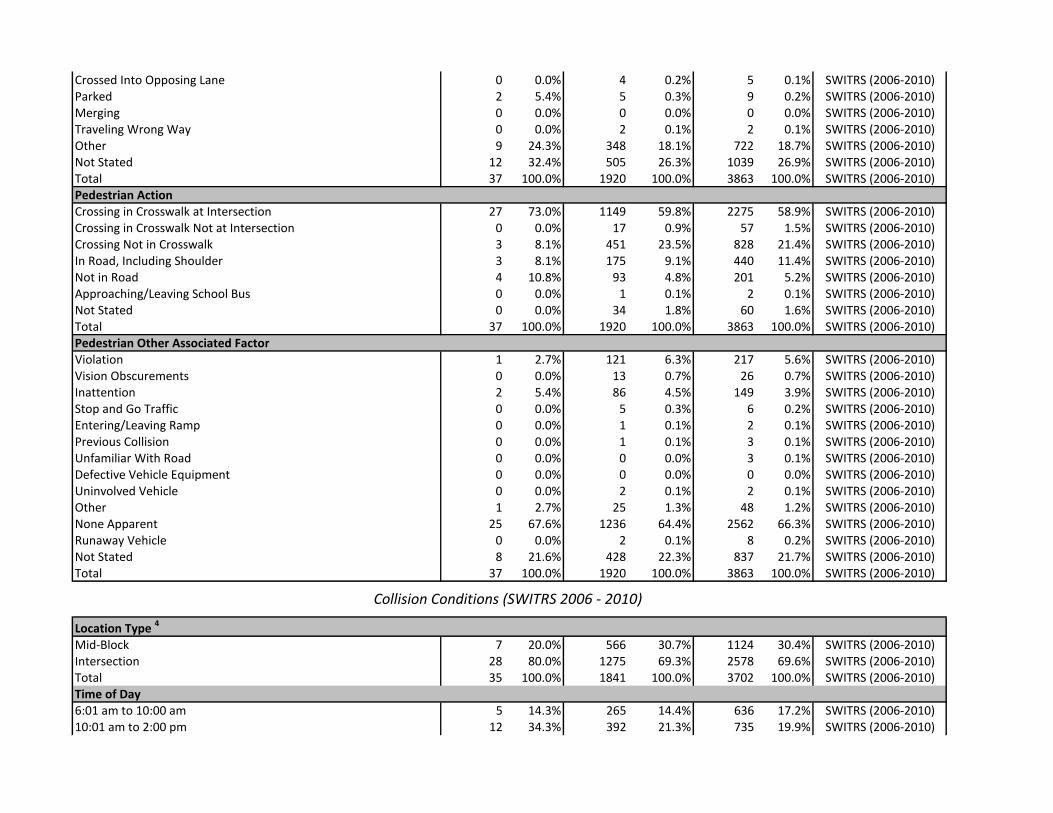
Crossed Into Opposing Lane 0 0.0% 4 0.2% 5 0.1% SWITRS (2006-2010)Parked 2 5.4% 5 0.3% 9 0.2% SWITRS (2006-2010)Merging 0 0.0% 0 0.0% 0 0.0% SWITRS (2006-2010)Traveling Wrong Way 0 0.0% 2 0.1% 2 0.1% SWITRS (2006-2010)Other 9 24.3% 348 18.1% 722 18.7% SWITRS (2006-2010)Not Stated 12 32.4% 505 26.3% 1039 26.9% SWITRS (2006-2010)Total 37 100.0% 1920 100.0% 3863 100.0% SWITRS (2006-2010)Pedestrian ActionCrossing in Crosswalk at Intersection 27 73.0% 1149 59.8% 2275 58.9% SWITRS (2006-2010)Crossing in Crosswalk Not at Intersection 0 0.0% 17 0.9% 57 1.5% SWITRS (2006-2010)Crossing Not in Crosswalk 3 8.1% 451 23.5% 828 21.4% SWITRS (2006-2010)In Road, Including Shoulder 3 8.1% 175 9.1% 440 11.4% SWITRS (2006-2010)Not in Road 4 10.8% 93 4.8% 201 5.2% SWITRS (2006-2010)Approaching/Leaving School Bus 0 0.0% 1 0.1% 2 0.1% SWITRS (2006-2010)Not Stated 0 0.0% 34 1.8% 60 1.6% SWITRS (2006-2010)Total 37 100.0% 1920 100.0% 3863 100.0% SWITRS (2006-2010)Pedestrian Other Associated FactorViolation 1 2.7% 121 6.3% 217 5.6% SWITRS (2006-2010)Vision Obscurements 0 0.0% 13 0.7% 26 0.7% SWITRS (2006-2010)Inattention 2 5.4% 86 4.5% 149 3.9% SWITRS (2006-2010)Stop and Go Traffic 0 0.0% 5 0.3% 6 0.2% SWITRS (2006-2010)Entering/Leaving Ramp 0 0.0% 1 0.1% 2 0.1% SWITRS (2006-2010)Previous Collision 0 0.0% 1 0.1% 3 0.1% SWITRS (2006-2010)Unfamiliar With Road 0 0.0% 0 0.0% 3 0.1% SWITRS (2006-2010)Defective Vehicle Equipment 0 0.0% 0 0.0% 0 0.0% SWITRS (2006-2010)Uninvolved Vehicle 0 0.0% 2 0.1% 2 0.1% SWITRS (2006-2010)Other 1 2.7% 25 1.3% 48 1.2% SWITRS (2006-2010)None Apparent 25 67.6% 1236 64.4% 2562 66.3% SWITRS (2006-2010)Runaway Vehicle 0 0.0% 2 0.1% 8 0.2% SWITRS (2006-2010)Not Stated 8 21.6% 428 22.3% 837 21.7% SWITRS (2006-2010)Total 37 100.0% 1920 100.0% 3863 100.0% SWITRS (2006-2010)
Location Type 4
Mid-Block 7 20.0% 566 30.7% 1124 30.4% SWITRS (2006-2010)Intersection 28 80.0% 1275 69.3% 2578 69.6% SWITRS (2006-2010)Total 35 100.0% 1841 100.0% 3702 100.0% SWITRS (2006-2010)Time of Day6:01 am to 10:00 am 5 14.3% 265 14.4% 636 17.2% SWITRS (2006-2010)10:01 am to 2:00 pm 12 34.3% 392 21.3% 735 19.9% SWITRS (2006-2010)
Collision Conditions (SWITRS 2006 - 2010)

2:01 pm to 6:00 pm 10 28.6% 465 25.3% 969 26.2% SWITRS (2006-2010)6:01 pm to 10:00 pm 6 17.1% 371 20.2% 795 21.5% SWITRS (2006-2010)10:01 pm to 2:00 am 1 2.9% 244 13.3% 408 11.0% SWITRS (2006-2010)2:01 am to 6:00 am 1 2.9% 104 5.6% 159 4.3% SWITRS (2006-2010)Total 35 100.0% 1841 100.0% 3702 100.0% SWITRS (2006-2010)LightingDaylight 27 77.1% 1097 59.6% 2287 61.8% SWITRS (2006-2010)
Dusk - Dawn 1 2.9% 68 3.7% 137 3.7% SWITRS (2006-2010)
Dark - Street Lights 7 20.0% 656 35.6% 1223 33.0% SWITRS (2006-2010)
Dark - No Street Lights 0 0.0% 9 0.5% 29 0.8% SWITRS (2006-2010)
Dark - Street Lights Not Functioning 0 0.0% 2 0.1% 7 0.2% SWITRS (2006-2010)
Not Stated 0 0.0% 9 0.5% 19 0.5% SWITRS (2006-2010)
Total 35 100.0% 1841 100.0% 3702 100.0% SWITRS (2006-2010)
Day of WeekMonday 5 14.3% 244 13.3% 514 13.9% SWITRS (2006-2010)Tuesday 7 20.0% 278 15.1% 569 15.4% SWITRS (2006-2010)Wednesday 3 8.6% 278 15.1% 572 15.5% SWITRS (2006-2010)Thursday 4 11.4% 267 14.5% 554 15.0% SWITRS (2006-2010)Friday 8 22.9% 309 16.8% 634 17.1% SWITRS (2006-2010)Saturday 6 17.1% 261 14.2% 466 12.6% SWITRS (2006-2010)Sunday 2 5.7% 204 11.1% 393 10.6% SWITRS (2006-2010)Total 35 100.0% 1841 100.0% 3702 100.0% SWITRS (2006-2010)MonthJanuary 6 17.1% 161 8.7% 341 9.2% SWITRS (2006-2010)February 3 8.6% 170 9.2% 347 9.4% SWITRS (2006-2010)March 4 11.4% 155 8.4% 330 8.9% SWITRS (2006-2010)April 3 8.6% 141 7.7% 270 7.3% SWITRS (2006-2010)May 3 8.6% 145 7.9% 268 7.2% SWITRS (2006-2010)June 3 8.6% 119 6.5% 246 6.6% SWITRS (2006-2010)July 2 5.7% 153 8.3% 268 7.2% SWITRS (2006-2010)August 2 5.7% 144 7.8% 290 7.8% SWITRS (2006-2010)September 1 2.9% 163 8.9% 322 8.7% SWITRS (2006-2010)October 3 8.6% 134 7.3% 302 8.2% SWITRS (2006-2010)November 3 8.6% 171 9.3% 333 9.0% SWITRS (2006-2010)December 2 5.7% 185 10.0% 385 10.4% SWITRS (2006-2010)Total 35 100.0% 1841 100.0% 3702 100.0% SWITRS (2006-2010)Year2006 10 28.6% 367 19.9% 715 19.3% SWITRS (2006-2010)2007 9 25.7% 427 23.2% 773 20.9% SWITRS (2006-2010)2008 6 17.1% 372 20.2% 773 20.9% SWITRS (2006-2010)
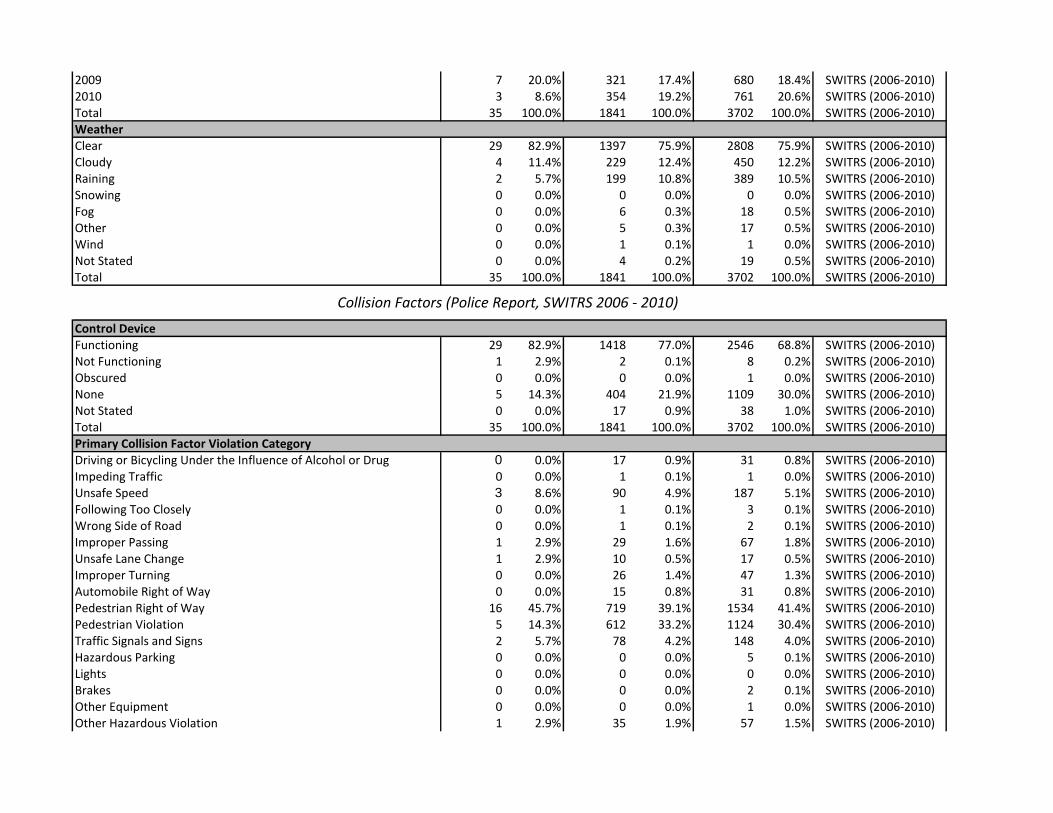
2009 7 20.0% 321 17.4% 680 18.4% SWITRS (2006-2010)2010 3 8.6% 354 19.2% 761 20.6% SWITRS (2006-2010)Total 35 100.0% 1841 100.0% 3702 100.0% SWITRS (2006-2010)WeatherClear 29 82.9% 1397 75.9% 2808 75.9% SWITRS (2006-2010)Cloudy 4 11.4% 229 12.4% 450 12.2% SWITRS (2006-2010)Raining 2 5.7% 199 10.8% 389 10.5% SWITRS (2006-2010)Snowing 0 0.0% 0 0.0% 0 0.0% SWITRS (2006-2010)Fog 0 0.0% 6 0.3% 18 0.5% SWITRS (2006-2010)Other 0 0.0% 5 0.3% 17 0.5% SWITRS (2006-2010)Wind 0 0.0% 1 0.1% 1 0.0% SWITRS (2006-2010)Not Stated 0 0.0% 4 0.2% 19 0.5% SWITRS (2006-2010)Total 35 100.0% 1841 100.0% 3702 100.0% SWITRS (2006-2010)
Control DeviceFunctioning 29 82.9% 1418 77.0% 2546 68.8% SWITRS (2006-2010)Not Functioning 1 2.9% 2 0.1% 8 0.2% SWITRS (2006-2010)Obscured 0 0.0% 0 0.0% 1 0.0% SWITRS (2006-2010)None 5 14.3% 404 21.9% 1109 30.0% SWITRS (2006-2010)Not Stated 0 0.0% 17 0.9% 38 1.0% SWITRS (2006-2010)Total 35 100.0% 1841 100.0% 3702 100.0% SWITRS (2006-2010)Primary Collision Factor Violation CategoryDriving or Bicycling Under the Influence of Alcohol or Drug 0 0.0% 17 0.9% 31 0.8% SWITRS (2006-2010)Impeding Traffic 0 0.0% 1 0.1% 1 0.0% SWITRS (2006-2010)Unsafe Speed 3 8.6% 90 4.9% 187 5.1% SWITRS (2006-2010)Following Too Closely 0 0.0% 1 0.1% 3 0.1% SWITRS (2006-2010)Wrong Side of Road 0 0.0% 1 0.1% 2 0.1% SWITRS (2006-2010)Improper Passing 1 2.9% 29 1.6% 67 1.8% SWITRS (2006-2010)Unsafe Lane Change 1 2.9% 10 0.5% 17 0.5% SWITRS (2006-2010)Improper Turning 0 0.0% 26 1.4% 47 1.3% SWITRS (2006-2010)Automobile Right of Way 0 0.0% 15 0.8% 31 0.8% SWITRS (2006-2010)Pedestrian Right of Way 16 45.7% 719 39.1% 1534 41.4% SWITRS (2006-2010)Pedestrian Violation 5 14.3% 612 33.2% 1124 30.4% SWITRS (2006-2010)Traffic Signals and Signs 2 5.7% 78 4.2% 148 4.0% SWITRS (2006-2010)Hazardous Parking 0 0.0% 0 0.0% 5 0.1% SWITRS (2006-2010)Lights 0 0.0% 0 0.0% 0 0.0% SWITRS (2006-2010)Brakes 0 0.0% 0 0.0% 2 0.1% SWITRS (2006-2010)Other Equipment 0 0.0% 0 0.0% 1 0.0% SWITRS (2006-2010)Other Hazardous Violation 1 2.9% 35 1.9% 57 1.5% SWITRS (2006-2010)
Collision Factors (Police Report, SWITRS 2006 - 2010)
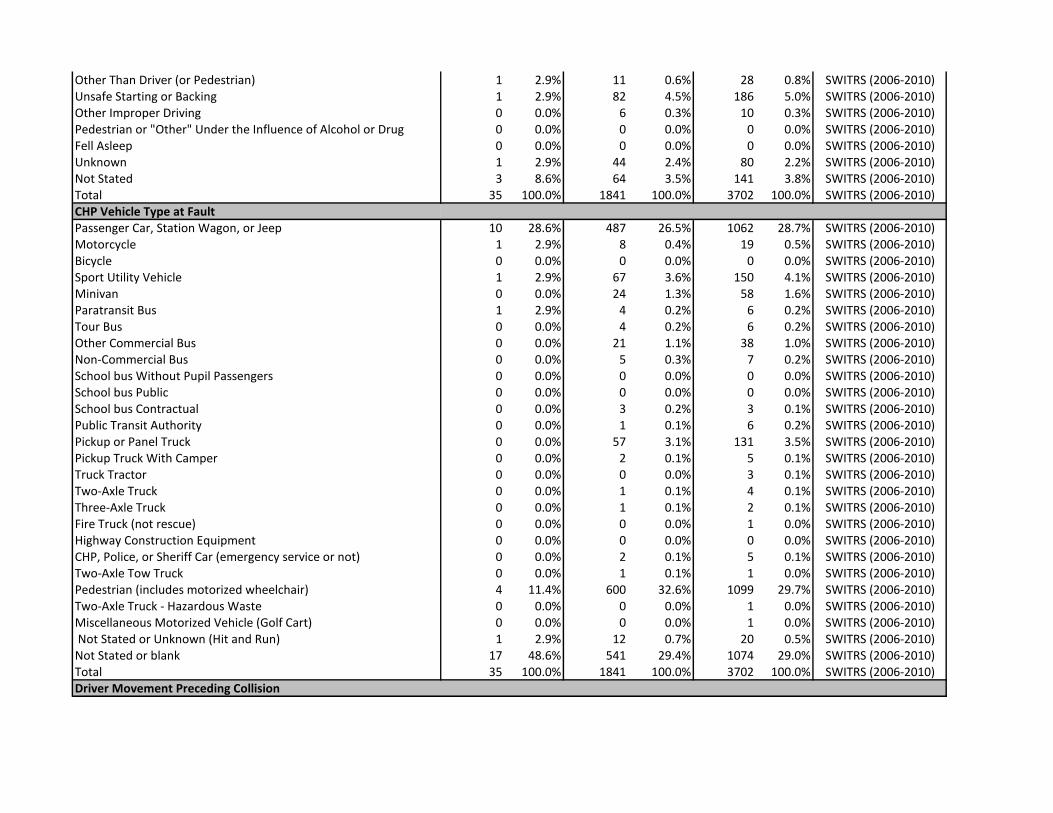
Other Than Driver (or Pedestrian) 1 2.9% 11 0.6% 28 0.8% SWITRS (2006-2010)Unsafe Starting or Backing 1 2.9% 82 4.5% 186 5.0% SWITRS (2006-2010)Other Improper Driving 0 0.0% 6 0.3% 10 0.3% SWITRS (2006-2010)Pedestrian or "Other" Under the Influence of Alcohol or Drug 0 0.0% 0 0.0% 0 0.0% SWITRS (2006-2010)Fell Asleep 0 0.0% 0 0.0% 0 0.0% SWITRS (2006-2010)Unknown 1 2.9% 44 2.4% 80 2.2% SWITRS (2006-2010)Not Stated 3 8.6% 64 3.5% 141 3.8% SWITRS (2006-2010)Total 35 100.0% 1841 100.0% 3702 100.0% SWITRS (2006-2010)CHP Vehicle Type at FaultPassenger Car, Station Wagon, or Jeep 10 28.6% 487 26.5% 1062 28.7% SWITRS (2006-2010)Motorcycle 1 2.9% 8 0.4% 19 0.5% SWITRS (2006-2010)Bicycle 0 0.0% 0 0.0% 0 0.0% SWITRS (2006-2010)Sport Utility Vehicle 1 2.9% 67 3.6% 150 4.1% SWITRS (2006-2010)Minivan 0 0.0% 24 1.3% 58 1.6% SWITRS (2006-2010)Paratransit Bus 1 2.9% 4 0.2% 6 0.2% SWITRS (2006-2010)Tour Bus 0 0.0% 4 0.2% 6 0.2% SWITRS (2006-2010)Other Commercial Bus 0 0.0% 21 1.1% 38 1.0% SWITRS (2006-2010)Non-Commercial Bus 0 0.0% 5 0.3% 7 0.2% SWITRS (2006-2010)School bus Without Pupil Passengers 0 0.0% 0 0.0% 0 0.0% SWITRS (2006-2010)School bus Public 0 0.0% 0 0.0% 0 0.0% SWITRS (2006-2010)School bus Contractual 0 0.0% 3 0.2% 3 0.1% SWITRS (2006-2010)Public Transit Authority 0 0.0% 1 0.1% 6 0.2% SWITRS (2006-2010)Pickup or Panel Truck 0 0.0% 57 3.1% 131 3.5% SWITRS (2006-2010)Pickup Truck With Camper 0 0.0% 2 0.1% 5 0.1% SWITRS (2006-2010)Truck Tractor 0 0.0% 0 0.0% 3 0.1% SWITRS (2006-2010)Two-Axle Truck 0 0.0% 1 0.1% 4 0.1% SWITRS (2006-2010)Three-Axle Truck 0 0.0% 1 0.1% 2 0.1% SWITRS (2006-2010)Fire Truck (not rescue) 0 0.0% 0 0.0% 1 0.0% SWITRS (2006-2010)Highway Construction Equipment 0 0.0% 0 0.0% 0 0.0% SWITRS (2006-2010)CHP, Police, or Sheriff Car (emergency service or not) 0 0.0% 2 0.1% 5 0.1% SWITRS (2006-2010)Two-Axle Tow Truck 0 0.0% 1 0.1% 1 0.0% SWITRS (2006-2010)Pedestrian (includes motorized wheelchair) 4 11.4% 600 32.6% 1099 29.7% SWITRS (2006-2010)Two-Axle Truck - Hazardous Waste 0 0.0% 0 0.0% 1 0.0% SWITRS (2006-2010)Miscellaneous Motorized Vehicle (Golf Cart) 0 0.0% 0 0.0% 1 0.0% SWITRS (2006-2010) Not Stated or Unknown (Hit and Run) 1 2.9% 12 0.7% 20 0.5% SWITRS (2006-2010)Not Stated or blank 17 48.6% 541 29.4% 1074 29.0% SWITRS (2006-2010)Total 35 100.0% 1841 100.0% 3702 100.0% SWITRS (2006-2010)Driver Movement Preceding Collision

Stopped 0 0.0% 29 1.6% 83 2.2% SWITRS (2006-2010)Proceeding Straight 9 25.7% 628 34.1% 1371 37.0% SWITRS (2006-2010)Ran Off Road 0 0.0% 3 0.2% 7 0.2% SWITRS (2006-2010)Making Right Turn 2 5.7% 180 9.8% 317 8.6% SWITRS (2006-2010)Making Left Turn 16 45.7% 494 26.8% 907 24.5% SWITRS (2006-2010)Making U-Turn 0 0.0% 1 0.1% 8 0.2% SWITRS (2006-2010)Backing 0 0.0% 71 3.9% 175 4.7% SWITRS (2006-2010)Slowing/Stopping 1 2.9% 16 0.9% 22 0.6% SWITRS (2006-2010)Passing Other Vehicle 1 2.9% 2 0.1% 13 0.4% SWITRS (2006-2010)Changing Lanes 0 0.0% 7 0.4% 14 0.4% SWITRS (2006-2010)Parking Maneuver 1 2.9% 8 0.4% 19 0.5% SWITRS (2006-2010)Entering Traffic 0 0.0% 84 4.6% 149 4.0% SWITRS (2006-2010)Other Unsafe Turning 0 0.0% 3 0.2% 8 0.2% SWITRS (2006-2010)Crossed Into Opposing Lane 0 0.0% 4 0.2% 5 0.1% SWITRS (2006-2010)Parked 0 0.0% 7 0.4% 14 0.4% SWITRS (2006-2010)Merging 0 0.0% 1 0.1% 3 0.1% SWITRS (2006-2010)Traveling Wrong Way 0 0.0% 5 0.3% 7 0.2% SWITRS (2006-2010)Other 1 2.9% 149 8.1% 287 7.8% SWITRS (2006-2010)Not Stated 4 11.4% 149 8.1% 293 7.9% SWITRS (2006-2010)Total 35 100.0% 1841 100.0% 3702 100.0% SWITRS (2006-2010)Hit and RunFelony 3 8.6% 256 13.9% 471 12.7% SWITRS (2006-2010)Misdemeanor 0 0.0% 21 1.1% 40 1.1% SWITRS (2006-2010)Not Hit and Run 32 91.4% 1564 85.0% 3191 86.2% SWITRS (2006-2010)Total 35 100.0% 1841 100.0% 3702 100.0% SWITRS (2006-2010)Collision Involved MotorcycleYes 1 2.9% 35 1.9% 53 1.4% SWITRS (2006-2010)No 34 97.1% 1806 98.1% 3649 98.6% SWITRS (2006-2010)Total 35 100.0% 1841 100.0% 3702 100.0% SWITRS (2006-2010)Collision Involved a Party DrinkingYes 5 14.3% 217 11.8% 348 9.4% SWITRS (2006-2010)No 30 85.7% 1624 88.2% 3354 90.6% SWITRS (2006-2010)Total 35 100.0% 1841 100.0% 3702 100.0% SWITRS (2006-2010)

FootnotesCDABC California Department of Alcoholic Beverage ControlCHP California Highway Patrol
2. Excludes proportion of area that are streets and sidewalks LEHD Longitudinal Employer andHousehold Dynamics Program (Census)OSHPD Office of Statewide Health Planning and Development
SAIC Science Applications International CorporationSFCTA San Francisco County Transportation Authority SFDPH San Francisco Department of Public Health SFDPW San Francisco Department of Public WorksSFDTIS
SFMTA San Francisco Municipal Transportation Agency SFP San Francisco Planning Department SFPD San Francisco Police DepartmentSFPUC San Francisco Public Utilities Commission SWITRS Statewide Integrated Traffic Records System
San Francisco Department of Telecommunications and Information
Services
1. Vehicle speed based on small sample of street segments (n=606
of 15,444, total)
3. Severe and Fatal Injuries are multiplied by three for a higher
severity weight
Acronyms
4. Injuries that occurred more than 20 feet away from an
intersection are considered mid-block (SFMTA)

Appendix B: Pedestrian Environmental Quality Index
Introduction
The San Francisco Department of Public Health developed the Pedestrian Environmental Quality Index (PEQI) as a tool to prioritize improvements in pedestrian infrastructure during the planning process. The PEQI draws on published research and work from numerous cities to assess how the physical environment impacts whether people walk in a neighborhood. The PEQI is an observational survey that quantifies street and intersection factors empirically known to affect people’s travel behaviors, and is organized into five categories: traffic, street design, land use, intersections, and safety. Within these categories are 31 indicators that reflect the quality of the built environment for pedestrians and comprise the survey used for data collection. SFDPH has aggregated these indicators to create a weighted summary index, which can be reported as an overall index. Table 1 indicates how the indicators fit into broader domains of pedestrian comfort and security.
Table 1: PEQI 2.0 Indicators by Domain
Intersection Safety Traffic Street Design Land Use Perceived Safety
Crosswalks
High visibility crosswalk
Intersection lighting
Traffic control
Pedestrian signal
Countdown signal
Wait time
Crossing speed
Pedestrian refuge island
Curb ramps
Intersection traffic calming features
Pedestrian engineering countermeasures
Number of vehicle lanes
Posted speed limit
Traffic volume
Street traffic calming features
Width of sidewalk
Width of throughway
Large sidewalk obstructions
Sidewalk impediments
Trees
Driveway cuts
Presence of a buffer
Planters/gardens
Public seating
Public art/historic sites
Retail use and public places
Pedestrian scale lighting
Illegal graffiti
Litter
Empty spaces
Background and Development
In San Francisco and in many cities nationwide, there is a dearth of data on the existence and quality of street and sidewalk infrastructure for pedestrians. SFDPH developed the PEQI as a practical method to evaluate existing barriers to walking and prioritize future investments for increasing pedestrian activity and safety in land use and urban planning processes. PEQI version 2.0 is currently undergoing beta testing and is available for evaluation and download at www.sfphes.org.

Collaborations/Constituencies Involved
SFDPH consulted national experts including city planners, independent planning consultants, and pedestrian advocates to develop the indicator weights and scores for each indicator category, based on survey responses. The PEQI has been utilized by numerous agencies and community groups in San Francisco and adapted for use in other cities nationwide.
Agencies/Organizations Using Tool: Locales/Agencies: San Francisco Department of Public Health (SFDPH), CA; The Denver Housing
Authority, CO; City of East Palo Alto, CA; Wasco County Planning and Development, OR; City of
Richmond, CA; Palms, CA; Carson and Boyle Heights, CA Community Partners: PODER (People
Organizing to Demand Environmental & Economic Rights), Trust for Public Land, Chinatown Community
Development Center, San Francisco Bicycle Coalition: Consulting Groups: Human Impact Partners,
Mithun, RAND Corporation: Academic Institutions: UC Berkeley, School of Public Health, UCLA, Center
for Occupational and Environmental Health
Applications, processes, or projects that have used this tool:
Pittsburg Railroad Ave. Specific Plan Health Impact Assessment. June 2008
Treasure Island Community Transportation Plan (SFDPH and San Francisco Bicycle Coalition 2009).
Pathways to Community Health: Evaluating the Healthfulness of Affordable Housing. Opportunity Sites along the San Pablo Avenue Corridor Using Health Impact Assessment. August 2009
Use of the Healthy Development Measurement Tool (HDMT) in Denver Cross-Sector Partnerships for Development and Public Health South Lincoln Homes, Denver CO. December 2009.
Pedestrian Environmental Quality and Safety in the Eastern Neighborhoods: Analysis and Recommendations (SFDPH 2010).
Walkability and Pedestrian Safety in Boyle Heights (UCLA 2010)
Park Renovation Impact on Physical Activity among Youth (Trust for Public Land, RAND Corporation and SFDPH 2011).
Pedestrian Safety Needs Assessment of San Francisco’s Chinatown (Chinatown Community Development Center 2011)
Health Impact Assessment of Road Pricing Policies in San Francisco (SFDPH 2011)
Green Connections, to improve access to urban green spaces in San Francisco (SFDPH, SF Planning 2012)
As SFDPH continues to work on walking and pedestrian safety conditions in San Francisco, we have been improving and evaluating opportunities to use the PEQI as a tool to prioritize pedestrian realm improvements in plans and projects. SFDPH hopes to further engage planners, City agencies and community organizations to use the PEQI for transportation planning and as an evaluation tool on future development and transportation projects.
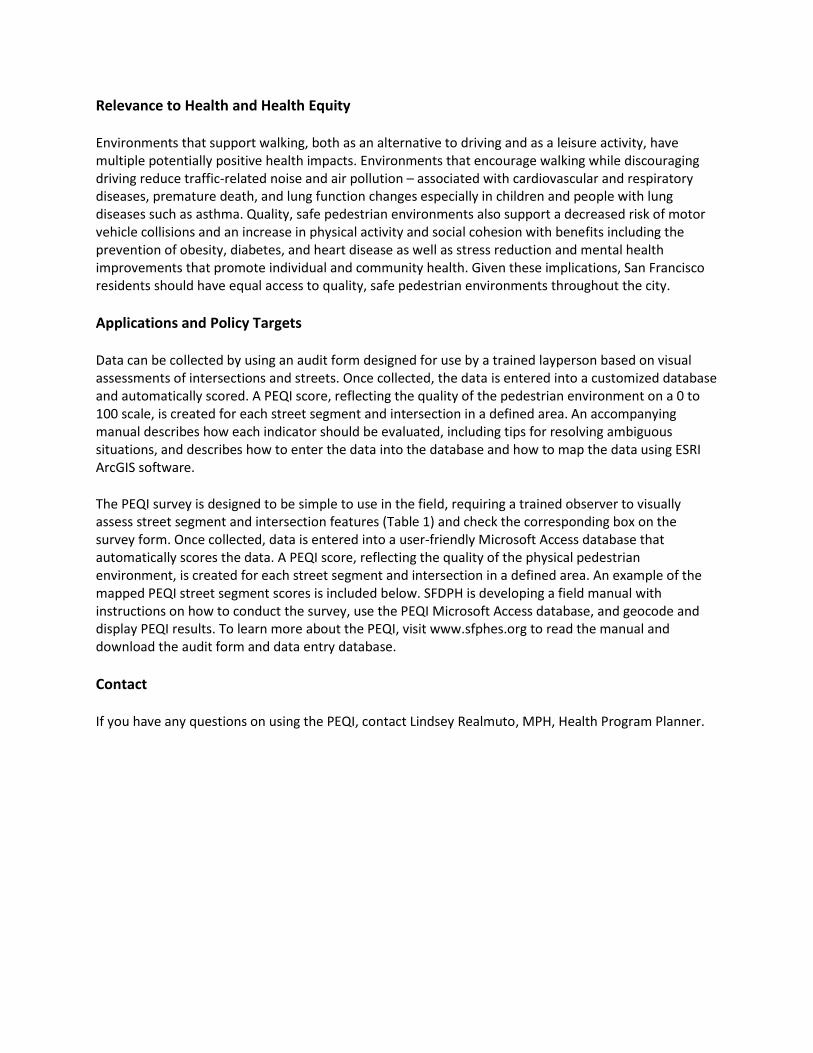
Relevance to Health and Health Equity
Environments that support walking, both as an alternative to driving and as a leisure activity, have multiple potentially positive health impacts. Environments that encourage walking while discouraging driving reduce traffic-related noise and air pollution – associated with cardiovascular and respiratory diseases, premature death, and lung function changes especially in children and people with lung diseases such as asthma. Quality, safe pedestrian environments also support a decreased risk of motor vehicle collisions and an increase in physical activity and social cohesion with benefits including the prevention of obesity, diabetes, and heart disease as well as stress reduction and mental health improvements that promote individual and community health. Given these implications, San Francisco residents should have equal access to quality, safe pedestrian environments throughout the city.
Applications and Policy Targets
Data can be collected by using an audit form designed for use by a trained layperson based on visual assessments of intersections and streets. Once collected, the data is entered into a customized database and automatically scored. A PEQI score, reflecting the quality of the pedestrian environment on a 0 to 100 scale, is created for each street segment and intersection in a defined area. An accompanying manual describes how each indicator should be evaluated, including tips for resolving ambiguous situations, and describes how to enter the data into the database and how to map the data using ESRI ArcGIS software.
The PEQI survey is designed to be simple to use in the field, requiring a trained observer to visually assess street segment and intersection features (Table 1) and check the corresponding box on the survey form. Once collected, data is entered into a user-friendly Microsoft Access database that automatically scores the data. A PEQI score, reflecting the quality of the physical pedestrian environment, is created for each street segment and intersection in a defined area. An example of the mapped PEQI street segment scores is included below. SFDPH is developing a field manual with instructions on how to conduct the survey, use the PEQI Microsoft Access database, and geocode and display PEQI results. To learn more about the PEQI, visit www.sfphes.org to read the manual and download the audit form and data entry database.
Contact
If you have any questions on using the PEQI, contact Lindsey Realmuto, MPH, Health Program Planner.

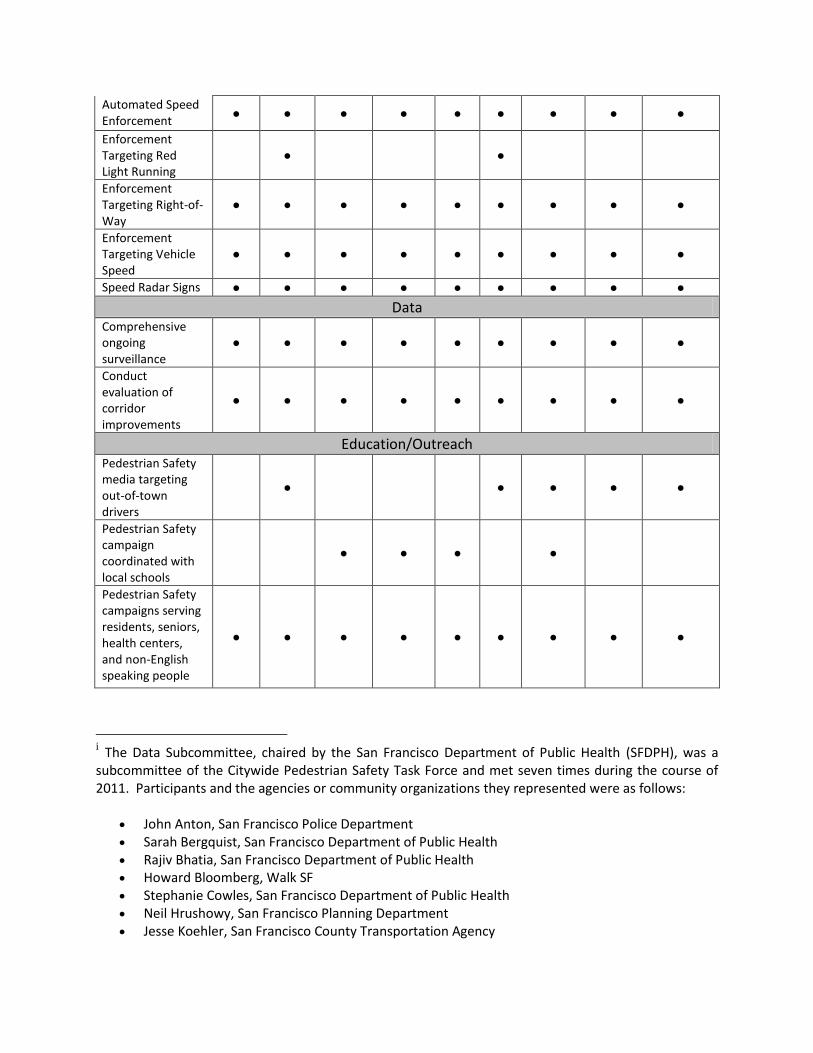
Appendix C: Citywide Pedestrian Safety Task Force Data Subcommitteei Recommendations for Nine High-Injury Corridors: Informed by High-Injury Corridor Case Studies and Comprehensive Analysis – January 2012 The following table of recommendations is organized by five categories – recommendations for: 1) Engineering: Shorter-term Measures; 2) Engineering: Longer-term Measures; 3) Enforcement; 4) Data; and 5) Education/Outreach. Please note that this is not an exhaustive list of potential improvements. The Data Subcommittee recommendations are interventions for consideration intended to address pedestrian safety issues common across the corridors, including the need to:
Add corridor traffic calming strategies to reduce speeds
Facilitate safe crossing for seniors and people with disabilities
Increase pedestrian visibility/vehicle yielding during vehicle turn movements
Decrease long crossing distances
Improve pedestrian scale aesthetics, comfort and visibility
Further, the Data Subcommittee developed the following list of recommendations in the second half of 2011 during the same period that the SFMTA was developing its new Pedestrian Safety Toolkit with ”state of the practice” engineering countermeasures – including those that could be applied on high-traffic arterial corridors. It is likely that a number of those additional measures would be appropriate to consider along the corridors as well.
Recommendations Geary Market Mission San
Bruno Silver Sixth Stockton
Van Ness
(S.) Van Ness
Engineering: Shorter-term measures (require less intensive study, lower costs) Crosswalks, High Visibility (add/improve)
● ● ● ● ● ● ● ● ●
Crosswalk Scramble: Increase Visibility
●
Lane Narrowing (lower cost if coordinated with repaving)
● ● ● ● ● ● ● ●
Leading Pedestrian Intervals
● ● ● ● ● ● ● ●
Limit Lines/Advanced Stop Lines (increase/add where feasible)
● ● ● ● ● ● ● ● ●
Parking Restrictions Near
● ● ● ● ● ● ●

Intersections
Rumble Strips ● ● ● ● ● ● ● ● ●
Signal Timing for Pedestrian Crossing (Increase)
● ● ● ● ●
Way finding for private vehicles (add/improve)
● ● ●
Engineering: Longer-term measures (require more intensive study, higher costs) Bulbouts ● ● ● ● ● ● ● ● ●
Curb Ramps (add/improve)
● ● ● ● ● ● ● ● ●
Flashing Beacons ●
Lane Reduction ● ●
Lighting at intersections and at pedestrian scale (improve)
● ● ● ● ● ● ● ●
Pedestrian Refuges in Crosswalks (add/improve: Raised Medians or Curb Extensions)
● ● ● ● ● ● ● ● ●
Pedestrian Scrambles
● ● ● ●
Private Vehicle Restrictions
● ●
Protected Turn Phases
● ● ● ● ● ● ● ●
Public Seating (add/improve)
●
Reduce speeds and traffic volumes near boarding islands
●
Synchronize Pedestrian Signal Timing to Reduce Wait Times
● ● ● ● ●
Traffic Signal Size Increase
●
Transit boarding island redesign and relocation brainstorm
●
Turn Restrictions ● ● ● ● ● ● ●
Widen Sidewalks ● ● ●
Enforcement
Automated Speed Enforcement
● ● ● ● ● ● ● ● ●
Enforcement Targeting Red Light Running
● ●
Enforcement Targeting Right-of-Way
● ● ● ● ● ● ● ● ●
Enforcement Targeting Vehicle Speed
● ● ● ● ● ● ● ● ●
Speed Radar Signs ● ● ● ● ● ● ● ● ●
Data Comprehensive ongoing surveillance
● ● ● ● ● ● ● ● ●
Conduct evaluation of corridor improvements
● ● ● ● ● ● ● ● ●
Education/Outreach Pedestrian Safety media targeting out-of-town drivers
● ● ● ● ●
Pedestrian Safety campaign coordinated with local schools
● ● ● ●
Pedestrian Safety campaigns serving residents, seniors, health centers, and non-English speaking people
● ● ● ● ● ● ● ● ●
i The Data Subcommittee, chaired by the San Francisco Department of Public Health (SFDPH), was a subcommittee of the Citywide Pedestrian Safety Task Force and met seven times during the course of 2011. Participants and the agencies or community organizations they represented were as follows:
John Anton, San Francisco Police Department Sarah Bergquist, San Francisco Department of Public Health Rajiv Bhatia, San Francisco Department of Public Health Howard Bloomberg, Walk SF Stephanie Cowles, San Francisco Department of Public Health Neil Hrushowy, San Francisco Planning Department Jesse Koehler, San Francisco County Transportation Agency

Dahianna Lopez, San Francisco Injury Center John Alex Lowell, Pedestrian Safety Advisory Committee Frank Markowitz, San Francisco Municipal Transportation Agency Susan Mizner, San Francisco Mayor’s Office on Disability Luis Montoya, San Francisco Municipal Transportation Agency Patti O’Connor, San Francisco General Hospital Trauma Center Antonio Piccagli, San Francisco Municipal Transportation Agency Bob Planthold, Senior Action Network/California WALKS Bridget Smith, San Francisco Municipal Transportation Agency Laura Stonehill, San Francisco Municipal Transportation Agency Ana Validzic, San Francisco Department of Public Health Megan Wier, San Francisco Department of Public Health, Subcommittee Chair Andy Zanoff, San Francisco Fire Department – Emergency Medical Services
For additional information regarding Data Subcommittee activities and products please contact Megan Wier at [email protected].

Appendix D: Pedestrian Safety Recommendations
Pedestrian Safety Factors Existing Conditions Relationship to Pedestrian Safety Source of
Recommendation
(See acronym
chart at the end
of the table)
Traffic
Traffic volume Moderate traffic volumes.
Lower traffic volumes are
associated with lower risk of
pedestrian injury.
na
Vehicle speed (85th
percentile) Unknown – not assessed
Vehicle speed is a principal factor
determining both the frequency
and lethality of motor vehicle
collisions.
na
Street Design
Chicane None
Midblock bulb-outs or plantings
can create an artificial “weave” in
an otherwise straight, wide street
in order to slow traffic.
Median None
Medians with tree plantings in
them have been shown to calm
traffic on high volume roadways.
At intersections the median can
be extended across crosswalks to
provide pedestrian refuge islands.
SFCTA
Parking buffer Exists along most street segments.
The lateral separation between
pedestrians and motor vehicles
which supports pedestrian safety
and increases pedestrian comfort.
Parking restrictions near
intersections None
Parking restrictions near
intersections can increase
pedestrian visibility by drivers and
improve safety.
PSTF
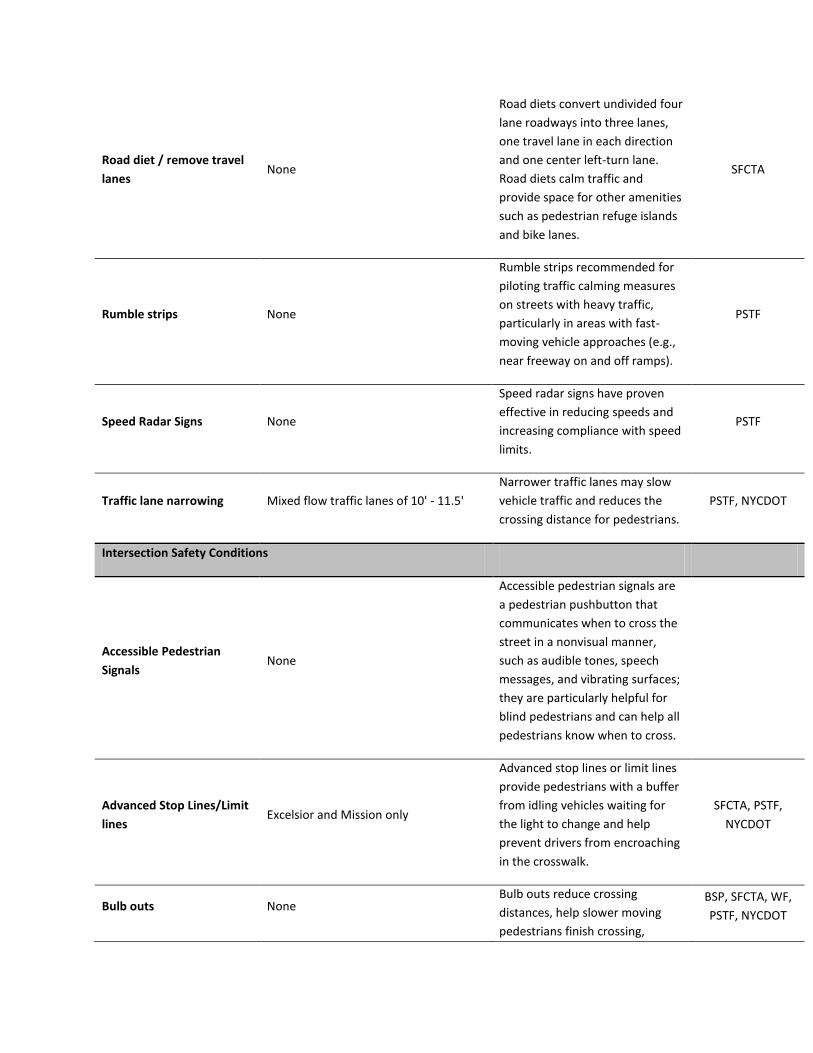
Road diet / remove travel
lanes None
Road diets convert undivided four
lane roadways into three lanes,
one travel lane in each direction
and one center left-turn lane.
Road diets calm traffic and
provide space for other amenities
such as pedestrian refuge islands
and bike lanes.
SFCTA
Rumble strips None
Rumble strips recommended for
piloting traffic calming measures
on streets with heavy traffic,
particularly in areas with fast-
moving vehicle approaches (e.g.,
near freeway on and off ramps).
PSTF
Speed Radar Signs None
Speed radar signs have proven
effective in reducing speeds and
increasing compliance with speed
limits.
PSTF
Traffic lane narrowing Mixed flow traffic lanes of 10' - 11.5'
Narrower traffic lanes may slow
vehicle traffic and reduces the
crossing distance for pedestrians.
PSTF, NYCDOT
Intersection Safety Conditions
Accessible Pedestrian
Signals None
Accessible pedestrian signals are
a pedestrian pushbutton that
communicates when to cross the
street in a nonvisual manner,
such as audible tones, speech
messages, and vibrating surfaces;
they are particularly helpful for
blind pedestrians and can help all
pedestrians know when to cross.
Advanced Stop Lines/Limit
lines Excelsior and Mission only
Advanced stop lines or limit lines
provide pedestrians with a buffer
from idling vehicles waiting for
the light to change and help
prevent drivers from encroaching
in the crosswalk.
SFCTA, PSTF,
NYCDOT
Bulb outs None Bulb outs reduce crossing
distances, help slower moving
pedestrians finish crossing,
BSP, SFCTA, WF,
PSTF, NYCDOT

increase pedestrian visibility,
provide additional space for
pedestrians and curb ramps, and
calm traffic by visually and
physically narrowing the roadway.
Crossing distance 60 feet across Mission Street, ~ 30 feet
across residential streets.
Reduced crossing distances
benefit pedestrian safety by
reducing exposure to vehicle
traffic.
PSTF, NYCDOT
Crossing time Largely in compliance with City and
National standards
Shorter signal crosswalk times can
be a movement barrier for
pedestrians, and cause hazardous
conditions if pedestrians are still
crossing when the signals
changes.
PSTF
Crosswalks
Present at signalized intersections, but
in many cases faded and worn. High
visibility crosswalks only at Lisbon
Street and Avalon Ave.
Crosswalks - especially those with
high visibility - indicate pedestrian
right of way on the roadway and
alert vehicles to the potential
presence of pedestrians.
BSP, SFCTA, WF,
PSTF, NYCDOT
Curb ramps Present at signalized intersections, one
or more missing at most others.
Curb ramps increase access and
safety for pedestrians with
disabilities as well as pedestrians
pushing children in strollers.
PSTF, NYCDOT
Flashing Beacons None
Alerts drivers to slow down and
look for pedestrians at
crosswalks. The most common
type is activated by pedestrians
wanting to cross using a push
button at uncontrolled
intersections; however they can
also be installed at intersection
approach alerting drivers they
should proceed with caution.
WF
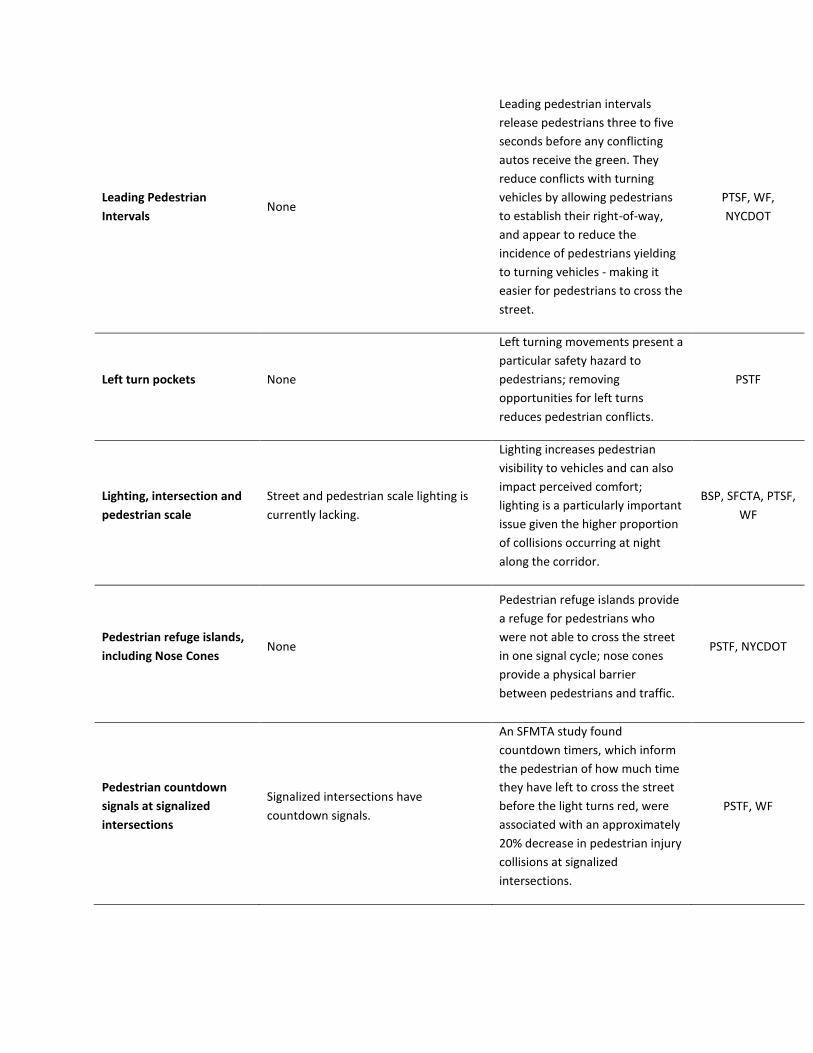
Leading Pedestrian
Intervals None
Leading pedestrian intervals
release pedestrians three to five
seconds before any conflicting
autos receive the green. They
reduce conflicts with turning
vehicles by allowing pedestrians
to establish their right-of-way,
and appear to reduce the
incidence of pedestrians yielding
to turning vehicles - making it
easier for pedestrians to cross the
street.
PTSF, WF,
NYCDOT
Left turn pockets None
Left turning movements present a
particular safety hazard to
pedestrians; removing
opportunities for left turns
reduces pedestrian conflicts.
PSTF
Lighting, intersection and
pedestrian scale
Street and pedestrian scale lighting is
currently lacking.
Lighting increases pedestrian
visibility to vehicles and can also
impact perceived comfort;
lighting is a particularly important
issue given the higher proportion
of collisions occurring at night
along the corridor.
BSP, SFCTA, PTSF,
WF
Pedestrian refuge islands,
including Nose Cones None
Pedestrian refuge islands provide
a refuge for pedestrians who
were not able to cross the street
in one signal cycle; nose cones
provide a physical barrier
between pedestrians and traffic.
PSTF, NYCDOT
Pedestrian countdown
signals at signalized
intersections
Signalized intersections have
countdown signals.
An SFMTA study found
countdown timers, which inform
the pedestrian of how much time
they have left to cross the street
before the light turns red, were
associated with an approximately
20% decrease in pedestrian injury
collisions at signalized
intersections.
PSTF, WF
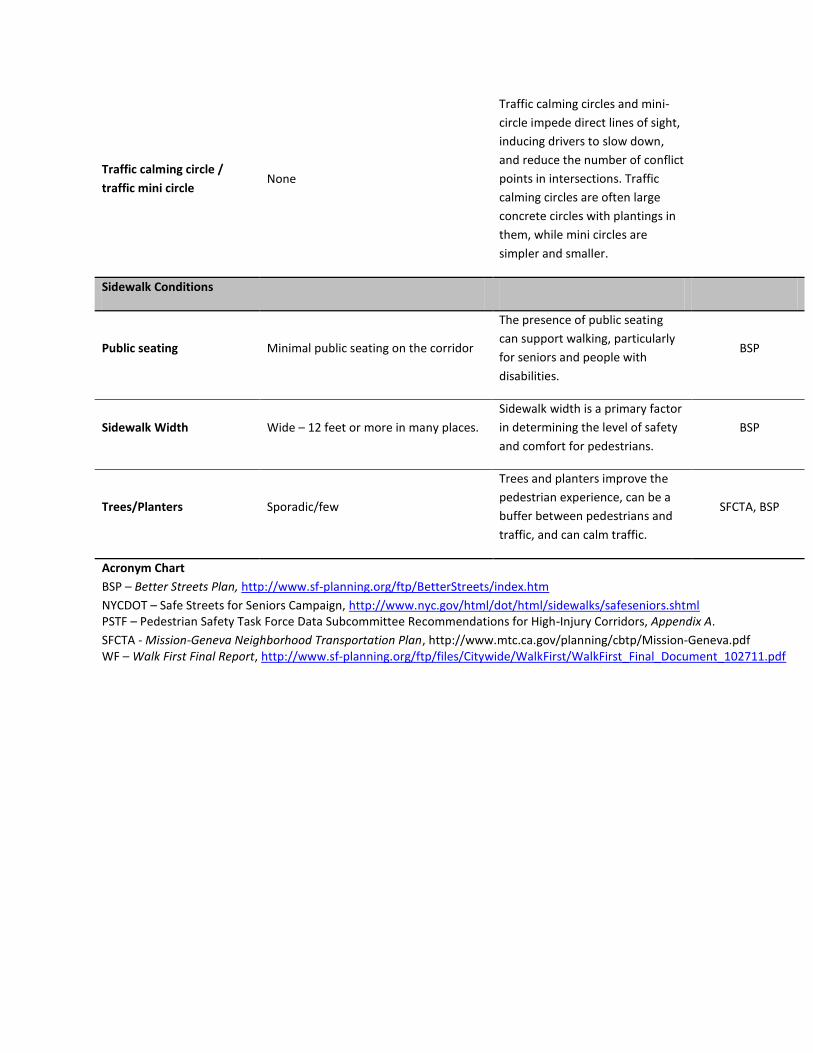
Traffic calming circle /
traffic mini circle None
Traffic calming circles and mini-
circle impede direct lines of sight,
inducing drivers to slow down,
and reduce the number of conflict
points in intersections. Traffic
calming circles are often large
concrete circles with plantings in
them, while mini circles are
simpler and smaller.
Sidewalk Conditions
Public seating Minimal public seating on the corridor
The presence of public seating
can support walking, particularly
for seniors and people with
disabilities.
BSP
Sidewalk Width Wide – 12 feet or more in many places.
Sidewalk width is a primary factor
in determining the level of safety
and comfort for pedestrians.
BSP
Trees/Planters Sporadic/few
Trees and planters improve the
pedestrian experience, can be a
buffer between pedestrians and
traffic, and can calm traffic.
SFCTA, BSP
Acronym Chart
BSP – Better Streets Plan, http://www.sf-planning.org/ftp/BetterStreets/index.htm
NYCDOT – Safe Streets for Seniors Campaign, http://www.nyc.gov/html/dot/html/sidewalks/safeseniors.shtml PSTF – Pedestrian Safety Task Force Data Subcommittee Recommendations for High-Injury Corridors, Appendix A.
SFCTA - Mission-Geneva Neighborhood Transportation Plan, http://www.mtc.ca.gov/planning/cbtp/Mission-Geneva.pdf WF – Walk First Final Report, http://www.sf-planning.org/ftp/files/Citywide/WalkFirst/WalkFirst_Final_Document_102711.pdf