Embed Size (px)
Citation preview
Annual Report to the
San Francisco Health Commission
(Fiscal Year 2013‐14)
Table of Contents
I. SUMMARY AND OVERVIEW OF PROGRAM ACCOMPLISHMENTS: HEALTHY SAN
FRANCISCO AND HEALTH CARE REFORM ............................................................. 1
II. LOW INCOME HEALTH PROGRAM AND SF PATH ............................................. 6
III. FY2013‐14 PROGRAM ACTIVITIES ................................................................. 18
A. COMMUNICATIONS, OUTREACH, APPLICATIONS AND ENROLLMENT .. 18
B. PARTICIPANT DEMOGRAPHICS ............................................................ 29
C. PROVIDER NETWORK (DELIVERY SYSTEM) ........................................... 33
D. CLINICAL COMPONENT AND SERVICES UTILIZATION ........................... 37
E. HEALTH IMPROVEMENT INITIATIVES ................................................... 47
F. PARTICIPANT EXPERIENCE AND SATISFACTION .................................... 51
G. HEALTH CARE SECURITY ORDINANCE AND THE EMPLOYER SPENDING REQUIREMENT ........................................................................................ 61
H. EXPENDITURES AND REVENUES .......................................................... 66
IV. FY2014‐15 ANTICIPATED PROGRAM ACTIVITIES ........................................... 71
APPENDIX A ...................................................................................................... 74
APPENDIX B ...................................................................................................... 75
1
I. SUMMARY AND OVERVIEW OF PROGRAM ACCOMPLISHMENTS: HEALTHY SAN FRANCISCO AND HEALTH CARE REFORM
The Healthy San Francisco Program (HSF) was designed by the San Francisco Department of Public Health
(DPH) in 2007 to make health care services available and affordable to uninsured San Francisco residents.
HSF has served a dual purpose: (1) providing health care services to San Francisco uninsured adults as the
program of last resort for those ineligible for public coverage and (2) preparing DPH, other providers, and
HSF participants for the federal Patient Protection and Affordable Care Act’s (ACA) key implementation
components. The ACA implementation on January 1, 2014 expanded Medi‐Cal to single healthy adults,
ages 19 to 64, and created California’s Health Benefit Exchange, Covered California. This is a marketplace
where individuals can purchase health insurance and potentially qualify for income‐based subsidies.
Fiscal Year 2013‐14 was pivotal for HSF and the populations it serves. HSF leveraged its history, experience
and connections with community‐based organizations, providers, and key stakeholders to assist
participants in making a smooth transition into new health care options available through the ACA. Well
positioned and trusted within the community, HSF conducted vigorous and comprehensive outreach,
informed, and educated participants and stakeholders about ACA options and requirements. Outreach
was organized in a variety of settings and included distributing informational materials to encourage
participants to enroll in or purchase health insurance. The program has continued to provide care for
uninsured adults ineligible for health insurance while encouraging ACA eligible participants to enroll in
newly created insurance options.
Program Activities to Support ACA Implementation
LIHP Transition
The statewide Low Income Health Program (LIHP) is known as San Francisco Provides Access to Health (SF
PATH) in San Francisco. HSF administered SF PATH and facilitated the transfer of eligible HSF participants
to SF PATH. SF PATH participants were successfully transitioned to Modified Adjusted Gross Income
(MAGI) Medi‐Cal, California’s free comprehensive health insurance program. SF PATH was funded locally
through the City General Fund subsidies and federally as California’s 1115 Waiver program.
The SF PATH Program ended on January 1, 2014 when all enrolled participants meeting eligibility
requirements were administratively transitioned to MAGI Medi‐Cal without requiring participant action.
HSF took proactive steps to maximize the number of participants eligible for this automatic transition
process:
HSF conducted outreach to potential participants, including underserved populations. For
example, HSF worked with the Homeless Outreach Team to expedite enrollment of homeless
individuals. The combination of targeted outreach and administrative transition of eligible HSF

2
participants into SF PATH increased enrollment by 5,202 or 53% from July 2013 through Dec 2013.
Enrollment reached 9,844 in July 2013 and increased to 15,046 by December 31, 2013 (last date
of the SF PATH program).
HSF implemented the State’s option to suspend redetermination for SF PATH participants with
program termination months from September 2013 to December 2013 for one year. This allowed
a greater number of participants to be eligible for automatic transition to MAGI Medi‐Cal. This
approach also enabled HSF Application Assistors to focus on Covered California’s first open
enrollment period.
HSF’s efforts to enroll participants in SF PATH resulted in the successful transition of 13,680 SF
PATH participants to Medi‐Cal. Some SF PATH participants did not transition for various reasons
including no longer being eligible for Medi‐Cal or living out of the county.
Application Process Includes ACA Options
HSF developed a new application process to incorporate the addition of the CalHEERS to determine
eligibility for Medi‐Cal and subsidies for Covered California plans consistent with program eligibility
rules.
HSF encouraged medical homes to become Covered California Certified Enrollment Entities (CEEs)
so Application Assistors at those sites could become Certified Enrollment Counselors (CECs) and
enroll participants into Medi‐Cal or Covered California plans in addition to HSF.
HSF developed a standardized application process flow to ensure that applicants are screened for
HSF only if they are ineligible for public coverage programs (Medi‐Cal and subsidized insurance
through Covered California).
HSF made several changes to One‐e‐App, the HSF eligibility and enrollment system, to streamline
the application process and to align the system with changes in program eligibility.
HSF Transition Period
Covered California’s first open enrollment period posed many challenges to the general public in
accessing health insurance and coverage. For example, California Healthcare Eligibility Enrollment and
Retention System (CalHEERS), the eligibility and enrollment system for Covered California, was not
prepared to process the large volume of applications that were submitted through the Statewide
Automated Welfare System (SAWS), causing a backlog of potential Medicaid applications. The backlog
caused confusion among applicants who avoided seeking healthcare services while they waited to be
processed and admitted to expanded Medi‐Cal. Additionally, continuity of care was a primary concern
for both participants whose HSF medical home was not an available option through the statewide
marketplace, and providers who strived to maintain treatment plans during patients’ transition to other
providers or coverage plans. In response to the concerns faced by the public and key stakeholders, HSF
created the Transition Period.
The Transition Period allows individuals eligible to purchase subsidized coverage through Covered
California to continue participation or newly enroll in HSF, provided all other HSF eligibility criteria are
3
met. In keeping with HSF program goals of transitioning participants to health insurance, which is better
than HSF, the Transition Period features:
An effective date until December 31, 2014
A required acknowledgment document for individuals enrolling in HSF under the Transition Period
to sign, confirming that they understand the terms and have been counseled on the potential
consequences of enrollment. Specifically, individuals are informed that HSF is not health
insurance, HSF does not meet the ACA individual mandate requirement, and they may be subject
to a tax penalty for failure to comply with the individual mandate.
Expanded Education and Outreach
In order to facilitate the transition of eligible HSF participants to new health insurance options, HSF led
and participated in outreach efforts targeting the existing HSF population, while expanding outreach to
the general public. HSF employed a variety of successful outreach and communications strategies to
engage, inform, and educate participants on the value of Health Care Reform, including:
• Participation in ACA education forums throughout the City sponsored by several Supervisors, a
Congressman, various community organizations and colleges
• Coordination of a program website update (October 2013) to feature added content on Health
Care Reform
Fall 2013 edition of HeartBeat, the HSF participant newsletter, focused on Health Care Reform
and its positive implications for HSF participants
Addition of HSF renewal notices and acknowledgement forms that include information on
program changes due to ACA implementation
HSF took a lead role in citywide initiatives to raise visibility for health care reform by collaborating with
the City and County of San Francisco to educate and enroll residents into new health insurance options
through participation in a citywide ACA communication workgroup. This integrated partnership brought
together multiple stakeholders to produce the City’s first Health Care Reform website and informational
flyers on how to enroll in ACA health insurance options. The success of the workgroup’s collaborative
effort to outreach to the general public was exemplified by the enrollment fair held on March 22, 2014.
HSF took the lead in coordinating the event, along with the Human Services Agency, the Mayor’s Office,
SEIU‐ United Healthcare Workers West, and National Association for the Advancement of Colored People
(NAACP), among others. Specifically, the program was responsible for developing and mailing flyers to
approximately 15,000 participants to market the event. Over 220 individuals attended the event, and 103
health insurance applications were initiated or submitted to both Covered California and Medi‐Cal.
To supplement direct participant communication, HSF provided training and resources to Application
Assistors and customer service staff to enable accurate, comprehensive, and helpful responses to
participant inquiries. This effort included the development of an HSF and Health Care Reform Frequently
4
Asked Questions (FAQ) guide, refresher training and webinars for Application Assistors, as well as the
inclusion of a new “Health Care Reform Corner” section in the monthly newsletter.
Health Care Reform Impact
Enrollment
The majority of HSF participants became eligible for new public insurance options when ACA was
implemented on January 1, 2014, decreasing the number of eligible HSF participants. The HSF and SF PATH
programs reached peak enrollment in September 2013 with 65,650 participants. Due to participants
transitioning to Medi‐Cal, Covered California, other insurance options, and the SF PATH, HSF enrollment
dropped to 46,302 participants by January 2014. As of June 30, 2014, enrollment was 31,965. This
represents a 51% reduction from the combined HSF and SF PATH peak enrollment. Most of the remaining
HSF population is exempt from ACA’s individual mandate requirement or is enrolled under the Transition
Period provision.
Eliminating Duplicate Enrollment
HSF continues to identify participants who have enrolled in health insurance programs, dedicating
resources to validating the accuracy of enrollment information in order to serve those who truly need the
health access provided by the Healthy San Francisco Program. In June 2013, HSF identified approximately
3,200 HSF participants who had concurrent Full‐Scope Medi‐Cal coverage through a validated third party
vendor. These individuals were notified and administratively dis‐enrolled. Additionally, since HSF cannot
obtain proprietary enrollment data from Covered California and other commercial insurers, HSF regularly
conducts phone outreach to participants who are due for renewal, determining if participants have
enrolled in other health insurance, See Section III A for details.
Financial Summary
In FY2013‐14, DPH’s estimated HSF expenditures totaled nearly $112 million. Of this amount, $28.76
million was covered by revenue and $83.12 million was provided by a City & County of San Francisco
General Fund subsidy. Private community HSF providers reported incurring an estimated $46.85 million
in net HSF expenditures. In total, the estimated program expenditures reached $158.74 million in FY2013‐
14 or a per participant per month (PMPM) expenditure of $296 based on a total of 537,045 participant
months.
As in previous years, this annual report is designed to provide the public, participants, providers,
researchers, other interested communities and policy makers with detailed information on how DPH
operates HSF and how it monitors and tracks its performance.
HSF’s reputation as a well‐trusted source of information for participants, made HSF an integral part of
citywide efforts to enroll residents into new health insurance options. However, the expansion of health
coverage options does not guarantee access to health services for all. There will be individuals who are
barred, exempt, or otherwise unable to purchase health insurance under the ACA. The program’s mission
remains the same: making health care services available and affordable to uninsured San Francisco

5
residents. HSF will continue to use the new health care options and tools available through the ACA to
assist eligible San Francisco residents to obtain coverage and will continue to provide comprehensive
health care access to any remaining uninsured and underserved San Francisco residents.
6
II. LOW INCOME HEALTH PROGRAM AND SF PATH
The Healthy San Francisco administration created the San Francisco Provides Access to Healthcare (SF
PATH) program in response to California’s “Bridge to Reform” Demonstration 1115 Medicaid Waiver. SF
PATH allowed for the development of a new statewide health care program, the Low Income Health
Program (LIHP). SF PATH was designed to move low‐income uninsured individuals into a coordinated
system of care to improve access to care, enhance quality of care, reduce episodic care, and improve
health status. DPH’s participation in LIHP is an extension of its participation in California’s former 1115
Waiver program, the Health Care Coverage Initiative (HCCI). HCCI provided DPH with federal
reimbursement to cover a portion of the cost of care for former HSF participants who met eligibility
requirements.
SF PATH is one of the legacy LIHPs, having served low‐income uninsured San Franciscans since the
beginning of the program on July 1, 2011. DPH’s participation in the State LIHP enabled the administrative
transition of SF PATH participants into Medi‐Cal on January 1, 2014 without requiring additional effort by
the participant. Those eligible for health insurance through Covered California must proactively apply to
enroll.
Program Eligibility and Provider Network
Since LIHP was designed to facilitate the seamless transition of eligible uninsured individuals to Medi‐Cal
on January 1, 2014, the program eligibility rules closely mirror those of Modified Adjusted Gross Income
(MAGI) Medi‐Cal. However, each participating county’s LIHP determined the maximum eligible income
for participation in the program. In San Francisco, SF PATH eligibility rules were:
San Francisco resident
Between 19 and 64 years old
Not eligible for full‐scope public coverage program
Meet citizenship requirements (US Citizen or Legal Permanent Resident for a minimum of five
years)
Below maximum income (see below)
Existing HCCI participants were allowed to participate in SF PATH up to 200% federal poverty level (FPL) if
they had continuous enrollment and met all other eligibility requirements. The HCCI Program’s income
eligibility requirement was 133‐200% FPL. In November 2011, the maximum income for SF PATH
participants was 25% FPL. To enable more eligible San Francisco residents to be eligible for automatic
transition to Medi‐Cal effective January 1, 2014, DPH raised the maximum income limit for SF PATH to
133% FPL on June 28, 2013. Similar to HSF, SF PATH had an income‐based participation and point‐of‐
service fee. Participants above 150% FPL paid a quarterly participation fee.
7
SF PATH’s provider network consisted of DPH’s network of primary care clinics and hospitals. However,
unlike HSF, out‐of‐network emergency services were covered under SF PATH, regardless of the service
location.
Application and Enrollment
DPH utilized one eligibility and enrollment system, One‐e‐App, for both HSF and SF PATH. At the time of
closure, the SF PATH Program served 15,046 individuals and had served 25,564 unique individuals since
the Program’s inception in July 2011. Participants enrolled in SF PATH by completing an application in
One‐e‐App with an HSF Application Assistor, or by meeting SF PATH eligibility and being administratively
transitioned from HSF to SF PATH. DPH conducted two administrative participant transitions from HSF to
the SF PATH Program, which accounted for the majority of new SF PATH enrollees. At the beginning of
the SF PATH Program, HSF administratively transitioned over 10,000 participants from HSF to SF PATH. On
September 28, 2013, DPH conducted a second administrative transition of HSF participants meeting SF
PATH eligibility rules into the SF PATH Program. A total of 2,926 participants were enrolled in SF PATH as
part of this second administrative transition.
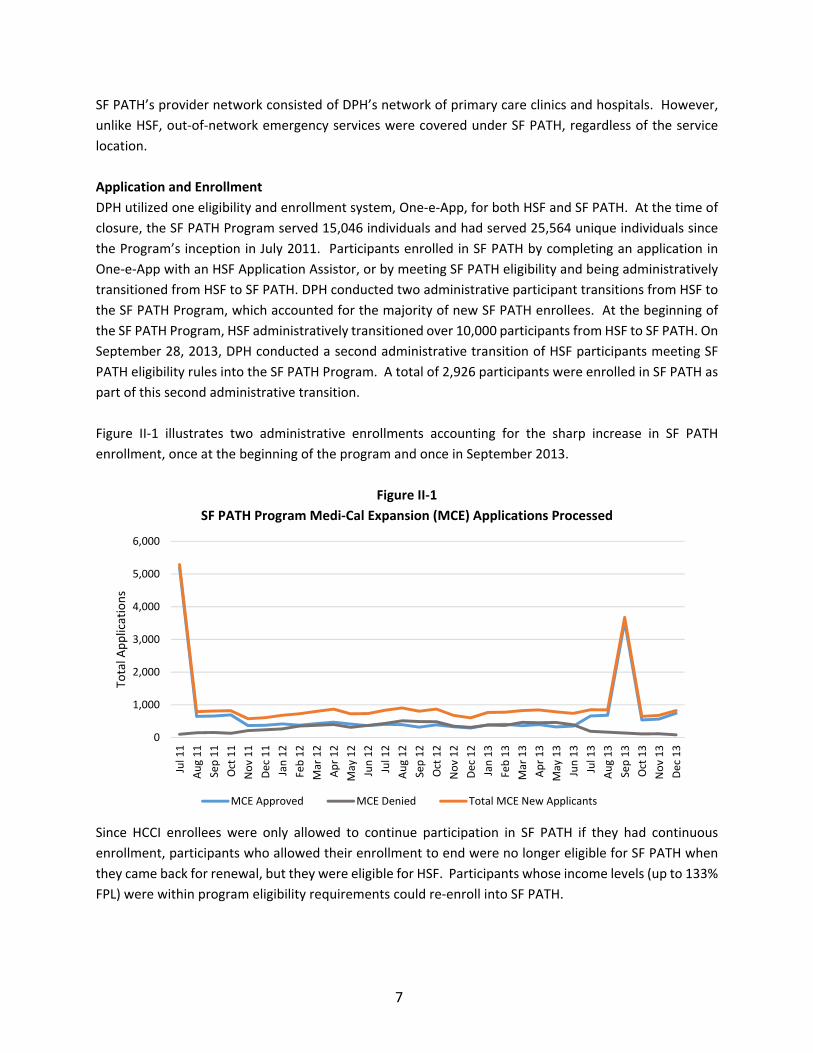
Figure II‐1 illustrates two administrative enrollments accounting for the sharp increase in SF PATH
enrollment, once at the beginning of the program and once in September 2013.
Figure II‐1
SF PATH Program Medi‐Cal Expansion (MCE) Applications Processed
Since HCCI enrollees were only allowed to continue participation in SF PATH if they had continuous
enrollment, participants who allowed their enrollment to end were no longer eligible for SF PATH when
they came back for renewal, but they were eligible for HSF. Participants whose income levels (up to 133%
FPL) were within program eligibility requirements could re‐enroll into SF PATH.
0
1,000
2,000
3,000
4,000
5,000
6,000
Jul 11
Aug 11
Sep 11
Oct 11
Nov 11
Dec 11
Jan 12
Feb 12
Mar 12
Apr 12
May 12
Jun 12
Jul 12
Aug 12
Sep 12
Oct 12
Nov 12
Dec 12
Jan 13
Feb 13
Mar 13
Apr 13
May 13
Jun 13
Jul 13
Aug 13
Sep 13
Oct 13
Nov 13
Dec 13
Total A
pplications
MCE Approved MCE Denied Total MCE New Applicants
8
0
100
200
300
400
500
600
700
800
Number New
Dis‐enrollm
ent
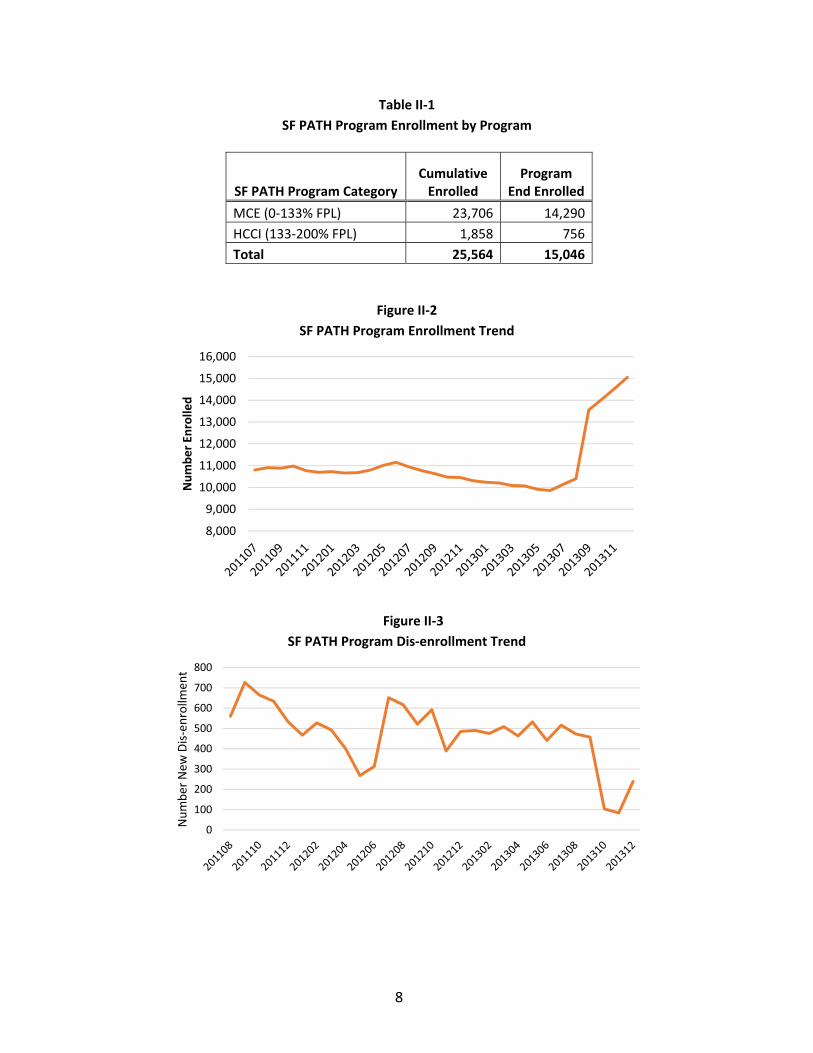
Table II‐1
SF PATH Program Enrollment by Program
Figure II‐2
SF PATH Program Enrollment Trend
Figure II‐3
SF PATH Program Dis‐enrollment Trend
8,000
9,000
10,000
11,000
12,000
13,000
14,000
15,000
16,000
Number En
rolled
SF PATH Program Category Cumulative Enrolled
Program End Enrolled
MCE (0‐133% FPL) 23,706 14,290
HCCI (133‐200% FPL) 1,858 756
Total 25,564 15,046
9
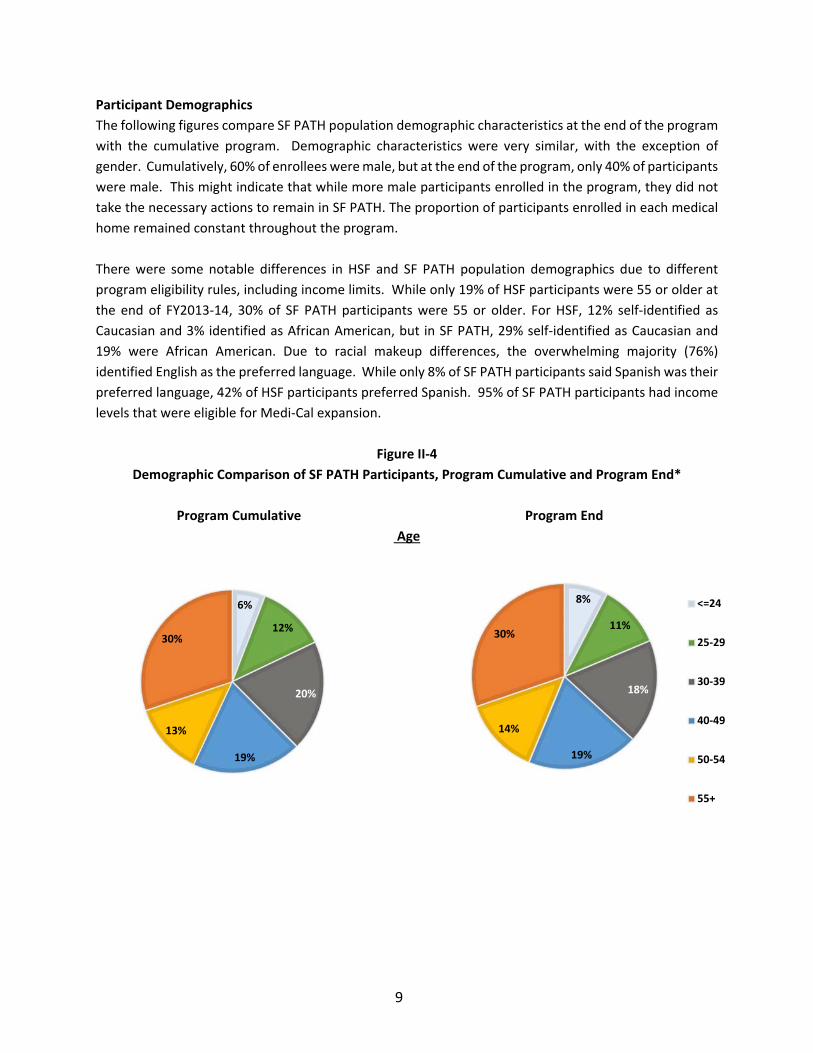
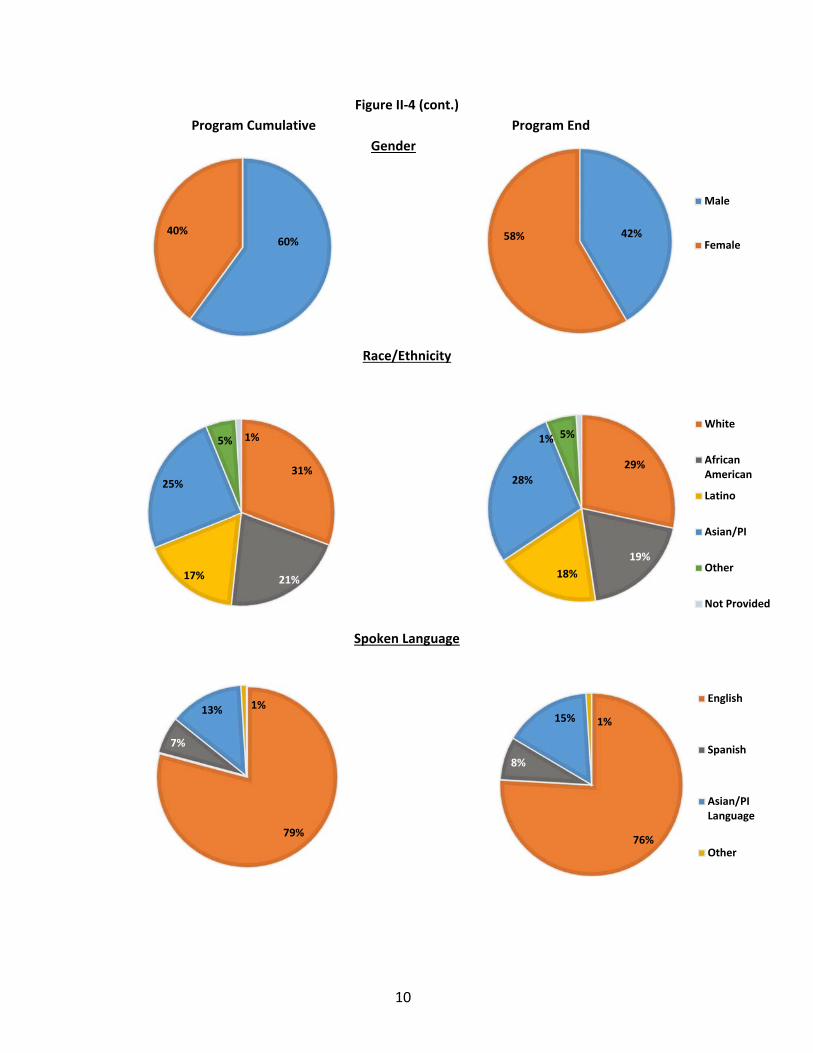
Participant Demographics
The following figures compare SF PATH population demographic characteristics at the end of the program
with the cumulative program. Demographic characteristics were very similar, with the exception of
gender. Cumulatively, 60% of enrollees were male, but at the end of the program, only 40% of participants
were male. This might indicate that while more male participants enrolled in the program, they did not
take the necessary actions to remain in SF PATH. The proportion of participants enrolled in each medical
home remained constant throughout the program.
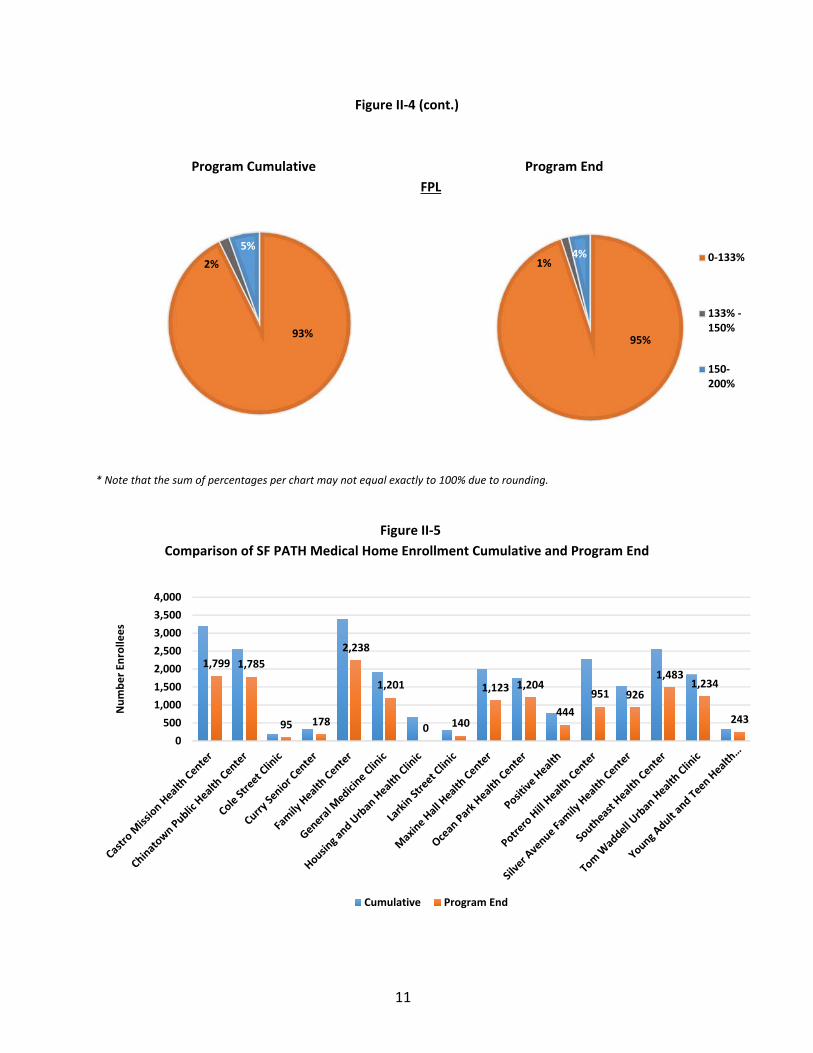
There were some notable differences in HSF and SF PATH population demographics due to different
program eligibility rules, including income limits. While only 19% of HSF participants were 55 or older at
the end of FY2013‐14, 30% of SF PATH participants were 55 or older. For HSF, 12% self‐identified as
Caucasian and 3% identified as African American, but in SF PATH, 29% self‐identified as Caucasian and
19% were African American. Due to racial makeup differences, the overwhelming majority (76%)
identified English as the preferred language. While only 8% of SF PATH participants said Spanish was their
preferred language, 42% of HSF participants preferred Spanish. 95% of SF PATH participants had income
levels that were eligible for Medi‐Cal expansion.
Figure II‐4
Demographic Comparison of SF PATH Participants, Program Cumulative and Program End*
Program Cumulative Program End
Age
8%
11%
18%
19%
14%
30%
<=24
25‐29
30‐39
40‐49
50‐54
55+
6%
12%
20%
19%
13%
30%
10
Figure II‐4 (cont.)
Program Cumulative Program End
Gender
Race/Ethnicity
Spoken Language
60%40% 42%58%
Male
Female
31%
21%17%
25%
5% 1%
29%
19%
18%
28%
5%1%
White
AfricanAmerican
Latino
Asian/PI
Other
Not Provided
79%
7%
13% 1%
76%
8%
15% 1%
English
Spanish
Asian/PILanguage
Other
11
Figure II‐4 (cont.)
Program Cumulative Program End
FPL
* Note that the sum of percentages per chart may not equal exactly to 100% due to rounding.
Figure II‐5
Comparison of SF PATH Medical Home Enrollment Cumulative and Program End
1,799 1,785
95 178
2,238
1,201
0 140
1,123 1,204
444
951 926
1,4831,234
243
0
500
1,000
1,500
2,000
2,500
3,000
3,500
4,000
Number En
rollees
Cumulative Program End
95%
1%4% 0‐133%
133% ‐150%
150‐200%
93%
2%
5%
12
Since most of the SF PATH population became eligible for transition to Medi‐Cal starting January 1, 2014,
this population will likely continue to be DPH’s responsibility under the Medi‐Cal managed care program.
Clinical Utilization
While SF PATH’s key purpose was to provide eligible low income uninsured individuals with an option for
administrative transition to Medi‐Cal starting January 1, 2014, the program also sought to improve
program participants’ health by enrolling them into coordinated care during SF PATH’s duration. This
section reviews SF PATH participants’ clinical and service data to determine whether the program met its
goals with respect to improved health outcomes and appropriate utilization of services. Since the majority
of SF PATH participants were automatically enrolled into Medi‐Cal managed care, appropriate utilization
and overall health outcomes impacts the DPH’s managed care programs after January 1, 2014.
In general, the SF PATH population utilized services at a higher rate than the HSF population, both
compared to the entire HSF population and compared to HSF participants with a DPH medical home.
Compared to the HSF population, the SF PATH population had a higher total percentage of participants
who utilized at least one primary care or specialty service, had a prescription, outpatient emergency
department (ED) visits, and inpatient admissions.
Utilization Summary
SF PATH Program participants actively used services throughout the program’s duration. During June 2013
to Dec 2013, 42.29% of SF PATH participants visited a provider within 60 days of enrollment. During 2013,
6,218 participants were continuously enrolled for at least 12 months. Of those participants, 77% had at
least one primary care or specialty care visit, 1% had at least one inpatient admission and 68% utilized a
prescription. Compared to the HSF population, 72% of HSF participants utilized at least one primary care
or specialty service and 43% had a prescription. Since Medi‐Cal members are required to have an Initial
Health Assessment within 120 days of enrollment unless the provider can document a qualifying service
provided to the patient in the last 12 months, a number of participants who rolled over to DPH’s Medi‐
Cal managed care program will need to have a qualifying visit. Inpatient admission encounter data
presented in the table below is primarily from DPH and may not capture utilization at hospitals outside of
San Francisco General Hospital (SFGH).
Table II‐2
SF PATH Program Utilization Summary January – December, 2013
Service Category Number of Participants Continuously Enrolled
Number of Participants Utilizing at Least One Service
Percentage
Primary / Specialty Care 6,218 4,797 77.15%
Inpatient Admission 6,218 92 1.48%
Prescription 6,218 4,250 68.35%
13
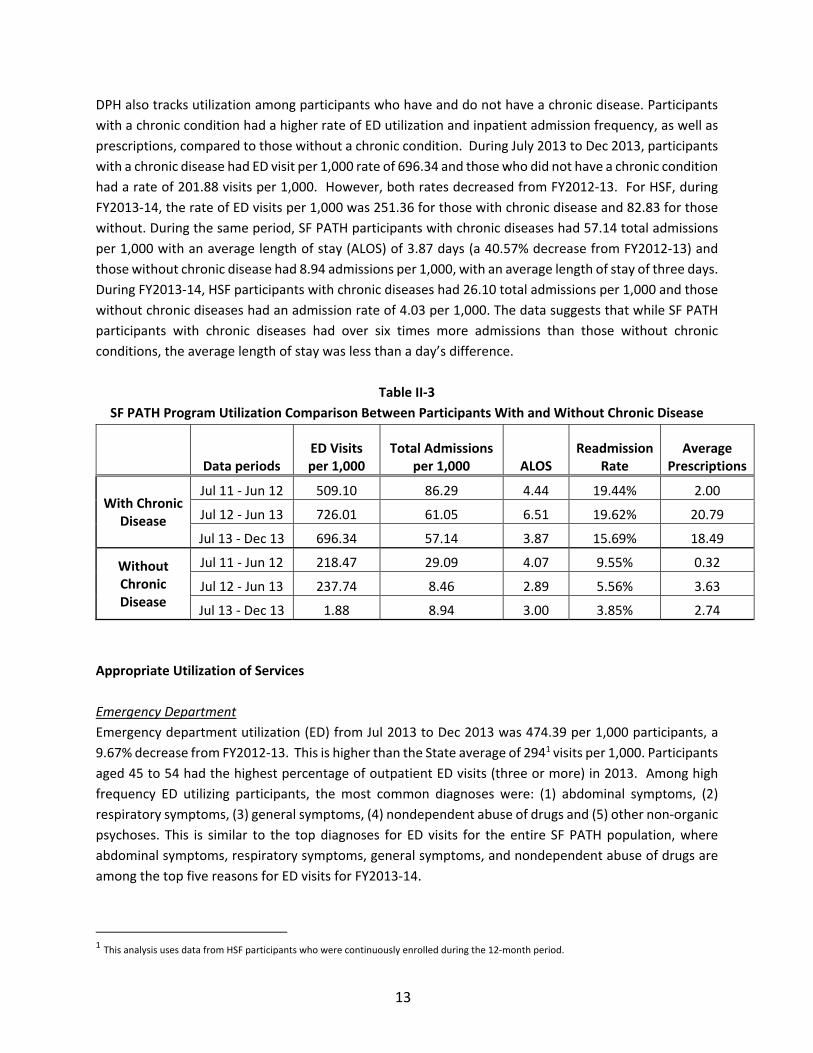
DPH also tracks utilization among participants who have and do not have a chronic disease. Participants
with a chronic condition had a higher rate of ED utilization and inpatient admission frequency, as well as
prescriptions, compared to those without a chronic condition. During July 2013 to Dec 2013, participants
with a chronic disease had ED visit per 1,000 rate of 696.34 and those who did not have a chronic condition
had a rate of 201.88 visits per 1,000. However, both rates decreased from FY2012‐13. For HSF, during
FY2013‐14, the rate of ED visits per 1,000 was 251.36 for those with chronic disease and 82.83 for those
without. During the same period, SF PATH participants with chronic diseases had 57.14 total admissions
per 1,000 with an average length of stay (ALOS) of 3.87 days (a 40.57% decrease from FY2012‐13) and
those without chronic disease had 8.94 admissions per 1,000, with an average length of stay of three days.
During FY2013‐14, HSF participants with chronic diseases had 26.10 total admissions per 1,000 and those
without chronic diseases had an admission rate of 4.03 per 1,000. The data suggests that while SF PATH
participants with chronic diseases had over six times more admissions than those without chronic
conditions, the average length of stay was less than a day’s difference.
Table II‐3
SF PATH Program Utilization Comparison Between Participants With and Without Chronic Disease
Data periods ED Visits per 1,000
Total Admissions per 1,000 ALOS
Readmission Rate
Average Prescriptions
With Chronic Disease
Jul 11 ‐ Jun 12 509.10 86.29 4.44 19.44% 2.00
Jul 12 ‐ Jun 13 726.01 61.05 6.51 19.62% 20.79
Jul 13 ‐ Dec 13 696.34 57.14 3.87 15.69% 18.49
Without Chronic Disease
Jul 11 ‐ Jun 12 218.47 29.09 4.07 9.55% 0.32
Jul 12 ‐ Jun 13 237.74 8.46 2.89 5.56% 3.63
Jul 13 ‐ Dec 13 1.88 8.94 3.00 3.85% 2.74
Appropriate Utilization of Services
Emergency Department
Emergency department utilization (ED) from Jul 2013 to Dec 2013 was 474.39 per 1,000 participants, a
9.67% decrease from FY2012‐13. This is higher than the State average of 2941 visits per 1,000. Participants
aged 45 to 54 had the highest percentage of outpatient ED visits (three or more) in 2013. Among high
frequency ED utilizing participants, the most common diagnoses were: (1) abdominal symptoms, (2)
respiratory symptoms, (3) general symptoms, (4) nondependent abuse of drugs and (5) other non‐organic
psychoses. This is similar to the top diagnoses for ED visits for the entire SF PATH population, where
abdominal symptoms, respiratory symptoms, general symptoms, and nondependent abuse of drugs are
among the top five reasons for ED visits for FY2013‐14.
1 This analysis uses data from HSF participants who were continuously enrolled during the 12‐month period.
14
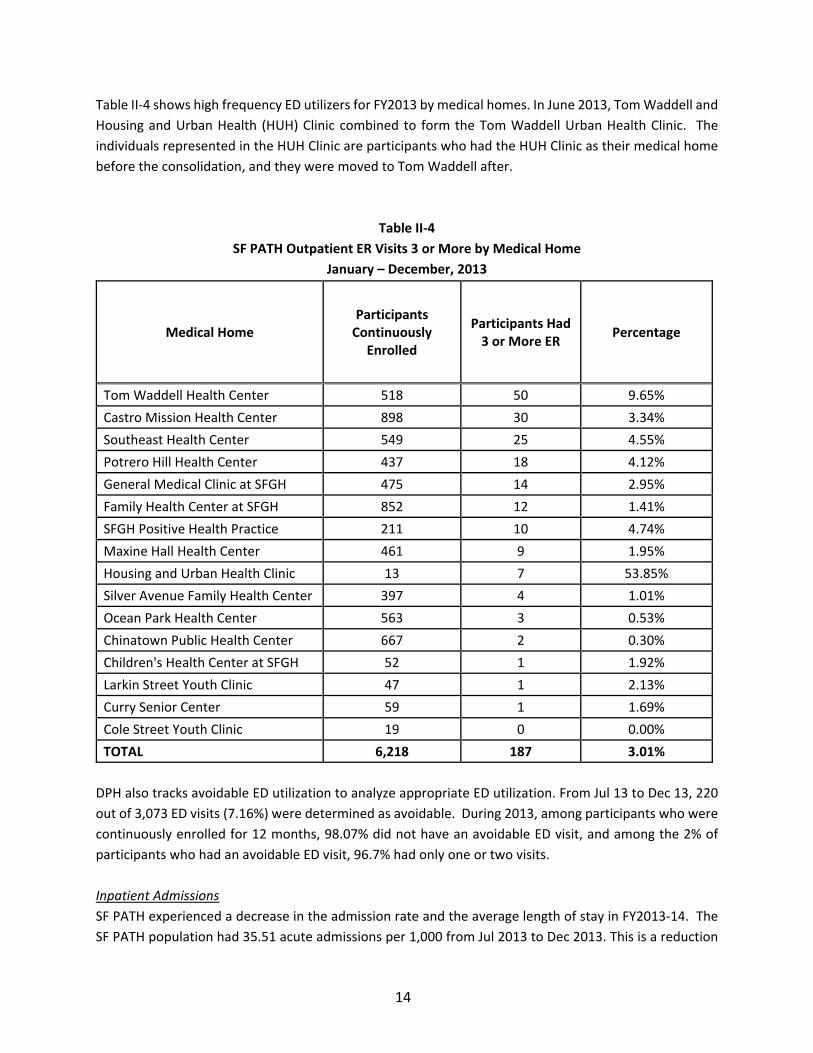
Table II‐4 shows high frequency ED utilizers for FY2013 by medical homes. In June 2013, Tom Waddell and
Housing and Urban Health (HUH) Clinic combined to form the Tom Waddell Urban Health Clinic. The
individuals represented in the HUH Clinic are participants who had the HUH Clinic as their medical home
before the consolidation, and they were moved to Tom Waddell after.
Table II‐4
SF PATH Outpatient ER Visits 3 or More by Medical Home
January – December, 2013
Medical Home Participants Continuously Enrolled
Participants Had 3 or More ER
Percentage
Tom Waddell Health Center 518 50 9.65%
Castro Mission Health Center 898 30 3.34%
Southeast Health Center 549 25 4.55%
Potrero Hill Health Center 437 18 4.12%
General Medical Clinic at SFGH 475 14 2.95%
Family Health Center at SFGH 852 12 1.41%
SFGH Positive Health Practice 211 10 4.74%
Maxine Hall Health Center 461 9 1.95%
Housing and Urban Health Clinic 13 7 53.85%
Silver Avenue Family Health Center 397 4 1.01%
Ocean Park Health Center 563 3 0.53%
Chinatown Public Health Center 667 2 0.30%
Children's Health Center at SFGH 52 1 1.92%
Larkin Street Youth Clinic 47 1 2.13%
Curry Senior Center 59 1 1.69%
Cole Street Youth Clinic 19 0 0.00%
TOTAL 6,218 187 3.01%
DPH also tracks avoidable ED utilization to analyze appropriate ED utilization. From Jul 13 to Dec 13, 220
out of 3,073 ED visits (7.16%) were determined as avoidable. During 2013, among participants who were
continuously enrolled for 12 months, 98.07% did not have an avoidable ED visit, and among the 2% of
participants who had an avoidable ED visit, 96.7% had only one or two visits.
Inpatient Admissions
SF PATH experienced a decrease in the admission rate and the average length of stay in FY2013‐14. The
SF PATH population had 35.51 acute admissions per 1,000 from Jul 2013 to Dec 2013. This is a reduction

15
of 9.93% from FY2012‐13 (39.42 admissions per 1,000) and a 38.5% reduction (57.76 admissions per
1,000) from FY2011‐12, the first year of the program. During FY2013‐14, HSF participants with DPH
medical homes had an acute admission rate of 12.51 per 1,000. The SF PATH average length of stay from
Jul 2013 to Dec 2013 was 3.77, a decrease of 39.09% (6.19 days) from FY2012‐13 and 13.3% (4.35 days)
from FY2011‐12. In 2013, over 98% of SF PATH participants continuously enrolled for 12 months did not
have an inpatient admission, an increase of 1.93% from 2012.
In 2013, the top five diagnoses for participants with inpatient admissions were: (1) alcohol withdrawal,
(2) cellulitis and abscess of leg, (3) unspecified septicemia, (4) acute on chronic systolic heart and (5) acute
pancreatitis.
Out‐of‐Network Utilization
Unlike HSF, SF PATH covered the cost of out‐of‐network emergency visits. Per LIHP requirements,
hospitals that provide emergency and post‐stabilization services to LIHP participants may seek
reimbursements from the LIHP if they meet LIHP requirements. Out‐of‐network hospitals providing
services to SF PATH participants must notify the SFGH Utilization Management (UM) Department within
24 hours to be eligible for reimbursement for services provided. Following is an analysis of out‐of‐
network claims for SF PATH participants submitted to SFGH’s UM Department. These visits may not be
captured in the previous emergency and inpatient analysis since the clinical utilization analysis is from
data encounters that are submitted to the San Francisco Health Plan (SFHP), who served as the Third Party
Administrator (TPA) for the SF PATH Program.
SFGH UM received a total of 6,367 claims for 2,793 members through December 31, 2013. Of these, 1,236
claims were accepted for 252 members; 347 (5.4%) claims were from providers outside of San Francisco.
Through December 2013, the total paid amount for out‐of‐network claims for SF PATH participants was
$228,538.11. Since providers may submit claims several months after an encounter, some claims may not
have been received at the time of this analysis and are not reflected in this report.
Table II‐5
SF PATH Program Out of Network Utilization
July 2011 – December 2013
Members Claims Outside SF
Accepted 252 1,236 41
Rejected 2,541 5,131 306
Total 2,793 6,367 347
16
Transition to Medi‐Cal
The LIHP Program ended after December 31, 2013 with the administrative transition of all SF PATH
enrollees to MEDS, California’s Medi‐Cal system of records. To maximize the number of uninsured San
Franciscan residents eligible for automatic transition to Medi‐Cal expansion, DPH took steps to increase
SF PATH enrollment.
Suspension of Redetermination
SF PATH participated in the State option to suspend redetermination for LIHP enrollees who had
termination dates between September 1 and December 31, 2013, extending their termination date by
one year. DPH enacted this option to minimize the number of participants who would need to see an
Application Assistor to re‐determine their program eligibility. This ensured that more people would be
eligible for transition to Medi‐Cal, while increasing the HSF enrollment site’s capacity to enroll individuals
in ACA insurance options. In total, 2,467 participants had their renewal dates deferred by one year.
BlueShield of California Foundation Grant – Direct to MEDS Transition
In late 2012, the State of California offered all LIHPs two options for transferring LIHP enrollee case
information to the Department of Healthcare Services (DHCS). One option was to transfer all case
information to the County Human Services Agency (HSA), the local agency with delegated authority to
determine Medi‐Cal eligibility, and for HSA to send these case files to MEDS, the State’s Medi‐Cal systems
of record. The second option was for local LIHPs to send the case information of LIHP enrollees directly to
MEDS and then subsequently send the case information to HSA, which is needed for redetermination or
renewal of these participants once they have been transitioned into Medi‐Cal. In order to avoid any
discrepancies between what the SF PATH program has and what information is ultimately received by
DHCS and MEDS, DPH chose to send information of SF PATH enrollees directly to MEDS.
While a direct to MEDS approach provided SF PATH control over the information that DHCS received on
SF PATH participants and those eligible for transition to Medi‐Cal, it necessitated the creation of two data
transfer pathways: one from One‐e‐App to MEDS and one from One‐e‐App to CalWIN (San Francisco’s
HSA system of records). Partnering with Alameda County and San Mateo County, the three Bay Area
counties applied for and received a grant from the Blue Shield of California Foundation to complete these
projects. San Francisco served as the grant administrator on behalf of the three counties. By June 30,
2014, all LIHP participant data was successfully transferred to both MEDS and CalWIN.
SF PATH Enrollment Efforts
In order to increase the number of individuals eligible for automatic transition, DPH took steps to
maximize enrollment. On September 28, 2013, HSF transitioned 2,926 HSF participants who met SF PATH
eligibility to the SF PATH Program. In addition, HSF partnered with several DPH Divisions and community‐
based organizations to conduct targeted outreach utilizing a streamlined application process for those
who met certain criteria. These included working with those serving mental health and substance abuse
clients, homeless individuals, and other residential facilities. As a result of these targeted enrollment
efforts, 4,646 participants were enrolled in SF PATH from September, 2013 to December 31, 2013.
17
Continuity of Care for LIHP/SF PATH Participants
During the transition, continuity of care for existing SF PATH participants as they transitioned into Medi‐
Cal was a primary concern for DPH. In order to ensure continuity of care, DPH worked closely with both
Medi‐Cal Managed Care Plans (SFHP and Anthem Blue Cross) to ensure that open authorizations for SF
PATH participants were communicated so that there were minimal interruptions to services and
prescriptions. Since SFHP was also the TPA for the SF PATH Program, SF PATH participants who enrolled
into their Medi‐Cal plan were assigned their SF PATH medical home if they did not select a different
medical home. In addition, DPH retained SF PATH pharmacy benefits through March, 2014 so that
participants could continue to access their prescriptions if they experienced problems transitioning to
Medi‐Cal.
Program Termination
When the SF PATH Program ended on December 31, 2013, all participant information was successfully
transmitted to the Department of Health Care Services (DHCS) and SF PATH was successfully closed in
One‐e‐App. At its conclusion, SF PATH had 15,046 participants: 14,290 were preliminarily determined
eligible for expansion Medi‐Cal and 756 were not eligible for Medi‐Cal but were eligible to purchase
subsidized health insurance through Covered California. As of May 31, 2014, all SF PATH participants were
dispositioned in MEDS and 13,680 individuals were transitioned to Medi‐Cal with coverage effective
January 1, 2014. There were 430 individuals who were not transitioned. There are several reasons that a
person could have been identified by the SF PATH program as eligible for transition but ultimately
determined not eligible by DHCS, including already being enrolled in Medi‐Cal, exceeding the age limit by
January 1, 2014 and so forth.
All individuals enrolled in Medi‐Cal as a part of the SF PATH termination will go through a full eligibility
determination by HSA during their annual redetermination. During 2014, renewals for those with term
dates between January and May, 2014 were delayed in anticipation of the increased demand for HSA
services due to Covered California open enrollment. DPH continues to track the status of SF PATH
participants after their transition to understand their behavior in Medi‐Cal Managed Care programs and
to ensure that DPH continues to meet their health care needs after the transition.
18
III. FY2013‐14 PROGRAM ACTIVITIES
A. COMMUNICATIONS, OUTREACH, APPLICATIONS AND ENROLLMENT
This section discusses HSF outreach, application, and enrollment trends.
Communications and Outreach
HSF relies heavily on positive public relations, community outreach, and word of mouth to generate
interest in and attention to the program.
HSF updated its website (www.healthysanfrancisco.org) with more user‐friendly features in October
2013. The updated website features an enhanced user experience on an easily navigable site containing
valuable Health Care Reform content. The HSF website continues to be an accessible and versatile
program communications tool, attracting a total of 155,857 visitors during FY2013‐14, despite a decrease
in utilization with an average of 7,677 visits per month. Although the HSF website is available in English,
Chinese and Spanish, the overwhelming majority of visits were to the English site (97.7%) followed by
Chinese (1.44%) and Spanish (.86%). New visits comprised 67.9% of all visits. The new City Option website
created separation from HSF, providing comprehensive information for the City Option on a separate site.
The City Option is a program that was formed by San Francisco for employers to meet the Employer
Spending Requirement portion of the Health Care Security Ordinance, if they do not elect to pay into HSF
(discussed in Section III‐G).
In addition to the website, the general public can also obtain information on HSF and SF PATH by calling
the City and County of San Francisco’s 3‐1‐1 System. Call volumes to 3‐1‐1 increased through December,
rising from 329 in the first quarter to 467 in the second quarter, and falling to levels that were similar with
the last quarter of the previous year, ending the year with 214 people calling during the last quarter of FY
2013‐14. HSF recognizes the value in providing a social media outlet for program exposure and in
leveraging social media to engage HSF participants who have proven harder to engage through more
traditional program communications channels such as mail and telephone. The program regularly posts
health education materials on the HSF Facebook page (http://www.facebook.com/HealthySF).
In April 2014, the City and County of San Francisco certified Tagalog as a threshold language and all public‐
facing departments will provide all available materials in Tagalog. HSF will provide all communications in
Tagalog to participants, including website, notices, applications, and other materials. This effort will be
implemented within 18 months, beginning in July 2014.
Applications
HSF enrollment begins with a trained Application Assistor, As of June 30, 2014, HSF had 165 Application
Assistors who helped San Francisco residents apply for the program at 33 different enrollment sites
throughout San Francisco. In FY2013‐14, Application Assistors processed 39,792 applications through the
web‐based eligibility and enrollment system, One‐e‐App, a 35% decrease from FY2012‐13. This decrease
is due to Application Assistors using CalHEERS, the application system for new health care options,
19
including Medi‐Cal and subsidized insurance through Covered California, to screen applicants for new
health care options since open enrollment began on October 1, 2013. Since most HSF participants are
eligible for these new options, and no longer eligible for HSF, they will not complete an application in One‐
e‐App.
The HSF program continues to offer trainings for new Application Assistors and refresher trainings for new
and current Application Assistors throughout the year, including a series of trainings for Community
Behavioral Health Services (CBHS) and two refresher webinars covering the HSF Transition Period in
FY2013‐14 described in Section I.
In FY2013‐14, applicants were determined to be eligible for HSF or SF PATH, preliminarily eligible for
another public program, or ineligible for any program. Of the 39,792 applications processed, 96.4% of
applicants were determined by One‐e‐App to be eligible for and submitted to a health program, 1.5% did
not have an eligibility determination made or did not complete an application and about 1.5% were
determined ineligible for any program. An eligibility determination may not be made if the application is
still in process or if the application is cancelled before a final eligibility determination is made. Applicants
are ineligible if they exceed the income eligibility threshold, are not within the eligibility age range, are
enrolled in health insurance or are not San Francisco residents.
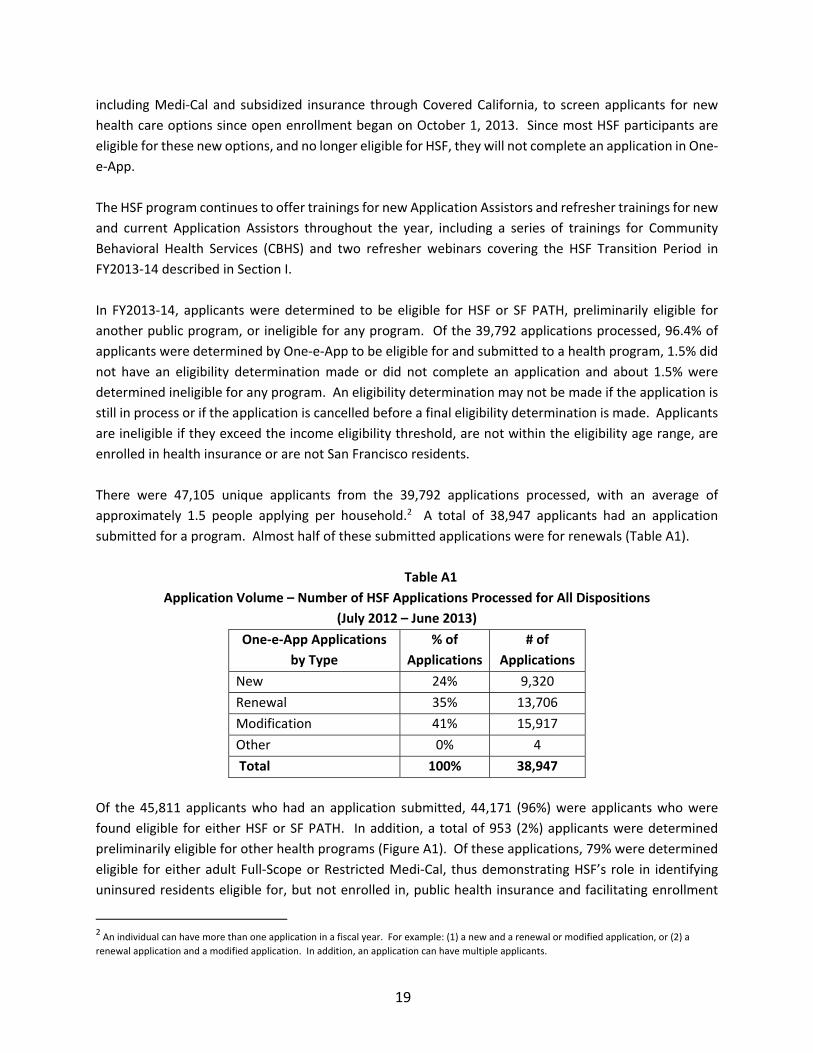
There were 47,105 unique applicants from the 39,792 applications processed, with an average of
approximately 1.5 people applying per household.2 A total of 38,947 applicants had an application
submitted for a program. Almost half of these submitted applications were for renewals (Table A1).
Table A1
Application Volume – Number of HSF Applications Processed for All Dispositions
(July 2012 – June 2013)
One‐e‐App Applications
by Type
% of
Applications
# of
Applications
New 24% 9,320
Renewal 35% 13,706
Modification 41% 15,917
Other 0% 4
Total 100% 38,947
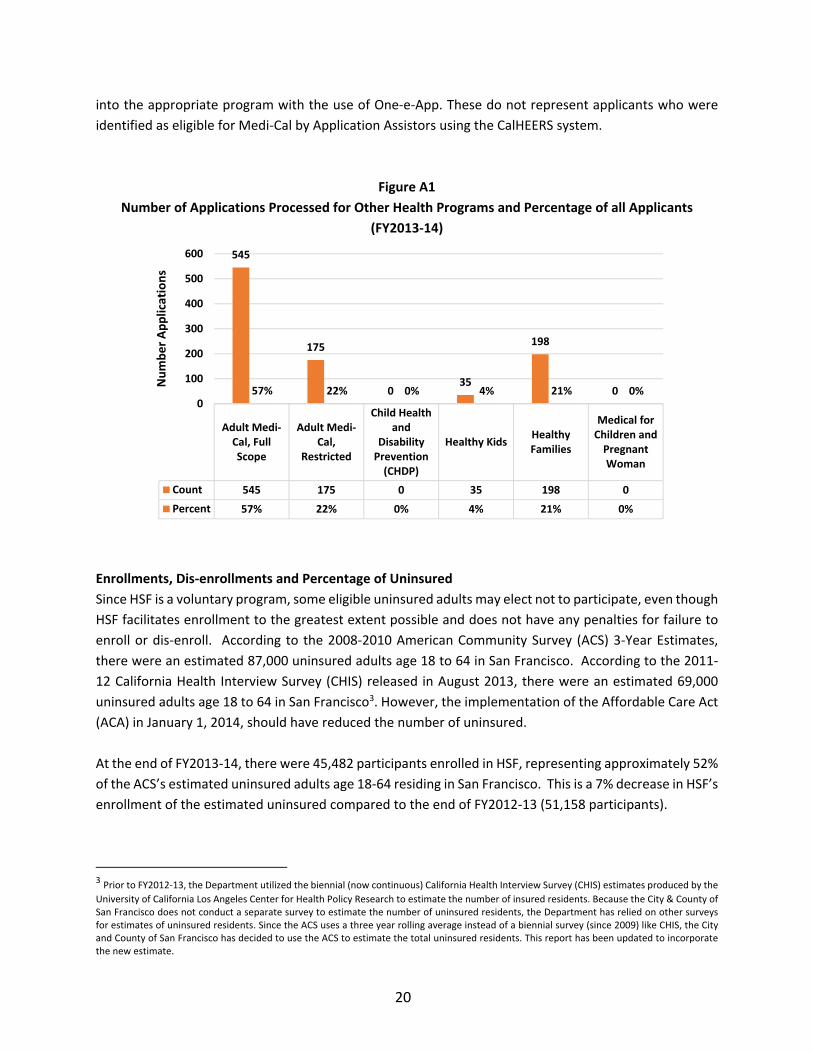
Of the 45,811 applicants who had an application submitted, 44,171 (96%) were applicants who were
found eligible for either HSF or SF PATH. In addition, a total of 953 (2%) applicants were determined
preliminarily eligible for other health programs (Figure A1). Of these applications, 79% were determined
eligible for either adult Full‐Scope or Restricted Medi‐Cal, thus demonstrating HSF’s role in identifying
uninsured residents eligible for, but not enrolled in, public health insurance and facilitating enrollment
2 An individual can have more than one application in a fiscal year. For example: (1) a new and a renewal or modified application, or (2) a
renewal application and a modified application. In addition, an application can have multiple applicants.
20
into the appropriate program with the use of One‐e‐App. These do not represent applicants who were
identified as eligible for Medi‐Cal by Application Assistors using the CalHEERS system.
Figure A1
Number of Applications Processed for Other Health Programs and Percentage of all Applicants
(FY2013‐14)
Enrollments, Dis‐enrollments and Percentage of Uninsured
Since HSF is a voluntary program, some eligible uninsured adults may elect not to participate, even though
HSF facilitates enrollment to the greatest extent possible and does not have any penalties for failure to
enroll or dis‐enroll. According to the 2008‐2010 American Community Survey (ACS) 3‐Year Estimates,
there were an estimated 87,000 uninsured adults age 18 to 64 in San Francisco. According to the 2011‐
12 California Health Interview Survey (CHIS) released in August 2013, there were an estimated 69,000
uninsured adults age 18 to 64 in San Francisco3. However, the implementation of the Affordable Care Act
(ACA) in January 1, 2014, should have reduced the number of uninsured.
At the end of FY2013‐14, there were 45,482 participants enrolled in HSF, representing approximately 52%
of the ACS’s estimated uninsured adults age 18‐64 residing in San Francisco. This is a 7% decrease in HSF’s
enrollment of the estimated uninsured compared to the end of FY2012‐13 (51,158 participants).
3 Prior to FY2012‐13, the Department utilized the biennial (now continuous) California Health Interview Survey (CHIS) estimates produced by the
University of California Los Angeles Center for Health Policy Research to estimate the number of insured residents. Because the City & County of San Francisco does not conduct a separate survey to estimate the number of uninsured residents, the Department has relied on other surveys for estimates of uninsured residents. Since the ACS uses a three year rolling average instead of a biennial survey (since 2009) like CHIS, the City and County of San Francisco has decided to use the ACS to estimate the total uninsured residents. This report has been updated to incorporate the new estimate.
Adult Medi‐Cal, FullScope
Adult Medi‐Cal,
Restricted
Child Healthand
DisabilityPrevention(CHDP)
Healthy KidsHealthyFamilies
Medical forChildren andPregnantWoman
Count 545 175 0 35 198 0
Percent 57% 22% 0% 4% 21% 0%
545
175
035
198
057% 22% 0% 4% 21% 0%0
100
200
300
400
500
600
Number Applications
21
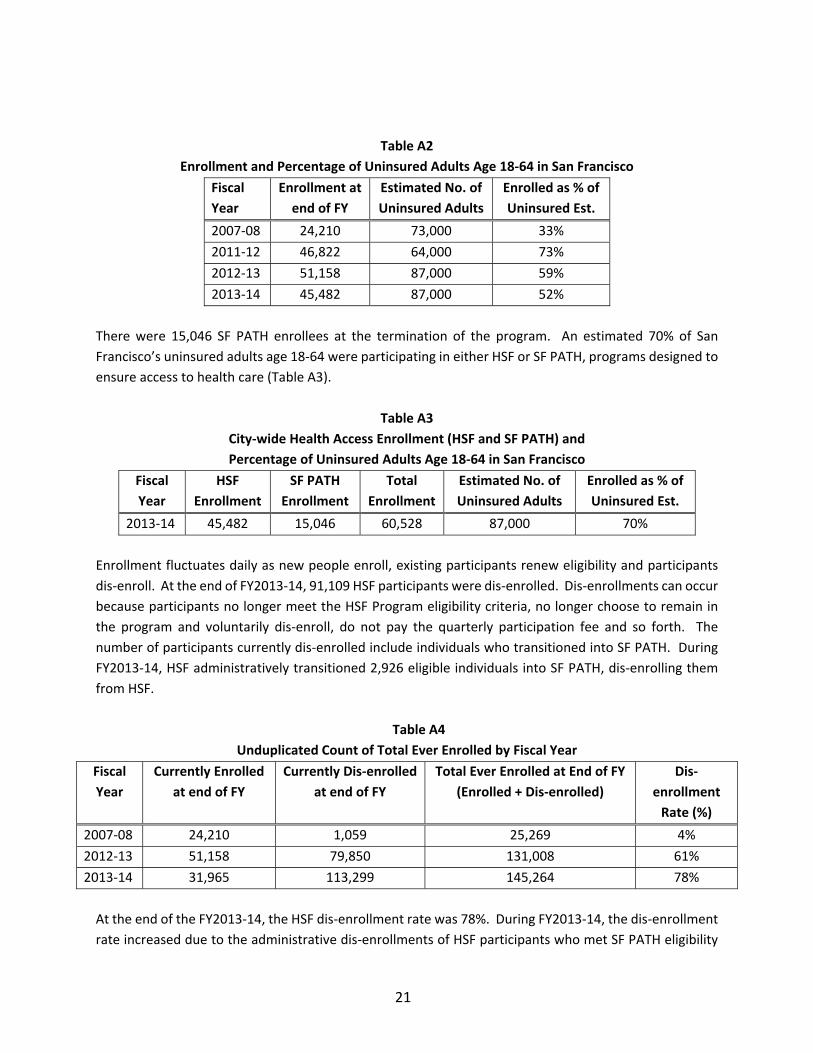
Table A2
Enrollment and Percentage of Uninsured Adults Age 18‐64 in San Francisco
Fiscal
Year
Enrollment at
end of FY
Estimated No. of
Uninsured Adults
Enrolled as % of
Uninsured Est.
2007‐08 24,210 73,000 33%
2011‐12 46,822 64,000 73%
2012‐13 51,158 87,000 59%
2013‐14 45,482 87,000 52%
There were 15,046 SF PATH enrollees at the termination of the program. An estimated 70% of San
Francisco’s uninsured adults age 18‐64 were participating in either HSF or SF PATH, programs designed to
ensure access to health care (Table A3).
Table A3
City‐wide Health Access Enrollment (HSF and SF PATH) and
Percentage of Uninsured Adults Age 18‐64 in San Francisco
Fiscal
Year
HSF
Enrollment
SF PATH
Enrollment
Total
Enrollment
Estimated No. of
Uninsured Adults
Enrolled as % of
Uninsured Est.
2013‐14 45,482 15,046 60,528 87,000 70%
Enrollment fluctuates daily as new people enroll, existing participants renew eligibility and participants
dis‐enroll. At the end of FY2013‐14, 91,109 HSF participants were dis‐enrolled. Dis‐enrollments can occur
because participants no longer meet the HSF Program eligibility criteria, no longer choose to remain in
the program and voluntarily dis‐enroll, do not pay the quarterly participation fee and so forth. The
number of participants currently dis‐enrolled include individuals who transitioned into SF PATH. During
FY2013‐14, HSF administratively transitioned 2,926 eligible individuals into SF PATH, dis‐enrolling them
from HSF.
Table A4
Unduplicated Count of Total Ever Enrolled by Fiscal Year
Fiscal
Year
Currently Enrolled
at end of FY
Currently Dis‐enrolled
at end of FY
Total Ever Enrolled at End of FY
(Enrolled + Dis‐enrolled)
Dis‐
enrollment
Rate (%)
2007‐08 24,210 1,059 25,269 4%
2012‐13 51,158 79,850 131,008 61%
2013‐14 31,965 113,299 145,264 78%
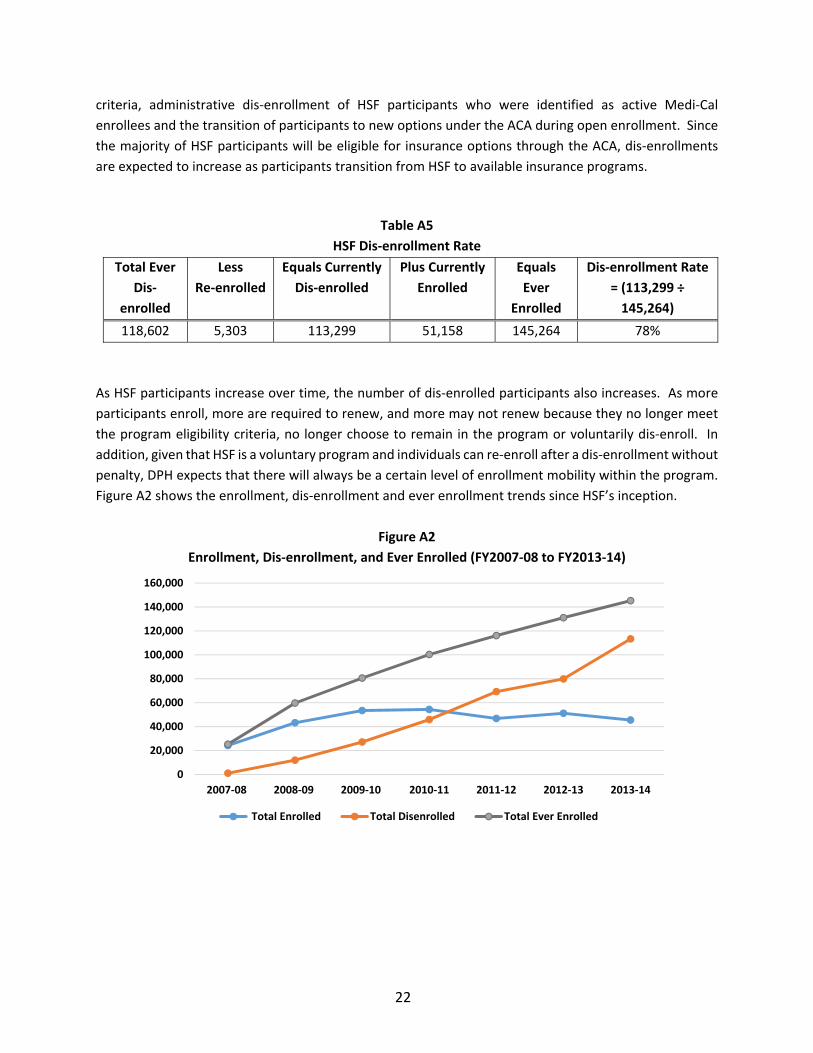
At the end of the FY2013‐14, the HSF dis‐enrollment rate was 78%. During FY2013‐14, the dis‐enrollment
rate increased due to the administrative dis‐enrollments of HSF participants who met SF PATH eligibility
22
criteria, administrative dis‐enrollment of HSF participants who were identified as active Medi‐Cal
enrollees and the transition of participants to new options under the ACA during open enrollment. Since
the majority of HSF participants will be eligible for insurance options through the ACA, dis‐enrollments
are expected to increase as participants transition from HSF to available insurance programs.
Table A5
HSF Dis‐enrollment Rate
Total Ever
Dis‐
enrolled
Less
Re‐enrolled
Equals Currently
Dis‐enrolled
Plus Currently
Enrolled
Equals
Ever
Enrolled
Dis‐enrollment Rate
= (113,299 ÷
145,264)
118,602 5,303 113,299 51,158 145,264 78%
As HSF participants increase over time, the number of dis‐enrolled participants also increases. As more
participants enroll, more are required to renew, and more may not renew because they no longer meet
the program eligibility criteria, no longer choose to remain in the program or voluntarily dis‐enroll. In
addition, given that HSF is a voluntary program and individuals can re‐enroll after a dis‐enrollment without
penalty, DPH expects that there will always be a certain level of enrollment mobility within the program.
Figure A2 shows the enrollment, dis‐enrollment and ever enrollment trends since HSF’s inception.
Figure A2
Enrollment, Dis‐enrollment, and Ever Enrolled (FY2007‐08 to FY2013‐14)
0
20,000
40,000
60,000
80,000
100,000
120,000
140,000
160,000
2007‐08 2008‐09 2009‐10 2010‐11 2011‐12 2012‐13 2013‐14
Total Enrolled Total Disenrolled Total Ever Enrolled

23
Dis‐enrollment Analysis
DPH regularly monitors and analyzes participant dis‐enrollments. By June 2014, 113,299 individuals were
dis‐enrolled from HSF for the following reasons:
Table A6
Dis‐enrollments By Reason
Current Dis‐enrollments by Reason Number Percent
Transitioned to SF PATH Program 11,328 10%
Program Eligibility 28,904 26%
Participation Fee 8,910 8%
Annual Renewal 63,770 56%
Other/Voluntary 387 <0.1%
Dis‐enrollments Due to Transition to SF PATH Program (10% ‐ 11,328 participants)
Ten (10%) of HSF participants transitioned into SF PATH in preparation for the Medi‐Cal Expansion in
January 2014 as a result of ACA implementation.
Dis‐enrollments Due to Program Eligibility (26% ‐ 28,904 participants)
Twenty‐Six (26%) of those dis‐enrolled no longer met the HSF eligibility requirements. Table A7 lists
specific program eligibility dis‐enrollment reasons. In FY2013‐14, HSF identified and administratively dis‐
enrolled 3,178 participants who actively enrolled in Medi‐Cal.
Table A7
Program Eligibility Dis‐enrollments
Dis‐enrollment Reason Number Percent
Enrolled in Public Coverage (including Medi‐Cal and PCIP) 11,839 41%
Exceeds Program Age Requirements 4,777 17%
Enrolled in Employer or Private Insurance 4,607 16%
Determined Eligible for Other Programs During Renewal or
Modification 2,781 10%
Not a San Francisco Resident 1,830 6%
Ineligible for City & County Program 325 1%
Dis‐enrollments Due to Participation Fee (8% ‐ 8,910 participants)
Dis‐enrollments due to insufficient payment of the quarterly participation fee comprised 8% of all
program dis‐enrollments at the end of FY2013‐14. These dis‐enrollments indicated the following:
Participant communicates that they could no longer afford the participation fee – 402 dis‐
enrollments
Insufficient payment of the participation fee – 8,508 dis‐enrollments
24
Dis‐enrollments due to participation fees occur for reasons other than inability to pay and may mask other
dis‐enrollment reasons. For example, an HSF participant at or above 100% FPL paying a participation fee
obtains health insurance during their 12‐month HSF eligibility period and may simply disregard the future
quarterly participant fee invoices. While program guidelines instruct HSF participants to contact HSF
Customer Service with any changes in health insurance status, some may neglect to do so. In such cases,
the dis‐enrollment is erroneously coded as failure to pay the participant fee when the correct code should
be dis‐enrollment due to eligibility – receipt of health insurance.
DPH analyzed the utilization of services among those with a participation fee related dis‐enrollment from
the time period July 2007 to June 2014. Analysis on 4,996 (59% of 8,508) of these dis‐enrolled individuals
was based on the fact that the individual sought services from DPH after HSF dis‐enrollment. These 4,996
individuals had a total of 87,646 clinical encounters after a HSF participation fee related dis‐enrollment.
Because there is no program penalty for re‐enrollment after a dis‐enrollment, the majority of encounters
(67%) were either HSF (9%) or SF PATH (58%); that is, 48% of the people with HSF participation fee‐related
dis‐enrollments eventually re‐enrolled and received health care services under HSF or SF PATH. Twenty‐
three percent (23%) of the encounters were paid for by health insurance (public or private) or other payer
sources after HSF dis‐enrollment. This supports the notion that some dis‐enrollments coded as
“insufficient payment” are in actuality dis‐enrollments due to obtaining health insurance.
Dis‐enrollments Due to Incompletion of Annual Renewal (56% ‐ 63,770 participants)
HSF eligibility is for a 12‐month period and the program requires participants to renew their eligibility in‐
person annually. If the renewal is not completed before the 12‐month period expires, the participant is
dis‐enrolled from the program. HSF participants receive notices and telephone calls to remind them to
renew before the end of their eligibility period.
Similar to FY2012‐13, the majority of dis‐enrollments in FY2013‐14 were due to failure to complete annual
renewal (56%). However, just as dis‐enrollments due to failure to pay participation fees can mask
different dis‐enrollment reasons, the same holds true for dis‐enrollments due to an incomplete annual
renewal. DPH has implemented new program components to promote on‐time renewal and to identify
true dis‐enrollment for participants who do not renew. During FY2013‐14, the program discontinued the
HSF renewal lottery program. HSF attempted to outreach to 25,251 participants who were approaching
their enrollment termination date. The program’s call center reached 11,063 (43.3%) of the participants
on the call lists and left messages for 4,822 (34.8%) participants.
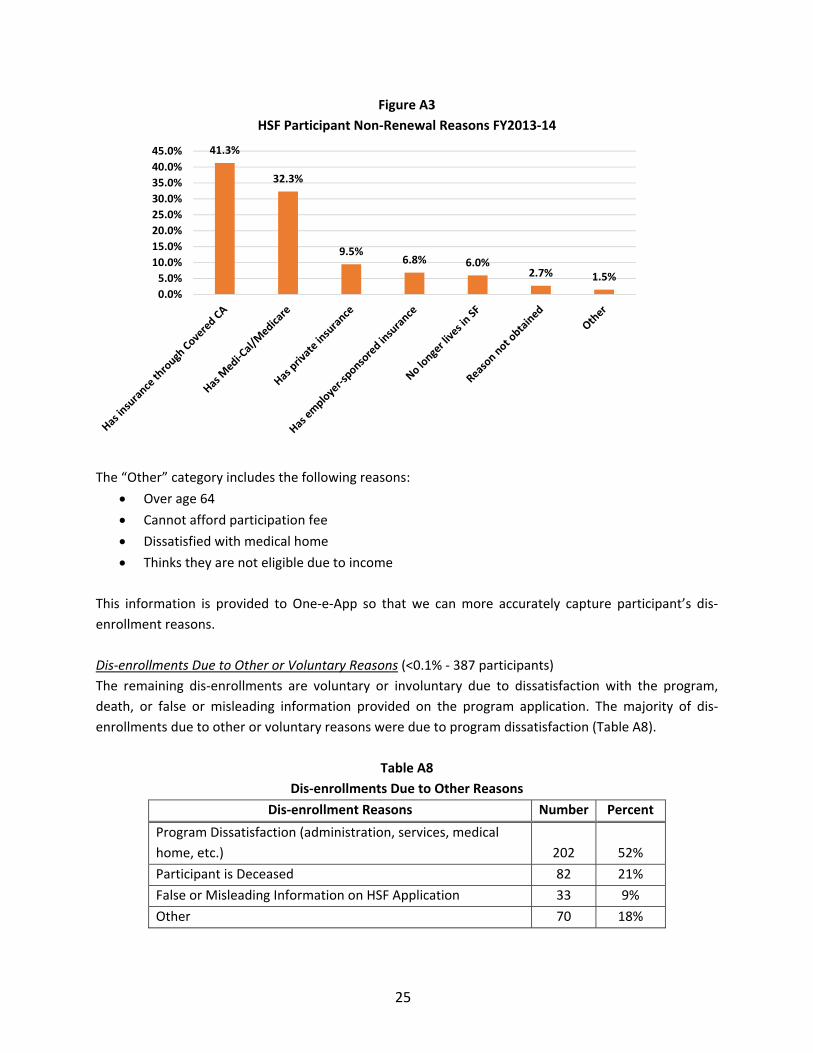
In FY2013‐14, there was a dramatic increase in the number of participants indicating they did not want to
renew their HSF coverage, primarily due to having enrolled in another insurance program. Of note, the
top reason was due to coverage through Covered California.
25
Figure A3
HSF Participant Non‐Renewal Reasons FY2013‐14
The “Other” category includes the following reasons:
Over age 64
Cannot afford participation fee
Dissatisfied with medical home
Thinks they are not eligible due to income
This information is provided to One‐e‐App so that we can more accurately capture participant’s dis‐
enrollment reasons.
Dis‐enrollments Due to Other or Voluntary Reasons (<0.1% ‐ 387 participants)
The remaining dis‐enrollments are voluntary or involuntary due to dissatisfaction with the program,
death, or false or misleading information provided on the program application. The majority of dis‐
enrollments due to other or voluntary reasons were due to program dissatisfaction (Table A8).
Table A8
Dis‐enrollments Due to Other Reasons
Dis‐enrollment Reasons Number Percent
Program Dissatisfaction (administration, services, medical
home, etc.) 202 52%
Participant is Deceased 82 21%
False or Misleading Information on HSF Application 33 9%
Other 70 18%
41.3%
32.3%
9.5%6.8% 6.0%
2.7% 1.5%
0.0%
5.0%
10.0%
15.0%
20.0%
25.0%
30.0%
35.0%
40.0%
45.0%
26
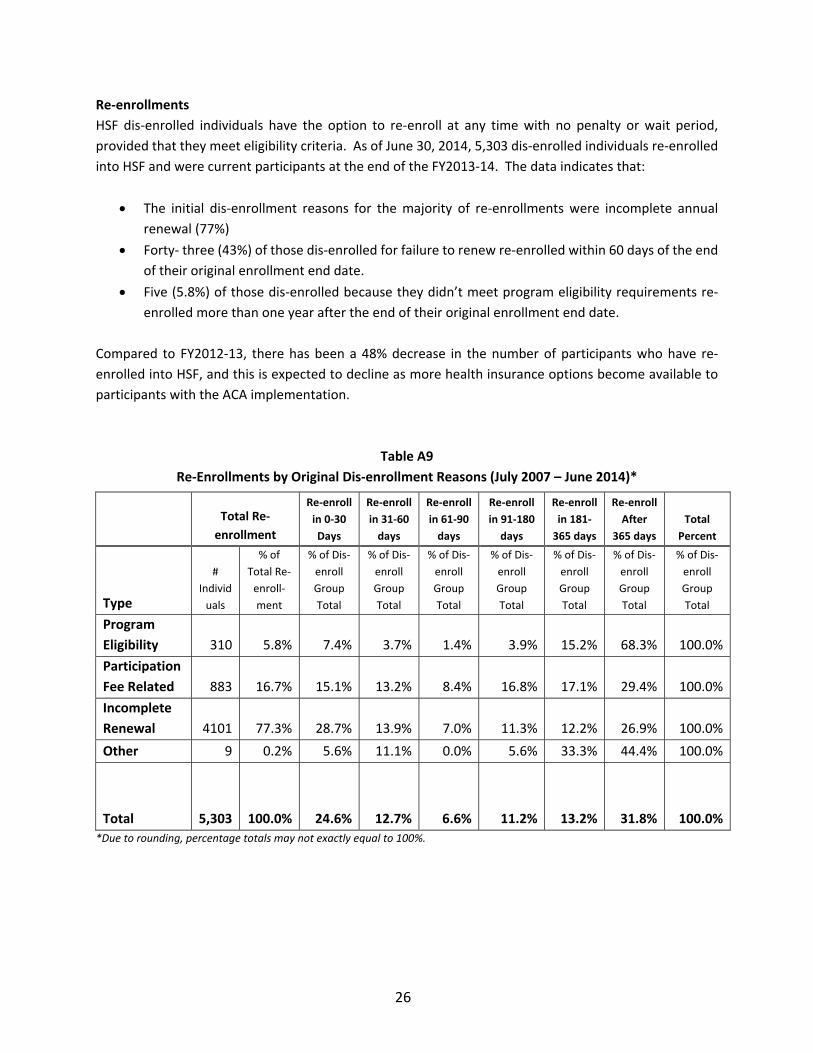
Re‐enrollments
HSF dis‐enrolled individuals have the option to re‐enroll at any time with no penalty or wait period,
provided that they meet eligibility criteria. As of June 30, 2014, 5,303 dis‐enrolled individuals re‐enrolled
into HSF and were current participants at the end of the FY2013‐14. The data indicates that:
The initial dis‐enrollment reasons for the majority of re‐enrollments were incomplete annual
renewal (77%)
Forty‐ three (43%) of those dis‐enrolled for failure to renew re‐enrolled within 60 days of the end
of their original enrollment end date.
Five (5.8%) of those dis‐enrolled because they didn’t meet program eligibility requirements re‐
enrolled more than one year after the end of their original enrollment end date.
Compared to FY2012‐13, there has been a 48% decrease in the number of participants who have re‐
enrolled into HSF, and this is expected to decline as more health insurance options become available to
participants with the ACA implementation.
Table A9
Re‐Enrollments by Original Dis‐enrollment Reasons (July 2007 – June 2014)*
Total Re‐
enrollment
Re‐enroll
in 0‐30
Days
Re‐enroll
in 31‐60
days
Re‐enroll
in 61‐90
days
Re‐enroll
in 91‐180
days
Re‐enroll
in 181‐
365 days
Re‐enroll
After
365 days
Total
Percent
Type
#
Individ
uals
% of
Total Re‐
enroll‐
ment
% of Dis‐
enroll
Group
Total
% of Dis‐
enroll
Group
Total
% of Dis‐
enroll
Group
Total
% of Dis‐
enroll
Group
Total
% of Dis‐
enroll
Group
Total
% of Dis‐
enroll
Group
Total
% of Dis‐
enroll
Group
Total
Program
Eligibility 310 5.8% 7.4% 3.7% 1.4% 3.9% 15.2% 68.3% 100.0%
Participation
Fee Related 883 16.7% 15.1% 13.2% 8.4% 16.8% 17.1% 29.4% 100.0%
Incomplete
Renewal 4101 77.3% 28.7% 13.9% 7.0% 11.3% 12.2% 26.9% 100.0%
Other 9 0.2% 5.6% 11.1% 0.0% 5.6% 33.3% 44.4% 100.0%
Total 5,303 100.0% 24.6% 12.7% 6.6% 11.2% 13.2% 31.8% 100.0%
*Due to rounding, percentage totals may not exactly equal to 100%.
27
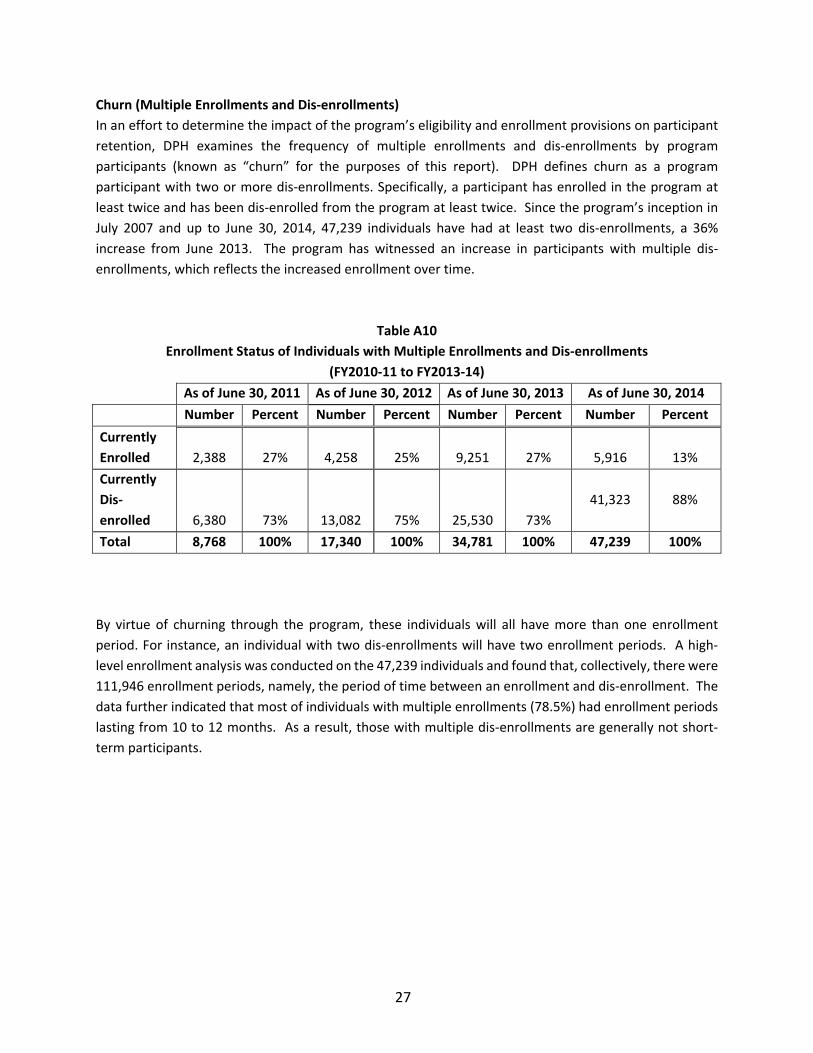
Churn (Multiple Enrollments and Dis‐enrollments)
In an effort to determine the impact of the program’s eligibility and enrollment provisions on participant
retention, DPH examines the frequency of multiple enrollments and dis‐enrollments by program
participants (known as “churn” for the purposes of this report). DPH defines churn as a program
participant with two or more dis‐enrollments. Specifically, a participant has enrolled in the program at
least twice and has been dis‐enrolled from the program at least twice. Since the program’s inception in
July 2007 and up to June 30, 2014, 47,239 individuals have had at least two dis‐enrollments, a 36%
increase from June 2013. The program has witnessed an increase in participants with multiple dis‐
enrollments, which reflects the increased enrollment over time.
Table A10
Enrollment Status of Individuals with Multiple Enrollments and Dis‐enrollments
(FY2010‐11 to FY2013‐14)
As of June 30, 2011 As of June 30, 2012 As of June 30, 2013 As of June 30, 2014
Number Percent Number Percent Number Percent Number Percent
Currently
Enrolled 2,388 27% 4,258 25% 9,251 27%
5,916
13%
Currently
Dis‐
enrolled 6,380 73% 13,082 75% 25,530 73%
41,323
88%
Total 8,768 100% 17,340 100% 34,781 100% 47,239 100%
By virtue of churning through the program, these individuals will all have more than one enrollment
period. For instance, an individual with two dis‐enrollments will have two enrollment periods. A high‐
level enrollment analysis was conducted on the 47,239 individuals and found that, collectively, there were
111,946 enrollment periods, namely, the period of time between an enrollment and dis‐enrollment. The
data further indicated that most of individuals with multiple enrollments (78.5%) had enrollment periods
lasting from 10 to 12 months. As a result, those with multiple dis‐enrollments are generally not short‐
term participants.
28
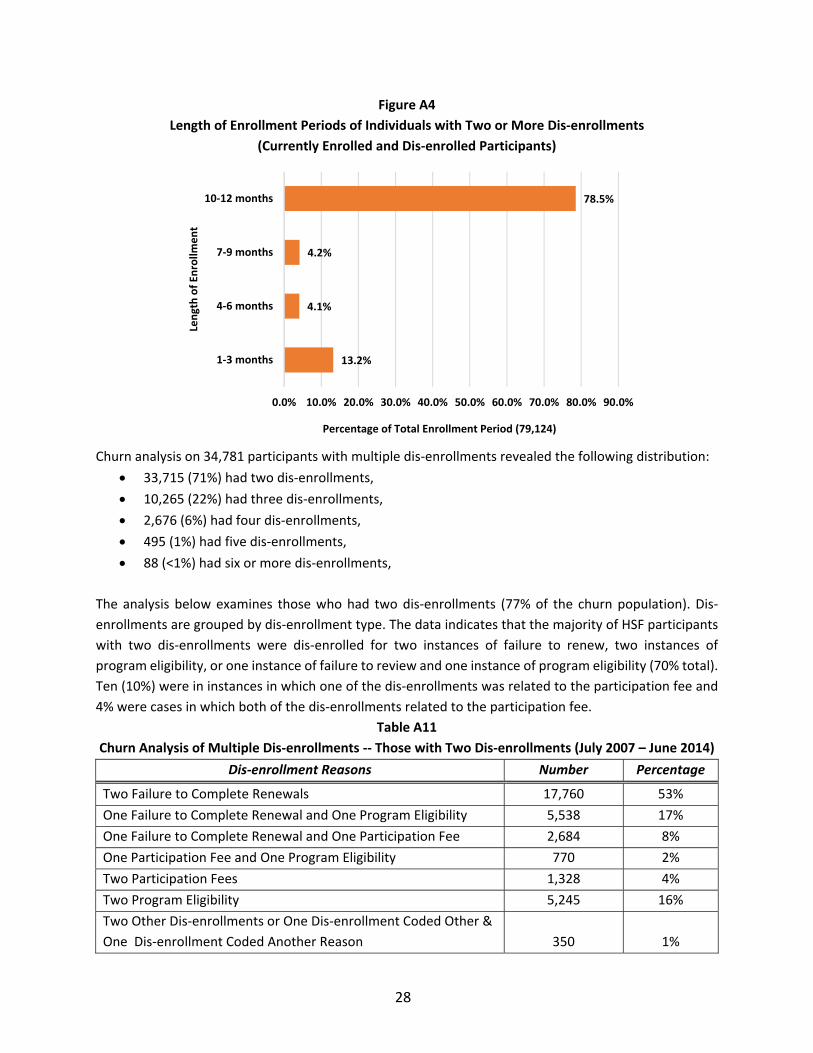
Figure A4
Length of Enrollment Periods of Individuals with Two or More Dis‐enrollments
(Currently Enrolled and Dis‐enrolled Participants)
Churn analysis on 34,781 participants with multiple dis‐enrollments revealed the following distribution:
33,715 (71%) had two dis‐enrollments,
10,265 (22%) had three dis‐enrollments,
2,676 (6%) had four dis‐enrollments,
495 (1%) had five dis‐enrollments,
88 (<1%) had six or more dis‐enrollments,
The analysis below examines those who had two dis‐enrollments (77% of the churn population). Dis‐
enrollments are grouped by dis‐enrollment type. The data indicates that the majority of HSF participants
with two dis‐enrollments were dis‐enrolled for two instances of failure to renew, two instances of
program eligibility, or one instance of failure to review and one instance of program eligibility (70% total).
Ten (10%) were in instances in which one of the dis‐enrollments was related to the participation fee and
4% were cases in which both of the dis‐enrollments related to the participation fee.
Table A11
Churn Analysis of Multiple Dis‐enrollments ‐‐ Those with Two Dis‐enrollments (July 2007 – June 2014)
Dis‐enrollment Reasons Number Percentage
Two Failure to Complete Renewals 17,760 53%
One Failure to Complete Renewal and One Program Eligibility 5,538 17%
One Failure to Complete Renewal and One Participation Fee 2,684 8%
One Participation Fee and One Program Eligibility 770 2%
Two Participation Fees 1,328 4%
Two Program Eligibility 5,245 16%
Two Other Dis‐enrollments or One Dis‐enrollment Coded Other &
One Dis‐enrollment Coded Another Reason 350 1%
13.2%
4.1%
4.2%
78.5%
0.0% 10.0% 20.0% 30.0% 40.0% 50.0% 60.0% 70.0% 80.0% 90.0%
1‐3 months
4‐6 months
7‐9 months
10‐12 months
Percentage of Total Enrollment Period (79,124)
Length of En
rollm
ent
29
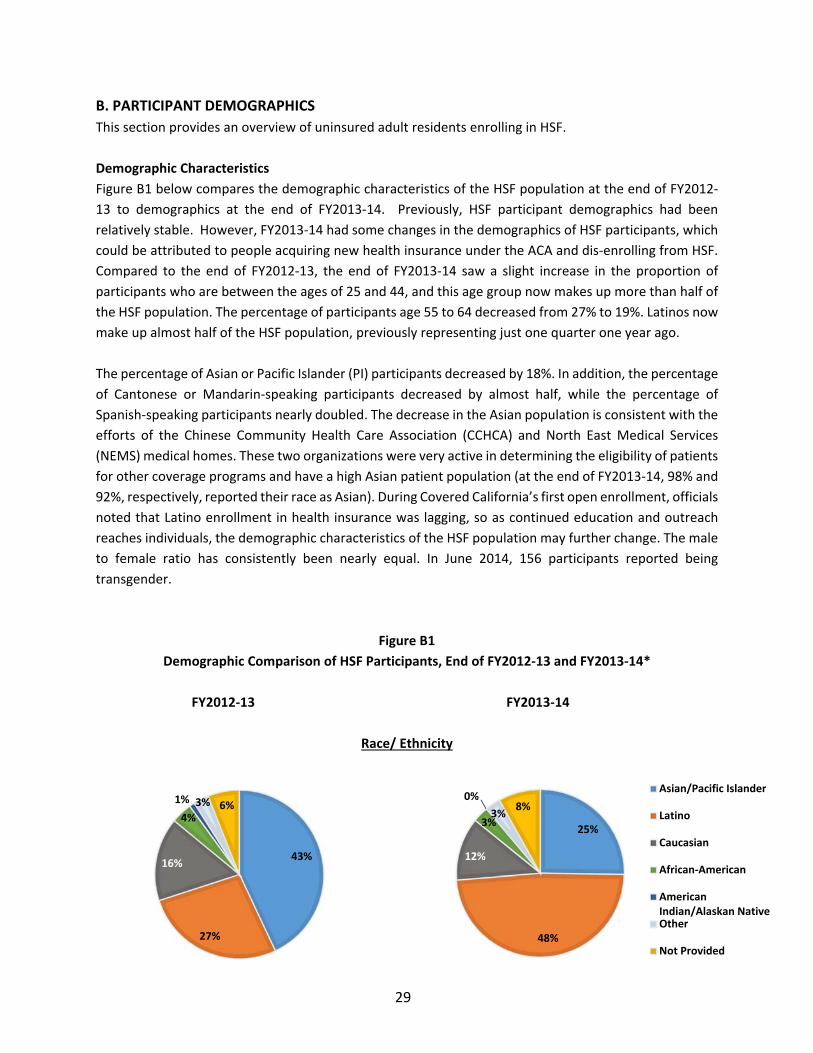
B. PARTICIPANT DEMOGRAPHICS
This section provides an overview of uninsured adult residents enrolling in HSF.
Demographic Characteristics
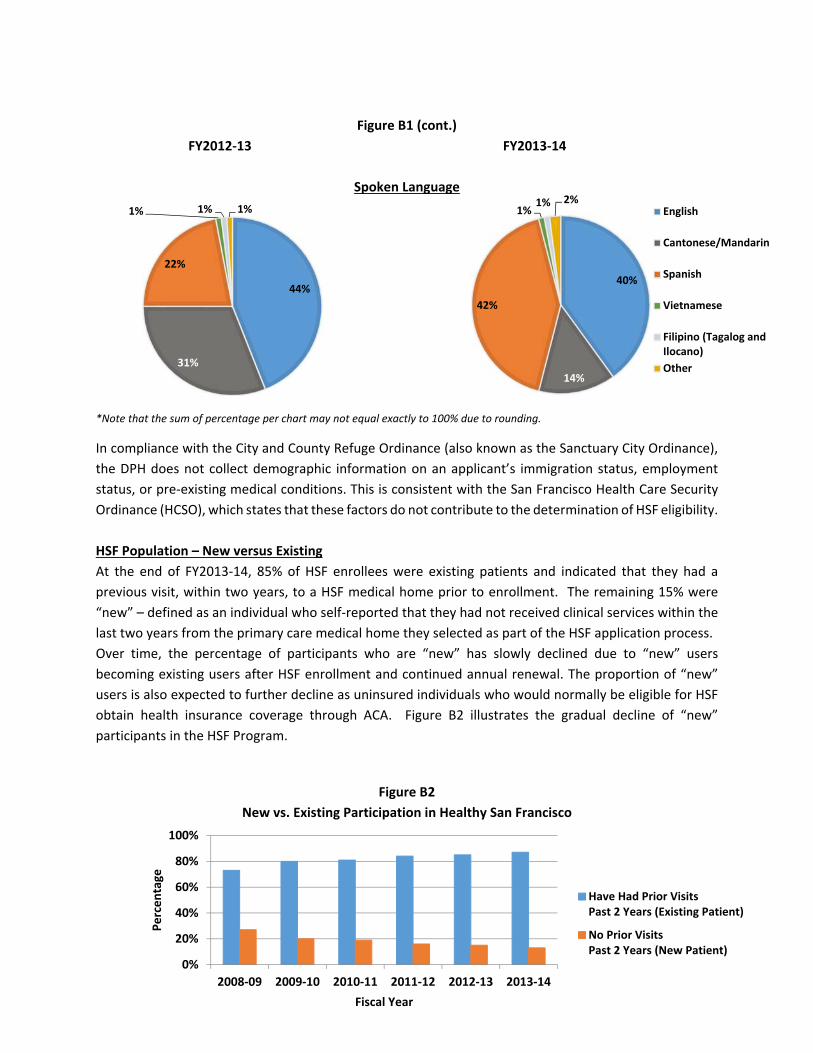
Figure B1 below compares the demographic characteristics of the HSF population at the end of FY2012‐
13 to demographics at the end of FY2013‐14. Previously, HSF participant demographics had been
relatively stable. However, FY2013‐14 had some changes in the demographics of HSF participants, which
could be attributed to people acquiring new health insurance under the ACA and dis‐enrolling from HSF.
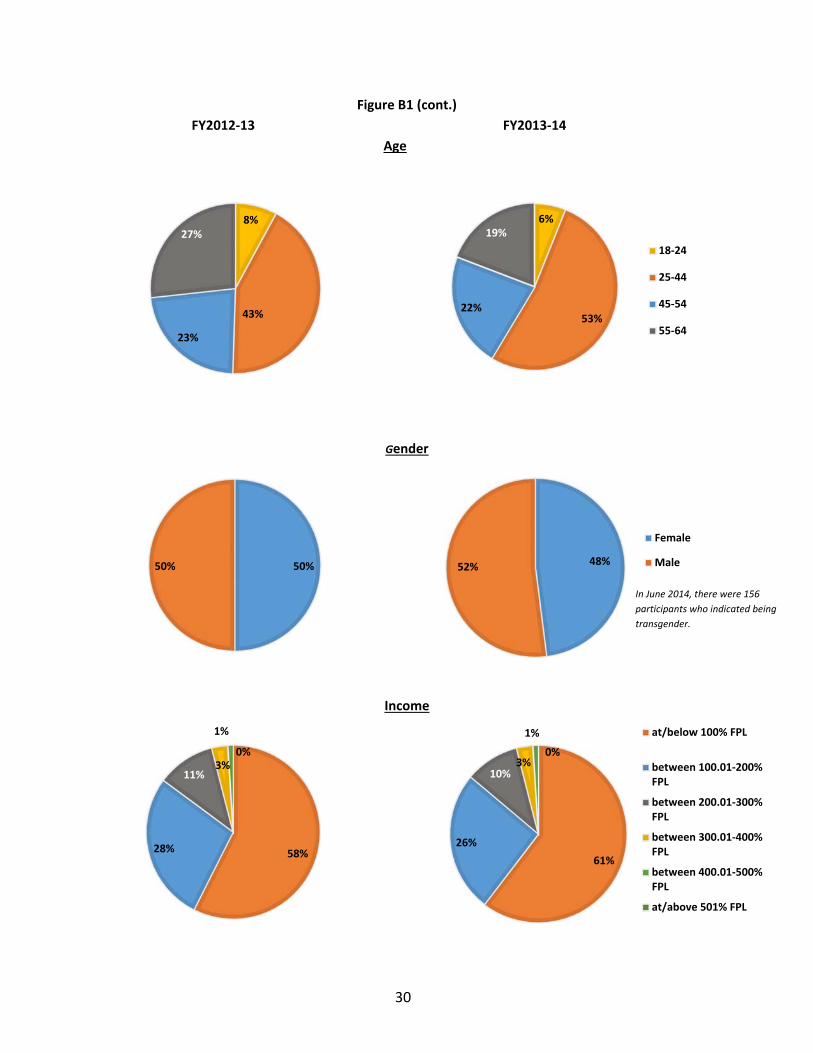
Compared to the end of FY2012‐13, the end of FY2013‐14 saw a slight increase in the proportion of
participants who are between the ages of 25 and 44, and this age group now makes up more than half of
the HSF population. The percentage of participants age 55 to 64 decreased from 27% to 19%. Latinos now
make up almost half of the HSF population, previously representing just one quarter one year ago.
The percentage of Asian or Pacific Islander (PI) participants decreased by 18%. In addition, the percentage
of Cantonese or Mandarin‐speaking participants decreased by almost half, while the percentage of
Spanish‐speaking participants nearly doubled. The decrease in the Asian population is consistent with the
efforts of the Chinese Community Health Care Association (CCHCA) and North East Medical Services
(NEMS) medical homes. These two organizations were very active in determining the eligibility of patients
for other coverage programs and have a high Asian patient population (at the end of FY2013‐14, 98% and
92%, respectively, reported their race as Asian). During Covered California’s first open enrollment, officials
noted that Latino enrollment in health insurance was lagging, so as continued education and outreach
reaches individuals, the demographic characteristics of the HSF population may further change. The male
to female ratio has consistently been nearly equal. In June 2014, 156 participants reported being
transgender.
Figure B1
Demographic Comparison of HSF Participants, End of FY2012‐13 and FY2013‐14*
FY2012‐13 FY2013‐14
Race/ Ethnicity
43%
27%
16%
4%
1% 3% 6%
25%
48%
12%
3%
0%
3%8%
Asian/Pacific Islander
Latino
Caucasian
African‐American
AmericanIndian/Alaskan NativeOther
Not Provided
30
50%50% 48%52%
Female
Male
58%28%
11%3%
1%
0%
61%
26%
10%3%
1%
0%
at/below 100% FPL
between 100.01‐200%FPL
between 200.01‐300%FPL
between 300.01‐400%FPL
between 400.01‐500%FPL
at/above 501% FPL
Figure B1 (cont.)
FY2012‐13 FY2013‐14
Age
Gender
Income
6%
53%22%
19%
18‐24
25‐44
45‐54
55‐64
In June 2014, there were 156
participants who indicated being
transgender.
8%
43%
23%
27%
31
0%
20%
40%
60%
80%
100%
2008‐09 2009‐10 2010‐11 2011‐12 2012‐13 2013‐14
Percentage
Fiscal Year
Have Had Prior VisitsPast 2 Years (Existing Patient)
No Prior VisitsPast 2 Years (New Patient)
44%
31%
22%
1% 1% 1%
40%
14%
42%
1%1% 2%
English
Cantonese/Mandarin
Spanish
Vietnamese
Filipino (Tagalog andIlocano)
Other
Figure B1 (cont.)
FY2012‐13 FY2013‐14
Spoken Language
*Note that the sum of percentage per chart may not equal exactly to 100% due to rounding.
In compliance with the City and County Refuge Ordinance (also known as the Sanctuary City Ordinance),
the DPH does not collect demographic information on an applicant’s immigration status, employment
status, or pre‐existing medical conditions. This is consistent with the San Francisco Health Care Security
Ordinance (HCSO), which states that these factors do not contribute to the determination of HSF eligibility.
HSF Population – New versus Existing
At the end of FY2013‐14, 85% of HSF enrollees were existing patients and indicated that they had a
previous visit, within two years, to a HSF medical home prior to enrollment. The remaining 15% were
“new” – defined as an individual who self‐reported that they had not received clinical services within the
last two years from the primary care medical home they selected as part of the HSF application process.
Over time, the percentage of participants who are “new” has slowly declined due to “new” users
becoming existing users after HSF enrollment and continued annual renewal. The proportion of “new”
users is also expected to further decline as uninsured individuals who would normally be eligible for HSF
obtain health insurance coverage through ACA. Figure B2 illustrates the gradual decline of “new”
participants in the HSF Program.
Figure B2
New vs. Existing Participation in Healthy San Francisco
32
0.0% 2.0% 4.0% 6.0% 8.0% 10.0% 12.0% 14.0% 16.0% 18.0%
Excelsior
Visitacion Valley
Tenderloin
South of Market
Haight
Outer Richmond
North Beach
Lake Merced
Chinatown
Castro‐Noe Valley
West Portal
Treasure Island
Mission Bay
Neighborhood
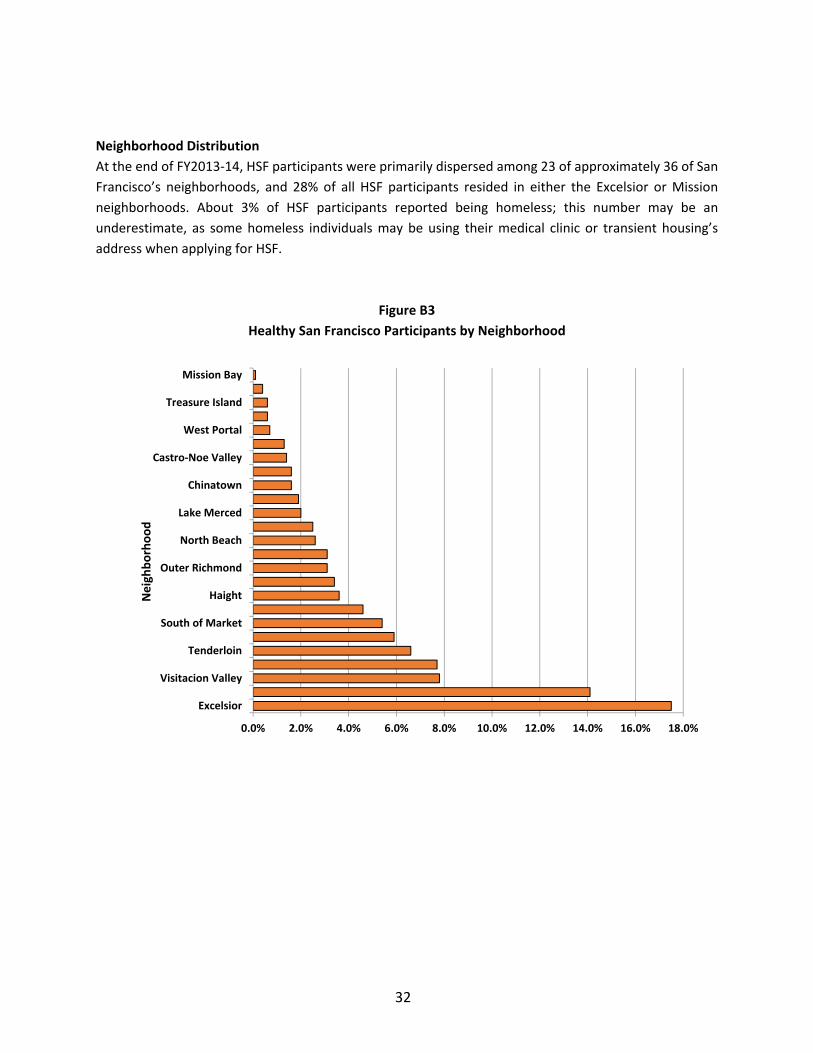
Neighborhood Distribution
At the end of FY2013‐14, HSF participants were primarily dispersed among 23 of approximately 36 of San
Francisco’s neighborhoods, and 28% of all HSF participants resided in either the Excelsior or Mission
neighborhoods. About 3% of HSF participants reported being homeless; this number may be an
underestimate, as some homeless individuals may be using their medical clinic or transient housing’s
address when applying for HSF.
Figure B3
Healthy San Francisco Participants by Neighborhood
33
C. PROVIDER NETWORK (DELIVERY SYSTEM)
This section describes HSF’s delivery system including medical homes, hospitals and behavioral health
services.
Medical Home Expansions and Capacity
HSF ended FY2013‐14 with 36 medical homes, one fewer than FY2012‐13. On July 9, 2013, Tom Waddell
Health Center and Housing & Urban Health Center merged to form the Tom Waddell Urban Health Clinic.
Tom Waddell Health Center’s old site became the Tom Waddell Urgent Care Center.
To ensure sufficient capacity to serve both new and existing HSF participants, HSF tracks each medical
home’s capacity twice a month, as “open” or “closed” status. HSF medical home capacity is determined
by factors including appointment availability and total number of patients (from all payer sources
including Medi‐Cal, Healthy Kids, Healthy Workers, sliding scale, and self‐pay) seen at each medical home.
As of July 1, 2014, 18 HSF medical homes were open to new and existing patients.
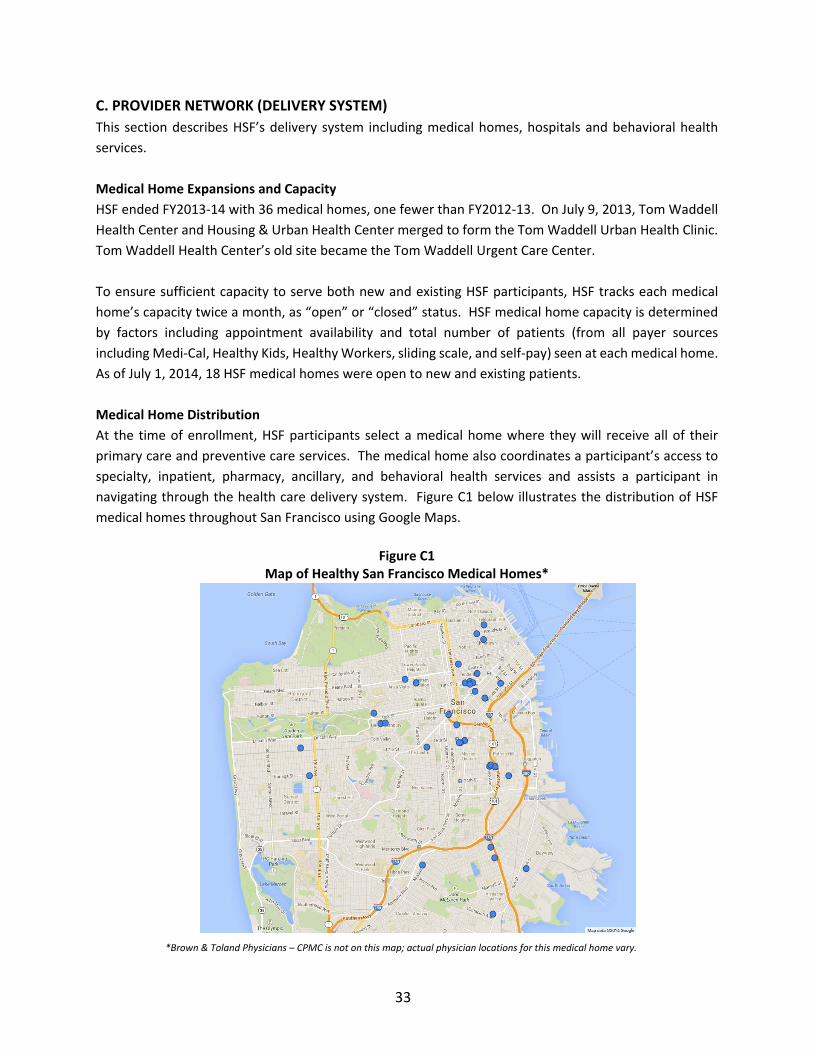
Medical Home Distribution
At the time of enrollment, HSF participants select a medical home where they will receive all of their
primary care and preventive care services. The medical home also coordinates a participant’s access to
specialty, inpatient, pharmacy, ancillary, and behavioral health services and assists a participant in
navigating through the health care delivery system. Figure C1 below illustrates the distribution of HSF
medical homes throughout San Francisco using Google Maps.
Figure C1
Map of Healthy San Francisco Medical Homes*
*Brown & Toland Physicians – CPMC is not on this map; actual physician locations for this medical home vary.
34
47%
41%
6%
2%1% 3% 0%
San FranciscoCommunity ClinicConsortium
San FranciscoDepartment of PublicHealth
Kaiser Permanente
Sr. Mary Philippa
Chinese CommunityHealth CareAssociation
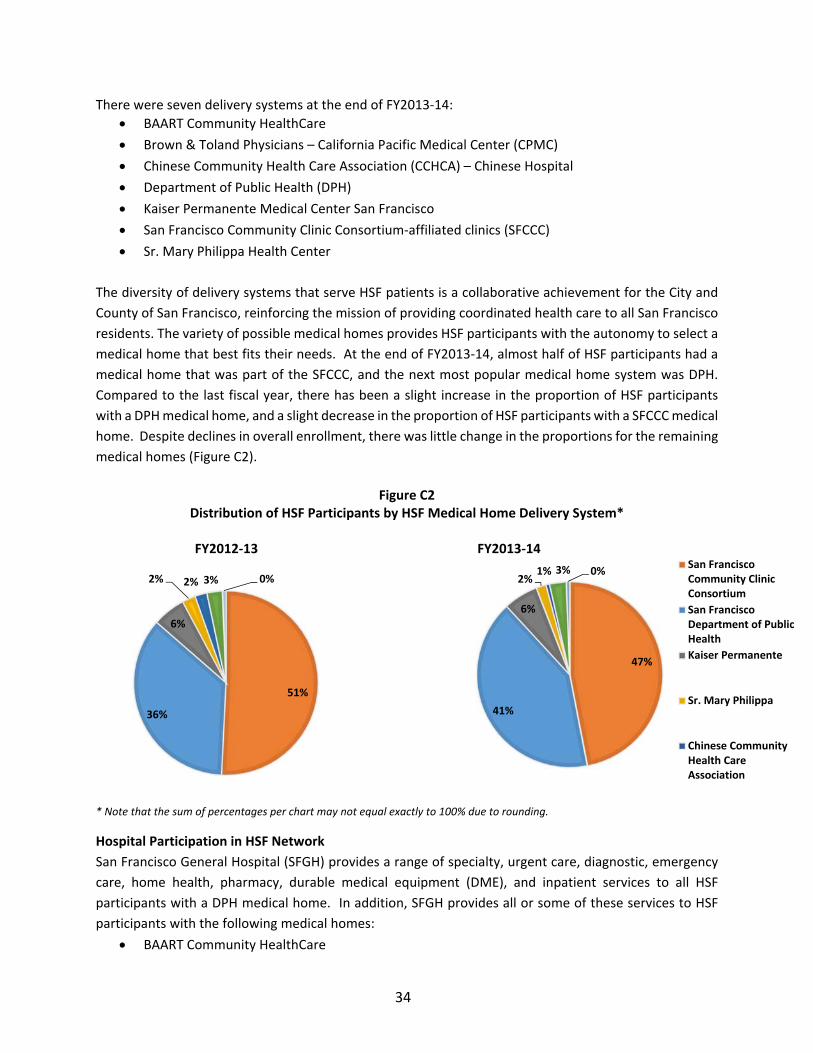
There were seven delivery systems at the end of FY2013‐14: BAART Community HealthCare
Brown & Toland Physicians – California Pacific Medical Center (CPMC)
Chinese Community Health Care Association (CCHCA) – Chinese Hospital
Department of Public Health (DPH)
Kaiser Permanente Medical Center San Francisco
San Francisco Community Clinic Consortium‐affiliated clinics (SFCCC)
Sr. Mary Philippa Health Center
The diversity of delivery systems that serve HSF patients is a collaborative achievement for the City and
County of San Francisco, reinforcing the mission of providing coordinated health care to all San Francisco
residents. The variety of possible medical homes provides HSF participants with the autonomy to select a
medical home that best fits their needs. At the end of FY2013‐14, almost half of HSF participants had a
medical home that was part of the SFCCC, and the next most popular medical home system was DPH.
Compared to the last fiscal year, there has been a slight increase in the proportion of HSF participants
with a DPH medical home, and a slight decrease in the proportion of HSF participants with a SFCCC medical
home. Despite declines in overall enrollment, there was little change in the proportions for the remaining
medical homes (Figure C2).
Figure C2
Distribution of HSF Participants by HSF Medical Home Delivery System*
FY2012‐13 FY2013‐14 * Note that the sum of percentages per chart may not equal exactly to 100% due to rounding.
Hospital Participation in HSF Network
San Francisco General Hospital (SFGH) provides a range of specialty, urgent care, diagnostic, emergency
care, home health, pharmacy, durable medical equipment (DME), and inpatient services to all HSF
participants with a DPH medical home. In addition, SFGH provides all or some of these services to HSF
participants with the following medical homes:
BAART Community HealthCare
51%
36%
6%
2% 2% 3% 0%
35
Brown & Toland Physicians (home health; after hours urgent care)
Glide Health Services (SFCCC‐affiliated)
Kaiser Permanente (home health only)
North East Medical Services (NEMS) (SFCCC‐affiliated)
Remaining SFCCC‐affiliated clinics
In addition to SFGH, the following non‐profit hospitals continue to play a vital role in HSF:
CPMC (four campuses) – inpatient services to those with NEMS as their HSF medical home and
inpatient and hospital‐based outpatient services to those with Brown & Toland Physicians as their
HSF medical home
Chinese Hospital – partners with CCHCA to provide the full scope of primary care, specialty and
inpatient services to those with CCHCA as their HSF medical home
Saint Francis Memorial Hospital (Dignity Health) –specialty services to those with Glide Health as
the HSF medical home
St. Mary’s Medical Center (Dignity Health) – inpatient and other specialty services to those with
Sr. Mary Philippa as the HSF medical home
UCSF Medical Center – referral‐based diagnostic imaging services at Mission Bay site as well as
services such as cardiac surgery which are not provided at SFGH
Hospital participation in HSF is separate from the general Emergency Medical Treatment & Labor Act
(EMTALA) obligations to which all hospitals (public, non‐profit or for‐profit) must adhere. In the case of
emergency services, HSF participants will receive services at the nearest available hospital with clinical
capacity, which may or may not be the hospital associated with their medical home.
Behavioral Health Services
While most of the HSF medical homes provide some form of either mental health assessment, mental
health services or substance abuse screening, DPH’s Community Behavioral Health Services (CBHS)
provides all contracted behavioral health services for HSF participants at all medical homes, especially
mental health and alcohol and drug abuse care. HSF participants have access to the comprehensive array
of community‐based services offered by DPH’s CBHS including, but not limited to:
Information and referral services
Prevention services
A full range of voluntary behavioral health services, including self‐help, peer support, outpatient,
case management, medication support, dual diagnosis treatment, and substance abuse services
24‐hour psychiatric emergency services and a crisis hotline
HSF participants have access to these confidential services from either their HSF medical home or health
care professionals at CBHS.
If an HSF participant needs access to behavioral health services that are not provided at their HSF medical
home, then a primary care provider can refer the participant to CBHS for care. However, HSF participants

36
do not need a referral from their HSF medical home provider to access services from CBHS – they can call
CBHS directly and self‐refer.
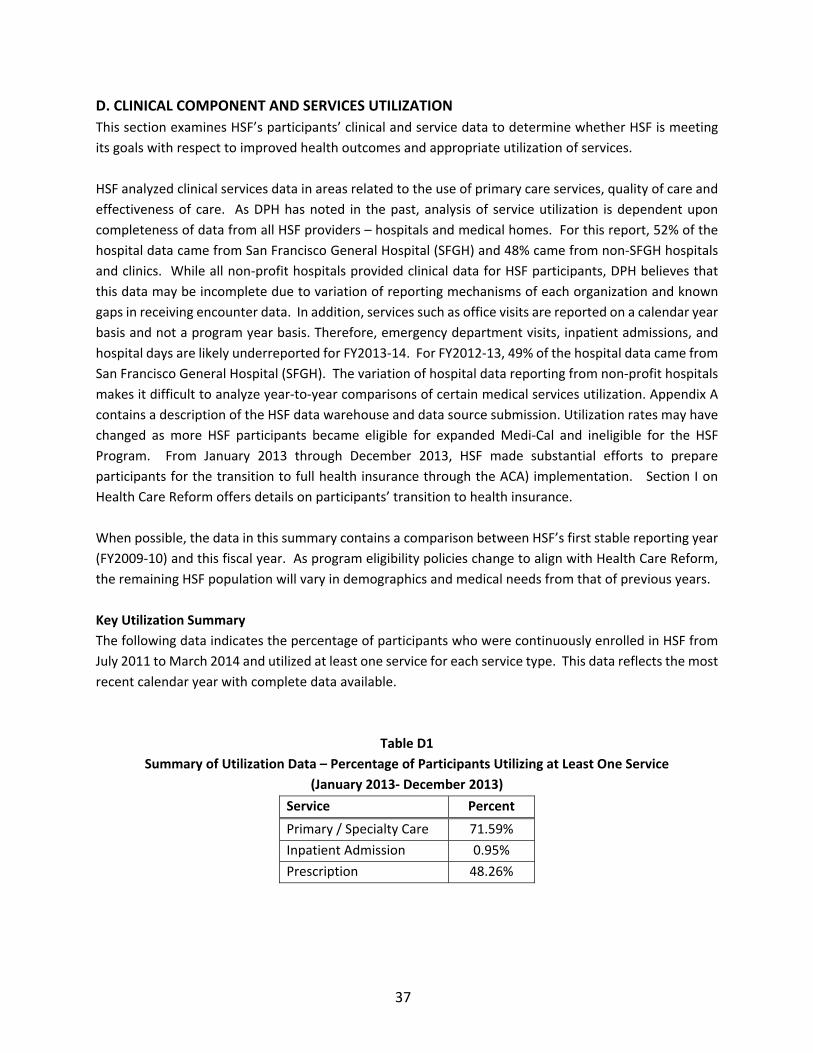
37
D. CLINICAL COMPONENT AND SERVICES UTILIZATION
This section examines HSF’s participants’ clinical and service data to determine whether HSF is meeting
its goals with respect to improved health outcomes and appropriate utilization of services.
HSF analyzed clinical services data in areas related to the use of primary care services, quality of care and
effectiveness of care. As DPH has noted in the past, analysis of service utilization is dependent upon
completeness of data from all HSF providers – hospitals and medical homes. For this report, 52% of the
hospital data came from San Francisco General Hospital (SFGH) and 48% came from non‐SFGH hospitals
and clinics. While all non‐profit hospitals provided clinical data for HSF participants, DPH believes that
this data may be incomplete due to variation of reporting mechanisms of each organization and known
gaps in receiving encounter data. In addition, services such as office visits are reported on a calendar year
basis and not a program year basis. Therefore, emergency department visits, inpatient admissions, and
hospital days are likely underreported for FY2013‐14. For FY2012‐13, 49% of the hospital data came from
San Francisco General Hospital (SFGH). The variation of hospital data reporting from non‐profit hospitals
makes it difficult to analyze year‐to‐year comparisons of certain medical services utilization. Appendix A
contains a description of the HSF data warehouse and data source submission. Utilization rates may have
changed as more HSF participants became eligible for expanded Medi‐Cal and ineligible for the HSF
Program. From January 2013 through December 2013, HSF made substantial efforts to prepare
participants for the transition to full health insurance through the ACA) implementation. Section I on
Health Care Reform offers details on participants’ transition to health insurance.
When possible, the data in this summary contains a comparison between HSF’s first stable reporting year
(FY2009‐10) and this fiscal year. As program eligibility policies change to align with Health Care Reform,
the remaining HSF population will vary in demographics and medical needs from that of previous years.
Key Utilization Summary
The following data indicates the percentage of participants who were continuously enrolled in HSF from
July 2011 to March 2014 and utilized at least one service for each service type. This data reflects the most
recent calendar year with complete data available.
Table D1
Summary of Utilization Data – Percentage of Participants Utilizing at Least One Service
(January 2013‐ December 2013)
Service Percent
Primary / Specialty Care 71.59%
Inpatient Admission 0.95%
Prescription 48.26%
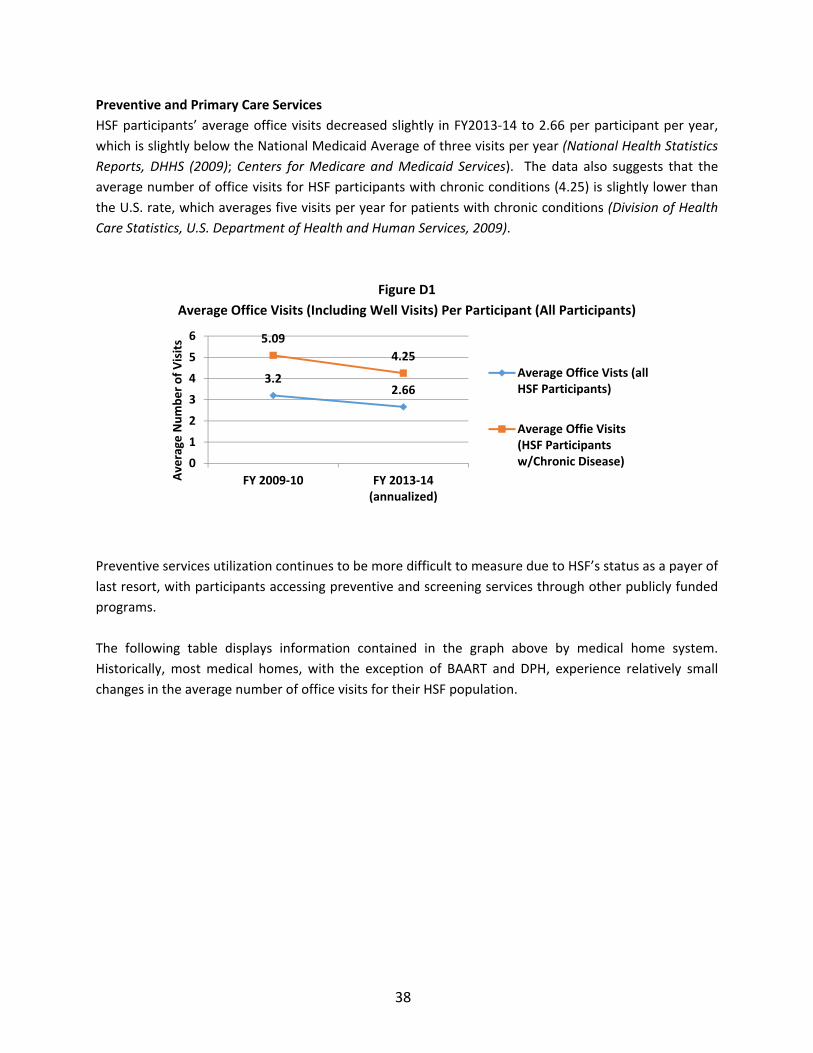
38
Preventive and Primary Care Services
HSF participants’ average office visits decreased slightly in FY2013‐14 to 2.66 per participant per year,
which is slightly below the National Medicaid Average of three visits per year (National Health Statistics
Reports, DHHS (2009); Centers for Medicare and Medicaid Services). The data also suggests that the
average number of office visits for HSF participants with chronic conditions (4.25) is slightly lower than
the U.S. rate, which averages five visits per year for patients with chronic conditions (Division of Health
Care Statistics, U.S. Department of Health and Human Services, 2009).
Figure D1
Average Office Visits (Including Well Visits) Per Participant (All Participants)
Preventive services utilization continues to be more difficult to measure due to HSF’s status as a payer of
last resort, with participants accessing preventive and screening services through other publicly funded
programs.
The following table displays information contained in the graph above by medical home system.
Historically, most medical homes, with the exception of BAART and DPH, experience relatively small
changes in the average number of office visits for their HSF population.
3.22.66
5.09
4.25
0
1
2
3
4
5
6
FY 2009‐10 FY 2013‐14(annualized)
Average
Number of Visits
Average Office Vists (allHSF Participants)
Average Offie Visits(HSF Participantsw/Chronic Disease)
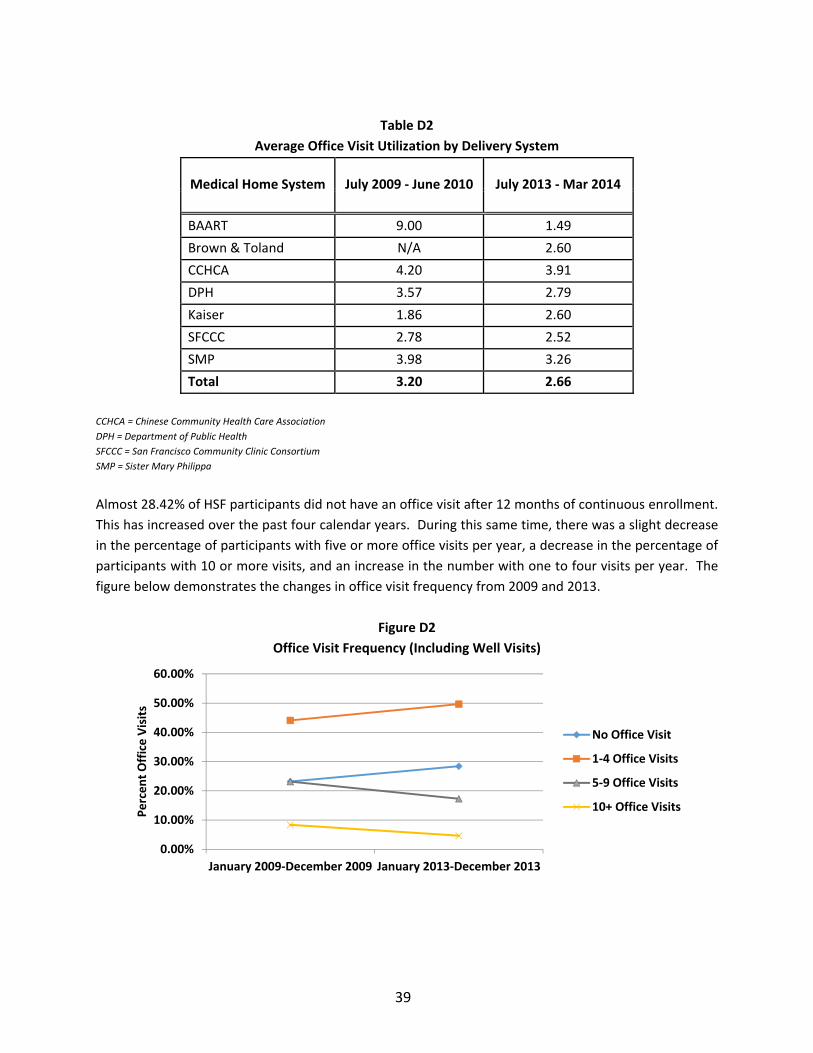
39
Table D2
Average Office Visit Utilization by Delivery System
Medical Home System July 2009 ‐ June 2010 July 2013 ‐ Mar 2014
BAART 9.00 1.49
Brown & Toland N/A 2.60
CCHCA 4.20 3.91
DPH 3.57 2.79
Kaiser 1.86 2.60
SFCCC 2.78 2.52
SMP 3.98 3.26
Total 3.20 2.66
CCHCA = Chinese Community Health Care Association
DPH = Department of Public Health
SFCCC = San Francisco Community Clinic Consortium
SMP = Sister Mary Philippa
Almost 28.42% of HSF participants did not have an office visit after 12 months of continuous enrollment.
This has increased over the past four calendar years. During this same time, there was a slight decrease
in the percentage of participants with five or more office visits per year, a decrease in the percentage of
participants with 10 or more visits, and an increase in the number with one to four visits per year. The
figure below demonstrates the changes in office visit frequency from 2009 and 2013.
Figure D2
Office Visit Frequency (Including Well Visits)
0.00%
10.00%
20.00%
30.00%
40.00%
50.00%
60.00%
January 2009‐December 2009 January 2013‐December 2013
Percent Office Visits
No Office Visit
1‐4 Office Visits
5‐9 Office Visits
10+ Office Visits
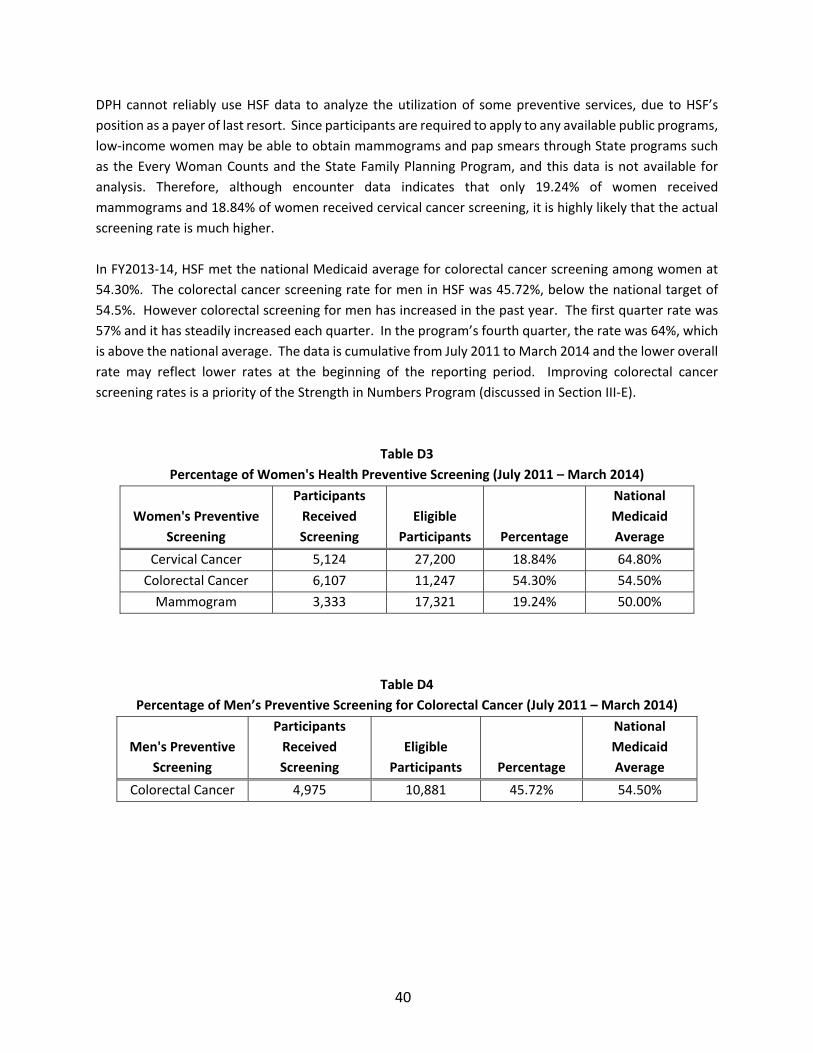
40
DPH cannot reliably use HSF data to analyze the utilization of some preventive services, due to HSF’s
position as a payer of last resort. Since participants are required to apply to any available public programs,
low‐income women may be able to obtain mammograms and pap smears through State programs such
as the Every Woman Counts and the State Family Planning Program, and this data is not available for
analysis. Therefore, although encounter data indicates that only 19.24% of women received
mammograms and 18.84% of women received cervical cancer screening, it is highly likely that the actual
screening rate is much higher.
In FY2013‐14, HSF met the national Medicaid average for colorectal cancer screening among women at
54.30%. The colorectal cancer screening rate for men in HSF was 45.72%, below the national target of
54.5%. However colorectal screening for men has increased in the past year. The first quarter rate was
57% and it has steadily increased each quarter. In the program’s fourth quarter, the rate was 64%, which
is above the national average. The data is cumulative from July 2011 to March 2014 and the lower overall
rate may reflect lower rates at the beginning of the reporting period. Improving colorectal cancer
screening rates is a priority of the Strength in Numbers Program (discussed in Section III‐E).
Table D3
Percentage of Women's Health Preventive Screening (July 2011 – March 2014)
Women's Preventive
Screening
Participants
Received
Screening
Eligible
Participants Percentage
National
Medicaid
Average
Cervical Cancer 5,124 27,200 18.84% 64.80%
Colorectal Cancer 6,107 11,247 54.30% 54.50%
Mammogram 3,333 17,321 19.24% 50.00%
Table D4
Percentage of Men’s Preventive Screening for Colorectal Cancer (July 2011 – March 2014)
Men's Preventive
Screening
Participants
Received
Screening
Eligible
Participants Percentage
National
Medicaid
Average
Colorectal Cancer 4,975 10,881 45.72% 54.50%
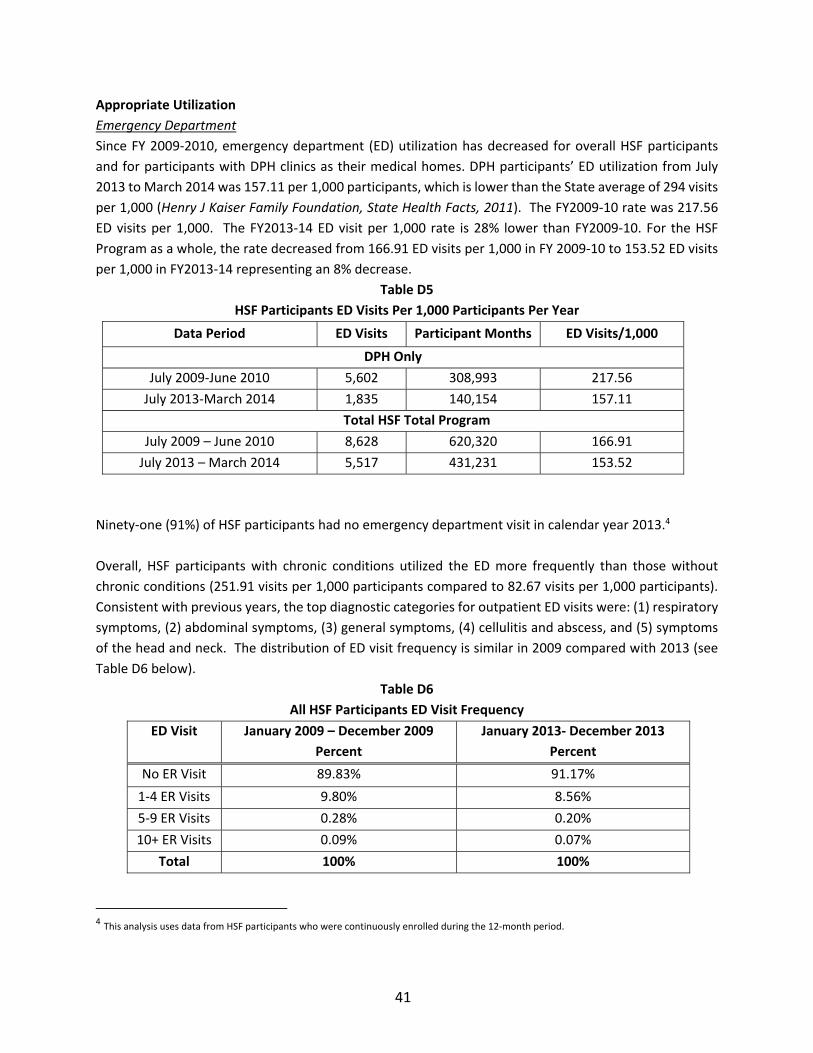
41
Appropriate Utilization
Emergency Department
Since FY 2009‐2010, emergency department (ED) utilization has decreased for overall HSF participants
and for participants with DPH clinics as their medical homes. DPH participants’ ED utilization from July
2013 to March 2014 was 157.11 per 1,000 participants, which is lower than the State average of 294 visits
per 1,000 (Henry J Kaiser Family Foundation, State Health Facts, 2011). The FY2009‐10 rate was 217.56
ED visits per 1,000. The FY2013‐14 ED visit per 1,000 rate is 28% lower than FY2009‐10. For the HSF
Program as a whole, the rate decreased from 166.91 ED visits per 1,000 in FY 2009‐10 to 153.52 ED visits
per 1,000 in FY2013‐14 representing an 8% decrease.
Table D5
HSF Participants ED Visits Per 1,000 Participants Per Year
Data Period ED Visits Participant Months ED Visits/1,000
DPH Only
July 2009‐June 2010 5,602 308,993 217.56
July 2013‐March 2014 1,835 140,154 157.11
Total HSF Total Program
July 2009 – June 2010 8,628 620,320 166.91
July 2013 – March 2014 5,517 431,231 153.52
Ninety‐one (91%) of HSF participants had no emergency department visit in calendar year 2013.4
Overall, HSF participants with chronic conditions utilized the ED more frequently than those without
chronic conditions (251.91 visits per 1,000 participants compared to 82.67 visits per 1,000 participants).
Consistent with previous years, the top diagnostic categories for outpatient ED visits were: (1) respiratory
symptoms, (2) abdominal symptoms, (3) general symptoms, (4) cellulitis and abscess, and (5) symptoms
of the head and neck. The distribution of ED visit frequency is similar in 2009 compared with 2013 (see
Table D6 below).
Table D6
All HSF Participants ED Visit Frequency
ED Visit January 2009 – December 2009
Percent
January 2013‐ December 2013
Percent
No ER Visit 89.83% 91.17%
1‐4 ER Visits 9.80% 8.56%
5‐9 ER Visits 0.28% 0.20%
10+ ER Visits 0.09% 0.07%
Total 100% 100%
4 This analysis uses data from HSF participants who were continuously enrolled during the 12‐month period.
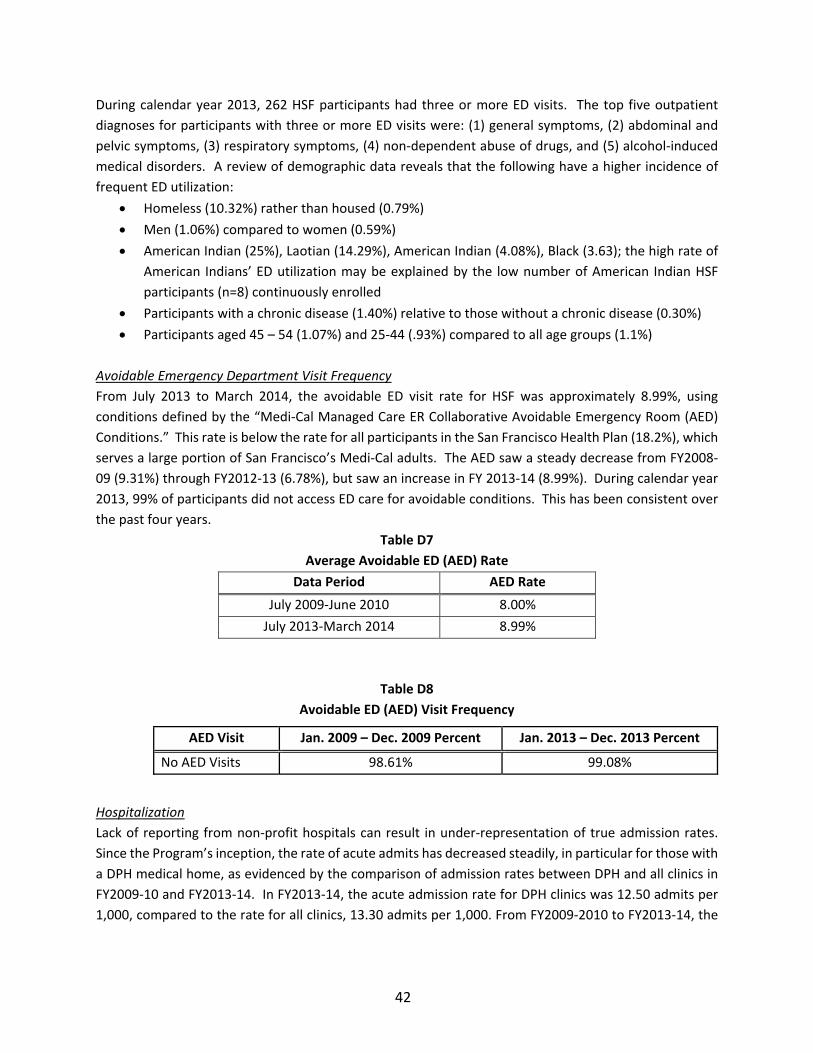
42
During calendar year 2013, 262 HSF participants had three or more ED visits. The top five outpatient
diagnoses for participants with three or more ED visits were: (1) general symptoms, (2) abdominal and
pelvic symptoms, (3) respiratory symptoms, (4) non‐dependent abuse of drugs, and (5) alcohol‐induced
medical disorders. A review of demographic data reveals that the following have a higher incidence of
frequent ED utilization:
Homeless (10.32%) rather than housed (0.79%)
Men (1.06%) compared to women (0.59%)
American Indian (25%), Laotian (14.29%), American Indian (4.08%), Black (3.63); the high rate of
American Indians’ ED utilization may be explained by the low number of American Indian HSF
participants (n=8) continuously enrolled
Participants with a chronic disease (1.40%) relative to those without a chronic disease (0.30%)
Participants aged 45 – 54 (1.07%) and 25‐44 (.93%) compared to all age groups (1.1%)
Avoidable Emergency Department Visit Frequency
From July 2013 to March 2014, the avoidable ED visit rate for HSF was approximately 8.99%, using
conditions defined by the “Medi‐Cal Managed Care ER Collaborative Avoidable Emergency Room (AED)
Conditions.” This rate is below the rate for all participants in the San Francisco Health Plan (18.2%), which
serves a large portion of San Francisco’s Medi‐Cal adults. The AED saw a steady decrease from FY2008‐
09 (9.31%) through FY2012‐13 (6.78%), but saw an increase in FY 2013‐14 (8.99%). During calendar year
2013, 99% of participants did not access ED care for avoidable conditions. This has been consistent over
the past four years.
Table D7
Average Avoidable ED (AED) Rate
Data Period AED Rate
July 2009‐June 2010 8.00%
July 2013‐March 2014 8.99%
Table D8
Avoidable ED (AED) Visit Frequency
Hospitalization
Lack of reporting from non‐profit hospitals can result in under‐representation of true admission rates.
Since the Program’s inception, the rate of acute admits has decreased steadily, in particular for those with
a DPH medical home, as evidenced by the comparison of admission rates between DPH and all clinics in
FY2009‐10 and FY2013‐14. In FY2013‐14, the acute admission rate for DPH clinics was 12.50 admits per
1,000, compared to the rate for all clinics, 13.30 admits per 1,000. From FY2009‐2010 to FY2013‐14, the
AED Visit Jan. 2009 – Dec. 2009 Percent Jan. 2013 – Dec. 2013 Percent
No AED Visits 98.61% 99.08%
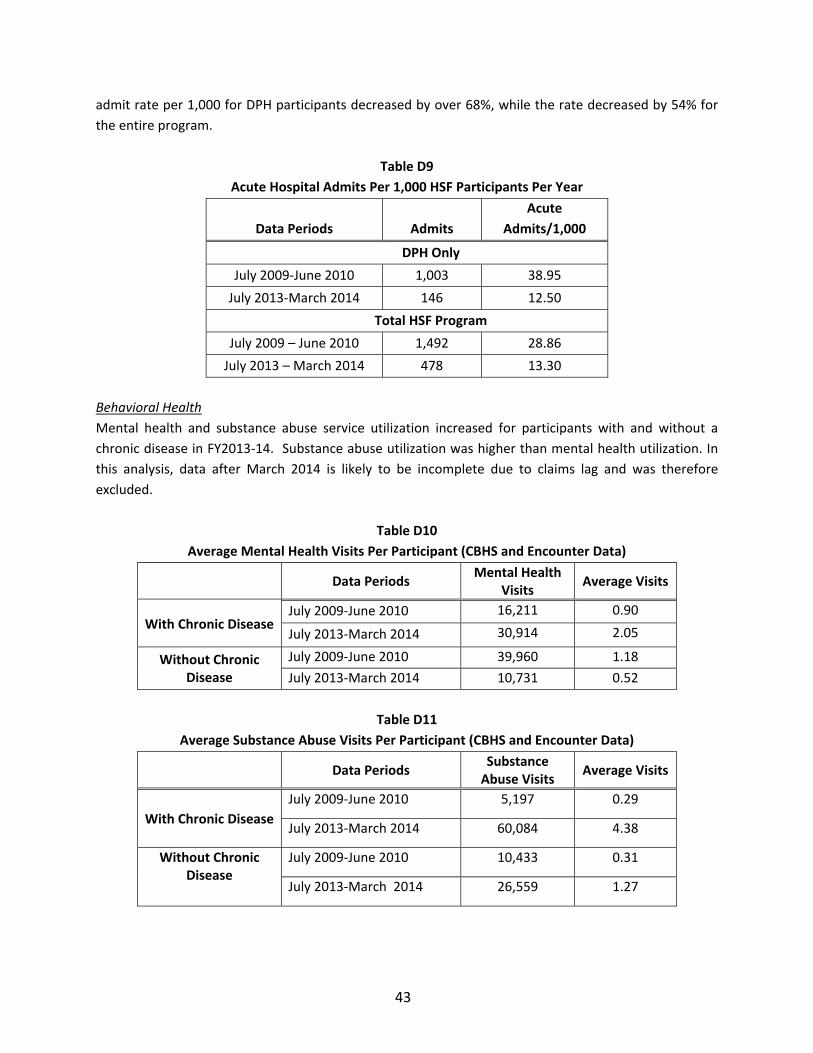
43
admit rate per 1,000 for DPH participants decreased by over 68%, while the rate decreased by 54% for
the entire program.
Table D9
Acute Hospital Admits Per 1,000 HSF Participants Per Year
Data Periods Admits
Acute
Admits/1,000
DPH Only
July 2009‐June 2010 1,003 38.95
July 2013‐March 2014 146 12.50
Total HSF Program
July 2009 – June 2010 1,492 28.86
July 2013 – March 2014 478 13.30
Behavioral Health
Mental health and substance abuse service utilization increased for participants with and without a
chronic disease in FY2013‐14. Substance abuse utilization was higher than mental health utilization. In
this analysis, data after March 2014 is likely to be incomplete due to claims lag and was therefore
excluded.
Table D10
Average Mental Health Visits Per Participant (CBHS and Encounter Data)
Data Periods
Mental Health Visits
Average Visits
With Chronic Disease July 2009‐June 2010 16,211 0.90
July 2013‐March 2014 30,914 2.05
Without Chronic Disease
July 2009‐June 2010 39,960 1.18
July 2013‐March 2014 10,731 0.52
Table D11
Average Substance Abuse Visits Per Participant (CBHS and Encounter Data)
Data Periods
Substance Abuse Visits
Average Visits
With Chronic Disease
July 2009‐June 2010 5,197 0.29
July 2013‐March 2014 60,084 4.38
Without Chronic Disease
July 2009‐June 2010 10,433 0.31
July 2013‐March 2014 26,559 1.27
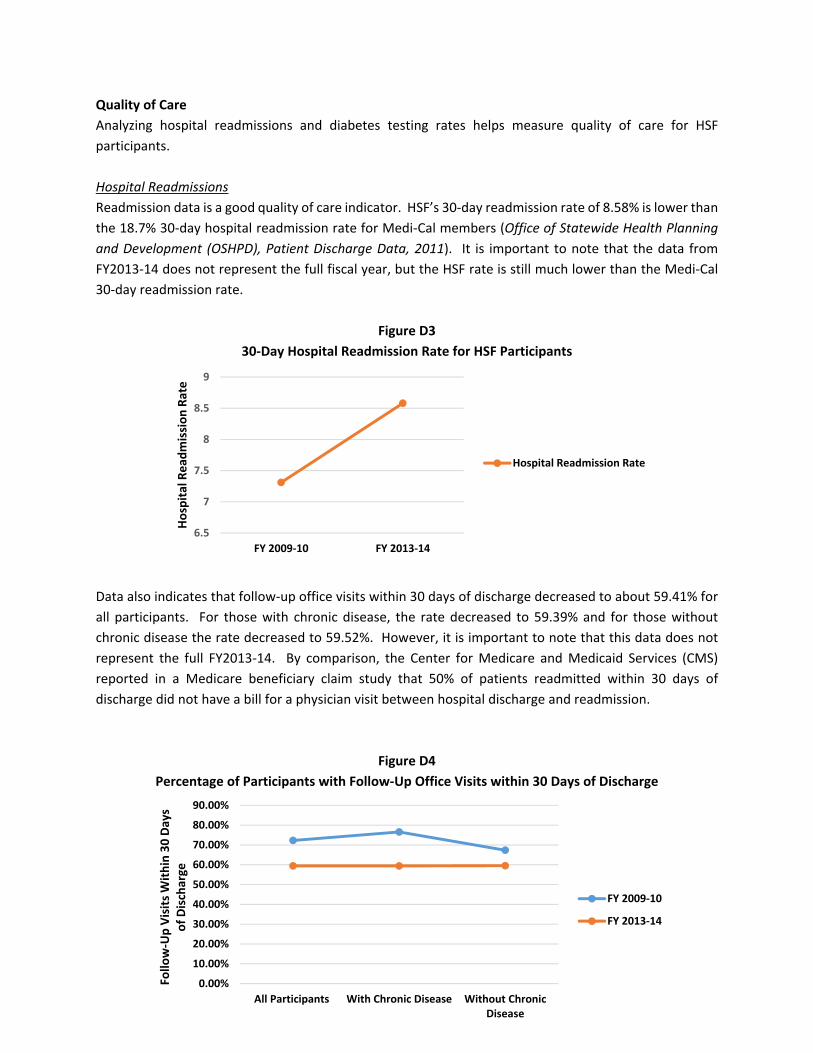
440.00%
10.00%
20.00%
30.00%
40.00%
50.00%
60.00%
70.00%
80.00%
90.00%
All Participants With Chronic Disease Without ChronicDisease
Follo
w‐Up Visits Within 30 Days
of Discharge
FY 2009‐10
FY 2013‐14
Quality of Care
Analyzing hospital readmissions and diabetes testing rates helps measure quality of care for HSF
participants.
Hospital Readmissions
Readmission data is a good quality of care indicator. HSF’s 30‐day readmission rate of 8.58% is lower than
the 18.7% 30‐day hospital readmission rate for Medi‐Cal members (Office of Statewide Health Planning
and Development (OSHPD), Patient Discharge Data, 2011). It is important to note that the data from
FY2013‐14 does not represent the full fiscal year, but the HSF rate is still much lower than the Medi‐Cal
30‐day readmission rate.
Figure D3
30‐Day Hospital Readmission Rate for HSF Participants
Data also indicates that follow‐up office visits within 30 days of discharge decreased to about 59.41% for
all participants. For those with chronic disease, the rate decreased to 59.39% and for those without
chronic disease the rate decreased to 59.52%. However, it is important to note that this data does not
represent the full FY2013‐14. By comparison, the Center for Medicare and Medicaid Services (CMS)
reported in a Medicare beneficiary claim study that 50% of patients readmitted within 30 days of
discharge did not have a bill for a physician visit between hospital discharge and readmission.
Figure D4
Percentage of Participants with Follow‐Up Office Visits within 30 Days of Discharge
6.5
7
7.5
8
8.5
9
FY 2009‐10 FY 2013‐14
Hospital Read
mission Rate
Hospital Readmission Rate
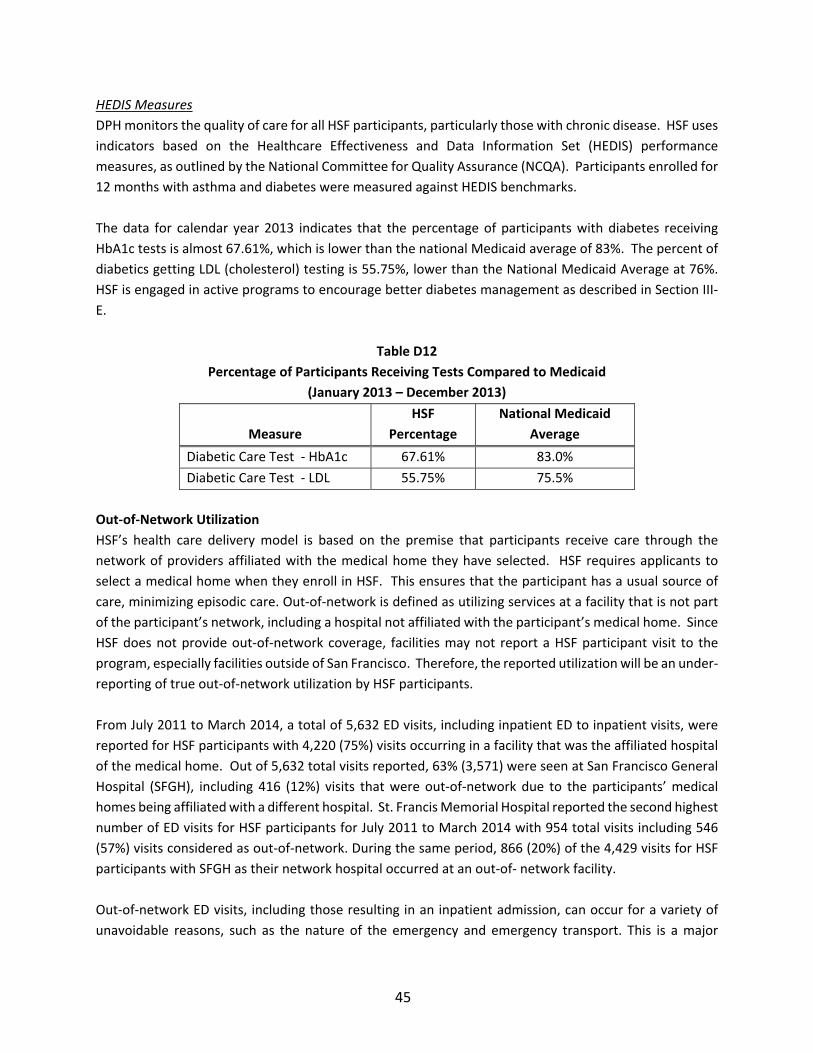
45
HEDIS Measures
DPH monitors the quality of care for all HSF participants, particularly those with chronic disease. HSF uses
indicators based on the Healthcare Effectiveness and Data Information Set (HEDIS) performance
measures, as outlined by the National Committee for Quality Assurance (NCQA). Participants enrolled for
12 months with asthma and diabetes were measured against HEDIS benchmarks.
The data for calendar year 2013 indicates that the percentage of participants with diabetes receiving
HbA1c tests is almost 67.61%, which is lower than the national Medicaid average of 83%. The percent of
diabetics getting LDL (cholesterol) testing is 55.75%, lower than the National Medicaid Average at 76%.
HSF is engaged in active programs to encourage better diabetes management as described in Section III‐
E.
Table D12
Percentage of Participants Receiving Tests Compared to Medicaid
(January 2013 – December 2013)
Measure
HSF
Percentage
National Medicaid
Average
Diabetic Care Test ‐ HbA1c 67.61% 83.0%
Diabetic Care Test ‐ LDL 55.75% 75.5%
Out‐of‐Network Utilization
HSF’s health care delivery model is based on the premise that participants receive care through the
network of providers affiliated with the medical home they have selected. HSF requires applicants to
select a medical home when they enroll in HSF. This ensures that the participant has a usual source of
care, minimizing episodic care. Out‐of‐network is defined as utilizing services at a facility that is not part
of the participant’s network, including a hospital not affiliated with the participant’s medical home. Since
HSF does not provide out‐of‐network coverage, facilities may not report a HSF participant visit to the
program, especially facilities outside of San Francisco. Therefore, the reported utilization will be an under‐
reporting of true out‐of‐network utilization by HSF participants.
From July 2011 to March 2014, a total of 5,632 ED visits, including inpatient ED to inpatient visits, were
reported for HSF participants with 4,220 (75%) visits occurring in a facility that was the affiliated hospital
of the medical home. Out of 5,632 total visits reported, 63% (3,571) were seen at San Francisco General
Hospital (SFGH), including 416 (12%) visits that were out‐of‐network due to the participants’ medical
homes being affiliated with a different hospital. St. Francis Memorial Hospital reported the second highest
number of ED visits for HSF participants for July 2011 to March 2014 with 954 total visits including 546
(57%) visits considered as out‐of‐network. During the same period, 866 (20%) of the 4,429 visits for HSF
participants with SFGH as their network hospital occurred at an out‐of‐ network facility.
Out‐of‐network ED visits, including those resulting in an inpatient admission, can occur for a variety of
unavoidable reasons, such as the nature of the emergency and emergency transport. This is a major

46
program limitation; 25% of visits from July 2011 to March 2014 were not covered under HSF. These
participants would have had to apply for charity care and other programs for assistance to cover the cost
of those visits.
Health Care Utilization among Participants with Multiple Enrollments and Dis‐enrollments
This analysis examines the health care utilization of HSF participants with multiple enrollments and dis‐
enrollments to determine whether an individual received a service during a given enrollment period (i.e.,
the period of time between an enrollment and dis‐enrollment). By virtue of churning through the
program, all of these individuals will have more than one enrollment period.
This analysis calculated length of enrollment in months; this is important to determine whether
participants were enrolled in the program for a sufficient period of time to receive a service. An
enrollment period will range in length of days.5 As indicated in Section III‐A of this report, 33,715
individuals have had at least two HSF dis‐enrollments and collectively had 111,946 enrollment periods
(i.e., the period of time between an enrollment and dis‐enrollment). Of the 111,946 enrollment periods,
79% had enrollment periods lasting 10 to 12 months.
An examination of utilization data for 33,715 individuals suggests that these participants use health care
services soon after enrolling or that health care needs may factor into their decision to enroll in HSF. The
analysis determined that there were 67,290 patients in the enrollment periods. The number of patients
(67,290) is greater than the number of unique individuals (33,715) because a participant can be a patient
(i.e., receive a service) in more than one enrollment period (i.e., duplicated). Each time a participant
receives one service in an enrollment period, they are counted as a patient. Data indicates that 61% of
the patients had their initial office visit within the first 60 days of enrollment with almost half (44%) making
their first visit within 30 days. Data does not suggest that those with multiple enrollment periods are
enrolling in HSF and not receiving services.
Table D13
Length of Days to Initial Office Visit for Individuals with Two or More Dis‐enrollments
First Initial Office Visit
(Days After Enrollment)
No. of Patients
(Duplicated) Rate
01‐30 Days 29,651 44%
31‐60 Days 11,529 17%
61‐90 Days 6,803 10%
>90 Days 19,307 29%
Total 67,290 100%
5 For example, individuals dis‐enrolled for program eligibility or failure to pay participation fee can be dis‐enrolled mid‐year while individuals dis‐
enrolled for failure to renew will have 365 days of enrollment before being dis‐enrolled. In addition, while HSF enrollment is primarily done at the medical home site, it is not the case that each person enrolling into the program on a particular day will be in need of a service on that day or shortly thereafter.
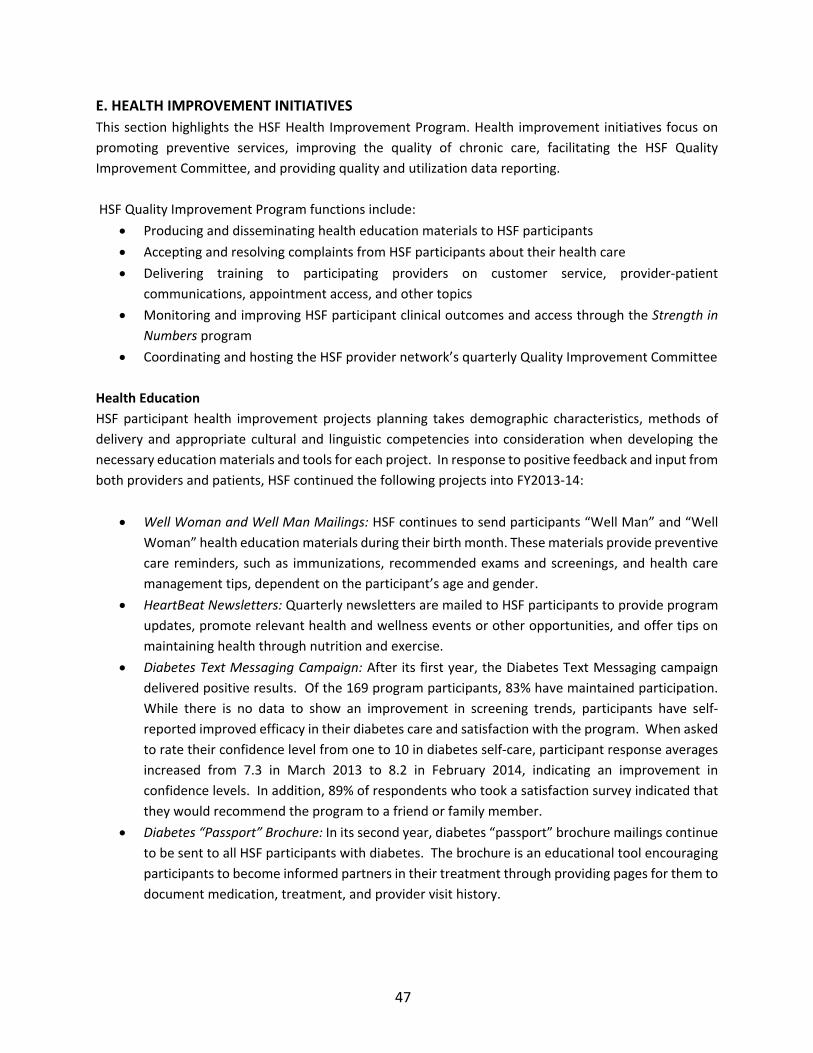
47
E. HEALTH IMPROVEMENT INITIATIVES
This section highlights the HSF Health Improvement Program. Health improvement initiatives focus on
promoting preventive services, improving the quality of chronic care, facilitating the HSF Quality
Improvement Committee, and providing quality and utilization data reporting.
HSF Quality Improvement Program functions include:
Producing and disseminating health education materials to HSF participants
Accepting and resolving complaints from HSF participants about their health care
Delivering training to participating providers on customer service, provider‐patient
communications, appointment access, and other topics
Monitoring and improving HSF participant clinical outcomes and access through the Strength in
Numbers program
Coordinating and hosting the HSF provider network’s quarterly Quality Improvement Committee
Health Education
HSF participant health improvement projects planning takes demographic characteristics, methods of
delivery and appropriate cultural and linguistic competencies into consideration when developing the
necessary education materials and tools for each project. In response to positive feedback and input from
both providers and patients, HSF continued the following projects into FY2013‐14:
Well Woman and Well Man Mailings: HSF continues to send participants “Well Man” and “Well
Woman” health education materials during their birth month. These materials provide preventive
care reminders, such as immunizations, recommended exams and screenings, and health care
management tips, dependent on the participant’s age and gender.
HeartBeat Newsletters: Quarterly newsletters are mailed to HSF participants to provide program
updates, promote relevant health and wellness events or other opportunities, and offer tips on
maintaining health through nutrition and exercise.
Diabetes Text Messaging Campaign: After its first year, the Diabetes Text Messaging campaign
delivered positive results. Of the 169 program participants, 83% have maintained participation.
While there is no data to show an improvement in screening trends, participants have self‐
reported improved efficacy in their diabetes care and satisfaction with the program. When asked
to rate their confidence level from one to 10 in diabetes self‐care, participant response averages
increased from 7.3 in March 2013 to 8.2 in February 2014, indicating an improvement in
confidence levels. In addition, 89% of respondents who took a satisfaction survey indicated that
they would recommend the program to a friend or family member.
Diabetes “Passport” Brochure: In its second year, diabetes “passport” brochure mailings continue
to be sent to all HSF participants with diabetes. The brochure is an educational tool encouraging
participants to become informed partners in their treatment through providing pages for them to
document medication, treatment, and provider visit history.
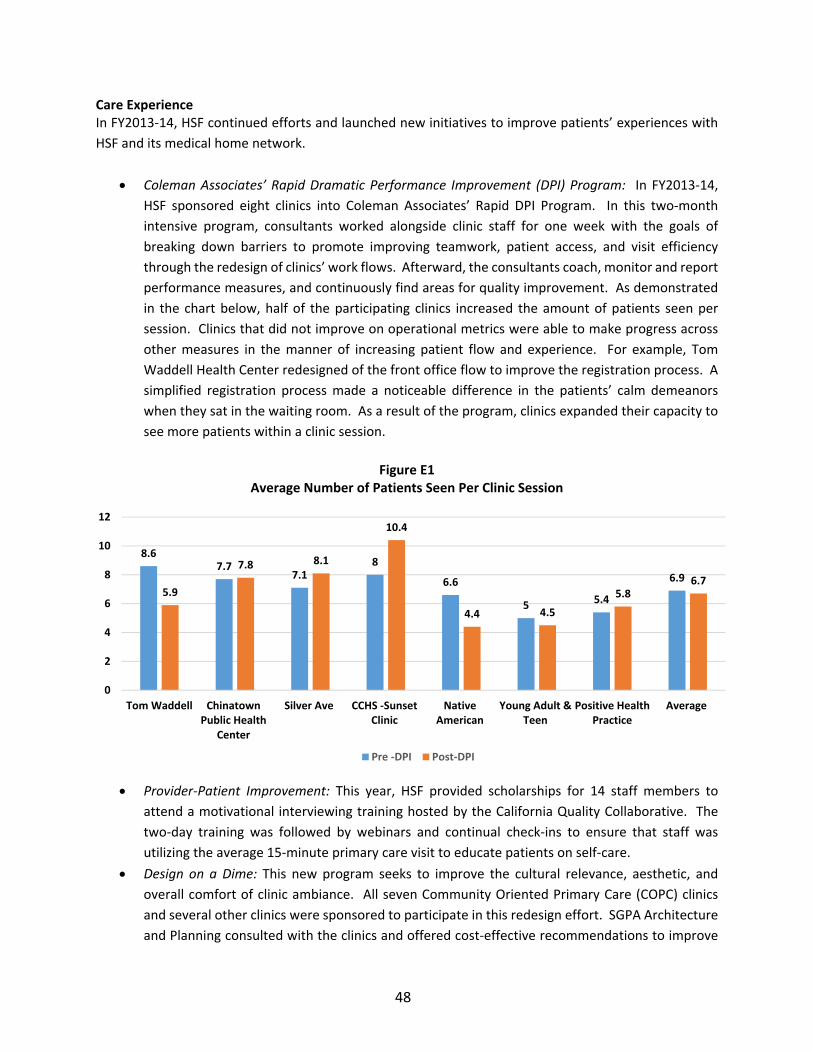
48
Care Experience In FY2013‐14, HSF continued efforts and launched new initiatives to improve patients’ experiences with
HSF and its medical home network.
Coleman Associates’ Rapid Dramatic Performance Improvement (DPI) Program: In FY2013‐14,
HSF sponsored eight clinics into Coleman Associates’ Rapid DPI Program. In this two‐month
intensive program, consultants worked alongside clinic staff for one week with the goals of
breaking down barriers to promote improving teamwork, patient access, and visit efficiency
through the redesign of clinics’ work flows. Afterward, the consultants coach, monitor and report
performance measures, and continuously find areas for quality improvement. As demonstrated
in the chart below, half of the participating clinics increased the amount of patients seen per
session. Clinics that did not improve on operational metrics were able to make progress across
other measures in the manner of increasing patient flow and experience. For example, Tom
Waddell Health Center redesigned of the front office flow to improve the registration process. A
simplified registration process made a noticeable difference in the patients’ calm demeanors
when they sat in the waiting room. As a result of the program, clinics expanded their capacity to
see more patients within a clinic session.
Figure E1
Average Number of Patients Seen Per Clinic Session
Provider‐Patient Improvement: This year, HSF provided scholarships for 14 staff members to
attend a motivational interviewing training hosted by the California Quality Collaborative. The
two‐day training was followed by webinars and continual check‐ins to ensure that staff was
utilizing the average 15‐minute primary care visit to educate patients on self‐care.
Design on a Dime: This new program seeks to improve the cultural relevance, aesthetic, and
overall comfort of clinic ambiance. All seven Community Oriented Primary Care (COPC) clinics
and several other clinics were sponsored to participate in this redesign effort. SGPA Architecture
and Planning consulted with the clinics and offered cost‐effective recommendations to improve
8.67.7
7.18
6.6
5 5.4
6.95.9
7.8 8.1
10.4
4.4 4.5
5.86.7
0
2
4
6
8
10
12
Tom Waddell ChinatownPublic Health
Center
Silver Ave CCHS ‐SunsetClinic
NativeAmerican
Young Adult &Teen
Positive HealthPractice
Average
Pre ‐DPI Post‐DPI
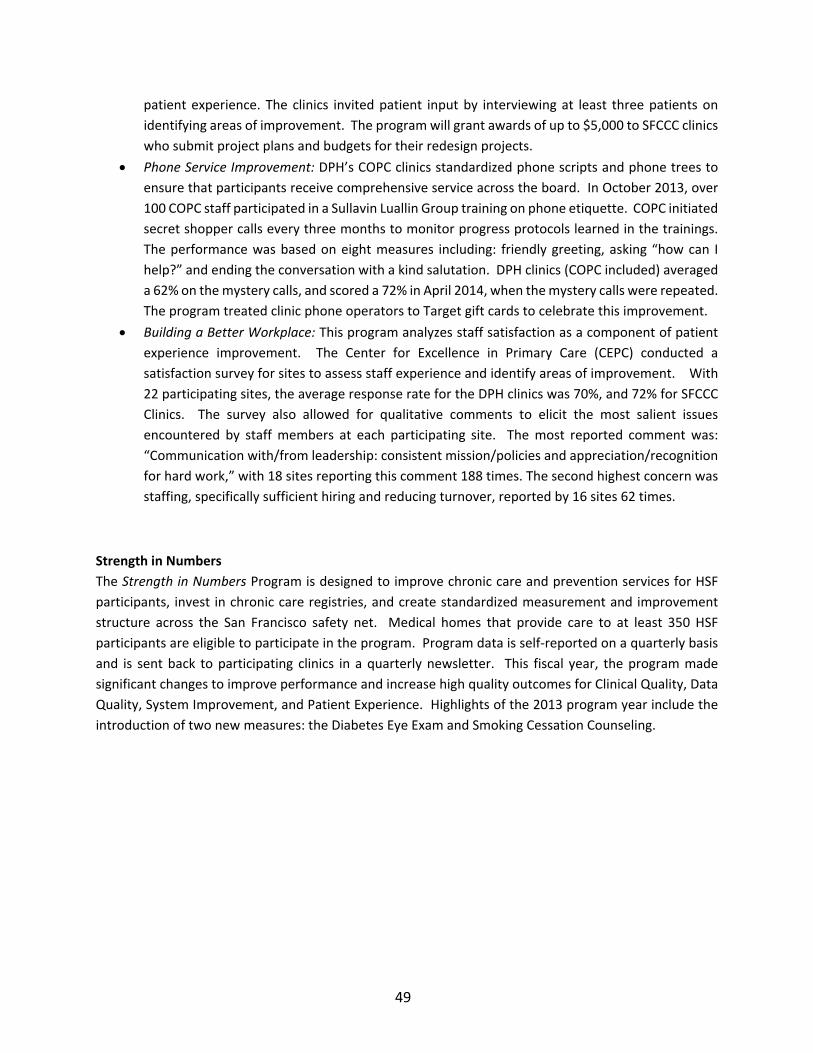
49
patient experience. The clinics invited patient input by interviewing at least three patients on
identifying areas of improvement. The program will grant awards of up to $5,000 to SFCCC clinics
who submit project plans and budgets for their redesign projects.
Phone Service Improvement: DPH’s COPC clinics standardized phone scripts and phone trees to
ensure that participants receive comprehensive service across the board. In October 2013, over
100 COPC staff participated in a Sullavin Luallin Group training on phone etiquette. COPC initiated
secret shopper calls every three months to monitor progress protocols learned in the trainings.
The performance was based on eight measures including: friendly greeting, asking “how can I
help?” and ending the conversation with a kind salutation. DPH clinics (COPC included) averaged
a 62% on the mystery calls, and scored a 72% in April 2014, when the mystery calls were repeated.
The program treated clinic phone operators to Target gift cards to celebrate this improvement.
Building a Better Workplace: This program analyzes staff satisfaction as a component of patient
experience improvement. The Center for Excellence in Primary Care (CEPC) conducted a
satisfaction survey for sites to assess staff experience and identify areas of improvement. With
22 participating sites, the average response rate for the DPH clinics was 70%, and 72% for SFCCC
Clinics. The survey also allowed for qualitative comments to elicit the most salient issues
encountered by staff members at each participating site. The most reported comment was:
“Communication with/from leadership: consistent mission/policies and appreciation/recognition
for hard work,” with 18 sites reporting this comment 188 times. The second highest concern was
staffing, specifically sufficient hiring and reducing turnover, reported by 16 sites 62 times.
Strength in Numbers
The Strength in Numbers Program is designed to improve chronic care and prevention services for HSF
participants, invest in chronic care registries, and create standardized measurement and improvement
structure across the San Francisco safety net. Medical homes that provide care to at least 350 HSF
participants are eligible to participate in the program. Program data is self‐reported on a quarterly basis
and is sent back to participating clinics in a quarterly newsletter. This fiscal year, the program made
significant changes to improve performance and increase high quality outcomes for Clinical Quality, Data
Quality, System Improvement, and Patient Experience. Highlights of the 2013 program year include the
introduction of two new measures: the Diabetes Eye Exam and Smoking Cessation Counseling.
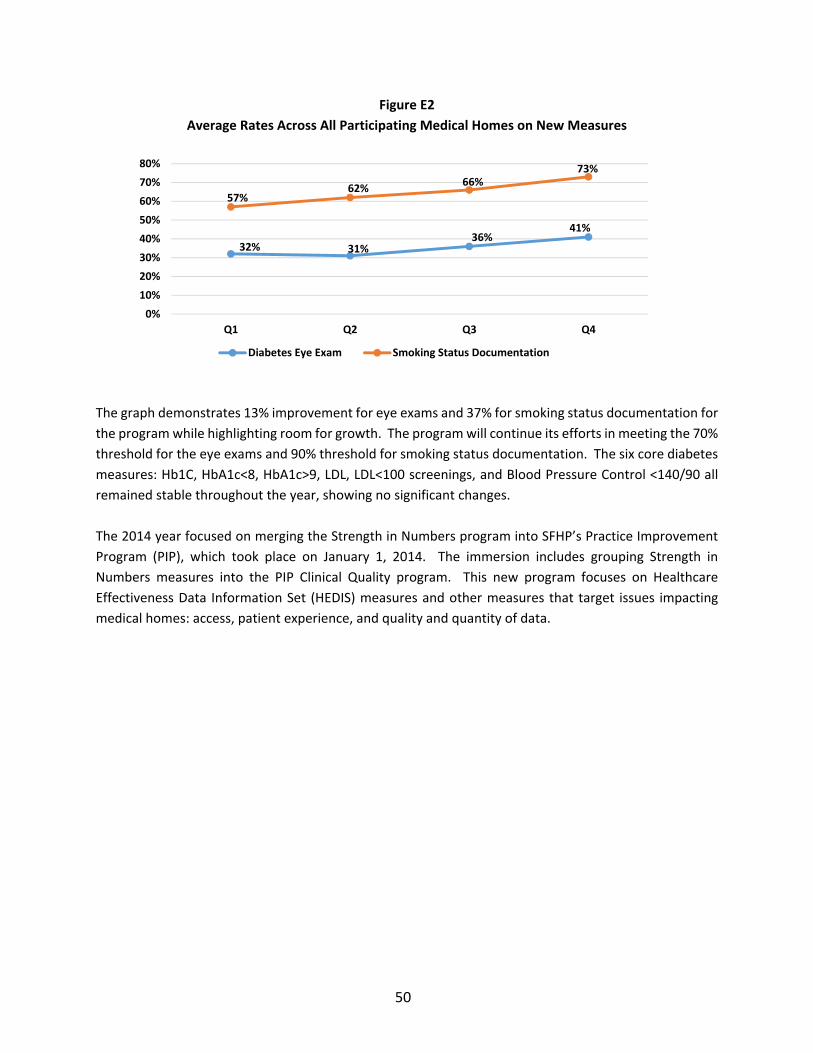
50
32% 31%36%
41%
57%62%
66%73%
0%
10%
20%
30%
40%
50%
60%
70%
80%
Q1 Q2 Q3 Q4
Diabetes Eye Exam Smoking Status Documentation
Figure E2
Average Rates Across All Participating Medical Homes on New Measures
The graph demonstrates 13% improvement for eye exams and 37% for smoking status documentation for
the program while highlighting room for growth. The program will continue its efforts in meeting the 70%
threshold for the eye exams and 90% threshold for smoking status documentation. The six core diabetes
measures: Hb1C, HbA1c<8, HbA1c>9, LDL, LDL<100 screenings, and Blood Pressure Control <140/90 all
remained stable throughout the year, showing no significant changes.
The 2014 year focused on merging the Strength in Numbers program into SFHP’s Practice Improvement
Program (PIP), which took place on January 1, 2014. The immersion includes grouping Strength in
Numbers measures into the PIP Clinical Quality program. This new program focuses on Healthcare
Effectiveness Data Information Set (HEDIS) measures and other measures that target issues impacting
medical homes: access, patient experience, and quality and quantity of data.
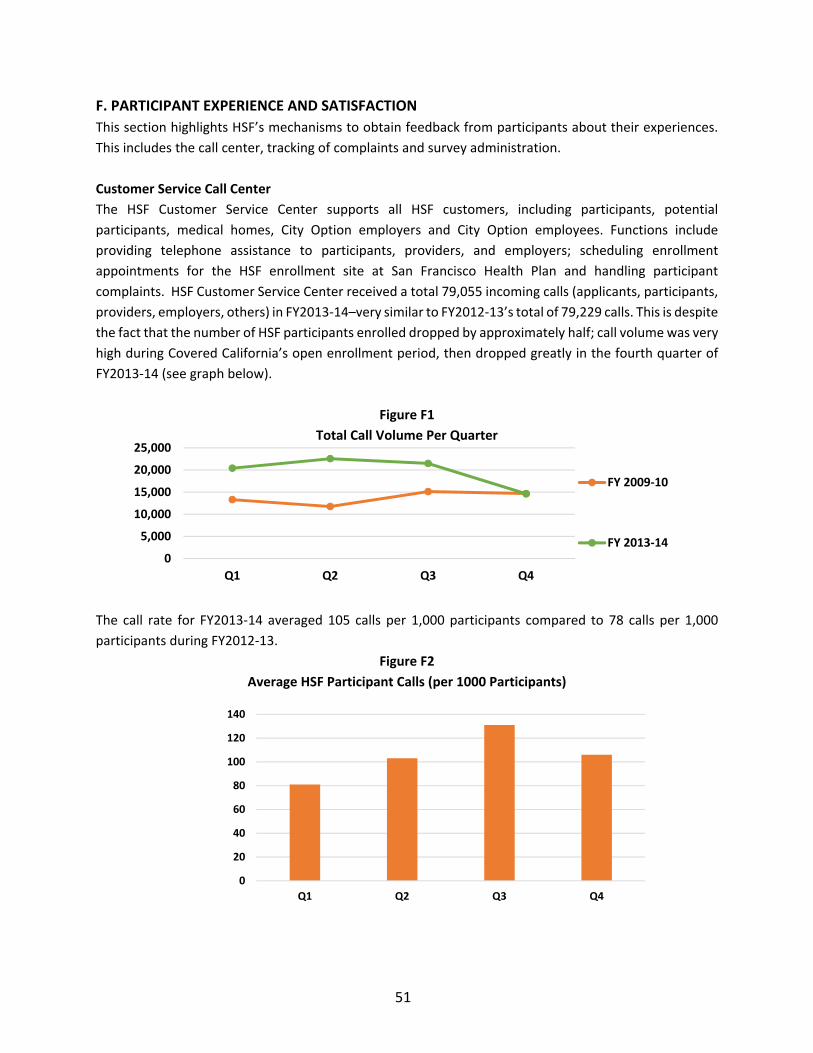
51
0
5,000
10,000
15,000
20,000
25,000
Q1 Q2 Q3 Q4
FY 2009‐10
FY 2013‐14
F. PARTICIPANT EXPERIENCE AND SATISFACTION
This section highlights HSF’s mechanisms to obtain feedback from participants about their experiences.
This includes the call center, tracking of complaints and survey administration.
Customer Service Call Center
The HSF Customer Service Center supports all HSF customers, including participants, potential
participants, medical homes, City Option employers and City Option employees. Functions include
providing telephone assistance to participants, providers, and employers; scheduling enrollment
appointments for the HSF enrollment site at San Francisco Health Plan and handling participant
complaints. HSF Customer Service Center received a total 79,055 incoming calls (applicants, participants,
providers, employers, others) in FY2013‐14–very similar to FY2012‐13’s total of 79,229 calls. This is despite
the fact that the number of HSF participants enrolled dropped by approximately half; call volume was very
high during Covered California’s open enrollment period, then dropped greatly in the fourth quarter of
FY2013‐14 (see graph below).
Figure F1
Total Call Volume Per Quarter
The call rate for FY2013‐14 averaged 105 calls per 1,000 participants compared to 78 calls per 1,000
participants during FY2012‐13.
Figure F2
Average HSF Participant Calls (per 1000 Participants)
0
20
40
60
80
100
120
140
Q1 Q2 Q3 Q4
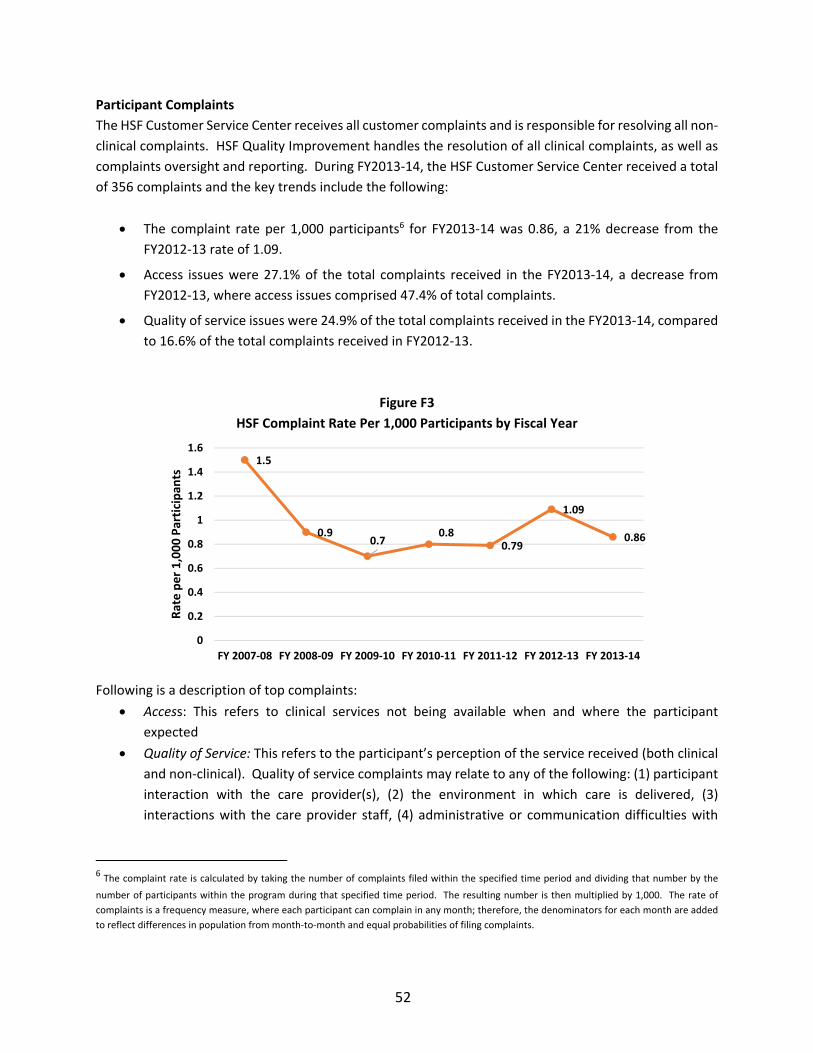
52
1.5
0.90.7
0.80.79
1.09
0.86
0
0.2
0.4
0.6
0.8
1
1.2
1.4
1.6
FY 2007‐08 FY 2008‐09 FY 2009‐10 FY 2010‐11 FY 2011‐12 FY 2012‐13 FY 2013‐14
Rate per 1,000 Participan
ts
Participant Complaints
The HSF Customer Service Center receives all customer complaints and is responsible for resolving all non‐
clinical complaints. HSF Quality Improvement handles the resolution of all clinical complaints, as well as
complaints oversight and reporting. During FY2013‐14, the HSF Customer Service Center received a total
of 356 complaints and the key trends include the following:
The complaint rate per 1,000 participants6 for FY2013‐14 was 0.86, a 21% decrease from the
FY2012‐13 rate of 1.09.
Access issues were 27.1% of the total complaints received in the FY2013‐14, a decrease from
FY2012‐13, where access issues comprised 47.4% of total complaints.
Quality of service issues were 24.9% of the total complaints received in the FY2013‐14, compared
to 16.6% of the total complaints received in FY2012‐13.
Figure F3
HSF Complaint Rate Per 1,000 Participants by Fiscal Year
Following is a description of top complaints:
Access: This refers to clinical services not being available when and where the participant
expected
Quality of Service: This refers to the participant’s perception of the service received (both clinical
and non‐clinical). Quality of service complaints may relate to any of the following: (1) participant
interaction with the care provider(s), (2) the environment in which care is delivered, (3)
interactions with the care provider staff, (4) administrative or communication difficulties with
6 The complaint rate is calculated by taking the number of complaints filed within the specified time period and dividing that number by the
number of participants within the program during that specified time period. The resulting number is then multiplied by 1,000. The rate of
complaints is a frequency measure, where each participant can complain in any month; therefore, the denominators for each month are added
to reflect differences in population from month‐to‐month and equal probabilities of filing complaints.
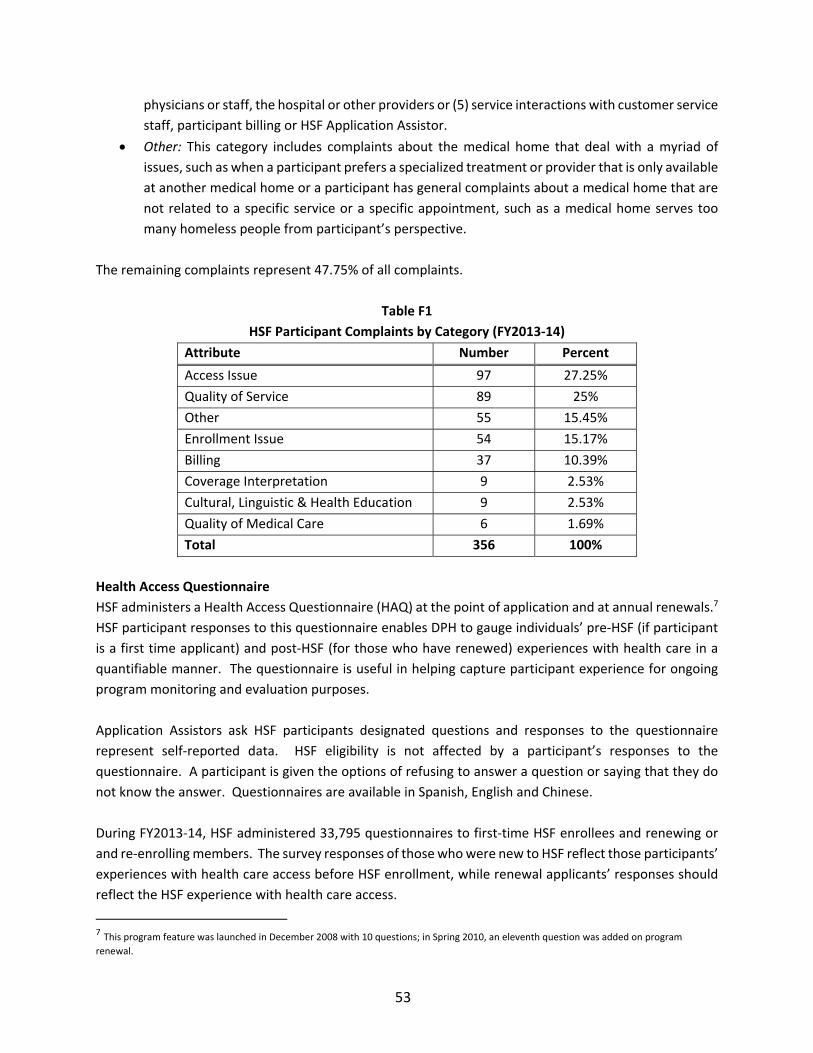
53
physicians or staff, the hospital or other providers or (5) service interactions with customer service
staff, participant billing or HSF Application Assistor.
Other: This category includes complaints about the medical home that deal with a myriad of
issues, such as when a participant prefers a specialized treatment or provider that is only available
at another medical home or a participant has general complaints about a medical home that are
not related to a specific service or a specific appointment, such as a medical home serves too
many homeless people from participant’s perspective.
The remaining complaints represent 47.75% of all complaints.
Table F1
HSF Participant Complaints by Category (FY2013‐14)
Attribute Number Percent
Access Issue 97 27.25%
Quality of Service 89 25%
Other 55 15.45%
Enrollment Issue 54 15.17%
Billing 37 10.39%
Coverage Interpretation 9 2.53%
Cultural, Linguistic & Health Education 9 2.53%
Quality of Medical Care 6 1.69%
Total 356 100%
Health Access Questionnaire
HSF administers a Health Access Questionnaire (HAQ) at the point of application and at annual renewals.7
HSF participant responses to this questionnaire enables DPH to gauge individuals’ pre‐HSF (if participant
is a first time applicant) and post‐HSF (for those who have renewed) experiences with health care in a
quantifiable manner. The questionnaire is useful in helping capture participant experience for ongoing
program monitoring and evaluation purposes.
Application Assistors ask HSF participants designated questions and responses to the questionnaire
represent self‐reported data. HSF eligibility is not affected by a participant’s responses to the
questionnaire. A participant is given the options of refusing to answer a question or saying that they do
not know the answer. Questionnaires are available in Spanish, English and Chinese.
During FY2013‐14, HSF administered 33,795 questionnaires to first‐time HSF enrollees and renewing or
and re‐enrolling members. The survey responses of those who were new to HSF reflect those participants’
experiences with health care access before HSF enrollment, while renewal applicants’ responses should
reflect the HSF experience with health care access.
7 This program feature was launched in December 2008 with 10 questions; in Spring 2010, an eleventh question was added on program
renewal.
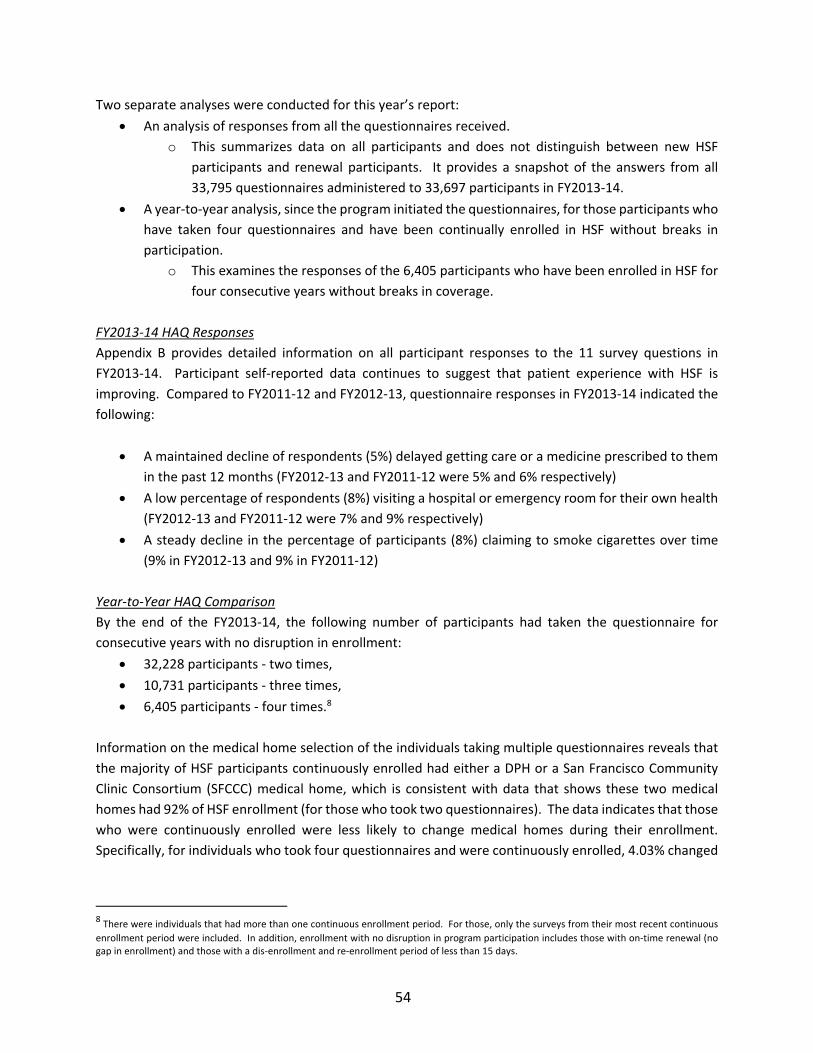
54
Two separate analyses were conducted for this year’s report:
An analysis of responses from all the questionnaires received.
o This summarizes data on all participants and does not distinguish between new HSF
participants and renewal participants. It provides a snapshot of the answers from all
33,795 questionnaires administered to 33,697 participants in FY2013‐14.
A year‐to‐year analysis, since the program initiated the questionnaires, for those participants who
have taken four questionnaires and have been continually enrolled in HSF without breaks in
participation.
o This examines the responses of the 6,405 participants who have been enrolled in HSF for
four consecutive years without breaks in coverage.
FY2013‐14 HAQ Responses
Appendix B provides detailed information on all participant responses to the 11 survey questions in
FY2013‐14. Participant self‐reported data continues to suggest that patient experience with HSF is
improving. Compared to FY2011‐12 and FY2012‐13, questionnaire responses in FY2013‐14 indicated the
following:
A maintained decline of respondents (5%) delayed getting care or a medicine prescribed to them
in the past 12 months (FY2012‐13 and FY2011‐12 were 5% and 6% respectively)
A low percentage of respondents (8%) visiting a hospital or emergency room for their own health
(FY2012‐13 and FY2011‐12 were 7% and 9% respectively)
A steady decline in the percentage of participants (8%) claiming to smoke cigarettes over time
(9% in FY2012‐13 and 9% in FY2011‐12)
Year‐to‐Year HAQ Comparison
By the end of the FY2013‐14, the following number of participants had taken the questionnaire for
consecutive years with no disruption in enrollment:
32,228 participants ‐ two times,
10,731 participants ‐ three times,
6,405 participants ‐ four times.8
Information on the medical home selection of the individuals taking multiple questionnaires reveals that
the majority of HSF participants continuously enrolled had either a DPH or a San Francisco Community
Clinic Consortium (SFCCC) medical home, which is consistent with data that shows these two medical
homes had 92% of HSF enrollment (for those who took two questionnaires). The data indicates that those
who were continuously enrolled were less likely to change medical homes during their enrollment.
Specifically, for individuals who took four questionnaires and were continuously enrolled, 4.03% changed
8 There were individuals that had more than one continuous enrollment period. For those, only the surveys from their most recent continuous
enrollment period were included. In addition, enrollment with no disruption in program participation includes those with on‐time renewal (no gap in enrollment) and those with a dis‐enrollment and re‐enrollment period of less than 15 days.
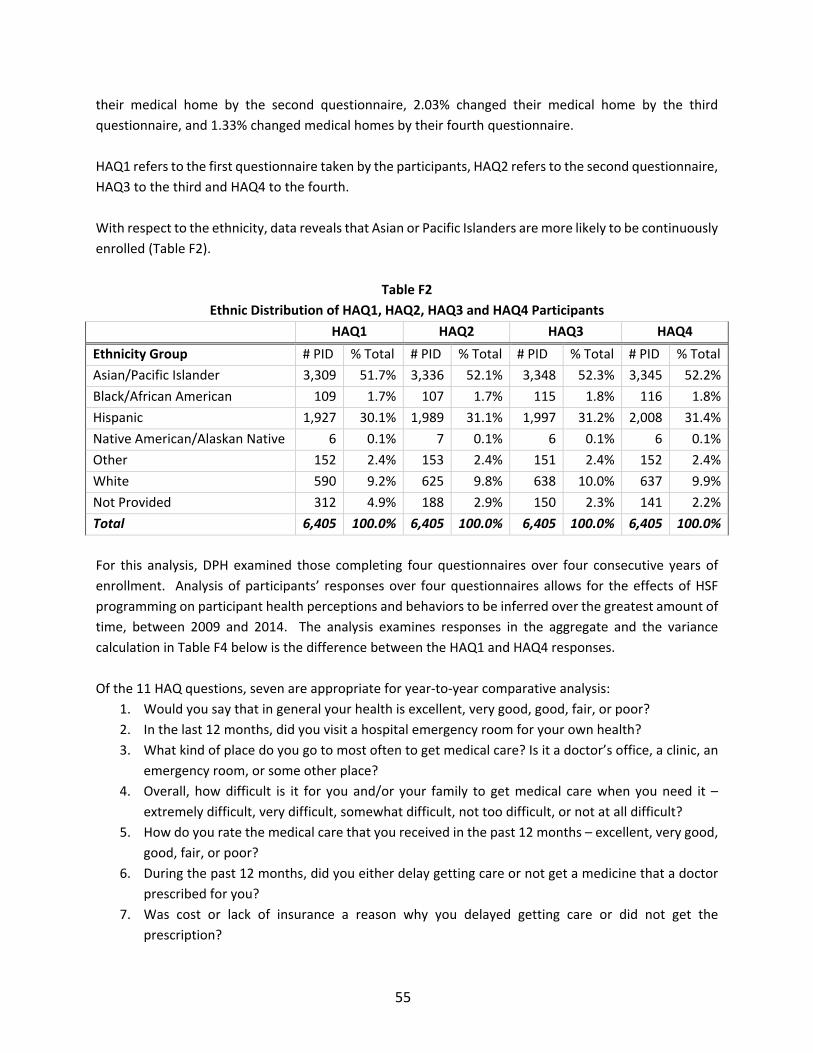
55
their medical home by the second questionnaire, 2.03% changed their medical home by the third
questionnaire, and 1.33% changed medical homes by their fourth questionnaire.
HAQ1 refers to the first questionnaire taken by the participants, HAQ2 refers to the second questionnaire,
HAQ3 to the third and HAQ4 to the fourth.
With respect to the ethnicity, data reveals that Asian or Pacific Islanders are more likely to be continuously
enrolled (Table F2).
Table F2
Ethnic Distribution of HAQ1, HAQ2, HAQ3 and HAQ4 Participants
HAQ1 HAQ2 HAQ3 HAQ4
Ethnicity Group # PID % Total # PID % Total # PID % Total # PID % Total
Asian/Pacific Islander 3,309 51.7% 3,336 52.1% 3,348 52.3% 3,345 52.2%
Black/African American 109 1.7% 107 1.7% 115 1.8% 116 1.8%
Hispanic 1,927 30.1% 1,989 31.1% 1,997 31.2% 2,008 31.4%
Native American/Alaskan Native 6 0.1% 7 0.1% 6 0.1% 6 0.1%
Other 152 2.4% 153 2.4% 151 2.4% 152 2.4%
White 590 9.2% 625 9.8% 638 10.0% 637 9.9%
Not Provided 312 4.9% 188 2.9% 150 2.3% 141 2.2%
Total 6,405 100.0% 6,405 100.0% 6,405 100.0% 6,405 100.0%
For this analysis, DPH examined those completing four questionnaires over four consecutive years of
enrollment. Analysis of participants’ responses over four questionnaires allows for the effects of HSF
programming on participant health perceptions and behaviors to be inferred over the greatest amount of
time, between 2009 and 2014. The analysis examines responses in the aggregate and the variance
calculation in Table F4 below is the difference between the HAQ1 and HAQ4 responses.
Of the 11 HAQ questions, seven are appropriate for year‐to‐year comparative analysis:
1. Would you say that in general your health is excellent, very good, good, fair, or poor?
2. In the last 12 months, did you visit a hospital emergency room for your own health?
3. What kind of place do you go to most often to get medical care? Is it a doctor’s office, a clinic, an
emergency room, or some other place?
4. Overall, how difficult is it for you and/or your family to get medical care when you need it –
extremely difficult, very difficult, somewhat difficult, not too difficult, or not at all difficult?
5. How do you rate the medical care that you received in the past 12 months – excellent, very good,
good, fair, or poor?
6. During the past 12 months, did you either delay getting care or not get a medicine that a doctor
prescribed for you?
7. Was cost or lack of insurance a reason why you delayed getting care or did not get the
prescription?
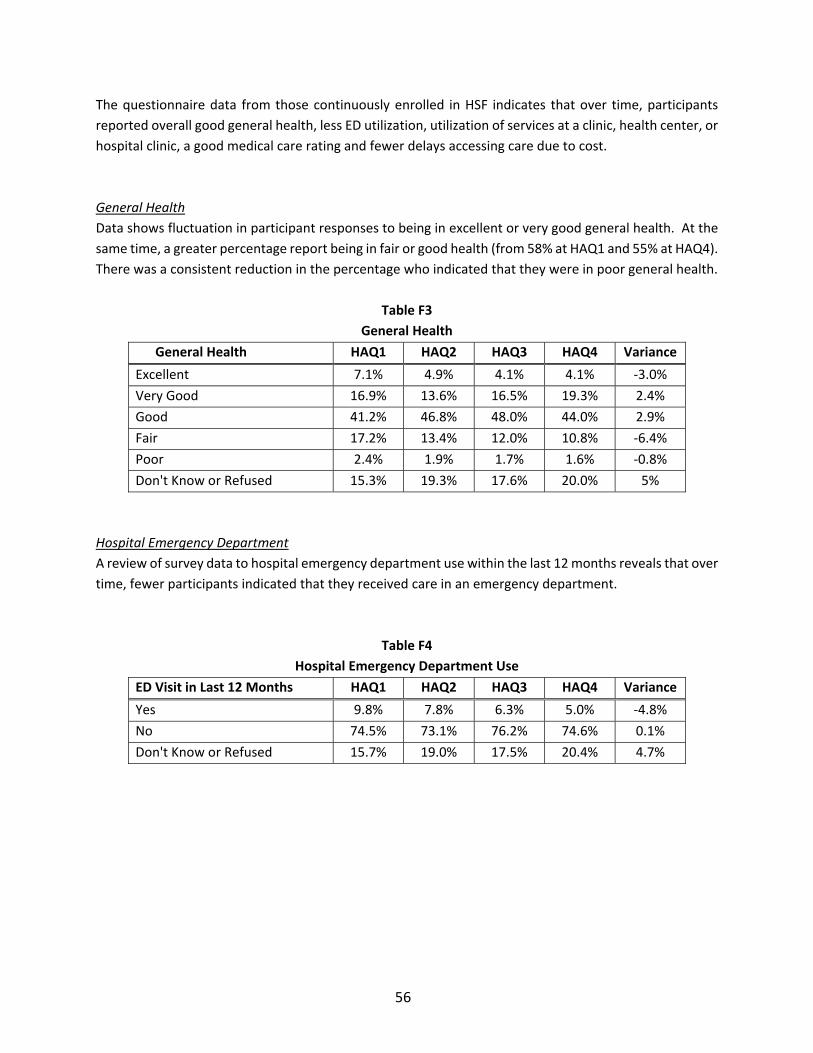
56
The questionnaire data from those continuously enrolled in HSF indicates that over time, participants
reported overall good general health, less ED utilization, utilization of services at a clinic, health center, or
hospital clinic, a good medical care rating and fewer delays accessing care due to cost.
General Health
Data shows fluctuation in participant responses to being in excellent or very good general health. At the
same time, a greater percentage report being in fair or good health (from 58% at HAQ1 and 55% at HAQ4).
There was a consistent reduction in the percentage who indicated that they were in poor general health.
Table F3
General Health
General Health HAQ1 HAQ2 HAQ3 HAQ4 Variance
Excellent 7.1% 4.9% 4.1% 4.1% ‐3.0%
Very Good 16.9% 13.6% 16.5% 19.3% 2.4%
Good 41.2% 46.8% 48.0% 44.0% 2.9%
Fair 17.2% 13.4% 12.0% 10.8% ‐6.4%
Poor 2.4% 1.9% 1.7% 1.6% ‐0.8%
Don't Know or Refused 15.3% 19.3% 17.6% 20.0% 5%
Hospital Emergency Department
A review of survey data to hospital emergency department use within the last 12 months reveals that over
time, fewer participants indicated that they received care in an emergency department.
Table F4
Hospital Emergency Department Use
ED Visit in Last 12 Months HAQ1 HAQ2 HAQ3 HAQ4 Variance
Yes 9.8% 7.8% 6.3% 5.0% ‐4.8%
No 74.5% 73.1% 76.2% 74.6% 0.1%
Don't Know or Refused 15.7% 19.0% 17.5% 20.4% 4.7%
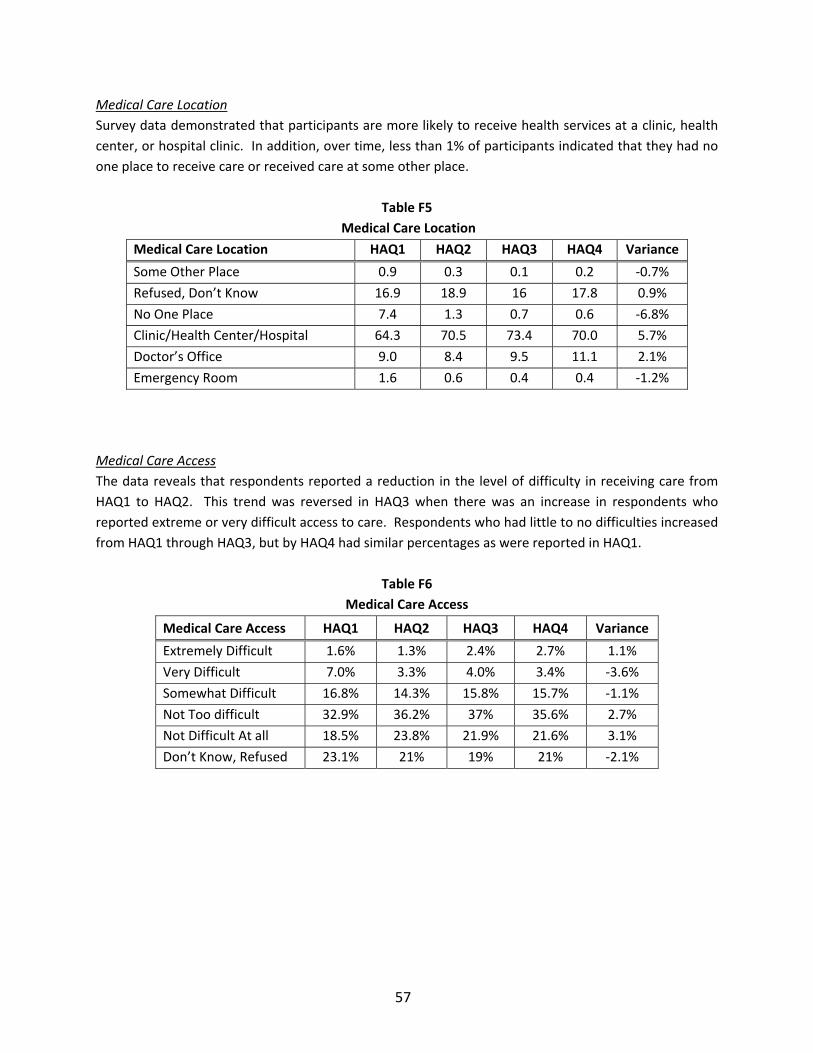
57
Medical Care Location
Survey data demonstrated that participants are more likely to receive health services at a clinic, health
center, or hospital clinic. In addition, over time, less than 1% of participants indicated that they had no
one place to receive care or received care at some other place.
Table F5
Medical Care Location
Medical Care Location HAQ1 HAQ2 HAQ3 HAQ4 Variance
Some Other Place 0.9 0.3 0.1 0.2 ‐0.7%
Refused, Don’t Know 16.9 18.9 16 17.8 0.9%
No One Place 7.4 1.3 0.7 0.6 ‐6.8%
Clinic/Health Center/Hospital 64.3 70.5 73.4 70.0 5.7%
Doctor’s Office 9.0 8.4 9.5 11.1 2.1%
Emergency Room 1.6 0.6 0.4 0.4 ‐1.2%
Medical Care Access
The data reveals that respondents reported a reduction in the level of difficulty in receiving care from
HAQ1 to HAQ2. This trend was reversed in HAQ3 when there was an increase in respondents who
reported extreme or very difficult access to care. Respondents who had little to no difficulties increased
from HAQ1 through HAQ3, but by HAQ4 had similar percentages as were reported in HAQ1.
Table F6
Medical Care Access
Medical Care Access HAQ1 HAQ2 HAQ3 HAQ4 Variance
Extremely Difficult 1.6% 1.3% 2.4% 2.7% 1.1%
Very Difficult 7.0% 3.3% 4.0% 3.4% ‐3.6%
Somewhat Difficult 16.8% 14.3% 15.8% 15.7% ‐1.1%
Not Too difficult 32.9% 36.2% 37% 35.6% 2.7%
Not Difficult At all 18.5% 23.8% 21.9% 21.6% 3.1%
Don’t Know, Refused 23.1% 21% 19% 21% ‐2.1%
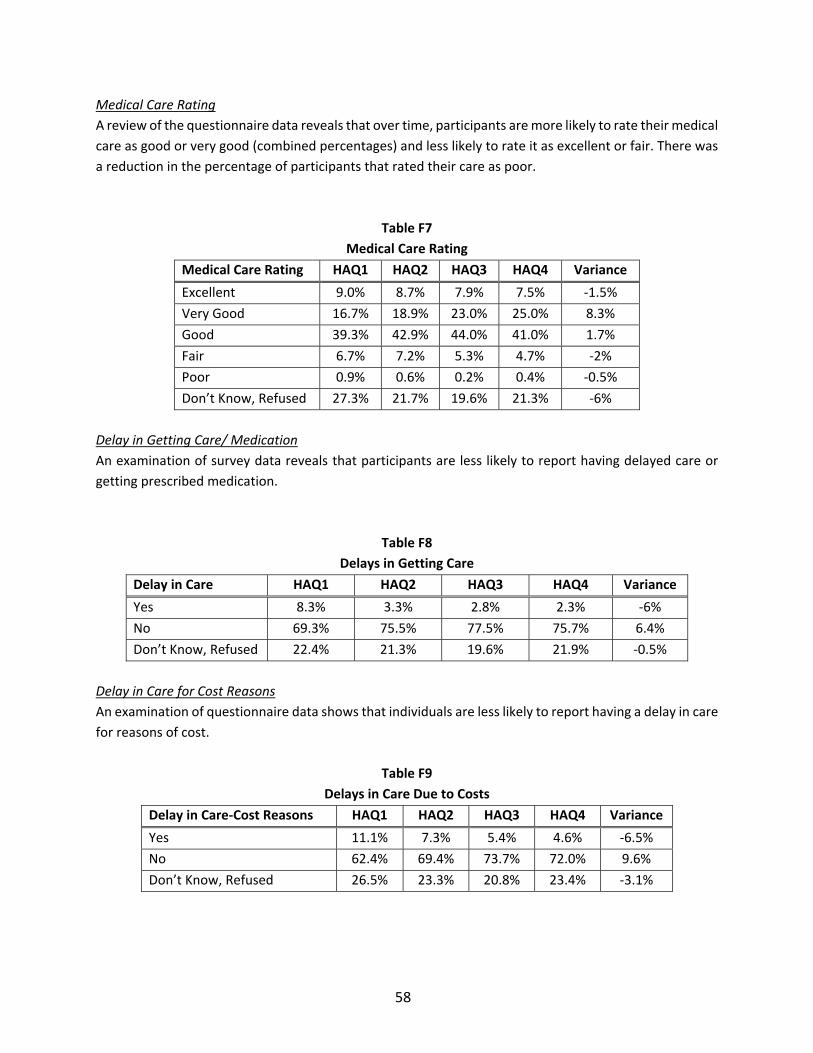
58
Medical Care Rating
A review of the questionnaire data reveals that over time, participants are more likely to rate their medical
care as good or very good (combined percentages) and less likely to rate it as excellent or fair. There was
a reduction in the percentage of participants that rated their care as poor.
Table F7
Medical Care Rating
Medical Care Rating HAQ1 HAQ2 HAQ3 HAQ4 Variance
Excellent 9.0% 8.7% 7.9% 7.5% ‐1.5%
Very Good 16.7% 18.9% 23.0% 25.0% 8.3%
Good 39.3% 42.9% 44.0% 41.0% 1.7%
Fair 6.7% 7.2% 5.3% 4.7% ‐2%
Poor 0.9% 0.6% 0.2% 0.4% ‐0.5%
Don’t Know, Refused 27.3% 21.7% 19.6% 21.3% ‐6%
Delay in Getting Care/ Medication
An examination of survey data reveals that participants are less likely to report having delayed care or
getting prescribed medication.
Table F8
Delays in Getting Care
Delay in Care HAQ1 HAQ2 HAQ3 HAQ4 Variance
Yes 8.3% 3.3% 2.8% 2.3% ‐6%
No 69.3% 75.5% 77.5% 75.7% 6.4%
Don’t Know, Refused 22.4% 21.3% 19.6% 21.9% ‐0.5%
Delay in Care for Cost Reasons
An examination of questionnaire data shows that individuals are less likely to report having a delay in care
for reasons of cost.
Table F9
Delays in Care Due to Costs
Delay in Care‐Cost Reasons HAQ1 HAQ2 HAQ3 HAQ4 Variance
Yes 11.1% 7.3% 5.4% 4.6% ‐6.5%
No 62.4% 69.4% 73.7% 72.0% 9.6%
Don’t Know, Refused 26.5% 23.3% 20.8% 23.4% ‐3.1%
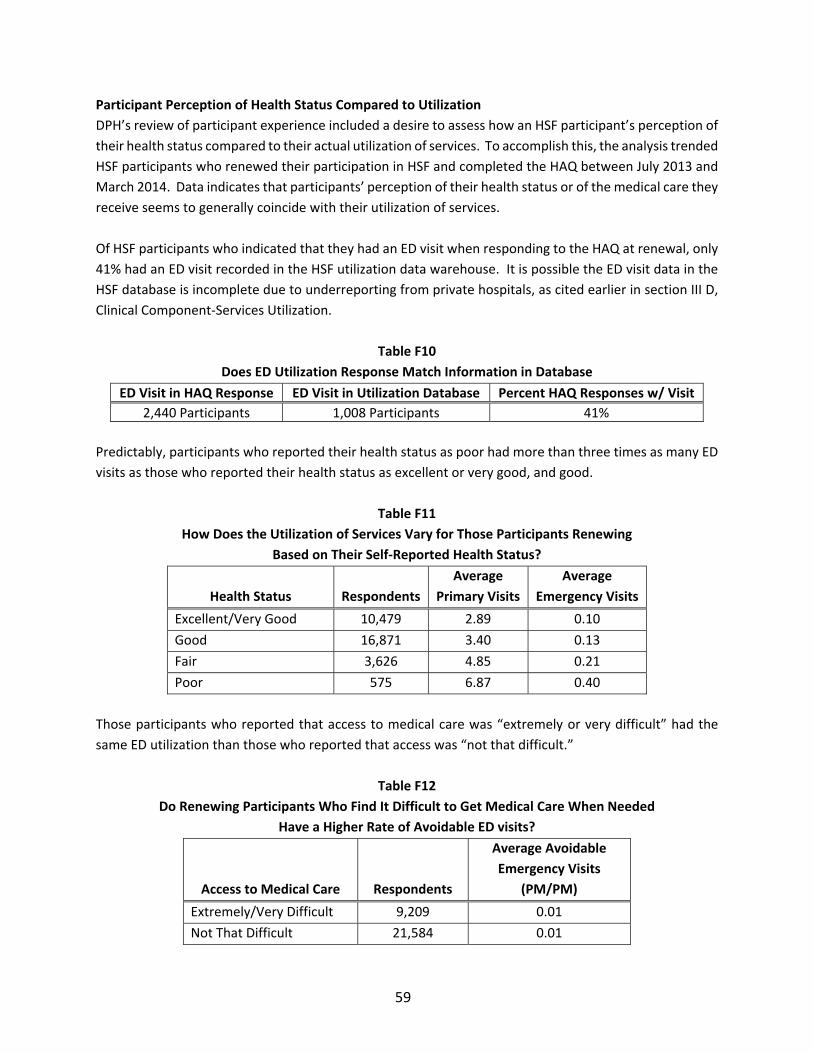
59
Participant Perception of Health Status Compared to Utilization
DPH’s review of participant experience included a desire to assess how an HSF participant’s perception of
their health status compared to their actual utilization of services. To accomplish this, the analysis trended
HSF participants who renewed their participation in HSF and completed the HAQ between July 2013 and
March 2014. Data indicates that participants’ perception of their health status or of the medical care they
receive seems to generally coincide with their utilization of services.
Of HSF participants who indicated that they had an ED visit when responding to the HAQ at renewal, only
41% had an ED visit recorded in the HSF utilization data warehouse. It is possible the ED visit data in the
HSF database is incomplete due to underreporting from private hospitals, as cited earlier in section III D,
Clinical Component‐Services Utilization.
Table F10
Does ED Utilization Response Match Information in Database
ED Visit in HAQ Response ED Visit in Utilization Database Percent HAQ Responses w/ Visit
2,440 Participants 1,008 Participants 41%
Predictably, participants who reported their health status as poor had more than three times as many ED
visits as those who reported their health status as excellent or very good, and good.
Table F11
How Does the Utilization of Services Vary for Those Participants Renewing
Based on Their Self‐Reported Health Status?
Health Status Respondents
Average
Primary Visits
Average
Emergency Visits
Excellent/Very Good 10,479 2.89 0.10
Good 16,871 3.40 0.13
Fair 3,626 4.85 0.21
Poor 575 6.87 0.40
Those participants who reported that access to medical care was “extremely or very difficult” had the
same ED utilization than those who reported that access was “not that difficult.”
Table F12
Do Renewing Participants Who Find It Difficult to Get Medical Care When Needed
Have a Higher Rate of Avoidable ED visits?
Access to Medical Care Respondents
Average Avoidable
Emergency Visits
(PM/PM)
Extremely/Very Difficult 9,209 0.01
Not That Difficult 21,584 0.01
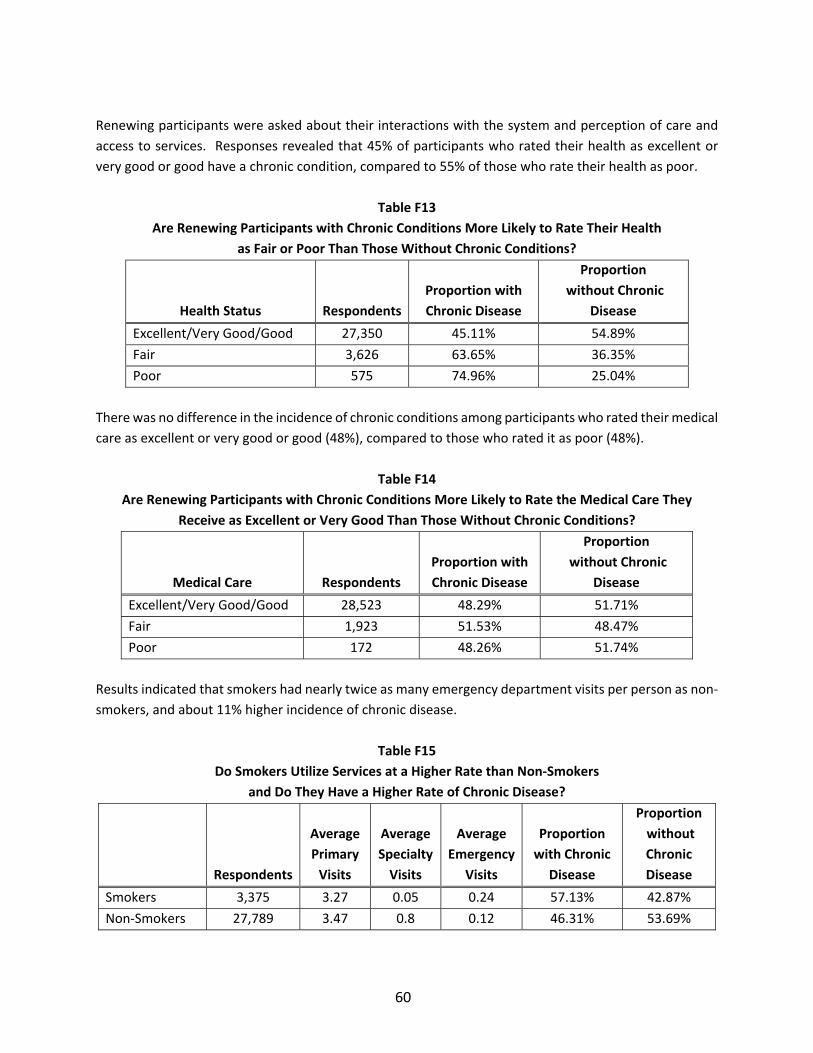
60
Renewing participants were asked about their interactions with the system and perception of care and
access to services. Responses revealed that 45% of participants who rated their health as excellent or
very good or good have a chronic condition, compared to 55% of those who rate their health as poor.
Table F13
Are Renewing Participants with Chronic Conditions More Likely to Rate Their Health
as Fair or Poor Than Those Without Chronic Conditions?
Health Status Respondents
Proportion with
Chronic Disease
Proportion
without Chronic
Disease
Excellent/Very Good/Good 27,350 45.11% 54.89%
Fair 3,626 63.65% 36.35%
Poor 575 74.96% 25.04%
There was no difference in the incidence of chronic conditions among participants who rated their medical
care as excellent or very good or good (48%), compared to those who rated it as poor (48%).
Table F14
Are Renewing Participants with Chronic Conditions More Likely to Rate the Medical Care They
Receive as Excellent or Very Good Than Those Without Chronic Conditions?
Medical Care Respondents
Proportion with
Chronic Disease
Proportion
without Chronic
Disease
Excellent/Very Good/Good 28,523 48.29% 51.71%
Fair 1,923 51.53% 48.47%
Poor 172 48.26% 51.74%
Results indicated that smokers had nearly twice as many emergency department visits per person as non‐
smokers, and about 11% higher incidence of chronic disease.
Table F15
Do Smokers Utilize Services at a Higher Rate than Non‐Smokers
and Do They Have a Higher Rate of Chronic Disease?
Respondents
Average
Primary
Visits
Average
Specialty
Visits
Average
Emergency
Visits
Proportion
with Chronic
Disease
Proportion
without
Chronic
Disease
Smokers 3,375 3.27 0.05 0.24 57.13% 42.87%
Non‐Smokers 27,789 3.47 0.8 0.12 46.31% 53.69%
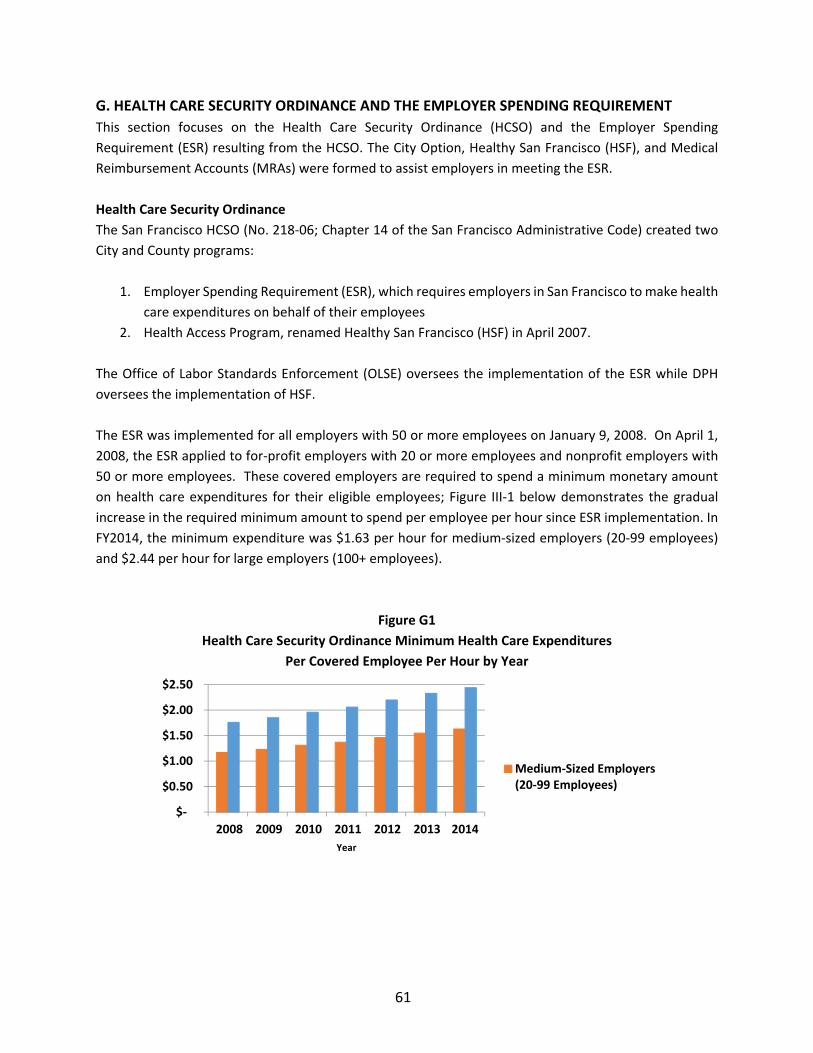
61
$‐
$0.50
$1.00
$1.50
$2.00
$2.50
2008 2009 2010 2011 2012 2013 2014
Year
Medium‐Sized Employers(20‐99 Employees)
G. HEALTH CARE SECURITY ORDINANCE AND THE EMPLOYER SPENDING REQUIREMENT
This section focuses on the Health Care Security Ordinance (HCSO) and the Employer Spending
Requirement (ESR) resulting from the HCSO. The City Option, Healthy San Francisco (HSF), and Medical
Reimbursement Accounts (MRAs) were formed to assist employers in meeting the ESR.
Health Care Security Ordinance
The San Francisco HCSO (No. 218‐06; Chapter 14 of the San Francisco Administrative Code) created two
City and County programs:
1. Employer Spending Requirement (ESR), which requires employers in San Francisco to make health
care expenditures on behalf of their employees
2. Health Access Program, renamed Healthy San Francisco (HSF) in April 2007.
The Office of Labor Standards Enforcement (OLSE) oversees the implementation of the ESR while DPH
oversees the implementation of HSF.
The ESR was implemented for all employers with 50 or more employees on January 9, 2008. On April 1,
2008, the ESR applied to for‐profit employers with 20 or more employees and nonprofit employers with
50 or more employees. These covered employers are required to spend a minimum monetary amount
on health care expenditures for their eligible employees; Figure III‐1 below demonstrates the gradual
increase in the required minimum amount to spend per employee per hour since ESR implementation. In
FY2014, the minimum expenditure was $1.63 per hour for medium‐sized employers (20‐99 employees)
and $2.44 per hour for large employers (100+ employees).
Figure G1
Health Care Security Ordinance Minimum Health Care Expenditures
Per Covered Employee Per Hour by Year
62
City Option
Program Description
The ESR Portal at www.sfcityoption.org is the mechanism by which employers identify employees for
whom they would like to meet the ESR via the City Option. When an employer chooses the City Option,
their employees will receive either HSF program participation or a MRA, depending upon the employee’s
eligibility:
If the employee is eligible for HSF, the employee will be notified and must complete the HSF
application process to enroll in the program. An employer does not enroll an employee into HSF;
the employee must initiate and complete the HSF application process in order to become an HSF
participant.
If the employee is ineligible for HSF, a MRA will be opened for the employee. All funds contributed
on the employee’s behalf by the employer are deposited into this account and the employee can
access these funds for reimbursement of eligible health care expenses.
Program Updates
In FY2013‐14, the City Option program created and improved resources to assist all users with navigating
the program’s features:
User and service guides were created to assist both employers and employees to address common
questions and provide instructions on how to use the ESR Administration Portal.
A new City Option website was launched in October 2013 to provide comprehensive program
information and resources for both employers and employees.
Automated calls are made to employees within one week of their employers’ first payment to
welcome them to the program and if applicable, explain new health care options that participants
may be eligible for.
At the end of FY2013‐14, the Welcome Letter for new participants was updated to include
information about new health care options that participants may be eligible for.
Program Activities
For FY2013‐14:
Approximately 66% (1,347) of employers made at least one contribution to the City Option to
meet the ESR. A total of 417 of these employers made their first contribution during FY2013‐14.
The increase in the number of employers contributing to the City Option is probably due to the
elimination of standalone Health Reimbursement Accounts (HRAs) as a result of ACA’s
implementation.
Employers deposited $64.6 million to provide the City Option for their employees, approximately
$13.9 million more compared to FY2012‐13. This increase is partially due to the ban on
standalone HRAs and employers opting to fulfill the ESR through the City Option.
Of the funds contributed to the City Option by employers in FY2013‐14, 63% ($41 million) was
distributed to employees’ MRAs and 37% ($23.6 million) was for employees potentially eligible
for HSF.
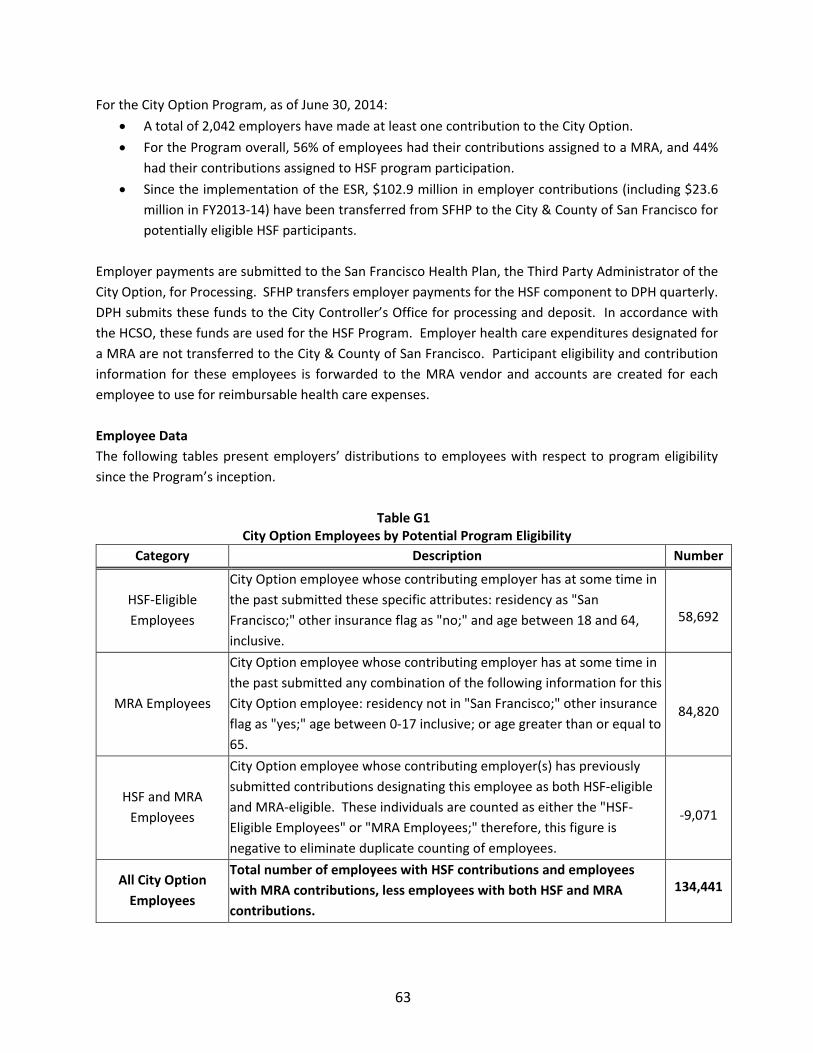
63
For the City Option Program, as of June 30, 2014:
A total of 2,042 employers have made at least one contribution to the City Option.
For the Program overall, 56% of employees had their contributions assigned to a MRA, and 44%
had their contributions assigned to HSF program participation.
Since the implementation of the ESR, $102.9 million in employer contributions (including $23.6
million in FY2013‐14) have been transferred from SFHP to the City & County of San Francisco for
potentially eligible HSF participants.
Employer payments are submitted to the San Francisco Health Plan, the Third Party Administrator of the
City Option, for Processing. SFHP transfers employer payments for the HSF component to DPH quarterly.
DPH submits these funds to the City Controller’s Office for processing and deposit. In accordance with
the HCSO, these funds are used for the HSF Program. Employer health care expenditures designated for
a MRA are not transferred to the City & County of San Francisco. Participant eligibility and contribution
information for these employees is forwarded to the MRA vendor and accounts are created for each
employee to use for reimbursable health care expenses.
Employee Data
The following tables present employers’ distributions to employees with respect to program eligibility
since the Program’s inception.
Table G1 City Option Employees by Potential Program Eligibility
Category Description Number
HSF‐Eligible
Employees
City Option employee whose contributing employer has at some time in
the past submitted these specific attributes: residency as "San
Francisco;" other insurance flag as "no;" and age between 18 and 64,
inclusive. 58,692
MRA Employees
City Option employee whose contributing employer has at some time in
the past submitted any combination of the following information for this
City Option employee: residency not in "San Francisco;" other insurance
flag as "yes;" age between 0‐17 inclusive; or age greater than or equal to
65.
84,820
HSF and MRA
Employees
City Option employee whose contributing employer(s) has previously
submitted contributions designating this employee as both HSF‐eligible
and MRA‐eligible. These individuals are counted as either the "HSF‐
Eligible Employees" or "MRA Employees;" therefore, this figure is
negative to eliminate duplicate counting of employees.
‐9,071
All City Option
Employees
Total number of employees with HSF contributions and employees
with MRA contributions, less employees with both HSF and MRA
contributions.
134,441
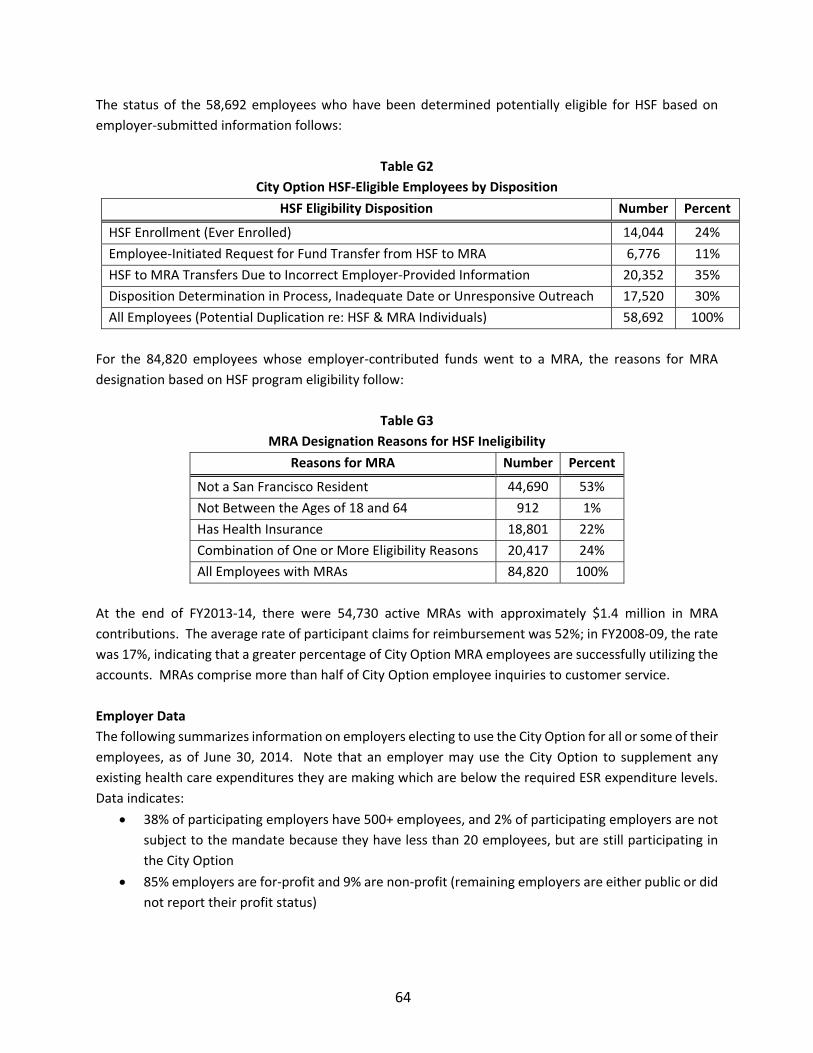
64
The status of the 58,692 employees who have been determined potentially eligible for HSF based on
employer‐submitted information follows:
Table G2
City Option HSF‐Eligible Employees by Disposition
HSF Eligibility Disposition Number Percent
HSF Enrollment (Ever Enrolled) 14,044 24%
Employee‐Initiated Request for Fund Transfer from HSF to MRA 6,776 11%
HSF to MRA Transfers Due to Incorrect Employer‐Provided Information 20,352 35%
Disposition Determination in Process, Inadequate Date or Unresponsive Outreach 17,520 30%
All Employees (Potential Duplication re: HSF & MRA Individuals) 58,692 100%
For the 84,820 employees whose employer‐contributed funds went to a MRA, the reasons for MRA
designation based on HSF program eligibility follow:
Table G3
MRA Designation Reasons for HSF Ineligibility
Reasons for MRA Number Percent
Not a San Francisco Resident 44,690 53%
Not Between the Ages of 18 and 64 912 1%
Has Health Insurance 18,801 22%
Combination of One or More Eligibility Reasons 20,417 24%
All Employees with MRAs 84,820 100%
At the end of FY2013‐14, there were 54,730 active MRAs with approximately $1.4 million in MRA
contributions. The average rate of participant claims for reimbursement was 52%; in FY2008‐09, the rate
was 17%, indicating that a greater percentage of City Option MRA employees are successfully utilizing the
accounts. MRAs comprise more than half of City Option employee inquiries to customer service.
Employer Data
The following summarizes information on employers electing to use the City Option for all or some of their
employees, as of June 30, 2014. Note that an employer may use the City Option to supplement any
existing health care expenditures they are making which are below the required ESR expenditure levels.
Data indicates:
38% of participating employers have 500+ employees, and 2% of participating employers are not
subject to the mandate because they have less than 20 employees, but are still participating in
the City Option
85% employers are for‐profit and 9% are non‐profit (remaining employers are either public or did
not report their profit status)
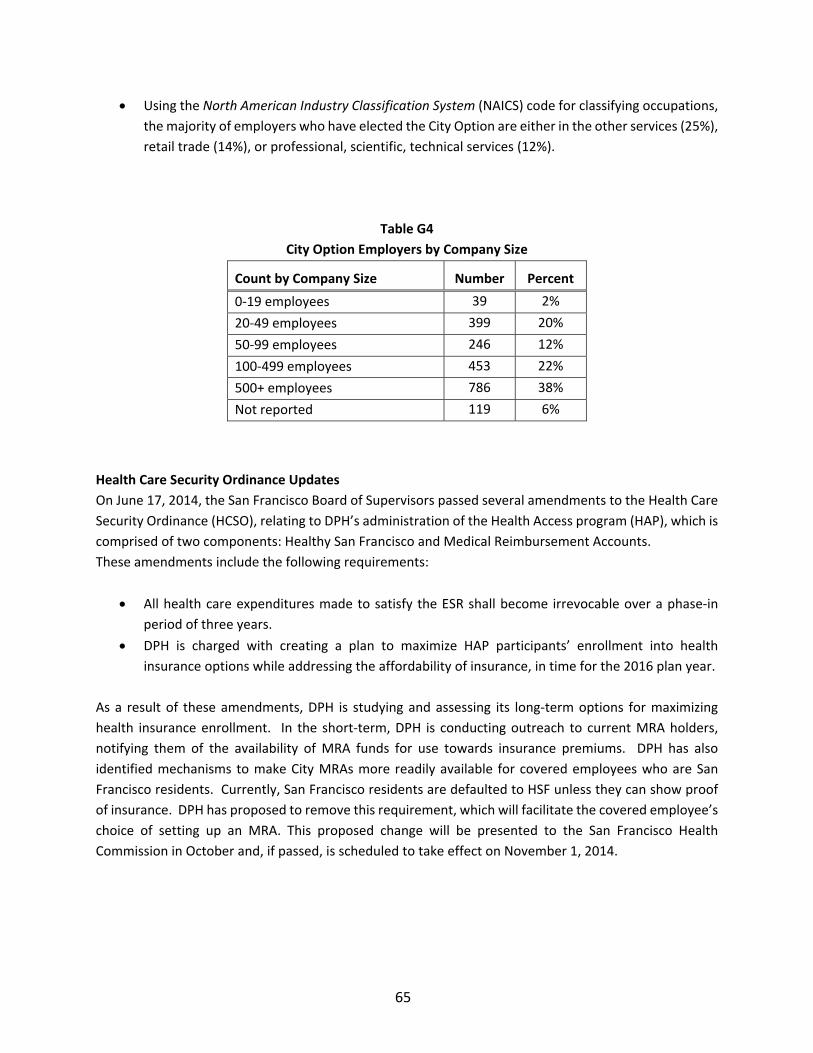
65
Using the North American Industry Classification System (NAICS) code for classifying occupations,
the majority of employers who have elected the City Option are either in the other services (25%),
retail trade (14%), or professional, scientific, technical services (12%).
Table G4
City Option Employers by Company Size
Count by Company Size Number Percent
0‐19 employees 39 2%
20‐49 employees 399 20%
50‐99 employees 246 12%
100‐499 employees 453 22%
500+ employees 786 38%
Not reported 119 6%
Health Care Security Ordinance Updates
On June 17, 2014, the San Francisco Board of Supervisors passed several amendments to the Health Care
Security Ordinance (HCSO), relating to DPH’s administration of the Health Access program (HAP), which is
comprised of two components: Healthy San Francisco and Medical Reimbursement Accounts.
These amendments include the following requirements:
All health care expenditures made to satisfy the ESR shall become irrevocable over a phase‐in
period of three years.
DPH is charged with creating a plan to maximize HAP participants’ enrollment into health
insurance options while addressing the affordability of insurance, in time for the 2016 plan year.
As a result of these amendments, DPH is studying and assessing its long‐term options for maximizing
health insurance enrollment. In the short‐term, DPH is conducting outreach to current MRA holders,
notifying them of the availability of MRA funds for use towards insurance premiums. DPH has also
identified mechanisms to make City MRAs more readily available for covered employees who are San
Francisco residents. Currently, San Francisco residents are defaulted to HSF unless they can show proof
of insurance. DPH has proposed to remove this requirement, which will facilitate the covered employee’s
choice of setting up an MRA. This proposed change will be presented to the San Francisco Health
Commission in October and, if passed, is scheduled to take effect on November 1, 2014.
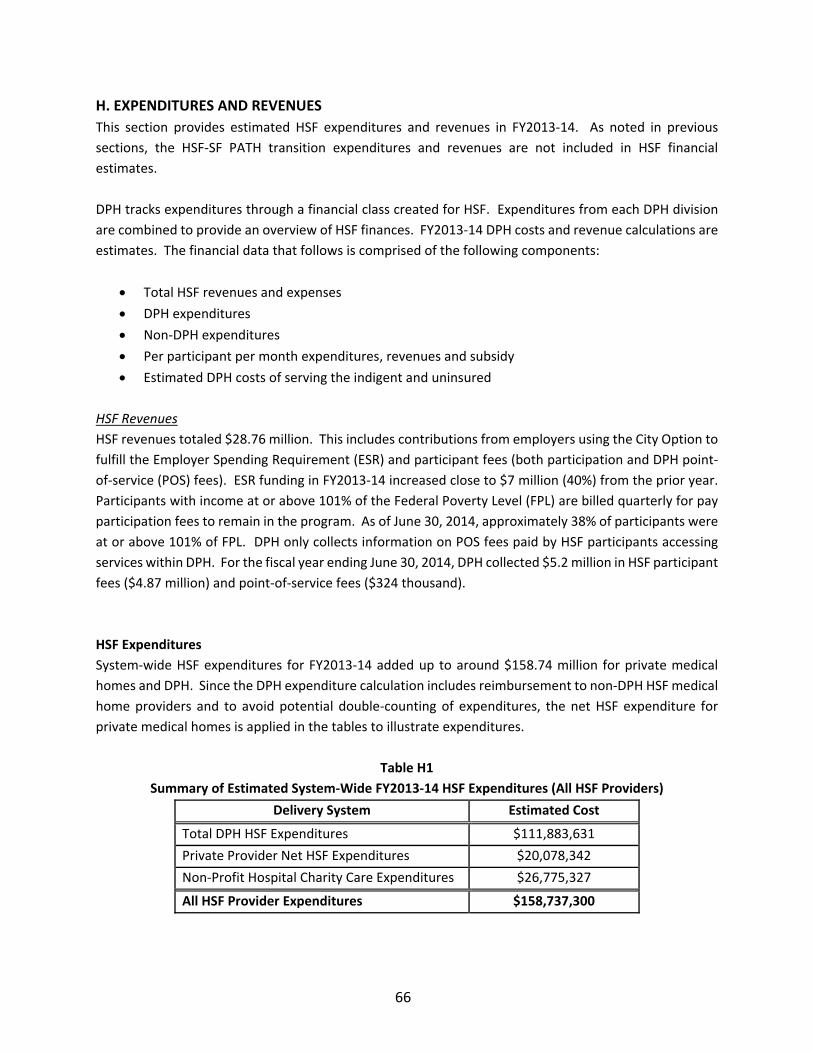
66
H. EXPENDITURES AND REVENUES
This section provides estimated HSF expenditures and revenues in FY2013‐14. As noted in previous
sections, the HSF‐SF PATH transition expenditures and revenues are not included in HSF financial
estimates.
DPH tracks expenditures through a financial class created for HSF. Expenditures from each DPH division
are combined to provide an overview of HSF finances. FY2013‐14 DPH costs and revenue calculations are
estimates. The financial data that follows is comprised of the following components:
Total HSF revenues and expenses
DPH expenditures
Non‐DPH expenditures
Per participant per month expenditures, revenues and subsidy
Estimated DPH costs of serving the indigent and uninsured
HSF Revenues
HSF revenues totaled $28.76 million. This includes contributions from employers using the City Option to
fulfill the Employer Spending Requirement (ESR) and participant fees (both participation and DPH point‐
of‐service (POS) fees). ESR funding in FY2013‐14 increased close to $7 million (40%) from the prior year.
Participants with income at or above 101% of the Federal Poverty Level (FPL) are billed quarterly for pay
participation fees to remain in the program. As of June 30, 2014, approximately 38% of participants were
at or above 101% of FPL. DPH only collects information on POS fees paid by HSF participants accessing
services within DPH. For the fiscal year ending June 30, 2014, DPH collected $5.2 million in HSF participant
fees ($4.87 million) and point‐of‐service fees ($324 thousand).
HSF Expenditures
System‐wide HSF expenditures for FY2013‐14 added up to around $158.74 million for private medical
homes and DPH. Since the DPH expenditure calculation includes reimbursement to non‐DPH HSF medical
home providers and to avoid potential double‐counting of expenditures, the net HSF expenditure for
private medical homes is applied in the tables to illustrate expenditures.
Table H1
Summary of Estimated System‐Wide FY2013‐14 HSF Expenditures (All HSF Providers)
Delivery System Estimated Cost
Total DPH HSF Expenditures $111,883,631
Private Provider Net HSF Expenditures $20,078,342
Non‐Profit Hospital Charity Care Expenditures $26,775,327
All HSF Provider Expenditures $158,737,300
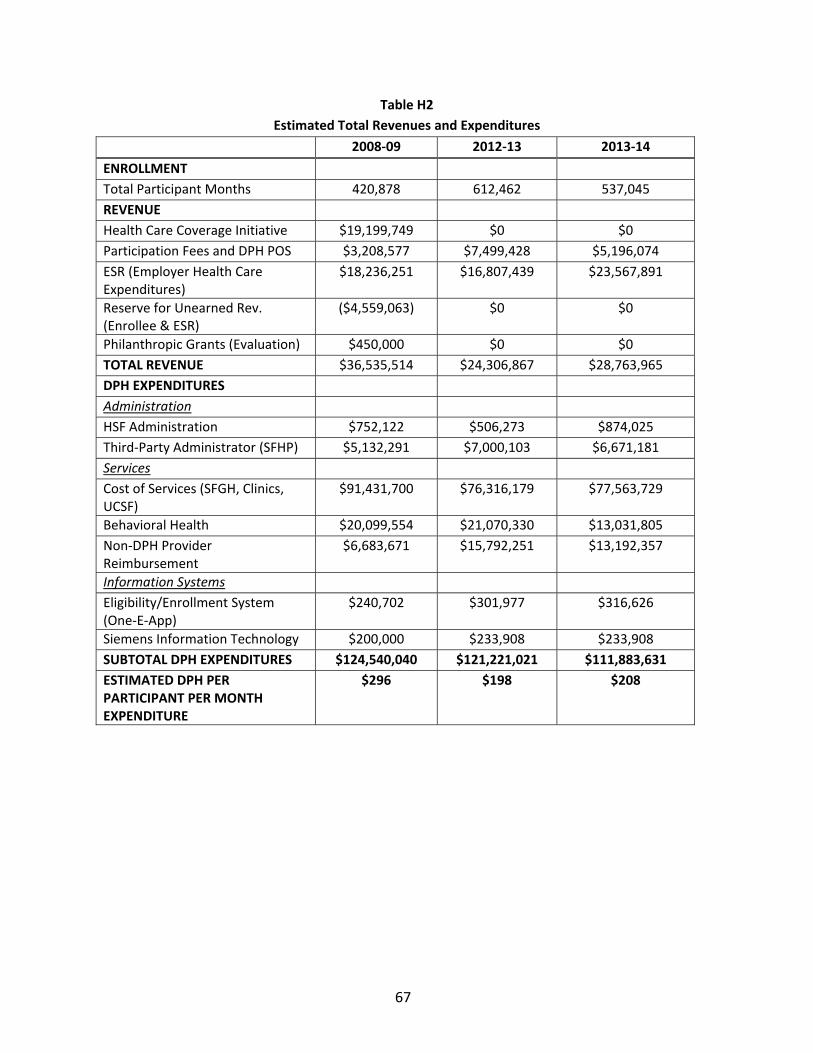
67
Table H2
Estimated Total Revenues and Expenditures
2008‐09 2012‐13 2013‐14
ENROLLMENT
Total Participant Months 420,878 612,462 537,045
REVENUE
Health Care Coverage Initiative $19,199,749 $0 $0
Participation Fees and DPH POS $3,208,577 $7,499,428 $5,196,074
ESR (Employer Health Care Expenditures)
$18,236,251 $16,807,439 $23,567,891
Reserve for Unearned Rev. (Enrollee & ESR)
($4,559,063) $0 $0
Philanthropic Grants (Evaluation) $450,000 $0 $0
TOTAL REVENUE $36,535,514 $24,306,867 $28,763,965
DPH EXPENDITURES
Administration
HSF Administration $752,122 $506,273 $874,025
Third‐Party Administrator (SFHP) $5,132,291 $7,000,103 $6,671,181
Services
Cost of Services (SFGH, Clinics, UCSF)
$91,431,700 $76,316,179 $77,563,729
Behavioral Health $20,099,554 $21,070,330 $13,031,805
Non‐DPH Provider Reimbursement
$6,683,671 $15,792,251 $13,192,357
Information Systems
Eligibility/Enrollment System (One‐E‐App)
$240,702 $301,977 $316,626
Siemens Information Technology $200,000 $233,908 $233,908
SUBTOTAL DPH EXPENDITURES $124,540,040 $121,221,021 $111,883,631
ESTIMATED DPH PER PARTICIPANT PER MONTH EXPENDITURE
$296 $198 $208
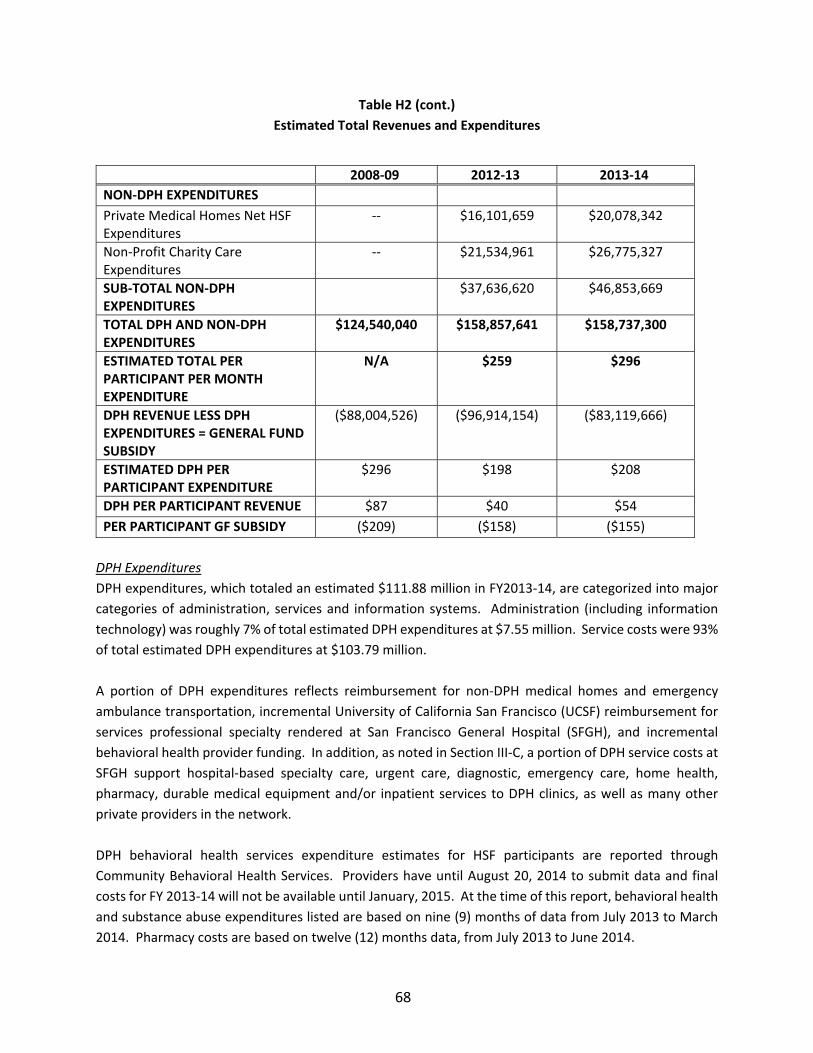
68
Table H2 (cont.)
Estimated Total Revenues and Expenditures
2008‐09 2012‐13 2013‐14
NON‐DPH EXPENDITURES
Private Medical Homes Net HSF Expenditures
‐‐ $16,101,659 $20,078,342
Non‐Profit Charity Care Expenditures
‐‐ $21,534,961 $26,775,327
SUB‐TOTAL NON‐DPH EXPENDITURES
$37,636,620 $46,853,669
TOTAL DPH AND NON‐DPH EXPENDITURES
$124,540,040 $158,857,641 $158,737,300
ESTIMATED TOTAL PER PARTICIPANT PER MONTH EXPENDITURE
N/A $259 $296
DPH REVENUE LESS DPH EXPENDITURES = GENERAL FUND SUBSIDY
($88,004,526) ($96,914,154) ($83,119,666)
ESTIMATED DPH PER PARTICIPANT EXPENDITURE
$296 $198 $208
DPH PER PARTICIPANT REVENUE $87 $40 $54
PER PARTICIPANT GF SUBSIDY ($209) ($158) ($155)
DPH Expenditures
DPH expenditures, which totaled an estimated $111.88 million in FY2013‐14, are categorized into major
categories of administration, services and information systems. Administration (including information
technology) was roughly 7% of total estimated DPH expenditures at $7.55 million. Service costs were 93%
of total estimated DPH expenditures at $103.79 million.
A portion of DPH expenditures reflects reimbursement for non‐DPH medical homes and emergency
ambulance transportation, incremental University of California San Francisco (UCSF) reimbursement for
services professional specialty rendered at San Francisco General Hospital (SFGH), and incremental
behavioral health provider funding. In addition, as noted in Section III‐C, a portion of DPH service costs at
SFGH support hospital‐based specialty care, urgent care, diagnostic, emergency care, home health,
pharmacy, durable medical equipment and/or inpatient services to DPH clinics, as well as many other
private providers in the network.
DPH behavioral health services expenditure estimates for HSF participants are reported through
Community Behavioral Health Services. Providers have until August 20, 2014 to submit data and final
costs for FY 2013‐14 will not be available until January, 2015. At the time of this report, behavioral health
and substance abuse expenditures listed are based on nine (9) months of data from July 2013 to March
2014. Pharmacy costs are based on twelve (12) months data, from July 2013 to June 2014.
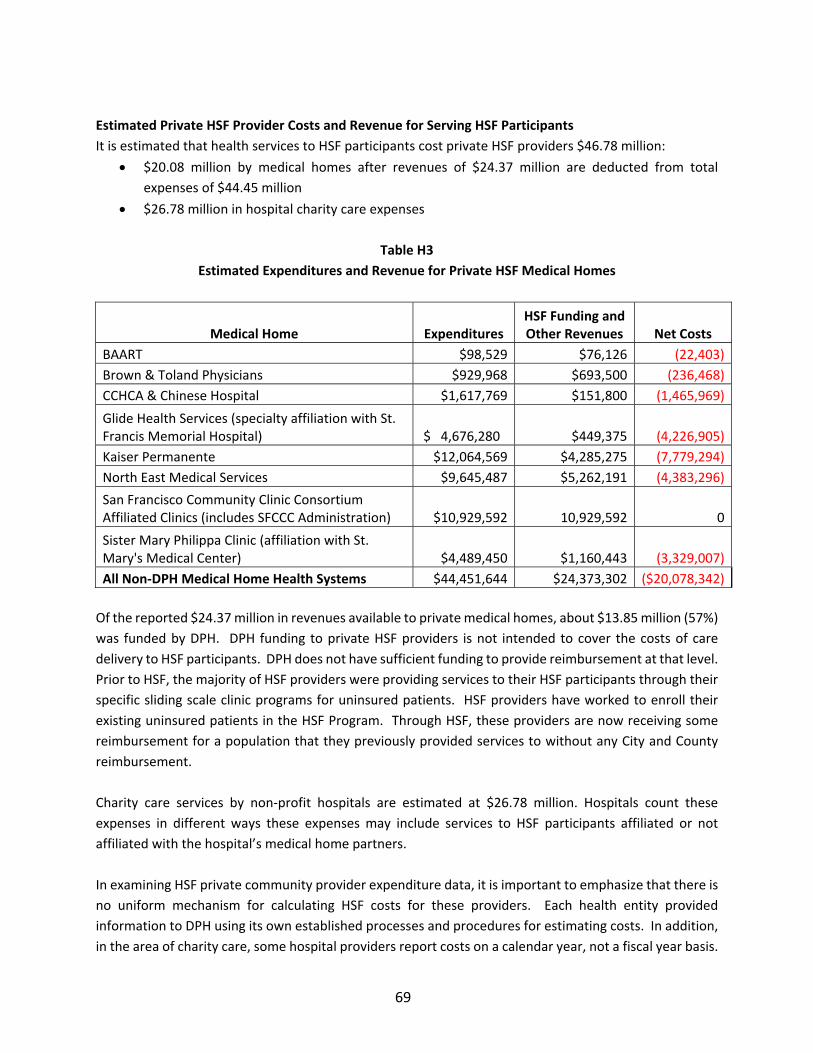
69
Estimated Private HSF Provider Costs and Revenue for Serving HSF Participants
It is estimated that health services to HSF participants cost private HSF providers $46.78 million:
$20.08 million by medical homes after revenues of $24.37 million are deducted from total
expenses of $44.45 million
$26.78 million in hospital charity care expenses
Table H3
Estimated Expenditures and Revenue for Private HSF Medical Homes
Medical Home Expenditures HSF Funding and Other Revenues Net Costs
BAART $98,529 $76,126 (22,403)
Brown & Toland Physicians $929,968 $693,500 (236,468)
CCHCA & Chinese Hospital $1,617,769 $151,800 (1,465,969)
Glide Health Services (specialty affiliation with St. Francis Memorial Hospital) $ 4,676,280 $449,375 (4,226,905)
Kaiser Permanente $12,064,569 $4,285,275 (7,779,294)
North East Medical Services $9,645,487 $5,262,191 (4,383,296)
San Francisco Community Clinic Consortium Affiliated Clinics (includes SFCCC Administration) $10,929,592 10,929,592 0
Sister Mary Philippa Clinic (affiliation with St. Mary's Medical Center) $4,489,450 $1,160,443 (3,329,007)
All Non‐DPH Medical Home Health Systems $44,451,644 $24,373,302 ($20,078,342)
Of the reported $24.37 million in revenues available to private medical homes, about $13.85 million (57%)
was funded by DPH. DPH funding to private HSF providers is not intended to cover the costs of care
delivery to HSF participants. DPH does not have sufficient funding to provide reimbursement at that level.
Prior to HSF, the majority of HSF providers were providing services to their HSF participants through their
specific sliding scale clinic programs for uninsured patients. HSF providers have worked to enroll their
existing uninsured patients in the HSF Program. Through HSF, these providers are now receiving some
reimbursement for a population that they previously provided services to without any City and County
reimbursement.
Charity care services by non‐profit hospitals are estimated at $26.78 million. Hospitals count these
expenses in different ways these expenses may include services to HSF participants affiliated or not
affiliated with the hospital’s medical home partners.
In examining HSF private community provider expenditure data, it is important to emphasize that there is
no uniform mechanism for calculating HSF costs for these providers. Each health entity provided
information to DPH using its own established processes and procedures for estimating costs. In addition,
in the area of charity care, some hospital providers report costs on a calendar year, not a fiscal year basis.
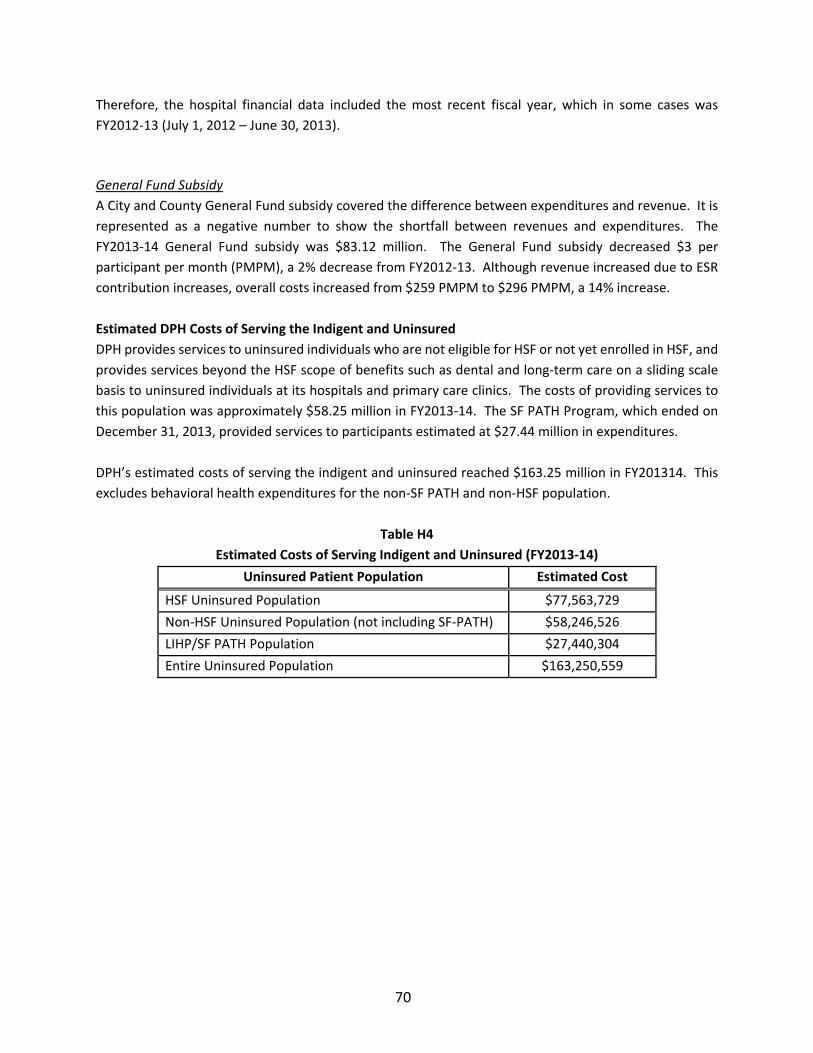
70
Therefore, the hospital financial data included the most recent fiscal year, which in some cases was
FY2012‐13 (July 1, 2012 – June 30, 2013).
General Fund Subsidy
A City and County General Fund subsidy covered the difference between expenditures and revenue. It is
represented as a negative number to show the shortfall between revenues and expenditures. The
FY2013‐14 General Fund subsidy was $83.12 million. The General Fund subsidy decreased $3 per
participant per month (PMPM), a 2% decrease from FY2012‐13. Although revenue increased due to ESR
contribution increases, overall costs increased from $259 PMPM to $296 PMPM, a 14% increase.
Estimated DPH Costs of Serving the Indigent and Uninsured
DPH provides services to uninsured individuals who are not eligible for HSF or not yet enrolled in HSF, and
provides services beyond the HSF scope of benefits such as dental and long‐term care on a sliding scale
basis to uninsured individuals at its hospitals and primary care clinics. The costs of providing services to
this population was approximately $58.25 million in FY2013‐14. The SF PATH Program, which ended on
December 31, 2013, provided services to participants estimated at $27.44 million in expenditures.
DPH’s estimated costs of serving the indigent and uninsured reached $163.25 million in FY201314. This
excludes behavioral health expenditures for the non‐SF PATH and non‐HSF population.
Table H4
Estimated Costs of Serving Indigent and Uninsured (FY2013‐14)
Uninsured Patient Population Estimated Cost
HSF Uninsured Population $77,563,729
Non‐HSF Uninsured Population (not including SF‐PATH) $58,246,526
LIHP/SF PATH Population $27,440,304
Entire Uninsured Population $163,250,559
71
IV. FY2014‐15 ANTICIPATED PROGRAM ACTIVITIES
During the next fiscal year, HSF will build on last year’s successful transition of participants to health
insurance options through the ACA. HSF will continue focusing on enrolling uninsured individuals in health
insurance.
DPH will propose several HSF and City Option Program policy changes for approval by the Health
Commission in October 2014. These changes are based on the 2013 Universal Healthcare Council (UHC)
Final Report and the June 2014 Board of Supervisors approved amendments to the Health Care Security
Ordinance (HCSO). These proposed changes are:
Remove HSF’s 65‐year‐old age limit
Participants who will be aging out of HSF (turning 65 years old) during the latter part of 2014 will be
informed of the opportunity to be eligible for HSF after January 1, 2015. The vast majority of participants
turning 65 will be eligible for either Medicare or Medi‐Cal (some will be eligible for both). However those
who are age 65 and older and who are ineligible for public coverage currently do not have a program that
offers comprehensive coordinated health care services. The UHC specifically requested to add this
population to those eligible for Healthy San Francisco. Consistent with current HSF eligibility, only those
seniors who are ineligible for Medi‐Cal or Medicare would be eligible for HSF. About 400 Healthy San
Francisco participants will turn 65 in 2015 and about 1,200 individuals in the city may be eligible for HSF
if the age limit is removed.
Decrease HSF’s income eligibility limit from 500% FPL to 400% FPL (does not apply to participants receiving
an employer contribution towards HSF participation)
The current income limit for HSF and public coverage (including subsidized coverage through
Covered California) are not aligned. This change will align the HSF income limit with that of
subsidies for Covered California. Individuals receiving an employer contribution will not be
affected by any income limit for participation in HSF. Currently less than 175 individuals are
affected by this policy change. Those individuals will be notified and provided with information
about their health insurance options such as Covered California.
Extend the HSF Transition Period until December 31, 2015
The current HSF Transition Period was established in response to barriers faced by San Franciscans during
the first Covered California Open Enrollment period. It also gave DPH an opportunity to explore options
to adequately address identified barriers. These options are to be researched under a plan to be brought
to the Health Commission in August 2015, which would help make Covered California more affordable for
eligible individuals who have an employer contribution under the Health Care Security Ordinance. The
extension of the HSF Transition Period through 2015 will provide residents who continue to face barriers
transitioning to ACA programs a health access program until that new proposed program is implemented
in 2016. Currently an estimated 4,500 HSF participants are eligible for this transition period. HSF will
72
counsel Transition Period participants about their health care coverage options. These participants will
be informed that HSF participation does not meet the federal individual mandate and that they may have
to pay a penalty for not having health insurance. The penalty for 2014 is 1% of household income or $95
per person. In 2015 the penalty increases to 2% of household income or $325 per person.
These HSF eligibility changes, if approved by the Health Commission will become effective January 1, 2015.
City Option Policy Change The City Option policy change is to streamline the process for transferring contributions from HSF to MRA,
including removing the requirement to show proof of program ineligibility. The City Option eligibility
changes are designed to facilitate employees who receive employer contributions through the program
to access and utilize those funds to purchase health insurance, including paying insurance premiums, co‐
payments, deductibles and so forth.
The City Option eligibility change is targeted for implementation on November 1, 2014.
Continue Transitioning Eligible Participants to ACA Options
Medical homes will be encouraged to continue as Certified Enrollment Entities and have Application
Assistors renew as Certified Enrollment Counselors. This will enable most HSF enrollment sites to continue
serving as a central place for health insurance information and enrollment for those who are eligible, and
for enrollment in HSF for those who are not eligible for insurance. HSF will continue to monitor dis‐
enrollments, outreach and educate individuals on available options.
HSF will focus on assisting participants to enroll in Covered California health insurance options during the
upcoming open enrollment from November 15, 2014 – February 15, 2015. HSF is again participating in
citywide communication efforts to educate San Franciscans about ACA health insurance options. This
includes continuing to encourage people to enroll and renew their Medi‐Cal coverage. It is critical for HSF
to clearly communicate expected program changes and the options available (including the Transition
Period) to participants and Application Assistors so that individuals can make an informed choice about
their health care options.
Maintain Medical Home Network
HSF will focus on maintaining the stability of the medical home network. HSF is able to offer participants
a choice of several providers throughout the city. This public‐private partnership of medical homes
provides participants options to access to healthcare. Maintaining such medical home options becomes
more challenging as some medical homes may be concerned about the financial risk of providing care to
a smaller and smaller number of participants due to ACA implementation.
While HSF continues to focus on transitioning eligible participants to new health insurance options, DPH
recognizes that San Franciscans who are not eligible for these new options will continue to rely on HSF for
their health care needs. In addition, the new options available remain unaffordable for many San
Franciscans. DPH will again explore ways to address these concerns in the upcoming year and HSF will

73
participate in these planning efforts. HSF will maintain fulfilling its mission of providing eligible San
Francisco residents with affordable health care options regardless of immigration status, employment, or
pre‐existing conditions. HSF will remain a solid support for uninsured San Franciscans who need assistance
in obtaining health care services, working to find the right option for each individual.
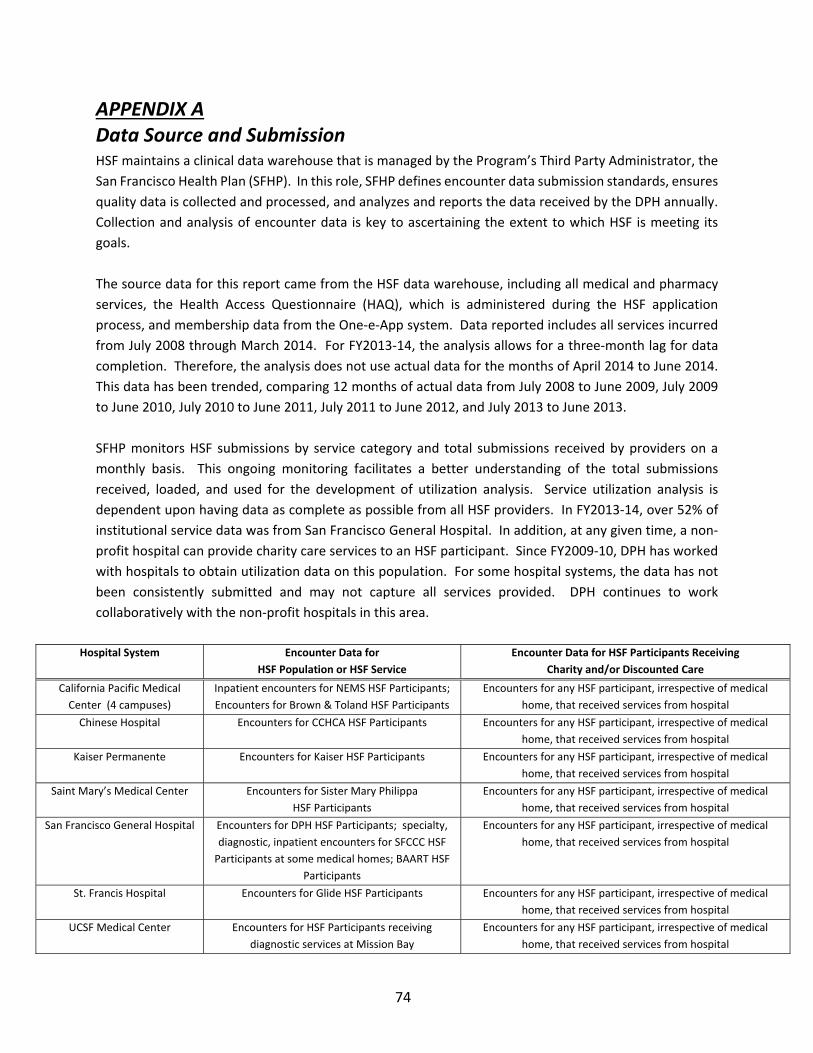
74
APPENDIX A Data Source and Submission HSF maintains a clinical data warehouse that is managed by the Program’s Third Party Administrator, the
San Francisco Health Plan (SFHP). In this role, SFHP defines encounter data submission standards, ensures
quality data is collected and processed, and analyzes and reports the data received by the DPH annually.
Collection and analysis of encounter data is key to ascertaining the extent to which HSF is meeting its
goals.
The source data for this report came from the HSF data warehouse, including all medical and pharmacy
services, the Health Access Questionnaire (HAQ), which is administered during the HSF application
process, and membership data from the One‐e‐App system. Data reported includes all services incurred
from July 2008 through March 2014. For FY2013‐14, the analysis allows for a three‐month lag for data
completion. Therefore, the analysis does not use actual data for the months of April 2014 to June 2014.
This data has been trended, comparing 12 months of actual data from July 2008 to June 2009, July 2009
to June 2010, July 2010 to June 2011, July 2011 to June 2012, and July 2013 to June 2013.
SFHP monitors HSF submissions by service category and total submissions received by providers on a
monthly basis. This ongoing monitoring facilitates a better understanding of the total submissions
received, loaded, and used for the development of utilization analysis. Service utilization analysis is
dependent upon having data as complete as possible from all HSF providers. In FY2013‐14, over 52% of
institutional service data was from San Francisco General Hospital. In addition, at any given time, a non‐
profit hospital can provide charity care services to an HSF participant. Since FY2009‐10, DPH has worked
with hospitals to obtain utilization data on this population. For some hospital systems, the data has not
been consistently submitted and may not capture all services provided. DPH continues to work
collaboratively with the non‐profit hospitals in this area.
Hospital System Encounter Data for
HSF Population or HSF Service
Encounter Data for HSF Participants Receiving
Charity and/or Discounted Care
California Pacific Medical
Center (4 campuses)
Inpatient encounters for NEMS HSF Participants;
Encounters for Brown & Toland HSF Participants
Encounters for any HSF participant, irrespective of medical
home, that received services from hospital
Chinese Hospital Encounters for CCHCA HSF Participants Encounters for any HSF participant, irrespective of medical
home, that received services from hospital
Kaiser Permanente Encounters for Kaiser HSF Participants Encounters for any HSF participant, irrespective of medical
home, that received services from hospital
Saint Mary’s Medical Center Encounters for Sister Mary Philippa
HSF Participants
Encounters for any HSF participant, irrespective of medical
home, that received services from hospital
San Francisco General Hospital Encounters for DPH HSF Participants; specialty,
diagnostic, inpatient encounters for SFCCC HSF
Participants at some medical homes; BAART HSF
Participants
Encounters for any HSF participant, irrespective of medical
home, that received services from hospital
St. Francis Hospital Encounters for Glide HSF Participants Encounters for any HSF participant, irrespective of medical
home, that received services from hospital
UCSF Medical Center Encounters for HSF Participants receiving
diagnostic services at Mission Bay
Encounters for any HSF participant, irrespective of medical
home, that received services from hospital

75
APPENDIX B Summary of FY2013‐14 Health Access Questionnaire Responses
(New Applicants and Continuing Participants) The 33,795 questionnaires were administered to 33,397 participants:
33,301 participants took the survey only one time during the year,
394 participants took the survey twice during the year (i.e. new applicant who renewed eligibility before the end of his/her 12‐month term)
2 participants took the survey three times (likely due to dis‐enrollment and re‐enrollment)
No. Question Key FY2013‐14
Responses
Key FY2012‐13
Responses
Key FY2011‐12
Responses
Key FY2010‐11
Responses
Key FY2009‐10
Responses
Key FY2008‐09
Responses
1 Would you say that
in general your
health is excellent,
very good, fair, or
poor?
62% of all
respondents
indicated their health
was Excellent, Very
Good, or Good.
64% of all
respondents
indicated their health
was Excellent, Very
Good, or Good.
64% of all
respondents
indicated their health
was Excellent, Very
Good, or Good.
58% of all
respondents
indicated their health
was Excellent, Very
Good, or Good.
52% of all respondents
indicated their health
was Excellent, Very
Good, or Good.
58% of all
respondents
indicated their health
was Excellent, Very
Good, or Good.
2 During the past 12
months, was there
any time you had no
health insurance at
all?
33% of all
respondents
indicated that they
did not have health
insurance for some
time in the past 12
months
46% of all
respondents
indicated that they
did not have health
insurance for some
time in the past 12
months
48% of all
respondents
indicated that they
did not have health
insurance for some
time in the past 12
months.
49% of all
respondents
indicated that they
did not have health
insurance for some
time in the past 12
months.
53% of all respondents
indicated that they did
not have health
insurance for some
time in the past 12
months.
53% of all
respondents
indicated that they
did not have health
insurance for some
time in the past 12
months.
3 What is the main
reason why you did
not have health
insurance?
The most common
reason notes was
“enrollment in HSF”
36% cited HSF as the
reason they did not
have health
insurance
The most common
reason notes was
“enrollment in HSF”
36% cited HSF as the
reason they did not
have health
insurance
The most common
reason noted was
“enrollment in HSF.”
33% cited HSF as the
reason they did not
have health
insurance.
The most common
reason noted was
“enrollment in HSF.”
29% cited HSF as the
reason they did not
have health
insurance.
The most common
reason noted was
“cost of health
insurance and/or co‐
payments.” 27% cited
it as the reason they
did not have health
insurance.
The most common
reason noted was
“cost of health
insurance and/or co‐
payments.” 20%
cited it as the reason
they did not have
health insurance.
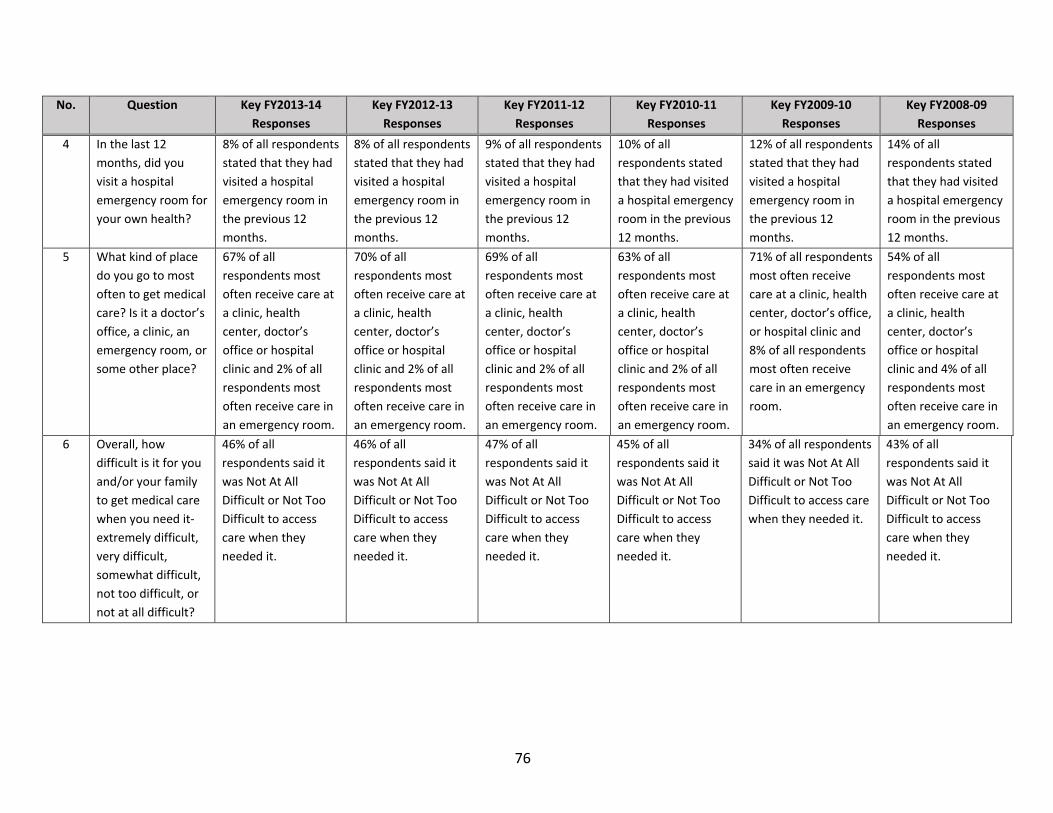
76
No. Question Key FY2013‐14
Responses
Key FY2012‐13
Responses
Key FY2011‐12
Responses
Key FY2010‐11
Responses
Key FY2009‐10
Responses
Key FY2008‐09
Responses
4 In the last 12
months, did you
visit a hospital
emergency room for
your own health?
8% of all respondents
stated that they had
visited a hospital
emergency room in
the previous 12
months.
8% of all respondents
stated that they had
visited a hospital
emergency room in
the previous 12
months.
9% of all respondents
stated that they had
visited a hospital
emergency room in
the previous 12
months.
10% of all
respondents stated
that they had visited
a hospital emergency
room in the previous
12 months.
12% of all respondents
stated that they had
visited a hospital
emergency room in
the previous 12
months.
14% of all
respondents stated
that they had visited
a hospital emergency
room in the previous
12 months.
5 What kind of place
do you go to most
often to get medical
care? Is it a doctor’s
office, a clinic, an
emergency room, or
some other place?
67% of all
respondents most
often receive care at
a clinic, health
center, doctor’s
office or hospital
clinic and 2% of all
respondents most
often receive care in
an emergency room.
70% of all
respondents most
often receive care at
a clinic, health
center, doctor’s
office or hospital
clinic and 2% of all
respondents most
often receive care in
an emergency room.
69% of all
respondents most
often receive care at
a clinic, health
center, doctor’s
office or hospital
clinic and 2% of all
respondents most
often receive care in
an emergency room.
63% of all
respondents most
often receive care at
a clinic, health
center, doctor’s
office or hospital
clinic and 2% of all
respondents most
often receive care in
an emergency room.
71% of all respondents
most often receive
care at a clinic, health
center, doctor’s office,
or hospital clinic and
8% of all respondents
most often receive
care in an emergency
room.
54% of all
respondents most
often receive care at
a clinic, health
center, doctor’s
office or hospital
clinic and 4% of all
respondents most
often receive care in
an emergency room.
6 Overall, how
difficult is it for you
and/or your family
to get medical care
when you need it‐
extremely difficult,
very difficult,
somewhat difficult,
not too difficult, or
not at all difficult?
46% of all
respondents said it
was Not At All
Difficult or Not Too
Difficult to access
care when they
needed it.
46% of all
respondents said it
was Not At All
Difficult or Not Too
Difficult to access
care when they
needed it.
47% of all
respondents said it
was Not At All
Difficult or Not Too
Difficult to access
care when they
needed it.
45% of all
respondents said it
was Not At All
Difficult or Not Too
Difficult to access
care when they
needed it.
34% of all respondents
said it was Not At All
Difficult or Not Too
Difficult to access care
when they needed it.
43% of all
respondents said it
was Not At All
Difficult or Not Too
Difficult to access
care when they
needed it.
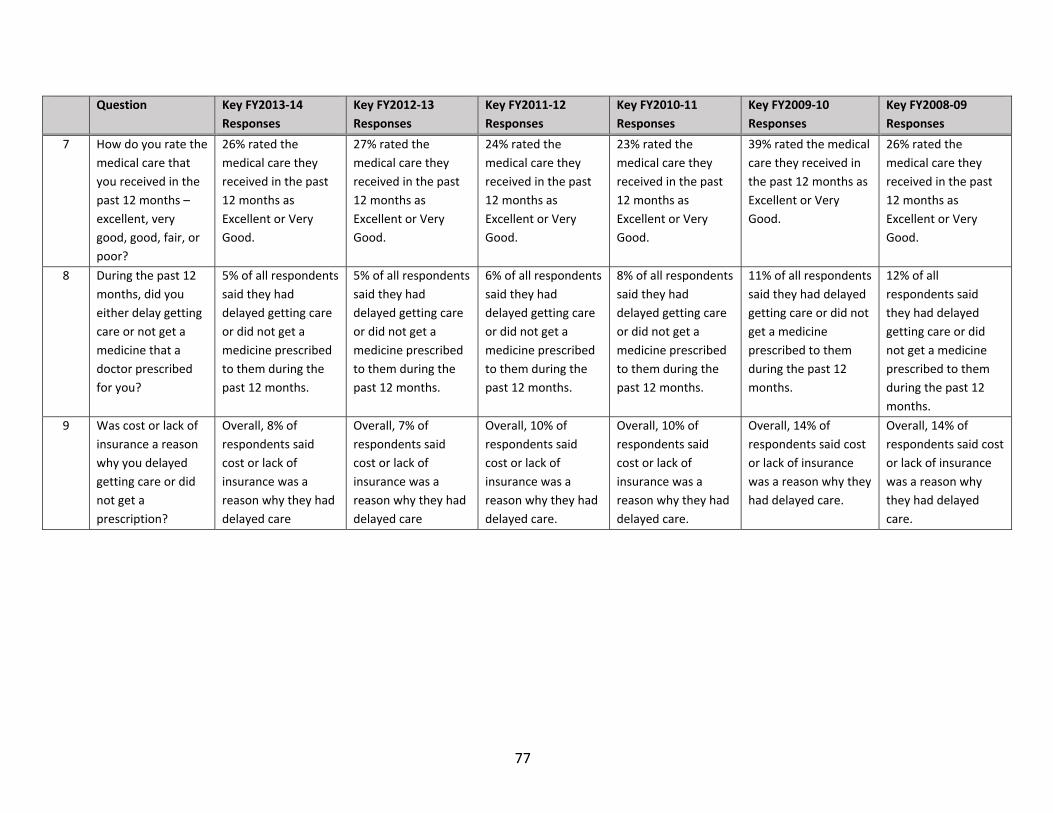
77
Question Key FY2013‐14
Responses
Key FY2012‐13
Responses
Key FY2011‐12
Responses
Key FY2010‐11
Responses
Key FY2009‐10
Responses
Key FY2008‐09
Responses
7 How do you rate the
medical care that
you received in the
past 12 months –
excellent, very
good, good, fair, or
poor?
26% rated the
medical care they
received in the past
12 months as
Excellent or Very
Good.
27% rated the
medical care they
received in the past
12 months as
Excellent or Very
Good.
24% rated the
medical care they
received in the past
12 months as
Excellent or Very
Good.
23% rated the
medical care they
received in the past
12 months as
Excellent or Very
Good.
39% rated the medical
care they received in
the past 12 months as
Excellent or Very
Good.
26% rated the
medical care they
received in the past
12 months as
Excellent or Very
Good.
8 During the past 12
months, did you
either delay getting
care or not get a
medicine that a
doctor prescribed
for you?
5% of all respondents
said they had
delayed getting care
or did not get a
medicine prescribed
to them during the
past 12 months.
5% of all respondents
said they had
delayed getting care
or did not get a
medicine prescribed
to them during the
past 12 months.
6% of all respondents
said they had
delayed getting care
or did not get a
medicine prescribed
to them during the
past 12 months.
8% of all respondents
said they had
delayed getting care
or did not get a
medicine prescribed
to them during the
past 12 months.
11% of all respondents
said they had delayed
getting care or did not
get a medicine
prescribed to them
during the past 12
months.
12% of all
respondents said
they had delayed
getting care or did
not get a medicine
prescribed to them
during the past 12
months.
9 Was cost or lack of
insurance a reason
why you delayed
getting care or did
not get a
prescription?
Overall, 8% of
respondents said
cost or lack of
insurance was a
reason why they had
delayed care
Overall, 7% of
respondents said
cost or lack of
insurance was a
reason why they had
delayed care
Overall, 10% of
respondents said
cost or lack of
insurance was a
reason why they had
delayed care.
Overall, 10% of
respondents said
cost or lack of
insurance was a
reason why they had
delayed care.
Overall, 14% of
respondents said cost
or lack of insurance
was a reason why they
had delayed care.
Overall, 14% of
respondents said cost
or lack of insurance
was a reason why
they had delayed
care.
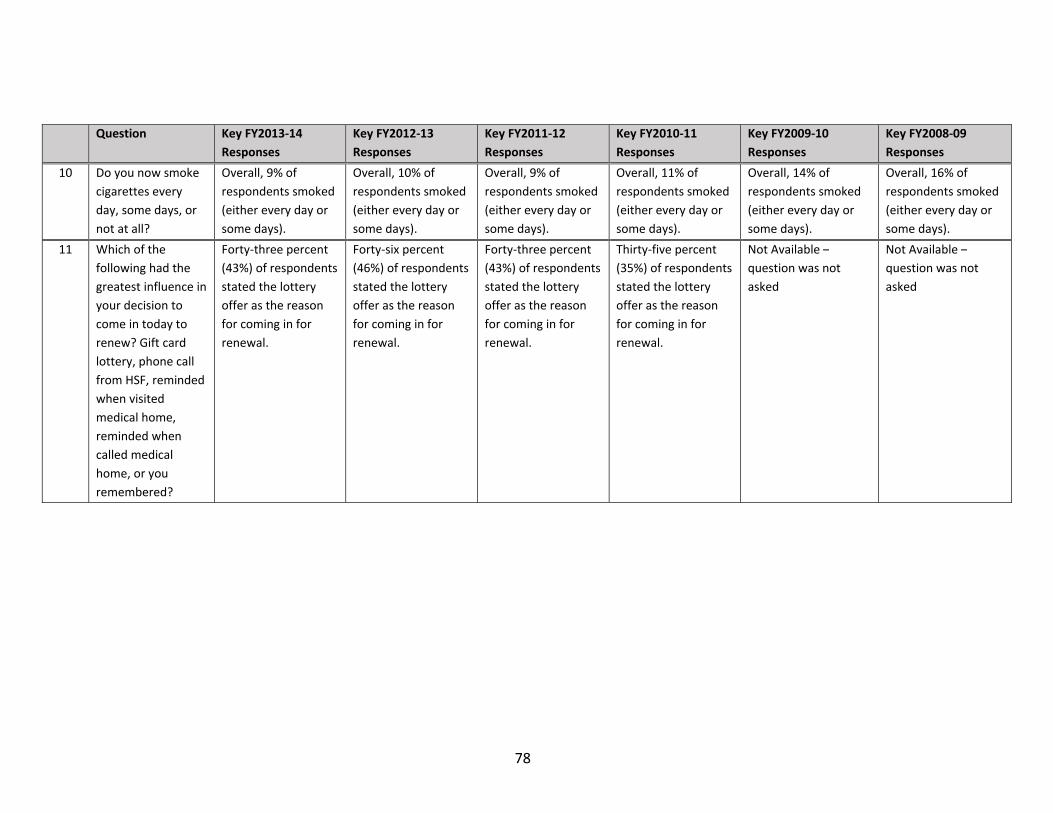
78
Question Key FY2013‐14
Responses
Key FY2012‐13
Responses
Key FY2011‐12
Responses
Key FY2010‐11
Responses
Key FY2009‐10
Responses
Key FY2008‐09
Responses
10 Do you now smoke
cigarettes every
day, some days, or
not at all?
Overall, 9% of
respondents smoked
(either every day or
some days).
Overall, 10% of
respondents smoked
(either every day or
some days).
Overall, 9% of
respondents smoked
(either every day or
some days).
Overall, 11% of
respondents smoked
(either every day or
some days).
Overall, 14% of
respondents smoked
(either every day or
some days).
Overall, 16% of
respondents smoked
(either every day or
some days).
11 Which of the
following had the
greatest influence in
your decision to
come in today to
renew? Gift card
lottery, phone call
from HSF, reminded
when visited
medical home,
reminded when
called medical
home, or you
remembered?
Forty‐three percent
(43%) of respondents
stated the lottery
offer as the reason
for coming in for
renewal.
Forty‐six percent
(46%) of respondents
stated the lottery
offer as the reason
for coming in for
renewal.
Forty‐three percent
(43%) of respondents
stated the lottery
offer as the reason
for coming in for
renewal.
Thirty‐five percent
(35%) of respondents
stated the lottery
offer as the reason
for coming in for
renewal.
Not Available –
question was not
asked
Not Available –
question was not
asked