Embed Size (px)
Citation preview

1 of 16
MARKET SCENARIOS Nov 22nd 2016
10° Convegno Sezione Logistica, Trasporti e Spedizioni
San Donato Milanese, 22 Novembre 2016Crowne Plaza Hotel
Giacomo Franchini, Director, SupplHi
Market scenarios
Sezione Logistica, Trasporti e Spedizioni

2 of 16
MARKET SCENARIOS Nov 22nd 2016
Oil prices fall starting in 3Q14
Brent quarterly average price per barrel
OIL&GAS
Note: LLS = Louisiana Light Sweet, WTI = West Texas Intermediate
Source: IHS

3 of 16
MARKET SCENARIOS Nov 22nd 2016
A gradual increase to ~70/80 $/bbl is expected
Brent annual forecast
OIL&GAS
Source: Bloomberg, Barclays Research (September 2016)
4 of 16
MARKET SCENARIOS Nov 22nd 2016
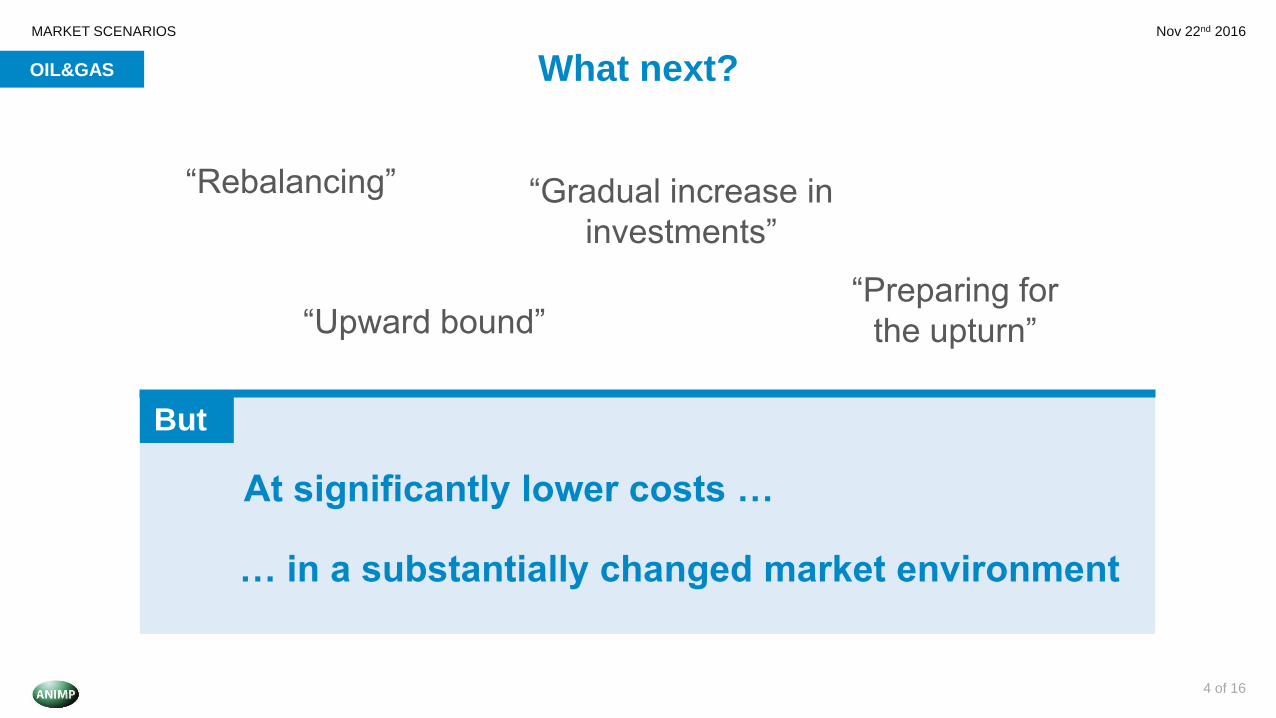
“Rebalancing” “Gradual increase in
investments”
“Upward bound”“Preparing for
the upturn”
But
At significantly lower costs …
… in a substantially changed market environment
OIL&GAS What next?

5 of 16
MARKET SCENARIOS Nov 22nd 2016
Depletion requires new investments to maintain production
-
Depletion of producing and under development fields (MBPD)
OIL&GAS
Source: IEA, Rystad Energy, Morgan Stanley Research June 2016

6 of 16
MARKET SCENARIOS Nov 22nd 2016
• An 18-22 % cost deflation has materialized by
2016, but there are inflationary pressures for
costs to rise again by the end of decade
• Further supply chain savings based on
‘squeezing’ the service sector are possible,
but probably limited
• Major structural supply chain improvements are needed to:
o Lower costs further
o Improve reliability and quality and reduce risk
End-Users
challenge:
>30%
reduction
The new projects requirea drastic cost-reductions
OIL&GAS

7 of 16
MARKET SCENARIOS Nov 22nd 2016
North America to be the top project destinationOIL&GAS
Global Oil&Gas CAPEX for Top 12 Countries, 2016-2018 (%)
UPSTREAM
MIDSTREAM
DOWNSTREAMNote: CAPEX is expressed as a % of the total weighted CAPEX of all projects currently Planned or Ongoing
Source: SupplHi Projects Database, November 2016

8 of 16
MARKET SCENARIOS Nov 22nd 2016
2017 as a transition year ILLUSTRATIVE
Expected backlog evolution
2015 2016 2017 2018 2019
EPC
CONTRACTORS
COMPONENTS
MANUFACTURERS
& SERVICE PROVIDERS
?Backlog sustained by diversification in
other industries Average of 6/9 months lead
time for contract awards between EPC and supply
OIL&GAS
Source: SupplHi analysis

9 of 16
MARKET SCENARIOS Nov 22nd 2016
Origins of the complex equipment to remain stable
• Relative stability is
expected in the
geographical distribution of
Vendors of engineered
equipment
• Potential protectionist
trends as well as Local
Content in the coming
years should not strongly
impact the
technologically driven
equipment
Volume for the Energy industry (Oil&Gas + Power), % based on equipment sales, 2013-2015
Source: SupplHi analysis

10 of 16
MARKET SCENARIOS Nov 22nd 2016
Beyond Oil&Gas
Note: the size of the bubbles is proportional to the estimated value of the global CAPEX annual expenditure related to external goods and services; Oil&Gas Upstream excludes exploration and drilling
Source: SupplHi analysis on public data, SupplHi Projects Database
DIRECTIONAL
OIL&GASUPSTREAM
OIL&GASDOWNSTREAM
SHIPBUILDING
MINING
CHEMICALS
POWER RENEWABLES
STEEL& METALS
OIL&GASMIDSTREAM
WATERRAILWAYS AND MASS
TRANSPORT

11 of 16
MARKET SCENARIOS Nov 22nd 2016
Installed Capacity to grow at 3% CAGR between 2015 and 2020
Power installed Capacity by Fuel (GWe)
COAL
OIL
GAS
NUCLEAR
HYDRO
WIND
SOLAR PV
OTHER REN.
3%CAGR
Electricity demand drivers
POPULATION
INCREASE
GDP TREND
ENVIRONMENTAL &
ENERGY POLICIES
FUEL ENERGY PRICE
POWER
Source: Frost & Sullivan

12 of 16
MARKET SCENARIOS Nov 22nd 2016
KEY GROWTH COUNTRIES WHOSE RISING POPULATIONS AND LIVING STANDARDS WILL DRIVE STRONG
INCREASES IN ENERGY DEMAND ARE CHINA, MEXICO, NIGERIA, IRAN, THAILAND AND INDONESIA
Population and GDP growth 2015-2020
EUROPE
AFRICALATIN AMERICA
CIS
MIDDLE EASTNORTH AMERICA
APAC
+50 M Population
+$1 Trillion GDP
Large majority of population increase will occur in developing countries
POWER
Source: United Nations, ExxonMobil
13 of 16
MARKET SCENARIOS Nov 22nd 2016
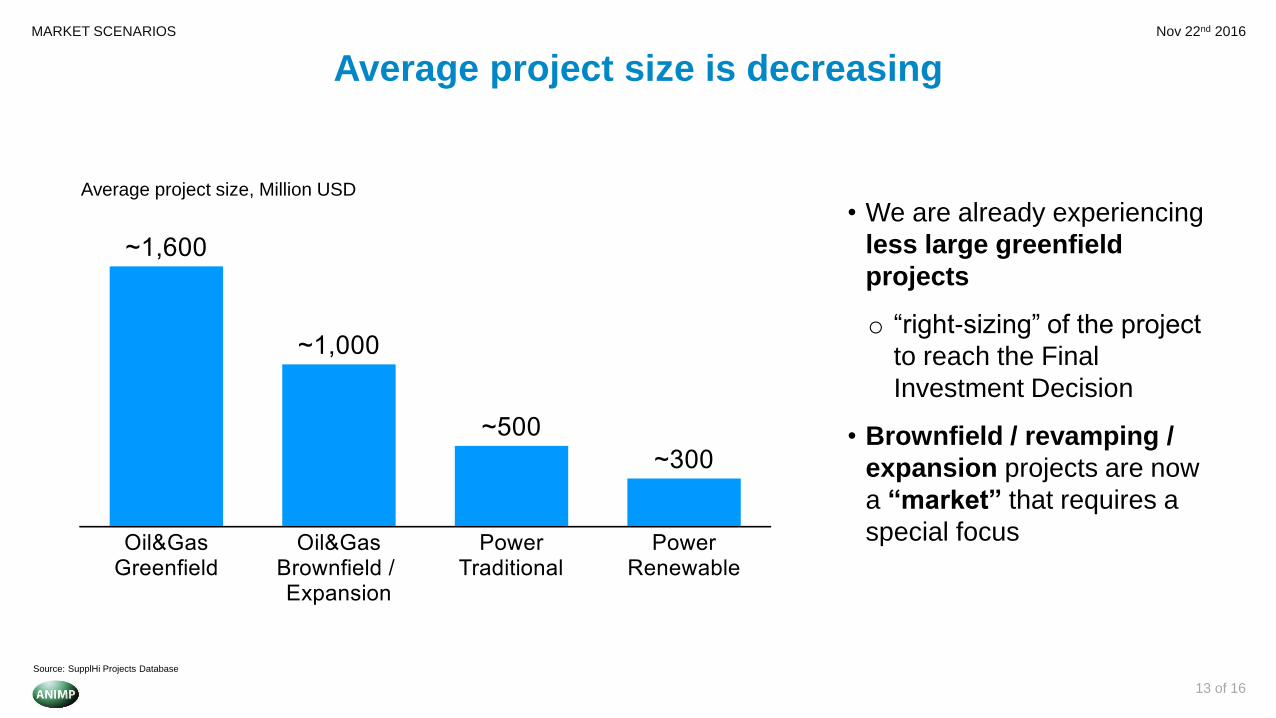
Average project size is decreasing
• We are already experiencing
less large greenfield
projects
o “right-sizing” of the project
to reach the Final
Investment Decision
• Brownfield / revamping /
expansion projects are now
a “market” that requires a
special focus
Average project size, Million USD
Source: SupplHi Projects Database

14 of 16
MARKET SCENARIOS Nov 22nd 2016
Just the tip of the iceberg
NEW TECHNOLOGIES WILL SUPPORT VALUE CREATION IN LOGISTICS
• DATA ANALYSIS (IoT, AI, …), AUTOMATION (handling robots, drones, 3D printing, …) andCONNECTIVITY (wearables, real-time tracking, marketplaces, …)
− e.g. cost reduction in inventory management through Artificial Intelligence, virtual warehouses, …
• Required strong proximity with the asset owners (plants, vessels, trucks, …)
• What we see in the Logistics market today are the traditional services for Project Logistics and the Contract Logistics outsourced
• Growing focus on Special Cargo
OUTSOURCED
currently INSOURCED

15 of 16
MARKET SCENARIOS Nov 22nd 2016
Thank you for your attention
Giacomo Franchini
Director
+44 [0]7756 679706 | +39 348 9201904
—
SupplHi LTD
Registered in England and Wales No. 09449047
35 Kingsland Road | London E2 8AA | United Kingdom
www.supplhi.com

16 of 16
MARKET SCENARIOS Nov 22nd 2016
ANIMP and the Authors hereby declare and stress that the scope of this work must not be deemed and/or construed
by the readers as the proved outlook of the future market evolution, which remains subject to unforeseeable events
beyond ANIMP and the Authors control.
ANIMP and the Authors put great effort into providing the consolidated information received regarding the subject
market, as made available by the Companies which in fact provided such information and ANIMP and the Authors
cannot nor shall not be held liable in anyway for the content provided in this document.
ANIMP and the Authors hereby accept no liability whatsoever for any and all misrepresentation that the Companies
might have made of their data, products or business information, as well as for any and all misrepresentation and
assumption that readers may make and which shall remain subject to their own whole autonomy and internal corporate
governance procedures.
Considering the cultural divulging nature of this work, ANIMP and the Authors shall not be liable for any direct and/or
indirect or consequential damages of any nature such as, but not limited to, loss of revenue, profit and/or
anticipated profit, production and/or product, productivity and/or facility downtime, business opportunity, whether
by way of indemnity or in contract or in tort (including negligence) or under any I. P. and Confidentiality and/or
other Laws.
ANIMP and the Authors suggest to use this information wisely.
Disclaimer