Embed Size (px)
Citation preview

11
San Diego Basin Study Final Presentation
San Diego IRWM RAC Meeting August 7, 2019

22
Agenda• Study Purpose and Background• Impacts Assessment• Trade-off Analysis• Key Findings

33
San Diego Basin Study Objectives
1. Determine how climate change will impact the water supply system
2. Develop structural and non-structural adaptation strategies to manage climate change impacts

44
San Diego Basin Study Overview
• Project time frame April 2015 – September 2019• Total project cost $2.1 million
– $1 M Bureau of Reclamation– $759,460 SD IRWM Program Prop 50– $300,000 City of San Diego
• Project managed by the Bureau of Reclamation and City of San Diego

55
San Diego Basin Study Participants• Project Management
– Reclamation Southern California Area Office– City of San Diego
• Technical Team– Reclamation Lower Colorado Region Engineering Services Office– Reclamation Denver Technical Services Center– Reclamation Mid-Pacific Region Planning Group– City of San Diego– San Diego County Water Authority– CH2M/Jacobs
• Study Technical Advisory Committee (STAC)• Public Stakeholders
– IRWM RAC– IRWM Stakeholder List

66
San Diego Basin Study Tasks & StatusWater Supply
and Water Demand
Projections (Task 2.1)
Downscaled Climate
Change and Hydrologic Modeling (Task 2.2)
Existing Structural
Response and Operations Guidelines
Analysis (Task 2.3)
Structural and Operations Concepts (Task 2.4)
Trade-Off Analysis and Opportunities
(Task 2.5)
Final Report and Executive Summary Report (Task 2.6)
Complete Report & Submit for Approval August 2019
Final reports can be found at: https://www.usbr.gov/lc/socal/basinstudies/SDBasin.html

77
Planning for the Future• Basin Study Motivation: Complexities + Demands + Climate Change
• Do Nothing (Baseline) → Negative Consequences– Increased water shortages
• Do Something → Reduced Impacts– Questions/Constraints
• Cost• Complexity of implementation• Effects on environment, community• Effects on other aspects of water system (flooding, recreation, energy)
• Basin Study Findings– Strengths and weaknesses of various approaches– Diverse supply options can put the region on a positive path to the
future

88
Study Area: Many Complexities

99
Climate Change
Mean changes in temperature and precipitation for all RCPs and models
2020s 2050sRCP 4.5 RCP 8.5 RCP 4.5 RCP 8.5
Median Temp. +1.5°F to +1.8°F +1.8°F to +1.9°F +3°F to +3.4°F +4.2°F to +4.5°FMedian Precip. + 2% to +8% + 1% to +8 % 0% to +10% 0% to +12%
Hot-Dry
Warm-Dry Warm-Wet
Hot-Wet
Central Tendency
Hot-Dry
Warm-Dry Warm-Wet
Hot-Wet
Central Tendency

1010
Water Demands

1111
Concepts for Water Supply/ Water Management• Conveyance Improvement• Drought Restriction/Allocation*• Enhanced Conservation• Firm Water Supply Agreements*• Gray Water Use• Groundwater• Imported Water Purchases• Local Surface Water Reservoirs*• Potable Reuse• Recycled Water• Seawater Desalination• Stormwater BMPs• Stormwater Capture• Urban and Agricultural Water Use Efficiency• Watershed and Ecosystem Management
*Baseline Concept: Only analyzed in Impacts Assessment

1212
Impacts Assessment Process1. Simulate system
operations with varying:a) Demand and Climate
scenariosb) Portfolios of Water
Supplies/Water Management Strategies
2. Compare metrics across Scenarios and Portfolios

1313
SDBS Demand and Climate Scenarios2015 Demands
2050 Demands
2025 Demands
+
+
+

1414
Impacts Assessment Portfolios
Portfolios• Baseline (B)• Baseline Plus (B+)• Increase Supplies (IS)• Enhanced
Conservation (EC)• Optimize Existing
Facilities (OEF)• Watershed Health and
Ecosystem Restoration (WE)

1515
EnergyFlood Control
Impacts Assessment Metrics
Water DeliveryRecreation
1616
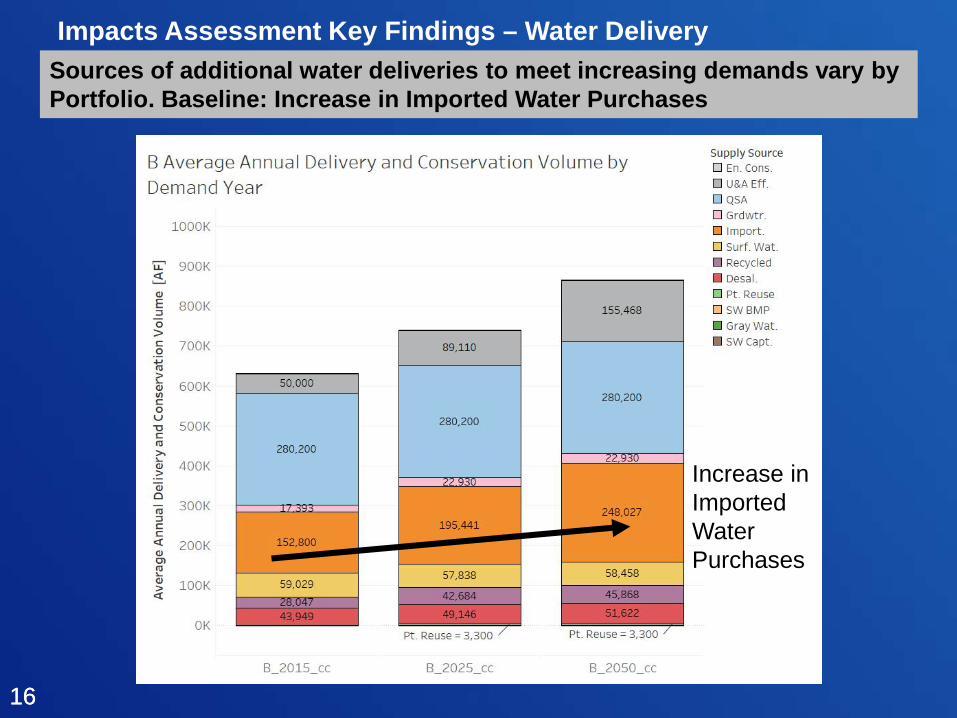
Sources of additional water deliveries to meet increasing demands vary by Portfolio. Baseline: Increase in Imported Water Purchases
Impacts Assessment Key Findings – Water Delivery
Increase in Imported Water Purchases

1717
Sources of additional water deliveries to meet increasing demands vary by Portfolio. Baseline+: Increase in Surface Water and Potable Reuse
Impacts Assessment Key Findings – Water Delivery
Increase in Surface Water
Increase in Potable Reuse

1818
Sources of additional water deliveries to meet increasing demands vary by Portfolio. EC: Demand reduction by conservation
Impacts Assessment Key Findings – Water Delivery
Reduction in demands due to Conservation

1919
Sources of additional water deliveries to meet increasing demands vary by Portfolio IS Deliveries: Increase in Potable Reuse & Desalination
Impacts Assessment Key Findings – Water Delivery
Increase in Desalination
Increase in Potable Reuse

2020
Impacts Assessment Key Findings – Water Delivery• Shortages occurred in all Portfolios for some scenarios• Largest shortages in B, Smallest in EC• No shortages above shortage threshold in EC or IS
28% of shortages above
threshold for mitigation
0% of shortages
above threshold for
mitigation
Baseline Enhanced Conservation

2121
Highest consumption in B, lowest in EC
Impacts Assessment Key Findings – Energy
Enhanced Conservation
Baseline

2222
Impacts Assessment Key Findings – Recreation• Boat ramps generally available at Hodges and San Vicente• Boat ramps frequently inaccessible at El Capitan, except in OEF • Boat ramp accessibility improved at Lower Otay for all Portfolios
beyond B
Baseline: Many days with Inaccessible Boat Ramps
Boat Ramp Accessibility Improved
in All Portfolios
2323
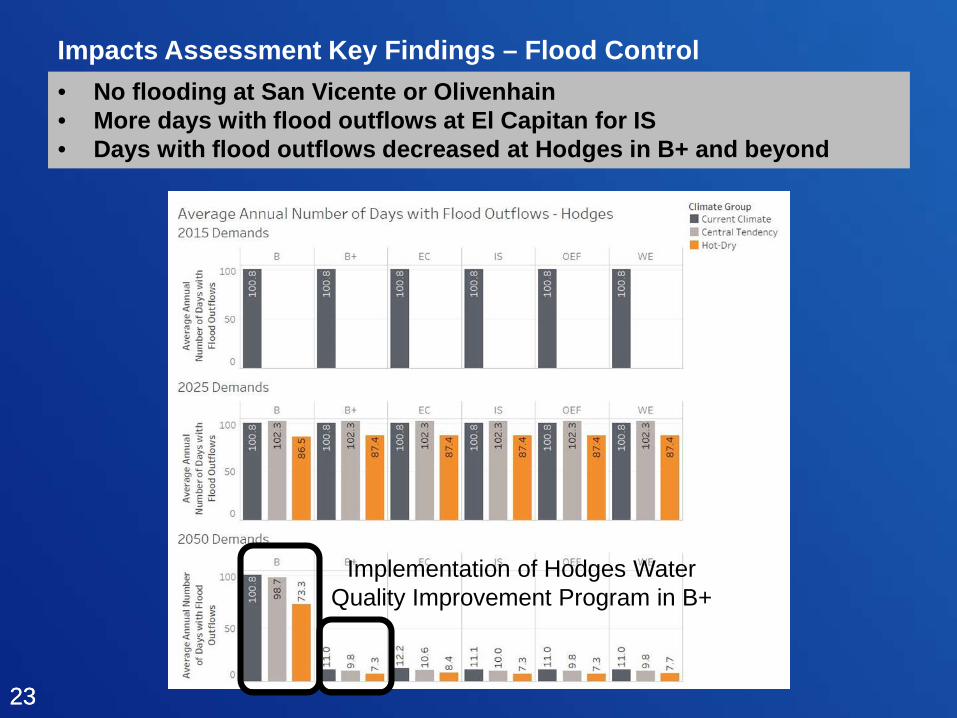
Impacts Assessment Key Findings – Flood Control• No flooding at San Vicente or Olivenhain• More days with flood outflows at El Capitan for IS• Days with flood outflows decreased at Hodges in B+ and beyond
Implementation of Hodges Water Quality Improvement Program in B+

2424
Trade-Off Analysis: Comparing ConceptsThe Challenge:
– Each Concept has a variety of benefits and costs – Benefits and costs may be
• direct and/or indirect • inside and/or outside the project area• quantifiable and can be monetized
OR• quantifiable but cannot be monetized
OR• unquantifiable and cannot be monetized.
The Need: A framework for comparing benefits and costs on a “level playing field”
The Solution: Trade-Off Analysis - provides a framework for comparing the effects of Concepts across different types of benefits and costs
2525
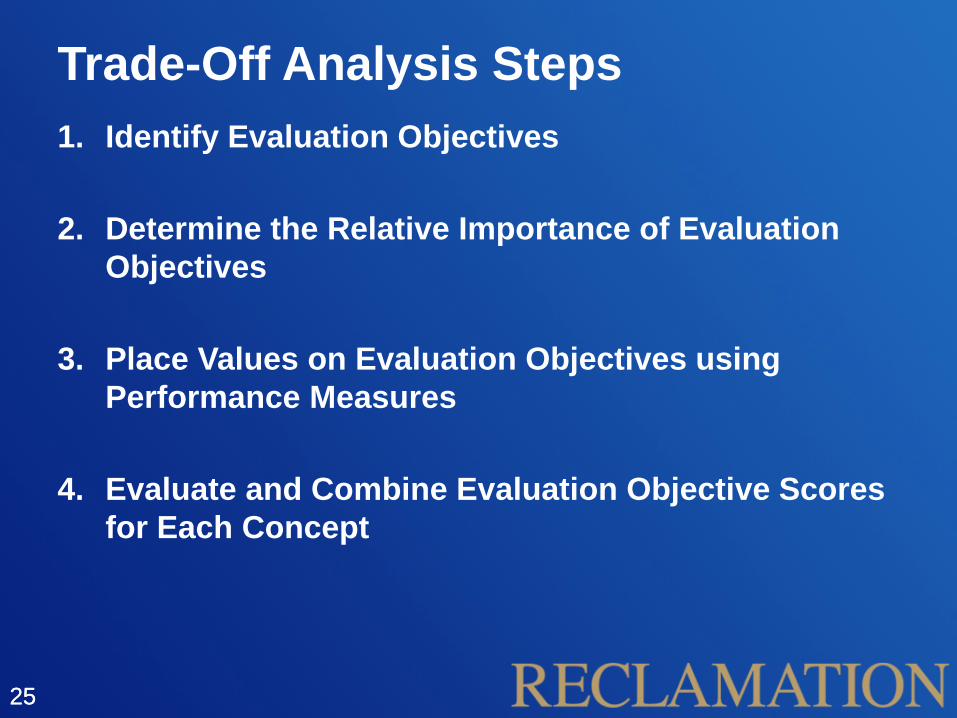
Trade-Off Analysis Steps1. Identify Evaluation Objectives
2. Determine the Relative Importance of Evaluation Objectives
3. Place Values on Evaluation Objectives using Performance Measures
4. Evaluate and Combine Evaluation Objective Scores for Each Concept

2626
Step 1: Identify Evaluation Objectives
• Address Climate Change Through Greenhouse Gas Reduction• Climate Resilience• Cost Effectiveness• Environmental Justice• Optimize Local Supplies/Independence• Project Complexity• Protect Habitats, Wildlife, and Ecosystem Services• Provide for Scalability of Implementation• Provide Reliability and Robustness• Quality of Life/Recreation• Regional Economic Impact• Regional Integration and Coordination• Water Quality and Watersheds

2727
Step 2: Relative Importance of Evaluation Objectives - Survey

2828
Step 2: Relative Importance of Evaluation Objectives – Survey Results
Evaluation Objective Importance Weight Rank
Water Quality and Watersheds 10.0 1Reliability and Robustness 10.0 1Climate Resilience 9.6 3Optimize Local Supplies 9.4 4Protect Habitats, Wildlife, and Ecosystems 9.2 5Environmental Justice 8.7 6Regional Integration and Coordination 8.5 7Cost Effectiveness 8.5 7Address Climate Change Through Greenhouse Gas Reduction 8.2 9
Regional Economic Impact 7.8 10Provide for Scalability of Implementation 7.7 11Quality of Life/Recreation 7.4 12Project Complexity 7.3 13

2929
Step 3: Place Values on Evaluation Objectives using Performance Measures

3030
Data for Calculating Performance Measures
Model Metrics
Concept-Level
Surveys
Project-Level
Surveys
GIS

3131
Step 4: Evaluate and Combine Evaluation Objective Scores for Each Concept

3232
Trade-off Analysis Results Using All Evaluation Objectives
3333
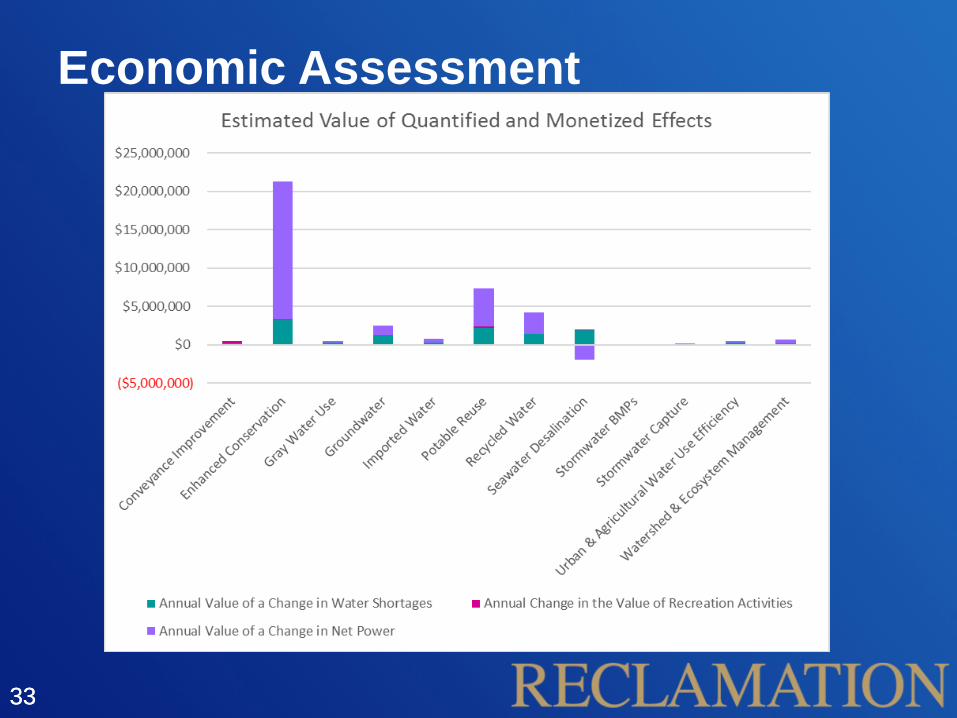
Economic Assessment

3434
Customized Trade-Off Analysis Tool

3535
Trade-Off Analysis for a Subset of Evaluation Objectives: Cost/Feasibility

3636
Trade-Off Analysis for a Subset of Evaluation Objectives: Environmental

3737
Key FindingsContinuing the region’s active investments (as simulated in the Baseline Plus Portfolio) will have a number of benefits:
– Improvements in water supply reliability, as indicated by a decreased occurrence of shortages (although shortages may not be completely eliminated)
– Less dependence on imported water

3838
Key FindingsThere are promising options for future investments to further secure reliable water supplies while supporting other aspects of water management such as flood control, recreation, and energy

3939
Key Findings
Conservation and Water Use Efficiency (analyzed in the Enhanced Conservation and Urban and Agricultural Water Use Efficiency Concepts) would have a number of positive benefits for the region:
– Reduced energy consumption – Fewer pipeline capacity issues– Increased reservoir storage, providing a direct benefit to
recreation– Less dependence on imported water– Cost effective and scalable– Potentially large energy cost reduction

4040
Key Findings
Increasing supply volumes through Potable Reuse would have a variety of potential benefits:
– Reduced shortage volumes
– Lower dependence on imported water
– Lower energy consumption

4141
Key FindingsConcepts such as Stormwater Capture, Watershed and Ecosystem Management, and Stormwater BMPs may have significant benefits and would be worth considering for implementation as part of the overall water system in the San Diego region.
– Enhanced quality of life/recreation– Reduced vulnerability to climate
change– Support environmental justice– Support healthy watersheds and
improved water quality

4242
Key Findings
Many Concepts and projects are complementary and could be implemented as part of a suite of strategies to benefit the region in many ways
Example: Water Use Efficiency (Lower energy costs) + Potable Reuse (Higher energy costs) = Improved supply reliability
Minimized energy cost impacts

4343
Basin Study Products• Interim Reports (Tasks 2.1 through 2.5): Details of
methods and results for each task of the Basin Study
• Customized Trade-Off Analysis Tool: Spreadsheet tool for performing trade-off analyses
• Final Report: Comprehensive report covering final version of all Basin Study tasks including details of methods and findings
• Executive Summary Report: Short overview of Basin Study focusing on key findings

4444
How to Use the Basin Study
• Gain insight into the impacts of Concepts or projects being considered for implementation– What positive impacts can be expected?– What negative impacts will need to be mitigated?
• Understand strengths and weaknesses of Concepts
• Compare Concepts to help guide future investments– Use customized trade-off analysis tool to make
comparisons based on your organization’s preferences

4545
Questions?
Allison Danner Odell ([email protected]), Technical Team Lead
Leslie Cleveland ([email protected]), Project Manager
Sarah Brower ([email protected]), Project Manager
https://www.usbr.gov/lc/socal/basinstudies/SDBasin.html