Embed Size (px)
Citation preview

Sampling methods in ecology
Enrico Tordoni
PhD student
Trieste, 11/10/2016
Design and Analysis of Environmental Monitoring and Experiments Master Degree in Global Change Ecology

1. What is a sampling?
2. What is the population of interest and why is it important to have an appropriate sampling unit?
3. What is an appropriate sampling unit size and shape?
4. How should sampling units be positioned?
5. Should sampling units be permanent or temporary?
6. How many sampling units should be sampled?
Questions addressed in the lesson

The research cycle

The research cycle
1. Recognition and choice of the hypothesis to be tested
2. Choice of factors, levels and so on
3. Selection response variable
4. Choice of design
5. Conducting experiment/observations
6. Statistical inference
7. Drawing conclusion and recommendations

Two major types of studies:
1. Observational: investigators observe subjects and measure variables of interest without assigning
treatments to the subjects. The treatment that each subject receives is determined beyond the control of
the investigator.
2. Experimental: investigators apply treatments to experimental units (people, animals, plots of land, etc.)
and then proceed to observe the effect of the treatments on the experimental units.
Study design

Key concepts
Grain size: is the size of the elementary sampling units. It may be expressed as the diameter, surface or
volume of matter supporting the measurements.
Sampling interval: is the average distance between neighbouring sampling units.
Extent: is the total length, area or volume included in the study.
Legendre & Legendre, 2012

Sampling is that part of statistical practice concerned with the selection of individual observations
intended to yield some knowledge about a population of concern.
The aim of the sampling is making inference on the population of interest, this allow us to make
generalization including some measures of “goodness of fit”
What is sampling?

What is sampling? – Basic concepts
- Random
All the sampling units must have the same probabilities to be sampled!

- Replication
- To make inference I need a correct number of replicates
- Replicates must be independent meaning that the position of a sampling unit doesn’t influence the position
of the others (not correlated)
- Pay attention to pseudoreplication!
What is sampling? – Basic concepts

Pseudoreplication
Pseudoreplication: effect of a factor that is studied using a source of variability not appropriate to study the
hypothesis under investigation
Good design Bad design

• Target vs. sampled population
What is the population of interest?

Sampling vs. Non-sampling errors?
In any study errors should be minimized
Sampling errors and bias
Induced from your sampling design, result from chance (random sampling error) or when the selection of
individuals, groups or data for analysis in such a way that proper randomization is not achieved, thereby
ensuring that the sample obtained is not representative of the population intended to be analyzed (selection
bias).
Non-sampling errors
These errors are associated with human, rather than chance, mistakes:
1) Using biased selection rules, such as selecting "representative samples" by subjectively locating sampling
units, or by substituting sampling units that are "easier" to measure
2) Using vegetation measurement or counting techniques within sampling units in which attributes cannot be
accurately counted or measured
3) Inconsistent field sampling effort
4) Transcription and recording errors
5) Incorrect or inconsistent species identification

What is an appropriate sampling unit size and shape?
• The type of sampling unit you select depends on the vegetation attribute you are measuring, the
most common are density, cover, frequency, and biomass. Attributes related to individual plants
(e.g. height, number of flowers per plant) are also often of interest.
• The most efficient design is usually the one that yields the highest statistical precision (smallest
standard error and narrowest confidence interval around the mean) for either a given area
sampled or a given total amount of time or money.

Main types of sampling units
Individuals: Individuals are the sampling units for attributes such as plant height, number of flowers per plant, or cover if the
cover measurements are made on individual plants (e.g., tree stem diameters, bunchgrass basal area measurements).
Object parts: Fruits might be the sampling units if the attribute is the number of seeds per fruit or the percentage of fruits
containing some seed herbivore. Or, you may be interested in estimating the number of flowers per inflorescence, in which
case the inflorescence is the sampling unit.
Quadrats (plots): Sampling unit of constant size. Most estimates of density, frequency, or biomass require the use of
quadrats, which represent the sampling units. Quadrats can also be the sampling units for cover measurements if visual
estimates of cover are made within quadrats.
Lines (transects): When cover is measured using the line-intercept method, the line is the sampling unit. Lines can also serve
as sampling units when points (for cover) or quadrats (for cover, density, or frequency) are positioned along lines and the
points or quadrats are not far enough apart to be themselves considered the sampling units (because they are not independent
of one another).
Point frames or point quadrats: When cover is measured using point frames or point quadrats and these frames or quadrats
are randomly positioned, then the point frames or point quadrats are the sampling units. Point frames are not recommended
because they are inefficient for measuring cover in most vegetation types.

Quadrats are required for estimating several vegetation attributes including:
Density - for counting the number of objects within the unit area of the quadrat.
Biomass - achieved by "clipping" all the material of a given type (e.g., grass, shrub or forb) or species
within a quadrat.
Cover - often accomplished by estimating the area of a quadrat that is covered by a plant's canopy.
Frequency - the proportion of quadrats in which a species occurs is called frequency, thus quadrats are
required to estimate plant frequency.
Attributes measured using quadrats
A
B

Point sampling methods to measure cover
Point frame
The frame is set up over the vegetation and the needles are lowered down through the plant canopy.
• Every time the point of a needle touches a plant, a “hit” is recorded with the species name.
• The needle can make several hits before it eventually touches the ground surface.
• % cover of species A = (No. of hits that intercept species A)/ (No. of points)
• This is the only point sampling method that can give an accurate estimate of absolute cover of each species in
multistratose vegetation, and hence an estimate of total leaf area for each species.
• It is, however, a very time consuming method.

Point sampling methods to measure cover
Point quadrat
This device is very useful for low-growing graminoid or dwarf shrub vegetation.
•. In sampling a point, the intersections between strings in the upper and lower grid a visually aligned so
as to avoid the problem of parallax.
• The percent cover for a species in each layer of the canopy is simply the number of hits out of 100.

Rectangle
- Generally best for "clumped" vegetation. Often have lower variance than squares or circles.
- Can reduce plot to plot variability in sparsely vegetated communities.
- Easier to estimate % cover than in circles or squares.
Square
- Greater perimeter:area ratio than circles but less than rectangles.
- Most typically used to estimate frequency because presence/absence is easy to estimate.
- Squares are easier to estimate % cover than circles but not as easy as rectangles.
Circle
- Less perimeter (per area) than square or rectangle.
- Often used in clipping because perimeter decisions are difficult to make when clipping.
- Reducing perimeter:area ratio is also good in communities with large sod-forming plants.
What shape of quadrat should be selected?

Edge effect: The edge of a quadrat is its outer boundary. The more edge a quadrat has, the greater the difficulty in
determining whether plants near the edge are in or out of the quadrat. Rectangular quadrats have more edge per
unit area than squares or circles.
You can choose between two simple conventions that help to minimize the non-sampling error associated with
plants landing right on the edge:
1. count every other plant that lands right on the edge as “in” and every other one as “out”,
2. specify that any plant that lands on the edge of two adjoining sides of the quadrat is considered “in” while any
plant landing on the other two adjoining sides is “out.”
You need to be consistent in applying whichever convention you choose!
Factor to consider when taking samples

Factor to consider when taking samples
Objective of study: parameter estimation vs. pattern detection

- Travel and setup time vs. searching and counting time
- Spatial distribution of individuals in the population
- Density of target population
- Ease in sampling
- Disturbance effects
Factor to consider when taking samples

How sampling unit should be positioned in the population?
- Random sampling. Critical to a valid monitoring study design is that the sample has been drawn randomly from
the population of interest.
Preferential sampling, the practice of subjectively selecting sampling units, should be avoided at all costs!
- Interspersion. One of the most important considerations in sampling is good interspersion of sampling units
throughout the area to be sampled (the target population). The basic goal is to have sampling units well
interspersed throughout the area of the target population. The practice of placing all the sampling units, whether
they be quadrats or points, along a single or even a few transects should be avoided. Arranging sampling units
in this manner results in poor interspersion of sampling units and the sample will not adequately represent the
target population. This is true even if the single transect or few transects are randomly located.

Sampling methods in ecology
1. Simple random sampling
2. Stratified random sampling
3. Systematic sampling
4. Restricted random sampling
5. Cluster sampling
6. Two-stage sampling
7. Double sampling

Simple random sampling
• Each combination of a specified number of sampling units has the same probability of being selected
• The selection of any one sampling unit is in no way tied to the selection of any other

Simple random sampling
• Random points
• Grid-cell method

Simple random sampling
Pros
• Simplest kind of random sampling
• The formulas used to calculate means and standard errors are easier
Cons
• By chance, some areas may be left unsampled
• Consider travel time if the area/sample size is large
• If population have clumped distribution, it is better to use others sampling methods
Useful in relatively small areas with homogeneous habitat, not too much sampling units.

Stratified random sampling
• This method involves dividing the population into two or more subgroups (strata) prior to sampling.
• Strata are generally delineated in such a manner that the sampling units within the same stratum are very
similar, while the units between strata are very different. Simple random samples are taken within each
stratum

Stratified random sampling
• It is very important to well define the strata.
• Strata should be defined based on the response of the attribute you are estimating to habitat characteristics
that are unlikely to change over time
• If there is no obvious reason for the difference in your area under investigation, you’re probably better off using
a simple random sampling procedure
• Sampling units do not have to be allocated in equal numbers to each stratum.
- equally to each stratum;
- In proportion to the size of each stratum;
- In proportion to the number of target individuals in each stratum;
- in proportion to the amount of variability in each stratum.

Stratified random sampling
Useful when the attribute of interest responds very differently to some clearly defined habitat structure. The
recommendations within strata are the same of simple random sampling
Pros
• More efficient in population estimate than simple random sampling if there is a strong variation according to
habitat features
Cons
• If geographic area within stratum is large as well as the number of sampling units, it is better to use others
sampling methods
• As before, by chance some areas within each stratum may be left unsampled.

Systematic sampling
• Often used when the area being studied is varied, not very large, or when time is available
• Samples are taken at fixed intervals
• Systematic samples are usually taken along a transect line marked by a tape measure
• The starting point for the regular placement is selected randomly
Consider spacing among quadrats to fulfill independence!

Systematic sampling
• Several factors can affect sampling spacing such as:
- The average size of gaps (especially in forests),
- The average size of individual plants
- The size of areas of clones
- The size and distribution of microsites
• In general, sampling units should be far enough apart that they do not fall into the
same microsite, gap, or clone. This, however, is scale dependent.
• Probably the best way to determine spacing of sampling units along transects
is to consider the degree of interspersion of your design

Systematic sampling
Line transect: A measured line is laid across the area in the direction of the environmental gradient. The species
touching the line can be recorded along the whole length of the line (continuous sampling) or at specific points
along the line (systematic sampling)
Belt transect: Similar to line transect but widens the sampling area– Transect line is laid out– Samples are taken
by determining abundance or % cover in an area that is a defined distance from the line. Samples can be taken all
the way along the line, at specific intervals or even randomly
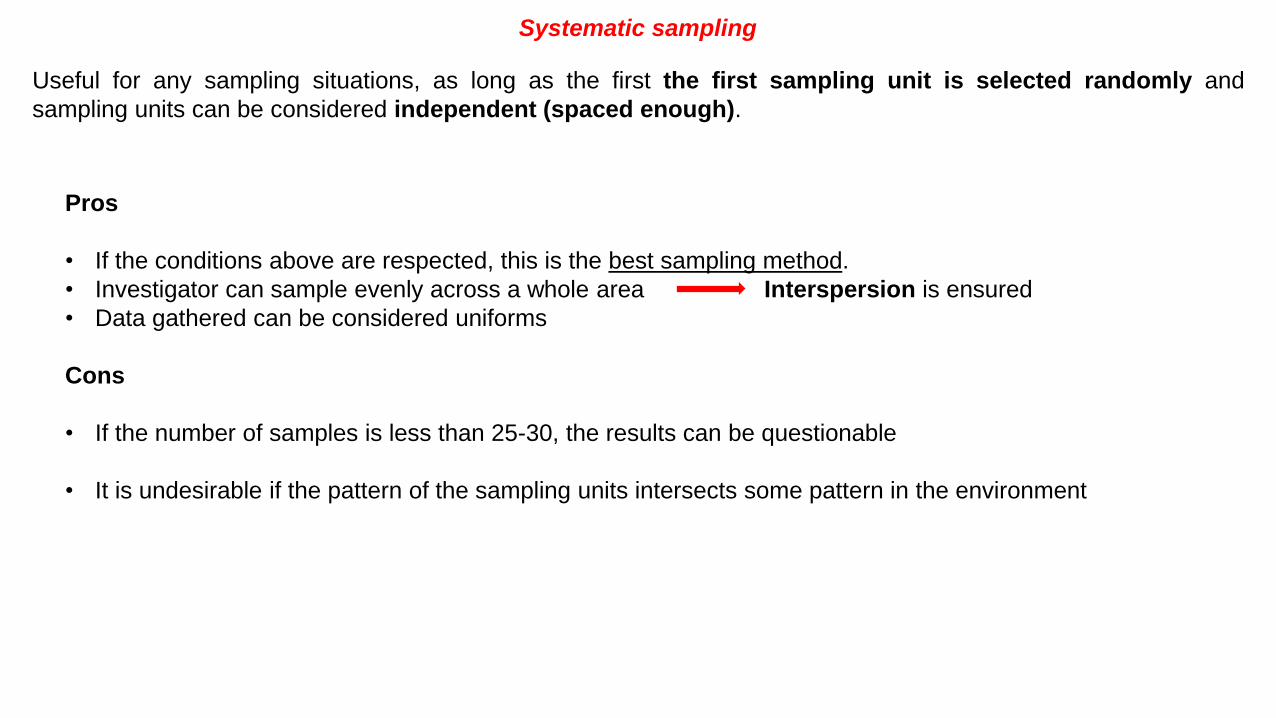
Useful for any sampling situations, as long as the first the first sampling unit is selected randomly and
sampling units can be considered independent (spaced enough).
Systematic sampling
Pros
• If the conditions above are respected, this is the best sampling method.
• Investigator can sample evenly across a whole area Interspersion is ensured
• Data gathered can be considered uniforms
Cons
• If the number of samples is less than 25-30, the results can be questionable
• It is undesirable if the pattern of the sampling units intersects some pattern in the environment

Restricted random sampling
You determine the number of sampling units, n, you will need to meet your monitoring objective, then divide your
population into n equal-sized segments. Within each of these segments, a single sampling unit is randomly
positioned. The sample of n sampling units is then analyzed as if it were a simple random sample.
0 10 20 30 40 50 m

Restricted random sampling
Should be used only if the number of potential samples < 25-30, otherwise use systematic sampling
Pros
• Ensure interspersion
• The formulas used to calculate means and standard errors are easier
Cons
• Not so efficient if samples > 25-30
• You can, purely by chance, end up with sampling units positioned side-by-side.

Cluster sampling
Cluster sampling is a method of selecting a sample when it is difficult or impossible to take a random sample
of the individual elements of interest.
We identify randomly groups of quadrats (clusters)
We then measure every element within each of the randomly selected clusters

Cluster sampling
Generally used when interested in individual characteristics (e.g. mean height of rare trees)
Pros
• Less costly to sample collection of elements in a cluster (more cost-effective) than sampling an equal
number of elements selected randomly from the population
Cons
• Can be time-consuming (you must measure all elements in the cluster)
• If clusters contain a lot of elements, it is more efficient to use two-stage sampling
• Difficulties in determining how many clusters are needed and their sizes

Two-stage sampling
Two-stage sampling is similar to cluster sampling in that we identify groups of elements about which we wish
to make inferences.
We then take a random sample of these groups
Primary sampling units
Secondary sampling units
The secondary sampling units can be either a simple random sample of elements or a systematic sample of
elements

Two-stage sampling
Similar to cluster sampling in identifying groups; used to estimate values associated with individuals
Pros
• The same of cluster sampling, 2-stage is preferred/more efficient when the number of individuals in each
group (quadrat) is large
• Cost effective
Cons
• Standard deviations associated both at primary and secondary sampling units
• If clusters contain a lot of elements, it is more efficient to use two-stage sampling
• Difficulties in determining how many clusters are needed and their sizes

Double sampling
Double sampling, sometimes called two-phase sampling, involves the estimation of two variables.
Because one of these variables, the variable of interest, is difficult or expensive to measure, it is measured in
only a relatively small number of sampling units. In order to improve the rather poor precision of the estimate that
normally results from a small sample, an auxiliary variable that is much easier to measure and well correlated
with the other variable is estimated in a much larger number of sampling units.
Pros
• If the auxiliary variable is relatively quick to measure and is highly correlated with the variable of interest,
double sampling is much more efficient and cost effective than directly measuring the variable
Cons
• Some difficulties in data analysis

Should sampling units be permanent or temporary?
When sampling units are temporary, the random sampling procedure is carried out independently at each
sampling period.
The principal advantage of using permanent instead of temporary sampling units is
- For many plant species, the statistical tests for detecting change from one time period to the next in
permanent sampling units are much more powerful
- Reduction in the number of sampling units that need to be sampled to detect a certain magnitude of
change

Permanent sampling unit
Permanent sampling units will be the most advantageous when there is a high degree
of correlation between sampling unit values between two time periods
One is the time and cost required to permanently mark the units.
Even when the markers are still in place, they may be difficult to find
Impacts either from investigators or from animals may bias your results
You need at least two years of data

How many sampling units should be sampled?
Adequacy relates to the ability of the observer to evaluate whether the management objective has been achieved.
To choose an adequate number of sampling unit consider:
1. Study aims
If you are targeting point-in-time estimates (parameter estimation), you need to specify how precise you want your
estimates to be. If you are trying to detect changes in some average value, you need to specify the magnitude of
the change you wish to detect
2. Sample size should be based on the amount of variability in actual measurements
You should assess this variability during pilot sampling
3. Relationship of sample size to precision level
Precision increases with sample size, but not proportionately
4. Use data from similar studies to estimate the standard deviation
5. By professional judgment
6. Using computer programs

Conclusions
• Before starting set your aims/priorities!
• Clearer is the question, easier is the sampling, simpler is the statistics to be applied
• If you have blurry and foggy questions and bad design, you will have to apply
complex analyses

UP TO YOU
1) A biologist want to obtain body weights of male reindeer calves from a herd during the seasonal
roundup
2) A researcher want to investigate plant diversity in urban environment according to the habitats
present in the cities
3) Pinus mugo is a low shrub found in subalpine fields. Imagine you are interested in the pollination
biology of this species and you need to know its overall abundance within your study area, a
subalpine field in Julian alps.
4) Surveying forest and grassland songbirds with the point count method at stations distributed along
a transect line