Embed Size (px)
Citation preview

Sampling
Mathsfest 2014
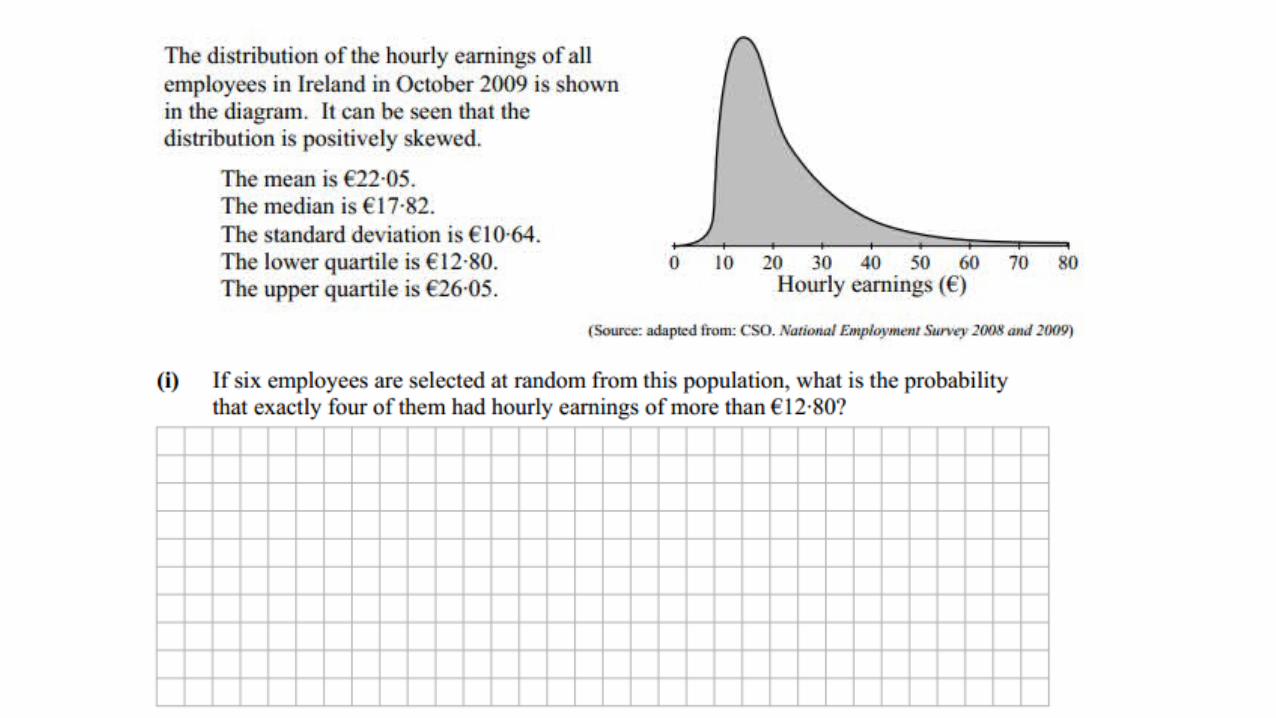
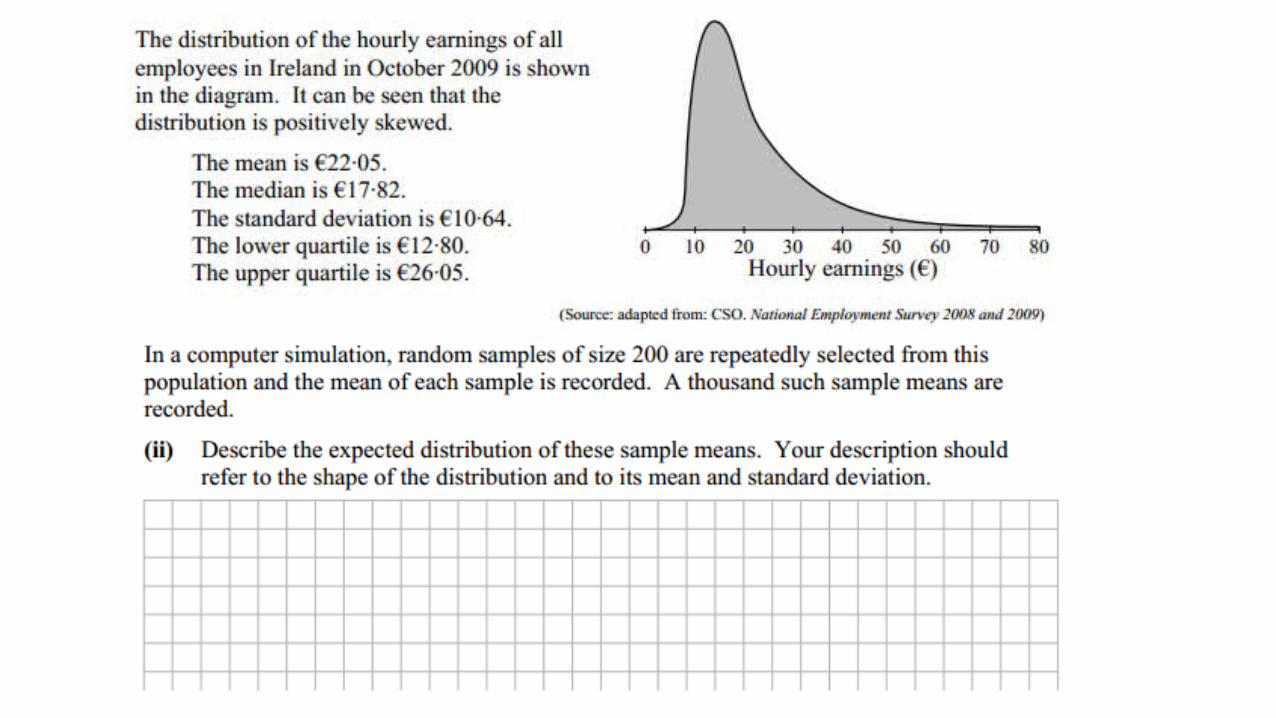
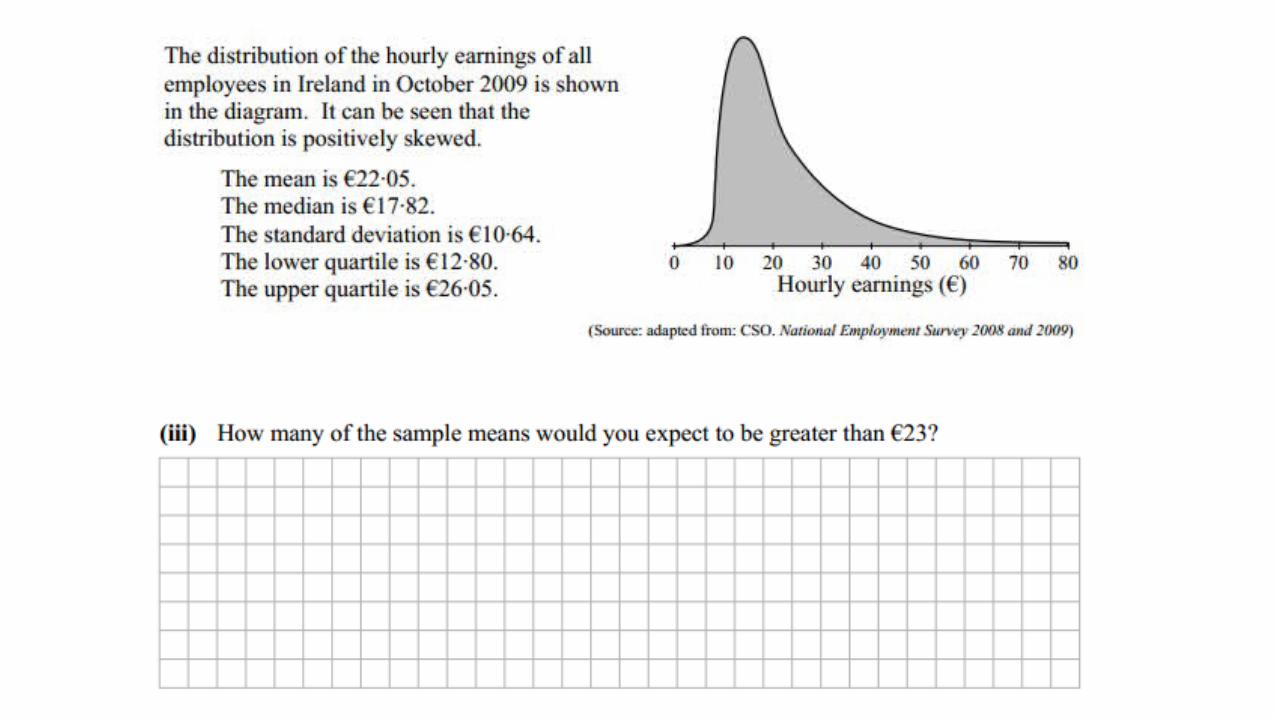
Why Sample?
Jan8, 2003 Air Midwest Flight 5481 from Douglas International Airport in North Carolina stalled after take off, crashed into a hangar and burst into flames. All 21 people on board perished.
A subsequent investigation revealed that the weight of the passengers was a factor that contributed to the crash.
This prompted the FAA to collect weight information from randomly selected flights so that old assumptions about passenger weights could be updated.

Sampling Distributions
Suppose that we draw all possible samples of size n from a given population. Suppose further that we compute a statistic (e.g., a mean) for each sample. The probability distribution of this statistic is called a sampling distribution
Population 1 2 5
Sample (1, 1) (1, 2) (1, 5) (2, 1) (2, 2) (2, 5) (5, 1) (5, 2) (5, 5)
Mean 1 1.5 3 1.5 2 3.5 3 3.5 5
Probability
Sampling With Replacement
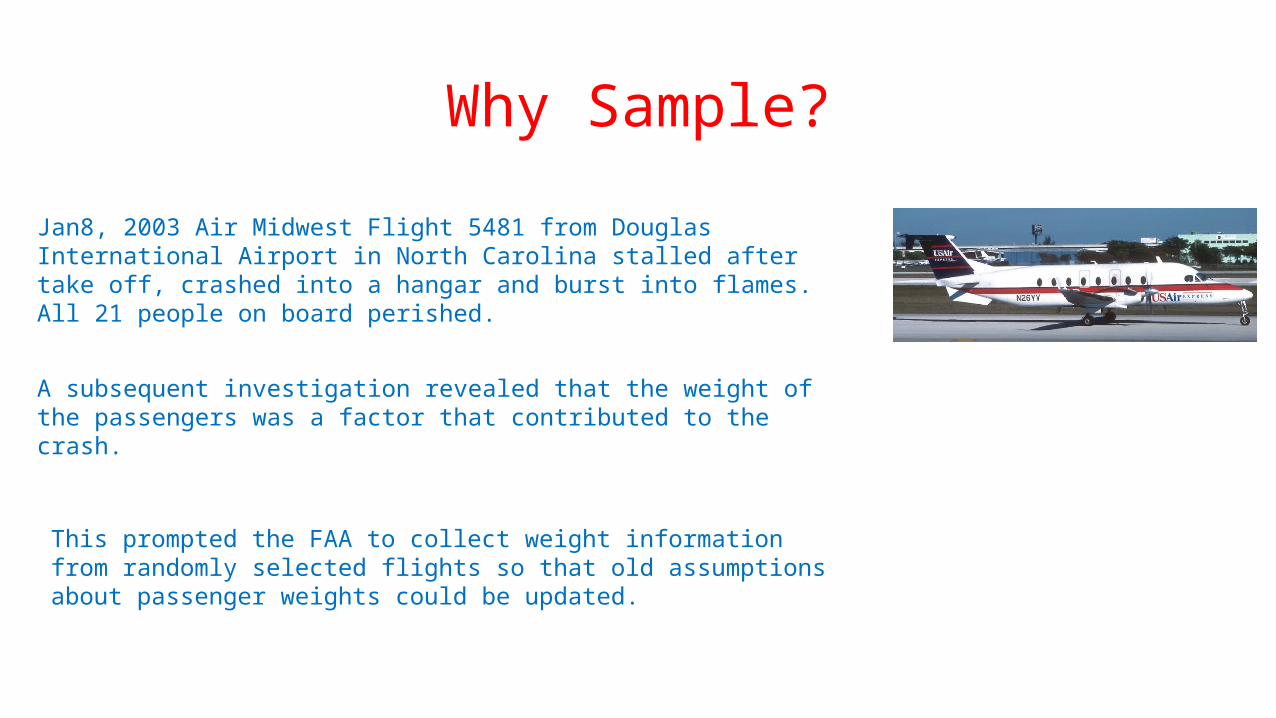
1. When selecting a relatively small sample from a large population, it makes no significant difference whether we sample with replacement or without replacement.
2. Sampling with replacement results in independent events that are unaffected by previous outcomes. Independent events are easier to analyse and result in simpler formulas.

Simple Random Sample
Advantages of Simple Random Sampling
• Every member of the population has an equal chance of being represented in the sample• The simple random sample should be representative of
the population. Theoretically the only thing that can compromise its representativeness is luck• If the sample is not representative of the population,
then the random variation is called sampling error
Disadvantages of Simple Random Sampling
• A complete and up to date list of all the population is required
• Such a list is usually not available for large populations

Estimators
Population 1 2 5
Mean (µ)
Sample (1, 1) (1, 2) (1, 5) (2, 1) (2, 2) (2, 5) (5, 1) (5, 2) (5, 5)
Mean ( 1 1.5 3 1.5 2 3.5 3 3.5 5
Mean of Sampling Distribution
The sample statistic targets the population parameter

Estimators
Population 1 2 5
Standard Deviation (σ) 1.6997
Sample (1, 1) (1, 2) (1, 5) (2, 1) (2, 2) (2, 5) (5, 1) (5, 2) (5, 5)
SD (s) 0 0.707 2.828 0.707 0 2.121 2.828 2.121 0
Mean of Sample Standard Deviations 1.2569
The sample statistic does not target the population parameter
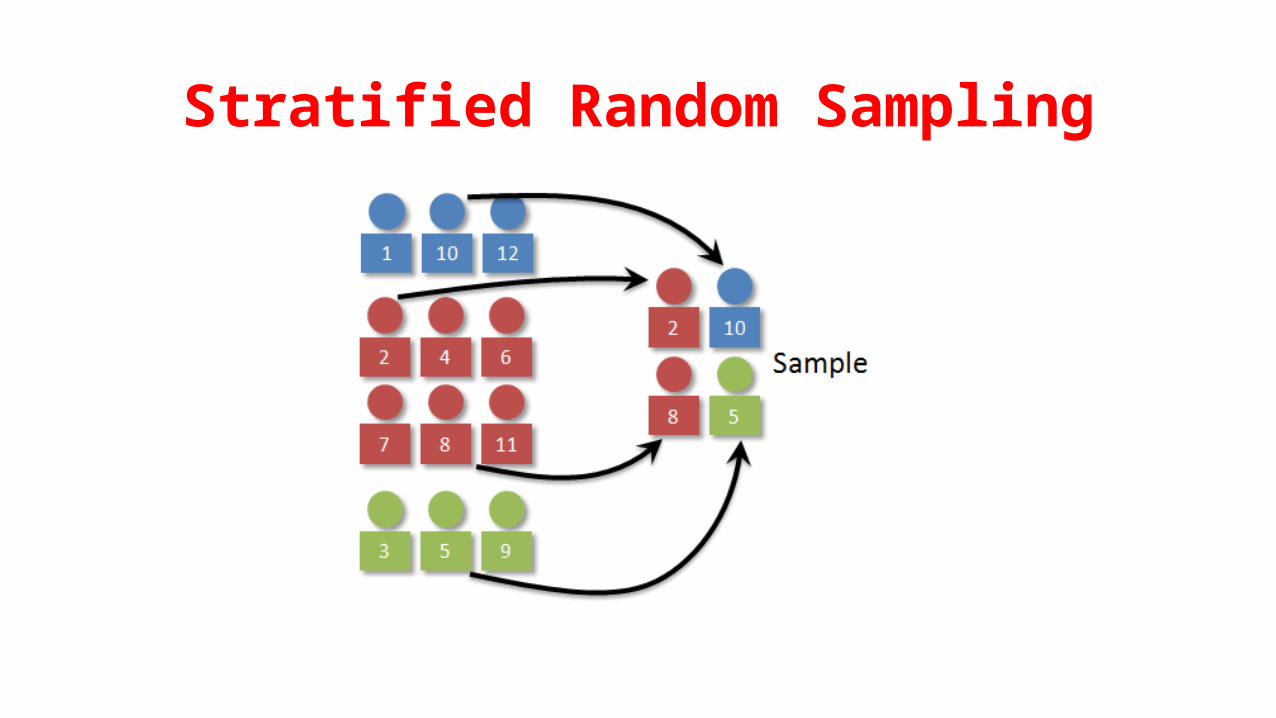
Stratified Random Sampling

Advantages of Stratified Random Sampling
• Provides greater precision than a simple random sample of the same size
• Smaller samples are required, thereby saving money
• Can guard against an unrepresentative sample

Disadvantages of Stratified Random Sampling
May require more administrative effort than a simple random sample
A complete and up to date list of the population is required
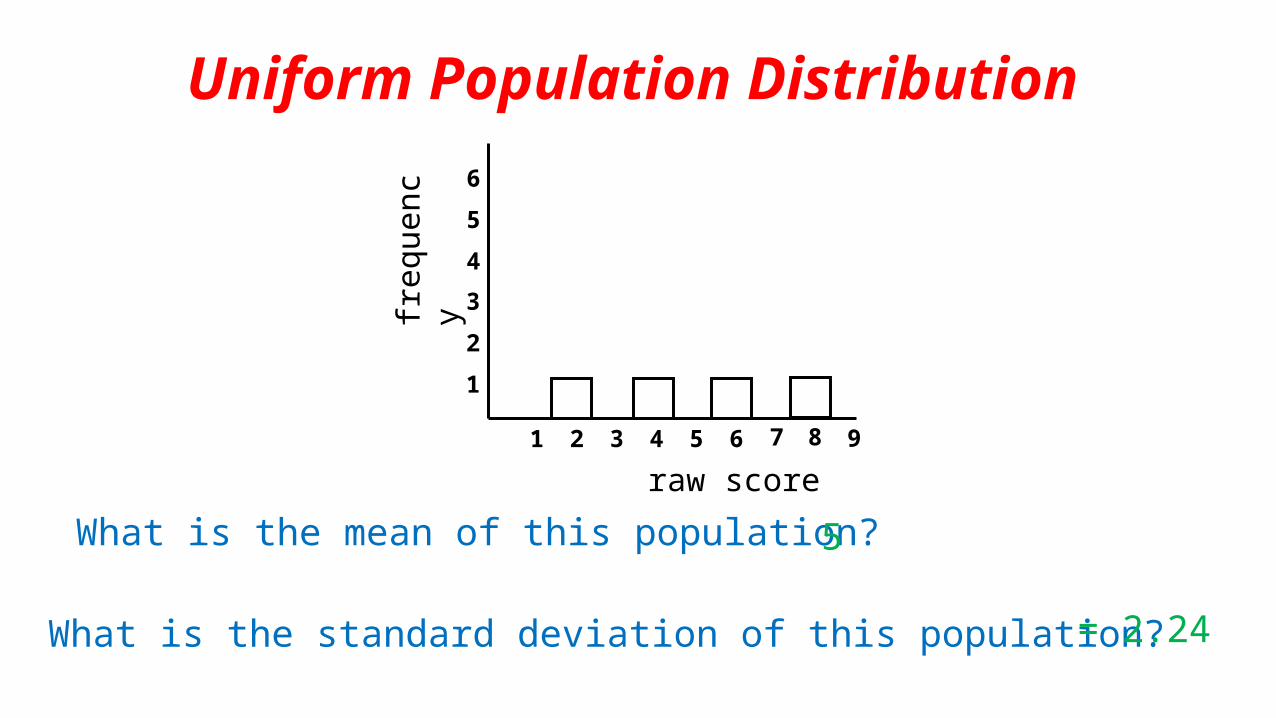
Uniform Population Distribution
1 2 3 4 5 6
1
2
3freq
uenc
y
4
5
6
raw score
7 8 9
What is the mean of this population?5
What is the standard deviation of this population? = 2.24

Distribution of Sample Means: Samples of Size 2
1 2, 2 2
2 2,4 3
3 2,6 4
4 2,8 5
5 4,2 3
6 4,4 4
7 4,6 5
8 4,8 6
9 6,2 4
10 6,4 5
11 6,6 6
12 6,8 7
13 8,2 5
14 8,4 6
15 8,6 7
16 8,8 8
Sample Scores Mean ( )
X
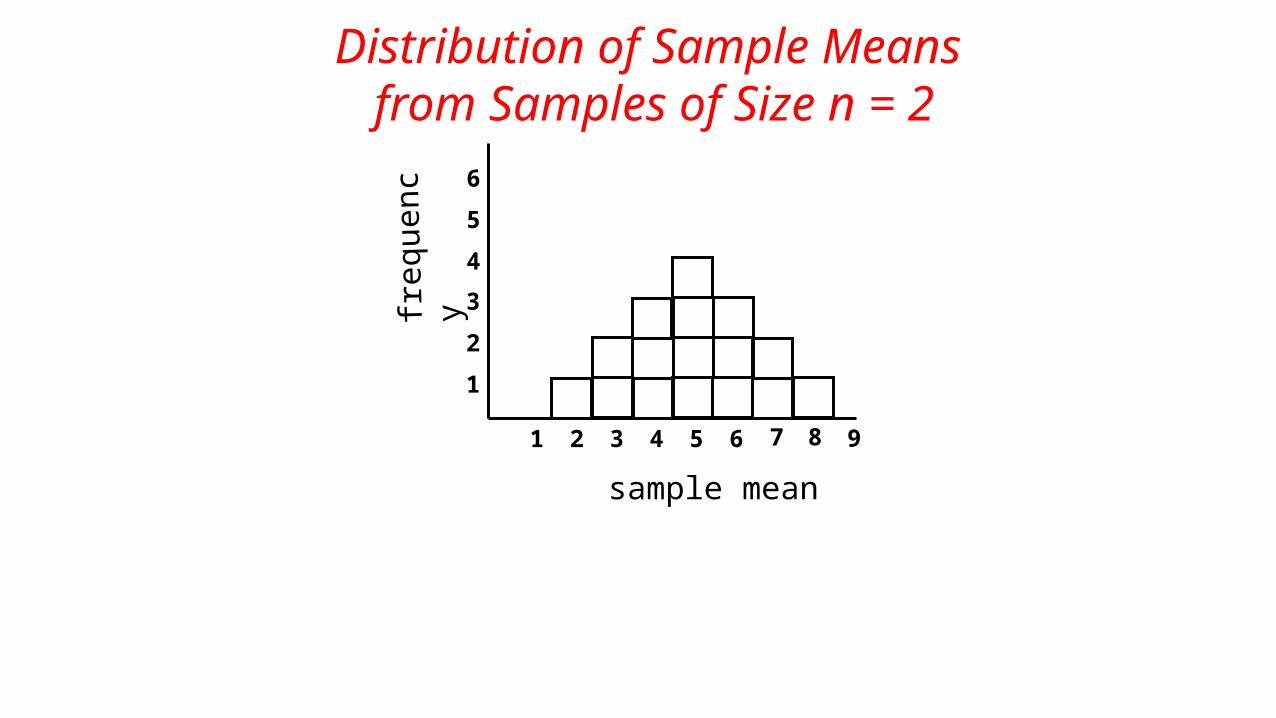
Distribution of Sample Means from Samples of Size n = 2
1 2 3 4 5 6
1
2
3freq
uenc
y
4
5
6
7 8 9
sample mean
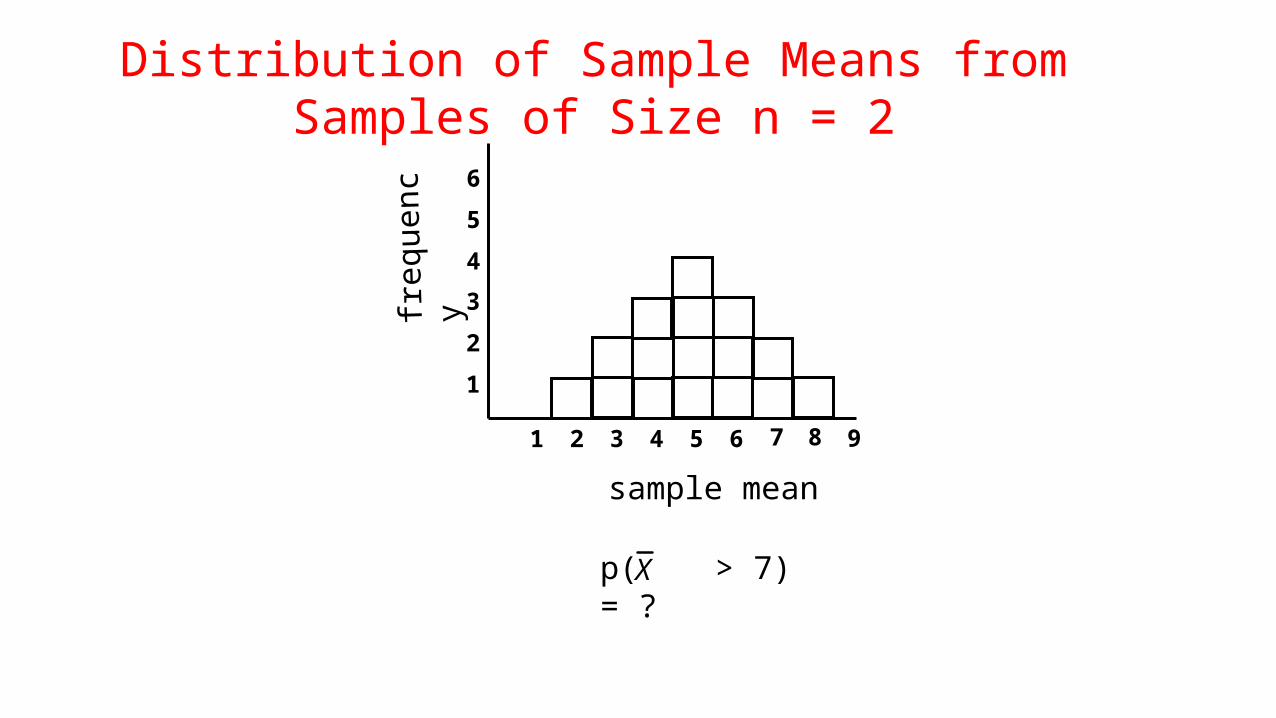
Distribution of Sample Means from Samples of Size n = 2
1 2 3 4 5 6
1
2
3freq
uenc
y
4
5
6
7 8 9
sample mean
p( > 7) = ?
X
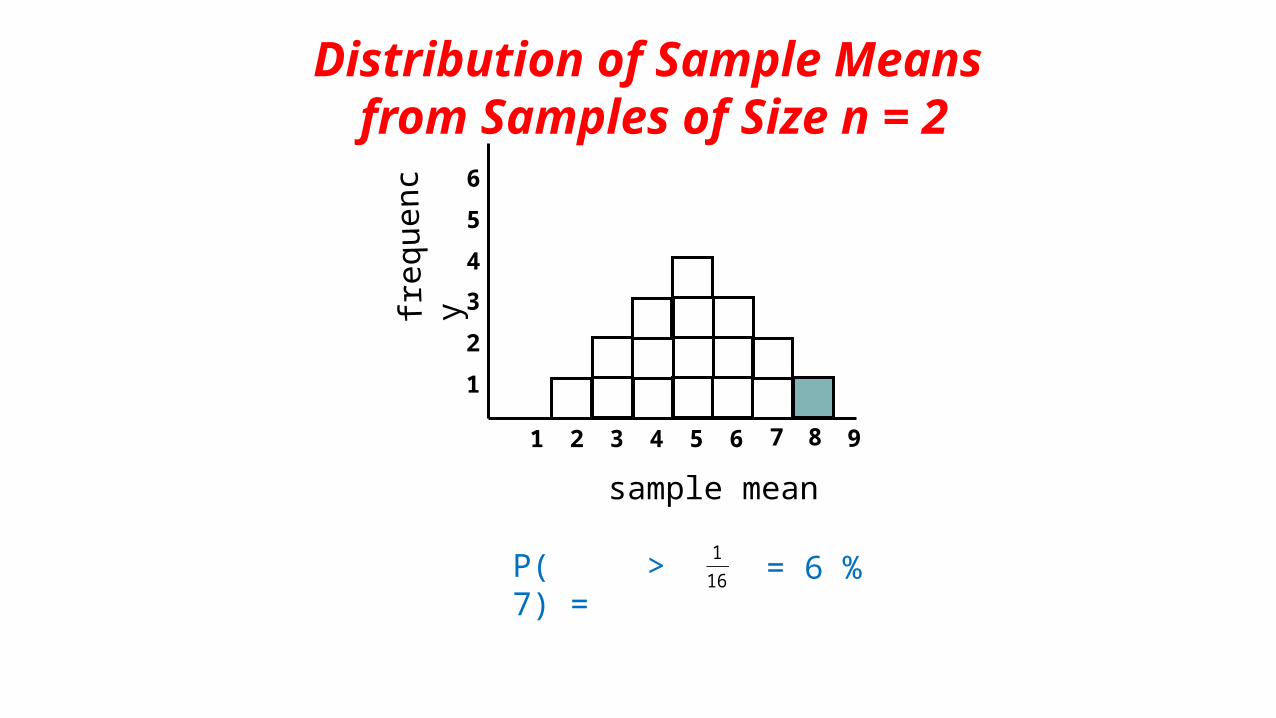
Distribution of Sample Means
from Samples of Size n = 2
1 2 3 4 5 6
1
2
3freq
uenc
y
4
5
6
7 8 9
sample mean
P( > 7) = = 6 %1
16

1 2 3 4 5 6
123fr
eque
ncy
456
raw score7 8 9 1 2 3 4 5 6
1
2
3freq
uenc
y
4
5
6
7 8 9
sample mean
Population Distribution Distribution of Sample Means
P(X > 7) = 25%
Distribution of Sample Means
𝑃 ( 𝑋 )>7¿=6 %
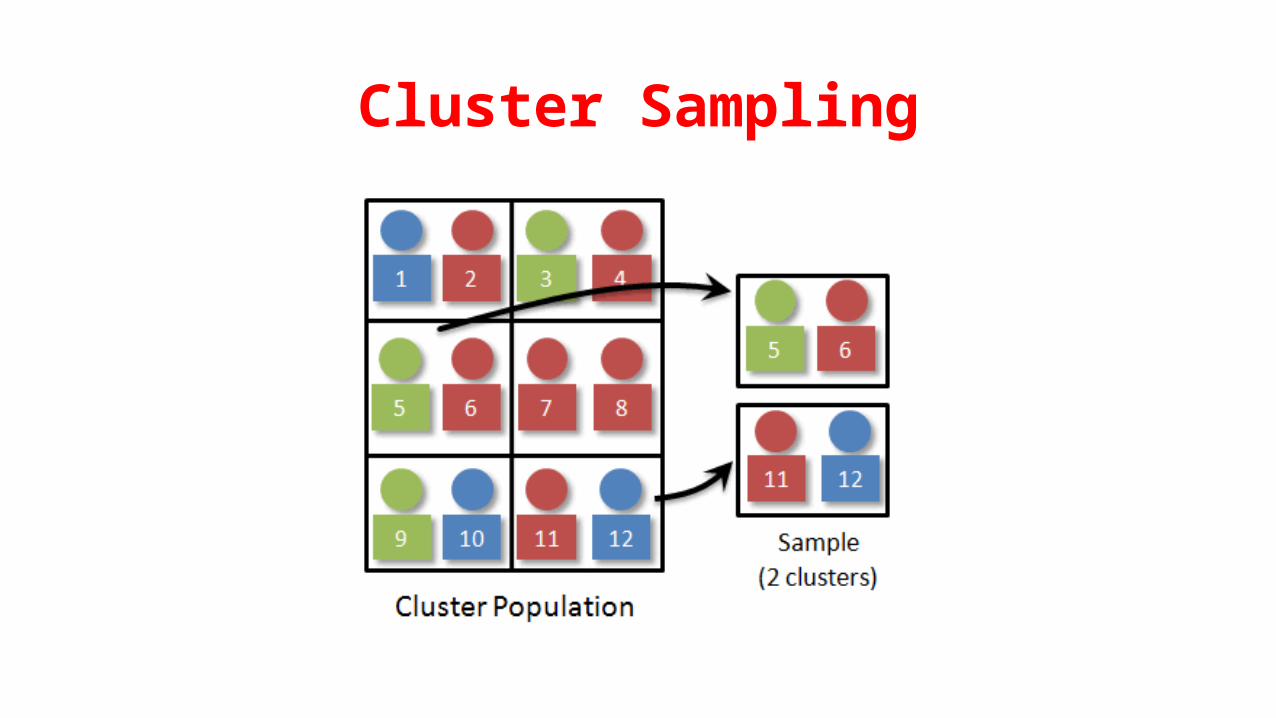
Cluster Sampling

Advantages of Cluster Sampling
• Inexpensive• Limited resources can be allocated to a few randomly selected
clusters.
• Easy to implement• Subjects are easily accessed

Disadvantages of Cluster Sampling
• From all the different probability sampling methods, this technique is the least representative of the population.
• There is a tendency for individuals within a cluster to have similar characteristics, therefore there is a chance that a researcher may have an over represented or under represented cluster.

Mean of Sample Means
Means 2 3 4 5 3 4 5 6 4 5 6 7 5 6 7 8
Mean of Sample Means = Standard Deviation of Sample Means = 1.58 =
Mean of Population = 5 Standard Deviation of Population =

Skewed Population Distribution
1 2 3 4 5 6
1
2
3freq
uenc
y
4
5
6
raw score
7 8 9
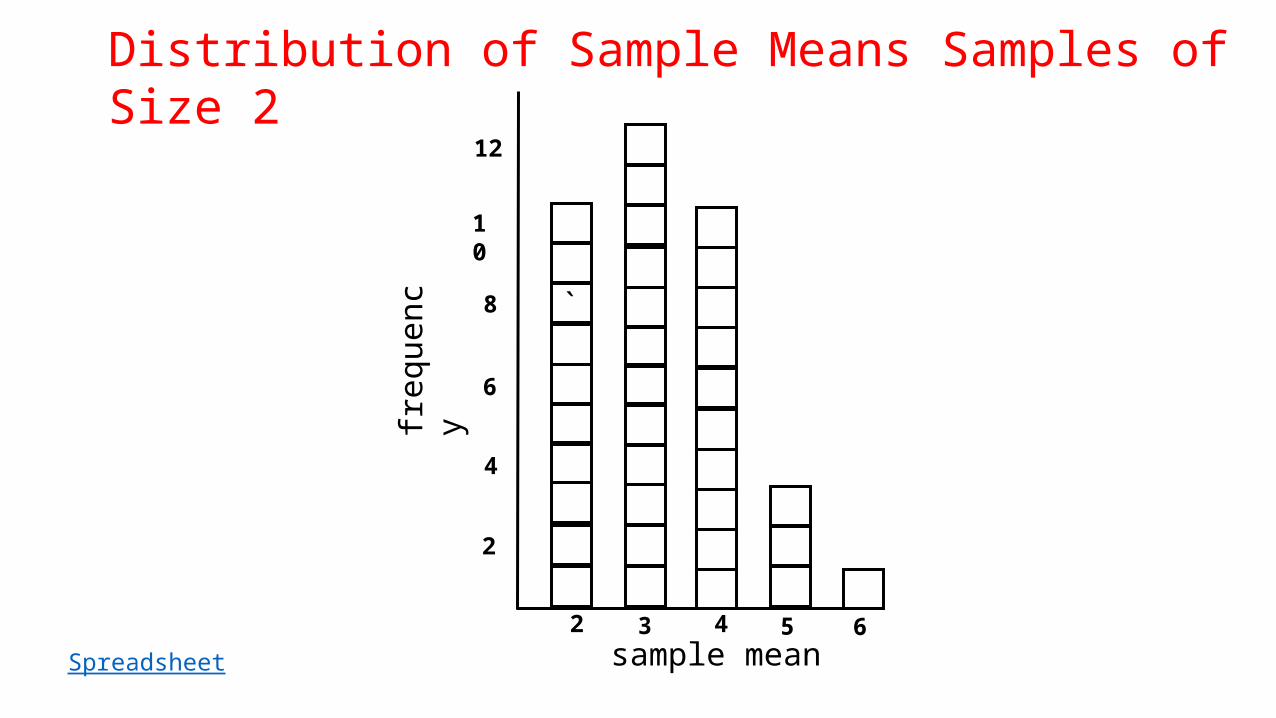
Distribution of Sample Means Samples of Size 2
2 53 4
2
freq
uenc
y
4
8
6
6
`
12
10
sample meanSpreadsheet

Systematic Random Sample
Advantages of Systematic Random Sampling
• Representative of the population
• Because the sample is random, we can make statistical conclusions that would be considered valid

Disadvantages of Systematic Random Sampling
• A complete and up to date list of all the population is required
• If the population is listed in some standardised pattern, then systematic sampling could pick out similar members rather than completely random members

Uniform Population Distribution
6
raw score1 2 3 4 5
1
2
3freq
uenc
y
4
5
6
7 8
Mean = 5
Standard deviation = = 2.24

Distribution of Sample Means Sample Size 3
1 2 3 4 5 6
2
4
6
freq
uenc
y
8
10
12
7 8 9
sample mean
14
16
18
20
22
24
Spreadsheet

Things to Notice
1. The sample means tend to pile up around the population mean.
2. The distribution of sample means is approximately normal in shape, even though the population distribution was not.
3. The distribution of sample means has less variability than does the population distribution.
4. Increasing sample size decreases the variability in the distribution of samples.
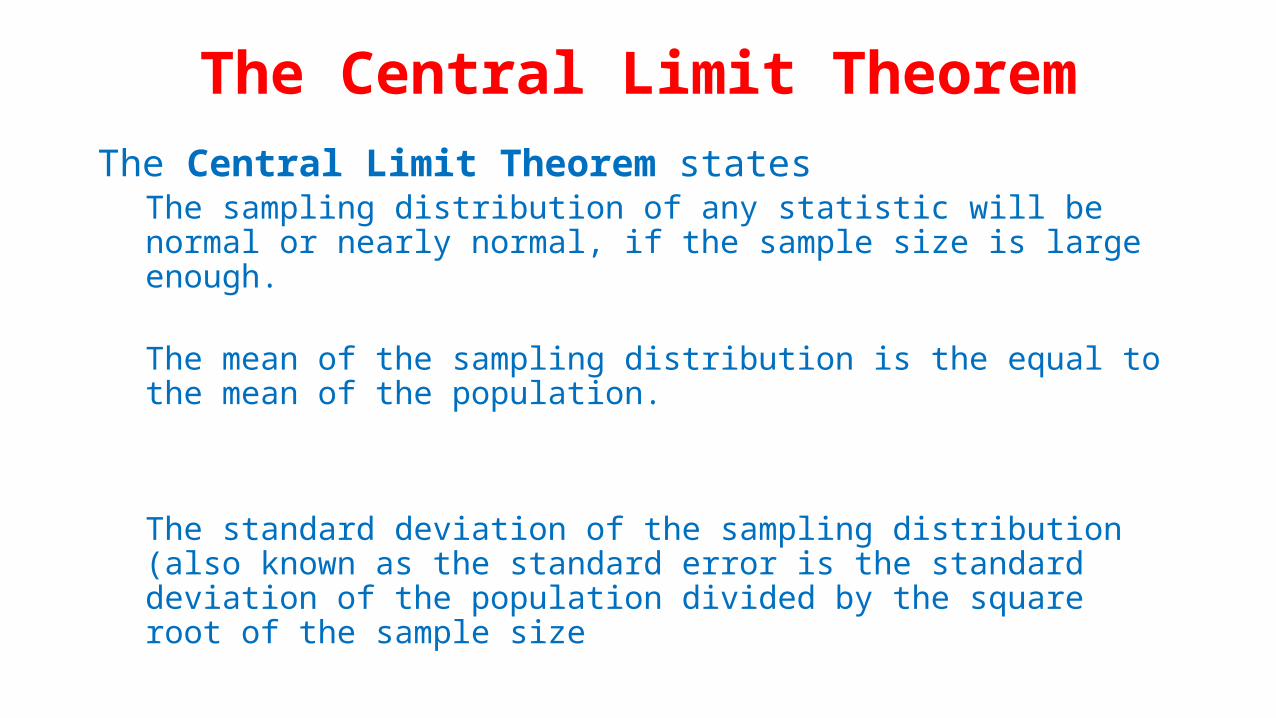
The Central Limit TheoremThe Central Limit Theorem states
The sampling distribution of any statistic will be normal or nearly normal, if the sample size is large enough.
The mean of the sampling distribution is the equal to the mean of the population.
The standard deviation of the sampling distribution (also known as the standard error is the standard deviation of the population divided by the square root of the sample size


Non Probabilistic Sampling
• Quota Sampling
• Convenience Sampling
• Snowball Sampling