Embed Size (px)
Citation preview

LeanSixSigma:Training/CertificationBooksandResources
Page 1 of 10
Samples from: MINITAB Book
Quality and Six Sigma Tools using MINITAB Statistical Software: A complete Guide to Six Sigma DMAIC Tools using MINITAB®
Prof. Amar Sahay, Ph.D.
One of the major objectives of this text is to teach quality, data analysis andstatisticaltoolsusedintheSixSigmaDMAIC(Define,Measure,Analyze,Improve,andControl)process.Thechaptersinthisbookprovideconcepts,understanding,andcomputerapplicationsofSixSigmaDMAICtools.ThestatisticaltoolsusedintheDMAICprocessarediscussedwithstep‐wiseMINITABcomputerapplications.
Thefollowingaresamplesfromthebookrandomlyselectedfromdifferentchapters CHAPTER 1 Introduction to MINITAB Statistical Software: Getting
Started with MINITAB
ChapterHighlights
ThischapterdealswiththedetailsofMINITABstatisticalsoftwareusedwidelyinSixSigma.Aftercompletingthischapter,youwillbecomefamiliarwithMINITABanditsmajorfeatures.Thefollowingtopicsarediscussedinthischapter:
1. IntroductiontoMinitabandgettingstartedwiththesoftware
2. Themain featuresofthesoftware,andhowtoperformdataanalysisusingMinitab
3. Enteringdata,datatypes,dataformats,andanalyzingdata
4. Graphing andeditingdatausing the features suchas:Scale,Labels,DataView,MultipleGraphs,andDataOptionstoeditgraphs
5. ThedescriptiveandstatisticalanalysistoolsforSixSigmausingMinitab
6. SimpletoadvancedanalysistoolsinMinitab
7. AninteractivesessionandatutorialtolearnMinitab

LeanSixSigma:Training/CertificationBooksandResources
Page 2 of 10
MINITABStatisticalSoftware:AnOverview
OUTLINE:CHAPTER1ObjectivesandOverviewMINITABStatisticalSoftware:AnOverviewWorksheet(DataWindow)SessionWindowHistoryWindowAnalyzingYourDataGraphingYourData:Scale,Labels,DataView,MultipleGraphs,DataOptionsPrintingandSavingYourWorkCommandSequenceUsedInThisTextPreparingYourReportChangingdatafromNumerictoTextorTexttoNumericEditingYourGraphsandPlotsAnInteractiveSessionwithMINITAB
SamplepagesfromChapter1
Mainmenuitems
Sessionwindowdisplaystheoutput
Datawindoworworksheet
LeanSixSigma:Training/CertificationBooksandResources
Page 3 of 10
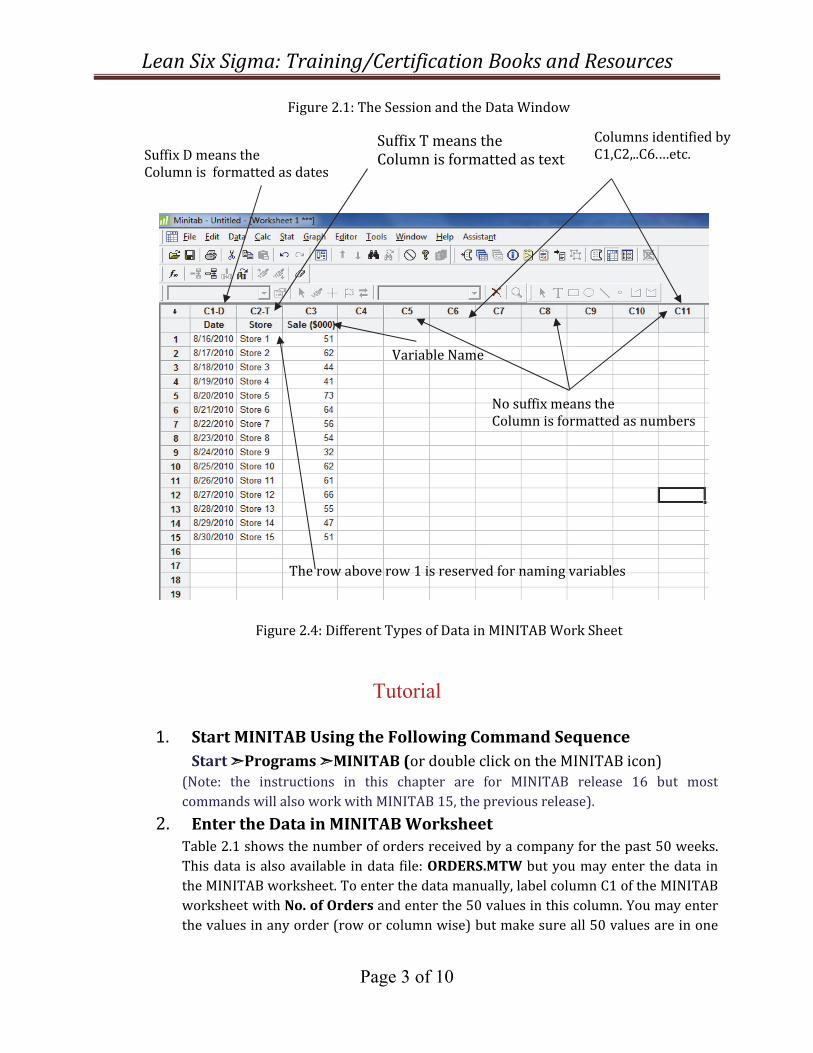
Figure2.1:TheSessionandtheDataWindow
Figure2.4:DifferentTypesofDatainMINITABWorkSheet
Tutorial
1. StartMINITABUsingtheFollowingCommandSequence Start&Programs&MINITAB(ordoubleclickontheMINITABicon)
(Note: the instructions in this chapter are for MINITAB release 16 but mostcommandswillalsoworkwithMINITAB15,thepreviousrelease).
2. EntertheDatainMINITABWorksheetTable2.1showsthenumberofordersreceivedbyacompanyforthepast50weeks.Thisdataisalsoavailable indata file:ORDERS.MTWbutyoumayenterthedataintheMINITABworksheet.Toenterthedatamanually,labelcolumnC1oftheMINITABworksheetwithNo.ofOrdersandenterthe50valuesinthiscolumn.Youmayenterthevaluesinanyorder(roworcolumnwise)butmakesureall50valuesareinone
SuffixDmeanstheColumnisformattedasdates
SuffixTmeanstheColumnisformattedastext
VariableName
ColumnsidentifiedbyC1,C2,..C6.…etc.
NosuffixmeanstheColumnisformattedasnumbers
Therowaboverow1isreservedfornamingvariables

LeanSixSigma:Training/CertificationBooksandResources
Page 4 of 10
column (C1). You may enter only part of data if you wish or open the fileORDERS.MTWfromthedatafiles.
Table2.1NumberofOrdersforthepast50weeks No. of Orders 137 183 133 142 128 164 125 94 163 172 160 170 163 112 138 141 163
Figure2.9showspartofthedatafileortheworksheet.Oncethedataareentered,usethecommandsequence
File&SaveCurrentWorksheetas
NamethefileORDERSandsaveit.MINITABputsanextension .MTWtoallthedatafiles.
Figure2.9:PartoftheDataFileorWorksheetinMINITAB
3.EnteringtheDatainMINITABWorksheet–AnotherExample:::
LabelcolumnC1asshown andenterthe50valuesinthiscolumn

LeanSixSigma:Training/CertificationBooksandResources
Page 5 of 10
Figure2.10:EnteringData–EachColumnContainingOneVariable
4.SelectingVariable(s)forAnalysisSelecting a menu item for analysis from the main menu will display a dialog boxshowingthelistofvariables… Stat&GraphicalSummary
willshowthedialogboxshowninfigurebelow.Thevariableorvariablesforanalysisarethenselectedfromthislist.
Refer to figure above. Supposewewant ‘Graphical Summary’ of the variable ‘Strength.’Doubleclickonthisvariablefromthelistofvariablesfromtheleftsideanditwillappearunderthe“Variables”box(seeFigure2.13).Ifyouwantthe‘GraphicalSummary’ofmorethan one variable, highlight all the variables from the variables list using yourmousepointerthenclickthe“Select”buttonatthebottomofthevariableslist.Figure2.14showshowtoselectmorethanonevariableforanalysis.
ColumnsC1toC7 eachcontainsonevariable.

LeanSixSigma:Training/CertificationBooksandResources
Page 6 of 10
Figure2.13:SelectingaVariableforAnalysis
Figure2.14:SelectingMultipleVariablesforAnalysis
5.SorttheData OpentheworksheetORDERS.MTW
Data&SortTocompletetheSortdialogboxthatisdisplayed;doubleclickonC1No.ofOrdersfromtheboxontheleftsideofthedialogboxthatdisplaysthelistofallvariables,thecolumntheyare…..
6. GeneratePatternedDataintheWorksheet(generatingasequence ofnumbers) : : Calc&MakePatternedData&SimpleSetofNumbers CompletetheSimpleSetofNumbersdialogboxbytypingthefollowingresponse Fromfirstvalue 1 Tolastvalue 50
LeanSixSigma:Training/CertificationBooksandResources
Page 7 of 10
Instepsof 1 Listeachvalue …
Listthewholesequence ….
ClickOKandthenumbers1through50willbestoredincolumnC3oftheworksheet.LabelthiscolumnWeek.
7. GenerateRandomDataYou can also generate random data from various distributions. For example, togenerate 100 random numbers from a normal distribution, use the followingcommandsequence:
Calc&RandomData&Normal
CompletetheNormalDistributiondialogboxbytypingthefollowingresponse : : :
Click OK and 100 random numbers from normal distribution with mean 50 andstandard deviation 5will be generated and stored in column C4 of theworksheet.NamethiscolumnRandomNumbers.
8. …..
9. DoingaSimpleAnalysis….AssumingthedatafileORDERS.MTWisopenwithcolumnC1ofthedatafilewithnumber of orders for 50weeks. To calculate the descriptive statistics for this data,followthecommandsequencebelow
Stat&BasicStatistics&DisplayDescriptiveStatistics
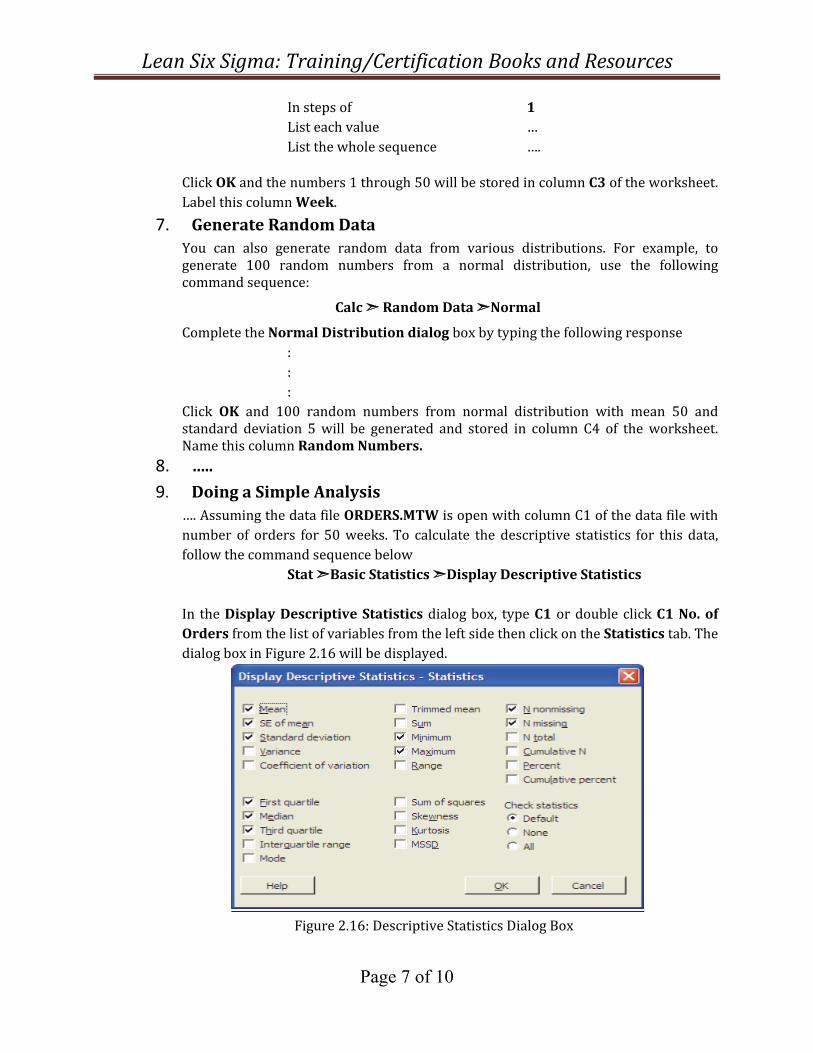
In theDisplayDescriptiveStatisticsdialogbox, typeC1 ordoubleclickC1No.ofOrdersfromthelistofvariablesfromtheleftsidethenclickontheStatisticstab.ThedialogboxinFigure2.16willbedisplayed.
Figure2.16:DescriptiveStatisticsDialogBox

LeanSixSigma:Training/CertificationBooksandResources
Page 8 of 10
…..YoumayselectadditionalstatisticsandthenclickOK.YouwillbebacktoDisplayDescriptive Statistics dialog box. Click OK and the selected statistics will becalculatedanddisplayedontheSessionwindowasshowninTable2.2.
Table2.2
Descriptive Statistics: No. of Orders
Variable N N* Mean SE Mean StDev Minimum Q1 Median Q3
No. of Orders 50 0 144.52 4.10 29.02 81.00 130.25 142.50 164.75
Variable Maximum
No. of Orders 198.00
YoucanalsoconstructsimplegraphsofyourdatabyclickingonGraphstabunderDisplayDescriptiveStatisticsdialogbox.Todothegraphs,usethefollowingcommandsequence:
Stat&BasicStatistics&DisplayDescriptiveStatistics
IntheDisplayDescriptiveStatisticsdialogbox,doubleclickonNo.ofOrdersontheleft….
Figure2.17:SelectingStatisticsandGraphs

LeanSixSigma:Training/CertificationBooksandResources
Page 9 of 10
10. ConstructingGraphsusingGraphMenuCommand YoucanconstructavarietyofgraphsandchartsusingtheGraphcommand.Wehaveexplainedherehowyoucandoastem‐and‐leafplot,ascatterplotandatimeseriesplot.(a) ConstructaStem‐and‐leafplotofNo.ofOrders (stored in columnC1):From
themainmenu,selectthecommandsequence:
Graph& Stem‐and‐leaf
In the Stem‐and‐leaf dialog box, select,C1No. ofOrders or …then clickOK. Thestem‐and‐leafplotshowninFigure2.18willbedisplayed.
Stem‐and‐Leaf Display: No. of Orders
Stem‐and‐leaf of No. of Orders N = 50 Leaf Unit = 1.0
2 8 17
5 9 046
8 10 035
9 11 2
12 12 558
21 13 133446789
(5) 14 12223
24 15 1277
20 16 0033333479
10 17 002469
4 18 38
2 19 38
Figure2.18:Stem‐and‐leafPlot
(b) ConstructaScatterPlot:Selectthecommandsequence
Graph&ScatterplotInthescatterplotsdialogbox,selectSimplethenclickOK.Scatterplot‐simpledialogboxwillbedisplayed. Typeorselect No.ofOrders forYvariablesandWeek for…variables. ClickOK. The scatter plot (shown below) of number of orders for 50weekswillbeshownonthegraphicswindow(Figure2.19).

LeanSixSigma:Training/CertificationBooksandResources
Page 10 of 10
Figure2.19:ScatterplotofNumberofOrders
(c) ConstructaTimeSeriesPlot
Atimeseriesplotdisplaysdataovertime.Supposewewanttoconstructatimeseriesplotofnumberofordersforthepast50weeks.Selectthecommandsequence
Graph&TimeSeriesPlot
IntheTimeSeriesPlotdialogbox,clickonSimple……
Figure2.20:ATime‐SeriesPlotofNumberofOrders11. SavingYourWork
BynowyoushouldhavedatainfourcolumnsC1,C2,C3,andC4oftheworksheet.Youcansaveyourworkusing
File&SaveCurrentWorksheetascontinued…
Index
No. o
f O
rder
s
50454035302520151051
200
180
160
140
120
100
80
Time Series Plot of No. of Orders
Week
No. o
f O
rder
s
50403020100
200
180
160
140
120
100
80
Scatterplot of No. of Orders vs Week