Embed Size (px)
Citation preview

PUBLIC DISCLOSURE
March 15, 2010
COMMUNITY REINVESTMENT ACT PERFORMANCE EVALUATION
Tioga State Bank RSSD No. 910118
1 Main Street P.O. Box 386
Spencer, NY 14883
FEDERAL RESERVE BANK OF NEW YORK
33 LIBERTY STREET NEW YORK, N.Y. 10045
NOTE: This document is an evaluation of this institution’s record of meeting the
credit needs of its entire community, including low- and moderate-income neighborhoods, consistent with safe and sound operation of the institution. This evaluation is not, nor should it be construed as, an assessment of the financial condition of this institution. The rating assigned to this institution does not represent an analysis, conclusion or opinion of the federal financial supervisory agency concerning the safety and soundness of this financial institution.

Tioga State Bank CRA Public Evaluation Spencer, NY March 15, 2010
BBi
TABLE OF CONTENTS
Institution’s CRA Rating ......................................................................................................... BB1 Description of Institution ......................................................................................................... BB2 Description of Assessment Areas ............................................................................................ BB2 Scope of Examination .............................................................................................................. BB4 Conclusions with Respect to Performance Tests ..................................................................... BB5 Lending Test ............................................................................................................................ BB5 Community Development Test ................................................................................................ BB6 Fair Lending or Other Illegal Credit Practices Review ............................................................ BB6 MSA 13780 (Binghamton, NY) – Full Scope Description of Operations ........................................................................................................ BB7 Performance Context ............................................................................................................... BB7 Conclusions with Respect to Performance Tests ..................................................................... BB9 MSA 27060 (Ithaca, NY) – Limited Scope Conclusions with Respect to Performance Tests ..................................................................... BB15 MSA 21300 (Chemung, NY) – Limited Scope Conclusions with Respect to Performance Tests ..................................................................... BB17 Exhibits
Exhibit I - Summary of Key Assessment Area Data .................................................... BB3 Exhibit II - Assessment Area Demographics MSA 13780 .......................................... BB8 Exhibit III – Loan Distribution Table MSA 27060……….. ........................................ BB16 Exhibit IV – Loan Distribution Table MSA 21300……….. ....................................... BB18
Appendices CRA Appendix A: Glossary ............................................................................................ BB19 CRA Appendix B: Map of Assessment Areas ................................................................. BB22

Tioga State Bank CRA Public Evaluation Spencer, NY March 15, 2010
BB1
INSTITUTION'S CRA RATING: Tioga State Bank (“TSB”) is rated “Satisfactory.” The following table indicates the performance level of the institution with respect to the lending and community development tests.
PERFORMANCE LEVELS
TIOGA STATE BANK
PERFORMANCE TESTS
Lending Test Community
Development Test
Outstanding
Satisfactory X X
Needs to Improve
Substantial Noncompliance
The satisfactory performance of TSB with regard to the Community Reinvestment Act (“CRA”) is based on the following performance criteria:
• The bank’s loan-to-deposit ratio was reasonable.
• A substantial majority of loans were made in the assessment areas.
• The distribution of loans to borrowers of different income levels and businesses of different sizes reflects reasonable penetration.
• The geographic distribution of loans reflects poor dispersion throughout the assessment areas.
• The level of community development loans, qualified investments and community development services demonstrates adequate responsiveness to the community development needs in the assessment areas.

Tioga State Bank CRA Public Evaluation Spencer, NY March 15, 2010
BB2
DESCRIPTION OF INSTITUTION
TSB is a retail commercial bank, wholly owned by TSB Services Inc., a one-bank holding company. The bank operates in the southwestern portion of upstate New York, with the majority of its branches located in Tioga and Broome Counties.
TSB offers a variety of commercial and consumer financial products such as fixed and adjustable rate mortgages, home equity loans and lines of credit, personal and unsecured loans, and commercial and agricultural loan products. As of December 31, 2009, the bank’s total assets were $356 million, with total net loans and leases of $214 million and total deposits of $288 million. Of the total loans originated in 2009, $154 million (72%) are real estate-related.
TSB operates 11 full-service branch offices, five of which are located in Tioga County, four in Broome County, one in Chemung County, and one in Tompkins County. The bank operates in a competitive market with branches of numerous local, regional, and international banks operating in the bank’s assessment areas. Based on deposits reported to the Federal Deposit Insurance Corporation (“FDIC”) on June 30, 2009, TSB has the fourth largest deposit market share (9.1%) in the Binghamton, NY metropolitan statistical area (“MSA”), the assessment area where the bank conducts a majority of its business.
TSB’s previous CRA examination was dated March 10, 2008, and the bank received an overall rating of “Satisfactory”. The previous examination was conducted using the Federal Financial Institutions Examination Council’s (“FFIEC”) Intermediate Small Bank Examination Procedures.
There are no financial or legal impediments preventing TSB from servicing the credit needs of consumers and small businesses in its assessment areas.
DESCRIPTION OF ASSESSMENT AREAS
TSB has three assessment areas located in central and southern New York State, within three contiguous Metropolitan Statistical Areas (MSAs). The assessment areas are as follows:
• MSA 13780 (Binghamton, NY), consisting of Tioga County and a portion of Broome County.
• MSA 21300 (Chemung, NY), consisting of a portion of Chemung County.
• MSA 27060 (Ithaca, NY), consisting of a portion of Tompkins County.
The assessment areas are in compliance with the requirements of Section 228.41 of Regulation BB and do not arbitrarily exclude low- and moderate-income (“LMI”) geographies. A map illustrating TSB’s assessment areas is on page BB22.

Tioga State Bank CRA Public Evaluation Spencer, NY March 15, 2010
BB3
EXHIBIT I Summary of Key Assessment Area Data
MSA 13780
Binghamton, NY MSA 27060 Ithaca, NY
MSA 21300 Chemung, NY TOTALS
Total Population4 227,714 14,693 7,789 250,196 Population % of AA population 91% 6% 3% 100% Families 58,303 3,945 2,260 64,508 Families % of AA families 90% 6% 4% 100%
Total Census Tracts4 58 3 2 63 Tracts % AA tracts 92% 5% 3% 100% LMI tracts 17 0 0 17 LMI tracts % all AA LMI tracts 100% 0% 0% 100%
Total Owner-Occupied Units4 60,427 4,402 2,529 67,358 Units % of AA units 90% 7% 4% 100%
Business Establishments5 7,805 469 153 8,427 Bus. est. % AA bus. est. 93% 6% 2% 100%
Number of Branches1 9 1 1 11 Branches % all branches 82% 9% 9% 100% Branches in LMI tracts 1 0 0 1 LMI branches % AA LMI branches 100% 0% 0% 100%
Branch Deposits ($'000s)2 242,614 33,340 8,638 284,592 Deposits % AA deposits 85% 12% 3% 100% Deposit Market Share (%)/ Rank in Market* 9.07%/4 2.11%/9 0.74%/9 N/A
Home Purchase Originations3 166 16 9 191 HP originations % AA orig. 87% 8% 5% 100%
Refinance Originations3 89 8 5 102 Refi orig. % AA orig. 87% 8% 5% 100%
Home Improvement Originations3 144 30 10 184 Home Improvement orig. % AA orig. 78% 16% 5% 100%
Multi-Family Originations3 3 0 0 3 SB orig. % AA orig. 100% 0% 0% 100%
Small Business Originations3 229 21 9 259 SB orig. % AA orig. 88% 8% 3% 100%
Consumer Originations 642 116 66 824 Consumer orig. % AA orig. 78% 14% 8% 100%
Combined Loan Totals 1,273 191 99 1,563 % of AA Orig. 81% 12% 6% 100%
(1) Branch numbers are as of 12/31/2009. (2) Branch deposits and deposit market share are from the FDIC as of 6/30/09. (3)Originations are loans reported under HMDA or CRA small business reporting for 2008 and 2009. (4)Demographic information was obtained from the 2000 Census. (5) Business establishments’ information was reported by D&B for 2008.

Tioga State Bank CRA Public Evaluation Spencer, NY March 15, 2010
BB4
SCOPE OF EXAMINATION
Procedures and Products
TSB was examined using the FFIEC CRA Intermediate-Small Bank Examination Procedures, which consist of the lending and community development tests. The examination covers the evaluation period of January 1, 2008 through December 31, 2009.
Examiners analyzed a sample of HMDA-related loans, consumer loans, and small business loans originated during the evaluation period. Loan samples were selected using the Board of Governors’ sampling procedures. The loan sample included 296 HMDA-related loans, 125 small business loans, and 168 consumer loans. Examiners verified the integrity of the bank’s HMDA-related, small business and consumer loan data as part of the onsite examination. Community development activities occurring during the evaluation period were also considered.
A full scope review was conducted of MSA 13780 (Binghamton, NY), while limited scope reviews were conducted of MSA 27060 (Ithaca, NY) and MSA 21300 (Chemung, NY). MSA 13780 (Binghamton, NY) was selected for a full-scope review because it contains 82% of the bank’s branches, 85% of retail deposits and 81% of retail lending activity.
Lending Distribution Analysis
The analysis of borrower and geographic distribution was based on the loans made in the assessment areas. To analyze the borrower characteristics of HMDA-related and consumer loans, the proportion of originations to LMI borrowers was compared with the proportion of LMI families in the assessment areas. Income estimates from the U.S. Department of Housing and Urban Development (“HUD”) were used to categorize borrower income. For small business loans, the bank’s percentage of loans to businesses with gross annual revenues (“GAR”) of $1 million or less was compared to the percentage of all such businesses in the assessment areas. The size of the small business loan was also used as a proxy to identify lending to businesses with GAR of $1 million or less.
To evaluate geographic distribution, the proportion of loan originations was compared to the proportion of owner-occupied housing units located in LMI geographies. For small business loans, the analysis compared the proportion of loan originations to the proportion of businesses located in LMI geographies.
The bank’s performance was also compared to the 2008 loan data of the aggregate of all HMDA-reporting lenders. Aggregate data for 2009 was not publicly available for comparison.
Peer data was used for the loan-to-deposit analysis. Local peer banks were selected based on the amount of deposits and number of branches in order to choose banks similarly-sized to TSB within MSA 13780. Local peer banks selected include Chemung Canal Trust Company and Peoples National Bank. TSB’s loan-to-deposit performance was also compared to its National

Tioga State Bank CRA Public Evaluation Spencer, NY March 15, 2010
BB5
Peer group. The bank’s performance was also compared with peer banks in MSA 13780 for community development loans and qualified investments.
Community Contacts
In order to gain an understanding of local credit needs, examiners conducted an interview with a community development organization that focuses on promoting economic development through offering services for small businesses in Tioga County.
CONCLUSIONS WITH RESPECT TO PERFORMANCE TESTS
LENDING TEST
TSB’s record of meeting the credit needs of its assessment areas through its lending performance is rated satisfactory. TSB originated a substantial majority of its loans within its assessment areas and its loan-to-deposit ratio was reasonable. The overall distribution of its loans to borrowers of different incomes and businesses of different sizes was also reasonable. However, the geographic distribution of loans reflects poor penetration throughout the bank’s assessment areas.
Loan-to-Deposit Ratio
TSB’s loan-to-deposit ratio was reasonable given the bank’s size, financial condition, and the credit needs of its assessment areas. The bank’s average loan-to-deposit ratio for the eight recent quarters from January 1, 2008 to December 31, 2009 was 87%, based on information contained in its Consolidated Report of Condition and Income. This ratio was below the national peer average of 112% for similarly-sized banks, but comparable to an average of 88% for two similarly-sized banks with branches located in TSB’s assessment areas.
Lending in the Assessment Area
TSB originated a substantial majority of its loans in its assessment areas. Overall, 86% of the sampled loans were originated in the assessment areas. Of the sample of 296 HMDA loans and 168 consumer loans analyzed, 80% of the HMDA loans and 91% of the consumer loans were extended to individuals residing in the bank’s assessment areas. Of the sample of 125 small business loans evaluated, 93% were extended to business establishments in the assessment areas.
Lending to Borrowers of Different Incomes and to Businesses of Different Sizes
TSB’s overall lending penetration among borrowers of different income levels (including LMI individuals) and businesses of different sizes was reasonable based on reasonable performance in MSA 13780 (Binghamton, NY).

Tioga State Bank CRA Public Evaluation Spencer, NY March 15, 2010
BB6
Geographic Distribution of Loans
TSB’s geographic distribution of loans reflected poor dispersion based on poor performance in MSA 13780 (Binghamton, NY).
Response to Complaints
TSB received no complaints relating to the bank’s CRA performance. Since the previous examination, there were no CRA-related complaints filed with the Federal Reserve Bank of New York.
COMMUNITY DEVELOPMENT TEST
TSB’s community development performance was rated satisfactory. This conclusion was based on a reasonable level of community development loans and investments made and services conducted, primarily in MSA 13780 (Binghamton, NY). This assessment considers TSB’s capacity and the need and availability of opportunities for community development in its assessment areas.
During the examination period, the bank made a total of $7 million in community development loans and qualified investments, of which 100% were made in the bank’s assessment areas. In terms of dollar volume, total community development efforts increased by 13% since the prior examination. See chart below for details of the bank’s total community development loans and qualified investments made within its assessment areas.
Tioga State Bank Community Development Loans & Qualified Investments
Loans and Investments
Affordable Housing
Community Services
Economic Development
Revitalize and Stabilize Totals
# ($000s) # ($000s) # ($000s) # ($000s) # ($000s)
Loans 4 $1,222 2 $1,400 1 $2,500 2 $1,846 9 $6,968
Investments 1 $13 17 $20 0 $0 0 $0 18 $33
Total Loans and
Investments 5 $1,235 19 $1,420 1 $2,500 2 $1,846 27 $7,001
FAIR LENDING OR OTHER ILLEGAL CREDIT PRACTICES REVIEW
TSB is in compliance with the substantial provisions of the antidiscrimination laws and regulations. No credit practices were identified as being inconsistent with helping to meet the credit needs of the assessment areas.

Tioga State Bank CRA Public Evaluation Spencer, NY March 15, 2010
BB7
METROPOLITAN AREA MSA 13780 (BINGHAMTON, NY)
DESCRIPTION OF OPERATIONS
TSB’s banking activities within its assessment areas were primarily conducted within MSA 13780. As of December 31, 2009, TSB operated 9 of 11 branches (82%) in this MSA. These branches generated $243 million in deposits, which accounts for 85% of the bank’s total branch deposits as of June 30, 2009. Of the bank’s total HMDA loans (480) originated in the assessment areas during 2008 and 2009, 84% were originated in this MSA. Of its total consumer loans (824) originated in the assessment areas, 78% were originated in this MSA. Of its total small business loans originated in the assessment areas (259), 88% were originated in this MSA. For additional assessment area data, see Exhibits I and II.
PERFORMANCE CONTEXT
The following demographic and economic information was obtained from publicly available sources that include the U.S. Department of Commerce’s Bureau of Census (2000), U.S. Department of Labor, HUD, the National Association of Realtors, and Moody’s Economy.
Demographic Characteristics
According to the 2000 Census, the population of MSA 13780 is 227,714. The MSA is comprised of Broome and Tioga Counties, with Broome County representing 88% of the MSA’s population. The City of Binghamton is the largest city in the MSA and is located within Broome County. TSB has historically operated primarily within Tioga County but has expanded into Broome County over the last few years. Of the 58 census tracts located in MSA 13780, 17 or 29% are LMI. All of the LMI census tracts are located in Broome County.
Income Characteristics
According to the 2000 Census, MSA 13780 has 58,303 families, of which 10,767 (19%) are low-income families and 10,804 (19%) are moderate-income families. The HUD-adjusted median family income for MSA 13780 was $58,100 in 2008 and $58,600 in 2009. These income levels are low in comparison to New York State’s 2009 HUD-adjusted median family income of $67,900.
Housing Characteristics
According to the 2000 Census, MSA 13780 has 99,588 housing units, of which 61% are owner-occupied, 31% are rental, and 8% are vacant. Of the owner-occupied housing units, 1% are in
Tioga State Bank CRA Public Evaluation Spencer, NY March 15, 2010
BB8
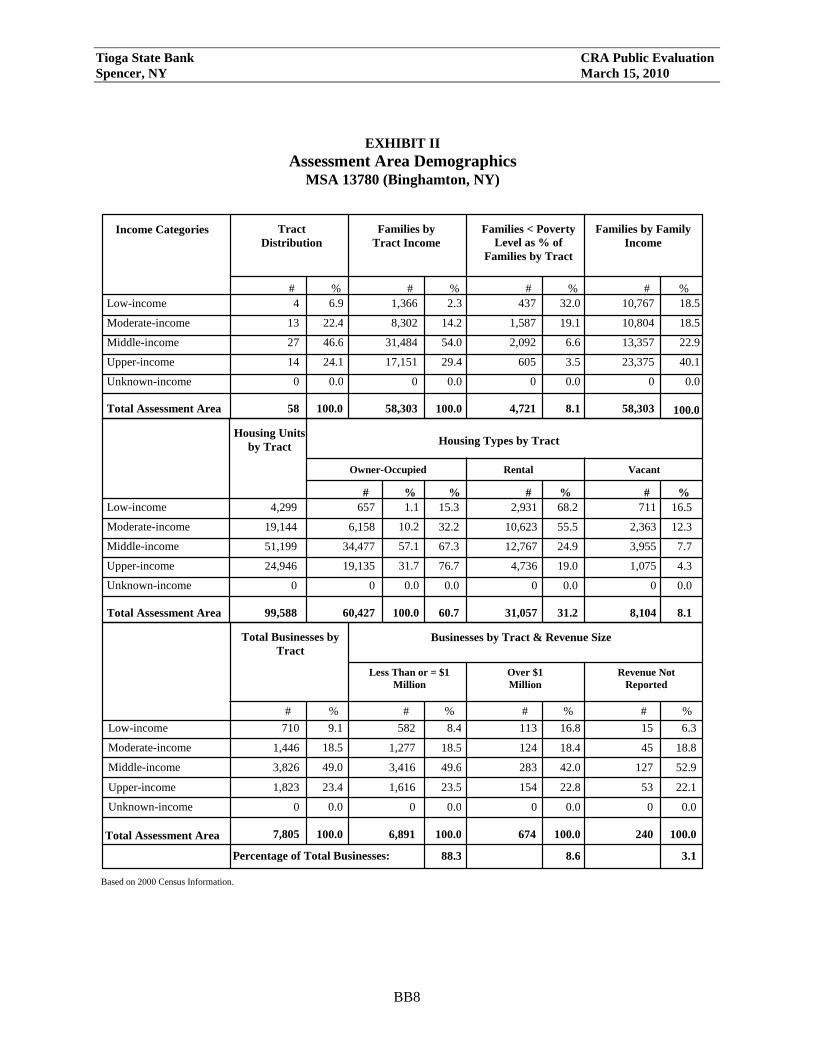
EXHIBIT II Assessment Area Demographics
MSA 13780 (Binghamton, NY)
Families by Family Income
Families < Poverty Level as % of
Families by Tract
Families by Tract Income
Tract Distribution
Income Categories
# # # # % % % % Low-income 4 1,366 437 10,767 6.9 2.3 32.0 18.5 Moderate-income 13 8,302 1,587 10,804 22.4 14.2 19.1 18.5 Middle-income 27 31,484 2,092 13,357 46.6 54.0 6.6 22.9 Upper-income 14 17,151 605 23,375 24.1 29.4 3.5 40.1 Unknown-income 0 0 0 0 0.0 0.0 0.0 0.0
Total Assessment Area 58 58,303 4,721 8.1 58,303 100.0 100.0 100.0
Vacant Rental Owner-Occupied
Housing Units by Tract Housing Types by Tract
# # # % % % % Low-income 4,299 657 2,931 711 1.1 15.3 68.2 16.5 Moderate-income 19,144 6,158 10,623 2,363 10.2 32.2 55.5 12.3 Middle-income 51,199 34,477 12,767 3,955 57.1 67.3 24.9 7.7 Upper-income 24,946 19,135 4,736 1,075 31.7 76.7 19.0 4.3 Unknown-income 0 0 0 0 0.0 0.0 0.0 0.0
Total Assessment Area 99,588 60,427 31,057 8,104 100.0 60.7 31.2 8.1
Revenue Not Reported
Over $1 Million
Less Than or = $1 Million
Total Businesses by Tract
Businesses by Tract & Revenue Size
# # # # % % % % Low-income 710 582 113 15 8.4 16.8 6.3 9.1 Moderate-income 1,446 1,277 124 45 18.5 18.4 18.8 18.5 Middle-income 3,826 3,416 283 127 49.6 42.0 52.9 49.0 Upper-income 1,823 1,616 154 53 23.5 22.8 22.1 23.4 Unknown-income 0 0 0 0 0.0 0.0 0.0 0.0
Total Assessment Area Percentage of Total Businesses:
100.0 100.0 100.0 100.0 88.3 8.6 3.1
7,805 6,891 674 240
Based on 2000 Census Information.

Tioga State Bank CRA Public Evaluation Spencer, NY March 15, 2010
BB9
low-income census tracts and 10% are in moderate-income tracts. The relatively lower levels of owner-occupancy in LMI census tracts limit opportunities for homeownership.
Housing costs are comparatively low in the MSA, particularly in comparison to the state average median sales price. According to the National Association of Realtors, the median annual sales price of existing single-family homes in MSA 13780 was $113,700 in 2008 and increased slightly to $115,700 in 2009. New York State’s median annual sales price for an existing single-family home was $253,800 in 2009. Housing affordability remains difficult for LMI borrowers in the MSA. The median housing cost in the assessment area is about four times the median family income of a low-income borrower and three times the income of a moderate-income borrower.
Community contacts, reported, however, that the area has not been affected by the housing foreclosure crisis since housing prices were never inflated. A community development organization noted that home improvement lending is a need in the area because housing is relatively old, and many houses are in need of basic upgrades.
Labor, Employment and Economic Characteristics
MSA 13780 has 7,805 business establishments, of which 88% had gross annual revenues (“GAR”) of less than or equal to $1 million. Of the total businesses, 710 (9%) are in low-income areas and 1,446 (19%) are in moderate-income areas. Community contacts noted that small business and agricultural financing are important assessment area credit needs.
Moody’s Economy reported that, as of December 2009, the Binghamton area is still in a severe recession, and there have been few signs of economic improvement. Employment rates have fallen in nearly every industry, with particularly steep losses in manufacturing and transportation/utilities. The unemployment rate in MSA 13780 was 5.4% in 2008 and increased to 8.2% in 2009, which was generally comparable with New York State’s 2009 unemployment rate of 8.9%. Community contacts reported that the area continues to lose jobs, particularly because of layoffs at Lockheed Martin, the area’s second largest employer.
CONCLUSIONS WITH RESPECT TO PERFORMANCE TESTS
LENDING TEST
TSB’s record of lending in MSA 13780 was reasonable. In making this conclusion, consideration was given to the demographics of the assessment area. Below is an analysis of the bank’s lending to borrowers of different income levels and businesses of different sizes as well as an analysis of the geographic distribution of loans throughout the MSA.

Tioga State Bank CRA Public Evaluation Spencer, NY March 15, 2010
BB10
Lending to Borrowers of Different Incomes and to Businesses of Different Sizes
In MSA 13780, TSB’s record of lending to borrowers of different income levels and businesses of different sizes reflects reasonable distribution. An analysis of the lending distribution in each loan category follows:
Home Purchase Loans
TSB’s distribution of home purchase loans to LMI borrowers was reasonable. The bank originated 9% or six home purchase loans to low-income borrowers, compared to 19% of low-income families residing in the assessment area. The bank’s home purchase lending to low-income borrowers was similar to the aggregate, which also originated 9% of its home purchase loans to low-income borrowers.
The bank originated 26% or 18 home purchase loans to moderate-income borrowers, compared to 19% of moderate-income families residing in the area. Home purchase lending to moderate-income borrowers was similar to the aggregate, which originated 24% of its home purchase loans to moderate-income borrowers.
Refinance Loans
TSB’s distribution of refinance loans to LMI borrowers was poor. The bank originated 4% or two refinance loans to low-income borrowers, compared to 19% of low-income families residing in the assessment area. The bank’s refinance lending to low-income borrowers was significantly below the aggregate, which originated 9% of its refinance loans to low-income borrowers in 2008.
With respect to lending to moderate-income families, the bank made 11% or six refinance loans to moderate-income borrowers, compared to 19% of moderate-income families residing in the area. Refinance lending to moderate-income borrowers was significantly below the aggregate, which originated 22% of its refinance loans to moderate-income borrowers.
Home Improvement Loans
TSB’s distribution of home improvement loans to LMI borrowers was reasonable. The bank originated 15% or 10 home improvement loans to low-income borrowers, compared to 19% of low-income families residing in the assessment area. The bank’s home improvement lending to low-income borrowers was slightly above the aggregate, which originated 13% of its home improvement loans to low-income borrowers.
The bank originated 19% or 13 home improvement loans to moderate-income borrowers, compared to 19% of moderate-income families residing in the area. Home improvement lending to moderate-income borrowers was similar to the aggregate, which originated 21% of its home improvement loans to moderate-income borrowers.

Tioga State Bank CRA Public Evaluation Spencer, NY March 15, 2010
BB11
Consumer Loans
TSB’s distribution of consumer loans to LMI borrowers was excellent. The bank originated 30% or 37 consumer loans to low-income borrowers, compared to 24% of low-income households in the assessment area. The bank also made 21% or 26 consumer loans to moderate-income borrowers, compared to 16% of moderate-income households in the area.
Lending to Businesses of Different Sizes
TSB’s distribution of loans to businesses of different sizes was reasonable. The bank made 71% or 71 loans to businesses with GAR of $1 million or less, compared to 88% of such businesses in the assessment area. The bank’s small business lending performance exceeded the aggregate, which made 33% of its loans to businesses with GAR of $1 million or less. Of the bank’s small business loans originated, 69% were in amounts of $100,000 or less, compared to the aggregate, which originated 95% of its small business loans in amounts of $100,000 or less.
Geographic Distribution of Loans
TSB’s overall distribution of loans in geographies of different income levels in MSA 13780 was poor and needs to improve. This conclusion takes into account the number of LMI tracts and limited opportunities for loan originations within these tracts, as well as the bank’s size and competition in the assessment area. An analysis of the lending distribution in each loan category follows:
Home Purchase Loans
TSB’s distribution of home purchase loans in LMI geographies was poor. The bank did not originate any home purchase loans in low-income tracts. However, opportunities to lend in low-income tracts were very limited, since only 1% or 657 of the owner-occupied units are located in these geographies. The aggregate’s home purchase lending in low-income tracts was similar to the bank. The aggregate made 1% of its home purchase loans in low-income geographies.
The bank originated 4% or three home purchase loans in moderate-income census tracts, compared to 10% of owner-occupied housing units located in moderate-income geographies in the MSA. TSB’s performance in moderate-income geographies was significantly below the aggregate, which made 13% of its home purchase loans in moderate-income geographies.
Refinance Loans
TSB’s distribution of refinance loans in LMI geographies was poor. The bank did not originate any refinance loans in low-income tracts. However, opportunities to make refinance loans in low-income tracts were very limited as only 1% or 657 of the owner-occupied units are located in low-income geographies. The aggregate’s refinance lending in low-income tracts was less than 1% of its refinance loans.

Tioga State Bank CRA Public Evaluation Spencer, NY March 15, 2010
BB12
The bank originated 4% or two refinance loans in moderate-income tracts, compared to 10% of owner-occupied housing units located in moderate-income geographies. TSB’s refinance lending performance in moderate-income geographies was significantly below the aggregate, which made 10% of its refinance loans in moderate-income geographies.
Home Improvement Loans
TSB’s distribution of home improvement loans in LMI geographies was poor. The bank did not originate any home improvement loans in low-income tracts. However, TSB had very limited opportunities to make home improvement loans in low-income tracts, as only 1% or 657 of the owner-occupied units are located in low-income geographies. The aggregate made less than 1% of its home improvement loans in low-income geographies.
The bank also did not originate any home improvement loans in moderate-income geographies, compared to 10% of owner-occupied housing units located in moderate-income geographies. TSB’s performance in making home improvement loans in moderate-income tracts was significantly below the aggregate, which made 7% of its home improvement loans in moderate-income geographies.
Consumer Loans TSB’s distribution of consumer loans in LMI areas in MSA 13780 was poor. The bank did not make any consumer loans in low-income geographies, compared to 4% of households in low-income geographies. In moderate-income geographies, the bank made 2% or three of its consumer loans, compared to 18% of households in moderate-income geographies.
Small Business Loans
TSB’s distribution of small business loans in LMI geographies was reasonable. The bank originated 8% or eight small business loans in low-income census tracts, compared to 8% of small businesses in the assessment area located in low-income geographies. The bank’s small business lending in low-income geographies was slightly below the performance of the aggregate, which made 9% of its small business loans in low-income geographies.
The bank originated 11% or 11 small business loans in moderate-income census tracts, compared to 19% of small businesses in the assessment area located in moderate-income geographies. TSB’s small business lending in moderate-income geographies was below the aggregate, which made 17% of its small business loans in moderate-income geographies.

Tioga State Bank CRA Public Evaluation Spencer, NY March 15, 2010
BB13
COMMUNITY DEVELOPMENT TEST
TSB’s community development performance in MSA 13780 demonstrates adequate responsiveness to the community development needs of the assessment area. The bank made a reasonable level of community development loans and services and a limited level of community development investments in the assessment area. This assessment considers TSB’s capacity and the need and availability of such opportunities for community development in MSA 13780. The bank’s level of community development activities compared favorably to two similarly-situated banks located in MSA 13780.
The bank’s overall community development loans and investments were primarily targeted to MSA 13780, which had $4.5 million or 64% of the bank’s total community development loans and investments.
Community Development Loans
In MSA 13780, TSB made $4.47 million in community development loans. Of this total, 28% targeted affordable housing initiatives, 31% financed community services, and 41% targeted economic development.
Examples of TSB’s community development loans made in MSA 13780 include:
• A commercial loan to fund a mobile housing park that provides 21 rent-to-own affordable housing units in Broome County.
• A commercial loan to fund the development of a mobile housing park that will provide 33 affordable housing units in Tioga County.
• A commercial loan to finance renovations to a center that provides services for low- and moderate-income disabled individuals in Broome County.
Qualified Investments
TSB provided a limited level of qualified investments to meet the needs of the assessment area. In MSA 13780, the bank made $32 thousand in qualified investments and grant donations. Qualified investments consisted of charitable donations to 17 community service organizations in Tioga and Broome Counties and a contribution to the Federal Home Loan Bank Affordable Housing Program.
Community Development Services
TSB employees participated in community development service activities through offering technical assistance to various organizations that furnish community development services to LMI individuals. The bank’s community development services were primarily targeted to MSA

Tioga State Bank CRA Public Evaluation Spencer, NY March 15, 2010
BB14
13780. In MSA 13780, 15 employees served as directors, treasurers, and committee members to 25 community development organizations. These organizations include:
• A community service organization in Tioga County whose mission is to provide services to promote learning, encourage high aspirations, and support innovation, creativity, and vitality particularly to the LMI youth of Spencer-Van Etten.
• A public service organization that serves the rural counties of Bradford, Sullivan, and Tioga in Pennsylvania and Tioga County in New York State. The organization serves as a vehicle for individuals, not-for-profit organizations and businesses to establish permanent named funds that will provide grants in perpetuity to local charitable organizations and programs.
• A community service organization that assists residents of Broome County. The organization provides services such as early child care, elderly care, youth development programs, and chemical dependency prevention programs.
In terms of retail banking services, TSB’s overall branch distribution provides some accessibility to the LMI population and geographies within the assessment areas. Within MSA 13780, the bank operates nine branches, of which one is in a moderate-income tract. All branches provide a full range of financial services to the communities they serve.

Tioga State Bank CRA Public Evaluation Spencer, NY March 15, 2010
BB15
METROPOLITAN AREA MSA 27060 (ITHACA, NY)
(LIMITED REVIEW)
The bank’s performance in MSA 27060 was consistent with overall lending performance and below overall community development performance.
The bank has a limited presence in MSA 27060, reflective of its lending activity. Only one of its eleven branches operates in MSA 27060. As of June 30, 2009, this branch generated 12% of the total assessment areas’ branch deposits. A total of 191 loans were originated in this assessment area during the course of the evaluation period. The loan sample analyzed consisted of 28 HMDA loans, 19 consumer loans, and 12 small business loans originated within the assessment area. TSB’s record of lending in MSA 27060 to borrowers of different income levels and businesses of different sizes was consistent with the overall lending test performance. The assessment area has no LMI tracts, so a geographic distribution analysis was not conducted. In terms of community development efforts, the bank did not make any community development loans or investments in MSA 27060. See Exhibits I and III for additional assessment area data.

Tioga State Bank CRA Public Evaluation Spencer, NY March 15, 2010
BB16
EXHIBIT III Tioga State Bank
Loan Distribution Table MSA 27060 (Ithaca, NY)
Income Categories HMDA
By Tract Income By Borrower Income 2008-2009 Bank 2008 Aggregate 2008-2009 Bank 2008 Aggregate
# % % $(000s) % % $(000s) # % % $(000s) % % $(000s) Home Purchase Low 0 0.0% 0.0% 0.0% 0.0% 1 16.7% 19.6% 10.6% 5.9% Moderate 0 0.0% 0.0% 0.0% 0.0% 1 16.7% 4.2% 28.8% 22.5% Middle 6 100.0% 100.0% 100.0% 100.0% 1 16.7% 16.3% 28.8% 32.0% Upper 0 0.0% 0.0% 0.0% 0.0% 3 50.0% 59.8% 27.3% 34.7% Unknown 0 0.0% 0.0% 0.0% 0.0% 0 0.0% 0.0% 4.5% 4.9% Total 6 100.0% 100.0% 100.0% 100.0% 6 100.0% 100.0% 100.0% 100.0% Refinance Low 0 0.0% 0.0% 0.0% 0.0% 0 0.0% 0.0% 11.0% 7.3% Moderate 0 0.0% 0.0% 0.0% 0.0% 2 66.7% 74.7% 30.3% 25.5% Middle 3 100.0% 100.0% 100.0% 100.0% 0 0.0% 0.0% 22.6% 21.9% Upper 0 0.0% 0.0% 0.0% 0.0% 1 33.3% 25.3% 29.7% 40.2% Unknown 0 0.0% 0.0% 0.0% 0.0% 0 0.0% 0.0% 6.5% 5.0% Total 3 100.0% 100.0% 100.0% 100.0% 3 100.0% 100.0% 100.0% 100.0% Home Improvement Low 0 0.0% 0.0% 0.0% 0.0% 5 26.3% 19.5% 25.3% 11.9% Moderate 0 0.0% 0.0% 0.0% 0.0% 7 36.8% 38.3% 22.7% 28.0% Middle 19 100.0% 100.0% 100.0% 100.0% 4 21.1% 25.5% 18.7% 24.1% Upper 0 0.0% 0.0% 0.0% 0.0% 3 15.8% 16.7% 32.0% 31.6% Unknown 0 0.0% 0.0% 0.0% 0.0% 0 0.0% 0.0% 1.3% 4.4% Total 19 100.0% 100.0% 100.0% 100.0% 19 100.0% 100.0% 100.0% 100.0% Multi-Family Low 0 0.0% 0.0% 0.0% 0.0% 0 0.0% 0.0% 0.0% 0.0% Moderate 0 0.0% 0.0% 0.0% 0.0% 0 0.0% 0.0% 0.0% 0.0% Middle 0 0.0% 0.0% 100.0% 100.0% 0 0.0% 0.0% 0.0% 0.0% Upper 0 0.0% 0.0% 0.0% 0.0% 0 0.0% 0.0% 0.0% 0.0% Unknown 0 0.0% 0.0% 0.0% 0.0% 0 0.0% 0.0% 100.0% 100.0% Total 0 0.0% 0.0% 100.0% 100.0% 0 0.0% 0.0% 100.0% 100.0% HMDA Totals Low 0 0.0% 0.0% 0.0% 0.0% 6 21.4% 17.6% 13.7% 6.5% Moderate 0 0.0% 0.0% 0.0% 0.0% 10 35.7% 31.4% 27.9% 22.8% Middle 28 100.0% 100.0% 100.0% 100.0% 5 17.9% 20.1% 23.8% 25.0% Upper 0 0.0% 0.0% 0.0% 0.0% 7 25.0% 31.0% 29.0% 35.1% Unknown 0 0.0% 0.0% 0.0% 0.0% 0 0.0% 0.0% 5.7% 10.6% Total 28 100.0% 100.0% 100.0% 100.0% 28 100.0% 100.0% 100.0% 100.0% SMALL BUSINESS By Tract Income 2008-2009 Bank 2008 Aggregate # % % $(000s) % % $(000s) Low 0 0.0% 0.0% 0.0% 0.0% Moderate 0 0.0% 0.0% 0.0% 0.0% Middle 12 100.0% 100.0% 100.0% 100.0% Upper 0 0.0% 0.0% 0.0% 0.0% Unknown 0 0.0% 0.0% 0.0% 0.0% Tract Unknown 0 0.0% 0.0% 0.0% 0.0% Total 12 100.0% 100.0% 100.0% 100.0% By Revenue $1 Million or Less 10 83.3% 88.3% 39.0% 51.2% By Loan Size $100,000 or less 11 91.7% 42.1% 98.3% 70.2% $100,001-$250,000 1 8.3% 57.9% 1.4% 18.4% $250,001-$1 Million 0 0.0% 0.0% 0.3% 11.4% Total 12 100.0% 100.0% 100.0% 100.0% Originations and Purchases

Tioga State Bank CRA Public Evaluation Spencer, NY March 15, 2010
BB17
METROPOLITAN AREA MSA 21300 (CHEMUNG, NY)
(LIMITED REVIEW)
The bank’s performance in MSA 21300 was consistent with overall lending performance and overall community development performance.
The bank has a limited presence in MSA 21300, reflective of its lending activity. Only one of its eleven branches operates in MSA 21300. As of June 30, 2009, the branch generated 3% of the total assessment areas’ branch deposits. A total of 99 loans were originated in this assessment area during the course of the evaluation period. The loan sample analyzed consisted of 13 HMDA loans, 8 consumer loans, and 4 small business loans originated within the assessment area. TSB’s record of lending in MSA 21300 to borrowers of different income levels and businesses of different sizes was consistent with the bank’s overall performance. The assessment area has no LMI tracts, so a geographic distribution analysis was not conducted. In terms of community development efforts, the bank made 36% of its total community development loans and investments in MSA 21300. See Exhibits I and IV for additional assessment area data.

Tioga State Bank CRA Public Evaluation Spencer, NY March 15, 2010
BB18
EXHIBIT IV Tioga State Bank
Loan Distribution Table MSA 21300 (Chemung, NY)
Income Categories HMDA
By Tract Income By Borrower Income 2008-2009 Bank 2008 Aggregate 2008-2009 Bank 2008 Aggregate
# % % $(000s) % % $(000s) # % % $(000s) % % $(000s) Home Purchase Low 0 0.0% 0.0% 0.0% 0.0% 1 33.3% 20.8% 6.8% 4.4% Moderate 0 0.0% 0.0% 0.0% 0.0% 1 33.3% 12.5% 22.0% 13.9% Middle 3 100.0% 100.0% 100.0% 100.0% 0 0.0% 0.0% 22.0% 15.4% Upper 0 0.0% 0.0% 0.0% 0.0% 1 33.3% 66.7% 44.1% 60.5% Unknown 0 0.0% 0.0% 0.0% 0.0% 0 0.0% 0.0% 5.1% 5.7% Total 3 100.0% 100.0% 100.0% 100.0% 3 100.0% 100.0% 100.0% 100.0% Refinance Low 0 0.0% 0.0% 0.0% 0.0% 0 0.0% 0.0% 3.6% 4.1% Moderate 0 0.0% 0.0% 0.0% 0.0% 0 0.0% 0.0% 19.6% 16.5% Middle 5 100.0% 100.0% 100.0% 100.0% 2 40.0% 48.6% 35.7% 32.6% Upper 0 0.0% 0.0% 0.0% 0.0% 3 60.0% 51.4% 33.9% 40.5% Unknown 0 0.0% 0.0% 0.0% 0.0% 0 0.0% 0.0% 7.1% 6.3% Total 5 100.0% 100.0% 100.0% 100.0% 5 100.0% 100.0% 100.0% 100.0% Home Improvement Low 0 0.0% 0.0% 0.0% 0.0% 1 20.0% 21.5% 12.2% 4.8% Moderate 0 0.0% 0.0% 0.0% 0.0% 2 40.0% 6.5% 26.5% 14.5% Middle 5 100.0% 100.0% 100.0% 100.0% 2 40.0% 72.0% 40.8% 49.7% Upper 0 0.0% 0.0% 0.0% 0.0% 0 0.0% 0.0% 20.4% 31.0% Unknown 0 0.0% 0.0% 0.0% 0.0% 0 0.0% 0.0% 0.0% 0.0% Total 5 100.0% 100.0% 100.0% 100.0% 5 100.0% 100.0% 100.0% 100.0% Multi-Family Low 0 0.0% 0.0% 0.0% 0.0% 0 0.0% 0.0% 0.0% 0.0% Moderate 0 0.0% 0.0% 0.0% 0.0% 0 0.0% 0.0% 0.0% 0.0% Middle 0 0.0% 0.0% 0.0% 0.0% 0 0.0% 0.0% 0.0% 0.0% Upper 0 0.0% 0.0% 0.0% 0.0% 0 0.0% 0.0% 0.0% 0.0% Unknown 0 0.0% 0.0% 0.0% 0.0% 0 0.0% 0.0% 0.0% 0.0% Total 0 0.0% 0.0% 0.0% 0.0% 0 0.0% 0.0% 0.0% 0.0% HMDA Totals Low 0 0.0% 0.0% 0.0% 0.0% 2 15.4% 11.8% 7.3% 4.3% Moderate 0 0.0% 0.0% 0.0% 0.0% 3 23.1% 6.4% 22.6% 15.1% Middle 13 100.0% 100.0% 100.0% 100.0% 4 30.8% 29.5% 32.3% 25.7% Upper 0 0.0% 0.0% 0.0% 0.0% 4 30.8% 52.3% 33.5% 49.5% Unknown 0 0.0% 0.0% 0.0% 0.0% 0 0.0% 0.0% 4.3% 5.4% Total 13 100.0% 100.0% 100.0% 100.0% 13 100.0% 100.0% 100.0% 100.0% SMALL BUSINESS By Tract Income 2008-2009 Bank 2008 Aggregate # % % $(000s) % % $(000s) Low 0 0.0% 0.0% 0.0% 0.0% Moderate 0 0.0% 0.0% 0.0% 0.0% Middle 4 100.0% 100.0% 100.0% 100.0% Upper 0 0.0% 0.0% 0.0% 0.0% Unknown 0 0.0% 0.0% 0.0% 0.0% Tract Unknown 0 0.0% 0.0% 0.0% 0.0% Total 4 100.0% 100.0% 100.0% 100.0% By Revenue $1 Million or Less 4 100.0% 100.0% 26.7% 30.5% By Loan Size $100,000 or less 4 100.0% 100.0% 97.5% 67.1% $100,001-$250,000 0 0.0% 0.0% 2.5% 32.9% $250,001-$1 Million 0 0.0% 0.0% 0.0% 0.0% Total 4 100.0% 100.0% 100.0% 100.0% Originations and Purchases

Tioga State Bank CRA Public Evaluation Spencer, NY March 15, 2010
BB19
CRA APPENDIX A
GLOSSARY Census tract: A small, relatively permanent statistical subdivision of a county or statistically equivalent entity delineated for data presentation purposes by a local group of census data users or the geographic staff of a regional census center in accordance with Census Bureau guidelines. Designed to be relatively homogeneous units with respect to population characteristics, economic status, and living conditions at the time they are established, census tracts generally contain between 1,000 and 8,000 people, with an optimum size of 4,000 people. Census tract boundaries are delineated with the intention of being stable over many decades, so they generally follow relatively permanent visible features. However, they may follow governmental unit boundaries and other invisible features in some instances; the boundary of a state or county (or statistically equivalent entity) is always a census tract boundary. Community development: Affordable housing (including multifamily rental housing) for low- or moderate-income individuals; community services targeted to low- or moderate-income individuals; activities that promote economic development by financing businesses or farms that meet the size eligibility standards of the Small Business Administration’s Development Company or Small Business Investment Company programs (13 CFR 121.301) or have gross annual revenues of $1 million or less; or, activities that revitalize or stabilize low- or moderate-income geographies. Effective September 1, 2005, the Board of Governors of the Federal Reserve System, Office of the Comptroller of the Currency, and the Federal Deposit Insurance Corporation have adopted the following additional language as part of the revitalize or stabilize definition of community development. Activities that revitalize or stabilize-
(i) Low-or moderate-income geographies; (ii) Designated disaster areas; or (iii) Distressed or underserved nonmetropolitan middle-income geographies
designated by the Board, Federal Deposit Insurance Corporation, and Office of the Comptroller of the Currency, based on- a. Rates of poverty, unemployment, and population loss; or b. Population size, density, and dispersion. Activities that revitalize and stabilize geographies designated based on population size, density, and dispersion if they help to meet essential community needs, including needs of low- and moderate-income individuals.
Family: A family is a group of two or more people related by birth, marriage, or adoption and residing together; all such people (including related subfamily members) are considered as members of one family. Full review: Performance is analyzed considering performance context, quantitative factors and qualitative factors.

Tioga State Bank CRA Public Evaluation Spencer, NY March 15, 2010
BB20
Geography: A census tract delineated by the United States Bureau of the Census in the most recent decennial census. Home Mortgage Disclosure Act (“HMDA”): The statute that requires certain mortgage lenders that do business or have banking offices in a metropolitan statistical area to file annual summary reports of their mortgage lending activity. The reports include such data as the race, gender, and income of applicants, the amount of loan requested, and the disposition of the application (e.g., approved, denied, and withdrawn). Home mortgage loans: Includes home purchase and home improvement loans as defined in the HMDA regulation. This definition also includes multifamily (five or more families) dwelling loans, loans for the purchase of manufactured homes, and refinancings of home improvement and home purchase loans. Household: A household consists of all the people who occupy a housing unit. A household includes the related family members and all the unrelated people, if any, such as lodgers, foster children, wards, or employees who share the housing unit. A person living alone in a housing unit, or a group of unrelated people sharing a housing unit such as partners or roomers, is also counted as a household. The count of households excludes group quarters. Limited-scope review: Performance is analyzed using only quantitative factors. Low-income: Individual income that is less than 50% of the area median income, or a median family income that is less than 50%, in the case of a geography. Metropolitan Statistical Area (“MSA”): A geographic entity defined by the federal Office of Management and Budget for use by federal statistical agencies, based on the concept of a core area with a large population nucleus, plus adjacent communities having a high degree of economic and social integration with that core. Metropolitan Division: A county or group of counties within a Metropolitan Statistical Area that contains a population of at least 2.5 million and represents an employment center(s) associated through commuting ties. Middle-income: Individual income that is at least 80% and less than 120% of the area median income, or a median family income that is at least 80% and less than 120%, in the case of a geography. Moderate-income: Individual income that is at least 50% and less than 80% of the area median income, or a median family income that is at least 50% and less than 80%, in the case of a geography. Owner-occupied units: Includes units occupied by the owner or co-owner, even if the unit has not been fully paid for or is mortgaged.

Tioga State Bank CRA Public Evaluation Spencer, NY March 15, 2010
BB21
Qualified investment: A qualified investment is defined as any lawful investment, deposit, membership share or grant that has as its primary purpose community development. Small loan(s) to business(es): A loan included in “loans to small businesses” as defined in the Consolidated Report of Condition and Income (“Call Report”) and the Thrift Financial Reporting (“TFR”) instructions. These loans have original amounts of $1 million or less and typically are either secured by nonfarm or nonresidential real estate or are classified as commercial and industrial loans. However, thrift institutions may also exercise the option to report loans secured by nonfarm residential real estate as "small business loans" if the loans are reported on the TFR as nonmortgage, commercial loans. Upper-income: Individual income that is more than 120% of the area median income, or a median family income that is more than 120%, in the case of a geography.

o
II II
C
i-^ J C^
0
Q '^
J a V
N N U¢ w E
PM I LJ•
2
J Q
s \ ''^E0
\ \
Q \ • \\\\\\\
m
00U
BB22