Embed Size (px)
Citation preview
Sample Means:
Target Goal: I can find the mean and standard deviation of the sampling distribution.
7.3a
h.w: pg 441:43 – 46; pg 454: 49, 51, 53, 55
x

Because sample means are just averages of observations, they are among the most common statistic.
• Bull Market or Bear Market
• Rates of return for NYSE in 1987.• What do you notice compared to the
next “portfolio”?

Rates of return for NYSE in 1987
• Data is wide spread and variability is high.
Rates of return for “5 stock portfolios”
• Data is less spread with less variation.
Sample means are:
Averages are more normal than individual observations.
Averages are less variable than individual observations.
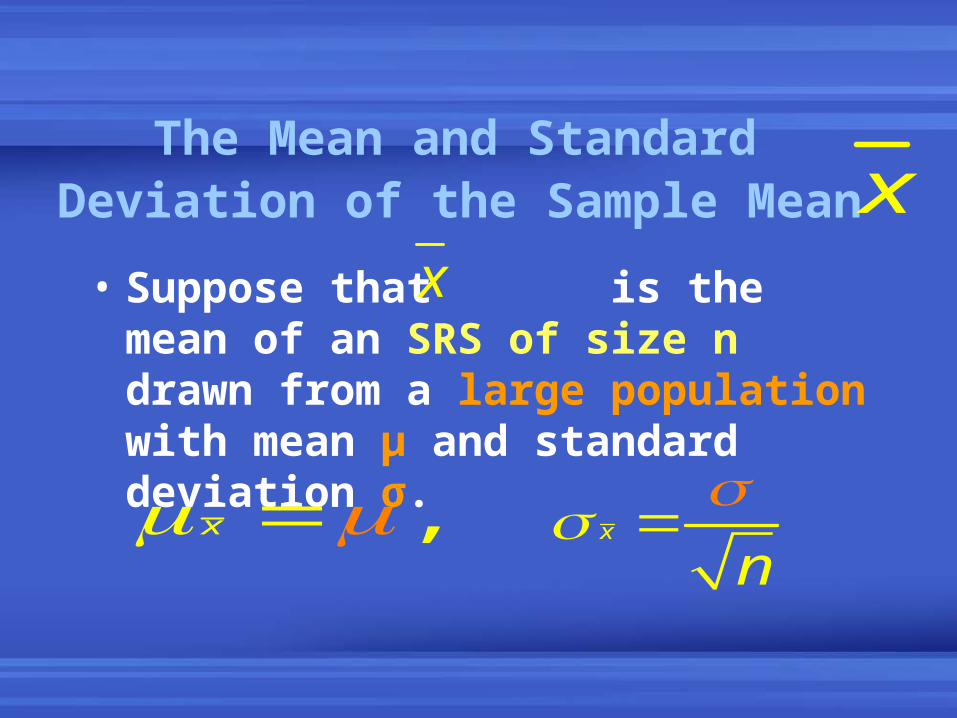
The Mean and Standard Deviation of the Sample Mean
• Suppose that is the mean of an SRS of size n drawn from a large population with mean μ and standard deviation σ.
xx
,x x
n

• Note: We can only use when
the population is at least 10 times the sample.
(This is almost always the case.)
n

The Shape of the distribution of depends on the shape of the distribution.
• If drawn from a population that is normal then:
Sample mean has:
x
x
: ,x Nn

• Note: the sample mean will not be as exact as the population mean because of sampling variability.
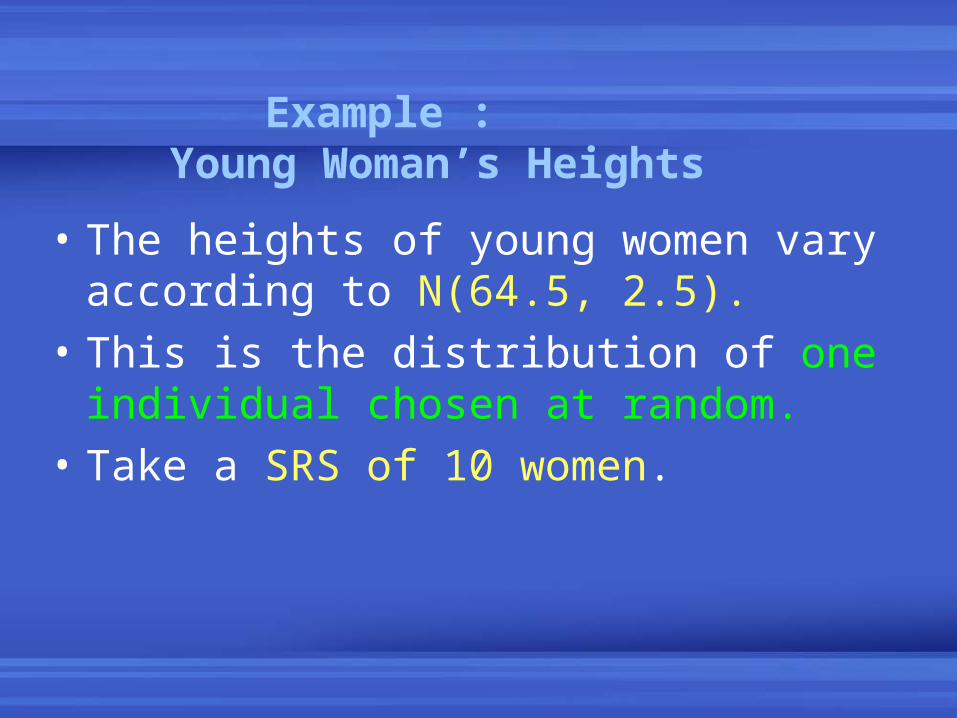
Example : Young Woman’s Heights
• The heights of young women vary according to N(64.5, 2.5).
• This is the distribution of one individual chosen at random.
• Take a SRS of 10 women.

Find the Mean and Standard Deviation
= 64.5
The average height of individual women vary widely (2.5inches) about the population mean.
• But, the average height of a sample of 10 women is less variable (.79 inches).
x
x
n
0
2.5
1
0.79x inches

What if n = 100?
= 0.25
The average height of a sample of 100 women is has even less variable.
2.
100
5x
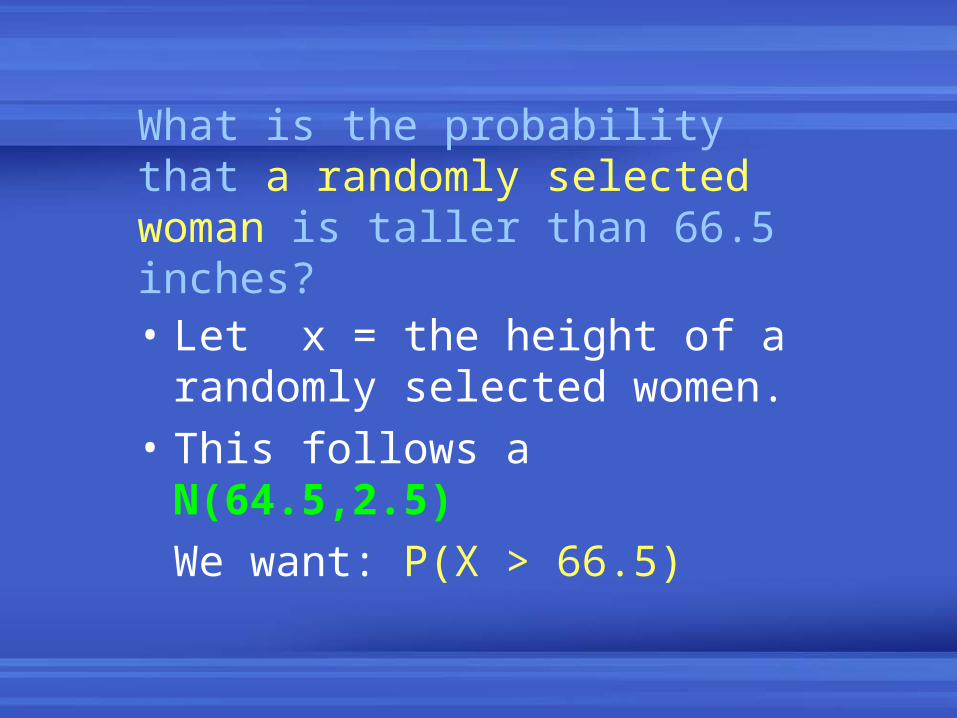
What is the probability that a randomly selected woman is taller than 66.5 inches?
• Let x = the height of a randomly selected women.
• This follows a N(64.5,2.5)
We want: P(X > 66.5)
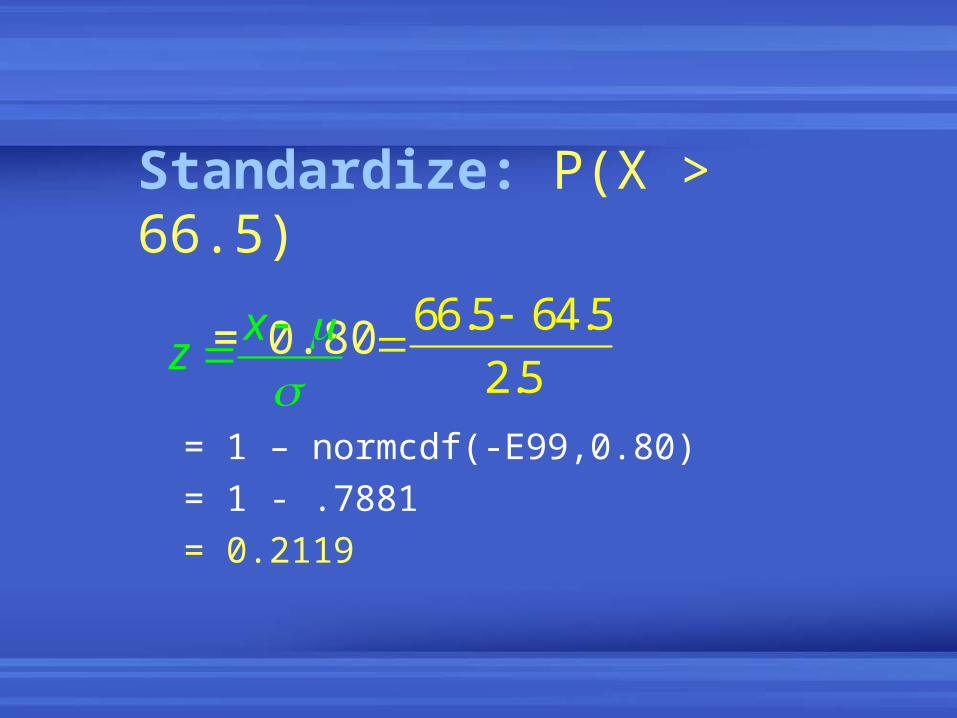
Standardize: P(X > 66.5)
= 0.80
= 1 – normcdf(-E99,0.80)
= 1 - .7881
= 0.2119
xz
66.5 64.5
2.5

What is the probability that a SRS of 10 women has a mean height greater than 66.5?
• We want : P( > 66.5) for n = 10
• We know that
: 64.5,.79x N
x
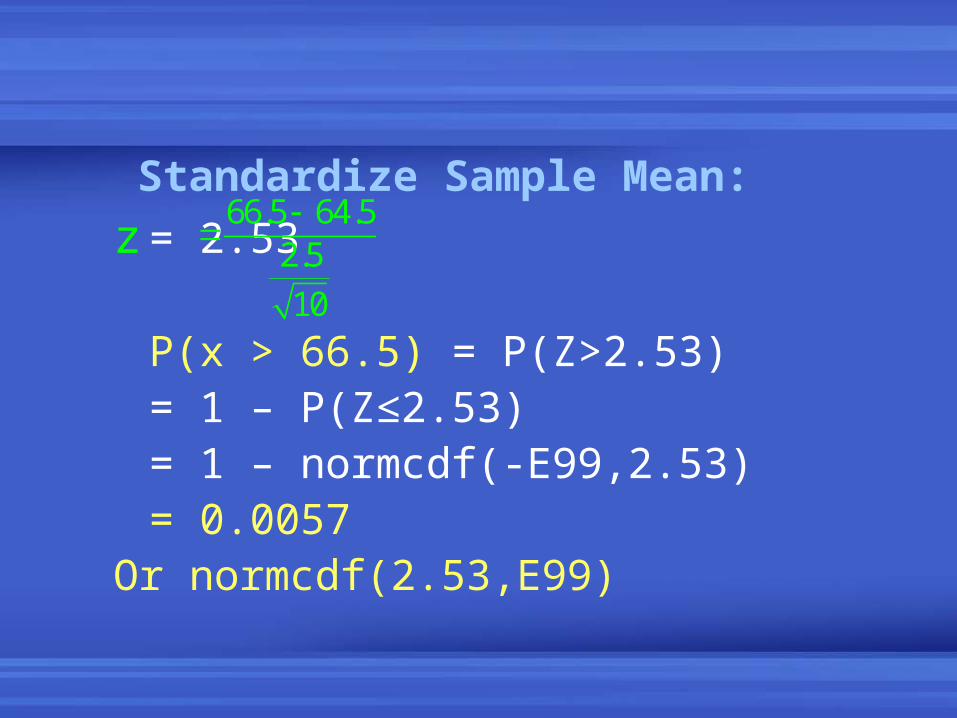
Standardize Sample Mean:
z = 2.53
P(x > 66.5) = P(Z>2.53)= 1 – P(Z≤2.53)= 1 – normcdf(-
E99,2.53)= 0.0057
Or normcdf(2.53,E99)
66.5 64.52.5
10

The probability is much less likely (less than 1% chance) compared to the individual probability which we calculated to be approx, 21% to have a height > 66.5.
1% 21%
Conclusion:
• The averages of several observations are less variable than individual observations.
• So, the sample mean is less variable than a single measurement.
x

• Receive CLT hand out and discuss tomorrow.
• Work on carnival calculations or hw the rest of class.