Embed Size (px)
Citation preview
Chapter 8Chapter 8 Introduction to Inference Introduction to InferenceTarget Goal: I can calculate the Target Goal: I can calculate the
confidence interval for a populationconfidence interval for a population
Estimating with Confidence8.1a
h.w: pg 481: 5, 7, 9, 11
Confidence Intervals: T
he Basics
Confidence Intervals: T
he Basics
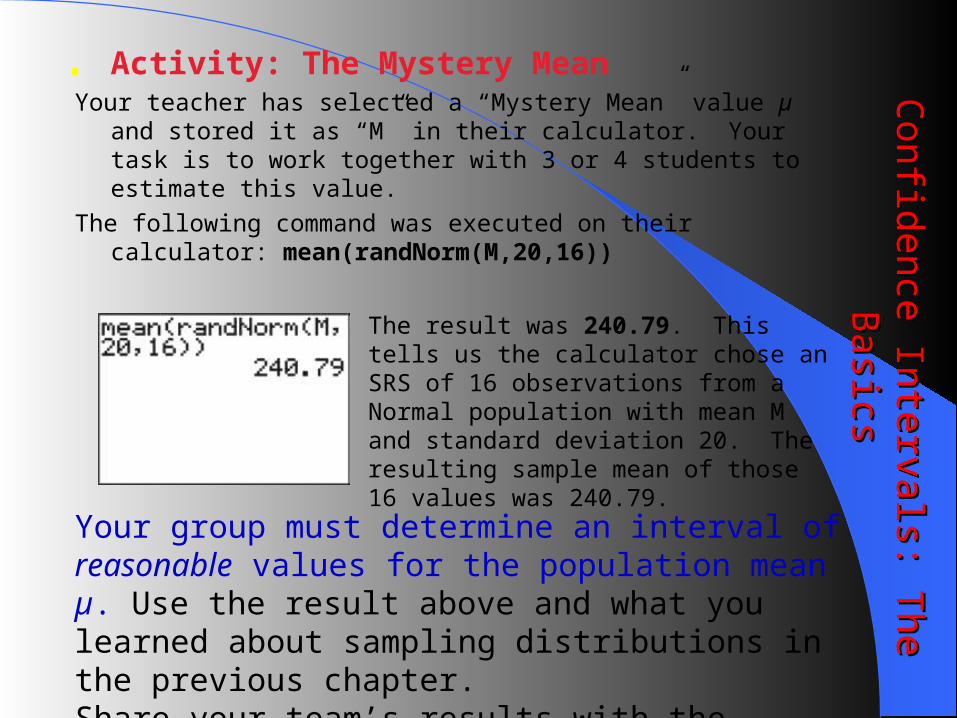
• Activity: The Mystery MeanYour teacher has selected a “Mystery Mean” value µ and stored it as “M” in
their calculator. Your task is to work together with 3 or 4 students to estimate this value.
The following command was executed on their calculator: mean(randNorm(M,20,16))
The result was 240.79. This tells us the calculator chose an SRS of 16 observations from a Normal population with mean M and standard deviation 20. The resulting sample mean of those 16 values was 240.79.
Your group must determine an interval of reasonable values for the population mean µ. Use the result above and what you learned about sampling distributions in the previous chapter.Share your team’s results with the class.
• Confidence Intervals: The BasicsC
onfidence Intervals: The B
asicsC
onfidence Intervals: The B
asics
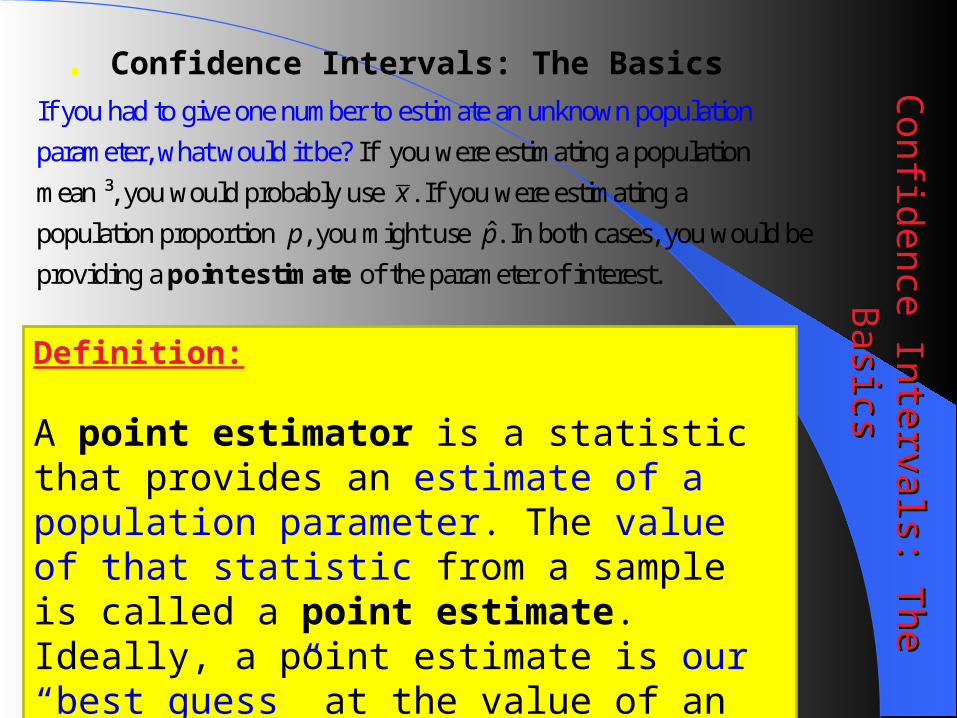
Definition:
A point estimator is a statistic that provides an estimate of a population parameter. The value of that statistic from a sample is called a point estimate. Ideally, a point estimate is our “best guess” at the value of an unknown parameter.
If you were estim
If you had to give
ating a population
m
one number to estimate an unknown popu
ean ³, you would probably use . If
lation
parameter,
you were estimati
wh
ng
at would
a
populat
it b
io
e?
n pr
x
ˆoportion , you might use . In both cases, you would be
providing a of the parameter of interest.
p p
point estimate

Point EstimatePoint Estimate
• A single number (a statistic) derived from sample data that is used to estimate a population characteristic
• But not always to the population characteristic due to sampling variation
“point” refers to the single value on a number line.
Different samples may produce different statistics.
Population characteristic
• Confidence Intervals: The Basics Confidence Intervals: T
he Basics
Confidence Intervals: T
he Basics
We learned in Chapter 7 that an ideal point estimator will have no bias and low variability.
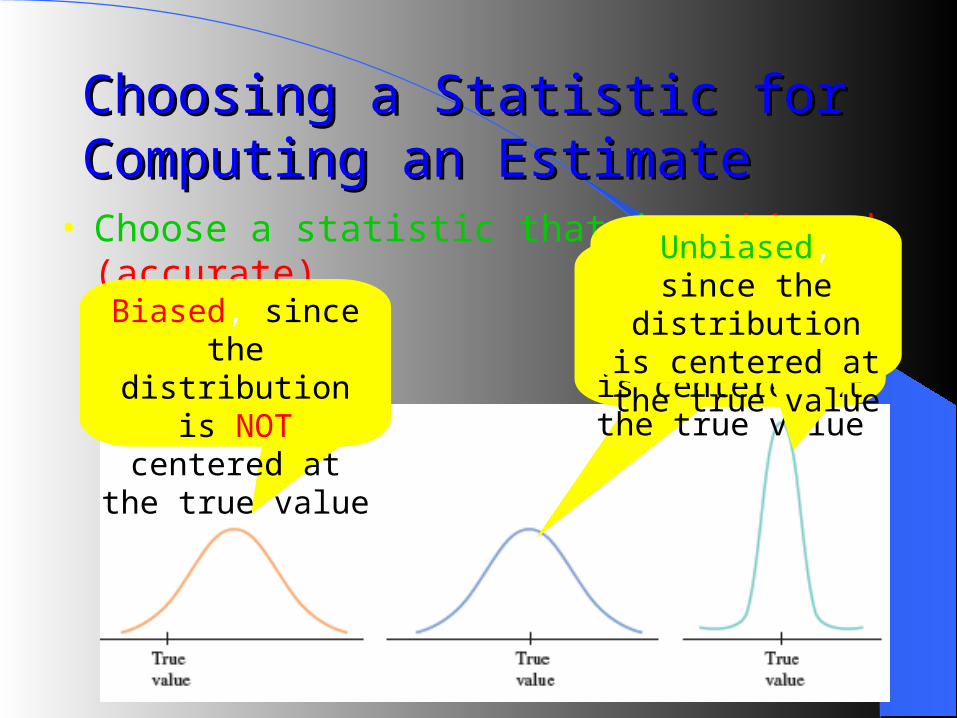
Choosing a Statistic for Choosing a Statistic for Computing an EstimateComputing an Estimate
• Choose a statistic that is unbiased (accurate) Unbiased, since the
distribution is centered at the true
value
Unbiased, since the distribution is
centered at the true value
Biased, since the distribution is NOT centered at the true
value
Estimating with ConfidenceEstimating with Confidence
• Suppose I want to know how often teenagers go to the movies. Specifically, I want to know how many times per month a typical teenager (ages 13 through 17) goes to the movies.
• Suppose I take an SRS of 100 teenagers and calculate the sample mean to be .
• The sample mean is an unbiased point estimator of the unknown population mean μ.
• I would estimate the population mean to be approximately 2.1.
• However, a different sample would have given a different sample mean, so I must consider the amount of variation in the sampling model for .
2.1x
x
Essential facts about the Essential facts about the sampling distribution of .sampling distribution of .
• The CLT tells us that the sampling model for is approximately normal for large populations.
(The overall population of teenagers is large).• The mean of the sampling model is μ.• The standard deviation of the sampling
model is
assuming the population size is at least 10n (10% condition).
x
x
n
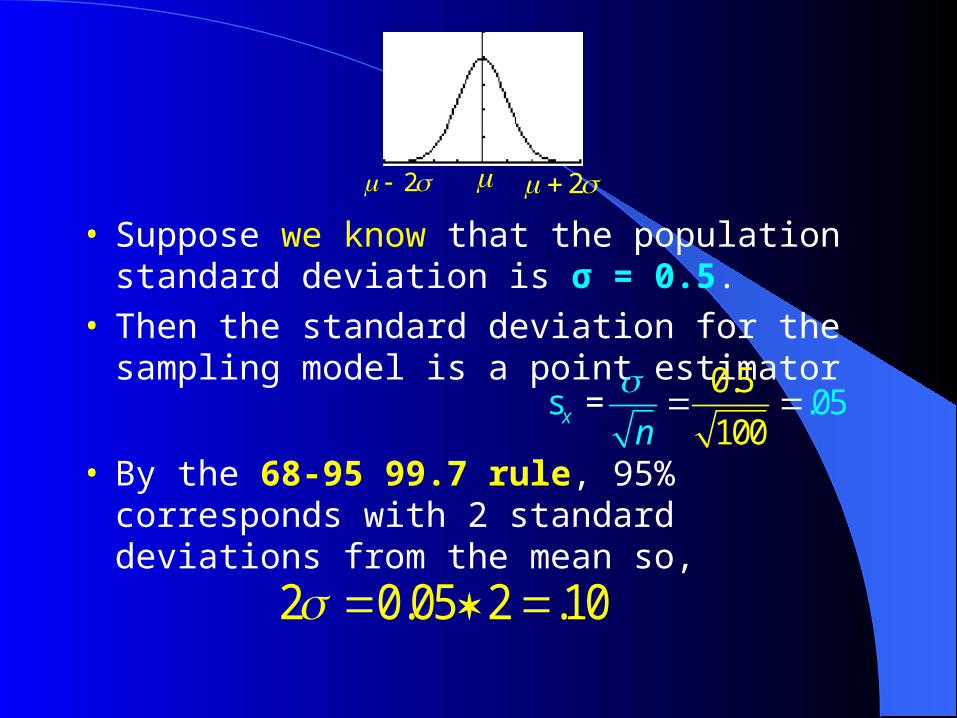
• Suppose we know that the population standard deviation is σ = 0.5.
• Then the standard deviation for the sampling model is a point estimator
• By the 68-95 99.7 rule, 95% corresponds with 2 standard deviations from the mean so,
2 2
0.5
1=
0.
0s 05x
n
2 0.05 2 .10
• Then 95% of our samples will produce a statistic that is between
μ - 0.10 and μ + 0.10.
• Therefore in 95% of our samples, the interval between and
(est + - margin of error) will contain the parameter μ.
x
0.10x 0.10x
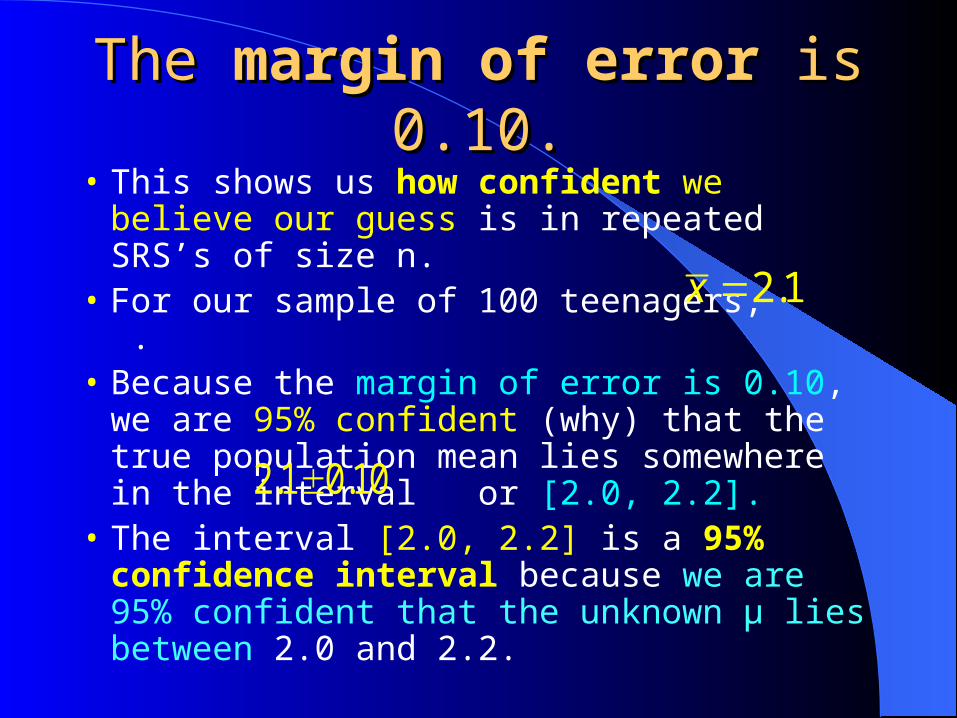
The The margin of errormargin of error is 0.10. is 0.10.
• This shows us how confident we believe our guess is in repeated SRS’s of size n.
• For our sample of 100 teenagers, .• Because the margin of error is 0.10, we are
95% confident (why) that the true population mean lies somewhere in the interval or [2.0, 2.2].
• The interval [2.0, 2.2] is a 95% confidence interval because we are 95% confident that the unknown μ lies between 2.0 and 2.2.
2.1x
2.1 0.10
Confidence IntervalConfidence Interval..
• Start with sample data and calculate the confidence interval in the form:
CI = estimate +- margin of error
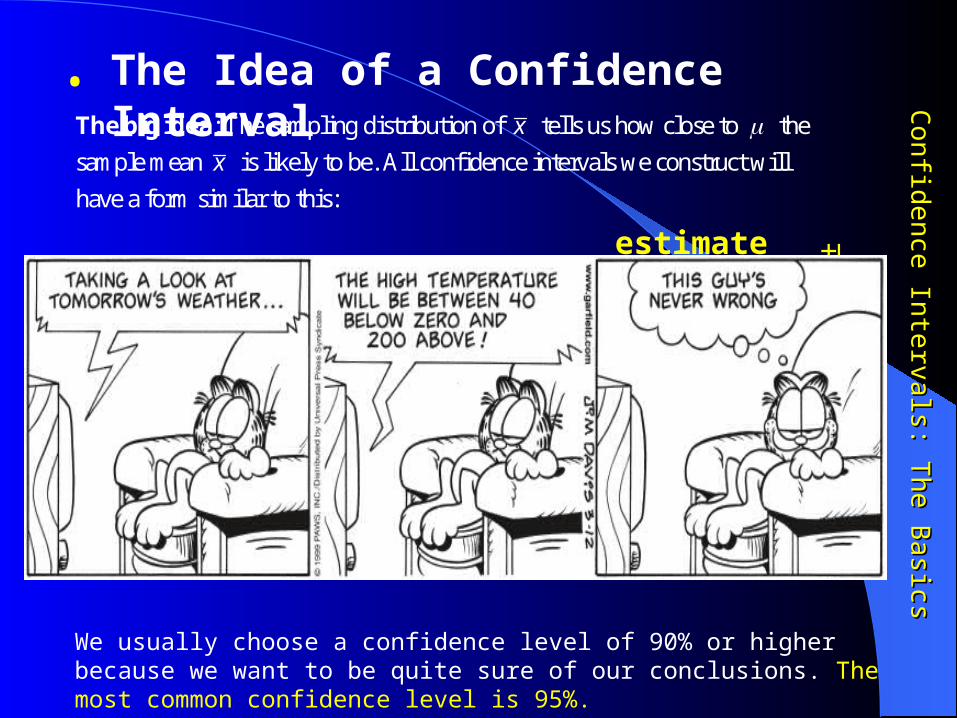
• The Idea of a Confidence Interval
estimate ± margin of error
Co
nfid
ence In
tervals: T
he B
asics
Co
nfid
ence In
tervals: T
he B
asics
We usually choose a confidence level of 90% or higher because we want to be quite sure of our conclusions. The most common confidence level is 95%.
: The sampling distribution of tells us how close to the
sample mean is likely to be. All confidence intervals we construct will
have a form similar to this:
x
x
The big idea
Confidence Level C • gives the overall success rate of the
method used for calculating the confidence interval.
• gives the probability that the interval contains the true value of the parameter in repeated samples.
• Note: not that the probability is 95% that the true mean falls in this interval!
• Instead, the confidence interval gives us a set of plausible values for the parameter.
Pg. 473
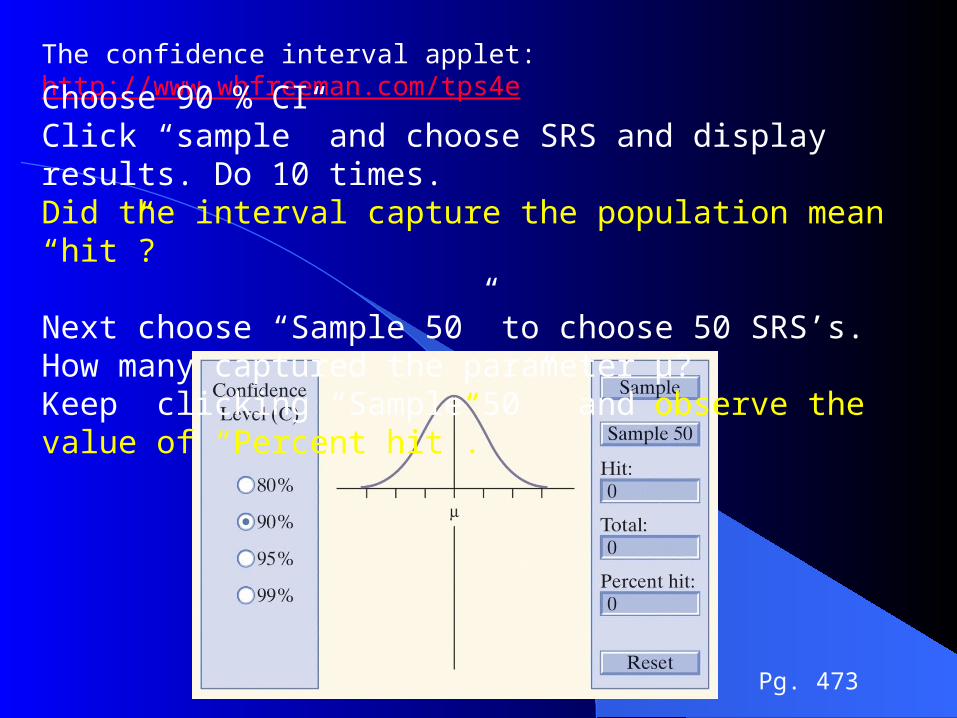
The confidence interval applet: http://www.whfreeman.com/tps4e
Choose 90 % CIClick “sample” and choose SRS and display results. Do 10 times.Did the interval capture the population mean “hit”?
Next choose “Sample 50” to choose 50 SRS’s. How many captured the parameter µ?Keep clicking “Sample 50” and observe the value of “Percent hit”.
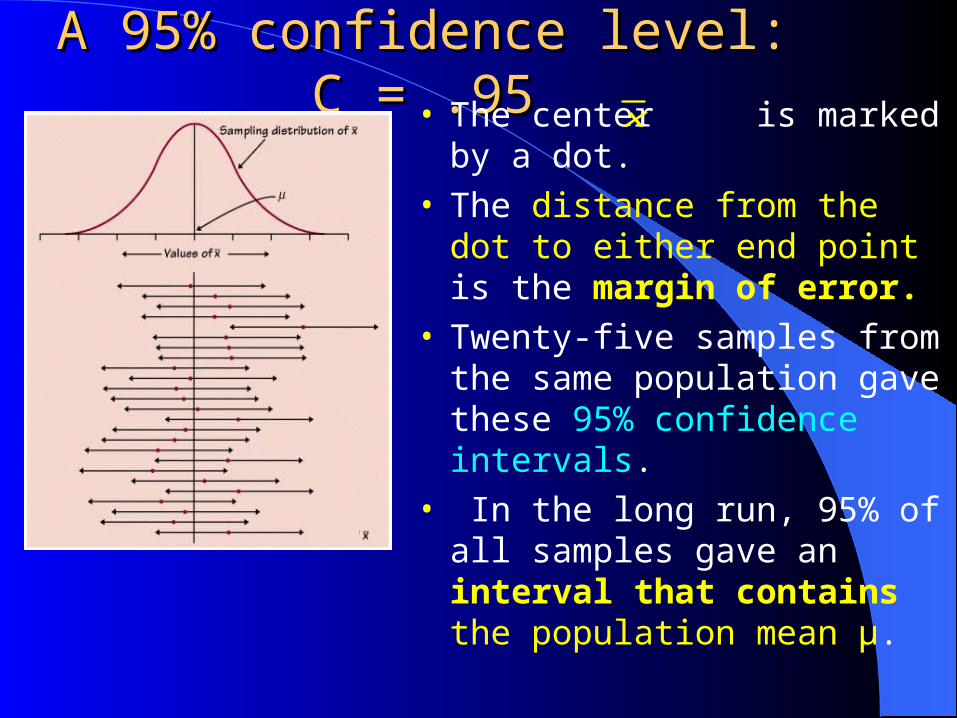
A 95% confidence level: C = .95A 95% confidence level: C = .95• The center is marked by a dot.• The distance from the dot to
either end point is the margin of error.
• Twenty-five samples from the same population gave these 95% confidence intervals.
• In the long run, 95% of all samples gave an interval that contains the population mean μ.
x
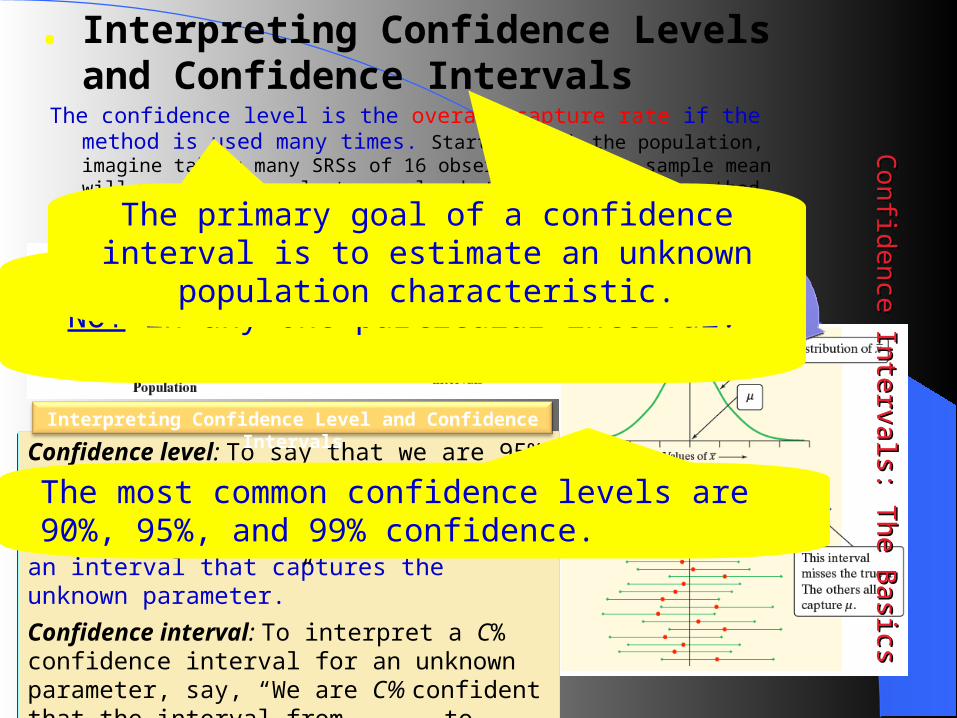
• Interpreting Confidence Levels and Confidence Intervals
The confidence level is the overall capture rate if the method is used many times. Starting with the population, imagine taking many SRSs of 16 observations. The sample mean will vary from sample to sample, but when we use the method estimate ± margin of error to get an interval based on each sample, 95% of these intervals capture the unknown population mean µ.
Co
nfid
ence In
tervals: T
he B
asics
Co
nfid
ence In
tervals: T
he B
asics
Confidence level: To say that we are 95% confident is shorthand for “95% of all possible samples of a given size from this population will result in an interval that captures the unknown parameter.”
Confidence interval: To interpret a C% confidence interval for an unknown parameter, say, “We are C% confident that the interval from _____ to _____ captures the actual value of the [population parameter in context].”
Interpreting Confidence Level and Confidence Intervals
Our confidence is in the method – NOT in any one particular interval!
The most common confidence levels are 90%, 95%, and 99% confidence.
The primary goal of a confidence interval is to estimate an unknown population characteristic.
Read: pg. 467 - 476Read: pg. 467 - 476