Embed Size (px)
DESCRIPTION
Sample costs to establish an orchard and produce sweet cherries under micro-sprinkler irrigation in thenorthern San Joaquin Valley are presented in this study. This study is intended as a guide only, and can be usedto make production decisions, determine potential returns, prepare budgets and evaluate production loans.Practices described are based on production practices considered typical for the crop and area, but these samepractices will not apply to every situation. The sample costs for labor, materials, equipment and customservices are based on current figures. A blank column, “Your Costs”, in Tables 2 and 3 is provided for enteringyour farm costs.
Citation preview

CH-VN-11
UNIVERSITY OF CALIFORNIA COOPERATIVE EXTENSION
2011
SAMPLE COSTS TO ESTABLISH AN ORCHARD AND PRODUCE
SWEET CHERRIES
SAN JOAQUIN VALLEY- NORTH
Micro-Sprinkler Irrigation
Prepared by: Joe A. Grant UC Cooperative Extension Farm Advisor, San Joaquin County Janet L. Caprile UC Cooperative Extension Farm Advisor, Contra Costa County William C. Coates UC Cooperative Extension Farm Advisor, San Benito County Kathy Kelly Anderson UC Cooperative Extension Farm Advisor, Stanislaus County Karen M. Klonsky UC Cooperative Extension Specialist, Department of Agricultural and Resource
Economics, UC Davis Richard L. De Moura UC Cooperative Extension Staff Research Associate, Department of Agricultural and
Resource Economics, UC Davis

2011 Cherries Costs and Returns Study San Joaquin Valley North UC Cooperative Extension 2
SAMPLE COSTS TO ESTABLISH AN ORCHARD and PRODUCE SWEET CHERRIES
San Joaquin Valley – North 2011
CONTENTS INTRODUCTION ................................................................................................................................................. 2 ASSUMPTIONS.................................................................................................................................................... 3 Establishment Cultural Practices and Material Inputs ......................................................................................... 3 Production Cultural Practices and Material Inputs .............................................................................................. 5 Labor, Equipment and Interest............................................................................................................................. 8 Cash Overhead ..................................................................................................................................................... 8 Non-Cash Overhead............................................................................................................................................. 9 REFERENCES .................................................................................................................................................... 11 Table 1. COSTS PER ACRE TO ESTABLISH A CHERRY ORCHARD ....................................................... 12 Table 2. COSTS PER ACRE TO PRODUCE SWEET CHERRIES ................................................................. 14 Table 3. COSTS AND RETURNS PER ACRE TO PRODUCE SWEET CHERRIES .................................... 16 Table 4. MONTHLY CASH COSTS – SWEET CHERRIES............................................................................ 18 Table 5. RANGING ANALYSIS ....................................................................................................................... 20 Table 6. WHOLE FARM ANNUAL EQUIPMENT, INVESTMENT AND BUSINESS OVERHEAD.......... 22 Table 7. HOURLY EQUIPMENT COSTS ........................................................................................................ 22 Table 8. OPERATIONS, EQUIPMENT & MATERIALS ................................................................................. 23
INTRODUCTION
Sample costs to establish an orchard and produce sweet cherries under micro-sprinkler irrigation in the
northern San Joaquin Valley are presented in this study. This study is intended as a guide only, and can be used to make production decisions, determine potential returns, prepare budgets and evaluate production loans. Practices described are based on production practices considered typical for the crop and area, but these same practices will not apply to every situation. The sample costs for labor, materials, equipment and custom services are based on current figures. A blank column, “Your Costs”, in Tables 2 and 3 is provided for entering your farm costs.
The hypothetical farm operation, production practices, overhead, and calculations are described under
the assumptions. For additional information or an explanation of the calculations used in the study call the Department of Agricultural and Resource Economics, University of California, Davis, (530) 752-3589 or your local UC Cooperative Extension office.
Sample Cost of Production Studies for many commodities are available and can be requested through
the Department of Agricultural and Resource Economics, UC Davis. Current studies and some archived studies can be downloaded from the department website at http://coststudies.ucdavis.edu or obtained from selected county UC Cooperative Extension offices.
The University of California is an affirmative action/equal opportunity employer The University of California and the United States Department of Agriculture, Risk Management Agency, cooperating.

2011 Cherries Costs and Returns Study San Joaquin Valley North UC Cooperative Extension 3
ASSUMPTIONS
The assumptions refer to Tables 1 to 8 and pertain to sample costs to establish a cherry orchard and produce cherries in the northern San Joaquin Valley. The cultural practices shown represent production operations and materials considered typical of a well-managed orchard in the region. Costs, materials, and practices in this study will not apply to all farms. Timing of and types of establishment and cultural practices will vary among growers within the region and from season to season due to variables such as weather, soil, and insect and disease pressure. The study does not represent a single farm and is intended as a guide only. The use of trade names and cultural practices in this report does not constitute an endorsement or recommendation by the University of California nor is any criticism implied by omission of other similar products or cultural practices.
Land. The hypothetical farm consists of 80 contiguous acres of land. Cherries are being established on
40 acres, other crops occupy 36 acres, and roads, irrigation system, and farmstead occupy four acres. The owner farms the orchard.
Establishment Cultural Practices and Material Inputs
The following practices refer to Table 1.
Site Preparation. The land was previously planted to cherries. Orchard removal costs are not included. All operations that prepare the orchard for planting are normally done the year prior to planting, but costs are shown in the first year. The site is subsoiled twice to break up any hardpan, and pull-up old tree roots, then disced twice, followed by laser leveling. The field is then strip (tree row) fumigated, untarped. Fumigation before planting is based on previous crop history and nematode sampling. Custom operators are hired to subsoil, level, and fumigate.
Trees. No specific sweet cherry variety or rootstock is assumed in this study. Some varieties that may
be planted are Bing (planted on the majority of the acreage), Chelan, Tieton and Rainier in the northern San Joaquin Valley and Brooks, Tulare, Garnet, in the southern San Joaquin Valley. Trees are planted on an 18-foot X 18-foot spacing or 134 trees per acre. The life of the orchard in this study is estimated to be 25 years.
Planting, Training, and Pruning. Planting the orchard starts by
surveying and marking tree sites. Trees are planted and painted with white interior water-base latex paint (mixed 1:1 with water) to protect against sunburn. Carton or wraps are placed around the tree to protect against damage by vertebrate pests and herbicide drift. Pruning to train trees to the desired shape begins in the first year and is completed in the fifth year. Annual dormant pruning, beginning in the second year and summer pruning, beginning in the first year are done to maintain tree architecture and ensure vigor and productivity. In the fourth and subsequent years, the dormant prunings are placed in the row middles and shredded, while the summer prunings are shredded with the normal cultural practices.
Fertilization. In June of the first two years an N-P-K fertilizer (15-15-15) is spread by hand around the
trees. Beginning in the third year, liquid fertilizer (CAN17) is sprayed on the wetted area (see Irrigation) and irrigated in. Nitrogen requirements are shown in Table A, but actual amounts to apply should be determined by leaf analysis. Leaf sampling for nutrient analysis begins in July of the second year. Soluble 20-20-20 plus micronutrients fertilizer is foliar applied beginning in the fourth year with the April worm spray. Some fields may show zinc and manganese deficiencies thus requiring additional minor nutrient sprays.
Table A. Annual Nitrogen Applied
Year Lb N/acre 1 10 2 10 3 20 4 30 5 35 6 40 7 45 8 50 9 60
10+ 60

2011 Cherries Costs and Returns Study San Joaquin Valley North UC Cooperative Extension 4
Irrigation. The total irrigation cost includes the pumping cost and irrigation
labor. Water for irrigation is supplied from a well and distributed to the orchard through a micro-sprinkler irrigation system wetting 70% of the orchard floor. The water cost for individual orchards will vary depending on the amount of water pumped, irrigation system (drip, micro-sprinkler, overhead sprinkler, flood, or other), energy source, and irrigation district. In this study, irrigation water is calculated to cost $60.00 per acre-foot or $5 per acre-inch. No assumption is made about effective rainfall. The amount of water applied to the orchard each year will vary as shown in Table B for the establishment and production years.
Pollination. In the first year of crop set (4th year), two bee hives per acre are placed in the field and maintained by the beekeeper.
Pest Management. The pesticides and rates mentioned in this cost study are listed in UC Integrated
Pest Management Guidelines, Cherries. For more information on other pesticides available, pest identification, monitoring, and management visit the UC IPM website at www.ipm.ucdavis.edu . Written recommendations are required for many pesticides and are made by licensed pest control advisers. For information and pesticide use permits, contact the local county agricultural commissioner's office.
Cherry pest and disease management is determined by the seasonal pest pressure and will vary among
growers and years. During the second and third years, the total material applied is less (1/2 rate) than in the production years because of the smaller trees. Beginning in the fourth year, the full label rates are applied.
Nematodes. In this study an untarped strip application (tree row) of Methyl Bromide at 400 pounds per
treated acre on a 9-foot strip (200 lbs per broadcast acre) is applied prior to planting by a custom applicator (Telone may be substituted). The land is assumed to be a cherry replant site without any nematodes. On sites where nematode (Pratylechus vulnus) is present, a fully tarped broadcast application at approximately $3,200 per acre may be required. On new sites not previously planted to cherries and without nematodes, fumigation is rarely necessary.
Insect. Beginning in the second year, four in-season treatments with Asana (late June, July, August,
September) are made for leafhopper control to prevent the spread of Western X (Buckskin) disease. Onager is added to the first Asana treatment and Omite to the second for mite control. Beginning in April of the fourth year, Intrepid insecticide is applied post-bloom for fruit-feeding worms (green fruitworm and fruittree leafroller). A minor nutrient foliar fertilizer is mixed with the worm spray. Sevin spray is applied in April for earwig control beginning in the fourth year. A delayed dormant application of Superior Oil and Diazinon, an insecticide, begins in the fifth year. Leafhopper sprays are not needed in cherry growing areas where Western X disease is not present. Spotted Wing Drosophila (a new pest) is treated beginning in the fourth year.
Diseases. A general bactericide application of copper sulfate plus hydrated lime (Bordeaux) and
dormant oil begins in the late fall (November) of the second year. Fungicide treatments to control bloom and fruit diseases start in the fourth year. In this study, one application of Rovral plus Superior oil and one of Pristine are made during bloom in March and early April for control of bloom diseases, followed by a post-bloom (late-April) Cabrio treatment for powdery mildew. One spray of Elite and Elevate fungicides are applied prior to harvest (May) for controlling fruit decay fungi.
Weeds (Orchard Floor Management). During the first three years, weeds in the row middles are disced
five times per year. In the fourth and subsequent years, the weeds in the middles are mowed five times per year. Beginning in the first year, weeds in the tree rows are controlled with fall-applied pre and postemergent
Table B. Cherry Orchard Water Use
Year Acre-ft/Yr 1-3 1.5 4-6 2.0 7+ 2.5

2011 Cherries Costs and Returns Study San Joaquin Valley North UC Cooperative Extension 5
(residual) herbicides - Goal and Surflan, and a contact herbicide, Gramoxone. The fall residual strip spray is applied to 30% of the orchard during the first three years and 50% thereafter. Two in-season spot sprays with the contact herbicide, Roundup, are applied to 20% of the orchard each time. During the first three years, the grower makes two passes per middle with a ten-foot wide disc; thereafter, the grower makes a single pass with a ten-foot wide mower.
Growth Regulators. Beginning in the fourth year, a late January application of calcium ammonium
nitrate fertilizer (CAN 17) plus a surfactant is used to accelerate bloom and harvest. A pre-harvest gibberellic acid (GA) spray is applied to cherries to enhance fruit size and firmness. In this study, GA is applied to the entire orchard in April. CAN 17 and GA are not used in every orchard every year.
Harvest. Cherries begin bearing an economic crop in the fourth or fifth year (fourth year in this study)
and reach maturity in the ninth year. The cherries are hand harvested into picking buckets, transferred into 30-pound field lugs and then into shallow bins that are trucked to the packing facility. In this study the grower contracts to have the cherry crop harvested for $0.34 per pound. It is assumed the packer hauls the cherries to the packing house.
Yields and Returns. Gross field yields are sorted, resulting in a
75% fresh fruit pack-out and 5% are sold for brining cherries. Assumed annual per acre yields for cherries measured in 30 pound field lugs (gross field harvested yield), 18 pound packed boxes (sorted & packed yield), and pounds of cherries for brining are shown in Table C.
This study assumes that 35% of the fresh market crop is exported
at a price of $40 per 18-pound box. Sixty five percent are sold domestically for $35 per box based on 2005 to 2009 Crop Reports. Brining cherries are sold for $0.19 per pound based on the same reports.
Assessments. See Assessments in production section.
Production Cultural Practices and Material Inputs
Tables 2 to 8
Prune. Hand crews prune mature orchards in the winter (January) and early summer (June). Winter prunings are stacked in the row middles and shredded. Summer prunings are destroyed during regular disking or mowing operations.
Plant. Weak or dead trees are replaced each year. It is assumed that three trees are replanted each year. The cost includes a custom backhoe service to dig out the old trees, planting labor, wraps, and whitewash.
Fertilization. CAN17 at 60 pounds of N per acre (or 2 applications at 30 pounds) is sprayed on the
ground in late April or early May using a fertilizer applicator furnished by the fertilizer dealer. The fertilizer is applied to the wetted area and irrigated in. Nitrogen requirements are shown in Table A, but actual amounts to apply should be determined by leaf analysis. Leaf samples are taken in July. Minor nutrients, (soluble 20-20-20 with micronutrients) at 5 pounds per acre are applied as a foliar with the April worm spray (one month after petal fall). Some fields may show zinc and manganese deficiencies thus requiring additional minor nutrient sprays applied in April with the worm spray.
Table C. Annual Yield per acre Year Gross Packed Brining
30 lb field lug 18 lb box lb
4 60 75 60 5 80 100 120 6 160 200 240 7 240 300 360 8 320 400 480
9+ 360 450 540

2011 Cherries Costs and Returns Study San Joaquin Valley North UC Cooperative Extension 6
Irrigation. The total irrigation cost includes the pumping costs and irrigation labor. Water for irrigation is supplied from a well and delivered to the micro-sprinklers on the orchard floor. The micro-sprinklers are assumed to cover 70% of the orchard floor. The water cost for individual orchards will vary depending on the amount of water pumped, energy source, and irrigation district. In this study, irrigation water is calculated to cost $60.00 per acre-foot ($5 per acre-inch). Irrigation labor is calculated at 0.08 hours per acre-inch. An average of 2.5 acre-feet (30 acre inches) is applied each year. No assumption is made about effective rainfall.
Pollination. Two hives per acre are placed in the orchard in March by a beekeeper. Pest Management. The pesticides and rates mentioned in this cost study are listed in UC Integrated
Pest Management Guidelines, Cherries. For information on other pesticides available, pest identification, monitoring, and management visit the UC IPM website at www.ipm.ucdavis.edu. Information and pesticide use permits are available through the local county agricultural commissioner's office. Pesticides mentioned in this study are used to calculate rates and costs. Although growers commonly use the pesticides mentioned, other pesticides are available. Spray adjuvants are recommended for use with many pesticides, but are not accounted for in this study. Pesticide costs vary by location, brand, and grower volume. Pesticide costs in this study are from a single dealer and shown as full retail. Cherry pest and disease management is determined by the seasonal pest pressure and will vary among growers and years.
Pest Control Adviser (PCA). A state-licensed pest control adviser monitors the field for agronomic
problems including pests, diseases, and nutritional status. Growers may hire private consultants on a per acre basis or receive a similar service as part of an agreement with an agricultural chemical and fertilizer company. Separate costs for a PCA are not included in this study.
Insect. Superior Oil and Diazinon are applied as a delayed dormant spray (February) to help manage
scale, aphids, mites, and lepidopterous pests. In April, Intrepid insecticide is applied post-bloom for fruit-feeding worms (green fruitworm and fruittree leafroller). A minor nutrient foliar fertilizer is mixed with the worm spray. A Sevin spray for earwig control is applied in April. In late April and early May, three sprays are applied to control the new pest Spotted Wing Drosophila. Four in-season treatments (late June, July, August, September) with Asana are made for leafhopper control to prevent the spread of Western X (Buckskin) disease. Onager is added to the first Asana treatment and Omite to the second for mite control. Leafhopper sprays are not needed in cherry growing areas where Western X disease is not present.
Diseases. Fungicides treatments are made to control bloom and fruit diseases such as Brown Rot,
Botrytis Rot and Powdery Mildew. In this study, one application of Rovral plus Superior oil and one of Pristine are made during bloom in March and early April, respectively, for control of bloom diseases, followed by a post-bloom (late April) Cabrio treatment for powdery mildew. One spray with Elite and Elevate fungicides is applied in May prior to harvest for controlling fruit decay fungi. A general bactericide application of copper sulfate, hydrated lime (Bordeaux) and dormant oil is applied in the late fall (November) or early winter.
Weeds (Orchard Floor Management). Middles are mowed five times per year – April, May, June,
August, September. Weeds in the tree rows are controlled with fall-applied pre- and post emergent (residual) herbicides. Goal, Surflan and Gramoxone are used in a single pre-emergence fall (November) treatment applied to 50% (9 ft. strip) of the orchard. Two in-season (April, July) spot sprays with the contact herbicide, Roundup, are applied to 20% of the orchard each time.

2011 Cherries Costs and Returns Study San Joaquin Valley North UC Cooperative Extension 7
Growth Regulators. Beginning in the fourth year, a late January application of calcium ammonium
nitrate fertilizer (CAN 17) plus a surfactant is used to accelerate bloom and harvest. A pre-harvest gibberellic acid (GA) spray (ProGibb) is applied to the cherries to enhance fruit firmness and size. In this study, GA is applied to the entire orchard in April, beginning in the fourth year. CAN 17 and GA are not used in every orchard every year.
Harvest. Cherry harvest begins in May and is usually completed by mid June. The cherries are hand
harvested into picking buckets, transferred into 30-pound field lugs and then into shallow bins that are trucked to the packing facility. In this study the grower contracts to have the cherry crop harvested for $0.34 per pound. It is assumed that the packer hauls the cherries to the packing shed, although some growers do their own hauling and would incur an additional cost. Pack-out (amount of fruit delivered from the field that meets quality standards for packing and sale) will vary from year to year, due to various factors such as weather, diseases, insects, and crop yield. Sorting and packing in this study results in a 75% fresh fruit pack-out, 20% cullage, and 5% brining cherries. Packing house charges and calculations will vary and are also affected by the pack-out rate. A great variety of packages are now used in the cherry industry due to the increased number of export destinations, popularity of consumer packaging, and increased sales through warehouse retailers. In this study, the packing ($8 per box) and sales commission (8% of $35) charges are assumed to be $10.80 per 18 pound box using 75% packout. Sweet cherries are sold fresh domestically and abroad. Cherries packed for some export markets require fumigation and other special handling. Cherry packinghouses levy an additional charge for these services. This study assumes an export packing charge of $5.00 per packed box.
Yields. The average field yield over the remaining life of the orchard is 5.40 tons (10,800 lbs) per acre.
Fresh packout will vary from year to year, but for this study, gross field yields are sorted resulting in a 75% fresh fruit pack-out with 5% of the gross sold for brining cherries. Assumed annual per acre yields for cherries measured in 30-pound field lugs (gross field harvested yield), 18-pound packed boxes (sorted & packed yield), and pounds of cherries for brining are shown in Table C.
Returns. Cherries sold for export typically command higher prices than those sold for domestic trade.
This study assumes that 35% of the fresh market crop is exported at a price of $40 ($35 + export charge) per 18-pound box. The remaining 65% are sold domestically for $35 per box based on 2005 to 2009 Crop Reports. Brining cherries are sold for $0.19 per pound based on the same reports. Prices and yields are used in this study to estimate income and net returns on Table 4. Returns with brining returns remaining constant are shown over a range of yields in Table 6.
Assessment. The California Cherry Advisory Board assesses commercially grown Bing, Rainier, Van
and Lambert cherries to pay for cherry promotion and research. Other varieties are not assessed. The mandatory assessment is $0.02 per packed pound. One-half of this assessment is paid by the grower and one-half is paid by the packing house.
Pickup/ATV. The study assumes a business use mileage for the pickup and ATV. The All Terrain
Vehicle or ATV is used for monitoring the orchard and checking the irrigation. The costs are estimated and not from any specific data.

2011 Cherries Costs and Returns Study San Joaquin Valley North UC Cooperative Extension 8
Labor, Equipment, and Interest
Labor. The basic hourly wage for equipment operators is $12.00 per hour and for general labor is $8.00
per hour. Adding payroll overhead of 36% gives labor rates of $16.32 for equipment operators and $10.88 per hour for general labor. The overhead includes the employers’ share of federal and California state payroll taxes, workers' compensation insurance for fruit orchards (code 0016), and a percentage for other possible benefits. Workers’ compensation insurance costs will vary among growers, but for this study the cost is based upon the average industry final rate as of January 1, 2011 (California Department of Insurance). Labor for operations involving machinery are 20% higher than the operation time given in Table 3 to account for the extra labor involved in equipment set up, moving, maintenance, work breaks, and field repair.
Equipment Operating Costs. Repair costs are based on purchase price, annual hours of use, total
hours of life and repair coefficients formulated by the ASAE equations based on maximum power takeoff (PTO) horsepower, and fuel type. Prices for on-farm delivery of diesel and gasoline are $2.60 and $3.10 per gallon, respectively. The cost includes a 2.5 % local sales tax on diesel fuel and 7.5% sales tax on gasoline. The fuel prices are the 2010 average costs derived from the Energy Information Administration monthly data for California. Gasoline also includes federal and state excise tax, which are refundable for on-farm use when filing your income tax. The fuel, lube, and repair cost per acre for each operation in Table 2 is determined by multiplying the total hourly operating cost in Table 7 for each piece of equipment used for the selected operation by the hours per acre. Tractor time is 10% higher than implement time for a given operation to account for setup, travel and down time.
Interest On Operating Capital. Interest on operating capital is based on cash operating costs and is
calculated monthly until harvest at a nominal rate of 7.75% per year. A nominal interest rate is the typical market cost of borrowed funds. The interest cost of post harvest operations is discounted back to the last harvest month using a negative interest charge.
Risk. While this study makes every effort to model a production system based on typical, real world
practices, it cannot fully represent financial, agronomic and market risks that affect the profitability and economic viability. Crop insurance is a risk management tool available to growers.
Cash Overhead
Cash overhead consists of various cash expenses paid out during the year that are assigned to the whole
farm and not to a particular operation. These costs include property taxes, interest on operating capital, office expense, liability and property insurance, sanitation services, equipment repairs, and crop insurance.
Property Taxes. Counties charge a base property tax rate of 1% on the assessed value of the property.
In some counties special assessment districts exist and charge additional taxes on property including equipment, buildings, and improvements. For this study, county taxes are calculated as 1% of the average value of the property. Average value equals new cost plus salvage value divided by 2 on a per acre basis. Salvage value for investments will vary.
Insurance. Insurance for farm investments vary depending on the assets included and the amount of
coverage. Property insurance provides coverage for property loss and is charged at 0.775% of the average value of the assets over their useful life. Liability insurance covers accidents on the farm and costs $587 for the entire farm.

2011 Cherries Costs and Returns Study San Joaquin Valley North UC Cooperative Extension 9
Office Expense. Office and business expenses are estimated at $150 per acre. These expenses include office supplies, telephones, bookkeeping, accounting, legal fees, road maintenance, and miscellaneous administrative charges.
Sanitation Services. Sanitation services provide portable toilets for the farm and cost the orchard $900
annually. The monthly service charge is an average of four to six California sanitation companies and locations. This cost includes delivery and servicing of a single toilet and washing unit for 6 months. The sanitation costs are estimated and not based on any specific grower data. Growers using contract labor may not have a cost because many labor contractors provide their own sanitation facilities.
Crop Insurance. Multi-peril crop insurance, a revenue program with weather trigger, at 75% of
established federal price is assumed to cost $168 per acre and is not based on any specific calculations. Management and Supervisor Wages. Wages for management are not included as cash cost. Returns
above total costs are considered a return to management and risk.
Non-Cash Overhead Non-Cash overhead is calculated as the capital recovery cost for equipment and other farm investments. Capital Recovery Costs. Capital recovery costs are the annual depreciation and interest costs for a
capital investment. It is the amount of money required each year to recover the difference between the purchase price and salvage value (unrecovered capital). It is equivalent to the annual payment on a loan for the investment with the down payment equal to the discounted salvage value. This is a more complex method of calculating ownership costs than straight-line depreciation and opportunity costs, but more accurately represents the annual costs of ownership because it takes the time value of money into account (Boehlje and Eidman). The formula for the calculation of the annual capital recovery costs is ((Purchase Price – Salvage Value) x Capital Recovery Factor) + (Salvage Value x Interest Rate).
Salvage Value. Salvage value is an estimate of the remaining value of an investment at the end of its
useful life. For farm machinery (tractors and implements) the remaining value is a percentage of the new cost of the investment (Boehlje and Eidman). The percent remaining value is calculated from equations developed by the American Society of Agricultural Engineers (ASAE) based on equipment type and years of life. The life in years is estimated by dividing the wearout life, as given by ASAE by the annual hours of use in this operation. For other investments including irrigation systems, buildings, and miscellaneous equipment, the value at the end of its useful life is zero. The salvage value for land is the purchase price because land does not depreciate. The purchase price and salvage value for equipment and investments are shown in tables.
Capital Recovery Factor. Capital recovery factor is the amortization factor or annual payment whose
present value at compound interest is 1. The amortization factor is a table value that corresponds to the interest rate used and the life of the machine.
Interest Rate. The interest rate of 4.75% is used to calculate capital recovery costs. The rate will vary
depending upon the loan size and other lending agency conditions. The rate is the suggested rate by a farm lending in January 2011.
Land. Land values (2010 Trends) are affected by many factors, and range from $8,000 to $15,000 per
acre. Producing orchards range in price from $15,000 to $20,000 per acre, or more. The cropland in this study is valued at $12,000 per acre. The land is assumed to be Class I soil formerly planted to cherries.

2011 Cherries Costs and Returns Study San Joaquin Valley North UC Cooperative Extension 10
Irrigation. The orchard is irrigated using a micro-sprinkler irrigation system with 70% coverage. The
sprinklers were installed prior to planting and are expected to have a 25-year life, the same as the orchard. The sprinklers will be removed when the orchard is removed. Water is pumped from a well and distributed to the orchard by way of underground mainlines. The well, a 25 horsepower (HP) pump and the installation labor are included in the irrigation system cost. This well and pump serve only the 40-acre orchard. Other well(s) are used on the remaining property and are not included. Water is pumped from a 120-foot depth. The irrigation system is considered an improvement to the property and has a 25-year life.
Establishment Cost. Costs to establish the orchard are used to determine capital recovery expenses,
depreciation, and interest on investment for the production years. The establishment cost is the sum of cash costs for land preparation, planting, trees, production expenses, and cash overhead for growing cherry trees through the first year fruit is harvested minus any returns from production. The Total Accumulated Net Cash Cost in the fourth year shown in Table 1 represents the establishment cost per acre. For this study, the cost is $7,503 per acre or $300,120 for the 40 acres planted to cherries. Establishment cost is amortized over the remaining 21 years that the orchard is assumed to be in production.
Equipment Costs. Farm equipment is purchased new or used, but the study shows the current purchase
price for new equipment. The new purchase price is adjusted to 60% to indicate a mix of new and used equipment. Annual ownership costs for equipment and other investments are in the Whole Farm Equipment, Investment and Business Overhead Tables. Equipment costs are composed of three parts: non-cash overhead, cash overhead, and operating costs. Both of the overhead factors have been discussed in previous sections. The operating costs consist of repairs, fuel, and lubrication and are discussed under operating costs.
Table Values. Due to rounding, the totals may be slightly different from the sum of the components.

2011 Cherries Costs and Returns Study San Joaquin Valley North UC Cooperative Extension 11
REFERENCES
Agricultural Commissioner, 2005, 2006, 2007, 2008, 2009 Annual Crop Reports. San Joaquin County. Stockton, CA.
American Society of Farm Managers and Rural Appraisers. 2010. Trends in Agricultural Land & Lease Values.
California Chapter of the American Society of Farm Managers and Rural Appraisers. Woodbridge, CA. American Society of Agricultural Engineers. 1994. American Society of Agricultural Engineers Standards
Yearbook. Russell H. Hahn and Evelyn E. Rosentreter (ed.) St. Joseph, MO. 41st edition.
Boehlje, Michael D., and Vernon R. Eidman. 1984. Farm Management. John Wiley and Sons. New York, NY. Doanes. Facts and Figures for Farmers. 1984. Doane Publishing, St. Louis, MO. p. 290. Grant, Joe A., Janet L. Caprile, William C. Coates, Karen M. Klonsky, and Richard L. De Moura. Sample Costs
to Establish an Orchard and Produce Sweet Cherries. 2005. University of California Cooperative Extension. Davis, CA.
Energy Information Administration. 2010. Weekly Retail on Highway Diesel and Gasoline Prices. Internet
accessed January 2011. http://tonto.eis.doe.gov/oog/info/wohdp. University of California Statewide IPM Project. 2010. UC Pest Management Guidelines, Cherries. University
of California, Davis, CA. http://www.ipm.ucdavis.edu
For information concerning the above mentioned University of California publications contact UC DANR Communications
Services (1-800-994-8849) or http://danrcs.ucdavis.edu or your local county Cooperative Extension office.

2011 Cherries Costs and Returns Study San Joaquin Valley North UC Cooperative Extension 12
UC COOPERATIVE EXTENSION Table 1. COSTS PER ACRE TO ESTABLISH A CHERRY ORCHARD
SAN JOAQUIN VALLEY – NORTH 2011
Cost Per Acre Year: 1st 2nd 3rd 4th 5th
Total Tons Per Acre: 0.5 1.2 Domestic Fresh (18 lb boxes): 50 65
Export Fresh (18 lb boxes): 25 35 Brining (lbs): 60 120
Planting Costs: Land Preparation: Rip 2X (custom) 250 Land Preparation: Disc 2X 22 Land Preparation: Laser Level (custom) 210 Land Preparation: Fumigate-Tree Row (custom) 900 Plant: Survey, Plant & Paint Trees (Replant Yrs 2+) 182 1 1 3 3 Trees: 134 Per Acre @ $6.65 each (Replants Yrs 2-3, 1 tree. Yrs 4+, 2 trees) 891 7 7 13 13 TOTAL PLANTING COSTS 2,455 8 8 16 16 Cultural Costs: Weed: Disc 5X (Yrs 1-3, 2 passes/middle.) 60 60 60 Irrigate: 8X (water and labor) 106 106 106 141 141 Weed: Spot Spray 20% of acres - 2X (Roundup) 21 21 21 21 21 Prune & Train: Summer 9 22 44 65 87 Fertilize: (Yr 1 & 2, 15-15-15. Yr 3+, CAN17)) 36 36 27 37 42 Weed: Fall Strip Spray (Goal, Surflan, Gramoxone) Yr 1-3, 30%, Yr 4+, 50% of acres 63 63 63 99 99 Prune & Train: Dormant 136 190 245 299 Insect: Leafhopper (Asana), Mite (Onager). Yrs 2-3, 1/2 label rate 50 50 89 89 Fertilize: Leaf Sampling & Nutritional Analysis 2 2 2 2 Insect: Leafhopper/Mite (Asana, Omite) Yrs 2-3, 1/2 rate 43 43 74 74 Insect: Leafhopper (Asana) 2X 36 36 49 49 Insect: Fall Spray (Oil, Copper, Lime). Yrs 2-3, 1/2 label rate 67 67 122 122 Prune: Shred Brush 9 9 Growth Regulator: Bloom Stimulant Spray (CAN17, Entry) 117 117 Pollination: (2 hives) 280 280 Disease: Bloom & Fruit Diseases (Rovral, Oil) 66 66 Insect: Earwigs (Sevin) 67 67 Disease: Bloom & Fruit Diseases (Pristine) 57 57 Insect: Worm (Intrepid). Fertilize: Foliar Nutrient Spray (20-20-20 with minors) 48 48 Weed: Mow Middles 5X (1 pass per middle) 35 35 Disease: Powdery Mildew (Cabrio) 34 34 Growth Regulator: Gibberellic Acid Spray (ProGibb) 72 72 Insect: SWD 3X (Warrior, Success, Malathion) 299 299 Disease: Preharvest Fruit Diseases (Elite & Elevate) 125 125 Insect: Delayed Dormant Spray (Superior Oil, Diazinon) 86 Pickup Truck Use 85 85 85 85 85 ATV Use 64 64 64 64 64 TOTAL CULTURAL COSTS 443 791 859 2,304 2,471 Harvest & Assessment Costs: Harvest (hand pick) 612 816 Packing and Sales Charges 810 1,080 Export Packing Charge 125 175 California Cherry Advisory Board Assessment 14 18 TOTAL HARVEST & ASSESSMENT COSTS 0 0 1,561 2,089 Interest On Operating Capital @ 5.75% 45 20 23 16 22 TOTAL OPERATING COSTS/ACRE 2,943 820 890 3,897 4,598
2011 Cherries Costs and Returns Study San Joaquin Valley North UC Cooperative Extension 13
UC COOPERATIVE EXTENSION
Table 1. CONTINUED SAN JOAQUIN VALLEY – NORTH 2011
Cost Per Acre
Year: 1st 2nd 3rd 4th 5th Total Tons Per Acre: 0.5 1.2
Domestic Fresh (18 lb boxes): 50 65 Export Fresh (18 lb boxes): 25 35
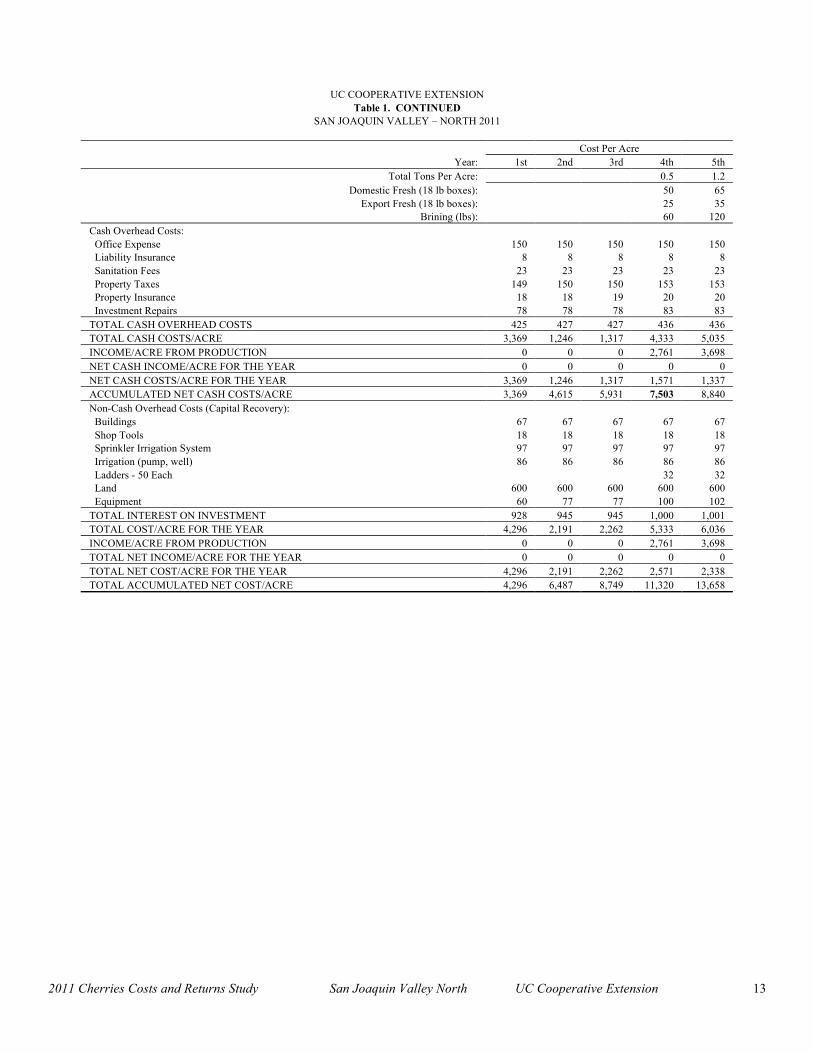
Brining (lbs): 60 120 Cash Overhead Costs: Office Expense 150 150 150 150 150 Liability Insurance 8 8 8 8 8 Sanitation Fees 23 23 23 23 23 Property Taxes 149 150 150 153 153 Property Insurance 18 18 19 20 20 Investment Repairs 78 78 78 83 83 TOTAL CASH OVERHEAD COSTS 425 427 427 436 436 TOTAL CASH COSTS/ACRE 3,369 1,246 1,317 4,333 5,035 INCOME/ACRE FROM PRODUCTION 0 0 0 2,761 3,698 NET CASH INCOME/ACRE FOR THE YEAR 0 0 0 0 0 NET CASH COSTS/ACRE FOR THE YEAR 3,369 1,246 1,317 1,571 1,337 ACCUMULATED NET CASH COSTS/ACRE 3,369 4,615 5,931 7,503 8,840 Non-Cash Overhead Costs (Capital Recovery): Buildings 67 67 67 67 67 Shop Tools 18 18 18 18 18 Sprinkler Irrigation System 97 97 97 97 97 Irrigation (pump, well) 86 86 86 86 86 Ladders - 50 Each 32 32 Land 600 600 600 600 600 Equipment 60 77 77 100 102 TOTAL INTEREST ON INVESTMENT 928 945 945 1,000 1,001 TOTAL COST/ACRE FOR THE YEAR 4,296 2,191 2,262 5,333 6,036 INCOME/ACRE FROM PRODUCTION 0 0 0 2,761 3,698 TOTAL NET INCOME/ACRE FOR THE YEAR 0 0 0 0 0 TOTAL NET COST/ACRE FOR THE YEAR 4,296 2,191 2,262 2,571 2,338 TOTAL ACCUMULATED NET COST/ACRE 4,296 6,487 8,749 11,320 13,658

2011 Cherries Costs and Returns Study San Joaquin Valley North UC Cooperative Extension 14
UC COOPERATIVE EXTENSION
Table 2. COSTS PER ACRE to PRODUCE SWEET CHERRIES SAN JOAQUIN VALLEY - NORTH 2011
Operation Cash and Labor Cost per acre Time Labor Fuel, Lube Material Custom/ Total Your Operation (Hrs/A) Cost & Repairs Cost Rent Cost Cost Cultural: Prune: Dormant 40.00 435 0 0 0 435 Prune: Shred Prunings 0.23 4 4 0 0 9 Growth Regulator: Bloom Stimulant (CAN17, Entry) 0.31 6 6 89 0 100 Insect: Delayed Dormant (Superior Oil, Diazinon) 0.31 6 6 74 0 86 Pollination: (2 hives) 0.00 0 0 0 280 280 Disease: Brown Rot (Rovral, Oil) 0.31 6 6 54 0 66 Trees - 3 Trees/acre replanted 0.00 0 0 20 0 20 Plant: Backhoe, plant, paint, wrap trees 0.00 0 0 0 58 58 Insect: Earwigs (Sevin) 0.31 6 6 55 0 67 Disease: Bloom & Fruit (Pristine) 0.31 6 6 45 0 57 Insect: Worm (Intrepid). Fertilize: Foliar (20-20-20) 0.31 6 6 36 0 48 Weed: Mow 5X (1 10ft pass/middle) 0.93 18 17 0 0 35 Irrigate: (water & labor) 8X 2.40 26 0 150 0 176 Disease: Powdery Mildew (Cabrio) 0.31 6 6 22 0 34 Weed: Spot Spray 20% of acres (Roundup) 2X 0.60 12 3 6 0 21 Growth Regulator: Gibberellic Acid (ProGibb) 0.31 6 6 60 0 72 Fertilize: N (CAN17) 0.25 5 1 62 0 68 Insect: Spotted Wing Drosophila (Warrior, Success, Malathion) 3X 0.31 6 6 264 0 276 Disease: Preharvest Fruit Decay Fungi (Elevate, Elite) 0.31 6 6 114 0 125 Prune: Summer 12.00 131 0 0 0 131 Insect: Leafhopper/Mites (Asana/Onager) 0.31 6 6 77 0 89 Fertilize: Leaf Sampling & Analysis 0.00 1 0 0 2 2 Insect: Leafhopper/Mites (Asana/Omite) 0.31 6 6 62 0 74 Insect: Leafhopper (Asana) 2X 0.61 12 11 26 0 49 Weed: Fall Strip (Goal, Surflan, Gramoxone) 0.30 6 2 92 0 99 Disease: Bactericide (Copper, Lime, Oil). 0.31 6 6 111 0 122 Pickup Truck Use 2.85 56 29 0 0 85 ATV Use 2.85 56 8 0 0 64 TOTAL CULTURAL COSTS 67.05 839 150 1,421 339 2,750 Harvest: Harvest (hand pick) 0.00 0 0 3,672 0 3,672 Packing & Sales Charge 0.00 0 0 4,860 0 4,860 Export Packing Charge 0.00 0 0 0 790 790 California Cherry Advisory Board Assessment 0.00 0 0 81 0 81 TOTAL HARVEST COSTS 0.00 0 0 8,613 790 9,403 Interest on operating capital @ 5.75% 60 TOTAL OPERATING COSTS/ACRE 839 150 10,034 1,129 12,213 Cash Overhead: Office Expense 150 Liability Insurance 8 Sanitation Fees 23 Crop Insurance 168 Property Taxes 190 Property Insurance 49 Investment Repairs 83 TOTAL CASH OVERHEAD COSTS 670 TOTAL CASH COSTS/ACRE 12,883

2011 Cherries Costs and Returns Study San Joaquin Valley North UC Cooperative Extension 15
UC COOPERATIVE EXTENSION
Table 2. CONTINUED SAN JOAQUIN VALLEY - NORTH 2011
Operation Cash and Labor Cost per acre Time Labor Fuel, Lube Material Custom/ Total Your Operation (Hrs/A) Cost & Repairs Cost Rent Cost Cost Non-Cash Overhead: Per producing Annual Cost Acre Capital Recovery Buildings 2400 sqft 1,053 67 67 Tools: Shop/Field 197 18 18 Micro-Sprinkler System 1,400 97 97 Irrigation System (pump & well) 1,250 86 86 Ladders: (50) 250 32 32 Land 12,632 600 600 Orchard Establishment 7,503 572 572 Equipment 893 99 99 TOTAL NON-CASH OVERHEAD COSTS 25,178 1,571 1,571 TOTAL COSTS/ACRE 14,454

2011 Cherries Costs and Returns Study San Joaquin Valley North UC Cooperative Extension 16
UC COOPERATIVE EXTENSION
Table 3. COSTS AND RETURNS PER ACRE to PRODUCE SWEET CHERRIES SAN JOAQUIN VALLEY - NORTH 2011
Quantity/ Price or Value or Your Acre Unit Cost/Unit Cost/Acre Cost GROSS RETURNS Domestic Fresh 292.00 box 35.00 10,220 Export Fresh 158.00 box 40.00 6,320 Brining 540.00 lb 0.19 103 TOTAL GROSS RETURNS 16,643 OPERATING COSTS Herbicide:
Goal 2 XL 1.50 pint 17.25 26 Surflan 4 AS 4.00 pint 14.51 58 Gramoxone Inteon 1.25 pint 6.15 8 Roundup WeatherMax 0.80 pint 7.38 6
Fungicide: Hydrated Lime 30.00 lb 0.25 8 Copper Sulfate 30.00 lb 2.65 80 Cabrio 9.00 oz 2.47 22 Elevate 50 WDG 1.50 lb 49.12 74 Elite 45WP 8.00 oz 5.01 40 Pristine 12.00 oz 3.76 45 Rovral 4F 1.60 pint 29.07 47
Insecticide: Asana XL 48.00 floz 1.08 52 Diazinon 50 W 4.00 lb 10.65 43 Dormant Emulsion 3.00 gal 7.90 24 Intrepid 2F 12.00 floz 2.58 31 Malathion 5EC 12.00 pint 5.60 67 Onager 18.00 floz 3.58 64 Omite 30 WP 6.00 lb 8.23 49 Sevin 80S 5.00 lb 11.00 55 Success 2SC 21.00 floz 7.47 157 Superior Oil 5.00 gal 7.90 40 Warrior II 7.68 floz 5.25 40
Growth Regulator: CAN 17 (17-0-0) [see Fertilizer] 316.00 lb 0.13 40 ProGibb 4% 36.00 floz 1.68 60
Adjuvant: Entry 1.00 gal 48.40 48
Fertilizer: 20-20-20+micronutrients (soluble) 5.00 lb 1.10 6 CAN 17 (17-0-0) [12.64 lbs/gal] 60.00 lb N 1.04 62
Water: Water - Pumped 30.00 acin 5.00 150
Tree/Tree Aids: Tree - Sweet Cherry 3.00 each 6.65 20 Carton/Tree Wrap 3.00 each 0.15 0 Paint/Whitewash 3.00 each 0.01 0
Custom/Contract: Pollination Fee 2.00 hive 140.00 280 Plant & Paint Tree 3.00 tree 1.20 4 Backhoe Tree 3.00 tree 18.00 54 Nutrient Analysis 0.05 each 32.00 2
Custom/Contract - Harvest: Picker Charge 10,800.00 lb 0.34 3,672 Packing Charge ($8) + Sales Charge ($2.80) 450.00 box 10.80 4,860 Export Packing Fee 158.00 box 5.00 790
Assessment: California Cherry Advisory Board (Growers Portion) 8,100.00 lb 0.01 81

2011 Cherries Costs and Returns Study San Joaquin Valley North UC Cooperative Extension 17
UC COOPERATIVE EXTENSION
Table 3. CONTINUED SAN JOAQUIN VALLEY - NORTH 2011
Quantity/ Price or Value or Your Acre Unit Cost/Unit Cost/Acre Cost Labor (machine) 15.11 hrs 16.32 247 Labor (non-machine) 54.45 hrs 10.88 592 Fuel - Gas 9.03 gal 3.10 28 Fuel - Diesel 26.36 gal 2.60 69 Lube 14 Machinery repair 39 Interest on operating capital @ 5.75% 60 TOTAL OPERATING COSTS/ACRE 12,213 NET RETURNS ABOVE OPERATING COSTS 4,429 CASH OVERHEAD COSTS: Office Expense 150 Liability Insurance 8 Sanitation Fees 23 Crop Insurance 168 Property Taxes 190 Property Insurance 49 Investment Repairs 83 TOTAL CASH OVERHEAD COSTS/ACRE 671 TOTAL CASH COSTS/ACRE 12,883 NON-CASH OVERHEAD COSTS (Capital Recovery) Buildings 2400 sqft 67 Tools: Shop/Field 18 Micro-Sprinkler System 97 Irrigation System (pump & well) 86 Ladders: (50) 32 Land 600 Orchard Establishment 572 Equipment 99 TOTAL NON-CASH OVERHEAD COSTS/ACRE 1,571 TOTAL COSTS/ACRE 14,454 NET RETURNS ABOVE TOTAL COSTS 2,188

2011 Cherries Costs and Returns Study San Joaquin Valley North UC Cooperative Extension 18
UC COOPERATIVE EXTENSION Table 4. MONTHLY CASH COSTS PER ACRE to PRODUCE SWEET CHERRIES
SAN JOAQUIN VALLEY - NORTH 2011 Beginning JAN 11 JAN FEB MAR APR MAY JUN JUL AUG SEP OCT NOV DEC TOTAL Ending DEC 11 11 11 11 11 11 11 11 11 11 11 11 11 Cultural: Prune: Dormant 435 435 Prune: Shred Prunings 9 9 Growth Regulator: Bloom Stimulant (CAN17, Entry) 100 100 Insect: Delayed Dormant (Superior Oil, Diazinon) 86 86 Pollination: (2 hives) 280 280 Disease: Brown Rot (Rovral, Oil) 66 66 Trees - 3 Trees/acre replanted 20 20 Plant: Backhoe, plant, paint, wrap trees 58 58 Insect: Earwigs (Sevin) 67 67 Disease: Bloom & Fruit (Pristine) 57 57 Insect: Worm (Intrepid). Fertilize: Foliar (20-20-20) 48 48 Weed: Mow 5X (1 10ft pass/middle) 7 7 7 7 7 35 Irrigate: (water & labor) 8X 18 23 23 47 47 18 176 Disease: Powdery Mildew (Cabrio) 34 34 Weed: Spot Spray 20% of acres (Roundup) 2X 11 11 21 Growth Regulator: Gibberellic Acid (ProGibb) 72 72 Fertilize: N (CAN17) 68 68 Insect: SW Drosophila (Warrior, Success, Malathion) 3X 276 276 Disease: Preharvest Fruit Decay Fungi (Elevate, Elite) 125 125 Prune: Summer 131 131 Insect: Leafhopper/Mites (Asana/Onager) 89 89 Fertilize: Leaf Sampling & Analysis 2 2 Insect: Leafhopper/Mites (Asana/Omite) 74 74 Insect: Leafhopper (Asana) 2X 25 25 49 Weed: Fall Strip (Goal, Surflan, Gramoxone) 99 99 Disease: Bactericide (Copper, Lime, Oil). 122 122 Pickup Truck Use 8 8 8 8 8 8 8 8 8 8 8 85 ATV Use 6 6 6 6 6 6 6 6 6 6 6 64 TOTAL CULTURAL COSTS 558 99 438 395 446 264 147 92 63 14 235 2,750 Harvest: Harvest (hand pick) 3,672 3,672 Packing & Sales Charge 4,860 4,860 Export Packing Charge 790 790 California Cherry Advisory Board 81 81 TOTAL HARVEST COSTS 9,403 9,403 Interest on operating capital @ 5.75% 3 3 5 7 54 -4 -2 -2 -2 -1 -1 60 TOTAL OPERATING COSTS/ACRE 560 103 443 402 9,903 260 145 90 61 12 234 12,213 TOTAL OPERATING COSTS/BOX 1.25 0.23 0.98 0.89 22.01 0.58 0.32 0.20 0.14 0.03 0.52 27

2011 Cherries Costs and Returns Study San Joaquin Valley North UC Cooperative Extension 19
UC COOPERATIVE EXTENSION
Table 4. CONTINUED SAN JOAQUIN VALLEY - NORTH 2011
Beginning JAN 11 JAN FEB MAR APR MAY JUN JUL AUG SEP OCT NOV DEC TOTAL Ending DEC 11 11 11 11 11 11 11 11 11 11 11 11 11 Cash Overhead: Office Expense 13 13 13 13 13 13 13 13 13 13 13 13 150 Liability Insurance 8 8 Sanitation Fees 23 23 Crop Insurance 168 168 Property Taxes 95 95 190 Property Insurance 25 25 49 Investment Repairs 7 7 7 7 7 7 7 7 7 7 7 7 83 TOTAL CASH OVERHEAD COSTS 139 195 19 19 42 19 139 19 19 19 19 19 671 TOTAL CASH COSTS/ACRE 699 298 462 422 9,945 280 284 110 81 32 253 19 12,884 TOTAL CASH COSTS/BOX* 1.55 0.66 1.03 0.94 22.10 0.62 0.63 0.24 0.18 0.07 0.56 0.04 29 *Box = 450 18 lb boxes per acre
2011 Cherries Costs and Returns Study San Joaquin Valley North UC Cooperative Extension 20
UC COOPERATIVE EXTENSION Table 5. RANGING ANALYSIS
SAN JOAQUIN VALLEY - NORTH 2011
COSTS PER ACRE AT VARYING YIELDS TO PRODUCE SWEET CHERRIES YIELD (18 lb boxes/acre)
Domestic Fresh: 142.00 192.00 242.00 292.00 342.00 392.00 442.00 Export Fresh: 78.00 105.00 131.00 158.00 184.00 211.00 238.00
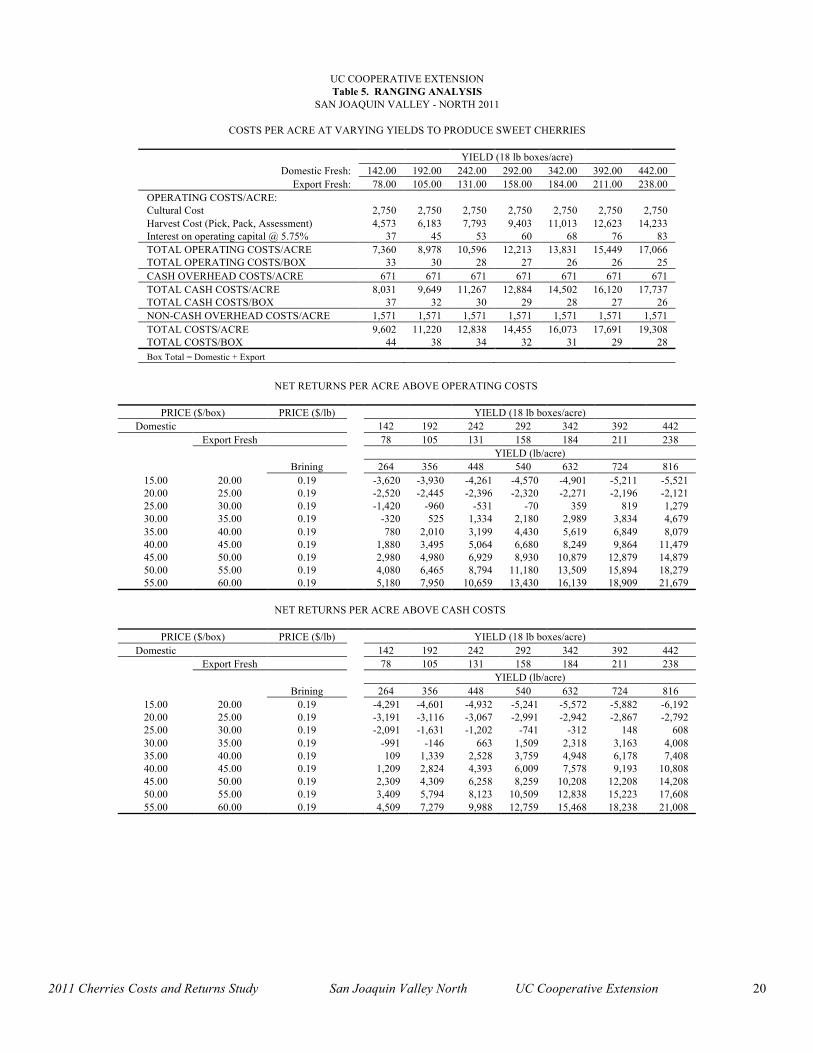
OPERATING COSTS/ACRE: Cultural Cost 2,750 2,750 2,750 2,750 2,750 2,750 2,750 Harvest Cost (Pick, Pack, Assessment) 4,573 6,183 7,793 9,403 11,013 12,623 14,233 Interest on operating capital @ 5.75% 37 45 53 60 68 76 83 TOTAL OPERATING COSTS/ACRE 7,360 8,978 10,596 12,213 13,831 15,449 17,066 TOTAL OPERATING COSTS/BOX 33 30 28 27 26 26 25 CASH OVERHEAD COSTS/ACRE 671 671 671 671 671 671 671 TOTAL CASH COSTS/ACRE 8,031 9,649 11,267 12,884 14,502 16,120 17,737 TOTAL CASH COSTS/BOX 37 32 30 29 28 27 26 NON-CASH OVERHEAD COSTS/ACRE 1,571 1,571 1,571 1,571 1,571 1,571 1,571 TOTAL COSTS/ACRE 9,602 11,220 12,838 14,455 16,073 17,691 19,308 TOTAL COSTS/BOX 44 38 34 32 31 29 28 Box Total = Domestic + Export
NET RETURNS PER ACRE ABOVE OPERATING COSTS
PRICE ($/box) PRICE ($/lb) YIELD (18 lb boxes/acre) Domestic 142 192 242 292 342 392 442
Export Fresh 78 105 131 158 184 211 238 YIELD (lb/acre) Brining 264 356 448 540 632 724 816
15.00 20.00 0.19 -3,620 -3,930 -4,261 -4,570 -4,901 -5,211 -5,521 20.00 25.00 0.19 -2,520 -2,445 -2,396 -2,320 -2,271 -2,196 -2,121 25.00 30.00 0.19 -1,420 -960 -531 -70 359 819 1,279 30.00 35.00 0.19 -320 525 1,334 2,180 2,989 3,834 4,679 35.00 40.00 0.19 780 2,010 3,199 4,430 5,619 6,849 8,079 40.00 45.00 0.19 1,880 3,495 5,064 6,680 8,249 9,864 11,479 45.00 50.00 0.19 2,980 4,980 6,929 8,930 10,879 12,879 14,879 50.00 55.00 0.19 4,080 6,465 8,794 11,180 13,509 15,894 18,279 55.00 60.00 0.19 5,180 7,950 10,659 13,430 16,139 18,909 21,679
NET RETURNS PER ACRE ABOVE CASH COSTS
PRICE ($/box) PRICE ($/lb) YIELD (18 lb boxes/acre) Domestic 142 192 242 292 342 392 442
Export Fresh 78 105 131 158 184 211 238 YIELD (lb/acre) Brining 264 356 448 540 632 724 816
15.00 20.00 0.19 -4,291 -4,601 -4,932 -5,241 -5,572 -5,882 -6,192 20.00 25.00 0.19 -3,191 -3,116 -3,067 -2,991 -2,942 -2,867 -2,792 25.00 30.00 0.19 -2,091 -1,631 -1,202 -741 -312 148 608 30.00 35.00 0.19 -991 -146 663 1,509 2,318 3,163 4,008 35.00 40.00 0.19 109 1,339 2,528 3,759 4,948 6,178 7,408 40.00 45.00 0.19 1,209 2,824 4,393 6,009 7,578 9,193 10,808 45.00 50.00 0.19 2,309 4,309 6,258 8,259 10,208 12,208 14,208 50.00 55.00 0.19 3,409 5,794 8,123 10,509 12,838 15,223 17,608 55.00 60.00 0.19 4,509 7,279 9,988 12,759 15,468 18,238 21,008

2011 Cherries Costs and Returns Study San Joaquin Valley North UC Cooperative Extension 21
UC COOPERATIVE EXTENSION
Table 5. CONTINUED SAN JOAQUIN VALLEY - NORTH 2011
NET RETURNS PER ACRE ABOVE TOTAL COSTS
PRICE ($/box) PRICE ($/lb) YIELD (18 lb boxes/acre) Domestic 142 192 242 292 342 392 442
Export Fresh 78 105 131 158 184 211 238 YIELD (lb/acre) Brining 264 356 448 540 632 724 816
15.00 20.00 0.19 -5,862 -6,172 -6,503 -6,812 -7,143 -7,453 -7,763 20.00 25.00 0.19 -4,762 -4,687 -4,638 -4,562 -4,513 -4,438 -4,363 25.00 30.00 0.19 -3,662 -3,202 -2,773 -2,312 -1,883 -1,423 -963 30.00 35.00 0.19 -2,562 -1,717 -908 -62 747 1,592 2,437 35.00 40.00 0.19 -1,462 -232 957 2,188 3,377 4,607 5,837 40.00 45.00 0.19 -362 1,253 2,822 4,438 6,007 7,622 9,237 45.00 50.00 0.19 738 2,738 4,687 6,688 8,637 10,637 12,637 50.00 55.00 0.19 1,838 4,223 6,552 8,938 11,267 13,652 16,037 55.00 60.00 0.19 2,938 5,708 8,417 11,188 13,897 16,667 19,437

2011 Cherries Costs and Returns Study San Joaquin Valley North UC Cooperative Extension 22
UC COOPERATIVE EXTENSION
Table 6. WHOLE FARM ANNUAL EQUIPMENT, INVESTMENT, and BUSINESS OVERHEAD COSTS
SAN JOAQUIN VALLEY - NORTH 2011
ANNUAL EQUIPMENT COSTS Cash Overhead Yrs Salvage Capital Insur- Yr Description Price Life Value Recovery ance Taxes Total 11 25 HP 2WD Tractor 13,900 15 2,706 1,189 64 83 1,336 11 80 HP 2WD Tractor 34,000 15 6,619 2,908 157 203 3,268 11 ATV 4WD 7,430 7 2,818 924 40 51 1,015 11 Mower - Flail 10' 10,000 15 960 902 42 55 999 11 Orch.Sprayer 500 Gal PTO 22,800 7 5,817 3,185 111 143 3,439 11 Pickup 1/2 ton 16,500 7 1,650 2,622 70 91 2,783 11 Shredder 10' 8,500 15 816 767 36 47 849 11 Weed Sprayer 100 G 4,000 15 384 361 17 22 400 TOTAL 117,130 21,770 12,770 538 695 14,089 60% of New Cost * 70,278 13,062 7,714 323 417 8,453 *Used to reflect a mix of new and used equipment
ANNUAL INVESTMENT COSTS
Cash Overhead Yrs Salvage Capital Insur- Description Price Life Value Recovery ance Taxes Repairs Total Buildings 2,400 sqft 80,000 30 5,057 310 400 1,600 7,367 Orchard Establishment (40 acres) 300,120 21 22,896 1,163 1,501 0 25,559 Irrigation (Pump, Well) 40 acres (Cherries) 50,000 25 3,459 194 250 1,000 4,903 Ladders - 50 Total 10,000 10 1,279 39 50 200 1,568 Land - 80 acres 960,000 20 960,000 45,600 0 9,600 0 55,200 Micro Sprinkler System - 40 acres 56,000 25 3,874 217 280 1,120 5,491 Tools: Shop & Field 15,000 15 1,500 1,350 64 83 300 1,796 TOTAL INVESTMENT 1,471,120 961,500 83,516 1,986 12,163 4,220 101,885
ANNUAL BUSINESS OVERHEAD COSTS
Units/ Price/ Total Description Farm Unit Unit Cost Crop Insurance 40 acre 168.00 6,720 Liability Insurance 76 acre 7.72 587 Office Expense 76 acre 150.00 11,400 Sanitation Fees 40 acre 22.50 900
UC COOPERATIVE EXTENSION
Table 7. HOURLY EQUIPMENT COSTS SAN JOAQUIN VALLEY - NORTH 2011
COSTS PER HOUR Actual Cash Overhead Operating Hours Capital Insur- Fuel & Total Total Yr Description Used Recovery ance Taxes Repairs Lube Oper. Costs/Hr. 11 25 HP 2WD Tractor 102 7.02 0.38 0.49 0.62 3.67 4.29 12.18 11 80 HP 2WD Tractor 470 3.71 0.20 0.26 1.52 11.75 13.27 17.44 11 ATV 4WD 228 2.43 0.10 0.13 0.55 2.38 2.93 5.59 11 Mower - Flail 10' 91 5.95 0.28 0.36 4.07 0.00 4.07 10.66 11 Orch.Sprayer 500 Gal PTO 319 6.00 0.21 0.27 3.99 0.00 3.99 10.47 11 Pickup 1/2 ton 228 6.90 0.19 0.24 1.22 8.91 10.13 17.46 11 Shredder 10' 18 25.33 1.19 1.54 3.97 0.00 3.97 32.03 11 Weed Sprayer 100 G 72 3.01 0.14 0.18 1.06 0.00 1.06 4.39
2011 Cherries Costs and Returns Study San Joaquin Valley North UC Cooperative Extension 23
UC COOPERATIVE EXTENSION
Table 8. OPERATIONS WITH EQUIPMENT SAN JOAQUIN VALLEY - NORTH 2011
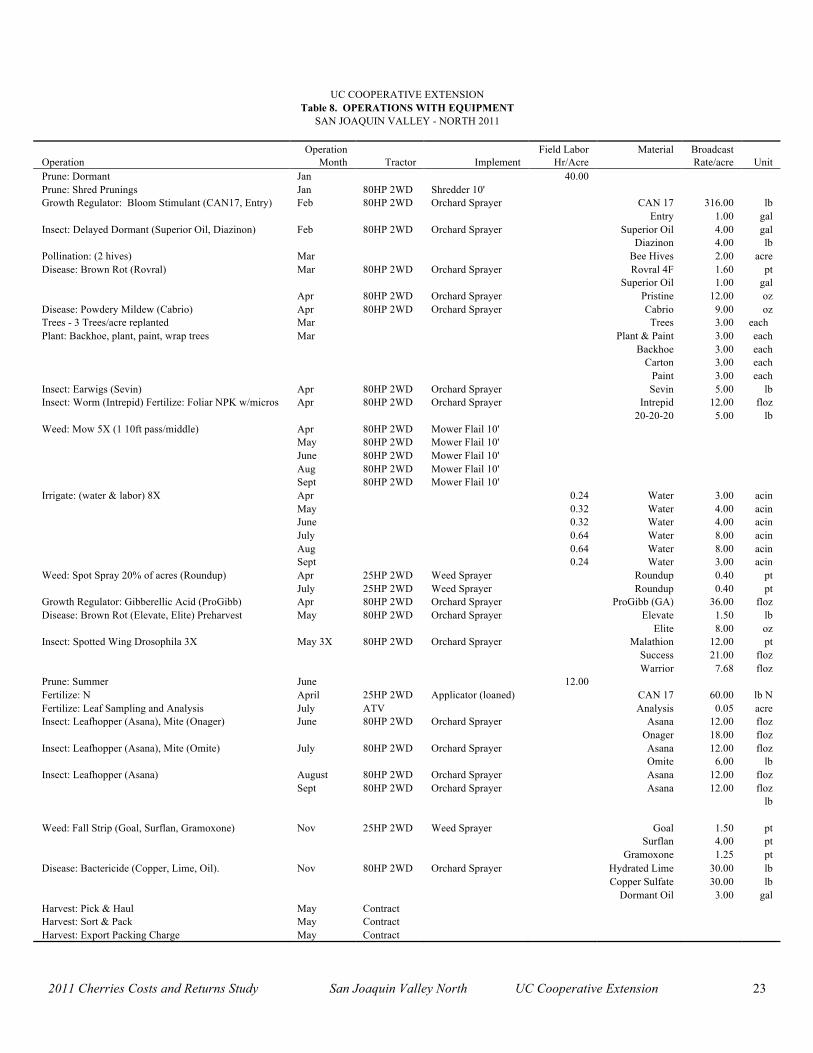
Operation Field Labor Material Broadcast Operation Month Tractor Implement Hr/Acre Rate/acre Unit Prune: Dormant Jan 40.00 Prune: Shred Prunings Jan 80HP 2WD Shredder 10' Growth Regulator: Bloom Stimulant (CAN17, Entry) Feb 80HP 2WD Orchard Sprayer CAN 17 316.00 lb Entry 1.00 gal Insect: Delayed Dormant (Superior Oil, Diazinon) Feb 80HP 2WD Orchard Sprayer Superior Oil 4.00 gal Diazinon 4.00 lb Pollination: (2 hives) Mar Bee Hives 2.00 acre Disease: Brown Rot (Rovral) Mar 80HP 2WD Orchard Sprayer Rovral 4F 1.60 pt Superior Oil 1.00 gal Apr 80HP 2WD Orchard Sprayer Pristine 12.00 oz Disease: Powdery Mildew (Cabrio) Apr 80HP 2WD Orchard Sprayer Cabrio 9.00 oz Trees - 3 Trees/acre replanted Mar Trees 3.00 each Plant: Backhoe, plant, paint, wrap trees Mar Plant & Paint 3.00 each Backhoe 3.00 each Carton 3.00 each Paint 3.00 each Insect: Earwigs (Sevin) Apr 80HP 2WD Orchard Sprayer Sevin 5.00 lb Insect: Worm (Intrepid) Fertilize: Foliar NPK w/micros Apr 80HP 2WD Orchard Sprayer Intrepid 12.00 floz 20-20-20 5.00 lb Weed: Mow 5X (1 10ft pass/middle) Apr 80HP 2WD Mower Flail 10' May 80HP 2WD Mower Flail 10' June 80HP 2WD Mower Flail 10' Aug 80HP 2WD Mower Flail 10' Sept 80HP 2WD Mower Flail 10' Irrigate: (water & labor) 8X Apr 0.24 Water 3.00 acin May 0.32 Water 4.00 acin June 0.32 Water 4.00 acin July 0.64 Water 8.00 acin Aug 0.64 Water 8.00 acin Sept 0.24 Water 3.00 acin Weed: Spot Spray 20% of acres (Roundup) Apr 25HP 2WD Weed Sprayer Roundup 0.40 pt July 25HP 2WD Weed Sprayer Roundup 0.40 pt Growth Regulator: Gibberellic Acid (ProGibb) Apr 80HP 2WD Orchard Sprayer ProGibb (GA) 36.00 floz Disease: Brown Rot (Elevate, Elite) Preharvest May 80HP 2WD Orchard Sprayer Elevate 1.50 lb Elite 8.00 oz Insect: Spotted Wing Drosophila 3X May 3X 80HP 2WD Orchard Sprayer Malathion 12.00 pt Success 21.00 floz Warrior 7.68 floz Prune: Summer June 12.00 Fertilize: N April 25HP 2WD Applicator (loaned) CAN 17 60.00 lb N Fertilize: Leaf Sampling and Analysis July ATV Analysis 0.05 acre Insect: Leafhopper (Asana), Mite (Onager) June 80HP 2WD Orchard Sprayer Asana 12.00 floz Onager 18.00 floz Insect: Leafhopper (Asana), Mite (Omite) July 80HP 2WD Orchard Sprayer Asana 12.00 floz Omite 6.00 lb Insect: Leafhopper (Asana) August 80HP 2WD Orchard Sprayer Asana 12.00 floz Sept 80HP 2WD Orchard Sprayer Asana 12.00 floz lb Weed: Fall Strip (Goal, Surflan, Gramoxone) Nov 25HP 2WD Weed Sprayer Goal 1.50 pt Surflan 4.00 pt Gramoxone 1.25 pt Disease: Bactericide (Copper, Lime, Oil). Nov 80HP 2WD Orchard Sprayer Hydrated Lime 30.00 lb Copper Sulfate 30.00 lb Dormant Oil 3.00 gal Harvest: Pick & Haul May Contract Harvest: Sort & Pack May Contract Harvest: Export Packing Charge May Contract