Embed Size (px)
Citation preview

WP/15/3
SAMA Working Paper:
CORE INFLATION INDICATORS FOR SAUDI ARABIA
March 2015
By
Saudi Arabian Monetary Agency
The views expressed are those of the author(s) and do not necessarily reflect the position of the Saudi Arabian Monetary Agency (SAMA) and its policies. This Working Paper should not be reported as representing the views of SAMA.
Ryadh M. Alkhareif Economic Research Department Saudi Arabian Monetary Agency
William A. Barnett University of Kansas and
Center for Financial Stability
2
CORE INFLATION INDICATORS FOR SAUDI ARABIA*
Abstract
This paper constructs and analyzes core inflation indicators for Saudi Arabia for
the period of March 2012 to May 2014 using two alternative approaches: the
Exclusion Method (ex food and housing/rent) and the Statistical Method. The
findings of the analysis suggest that the ex food and housing/rent inflation is more
volatile than the overall CPI inflation over the sample period. In contrast, the
statistical core inflation is relatively more stable and less volatile. Moreover, the
ex food and housing/rent inflation is only weakly correlated with headline
inflation, whereas the statistical core inflation exhibits a stronger correlation. This
combination of lower volatility and higher correlation with headline inflation
makes the statistical method a much better choice for policymakers. From a
monetary policy standpoint, using a bundle of core inflation measures, including
both properly constructed Exclusion and Statistical methods, is more desirable,
especially when variation across measures is widespread, as is the case in Saudi
Arabia.
Keywords: consumer price index, core inflation, generalized dynamic factor model, monetary policy. JEL Classifications: C51, E31, E58
* Author contacts: Ryadh Alkhareif, Economic Research Department, Saudi Arabian Monetary Agency, P. O. Box 2992 Riyadh 11169, Email: [email protected].

3
1. Introduction The measurement of prices and monitoring of inflation is a key task for virtually
every central bank in the world; this is certainly the case in Saudi Arabia. In order to
accomplish this task, the Saudi Arabian Monetary Agency (SAMA) needs accurate data
about domestic inflation, so that it can make appropriate policy decisions in a timely
fashion. Simply put, the better the measure of underlying inflation, the higher the
probability that proper policy decisions will be made. Most central banks, including
SAMA, use overall consumer price indexes that have two inherent problems: 1) they are
based on consumer expenditure surveys, which are used to derive expenditure-based
weighting factors that have a potential weighing and substitution bias, and 2) they may
contain measurement errors that can lead to measurement bias.1 These potential problems
could hinder an accurate assessment of inflationary (or deflationary) tendencies.
SAMA’s central measure of inflation is based on the year-over-year growth rate
of the CPI index, which is released each month. In other words, it is the change in the
monthly index compared to its value in the same month of the previous year. Use of this
measurement presents two immediate problems. First, it is obviously a lagging indicator
of inflation, since it is based on price movements that have occurred over the period of an
entire year. Thus, the price movement in the first month of the period carries as much
weight as does the price movement in the last (12th and most recent) month. The second
problem is that it carries with it a considerable amount of inherent noise, oscillations, and
other temporary shocks. This could lead to policy errors by the monetary authorities. To
overcome these problems, SAMA ideally needs a measure of inflation that is at least
somewhat predictive in nature (i.e., is more of a leading indicator, rather than a lagging)
and also eliminates the noise, short-term oscillations, and other transitory shocks. Such a
measure would reveal the true base, or core, inflation rate for the Saudi economy.
There are several ways of approaching the problem of constructing a core
inflation measure. This includes the following:
I. The exclusion method. This is the most widely used method, because it is simple
and easy to understand. This method estimates core inflation by removing the prices
1 SAMA publishes CPI series for Saudi Arabia in its website and reports, but the Central Department of Statistics and Information (CDSI) is the authority that produces the CPI data for the Kingdom. For more information on the issue of measurement bias, see Bryan and Cecchetti (1994).

4
of selected components from the market basket of goods and services that go into
the calculation of the overall index. Ideally, in order to achieve the goal of
constructing a core index, the components selected for exclusion should show short-
term oscillations and a degree of volatility in their price movements. One example
that is widely used, most notably in the United States, is the exclusion of food and
energy prices from the index, due to their high volatility and the transient nature of
their movement. Although food may seemingly be a logical candidate for exclusion,
we do not advocate the exclusion of energy in a Saudi core inflation measure, for
two reasons. First of all, Saudi Arabia is an oil producing country and its economy
depends heavily on oil revenues. Specifically, the exports of crude oil and refined
petroleum products provide about 85-90 percent of government revenues. These
revenues, when recycled into the economy via government spending on goods,
services, and transfer payments, can significantly boost aggregate domestic demand.
This could result in demand-pull inflation, which, if sustained over a period of time,
could raise the core inflation rate [see Wynne (1999)]. Alkhareif and Barnett (2012)
have shown that inflation rates in the Gulf area have peaked during periods of
booming oil prices.
The second reason for not excluding energy is that domestic energy prices
are fixed by royal edict and are only infrequently adjusted. Thus, rather than being
a source of volatility, domestic energy prices are a source of stability in the index.
Any change in these fixed prices causes a one-time shock to the overall CPI, but it is
concentrated in a few areas (primarily the housing & utilities and transportation
sectors) and does not directly feed through into other sectors of the economy.
II. The trimmed means method. This methodology considers only the central portion of
a distribution by using limited-influence estimators that, in effect, disregard the
outliers [Bryan and Cecchetti (1994)]. However, the trimmed mean method is not
completely satisfactory. The optimal size of trimming is done through the use of
criterion functions over the full sample, rather than being determined by a recursive
estimation procedure, where the trimmed mean is constructed sequentially. In effect,
this causes estimates to be biased toward particular periods [see Rich and Steindel

5
(2007)]. As a result, care must be taken to avoid any potential estimation bias when
using the trimming index.
III. Core inflation measures based on statistical (or theory based) methods. Such core
inflation series are calculated using formal theoretical models such as vector
autoregressive models and dynamic factor models. This methodology is the basis
for the core inflation index described in this paper.
In order to construct a core inflation measure that minimizes random noise and
short-term price movements, we chose to use the Generalized Dynamic Factor Model
(GDFM), first mentioned by Altissimo, Cristadoro, Forni, Lippi, and Veronese (2010).
Use of this model enabled us to achieve two goals simultaneously: 1) separate the
common shocks from the idiosyncratic counterparts, and 2) extract the long-run common
component part from the common shocks. It seems reasonable to model inflation in Saudi
Arabia based on this approach, since there are two kinds of shocks an oil-exporting
country could face —common shocks (i.e., those experienced by all oil exporters who are
exposed to global commodity markets) and idiosyncratic (or country specific) shocks.
Saudi Arabia has experienced major shocks of both types in the past decade. For
example, three of the six GCC countries (Saudi Arabia, the UAE, and Kuwait) showed
actual declines in real GDP in 2009, while the economies of the other three showed
marked slowdowns in real growth. This was due primarily to the decline in oil prices in
late 2008 and the cut-back in Gulf oil production in 2009, a result of sluggish global
demand on oil caused by the global financial crisis. In contrast, the Saudi stock market
meltdown two years earlier, in 2006, was a good example of an idiosyncratic country
specific shock, since it had little impact on other stock markets in the region.
Use of the Generalized Dynamic Factor Model (GDFM) makes it possible to
identify the sources of price fluctuations, since it allows us to distinguish between
common and sector-specific (idiosyncratic) shocks. The ability to identify the source of
specific shocks gives the policymakers more information, so that they can effectively
respond to the shocks with the appropriate policies. The idiosyncratic shocks contain
errors that can lead to measurement bias; they also exhibit a weak correlation with both
real and financial indicators, particularly the long-term movements of inflation [see, inter

6
alia, Cristadoro, Forni, Reichlin, and Veronese (2005)]. The elimination of idiosyncratic
shocks from the core inflation indicators should lead to a more robust and reliable core
inflation measure. Thus, use of these core inflation indicators would provide useful tools
that could be used to strengthen monetary policy at SAMA. Our core inflation data will
also help financial analysts and economic agents explore price developments in Saudi
Arabia and, more importantly, the interaction between inflation and other macroeconomic
variables.
We strongly support the inclusion of oil prices and related variables (e.g., oil
export revenues) in the construction of the core inflation indicators, since oil revenues are
one of the key drivers for the Saudi economy. Between 85 and 90 percent of government
spending in Saudi Arabia is financed via oil revenues, rather than by standard sources
such as taxes and borrowing. Government spending on infrastructure projects and social
programs has exploded in the 2004-2014 period, and this can act to increase domestic
prices. Oil prices surged in the first six months of 2008, leading to higher oil export
revenues for the Kingdom. The government’s spending of these revenues triggered a
record high inflation rate, with inflation reaching 11 percent year-over-year in mid-2008,
as indicated by Alkhareif and Barnett (2012).2 Since the inflation rate in Saudi Arabia is
driven in part by oil prices, it would be inadvisable to exclude energy prices from core
inflation.
The remainder of this paper is organized as follows: Section 2 gives an overview
of the Generalized Dynamic Factor Model, Section 3 describes the data used in the
model’s construction, Section 4 constructs core inflation indicators for Saudi Arabia, and
Section 5 concludes the paper.
2. Methodology The dynamic factor model is based on the theory that each variable in the dataset
has two orthogonal components whose values can be determined only by decomposition
2 This inflation figure was published by the CDSI with a base year of 1999. The CDSI has recently changed the base year from 1999 to 2007 and hence inflation numbers have changed accordingly.

7
using statistical analysis.3 Such components are: i) a common component that is highly
correlated with the other macro variables that are included in the analysis and contribute
to the new index, and ii) the idiosyncratic component, which is unique for each individual
variable and therefore has no effect on the other variables that are part of the index [see
Cristadoro, Forni, Reichlin, and Veronese (2005)]. Thus, use of the GDFM methodology
allows us to identify and remove the short-term fluctuations and sector-specific shocks,
while retaining the long-term components, which we believe contain the essence of the
core inflation information. Thus, our new core inflation indicator is based upon the
common shared information that is embedded in the cross-section and time series
characteristics of the variables in the dataset [see Wynne (1999)].
This GDFM-based methodology uses two distinct smoothing procedures. First, a
cross-sectional smoothing is performed, in order to net out the idiosyncratic (or sector
specific) component of inflation, while maintaining the common component of the
underlying inflation. The second step is to use time series smoothing in order to extract
the long-term (longer than one year) common components. This step removes the high
frequency movements of the common components [see Altissimo, Cristadoro, Forni,
Lippi, and Veronese (2010)]. Although these movements are shared with the other
variables used, their high frequency oscillation means that they do not enter into the
determination of the core inflation rate.
2.1 Generalized Dynamic Factor Model The Generalized Dynamic Factor Model (GDFM) that we have used to construct
our index was originally introduced by Altissimo, Cristadoro, Forni, Lippi, and Veronese
(2010). We have applied this methodology to our large-dimensional dataset that consists
of economic variables displaying strong co-movements among themselves. More
importantly, this dataset includes variables that economic theory tells us should be related
to core inflation – e.g., oil prices and revenues, as well as government spending proxies.
Unlike traditional econometric analysis (e.g., OLS regression), the lack of a large number
of periods of observations (e.g., monthly data over just a few years) is not a hindrance.
According to recent empirical studies, the GDFM approach appears to perform well in
3 Statistically speaking, orthogonal components are those that have no correlation with each other.

8
large cross-sectional datasets, especially when the number of cross-sectional series is
larger than the number of time series observations [see, e.g., Stock and Watson (2011)
and Cristadoro, Forni, Reichlin, and Veronese (2005)].
GDFM methodology allows the identification of the various sources of price
fluctuations by using a few common factors that can explain a large proportion of the
covariation across economic series. The biggest advantage of GDFM is its ability to
separate long-term movements of variables from short-term fluctuations. The underlying
principle of the dynamic factor model is that each variable, 𝑥!" , can be decomposed into
the sum of two stationary, mutually orthogonal, and unobservable components, which we
will refer to as the common component 𝜒!", and the idiosyncratic component 𝜉!",. Thus:
(1)
The common component embodies the intrinsic GDFM principle that variables are more
likely to be determined, in part, by a few common factors. Conversely, the idiosyncratic
component represents a variable-specific shock that does not have an impact on other
variables in the system.
However, it is necessary to carry our development process one step further. An
inflation indicator that is free from errors and transitory turbulences is required. As an
example, policymakers could conceivably make erroneous policy decisions because of
the existence of measurement errors and short-term oscillations of the inflation indicator.
The ability to filter out transitory shocks and seasonal noise is an absolute necessity, if a
central bank is to monitor inflationary trends accurately. Thus, it is necessary to smooth
and refine the common component 𝜒!" in a further step, by using statistical techniques
involving frequency domain analysis and spectral decomposition [see, e.g., Stock and
Watson (2003)]. Like any stationary variable, the common component can be
decomposed into a short-term component 𝜒!"! , and a long-term component 𝜒!"! :
(2)
This paper defines this long-term common component of inflation as being core
inflation; thus, our goal is to estimate this long-term key variable. The estimation
procedure exploits the generalized principal components techniques and frequency
domain analysis. We use spectral density estimation techniques to convert the dataset
it it itx χ ξ= +
L Sit it itχ χ χ= +

9
back and forth between time domain and frequency domain through Fourier
transformation systems. The exact estimation process that we followed is described in
more detail in Alkhareif and Barnett (2013).
3. Data Descriptions and Sources A total of 86 cross-sectional series were used to construct the statistical core
inflation indicator, with monthly data from March 2012 to May 2014. This is a relatively
short period of time, but data were limited for such a wide variety of data. The data were
obtained from various sources such as SAMA, CDSI, the IMF’s International Financial
Statistics (IFS), the GCC-Stat, the Federal Reserve Economic Database (FRED), and the
Bloomberg database. To construct our core inflation indicators, we used prices including
consumer price indexes (CPI) and wholesale (producer) prices (WPI). Variables such as
exchange rates and oil prices were also included in the computations of our core inflation
indicators, as were interest rates on different types of financial assets, including overnight
deposits, demand deposits, savings and time deposits, and quasi-money. Government
bonds and interest rate spreads were also used, along with the Divisia monetary indexes
produced by Alkhareif and Barnett (2013, 2015). Specifically, we used their Divisia
monetary aggregates (M1 and M2), monetary assets’ user-cost prices, Divisia user-cost
aggregates, and dual prices. Because Divisia indexes exhibit a very significant relation
with inflation rates in Saudi Arabia [see Alkhareif and Barnett (2013)], using such
measures toward constructing core inflation indicators for Saudi Arabia is greatly
desirable.
As the first step in the analysis, the original data were normalized by subtracting
their means and dividing by their standard deviations. There were only a few missing
data items in our study; in these rare cases, we applied moving average interpolation to
fill in the missing data. The stationarity of variables in the system is a key condition for
using any dynamic factor model, especially for estimating the spectral matrix of the data,
which was a necessary step in our procedure [See Forni and Lippi (2011) for more
details]. In order to ensure this stationarity, we transformed any non-stationary variables
into a stationary series using the proper transformation methodology. In the case of
variables in the dataset with I(1) cointegration, we used a log difference (delta log)

10
transformation. Non-stationary variables with I(1) cointegration and negative values
were, of course, only differenced. We then applied Augmented Dickey Fuller (ADF) and
Phillips Perron (PP) unit root tests to confirm their stationarity.4 All quantities were
seasonally adjusted using the X11 procedure.
4. Core Inflation Indicators for Saudi Arabia Two core inflation measures were calculated in this study–the statistically-derived
core inflation indicator described above and an ex food and housing/rent inflation index,
which was calculated by simply excluding the two major categories and rebalancing the
weights of those remaining. It should be noted that these categories are the largest in the
Saudi CPI, comprising over 42 percent of the overall index.
Figure 1 depicts Saudi headline inflation versus the two core inflation measures
over the period from March 2012 to May 2014, using monthly data. As was indicated
earlier, all inflation figures are based on the change in the relevant monthly index from its
12-month-earlier value.
4 Since we had a total of 86 variables in our study, including the results of the standard unit root tests was not feasible. The overall results of the unit root tests can be provided upon request.
11
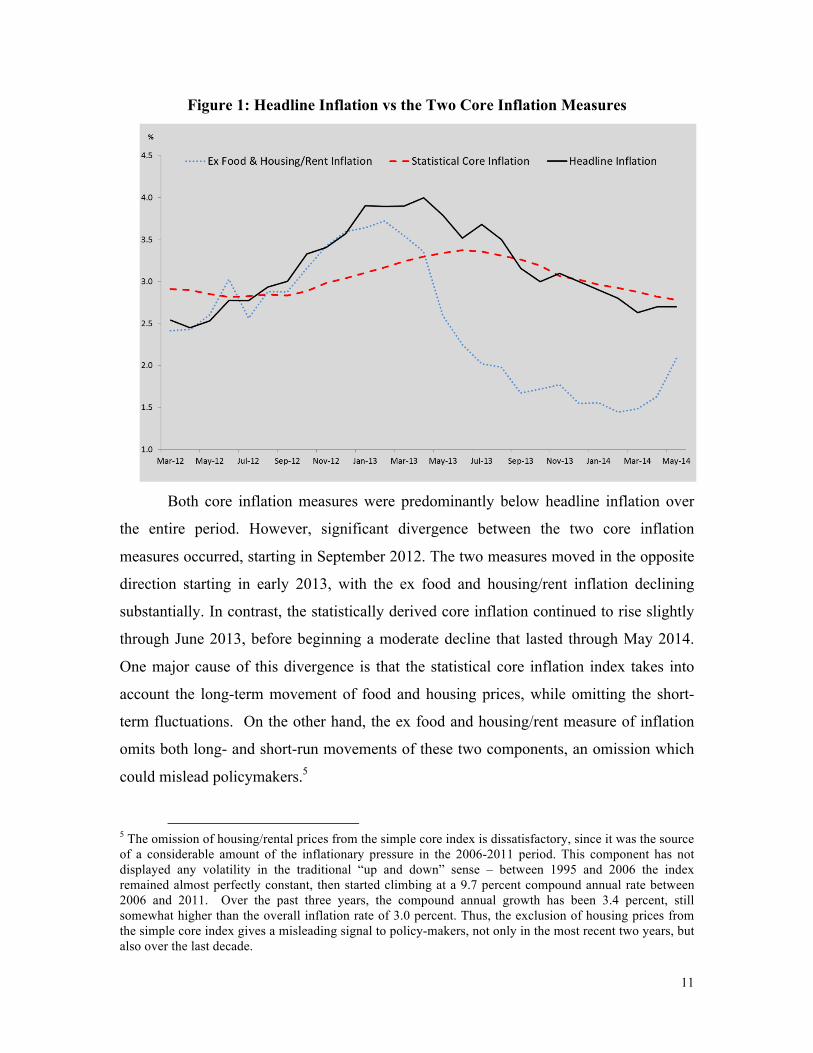
Figure 1: Headline Inflation vs the Two Core Inflation Measures
Both core inflation measures were predominantly below headline inflation over
the entire period. However, significant divergence between the two core inflation
measures occurred, starting in September 2012. The two measures moved in the opposite
direction starting in early 2013, with the ex food and housing/rent inflation declining
substantially. In contrast, the statistically derived core inflation continued to rise slightly
through June 2013, before beginning a moderate decline that lasted through May 2014.
One major cause of this divergence is that the statistical core inflation index takes into
account the long-term movement of food and housing prices, while omitting the short-
term fluctuations. On the other hand, the ex food and housing/rent measure of inflation
omits both long- and short-run movements of these two components, an omission which
could mislead policymakers.5
5 The omission of housing/rental prices from the simple core index is dissatisfactory, since it was the source of a considerable amount of the inflationary pressure in the 2006-2011 period. This component has not displayed any volatility in the traditional “up and down” sense – between 1995 and 2006 the index remained almost perfectly constant, then started climbing at a 9.7 percent compound annual rate between 2006 and 2011. Over the past three years, the compound annual growth has been 3.4 percent, still somewhat higher than the overall inflation rate of 3.0 percent. Thus, the exclusion of housing prices from the simple core index gives a misleading signal to policy-makers, not only in the most recent two years, but also over the last decade.

12
We find that the ex food and housing/rent inflation has the lowest mean value,
and it is more volatile than both headline inflation and statistical core inflation. To
measure inflation volatility, we compute the Standard Deviation (S.D.) for the Saudi
inflation rate over the estimation period from March 2012 to May 2014. Table 1 indicates
that the S.D. for the ex food and housing/rent core inflation is 0.8 percent; higher than the
S.D. for both headline inflation and the statistical core inflation (0.5 percent and 0.2
percent, respectively).
Table 1: Summary Statistics (March 2012-May 2014)
Ex Food and Housing/ Rent Inflation
Statistical Core Inflation Headline Inflation (HI)
Mean 2.5 3.0 3.2
Max 3.7 3.4 4.0
Min 1.4 2.8 2.5
S.D. 0.8 0.2 0.5
Corr. with HI 0.6 0.8 1.0
Moreover, the absolute difference between headline inflation and ex food and
housing/rent inflation greatly exceeds its statistical core inflation counterpart (Figure 2).
This is in line with the results shown in Table 1, where the headline inflation is highly
correlated with statistical core inflation as opposed to ex food and housing/rent inflation.
Clearly, the statistical core inflation measure is better than the ex food and housing/rent
inflation, as its volatility (S.D.) is lower and its correlation with the actual headline
inflation is higher.

13
Figure 2: Gaps between Headline Inflation vs Core Inflation Measures (Absolute terms)
It is interesting to note that the statistical core inflation average of 3.0 percent
over the last two years is well within the 2-3½ percent “comfort range” for the
underlying inflation target in the major countries. It is also very close to both the
medium term (3.0 percent compound annual average over the past three years) and long
term (3.4 percent compound annual average over the past ten years). We can conclude
that this measure of core inflation is an accurate assessment of the underlying inflation
rate and that this rate is within the “comfort range” of other economies.

14
5. Conclusion Core inflation can be seen to be a useful indicator of long-term inflation trends.
Constructing core inflation measures is of particular importance for policymakers at
central banks. This study analyzes core inflation measures for Saudi Arabia based on two
alternative methods: 1) a traditional exclusion-based index that excludes food and
housing/rent inflation, and 2) a statistical core inflation measure that uses an innovative
General Dynamic Factor Model (GDFM) methodology. The merit of using the statistical
technique is that it permits us not only to separate common shocks from the idiosyncratic
counterparts, but also to extract the long-term common component part from the common
shocks—leading to smoother estimates.
The findings suggest that there is considerable variation between the two core
inflation measures. The ex food and housing/rent definition of core inflation is less stable
than is its statistical core inflation counterpart; furthermore, the GDFM statistical method
tracks the headline inflation index more closely. However, an index based on the
exclusion methodology applied properly (i.e., with the proper components excluded)
would have the advantage of simplicity, and such an index could be included with the
statistical core inflation indicator as one of several core inflation measures that would be
made available to policymakers. This would be better than relying on a single (and
possibly flawed) core inflation measure when examining inflationary trends.

15
References
Alkhareif, R. M. and Barnett, W. A. Divisia Monetary Aggregates for the GCC Countries. In William A. Barnett and Fredj Jawadi (eds.), Recent Developments in Alternative Finance: Empirical Assessments and Economic Implications, Emerald Press. 2012; 1 – 37.
Alkhareif, R. M. and Barnett, W. A. Advances in Monetary Policy Design. Newcastle upon Tyne: Cambridge Scholars Publishing. 2013.
Alkhareif, R. M. and Barnett, W. A. Modern and Traditional Methods for Measuring Money Supply: The Case of Saudi Arabia. International Journal of Financial Studies. 2015; 3(1), 49-55.
Altissimo, F., Cristadoro, R., Forni, M., Lippi, M., and Veronese, G. New Eurocoin:
Tracking Economic Growth in Real Time. The Review of Economics and Statistics.
2010, 92(4), 1024-1034.
Bryan, M. F. and Cecchetti, S. G. Measuring Core Inflation, Monetary Policy. 1994; 195-
219, The University of Chicago Press.
Cristadoro, R., Forni, M., Reichlin, L., and Veronese, G. A Core Inflation Indicator for
the Euro Area. Journal of Money, Credit and Banking 2005, 37(3), 539-560.
Forni, M. and Lippi, M. The General Dynamic Factor Model: One-Sided Representation
Results. Journal of Econometrics 2011, 163(1), 23-28.
Rich, R. and Steindel, C. A Comparison of Measures of Core Inflation. Economic Policy
Review 2007, 13(3).
Stock, J. H. and Watson, M. W. Has the Business Cycle Changed and Why?. NBER
Macroeconomics Annual 2002, (Vol.17), MIT Press 2003, 159-230.
Stock, J. H. and Watson, M. W. Dynamic Factor Models. Oxford Handbook of Economic
Forecasting 2011, Oxford University Press, Oxford, UK.
Wynne, M. Core Inflation: A Review of Some Conceptual Issues. Working Paper Series
(5) 1999, European Central Bank.